
Ṣukūk or Bond, Which Is More Sustainable during COVID-19? Global Evidence from the Wavelet Coherence Model

 , , and
Abstract
:1. Introduction
2. Literature Review
3. Research Methodology
3.1. Data
3.2. Wavelet Coherence
4. Results and Discussion
4.1. Descriptive Analysis
4.2. Comparison among Bond Indices
4.3. Comparison among Ṣukūk Indices Image
5. Conclusions and Policy Implications
Author Contributions
Funding
Institutional Review Board Statement
Informed Consent Statement
Data Availability Statement
Acknowledgments
Conflicts of Interest
Appendix A

| Does the Market Provide Diversification Opportunities for Investors? | |||||
|---|---|---|---|---|---|
| Investment Bands | 4 Days | 16 Days | 64 Days | 128 Days | 256 Days |
| US Bond and SPGCC Ṣukūk | Yes: due to low correlations | Yes: due to low correlations | Yes: due to low correlations | Note: during recent years, 2018–2020 | Note: during recent years, 2018–2020 |
| US Bond and FTSE Ṣukūk | Yes: during 2015–2017 | Yes: during 2015–2017 | Yes: during 2018–2020 due to inverse correlations | Yes: no correlations were found throughout the periods | No: due to high positive correlations |
| US Bond and Dow Jones Ṣukūk | Yes: due to low correlations | Yes: due to low correlations | Yes: high but inverse correlations | Yes: High but inverse correlations | Yes: high but inverse correlations |
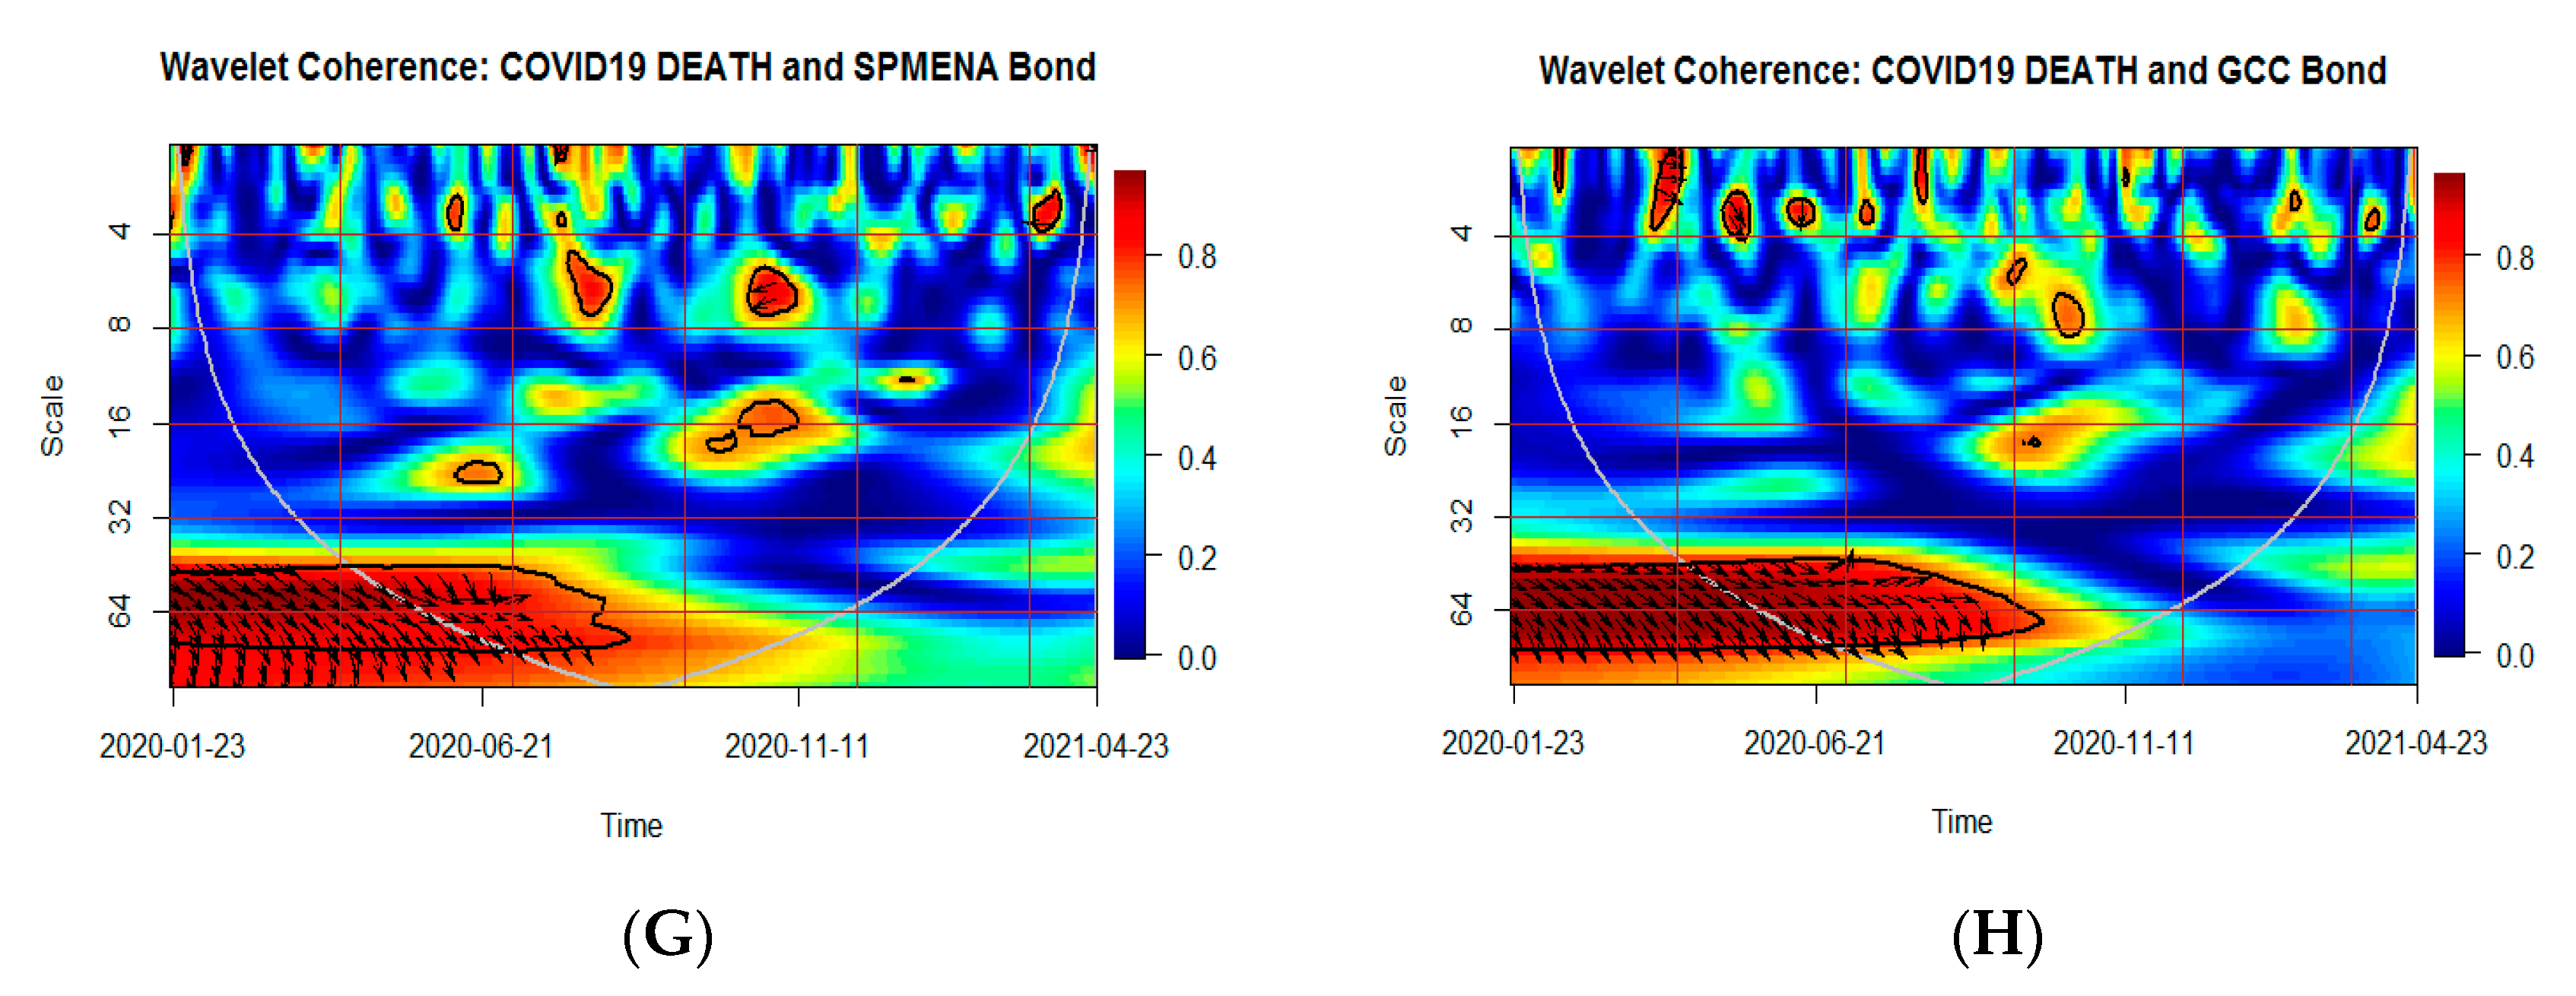
| SPMENA Ṣukūk and UK Bond | Yes: due to low correlations | Yes: due to low correlations | Some small islands of high but inverse correlations | Yes: due to low correlations | Yes: due to Some small islands of high but inverse correlations |
| SPGCC Ṣukūk and UK Bond | Yes: due to low correlations | Yes: due to low correlations | Yes: except in 2013 | Overall, yes: except in 2013 | Overall, yes: except in 2018–2020 |
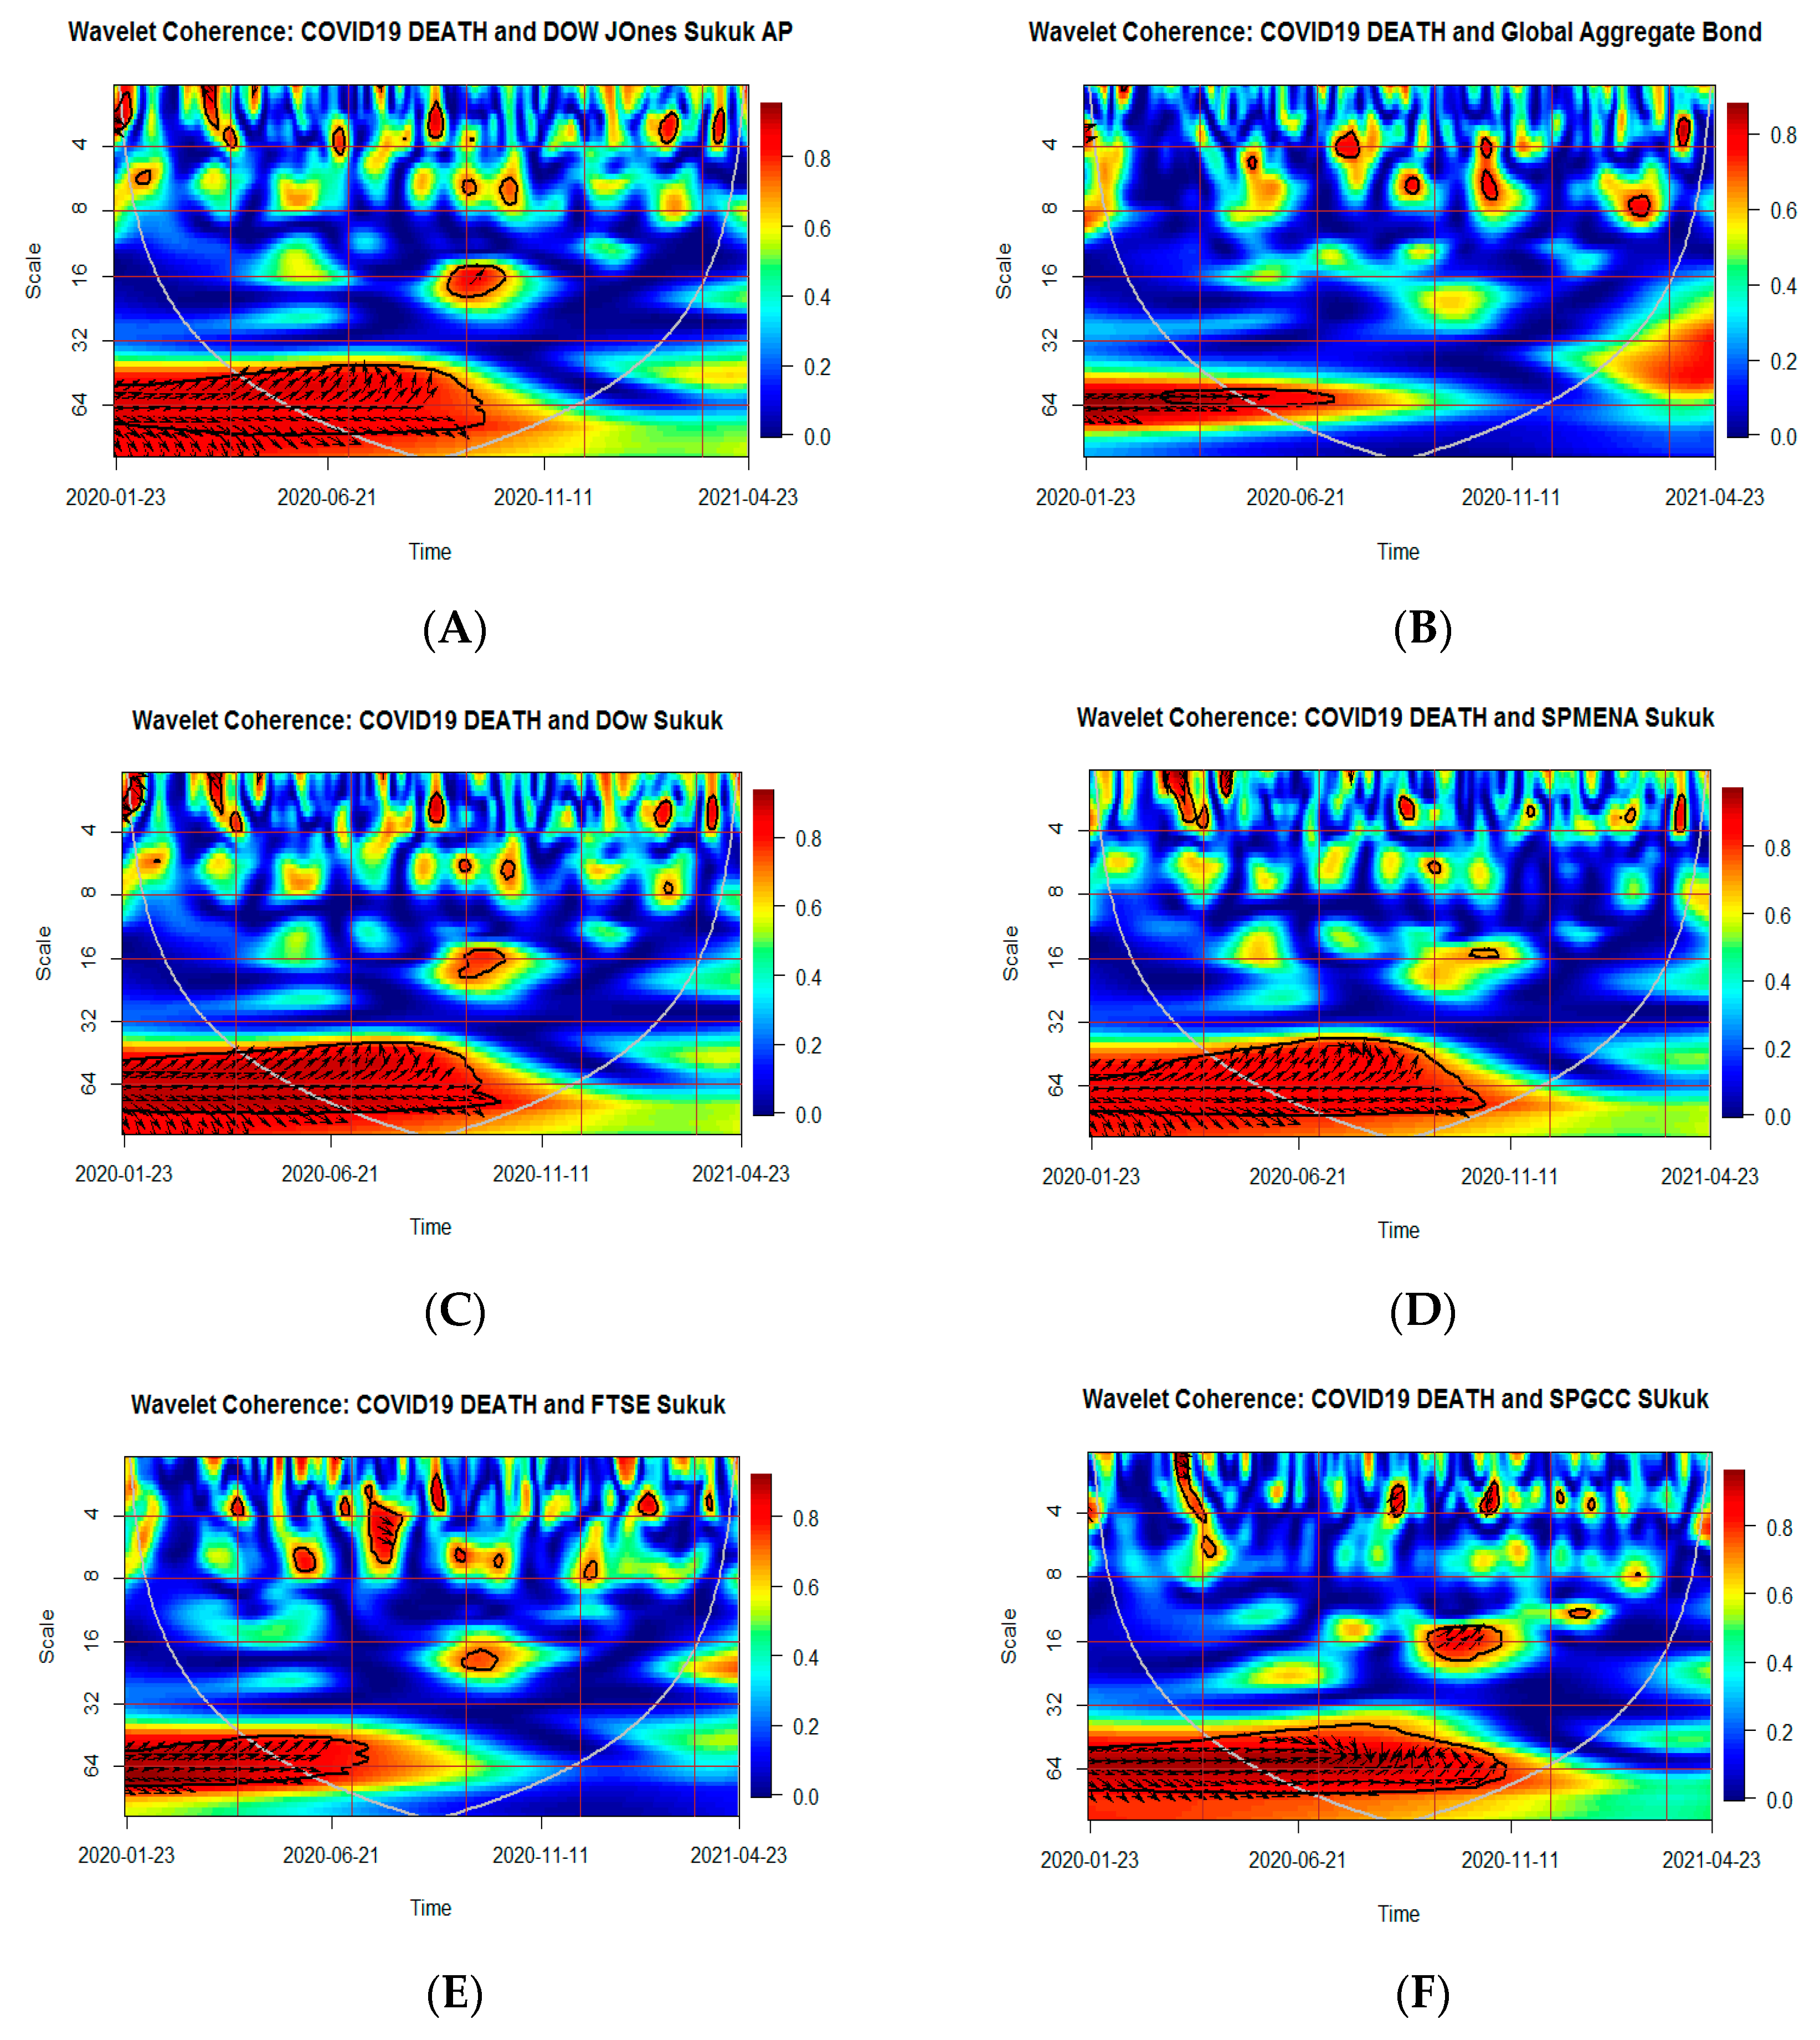
| Global Aggregate Bond and Dow Jones Ṣukūk AP | Yes: due to low correlations | Yes: due to low correlations | No: due to high correlations throughout the sample period | No: due to high correlations throughout the sample period | No: due to high correlations throughout the sample period |
| Global Aggregate Bond and SPMENA Ṣukūk | Yes: due to low correlations | Yes: due to low correlations | No: due to high correlations throughout the sample period | No: due to high correlations throughout the sample period | No: due to high correlations throughout the sample period |
| Global Aggregate Bond and SPGCC Ṣukūk | Yes: due to low correlations | Yes: except during 2019–2020 | Yes: except during 2013 and 2019–2020 | Yes: except during 2019–2020 | Yes: except during 2019–2020 |
| Global Aggregate Bond and FTSE Ṣukūk | Yes: due to low correlations | Overall, yes: except during 2018–2020 | Overall, yes: except during 2018–2020 | Overall, yes: except during 2018–2020 | No: due to high correlations throughout the sample period |
| GCC Bond and SPMENA Ṣukūk | Yes: due to low correlations | Yes: due to low correlations | No: due to high correlations throughout the sample period | No: due to high correlations throughout the sample period | No: due to high correlations throughout the sample period |
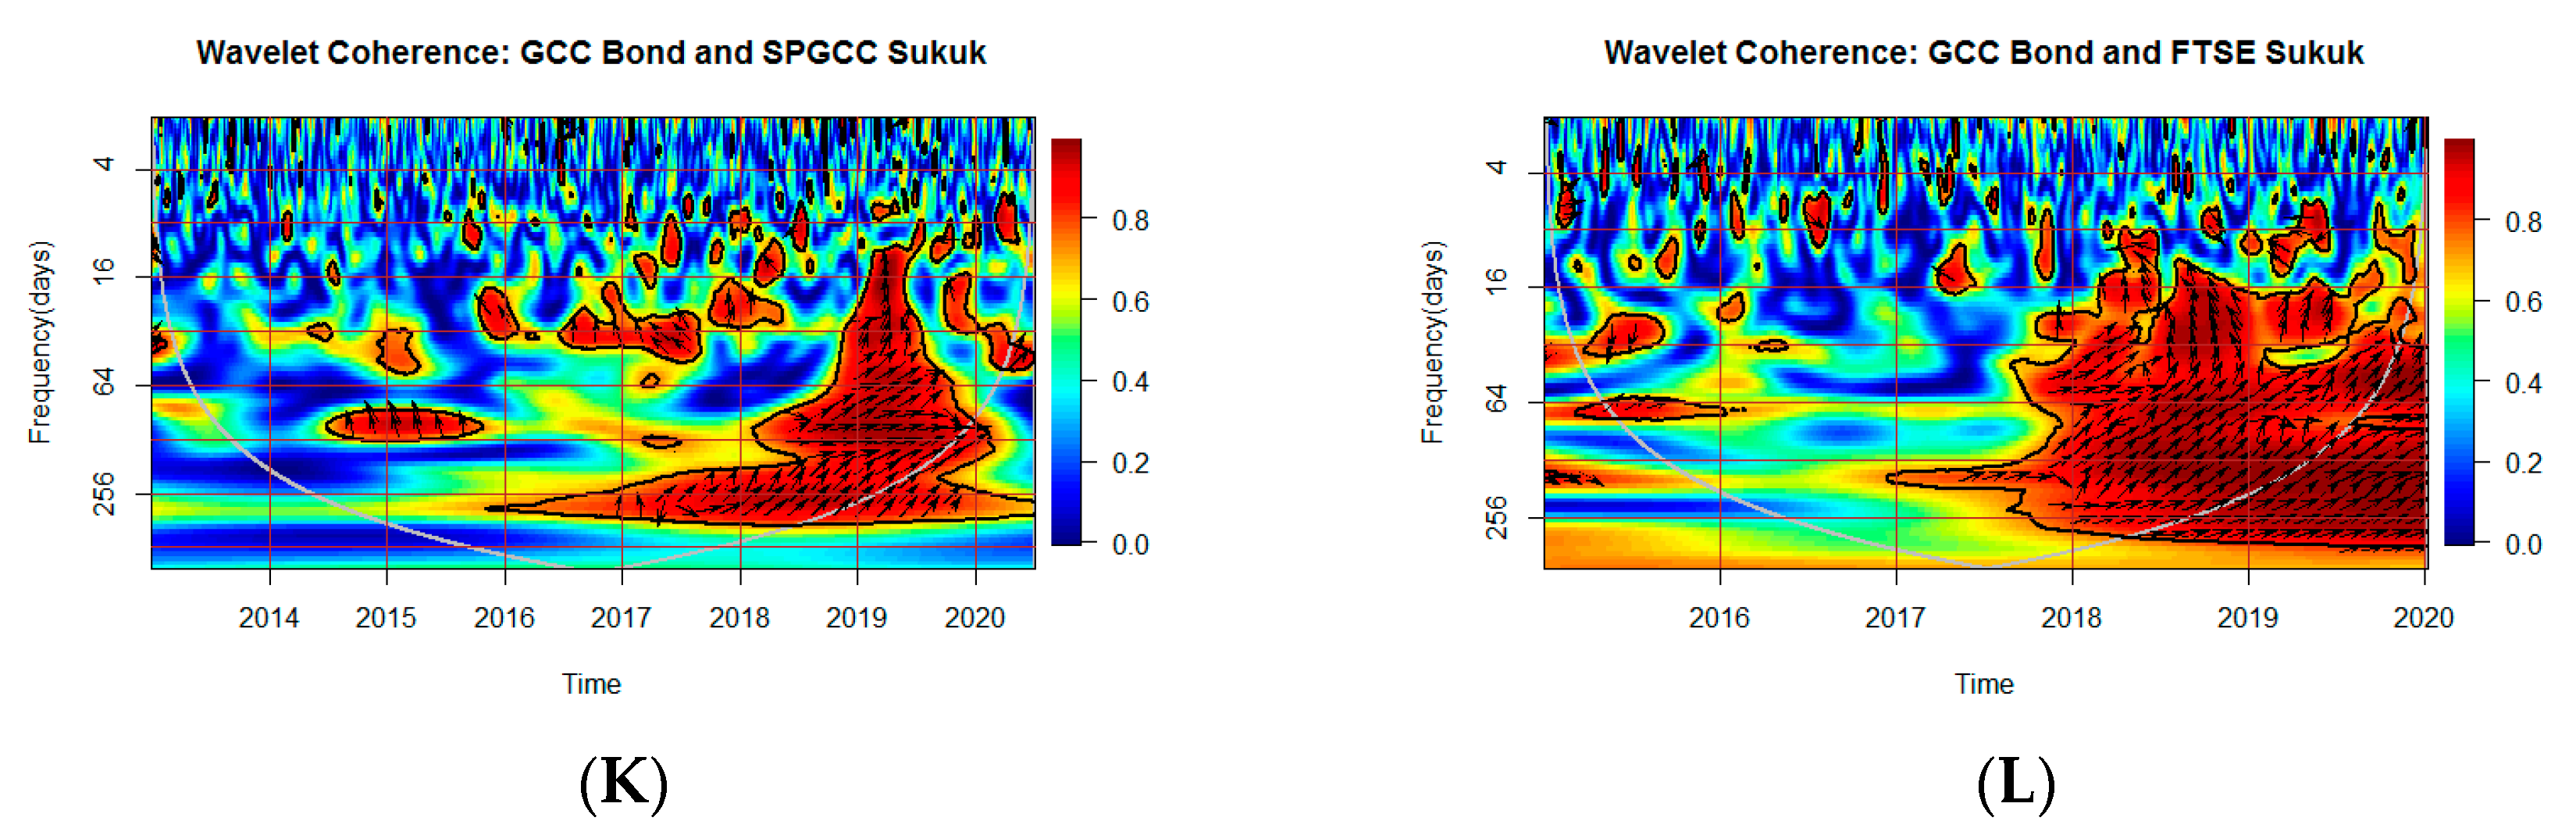
| GCC Bond and SPGCC Ṣukūk | Yes: due to low correlations | Yes: due to low correlations | Overall, yes: except in 2019–2020 | Overall, yes: except in 2019–2020 | Overall, yes: except in 2017–2020 |
| GCC Bond and FTSE Ṣukūk | Yes: due to low correlations | Yes: but only during 2016–17 and mid-2018 | Yes: but only during 2016–17 and mid-2018 | Yes: but only during 2016–17 and mid-2018 | Yes: but only during 2016–17 and mid-2018 |
| GCC Bond and Dow Jones Ṣukūk AP | Yes: due to low correlations | No: due to high correlations throughout the sample period | No: due to high correlations throughout the sample period | No: due to high correlations throughout the sample period | No: due to high correlations throughout the sample period |
| FTSE Ṣukūk and UK Bond | Yes: due to low correlations | Yes: due to low correlations | Yes: due to low correlations | Yes: due to low correlations | Yes: due to low correlations, except in 2020 |
| Dow Jones Ṣukūk and UK Bond | Yes: due to low correlations | Yes: due to low correlations | No: due to frequent chunks of high correlations | Overall, yes: except during 2013–2015 | No: during 2013 to 2015 and 2017 to 2020 |
| US Bond and SPMENA Ṣukūk | Yes: due to low correlations | Yes: due to low correlations | Yes: except during the year 2014–2015, 2016–2017, and 2019 | Yes: due to low correlations | Overall, yes: except from 2014 to 2020 |
References
- Bhuiyan, R.A.; Rahman, M.P.; Saiti, B.; Ghani, G.M. Financial integration between Sukuk and Bond indices of emerging markets: Insights from wavelet coherence and multivariate-GARCH analysis. Borsa Istanb. Rev. 2018, 18, 218–230. [Google Scholar] [CrossRef]
- Miyajima, K.; Mohanty, M.S.; Chan, T. Emerging market local currency bonds: Diversification and stability. Emerg. Mark. Rev. 2015, 22, 126–139. [Google Scholar] [CrossRef]
- Kronfol, M. Sukuk: An Asset Class Goes Mainstream: Franklin Templeton. Beyond Bulls & Bears. 2017. Available online: https://global.beyondbullsandbears.com/2014/09/22/sukuk-asset-class-goes-mainstream/ (accessed on 23 June 2022).
- Bekaert, G.; Hodrick, R.J.; Zhang, X. International stock return comovements. J. Finance 2009, 64, 2591–2626. [Google Scholar] [CrossRef]
- Kim, S.-J.; Lucey, B.M.; WU, E. Dynamics of bond market integration between established and accession European Union countries. J. Int. Financ. Mark. Inst. Money 2006, 16, 41–56. [Google Scholar] [CrossRef]
- Chordia, T.; Sarkar, A.; Subrahmanyam, A. An empirical analysis of stock and bond market liquidity. Rev. Financ. Stud. 2005, 18, 85–129. [Google Scholar] [CrossRef]
- Connolly, R.; Stivers, C.; Sun, L. Stock market uncertainty and the stock-bond return relation. J. Financ. Quant. Anal. 2005, 40, 161–194. [Google Scholar] [CrossRef]
- Hartmann, P.; Straetmans, S.; de Vries, C.G. Asset market linkages in crisis periods. Rev. Econ. Stat. 2004, 86, 313–326. [Google Scholar] [CrossRef]
- Yang, J. International bond market linkages: A structural VAR analysis. J. Int. Financ. Mark. Inst. Money 2005, 15, 39–54. [Google Scholar] [CrossRef]
- Clare, A.D.; Maras, M.; Thomas, S.H. The integration and efficiency of international bond markets. J. Bus. Financ. Account. 1995, 22, 313–322. [Google Scholar] [CrossRef]
- DeGennaro, R.P.; Kunkel, R.A.; Lee, J. Modeling international long-term interest rates. Financ. Rev. 1994, 29, 577–597. [Google Scholar] [CrossRef]
- Barassi, M.R.; Caporale, G.M.; Hall, S.G. Irreducibility and structural cointegrating relations: An application to the G-7 long-term interest rates. Int. J. Finance Econ. 2001, 6, 127–138. [Google Scholar] [CrossRef]
- Smith, K.L. Government bond market seasonality, diversification, and cointegration: International evidence. J. Financ. Res. 2002, 25, 203–221. [Google Scholar] [CrossRef]
- Solnik, B.; Boucrelle, C.; Le Fur, Y. International market correlation and volatility. Financ. Anal. J. 1996, 52, 17–34. [Google Scholar] [CrossRef]
- Engle, R. Dynamic conditional correlation: A simple class of multivariate generalized autoregressive conditional heteroskedasticity models. J. Bus. Econ. Stat. 2002, 20, 339–350. [Google Scholar] [CrossRef]
- Bhuiyan, R.A.; Rahman, M.P.; Saiti, B.; Ghani, G.M. Co-movement dynamics between global Sukuk and bond markets: New insights from a wavelet analysis. Int. J. Emerg. Mark. 2019, 14, 550–581. [Google Scholar] [CrossRef]
- Samitas, A.; Papathanasiou, S.; Koutsokostas, D. The connectedness between Sukuk and conventional bond markets and the implications for investors. Int. J. Islam. Middle East. Finance Manag. 2021, 14, 928–949. [Google Scholar] [CrossRef]
- Mosli, N.Z.; Tayachi, T. Sukuk-Bond Dynamic Co-Movement and Driving Factors: Evidence from DCC-GARCH and Wavelet Analysis. PalArch’s J. Archaeol. Egypt/Egyptol. 2021, 18, 315–325. [Google Scholar]
- McGowan, C.B., Jr.; Muhammad, J. The theoretical impact of the listing of Syariah-approved stocks on stock price and trading volume. Int. Bus. Econ. Res. J. (IBER) 2010, 9, 11–19. [Google Scholar] [CrossRef]
- Bhutto, S.A.; Shaikh, S.; Amar, H.; Mangi, Q.A. The Classification of Sharia Assets and Performance of Financial Portfolio. Turk. J. Islam. Econ. 2021, 8, 517–530. [Google Scholar] [CrossRef]
- Nasreen, S.; Naqvi, S.A.A.; Tiwari, A.K.; Hammoudeh, S.; Shah, S.A.R. A wavelet-based analysis of the co-movement between Sukuk bonds and Shariah stock indices in the GCC region: Implications for risk diversification. J. Risk Financ. Manag. 2020, 13, 63. [Google Scholar] [CrossRef]
- Ghoul, W.; Karam, P. MRI and SRI mutual funds: A comparison of Christian, Islamic (morally responsible investing), and socially responsible investing (SRI) mutual funds. J. Investig. 2007, 16, 96–102. [Google Scholar] [CrossRef]
- Saad, N.M.; Haniff, M.N.; Ali, N. Corporate governance mechanisms with conventional bonds and Sukuk’ yield spreads. Pac.-Basin Finance J. 2020, 62, 101116. [Google Scholar] [CrossRef]
- Safari, M.; Ariff, M.; Shamsher, M. Do Debt Markets Price Ṣukūk and Conventional Bonds Differently? J. King Abdulaziz Univ. Islami. Econ. 2013, 26, 113–149. [Google Scholar]
- Ataturk, Y.; Asutay, M.; Aksak, E. What explains corporate Sukuk primary market spreads? Res. Int. Bus. Finance 2017, 40, 141–149. [Google Scholar] [CrossRef]
- Hossain, M.S.; Uddin, M.H.; Kabir, S.H. Sukuk and bond puzzle: An analysis with characteristics matched portfolios. Emerg. Mark. Finance Trade 2021, 57, 3792–3817. [Google Scholar] [CrossRef]
- Miniaoui, H.; Sayani, H.; Chaibi, A. The impact of financial crisis on Islamic and conventional indices of the GCC countries. J. Appl. Bus. Res. (JABR) 2015, 31, 357–370. [Google Scholar] [CrossRef]
- Cevik, E.I.; Bugan, M.F. Regime-dependent relation between Islamic and conventional financial markets. Borsa Istanb. Rev. 2018, 18, 114–121. [Google Scholar] [CrossRef]
- Trabelsi, L.; Bahloul, S.; Mathlouthi, F. Performance analysis of Islamic and conventional portfolios: The emerging markets case. Borsa Istanb. Rev. 2020, 20, 48–54. [Google Scholar] [CrossRef]
- Farooq, M.; Zaheer, S. Are Islamic banks more resilient during financial panics? Pac. Econ. Rev. 2015, 20, 101–124. [Google Scholar] [CrossRef]
- Beck, T.; Demirgüç-Kunt, A.; Merrouche, O. Islamic vs. conventional banking: Business model, efficiency and stability. J. Bank. Finance 2013, 37, 433–447. [Google Scholar] [CrossRef]
- Azad, A.S.M.S.; Azmat, S.; Chazi, A.; Ahsan, A. Sailing with the non-conventional stocks when there is no place to hide. J. Int. Financ. Mark. Inst. Money 2018, 57, 1–16. [Google Scholar] [CrossRef]
- Abduh, M. Volatility of Malaysian conventional and Islamic indices: Does financial crisis matter? J. Islam. Account. Bus. Res. 2020, 11, 1–11. [Google Scholar] [CrossRef]
- Boujelbène Abbes, M. Risk and return of Islamic and conventional indices. Int. J. Euro-Mediterr. Stud. 2012, 5, 1–23. [Google Scholar] [CrossRef]
- Rana, M.E.; Akhter, W. Performance of Islamic and conventional stock indices: Empirical evidence from an emerging economy. Financ. Innov. 2015, 1, 15. [Google Scholar] [CrossRef]
- Ji, Q.; Zhang, D.; Zhao, Y. Searching for safe-haven assets during the COVID-19 pandemic. Int. Rev. Financ. Anal. 2020, 71, 101526. [Google Scholar] [CrossRef]
- Al-Awadhi, A.M.; Alsaifi, K.; Al-Awadhi, A.; Alhammadi, S. Death and contagious infectious diseases: Impact of the COVID-19 virus on stock market returns. J. Behav. Exp. Finance 2020, 27, 100326. [Google Scholar] [CrossRef]
- Ashraf, B.N. Stock markets’ reaction to COVID-19: Cases or fatalities? Res. Int. Bus. Finance 2020, 54, 101249. [Google Scholar] [CrossRef]
- Hasan, M.B.; Mahi, M.; Hassan, M.K.; Bhuiyan, A.B. Impact of COVID-19 pandemic on stock markets: Conventional vs. Islamic indices using wavelet-based multi-timescales analysis. North Am. J. Econ. Finance 2021, 58, 101504. [Google Scholar] [CrossRef]
- Aloui, C.; Asadov, A.; Al-kayed, L.; Hkiri, B.; Danila, N. Impact of the COVID-19 outbreak and its related announcements on the Chinese conventional and Islamic stocks’ connectedness. North Am. J. Econ. Finance 2022, 59, 101585. [Google Scholar] [CrossRef]
- Pakko, M.R. A spectral analysis of the cross-country consumption correlation puzzle. Econ. Lett. 2004, 84, 341–347. [Google Scholar] [CrossRef]
- A’Hearn, B.; Woytek, U. More international evidence on the historical properties of business cycles. J. Monetary Econ. 2001, 47, 321–346. [Google Scholar] [CrossRef]
- Kiymaz, H. Stock returns, volatility spillover, and other financial issues in emerging markets. Int. J. Emerg. Mark. 2013, 8. [Google Scholar] [CrossRef]
- Saiti, B.; Bacha, O.I.; Masih, M. Testing the conventional and Islamic financial market contagion: Evidence from wavelet analysis. Emerg. Mark. Finance Trade 2016, 52, 1832–1849. [Google Scholar] [CrossRef]
- Vortelinos, D.I. Realized correlation analysis of contagion. Q. Rev. Econ. Finance 2016, 60, 138–148. [Google Scholar] [CrossRef]
- Al Refai, H.; Eissa, M.A.; Zeitun, R. Asymmetric volatility and conditional expected returns: Evidence from emerging market sectors. Int. J. Emerg. Mark. 2017, 12, 335–351. [Google Scholar] [CrossRef]
- Haque, M.M.; Chowdhury, M.A.F.; Buriev, A.A.; Bacha, O.I.; Masih, M. Who drives whom-Sukuk or Bond? A new evidence from granger causality and wavelet approach. Rev. Financ. Econ. 2018, 36, 117–132. [Google Scholar] [CrossRef]
- IIFM Sukuk Report, 10th Edition. 2021. Available online: www.iifm.net/wp-content/uploads/2021/08/IIFM-SukukReport-10th-Edition.pdf (accessed on 2 January 2022).
- Grinsted, A.; Moore, J.C.; Jevrejeva, S. Application of the cross wavelet transform and wavelet coherence to geophysical time series. Nonlinear Process. Geophys. 2004, 11, 561–566. [Google Scholar] [CrossRef]
- Aguiar-Conraria, L.; Soares, M.J. Oil and the macroeconomy: Using wavelets to analyze old issues. Empir. Econ. 2011, 40, 645–655. [Google Scholar] [CrossRef]
- Bodart, V.; Candelon, B. Evidence of interdependence and contagion using a frequency domain framework. Emerg. Mark. Rev. 2009, 10, 140–150. [Google Scholar] [CrossRef]
- Vacha, L.; Barunik, J. Co-movement of energy commodities revisited: Evidence from wavelet coherence analysis. Energy Econ. 2012, 34, 241–247. [Google Scholar] [CrossRef]
- Torrence, C.; Webster, P.J. Interdecadal changes in the ENSO–monsoon system. J. Clim. 1999, 12, 2679–2690. [Google Scholar] [CrossRef]
- Torrence, C.; Compo, G.P. A practical guide to wavelet analysis. Bull. Am. Meteorol. Soc. 1998, 79, 61–78. [Google Scholar] [CrossRef]
- Najeeb, S.F.; Bacha, O.; Masih, M. Does a held-to-maturity strategy impede effective portfolio diversification for Islamic Bond (Sukuk) portfolios? A multi-scale continuous wavelet correlation analysis. Emerg. Mark. Finance Trade 2017, 53, 2377–2393. [Google Scholar] [CrossRef]
- Aloui, C.; Hammoudeh, S.; Hamida, H.B. Co-movement between sharia stocks and Sukuk in the GCC markets: A time-frequency analysis. J. Int. Financ. Mark. Inst. Money 2015, 34, 69–79. [Google Scholar] [CrossRef]
- Piesse, J.; Israsena, N.; Thirtle, C. Volatility transmission in Asian bond markets: Tests of portfolio diversification. Asia Pac. Bus. Rev. 2007, 13, 585–607. [Google Scholar] [CrossRef]
- Yang, L.; Hamori, S. Interdependence between the bond markets of CEEC-3 and Germany: A wavelet coherence analysis. North Am. J. Econ. Finance 2015, 32, 124–138. [Google Scholar] [CrossRef]
- Fleming, J.; Kirby, C.; Ostdiek, B. Information and volatility linkages in the stock, Bond, and money markets. J. Financ. Econ. 1998, 49, 111–137. [Google Scholar] [CrossRef]
- Akhtar, S.M.; Akhtar, F.; Jahromi, M.; John, K. Intensity of Volatility Linkages in Islamic and Conventional Markets. 2016. Available online: https://ssrn.com/abstract=2906546 (accessed on 23 June 2022).
- Bhutto, N.A.; Khan, S.; Khan, U.A.; Matlani, A. The impact of COVID-19 on conventional and Islamic stocks: Empirical evidence from Pakistan. J. Econ. Adm. Sci. 2022. ahead-of-print. [Google Scholar] [CrossRef]


| No | Index Name | Ticker |
|---|---|---|
| 1 | Dow Jones Sukuk Index | DJSUKUK Index |
| 2 | The S&P Gulf Cooperation Council (GCC) Sukuk index | SPSUKHYT Index |
| 3 | US Generic Govt Bond 10 YR | USGG10YR Index |
| 4 | FTSE Sukuk Index | SBKU0P Index |
| 5 | S&P Middle East and North Africa (MENA) SUKUK | SPBDSMNT Index |
| 6 | Gulf Cooperation Council (GCC) Bond Index | H30738EU Index |
| 7 | Global Aggregate Bond Index | LEGATRUU Index |
| 8 | S&P Middle East and North Africa (MENA) Bond Index | SPMNAHY Index |
| 9 | Dow Jones Sukuk AP | DJSUKB Index |
| 10 | UK BOND | UK BOND |
| 11 | Global death counts of COVID-19 | GDC |
| Dow Jones Sukuk | Dow Jones Sukuk | Global Aggregate Bond | US Bond | GCC Bond | SPMENA Bond | SPGCC Sukuk | FTSE Sukuk | SPMENA Sukuk | Dow Jones Sukuk AP | UK Bond |
|---|---|---|---|---|---|---|---|---|---|---|
| Mean | 0.0000 | 0.0001 | 0.0003 | 0.0002 | 0.0002 | 0.0002 | 0.0004 | 0.0002 | 0.0000 | 0.0001 |
| Standard Error | 0.0001 | 0.0000 | 0.0004 | 0.0001 | 0.0003 | 0.0001 | 0.0002 | 0.0000 | 0.0000 | 0.0001 |
| Median | 0.0000 | 0.0002 | 0.0000 | 0.0002 | 0.0002 | 0.0003 | 0.0003 | 0.0002 | 0.0001 | 0.0000 |
| Standard Deviation | 0.0038 | 0.0032 | 0.0278 | 0.0037 | 0.0067 | 0.0029 | 0.0067 | 0.0012 | 0.0013 | 0.0056 |
| Sample Variance | 0.0000 | 0.0000 | 0.0008 | 0.0000 | 0.0000 | 0.0000 | 0.0000 | 0.0000 | 0.0000 | 0.0000 |
| Kurtosis | 812.9143 | 5.3573 | 36.7246 | 34.4013 | 24.5524 | 37.5656 | 31.0893 | 15.0393 | 18.8884 | 8.4814 |
| Skewness | −14.6381 | −0.0175 | 0.1715 | −0.7949 | −2.9852 | −2.9764 | 0.6563 | −1.2334 | −1.8871 | 0.4653 |
| Range | 0.2320 | 0.0502 | 0.7500 | 0.0745 | 0.0942 | 0.0580 | 0.1383 | 0.0198 | 0.0211 | 0.0961 |
| Minimum | −0.1566 | −0.0220 | −0.3435 | −0.0401 | −0.0605 | −0.0365 | −0.0522 | −0.0117 | −0.0138 | −0.0330 |
| Maximum | 0.0754 | 0.0282 | 0.4065 | 0.0344 | 0.0337 | 0.0215 | 0.0861 | 0.0082 | 0.0073 | 0.0631 |
| Sum | 0.0910 | 0.5752 | −1.1438 | 0.4735 | −0.0895 | 0.4598 | 0.5139 | 0.3380 | 0.0205 | 0.3098 |
| Correlation Matrix | Dow Jones Sukuk | Global Aggregate Bond | US Bond | GCC Bond | SPMENA Bond | SPGCC Sukuk | FTSE Sukuk | SPMENA Sukuk | UK Bond |
|---|---|---|---|---|---|---|---|---|---|
| Dow Jones Sukuk | 1 | ||||||||
| Global Aggregate Bond | 0.0361 | 1 | |||||||
| US Bond | −0.0131 | −0.1030 | 1 | ||||||
| GCC Bond | −0.0162 | −0.0629 | 0.0621 | 1 | |||||
| SPMENA Bond | 0.0241 | 0.0338 | −0.0392 | 0.2755 | 1 | ||||
| SPGCC Sukuk | 0.1844 | 0.0749 | 0.0126 | 0.0492 | 0.3058 | 1 | |||
| FTSE Sukuk | 0.0996 | 0.1407 | 0.0368 | 0.0720 | −0.0766 | 0.1904 | 1 | ||
| SPMENA Sukuk | 0.2359 | 0.1095 | −0.0453 | 0.0098 | −0.0001 | 0.2350 | 0.2077 | 1 | |
| UK Bond | −0.0363 | −0.0227 | −0.0067 | 0.0651 | 0.0355 | −0.0399 | −0.0381 | −0.0529 | 1 |
Publisher’s Note: MDPI stays neutral with regard to jurisdictional claims in published maps and institutional affiliations. |
© 2022 by the authors. Licensee MDPI, Basel, Switzerland. This article is an open access article distributed under the terms and conditions of the Creative Commons Attribution (CC BY) license (https://creativecommons.org/licenses/by/4.0/).
Share and Cite
Khan, S.; Bhutto, N.A.; Khan, U.A.; Rehman, M.Z.; Alonazi, W.B.; Ludeen, A. Ṣukūk or Bond, Which Is More Sustainable during COVID-19? Global Evidence from the Wavelet Coherence Model. Sustainability 2022, 14, 10541. https://doi.org/10.3390/su141710541
Khan S, Bhutto NA, Khan UA, Rehman MZ, Alonazi WB, Ludeen A. Ṣukūk or Bond, Which Is More Sustainable during COVID-19? Global Evidence from the Wavelet Coherence Model. Sustainability. 2022; 14(17):10541. https://doi.org/10.3390/su141710541
Chicago/Turabian StyleKhan, Shabeer, Niaz Ahmed Bhutto, Uzair Abdullah Khan, Mohd Ziaur Rehman, Wadi B. Alonazi, and Abdullah Ludeen. 2022. "Ṣukūk or Bond, Which Is More Sustainable during COVID-19? Global Evidence from the Wavelet Coherence Model" Sustainability 14, no. 17: 10541. https://doi.org/10.3390/su141710541
APA StyleKhan, S., Bhutto, N. A., Khan, U. A., Rehman, M. Z., Alonazi, W. B., & Ludeen, A. (2022). Ṣukūk or Bond, Which Is More Sustainable during COVID-19? Global Evidence from the Wavelet Coherence Model. Sustainability, 14(17), 10541. https://doi.org/10.3390/su141710541