Abstract
We assessed the implementation of operational programs (OPs) aimed at boosting the deployment of information and communication technologies (ICTs) in small and medium-sized enterprises (SMEs). We performed a three-stage slack-based measure (SBM) data envelopment analysis (DEA) model combined with the stochastic frontier analysis (SFA), which considered data and contextual factors reported from the European Union (EU) to appraise 51 OPs from 16 countries. Overall, we discovered that by eliminating the contextual factors, almost 27% of the OPs (14) attained efficient procedural results. The OP “Multi-regional Spain—ERDF” is widely perceived as a benchmark, irrespective of its contextual factors, remaining robustly efficient for data perturbations ranging from 5% to 10%. The “Number of Operations Supported” is the indicator that requires attention, both with or without the removal of contextual factors. Our findings suggest that more developed regions, with a greater proportion of ICT professionals, are associated with a poor utilization and allocation of ERDF funds to promote ICT adoption in SMEs. This could be attributed to an inability of SMEs to handle the complex bureaucratic processes of submitting and executing European Regional Development Fund (ERDF) initiatives. Consequently, it is vital to provide additional assistance that streamlines the management formalities and satisfies the needs of SMEs.
1. Introduction
Information and communication technologies (ICTs) may help businesses adjust to world trade conditions by cutting border operational costs and boosting access to novel, valuable resources [1,2,3]. Furthermore, it is well-known that ICTs may have a significant beneficial influence on profitability [4,5,6]. The influence of ICTs on establishing connections, both internal and external, is also vital to the success of SMEs in their innovation activities [7,8]. It has been demonstrated that adopting broadband Internet also has a positive impact on the innovation capabilities of SMEs [9]. Some researchers have determined that ICTs may assist small businesses in improving their production, efficiency, and performance [10,11,12,13]. Furthermore, various studies have demonstrated that the beginning of the COVID-19 pandemic resulted in the rapidly increased use of digital technology, particularly for SMEs [14,15].
Despite the benefits and opportunities that ICTs and digital technologies may offer, as well as the fast development of their adoption in recent years, SMEs have not yet exploited their full capabilities [16,17]. New technologies, notably digital technologies and ICTs, continue to pose challenges for companies [18,19,20]. This may in part be due to the fact that SMEs have limited resources, technology, and expertise. In practice, there are various barriers that limit the use of ICTs by SMEs [21]: financial, as substantial expenditure is necessary and funding is difficult to receive; infrastructure, due to electricity prices, broadband, and reliable Internet access; organizational, mainly related to the dearth of qualified staff; and technical, as technological development requires suitable planning. Another problem hindering the use of ICTs is the widespread misunderstanding of the possibilities and consequences of digital transformation [22,23]. On the one hand, SMEs fear the loss of competitiveness, productivity, and profitability if they do not undergo digital transformation [24,25]. On the other hand, managers tend to dismiss digital initiatives, as they are unsure of how to incorporate them into the organizations they lead [22,26].
To promote ICT adoption by SMEs, governments must implement policies that close the digital divide (DD), provide free broadband Internet access, and support education on the relevant topics [22,23,26].
Several attempts have been made over the last 10 years to examine the importance of ICT use by SMEs, resulting in the production of a vast corpus of literature reviews. Taylor [27] investigated two conceptual models: the diffusion of innovation theory [28] and the technology, organization, and environment framework [29], to create a comprehensive theoretical foundation for ICT use by SMEs. This holistic model included an overarching ontology that identifies many of the most significant internal and external factors impacting ICT usage by SMEs. Similarly, [30] conducted a literature review on the relationship between ICTs, SMEs, and poverty reduction. This research highlighted the importance of ICT implementation by SMEs and investigated how SMEs could use ICTs to assist in poverty reduction. Differences in the accessibility of ICTs across enterprises were also explored in a survey by [31] on the DD between companies. This evaluation examined the geographical location, company type, and period of the study, as well as the effect and sources of the DD. Other research has examined the primary causes, consequences, and challenges to ICT usage by SMEs [21]. Tarutė and Gatautis [32] investigated the potential effects of ICTs on the profitability of SMEs. Lehner and Sundby [22] focused on the relevance of ICT skills for SMEs, considering several viewpoints. Oberländer et al. [20] recently evaluated digital competence in the workplace. Isensee et al. [33] created a theoretical framework to provide a holistic view of the organization behavior, sustainability, and digitization levels (including interactions between the three) of SMEs; they concluded that the most frequently researched cultural characteristics were strategies, organizational skill sets, administration, and attitudes. Another recent report [34] examined digital innovation in SMEs, observing that it was governed by prior experience, advanced through multiple phases of innovation, and resulted in a continual organizational and corporate improvement. In the same vein, [35] conducted a literature review to assist in the identification of the key challenges and opportunities for SMEs in the context of digitalization and ICT breakthroughs.
None of the prior reviews centered on the examination of ICT policy. As [36] noted, there has been a lack of academic emphasis on how to choose the optimal strategy for finance allocation. Furthermore, there have only been a few studies conducted to assess if the type of financing is distributed in accordance with the most urgent needs of every location [37,38]. Ex post evaluations are commonly used in studies, which appraise the European structural funds that are allocated to ICTs [37,38]. Some research has also provided ex ante assessments of the variables impacting funding allocation among various ICT initiatives [36]. Nevertheless, to date, no studies have been conducted that contrast the application of OPs related to ICT policies with their counterparts during programmatic timeframes, or that highlight the changes that must be implemented to make an inefficient OP more efficient.
As a result, the purpose of this study was to add to the literature by using a methodological approach that enables management authorities (MAs) to evaluate the execution of OPs dedicated to assisting the implementation of ICTs in SMEs using a non-parametric methodology, specifically, the SBM model in conjunction with the SFA model.
Basically, the primary research questions this study sought to answer were as follows:
RQ1: Which factors hinder the efficient use of ERDFs allotted to increase ICT usage in the EU SMEs?
RQ2: Which OPs were widely reported as benchmarks throughout the programming period evaluated?
RQ3: Which OPs show a more resilient performance in the face of variations in the utilized metrics?
RQ4: Which contextual variables have the highest influence on the inefficiency of the OPs?
RQ5: How does efficiency vary when contextual variables are introduced?
This paper has the following structure. Section 2 provides a literature review on ICT policies/strategies among the EU SMEs. Section 3 explains the basic assumptions underlying the suggested methodological approaches to assess the execution of the OPs being evaluated. Section 4 addresses the key rationale for the chosen input and output parameters and contextual factors utilized in our assessment, as well as some descriptive statistics on the data used in the SBM and SFA models. Section 5 discusses the primary findings in depth. Section 6 summarizes the significant findings, discusses the potential political consequences, highlights the key shortcomings, and proposes future research directions.
2. Literature Review
Successful strategies and suitable policies regarding the adoption of ICTs by SMEs require an understanding of the literature dedicated to this topic. In this context, starting with the Scopus and OpenAlex databases (using Harzing’s Publish or Perish software, version 8, released by David Adams [39]), we began our literature search by considering the combinations of title words, such as “ICT”/“digital transformation”, “SMEs”/“firms”, and “policy” for articles published in the years selected by default by the software. Subsequently, we refined our search by only considering publications that were available online, in English, and devoted to Europe or European countries. The findings of this search are given in Table 1.
From the obtained results, it can be concluded that the literature on this topic is scarce. Only a few studies have addressed the successful development and use of ICTs by SMEs through the establishment of programs and policies by the EU, national, and regional governments. In this context, [40] addressed several initiatives undertaken by the European Commission since the Lisbon summit of March 2000, concluding that the European regional policies have changed from simply getting SMEs connected to the Internet to the effective integration of ICTs into business processes. Recently, [41] also examined the lessons that the EU learned with respect to their experience in fostering digital adoption by SMEs, namely in terms of strengthening the ability for digital transformation, sustainable growth, lowering regulatory burdens, expanding market access, developing finance channels, and lowering the difficulty and cost of financing. Along the same lines but considering a national context, [42] studied Spain as a point of comparison. Later, [43] explored the first public initiatives in Spain to help SMEs and micro-SMEs use cloud computing services, which also aimed to support SMEs in their digital transformation, promote e-commerce, and boost competitiveness. Skoko et al. [44] proposed an ICT adoption model for Australian and Croatian SMEs, which was based on the concept that SMEs are the primary economic development force in all advanced economies. Similarly, [45] presented the findings of an ex post assessment of a national ICT program devoted to SMEs in the Netherlands that took place from 2002 to 2007. Later, [46] evaluated the government program to boost SMEs’ inter-organizational ICTs, proposing simple, awareness-focused policy programs. More recently, [47] studied the influence of digitization on demand-side policies that encourage SMEs in Wales to embrace broadband and digital technologies.
Alternatively, other published works addressed specific activity sectors. With respect to this framework, [48] reviewed and compiled an extremely diverse set of literature on the use of ICTs in rural SMEs, offering an overview of the generic policy concerns. In a different sector, [49] sought to examine if horizontal, general purpose direct support mechanisms at the national level and financial support measures at the local level allowed for the effective deployment of public funds; they had a particular focus on the Italian ICT services firms. More recently, [50] assessed legislative measures performed in Greece to facilitate the national digital transformation of Greek tourist SMEs.
Other studies addressed specific policy instruments, such as in [51], which aimed to provide national/regional decision-makers and/or existing digital innovation hub (DIH) managers with valuable and organized details regarding how to install a new DIH, or how to strengthen current ones while receiving funding, with a special focus on the ERDF of 2021–2027.
Finally, [52] discussed the main hurdles that governments face in encouraging SMEs to benefit from digital transformation, and put forth important policy recommendations, such as: (1) stimulating SMEs so that they adopt digital technologies, (2) assisting SMEs in training and developing the appropriate skills, (3) improving management skills in SMEs, and (4) utilizing financial technology (Fintech) and innovative sources of funding for SMEs.
From the literature review conducted, we established that the strategy of ICT adoption by businesses was influenced by and was a product of the regional economic dynamics. Therefore, the assessment of environmental factors through the SFA model proposed herein is timely and relevant. Additionally, it can be ascertained that the studies available usually conducted ex post assessments of ICT policy interventions, with a dearth of scholarly attention to the evaluation of the ICT policy during its midterm/terminal uptake. Hence, this study aimed to fill this gap in the literature by using an overarching methodological approach, one that allowed for the performance of a midterm/terminal assessment of the execution of OPs dedicated to assisting SMEs in the adoption of ICTs using a non-parametric methodology, specifically the SBM model, in conjunction with the SFA model. With this approach, it is possible to detect whether the inefficiency of these OPs is the result of management failures or contextual factors.

Table 1.
Studies dedicated to study ICTs/digital policies in SMEs.
Table 1.
Studies dedicated to study ICTs/digital policies in SMEs.
| Authors | Main Topics Addressed |
|---|---|
| Cuadrado-Roura and Garcia-Tabuenca [42] | Analyzed EU programs and policies aimed at the successful use of ICT in SMEs, focusing on Spain |
| Santinha and Soares [40] | Analyzed several initiatives undertaken by the European Commission since the Lisbon summit of March 2000, particularly European regional policies related to the effective integration of ICTs into business processes |
| Galloway and Mochrie [48] | Aimed to compile the extremely diverse literature on the use of ICTs in rural SMEs to offer an overview of the generic policy concerns |
| Skoko et al. [44] | Suggested an ICT adoption model in Australian and Croatian SMEs |
| Colombo and Grilli [49] | Evaluated if both horizontally general purpose direct support mechanisms at the national and local levels allowed for the effective deployment of public funds, with a focus on the Italian ICT services industry |
| Plomp et al. [45] | Ex post assessment of the Netherlands ICT policy program for SMEs that took place between 2002 and 2007 |
| Plomp et al. [46] | Proposed simple, awareness-focused policy programs rather than extensive, government-supported initiatives in the Netherlands |
| Calle et al. [43] | Assessment of the first public initiatives to help Spanish SMEs in their digital transformation |
| Kalpaka et al. [51] | Proposed digital innovation hubs as a policy instrument to boost the digitalization of SMEs, focusing on the ERDF of 2021–2027 |
| Henderson [47] | Investigated the influence of digitization on demand-side policies that encourage SMEs to embrace broadband and digital technologies |
| Kergroach [52] | Appraisal of the government challenges in fostering digital transformation in OECD SMEs |
| Dionysopoulou and Tsakopoulou [50] | Looked at the ongoing policy initiatives in Greece to support the digital transformation of Greek tourism SMEs on a national level |
| Dong and Meng [41] | Observed the lessons learned from the EU’s experience in assisting the digital transformation of SMEs as a benchmark for Chinese SMEs |
3. Methodology
Conventional DEA approaches, such as the Charnes–Cooper–Rhodes model, or CCR model [53], and the Banker–Charnes–Cooper model, or BCC [54], are radial, i.e., they only handle the proportionate changes in the inputs (resources) or outputs (outcomes) utilized in the efficiency evaluation. As a result, the CCR and BCC efficiency scores generated represent the greatest possible proportional input (or output) retraction (or growth) rate for all inputs (or outputs). In practice, however, this type of assumption is often not attainable due to factor substitution.
Therefore, in contrast to the CCR and BCC models, we used the SBM model [55], which allows for a more detailed examination of efficiency as it is non-radial (i.e., inputs and outputs can adjust non-proportionally) and non-oriented (i.e., it allows for simultaneous changes in the inputs and outputs).
Nevertheless, one of the disadvantages of the DEA technique is that it does not take into consideration the influence of contextual variables and random errors in the efficiency evaluation. As a result, [56] suggested a three-stage DEA model. First, the SBM model is used to generate the efficiency scores of each decision-making unit (DMU), i.e., the units under evaluation (the OPs in this study), as well as the required adjustments on the input and output factors to turn inefficient DMUs into efficient ones (i.e., the slacks). Second, the slacks are broken down into three categories: contextual factors, management inefficiency, and statistical noise. The slacks are the dependent variables, whereas the independent variables are the contextual factors. The goal is to eliminate the impact of contextual variables and random errors. Subsequently, the input and output factors are modified using the SFA model [57,58]. Finally, at the third stage, the efficiency scores are computed once more with the modified input and output factors.
3.1. First Stage: Computing Efficiencies for Every DMU with Original Inputs and Outputs through the SBM Model
Based on the three-stage method of [56], in the first stage, the slacks are computed through the SBM model. The SBM model is given by [55]:
where we consider a set of DMUs (), with X = [xij, i = 1, 2, …, m, j = 1, 2, …, n] being the matrix of inputs (m × n), Y = [yrj, r = 1, 2, …, s, j = 1, 2, …, n] being the vector of outputs (s × n), and the rows of the matrices for DMUk are and , respectively, with T representing the transpose of a vector.
The value of 0 < ρ < 1 can be seen as the ratio of average inefficiencies of inputs and outputs.
Model (1) can be transformed into Model (2), by using a positive scalar variable t:
Let = , = and = . Next, Model (2) turns into:
The optimal solution corresponds to:
ρ* = τ*, * = */t*, = /t*, = /t*.
Definition 1.
A DMUk is efficient if, meaning that = 0 and.
Definition 2.
The set of benchmark DMUs for each inefficient DMUk is Ek = {j:, j = 1, …, n}.
Definition 3.
The reference point for each inefficient DMUk is:
We have also used the Super-SBM non-oriented model proposed by [59], which evaluates the efficiency of a DMU, considering the closest efficient point on the frontier excluding itself. The optimal value of the objective function of this latter model is always greater than or equal to 1. Nevertheless, since the super-efficiency for DMUk can be 1, even if the DMU is inefficient, to check if a DMUk is inefficient or not, both Model (1) and Tone’s model must be solved. If DMUk is efficient in accordance with Model (1), Tone’s model should be applied to compute its Super-SBM non-oriented efficiency score.
3.2. Second Stage: Obtaining the Adjusted Input and Output Factors for Inefficient DMUs Using the SFA Model
In the second stage, the input and output variables of each DMU are modified according to the SFA results by eliminating the significant contextual effects and statistical noises.
Each input slack is obtained for j inefficient DMU () through:
where is the slack value of input i of DMUj, is the deterministic feasible slack frontier, and denotes the coefficients associated with the contextual factors. The term is the mixed error, relates to the statistical noise, and relates to the management inefficiency. Usually, it is assumed that and with and corresponding to the independent variables.
Let . If is near 1, it means that the management factors are in a leading position, i.e., most of the change required to attain efficiency is linked to the management inefficiency. If is near 0, the random error is the predominant factor, i.e., most of the change required to attain efficiency is related to the statistical noise.
The adjusted input and output slacks are then computed by decomposing the mixed error. In line with [60], the management inefficiency is computed as follows:
where and are, respectively, the density and distribution functions of the standard normal distribution. Therefore, the random error term can be obtained as:
The input data are then modified by considering [56]:
By following an analogous process, the adjusted outputs are obtained as follows [61]:
3.3. Third Stage: Computing the Efficiencies of Every DMU with the Adjusted Inputs and Outputs through the SBM Model
Finally, in the third stage, the efficiency scores are computed through the SBM method, with the modified input and output factors as follows:
where = if DMUj (j = 1, …, n) is found to be efficient in the first stage and if otherwise. Similarly, if DMUj (j = 1, …, n) is found to be efficient in the first stage and if otherwise.
4. Data
The input and output factors chosen for evaluating the execution efficiency of the ERDF engagement in SME ICT usage were drawn from an array of cross-cutting metrics formally required by the EU (Available online: https://cohesiondata.ec.europa.eu/2014-2020-Categorisation/ESIF-2014-2020-categorisation-ERDF-ESF-CF-planned-/3kkx-ekfq (accessed on 30 March 2022)).
Due to the lack of data on ICT usage at the corporate level from conventional datasets per NUTS2 region [36,62,63], we utilized indicators that were accessible from the Regional Innovation Scoreboard 2021 as the contextual factors [64]. These were selected according to the literature on the primary factors influencing ICT usage in EU SMEs. Other statistical data were obtained from OECD statistics (Available online: https://stats.oecd.org/Index.aspx?DataSetCode=REGION_ECONOM (accessed on 30 March 2022)).
4.1. Input and Output Factors
4.1.1. “Total Eligible Costs Decided” and “Total Eligible Spending”
“Total Eligible Spending” and “Total Eligible Costs Decided” were the metrics used to assess the capability of the OPs’ uptakes. The first is about the eligible expenses that have been recorded and validated by a decision body. As a result, this factor was used as an output, since the higher the value allocated to it, the higher the financial execution of each project. The second was considered an input because it pertains to the budget available to the projects chosen for financing, which must be kept to a minimum.
4.1.2. “Number of Operations Supported”
The “Number of Operations Supported” refers to the number of ERDF-funded initiatives. The greater the number of initiatives financed, the larger the possibility of increasing/improving enterprises’ usage of ICTs. As a result, this indicator was regarded as an output.
Table 2 provides the descriptive statistics of the inputs and outputs employed in the efficiency assessment of the OPs.
Table 2.
The descriptive statistics of the inputs and outputs.
4.2. Contextual Variables
Regarding independent factors (see Table 2), we used the regional GDP at purchasing power parity per capita (GDPPPPpc) as a proxy for the economic growth [36,62,63]. According to [65], ICTs are more effectively deployed in richer regions.
We also included the percentage of the population aged 25–34 years who have finished university education as a contextual variable, as evidence shows a favorable relationship between education received and ICT use [62,63]. In the case of ICT use, certain explanations have been emphasized to justify this apparent favorable link. On the one hand, education is believed to provide the necessary skills for utilizing and benefiting from ICTs. Employees, on the other hand, have been assumed to be more adept in understanding how to use innovative technology, particularly ICTs [63].
Furthermore, because R&D expenditures promote ICT diffusion in European regions [62,63,66], we utilized R&D spending in the corporate sector as a percentage of GDP and SMEs bringing innovative products as a percentage of all SMEs, corresponding as recorded independent variables.
Furthermore, because a firm’s ICT skills are viewed as an essential technology-related aspect that influences user acceptability and ICT adoption [66], we included employees with above-average digital capabilities as a fraction of the total SME employees. Lastly, the proportion of ICT experts have been utilized as a fraction of total SMEs’ labor; in other words, these are employees whose major vocation is ICTs and can manage a wide range of tasks related to an enterprise’s computer systems [67].
The min-max approach was used to normalize the data, which meant that the minimum score for all locations throughout all the years was removed from the corresponding converted score, which was then divided by the difference between the maximum and minimum values recorded for all data (regions and years). Table 3 depicts the normalized scores that range between 0 and 1, apart from the GDPPPPpc variable, which was measured by an index number.
Table 3.
The descriptive statistics of the contextual variables.
5. Discussion of Results
The discussion of the results obtained with the three-stage SBM approach are listed below.
5.1. First Stage: Computing the Efficiencies for Every DMU with the Original Inputs and Outputs through the SBM Model
Results were obtained through the Max DEA software, version 8 Ultra (v8.22, R2022/3/21), and their descriptive statistics are depicted in Table 4.
Table 4.
The descriptive statistics of the results obtained.
As seen from Table 4, the efficient OPs have greater mean scores than inefficient OPs (with efficiency values varying between 1.00 and 1.71 and at least 50% of the efficient OPs having efficiency values greater than 1.16). In addition, the inefficient OPs have a wide variety of efficiency ratings scores, ranging from 0 to 0.96 (with a standard deviation of 0.25 and at least 50% of the inefficient OPs with efficiency values lower than 0.06).
The four OPs chosen as the references of best practices are “Extremadura—ERDF” (27), “Pas Vasco—ERDF” (26), “Provence-Alpes-Côte d’Azur—ERDF/ESF/YEI” (20), and “Multi-regional Spain—ERDF” (14) (see Table 5). Surprisingly, all of these territories belong to countries that are regarded as the largest spenders on ICT assistance for SMEs [68]. Moreover, the results produced by the Spanish regional OP conform with the findings of [67].
Table 5.
The characteristics of the efficient OPs.
According to these authors, Spanish regions (at the corporate level) have a moderate or higher level of digital development compared with other EU counterparts, as well as a lower DD between the firms (i.e., a lesser discrepancy in firm digitalization) than the other European MSs. In the study published by [67], Greece and Bulgaria were recognized as countries whose companies were positioned last in terms of digital acceptance (per the 2015 data), showcasing the steps taken by these countries in the integration of ICTs by SMEs in the most recent programmatic period.
The SBM model also provides an overview of the modifications that must be made to inputs and outputs to turn inefficient OPs into efficient ones (Table 6).
Table 6.
Improvement potential for the OPs.
The “Number of Operations Supported” had the greatest enhancement potentiality (i.e., it must rise from 189.54 to 782.72 to promote efficiency), while “Eligible Costs Decided” required a moderate reduction (−22%); “Eligible Spending” (2%) only required minor modifications (see Table 6).
5.2. Second Stage: Obtaining the Adjusted Input and Output Factors for Inefficient DMUs Using the SFA Model
The slacks of the outputs derived from Model (2) were employed as the dependent variables, leading to two linear regressions. We evaluated the multicollinearity through the correlation coefficients and variance inflation factors (VIFs). From the correlation analysis, it is possible to conclude that ICT specialists and GDPPPPPC have a strong positive correlation (0.73). Meanwhile, all the remaining associations are moderate correlations, with coefficients ranging from 0.32 to 0.65.
Since multicollinearity occurs when two or more explanatory factors are strongly correlated, the VIF values were obtained as well. The VIF values begin at one and has no maximum bound. Values between one and five suggest a moderate correlation, although we deemed this range to not be significant enough to cause concern [69,70]. The highest VIF value was 3.2690, meaning that all variables could be used in the model. However, due to problems of misspecification, some of them might not appear in the model formulation.
To execute the SFA regression models, R software, version 4.0.5 [71] was used, particularly, the sfaR package version 0.1.1 [72]. The findings thus obtained are shown in Table 7.
Table 7.
Results obtained with SFA.
The values of γ were near one and were statistically significant (1%), showing that management problems were the primary cause of the technical efficiency achieved. To compute unbiased efficiency values, we used the SFA model to eliminate the impacts of contextual variables and random errors. The regression coefficients were all significant (1%), indicating that the specified contextual factors have a considerable influence on the required adjustments computed.
According to Table 6, a rise in both the percentage of ICT experts and GDPPPPpc contributed to a larger necessary increase of “Total Eligible Spending,” but the remaining variables have a detrimental effect on this particular slack. These results demonstrated that richer regions and a larger number of ICT specialists may not always imply a better rate of execution of ERDF funds targeted at strengthening the ICTs in SMEs. In line with these results, [73] recognized the underutilization of ERDFs by Croatian SMEs’ ICTs from 2014 to 2020. The authors of the study proposed that the complexities and time necessary to apply, create, and evaluate the projects were a possible explanation for these outcomes [73]. Furthermore, [74] reported that SMEs’ investments were lower than would be predicted by typical economic models, suggesting that these enterprises are especially sensitive to financing challenges. Another explanation for these results might be that these SMEs utilize other sources of funding [68].
Regarding the need for improving the “Number of Operations Supported”, the analysis revealed that this factor tended to grow as digital skills and ICT experts increased, but tended to decrease when the proportion of SMEs with product process innovations and GDPPPPpc increased. These findings indicate once more that a large percentage of ICT skills/specialists does not inevitably lead to an efficient “Number of Operations Supported”. Contrastingly, regions with a higher GDPPPPPC and greater number of SMEs more susceptible to process innovation do not always have to apply for more ERDF-supported initiatives, since they show a higher efficiency in seeking funds.
5.3. Third Stage: Computing the Efficiencies of Every DMU with the Adjusted Inputs and Outputs through the SBM Model
As observed in Table 8, we established that the efficient OPs decreased their variability in terms of efficiency scores (the standard deviation was 0.15 compared with the previous 0.23). In addition, the efficiency scores were bounded within [1.00, 1.49], showing efficiency scores greater than 1.10 for more than 50% of the efficient OPs. Furthermore, the inefficient OPs also decreased the variability of their efficiency scores (with a standard deviation of 0.21 and more than 50% of inefficient OPs having efficiency values just under 0.41, compared with the previous 0.06) and considerably increased their efficiency (highlighting the relevance of the contextual variables).
Table 8.
The descriptive statistics of the results obtained with adjusted factors.
Approximately 27% of the OPs achieved an efficient procedural performance, compared with the preceding 20%, i.e., 10 out of 51 (see Table 3 and Table 7).
Figure 1 shows the highest difference in the technical efficiency of the OPs with and without adjusted factors.
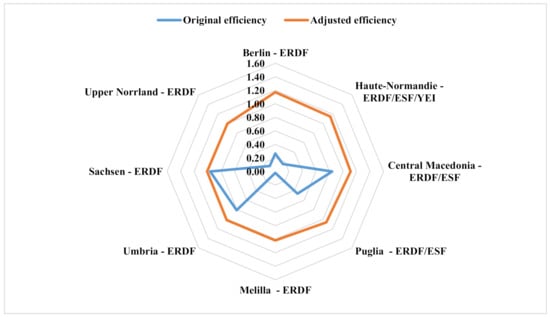
Figure 1.
OPs that increased their technical efficiency with adjusted factors. Source: Authors’ own computation.
When compared with the first phase of the analysis, “Melilla—ERDF” and “Upper Norrland—ERDF,” showed the highest improvement on efficiency, with values ranging from 0.02 to 1.02 (4493% increase) and from 0.12 to 1.00 (763% increase), respectively (Figure 1). These findings imply that the former inefficiencies of the OPs depicted in Figure 1 were not exclusively due to their low technical level but were also related to their contextual factors.
As observed in Table 9, it is possible to conclude that despite the first three ranked OPs remaining the same irrespective of the adjustment of factors, the number of times that they achieved benchmark status was different.
Table 9.
The characteristics of efficient OPs with adjusted factors.
Now, “Central Macedonia—ERDF/ESF” (25), “Berlin—ERDF” (18), “Puglia—ERDF/ESF” (10), and “Multi-regional Spain—ERDF” (9) were the top 4 OPs selected more frequently as benchmarks (see Table 8). “Multi-regional Spain—ERDF” ranked among the top four efficient OPs, serving as a reference for the best practices, irrespective of the adjustments. Moreover, two of the OPs that remained efficient regardless of the adjustments of the factors belonged to Spain. It is important to mention that the MSs in Southern (such as Italy and Spain), Central, and Eastern EU were among the leading recipients of ICTs and digital economy assistance [68]. This is particularly true for nations with efficient OPs such as Spain, Greece, Bulgaria, and the Czech Republic [68]. Over half of the firms in countries with declining efficiency related to environmental factors, such as Poland (formerly ranked 10th and now ranked 22nd) and Bulgaria (formerly ranked 7th and now ranked 10th), had relatively low levels of digitization in 2016 [68]. Additionally, other OPs from Italy and Germany mainly became efficient because of environmental factors.
Finally, the required improvement on the “Number of Operations Supported” became significantly reduced, dropping from 313% to 111% (see Table 10).
Table 10.
The improvement potential for the OPs with the adjusted factors.
5.4. Robustness Study and Sensitivity Analysis
Deterministic values are used for both inputs and outputs in conventional DEA approaches. However, the values considered to represent the input and output data are sometimes uncertain. These data might be expressed as intervals or so-called “fuzzy” numbers [75]. In this context, the Max DEA software transforms the “fuzzy” DEA model into two models to identify the lower and upper limits of the α-level associated with the membership functions of the efficiency values, thus allowing for the acquisition of the upper and lower bounds of the efficiency scores. The robustness assessment was conducted by employing data perturbations of 5% and 10%, either for the case of adjusted or non-adjusted factors, whereas the sensitivity analysis was performed by omitting a single factor of evaluation (input or output) at a time and subsequently evaluating the impacts thus obtained in the efficiency assessment [76].
5.4.1. Robustness Study
As per our results in Figure 2, just four efficient OPs remained efficient for both data perturbations without the consideration of the contextual factors: “Enterprise and Innovation for Competitiveness—CZ—ERDF”, “Provence-Alpes-Côte d’Azur—ERDF/ESF/YEI”, “Multi-regional Spain—ERDF”, and “Extremadura—ERDF”. In comparison, 19 OPs stayed potentially efficient for both data perturbations (i.e., 37% of the sample of OPs evaluated). Lastly, 28 OPs were robustly inefficient for the same data perturbations. As supported by Figure 3, we concluded that there were only three efficient OPs that remained efficient for the data disturbances of 5% and 10%, which were “Enterprise and Innovation for Competitiveness—CZ—ERDF”, “Provence-Alpes-Côte d’Azur—ERDF/ESF/YEI,” and “Multi-regional Spain—ERDF.” Without taking the adjusted factors into account, these OPs overlapped with three of the formerly most robust OPs.
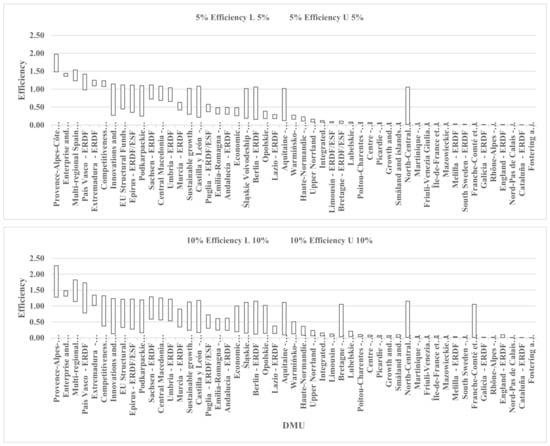
Figure 2.
Results of the robustness analysis per OP (non-adjusted factors). Source: Authors’ own computation.
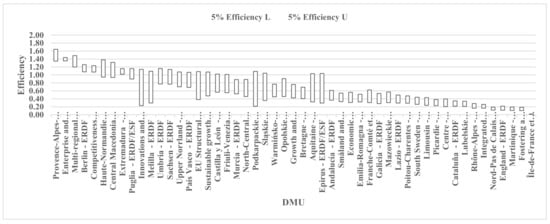
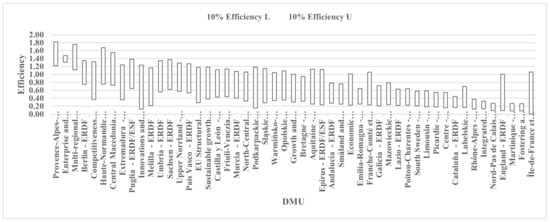
Figure 3.
Results of the robustness analysis per OP (adjusted factors). Source: Authors’ own computation.
Overall, these findings point to a poor use of ERDF money in supporting the ICT development of SMEs.
These outcomes corroborate the study by Pellegrin et al. (2018), where the EU appeared to lag behind its rivals (namely, the US, Japan, and South Korea), either in terms of ICT adoption or ICT infrastructures, particularly among SMEs.
5.4.2. Sensitivity Analysis
Figure 4 and Table 11 show the findings of the sensitivity analysis. The “Number of Operations” factor has the greatest influence on efficiency, as its omission from the analysis resulted in the highest value of |1-slope|, 0.4373, whereas the “Total Eligible Spending” factor has the lowest impact on efficiency. These results remained valid with the removal of contextual variables, that is, the factor that continued to show the greatest impact on efficiency is the “Number of Operations”.
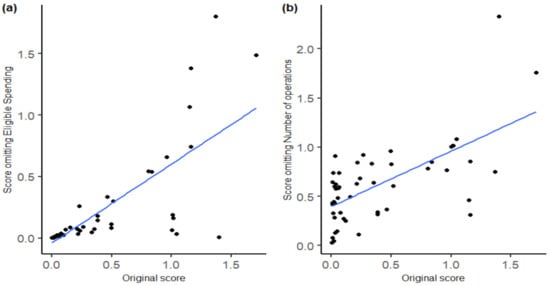
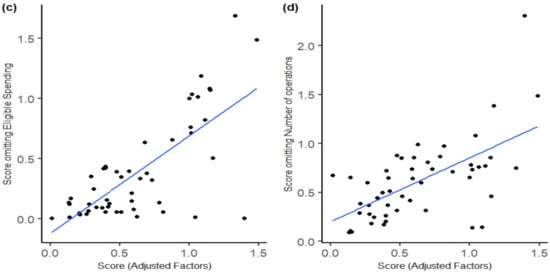
Figure 4.
The sensitivity analysis for the Total Eligible Spending (a) and Number of Operations (b) without adjustments and the sensitivity analysis for the for the Total Eligible Spending (c) and Number of Operations (d) with adjustments. The x-axis of each graph represents the original efficiency score, and the y-axis represents the recalculated efficiency by omitting one output factor at a time. The solid blue lines represent the lines of the best fit. Source: Authors’ own computation.
Table 11.
Results of the sensitivity analysis.
6. Conclusions and Further Research
The purpose of this study was to assess the procedural efficiency of the execution of 51 OPs that were linked to the support of ICTs in SMEs from 16 EU countries. We proposed a three-stage SBM modelling framework to achieve this. First, the SBM model was used to determine the efficiency scores of each OP. Relevant information was gathered regarding the changes that must be performed to mitigate the potential differences from the inefficient OPs against their benchmarks.
In contrast to the other frequently used approaches employed in similar contexts, namely in benchmark case studies, econometric and statistical approaches, and macroeconomic and microeconomic studies, the SBM model can be especially insightful for MAs, as it allows them to pinpoint the benchmarks and variations that should be applied to enhance the efficient execution of OPs. After eliminating the contextual effects and statistical noise, the second step involved applying the SFA model to the slacks of the inefficient OPs to modify the inputs and outputs. At this point, it was also possible to understand just how significantly the contextual factors may affect the efficiency of the application of ERDFs in various OPs committed to encouraging ICT usage in SMEs, and the relevance of management failures. Lastly, the formerly adjusted factors were used to generate new efficiency scores through the SBM model.
Our key findings are summarized below.
RQ1: Which factors hinder the efficient use of ERDF allotted to increase ICT usage in the EU SMEs?
Before adjusting the input and output factors, the “Number of Operations Supported” is the indicator that demands the most concern from MAs, while “Eligible Costs Decided” require a modest enhancement (i.e., a 22% reduction) and “Eligible Spending” demands a neglectable improvement (i.e., a 3% increase). Both with or without the adjusted factors (by removing the environmental effect and statistical noise), the “Number of Operations Supported” is the main factor that requires concern from MAs.
RQ2: Which OPs were widely reported as benchmarks throughout the programming period evaluated?
The OP that is most often elected as benchmark in this study, with or without the consideration of the environmental factors, is “Multi-regional Spain—ERDF,” which is ranked on the top four efficient OPs viewed as benchmarks in either adjustment situation. In this respect, it is important to note that the usage of “vouchers” in Spain (Pellegrini et al., 2018) appears to be an efficient way for contacting SMEs and offering them with assistance that is easy to manage and tailored to their needs.
RQ3: Which OPs show a more resilient performance in the face of variations in the metrics utilized?
The robustness assessment reveals that “Enterprise and Innovation for Competitiveness—CZ—ERDF”, “Provence-Alpes-Côte d’Azur—ERDF/ESF/YEI”, “Multi-regional Spain—ERDF”, and “Extremadura—ERDF” are the OPs that keep their efficiency for data variations of 5% and 10%, regardless of accounting for any adjustments of the factors. Moreover, without any adjustments, 55% of the OPs are robustly inefficient; with adjustments, 37% of the OPs are robustly inefficient. In any case, these data indicate that the management practices of these OPs were the primary cause for such results.
RQ4: Which contextual variables have the highest influence on the OPs’ inefficiency?
Our findings indicate that wealthier regions with a higher concentration of ICT professionals tend to underuse ERDF funds for boosting ICTs in SMEs. Additionally, a higher share of ICT skills/specialists corresponds to a lower “Number of Operations Supported”. Contrastingly, wealthier regions and a greater number of SMEs proposing product innovations appear to be more efficient in obtaining financial assistance. These findings may be linked to bureaucratic issues that act in compliance with EU processes, financial channels, and administrative legislation, particularly for SMEs.
RQ5: How does efficiency vary when contextual variables are introduced?
When the factors were adjusted, more than 27% of the OPs (14) attained technical efficiency compared with the prior 20% (10), highlighting the relevance of contextual variables in evaluating efficiency.
Overall, it can be concluded that SMEs’ access to ESIFs (especially ERDFs) remains limited, as they require the organizational capacity to deal with the many formalities for the application for and completion of ERDF projects. In comparison to “traditional” SME activities, this problem becomes more pressing when it comes to ICTs. In consequence, activities in a sector recognized for its fast change, such as ICTs, demand additional flexibility and skills. As a result, MAs should look for methods to provide additional assistance that streamline procedures and meet the requirements of SMEs.
Furthermore, our study emphasizes the scarcity of metrics available to measure the success of ESIF funds dedicated to ICT assistance in SMEs. Lastly, although this study provided novel insights and creative techniques for evaluating the efficiency of financing that is allocated to increasing the ICT usage in EU SMEs, future works should especially examine the economic consequences of these OPs, even though this examination continues to be a challenging endeavor.
Author Contributions
C.H.: Writing—original draft, Revision and Final revision, Methodology, Data curation, Conceptualization, Validation, Formal analysis, Investigation, Resources, Project administration. C.V.: Writing—original draft, Data curation, Statistical Analysis, Methodology, Validation and Final Revision. All authors have read and agreed to the published version of the manuscript.
Funding
This work was funded by the European Regional Development Fund within the framework of Portugal 2020: Programa Operacional Assistência Técnica (POAT 2020), under Project No. POAT-01-6177-FEDER-000044; and ADEPT, Avaliação de Políticas de Intervenção Co-financiadas em Empresas.
Institutional Review Board Statement
Not applicable.
Informed Consent Statement
Not applicable.
Acknowledgments
INESC Coimbra and CeBER are supported by funding from the Portuguese Foundation for Science and Technology through Project No. UID/MULTI/00308/2020 and UIDB/05037/2020, respectively.
Conflicts of Interest
The authors declare no conflict of interest.
References
- Kostis, A.; Ritala, P. Digital Artifacts in Industrial Co-creation: How to Use VR Technology to Bridge the Provider-Customer Boundary. Calif. Manag. Rev. 2020, 62, 125–147. [Google Scholar] [CrossRef]
- Ranta, V.; Aarikka-Stenroos, L.; Väisänen, J.-M. Digital technologies catalyzing business model innovation for circular economy—Multiple case study. Resour. Conserv. Recycl. 2020, 164, 105155. [Google Scholar] [CrossRef]
- Eaton, J.; Jinkins, D.; Tybout, J.R.; Xu, D. Two-Sided Search in International Markets (No. w29684). National Bureau of Economic Research. 2022. Available online: https://www.nber.org/system/files/working_papers/w29684/w29684.pdf (accessed on 11 April 2022).
- Chen, Y.-Y.K.; Jaw, Y.-L.; Wu, B.-L. Effect of digital transformation on organisational performance of SMEs: Evidence from the Taiwanese textile industry’s web portal. Internet Res. 2016, 26, 186–212. [Google Scholar] [CrossRef]
- Yunis, M.; El-Kassar, A.-N.; Tarhini, A. Impact of ICT-based innovations on organizational performance: The role of corporate entrepreneurship. J. Enterp. Inf. Manag. 2017, 30, 122–141. [Google Scholar] [CrossRef]
- Chege, S.M.; Wang, D.; Suntu, S.L. Impact of information technology innovation on firm performance in Kenya. Inf. Technol. Dev. 2019, 26, 316–345. [Google Scholar] [CrossRef]
- Neirotti, P.; Raguseo, E.; Paolucci, E. How SMEs develop ICT-based capabilities in response to their environment: Past evidence and implications for the uptake of the new ICT paradigm. J. Enterp. Inf. Manag. 2018, 31, 10–37. [Google Scholar] [CrossRef]
- Cenamor, J.; Parida, V.; Wincent, J. How entrepreneurial SMEs compete through digital platforms: The roles of digital platform capability, network capability and ambidexterity. J. Bus. Res. 2019, 100, 196–206. [Google Scholar] [CrossRef]
- Price, L.; Shutt, J.; Sellick, J. Supporting rural Small and Medium-sized Enterprises to take up broadband-enabled technology: What works? Local Econ. J. Local Econ. Policy Unit 2018, 33, 515–536. [Google Scholar] [CrossRef]
- Vargas, H.C.; Estrada, S.; Larios-Gómez, E. The Effects of ICTs As Innovation Facilitators for a Greater Business Performance. Evidence from Mexico. Procedia Comput. Sci. 2016, 91, 47–56. [Google Scholar] [CrossRef] [Green Version]
- Leviäkangas, P.; Paik, S.M.; Moon, S. Keeping up with the pace of digitization: The case of the Australian construction industry. Technol. Soc. 2017, 50, 33–43. [Google Scholar] [CrossRef]
- Taştan, H.; Gönel, F. ICT labor, software usage, and productivity: Firm-level evidence from Turkey. J. Prod. Anal. 2020, 53, 265–285. [Google Scholar] [CrossRef]
- Skare, M.; Soriano, D.R. How globalization is changing digital technology adoption: An international perspective. J. Innov. Knowl. 2021, 6, 222–233. [Google Scholar] [CrossRef]
- Guo, H.; Yang, Z.; Huang, R.; Guo, A. The digitalization and public crisis responses of small and medium enterprises: Implications from a COVID-19 survey. Front. Bus. Res. China 2020, 14, 1–25. [Google Scholar] [CrossRef]
- Akpan, I.J.; Udoh, E.A.P.; Adebisi, B. Small business awareness and adoption of state-of-the-art technologies in emerging and developing markets, and lessons from the COVID-19 pandemic. J. Small Bus. Entrep. 2020, 34, 123–140. [Google Scholar] [CrossRef]
- Akter, S.; Michael, K.; Uddin, M.R.; McCarthy, G.; Rahman, M. Transforming business using digital innovations: The application of AI, blockchain, cloud and data analytics. Ann. Oper. Res. 2020, 308, 7–39. [Google Scholar] [CrossRef]
- Haaker, T.; Ly, P.T.M.; Nguyen-Thanh, N.; Nguyen, H.T.H. Business model innovation through the application of the Internet-of-Things: A comparative analysis. J. Bus. Res. 2021, 126, 126–136. [Google Scholar] [CrossRef]
- Martin, C.; Leurent, H. Technology and Innovation for the Future of Production: Accelerating Value Creation. Geneva Switzerland. World Economic Forum. 2017. Available online: http://www3.weforum.org/docs/WEF_White_Paper_Technology_Innovation_Future_of_Production_2017.pdf (accessed on 30 May 2022).
- Vial, G. Understanding digital transformation: A review and a research agenda. J. Strateg. Inf. Syst. 2019, 28, 118–144. [Google Scholar] [CrossRef]
- Oberländer, M.; Beinicke, A.; Bipp, T. Digital competencies: A review of the literature and applications in the workplace. Comput. Educ. 2019, 146, 103752. [Google Scholar] [CrossRef]
- Consoli, D. Literature Analysis on Determinant Factors and the Impact of ICT in SMEs. Procedia Soc. Behav. Sci. 2012, 62, 93–97. [Google Scholar] [CrossRef] [Green Version]
- Lehner, F.; Sundby, M.W. ICT Skills and Competencies for SMEs: Results from a Structured Literature Analysis on the Individual Level. In The Impact of Digitalization in the Workplace. Professional and Practice-Based Learning; Harteis, C., Ed.; Springer: Cham, Switzerland, 2018; Volume 21. [Google Scholar] [CrossRef]
- Horváth, D.; Szabó, R.Z. Driving forces and barriers of Industry 4.0: Do multinational and small and medium-sized companies have equal opportunities? Technol. Forecast. Soc. Chang. 2019, 146, 119–132. [Google Scholar] [CrossRef]
- Li, L.; Su, F.; Zhang, W.; Mao, J.-Y. Digital transformation by SME entrepreneurs: A capability perspective. Inf. Syst. J. 2017, 28, 1129–1157. [Google Scholar] [CrossRef]
- Ulas, D. Digital Transformation Process and SMEs. Procedia Comput. Sci. 2019, 158, 662–671. [Google Scholar] [CrossRef]
- Reis, J.; Amorim, M.; Melão, N.; Matos, P. Digital transformation: A literature review and guidelines for future research. In World Conference on Information Systems and Technologies; Springer: Cham, Switzerland, 2018; pp. 411–421. [Google Scholar] [CrossRef]
- Taylor, P. The importance of information and communication technologies (ICTs): An integration of the extant literature on ICT adoption in small and medium enterprises. Int. J. Econ. Commer. Manag. 2015, 3, 274–295. [Google Scholar]
- Rogers, E.M.; Singhal, A.; Quinlan, M.M. Diffusion of innovations. In An integrated Approach to Communication Theory and Research; Routledge: London, UK, 2014; pp. 432–448. [Google Scholar]
- Tornatzky, L.G.; Fleischer, M.; Chakrabarti, A.K. Processes of Technological Innovation; Lexington Books: Washington, DC, USA, 1990. [Google Scholar]
- Mbuyisa, B.; Leonard, A. The Role of ICT Use in SMEs Towards Poverty Reduction: A Systematic Literature Review. J. Int. Dev. 2016, 29, 159–197. [Google Scholar] [CrossRef]
- Bach, M.P.; Zoroja, J.; Vukšić, V.B. Determinants of Firms’ Digital Divide: A Review of Recent Research. Procedia Technol. 2013, 9, 120–128. [Google Scholar] [CrossRef] [Green Version]
- Tarutė, A.; Gatautis, R. ICT Impact on SMEs Performance. Procedia Soc. Behav. Sci. 2014, 110, 1218–1225. [Google Scholar] [CrossRef] [Green Version]
- Isensee, C.; Teuteberg, F.; Griese, K.-M.; Topi, C. The relationship between organizational culture, sustainability, and digitalization in SMEs: A systematic review. J. Clean. Prod. 2020, 275, 122944. [Google Scholar] [CrossRef]
- Ramdani, B.; Raja, S.; Kayumova, M. Digital innovation in SMEs: A systematic review, synthesis and research agenda. Inf. Technol. Dev. 2021, 28, 56–80. [Google Scholar] [CrossRef]
- Thrassou, A.; Uzunboylu, N.; Vrontis, D.; Christofi, M. Digitalization of SMEs: A Review of Opportunities and Challenges. In The Changing Role of SMEs in Global Business; Thrassou, A., Vrontis, D., Weber, Y., Shams, S.M.R., Tsoukatos, E., Eds.; Palgrave Studies in Cross-disciplinary Business Research; In Association with EuroMed Academy of Business; Palgrave Macmillan: Cham, Switzerland, 2020. [Google Scholar] [CrossRef]
- Reggi, L.; Gil-Garcia, J.R. Addressing territorial digital divides through ICT strategies: Are investment decisions consistent with local needs? Gov. Inf. Q. 2020, 38, 101562. [Google Scholar] [CrossRef]
- Reggi, L.; Scicchitano, S. Are EU regional digital strategies evidence-based? An analysis of the allocation of 2007–13 Structural Funds. Telecommun. Policy 2014, 38, 530–538. [Google Scholar] [CrossRef]
- Kleibrink, A.; Niehaves, B.; Palop, P.; Sörvik, J.; Thapa, B.E.P. Regional ICT Innovation in the European Union: Prioritization and Performance (2008–2012). J. Knowl. Econ. 2015, 6, 320–333. [Google Scholar] [CrossRef] [Green Version]
- Harzing, A.W. Publish or Perish. 2007; Available online: https://harzing.com/resources/publish-or-perish (accessed on 11 August 2022).
- Santinha, G.; Soares, A. SMEs and ICT adoption: A new challenge to Regional Policies. In Proceedings of the European Regional Science Association Congress, Porto, Portugal, 25–29 August 2004; Available online: https://www.researchgate.net/profile/Goncalo-Santinha/publication/23731269_SMEs_and_ICTs_adoption_a_new_challenge_to_Regional_Policies/links/5a719e48aca272e425ede101/SMEs-and-ICTs-adoption-a-new-challenge-to-Regional-Policies.pdf (accessed on 23 August 2022).
- Dong, H.; Meng, T. The European Union Supports the Digital Transformation Development of SMEs Policy Propositions and Enlightenment. Int. Core J. Eng. 2021, 7, 338–344. [Google Scholar] [CrossRef]
- Cuadrado-Roura, J.R.; Garcia-Tabuenca, A. ICT policies for SMEs and regional disparities. The Spanish case. Entrep. Reg. Dev. 2004, 16, 55–75. [Google Scholar] [CrossRef]
- Calle, S.; Martínez, J.; Barroso, Z. Spanish Public Policies towards the Promotion of Cloud Computing and Digital Services for SMEs. In Proceedings of the 27th European Regional Conference of the International Telecommunications Society (ITS): The Evolution of the North-South Telecommunications Divide: The Role for Europe, Cambridge, UK, 7–9 September 2016; International Telecommunications Society (ITS): Calgary, AB, Canada, 2016. Available online: https://www.econstor.eu/bitstream/10419/148703/1/Serrano-et-al.pdf (accessed on 8 August 2022).
- Skoko, H.; Krivokapic-Skoko, B.; Skare, M.; Ceric, A. ICT Adoption Policy of Australian and Croatian smes. Manag. Glob. Transit. 2006, 4, 25. Available online: https://www.fm-kp.si/zalozba/ISSN/1581-6311/4-1.pdf#page=27 (accessed on 11 August 2022).
- Plomp, M.G.; Batenburg, R.S.; Hertog, P.D. Does ICT Policy Improve Interorganisational ICT for SMEs? A Dutch Policy Evaluation Study. BLED 2011 Proceedings. 33. 2011. Available online: https://aisel.aisnet.org/bled2011/33 (accessed on 10 August 2022).
- Plomp, M.G.; Batenburg, R.S.; Hertog, P.D. ICT policy to foster interorganisational ICT adoption by SMEs: The Netherlands Goes Digital case. In Information Systems for Small and Medium-Sized Enterprises; Springer: Berlin/Heidelberg, Germany, 2014; pp. 123–139. [Google Scholar] [CrossRef]
- Henderson, D. Demand-side broadband policy in the context of digital transformation: An examination of SME digital advisory policies in Wales. Telecommun. Policy 2020, 44, 102024. [Google Scholar] [CrossRef] [PubMed]
- Galloway, L.; Mochrie, R. The use of ICT in rural firms: A policy-orientated literature review. info 2005, 7, 33–46. [Google Scholar] [CrossRef]
- Colombo, M.G.; Grilli, L. Technology policy for the knowledge economy: Public support to young ICT service firms. Telecommun. Policy 2007, 31, 573–591. [Google Scholar] [CrossRef]
- Dionysopoulou, P.; Tsakopoulou, K. Policy Responses to Critical Issues for the Digital Transformation of Tourism SMEs: Evidence from Greece. In Culture and Tourism in a Smart, Globalized, and Sustainable World; Springer: Cham, Switzerland, 2021; pp. 499–510. [Google Scholar] [CrossRef]
- Kalpaka, A.; Sörvik, J.; Tasigiorgou, A.; Rissola, G. Digital Innovation Hubs as Policy Instruments to Boost Digitalisation of SMEs; JRS Science for Policy Report JRC121604; European Commission: Brussels, Belgium, 2020; Available online: https://www.ffg.at/sites/default/files/downloads/dih-handbook.pdf (accessed on 9 August 2022).
- Kergroach, S. SMEs Going Digital: Policy Challenges and Recommendations, Going Digital Toolkit Notes, No. 15; OECD Publishing: Paris, France, 2021. [Google Scholar] [CrossRef]
- Charnes, A.; Cooper, W.; Rhodes, E. Measuring the efficiency of decision-making units. Eur. J. Oper. Res. 1979, 3, 339. [Google Scholar] [CrossRef]
- Banker, R.D.; Charnes, A.; Cooper, W.W. Some Models for Estimating Technical and Scale Inefficiencies in Data Envelopment Analysis. Manag. Sci. 1984, 30, 1078–1092. [Google Scholar] [CrossRef] [Green Version]
- Tone, K. A slacks-based measure of efficiency in data envelopment analysis. Eur. J. Oper. Res. 2001, 130, 498–509. [Google Scholar] [CrossRef] [Green Version]
- Fried, H.O.; Lovell, C.A.K.; Schmidt, S.S.; Yaisawarng, S. Accounting for Environmental Effects and Statistical Noise in Data Envelopment Analysis. J. Prod. Anal. 2002, 17, 157–174. [Google Scholar] [CrossRef]
- Aigner, D.; Lovell, C.A.K.; Schmidt, P. Formulation and estimation of stochastic frontier production function models. J. Econom. 1977, 6, 21–37. [Google Scholar] [CrossRef]
- Meeusen, W.; van den Broeck, J. Efficiency Estimation from Cobb-Douglas Production Functions with Composed Error. Int. Econ. Rev. 1977, 18, 435–444. [Google Scholar] [CrossRef]
- Tone, K. A slacks-based measure of super-efficiency in data envelopment analysis. Eur. J. Oper. Res. 2002, 143, 32–41. [Google Scholar] [CrossRef] [Green Version]
- Jondrow, J.; Lovell, C.A.K.; Materov, I.S.; Schmidt, P. On the estimation of technical inefficiency in the stochastic frontier production function model. J. Econom. 1982, 19, 233–238. [Google Scholar] [CrossRef] [Green Version]
- Avkiran, N.K.; Rowlands, T. How to better identify the true managerial performance: State of the art using DEA. Omega 2008, 36, 317–324. [Google Scholar] [CrossRef] [Green Version]
- Billon, M.; Lera-Lopez, F.; Marco, R. ICT use by households and firms in the EU: Links and determinants from a multivariate perspective. Rev. World Econ. 2016, 152, 629–654. [Google Scholar] [CrossRef]
- Billon, M.; Marco, R.; Lera-Lopez, F. Innovation and ICT use by firms and households in the EU: A multivariate analysis of regional disparities. Inf. Technol. People 2017, 30, 424–448. [Google Scholar] [CrossRef]
- Hollanders, H. Regional Innovation Scoreboard 2021; European Commission: Brussels, Belgium, 2021. [Google Scholar] [CrossRef]
- Neokosmidis, I.; Avaritsiotis, N.; Ventoura, Z.; Varoutas, D. Assessment of the gap and (non-)Internet users evolution based on population biology dynamics. Telecommun. Policy 2015, 39, 14–37. [Google Scholar] [CrossRef]
- Giotopoulos, I.; Kontolaimou, A.; Korra, E.; Tsakanikas, A. What drives ICT adoption by SMEs? Evidence from a large-scale survey in Greece. J. Bus. Res. 2017, 81, 60–69. [Google Scholar] [CrossRef]
- Ruiz-Rodríguez, F.; Lucendo-Monedero, A.L.; González-Relaño, R. Measurement and characterisation of the Digital Divide of Spanish regions at enterprise level. A comparative analysis with the European context. Telecommun. Policy 2018, 42, 187–211. [Google Scholar] [CrossRef]
- Pellegrin, J.; Colnot, L.; Arendt, Ł.; Bisaschi, L.; Catalano, G.; Martinaitis, Ž.; Micheletti, G. Research for REGI Committee-Digital Agenda and Cohesion Policy. European Parliament. 2018. Available online: https://www.europarl.europa.eu/RegData/etudes/STUD/2018/617485/IPOL_STU(2018)617485_EN.pdf (accessed on 30 May 2022).
- Belsley, D.A. Conditioning Diagnostics: Collinearity and Weak Data in Regression; John Wiley & Sons, Inc.: New York, NY, USA, 1991. [Google Scholar]
- James, G.; Witten, D.; Hastie, T.; Tibshirani, R. An Introduction to Statistical Learning; Springer: New York, NY, USA, 2013; Volume 112, p. 18. [Google Scholar]
- R Core Team. R: A Language and Environment for Statistical Computing; R Foundation for Statistical Computing: Vienna, Austria, 2021; Available online: https://www.R-project.org (accessed on 6 June 2022).
- Dakpo, K.H.; Desjeux, Y.; Latruffe, L. sfaR: Stochastic Frontier Analysis Using R. R Package Version 0.1.1. 2022. Available online: https://cran.r-project.org/web/packages/sfaR/sfaR.pdf (accessed on 6 June 2022).
- Bukvić, I.B.; Babić, I.Ɖ.; Starčević, D.P. Study on the Utilization of National and EU Funds in Financing Capital Investments of ICT Companies. In Proceedings of the 2021 44th International Convention on Information, Communication and Electronic Technology (MIPRO), Opatija, Croatia, 24–28 May 2021; 2021; pp. 1282–1287. [Google Scholar] [CrossRef]
- Martinez-Cillero, M.; Lawless, M.; O’Toole, C.; Slaymaker, R. Financial frictions and the SME investment gap: New survey evidence for Ireland. Ventur. Cap. 2020, 22, 239–259. [Google Scholar] [CrossRef]
- Hatami-Marbini, A.; Emrouznejad, A.; Tavana, M. A taxonomy and review of the fuzzy data envelopment analysis literature: Two decades in the making. Eur. J. Oper. Res. 2011, 214, 457–472. [Google Scholar] [CrossRef]
- Hughes, A.; Yaisawarng, S. Sensitivity and dimensionality tests of DEA efficiency scores. Eur. J. Oper. Res. 2004, 154, 410–422. [Google Scholar] [CrossRef]
Publisher’s Note: MDPI stays neutral with regard to jurisdictional claims in published maps and institutional affiliations. |
© 2022 by the authors. Licensee MDPI, Basel, Switzerland. This article is an open access article distributed under the terms and conditions of the Creative Commons Attribution (CC BY) license (https://creativecommons.org/licenses/by/4.0/).