1. Introduction
The steady growth in demand for transport, especially road transport, raises serious concerns about the long-term sustainability of current mobility trends [
1,
2]. In recent decades, the flow of cargo in the EU has been actively growing. Since 1995, freights transported across the EU (27 countries) increased by 40% in all modes of transport. In 2019, more than half of the total amount of freights transported was by road. For land transport, the share of road transport in 2019 accounted for over 73% [
3]. Indeed, in addition to its many benefits, road freight transport has negative transport consequences, such as environmental pollution, climate change, noise, congestion and accidents, which pose problems for the economic and health well-being of European citizens. Statistics data show that the greenhouse gas emissions from transport continue to worsen. EU-wide greenhouse gas emissions from transport between 1995 and 2019 increased by 24%. In 2019 transport accounted for virtually 31% of total EU energy consumption. At the same time, in terms of the ratio of modes of transport, the absolute leader in terms of energy consumption was road transport (93%) [
3,
4]. It is clear that the current situation requires solving environmental issues raised by road freight transport and increasing the role of other modes of transport.
The European Green Deal is a new growth strategy to transform the EU into a fair and prosperous society with a modern, resource-efficient and competitive economy [
5,
6,
7]. There are no net greenhouse gas emissions and economic growth linked to resource use. In terms of emissions for climate neutrality, by 2050, transport emissions need to be reduced by 90%. This ambitious EU challenge cannot be achieved without the involvement of all modes of transport in order to reduce emissions. As a matter of priority, a large proportion of the 75% of inland freight transported today should be diverted to rail and inland waterways. Inland waterway transport is one of the undervalued players in the Europe transport network. It has great potential to contribute to the EU’s climate goals, but it often does not receive the attention it deserves [
7,
8,
9,
10,
11]. The growing demand for a new “green economy” opens up new opportunities for more active development of inland waterway transport.
The degree of involvement of inland waterways in cargo transportation differs markedly in different European countries [
11,
12,
13,
14], and the density of waterways is not always the determining factor in this matter. The development of water transport infrastructure and the maintenance of guaranteed depths of the fairway often plays a large role. The uneven development of water transport infrastructure is a serious problem for the EU. The most noticeable differences are observed in the East and West of the region. Historically, there are states in the eastern part of the EU that joined the EU later than others. These countries have a lower level of economic development, which has had a negative impact on the level of the water transport industry. Insufficient technical equipment, often unfit for modern ways of transportation (for example, intermodal), and the presence of “bottlenecks” distinguish waterways of the eastern part of the EU. The European green deal and EU goal to become a climate-neutral economy by 2050 to ensure sustainable development EU can become an impetus for the development of inland waterway transport in the region and attract investment in this type of transport [
15,
16,
17,
18].
Due to its geographical location (located in the center of the Baltic Sea region between the markets of Western and Eastern Europe), Lithuania was positioned as a strategically important country in the European transport system since regaining independence. One of the nine main Trans-European Transport Network (TEN-T) corridors crosses the territory of Lithuania—the Nordic–Baltic Sea Transport Corridor, which connects the seaports of the Netherlands and Belgium, Germany, Poland, Lithuania, Latvia and Estonia. Lithuania is on the axis of transport flows and can serve large markets—the Baltic Sea region, Eastern Europe and the Commonwealth of Independent States (CIS) and Western Europe. The importance of the sector is also reflected in Lithuania’s macroeconomic indicators [
19]. In 2019 the transport sector accounted for 13% of Gross domestic product (GDP) and was one of the most important sectors in the country. The potential of the inland waterway sector in Lithuania is extremely underused. Moreover, the dense Lithuanian hydrographic network provides wide opportunities for the development of inland waterway transport in the country [
20].
The targeted strengthening of inland waterway transport in Europe is a key element of a forward-looking transport policy for sustainable development. Safety, low emissions, cost efficiency and throughput compared to road transport [
11,
21,
22,
23] are important arguments encouraging greater attention to be paid to the use of inland waterway transport in cargo transportation.
The growing need to solve environmental pollution problems and identify the advantages of inland waterway transport inspired the authors of the article to analyze in more detail the benefits of inland waterway transport development in ensuring sustainability and performing calculations proving this in the case of Lithuania.
The aim of this article was to justify the benefit of the development of inland waterway transport; prove the reduction in external costs; and model the types of fuel, energy and size of ships in the case of Lithuania.
2. Literature Review
The topic of the benefits and development of inland waterway transport compared to road transport, thus achieving sustainability, is discussed a lot in the scientific literature [
1,
2,
7,
8,
11,
12,
13,
14,
16,
17,
18,
24,
25]. Erceg [
11], Leijer et al. [
12], Caris et al. [
18], Solomon et al. [
21] and others analyzed the advantages and disadvantages of inland waterway transport and stated that economy, efficiency, reliability, safety and environmental friendliness are the most important advantages. The authors’ identified disadvantages were geographical limitations; inadequate infrastructure; relatively slow speed; the inadequacy of the modern “door-to-door” transportation conditions; less flexibility in comparison to road, rail and maritime transport; and inadequate legal regulation.
Mircetic et al. [
24] introduced the barriers that limit and prevent the development of inland waterway transport and classified them into four main categories: goods, logistics, infrastructure and framework conditions (political/legal, environment, economy, technology). The authors’ research in the case of the Republic of Serbia revealed that the political/legal barriers are the most significant negative influence on the further development of inland waterway transport in Serbia.
Cavalcante de Barros et al. [
26], Havinga [
27], Vega-Muñoz et al. [
28] and others presented a definition of sustainable inland waterway transport and ways for future research to achieve higher levels of sustainability. The authors reviewed recent research on the conceptual definition of sustainable inland waterway transport. According to the results of the case study, there was an increased scientific interest in environmentally friendly methods, but social issues remain underestimated.
Fan Bu and Heather Nachtmann [
16] also pointed out that inland waterway transport is of increasing interest as a reliable and low-cost alternative mode to road transport. This is facilitated by the growth of the Container on the Barge market.
An important contribution to promoting the use of inland waterway transport and demonstrating its benefits was made by Mako et al. [
7]. The authors presented Mathematical Model for Estimating CO
2 Emissions in Transport, based on the results of the Danube waterway, which proved that the transportation of the amount of cargo expressed in the presented model by inland waterway transport could cause significant reductions in CO
2 emissions by more than 920 tons of CO
2 per kilometer (in comparison with road transport). The conclusion of this study is that model could be implemented all around the world because it proposes a cheap and efficient way of CO
2 reduction that is applicable in poor and rich countries. The main point of this article was to show the available capacity of the Danube, according to the model, and thereby prove that inland waterway transport is a sustainable and environmentally friendly means of transport.
For their part, Ilchenko et al. [
15] emphasized that the development of waterway transport can ensure the movement of rational patterns of consumption and production, the preservation of ecosystems and a decrease in energy consumption.
The cost-effectiveness of inland waterway transport is often cited by researchers [
28,
29,
30] as a key factor in shifting freight from road transport to inland waterways. Negative impacts of transport are in general associated with costs. These costs are usually denoted as “external costs”.
External costs or externalities arise when the social or economic activities of one person (or group of people) affect another person (or group of people) and when these effects are not fully taken into account and are not compensated for by the first person (group of people) [
31]. Therefore, external transport costs are generally not borne by transport users and are therefore not taken into account in transport decisions. At the same time, external costs affect the social well-being of society.
External transport costs refer to the difference between social costs (i.e., all costs to the society for the provision and use of transport infrastructure) and private transport costs (i.e., costs directly borne by the transport user) [
31].
Hofbauer et al. [
8] performed a comprehensive literature review and state-of-the-art analysis of external cost categories and calculation methods for inland waterway transport. The authors found that usually, the number of studies on the external costs of inland waterway transport is significantly lower than for rail and road transport; therefore, the database of inland waterway transport is not as detailed as the database for rail and road transport.
The main external costs of transport include accidents, air pollution, climate change, noise, habitat damage, and congestion. The external cost explanation is presented in
Table 1.
As no market prices have been set for external costs, alternative valuation techniques need to be used to estimate external costs.
In 2008 the European Commission published the first guidelines on the external costs of transport in the IMPACT study. In 2014, the guide was updated to reflect new developments in research and policy. The methodology for calculating external transport costs was developed in the study “Sustainable Transport Infrastructure. Accumulation and internalization of transport externalities”, commissioned by the European Commission’s DG MOVE, a consortium led by CE Delft.
Our review of available studies dealing with external costs for various modes of transport showed that even in recent studies, such as the Handbook on External Costs of Transport published by the European Commission in 2019 (taken as the basis for this article), there are no data for alternative fuels in inland waterway transport. At the same time, the Handbook on External Costs of Transport published by the European Commission in 2019 includes information on rail transport using both electricity and diesel fuel. The significant differences in external costs with a change in fuel type highlight the importance of this information.
3. Methods
In order to justify the benefit of the development of inland waterway transport in the case of Lithuania for ensuring sustainability, an assessment of external costs was carried out, comparing heavy goods vehicles and inland waterway transport. In this study, the modeling of the shipping route of Neman River from Kaunas to Klaipeda and the environmental impact was carried out, assuming that all necessary works to improve the waterway transport infrastructure were completed, and ideal conditions for navigation along this route were created. As a result, it becomes possible to connect Klaipeda sea port and Kaunas river port with a regular cargo route.
Calculating external costs was focused on the data provided in the Handbook on External Costs of Transport published by the European Commission in 2019. However, due to the fact that freight transportation by inland waterway transport in Lithuania is currently practically absent, there are no data on the average external costs of inland waterway transport in the Republic of Lithuania. However, having EU data and assuming that the use of water transport in Lithuania will reach the European average in the future, we applied these data to Lithuanian inland waterway transport. For example, in the case of accidents across the EU, we can estimate that the average external cost of inland waterway transport is 7.69% of the average for trucks. Assuming that in the future, the internal costs of inland waterways will be the same percentage as for trucks, we obtained 0.031 EUR–cent per tkm for Lithuania. Thus, data for each of the external cost categories in question were calculated.
Moreover, in this article, more detailed calculations of the external costs of air pollution and climate change are carried out for the section Kaunas–Klaipeda on the Neman River (300 km), simulating the transfer of part of the cargo from the busy highway A1 Kaunas–Klaipeda to Neman River (inland waterway of international importance E41). The Neman (the most promising waterway in Lithuania in terms of navigation) belongs to the TEN-T network (E41) and goes along two cities in Lithuania: Kaunas, which is the second largest city in Lithuania and is geographically located almost in the center of Lithuania, and Klaipeda, which is the third largest Lithuanian city with one of the biggest ports in the Baltic region. Therefore, the active use of inland waterway transport would be very beneficial. In 2020, the Lithuanian Ministry of Transport and Communication approved EU-provided funding for the construction in the Neman of new groins and the renewal of older groins in order to stabilize the depth of the river along the riverway from Klaipeda to Kaunas. After the completion of these works, uninterrupted cargo transportation along the river will become possible.
For modeling, three options were considered for the possible volumes of cargo transportation by inland waterway transport along this route: optimistic, realistic and pessimistic (
Table 2). The optimistic variant was chosen for about 10% of all transported cargo in Lithuania (100,802 thousand tons of cargo were transported in the Republic of Lithuania in 2019). These model shift scenarios were used in accordance with the forecasts of possible future volumes of cargo transportation, which we received from the Lithuanian Inland Waterways Authority [
32].
For modeling, it was assumed the transportation of cargo by barges with a carrying capacity of 1000 and 1800 tons. The cases were simulated when transporting cargo with the currently available pusher ship and 1000 t barge and planned purchase pusher ship and 1800 t barge, as well as evaluating different types of energy: diesel fuel, liquefied natural gas or electricity.
Energy consumption and greenhouse gas emissions were calculated in accordance with the EN 16258 standard “Methodology for calculation and declaration of energy consumption and greenhouse gas emissions of transport services” [
33]. This standard requires the energy consumption of the transport service to be shown together with the amount of greenhouse gas emissions in comparable energy units—MJ. Therefore, all energy consumption is converted into standard energy units—MJ.
where E is the energy consumption in MJ;
F—measured fuel or energy consumption (e.g., L, kg or kWh);
eT—coefficient of conversion of energy into MJ (
Table 3).
For simulated cases where fuel consumption data are not available, they were calculated as follows:
where b
e—brake specific fuel consumption g/kWh;
Pe is the effective power of the engine in kW;
K—load factor;
T—working (sailing time) time h.
Greenhouse gas emissions were calculated by multiplying energy consumption by specific coefficients (
Table 3).
The climate change costs calculations were made based on the cost factor of EUR 100 per t CO
2 equivalent, the central value for short and medium-run estimations [
31].
When assessing the emission of harmful pollutants, the limit values specified in the regulatory documents [
34] were used. The coefficients expressed in g/kWh (
Table 4) were used to calculate NOx, CO, CH and PM (Particulate Matter) emissions.
Environmental pollution costs were calculated using the following values: 0.6 EUR/kg CO and HC emissions, 7.1 EUR/kg NOx emissions and 38 EUR/kg PM [
31].
In the simulation of the situation where an electric-powered ship was used, it was assumed that only green electricity (solar and wind) would be used.
4. Results
4.1. Comparison of Average External Costs for Road and Inland Waterway Transport for Cargo Transportation
A comparison of the external costs of trucks and inland waterway transport shows that the total external costs of freight transport by water are lower and save 0.671 EUR–cents/tkm. By analyzing each category of external costs, we observed that the greatest effects are due to very low noise levels, safety (low number of accidents) and air pollution (see
Table 5).
At first glance, the costs of habitat damage appear to be the same for both trucks and inland waterway transport. It should be noted, however, that in the study, we did not compare waterborne transport with road transport in general, but only with vehicles, which account for only a small proportion, as motorways are also used by other types of cars, which make up the majority of road transport. For example, according to data from the Lithuanian Road Administration in 2020, trucks account for only 18% of total motor traffic on motorways. Considering cars with a capacity of up to 3.5 tonnes, then the damage to their habitats would be 1.35 EUR–cent per tkm, which is more than six times higher than for inland waterways.
The reason for the higher air pollution compared to freight transport shown in
Table 5 is that the compared truck fleet is renewed faster and meets more strict emission requirements, the fleet life is generally much longer, and pollution from older ships leads to a negative balance. Renewal of the fleet is planned for the Kaunas–Klaipeda route; therefore, the result of this cost category would be different, and it is analyzed in detail in the next subsection.
4.2. Comparison of Average External Costs for Road and Inland Waterway Transport for Cargo on the Kaunas–Klaipeda Route
By using the data and modeling different variants of freight transport by inland waterways on the route Kaunas–Klaipeda, the results of the calculation of the reduction in external costs are presented in
Table 6.
By taking into account the calculations presented in
Table 6, it was found that when moving cargo transportation from the highway to inland waterways, external cost savings are observed in most of the external cost categories, despite the fact that the highway distance is shorter compared to the inland waterway section (the distance by road is 221 km, and by the river almost 300 km).
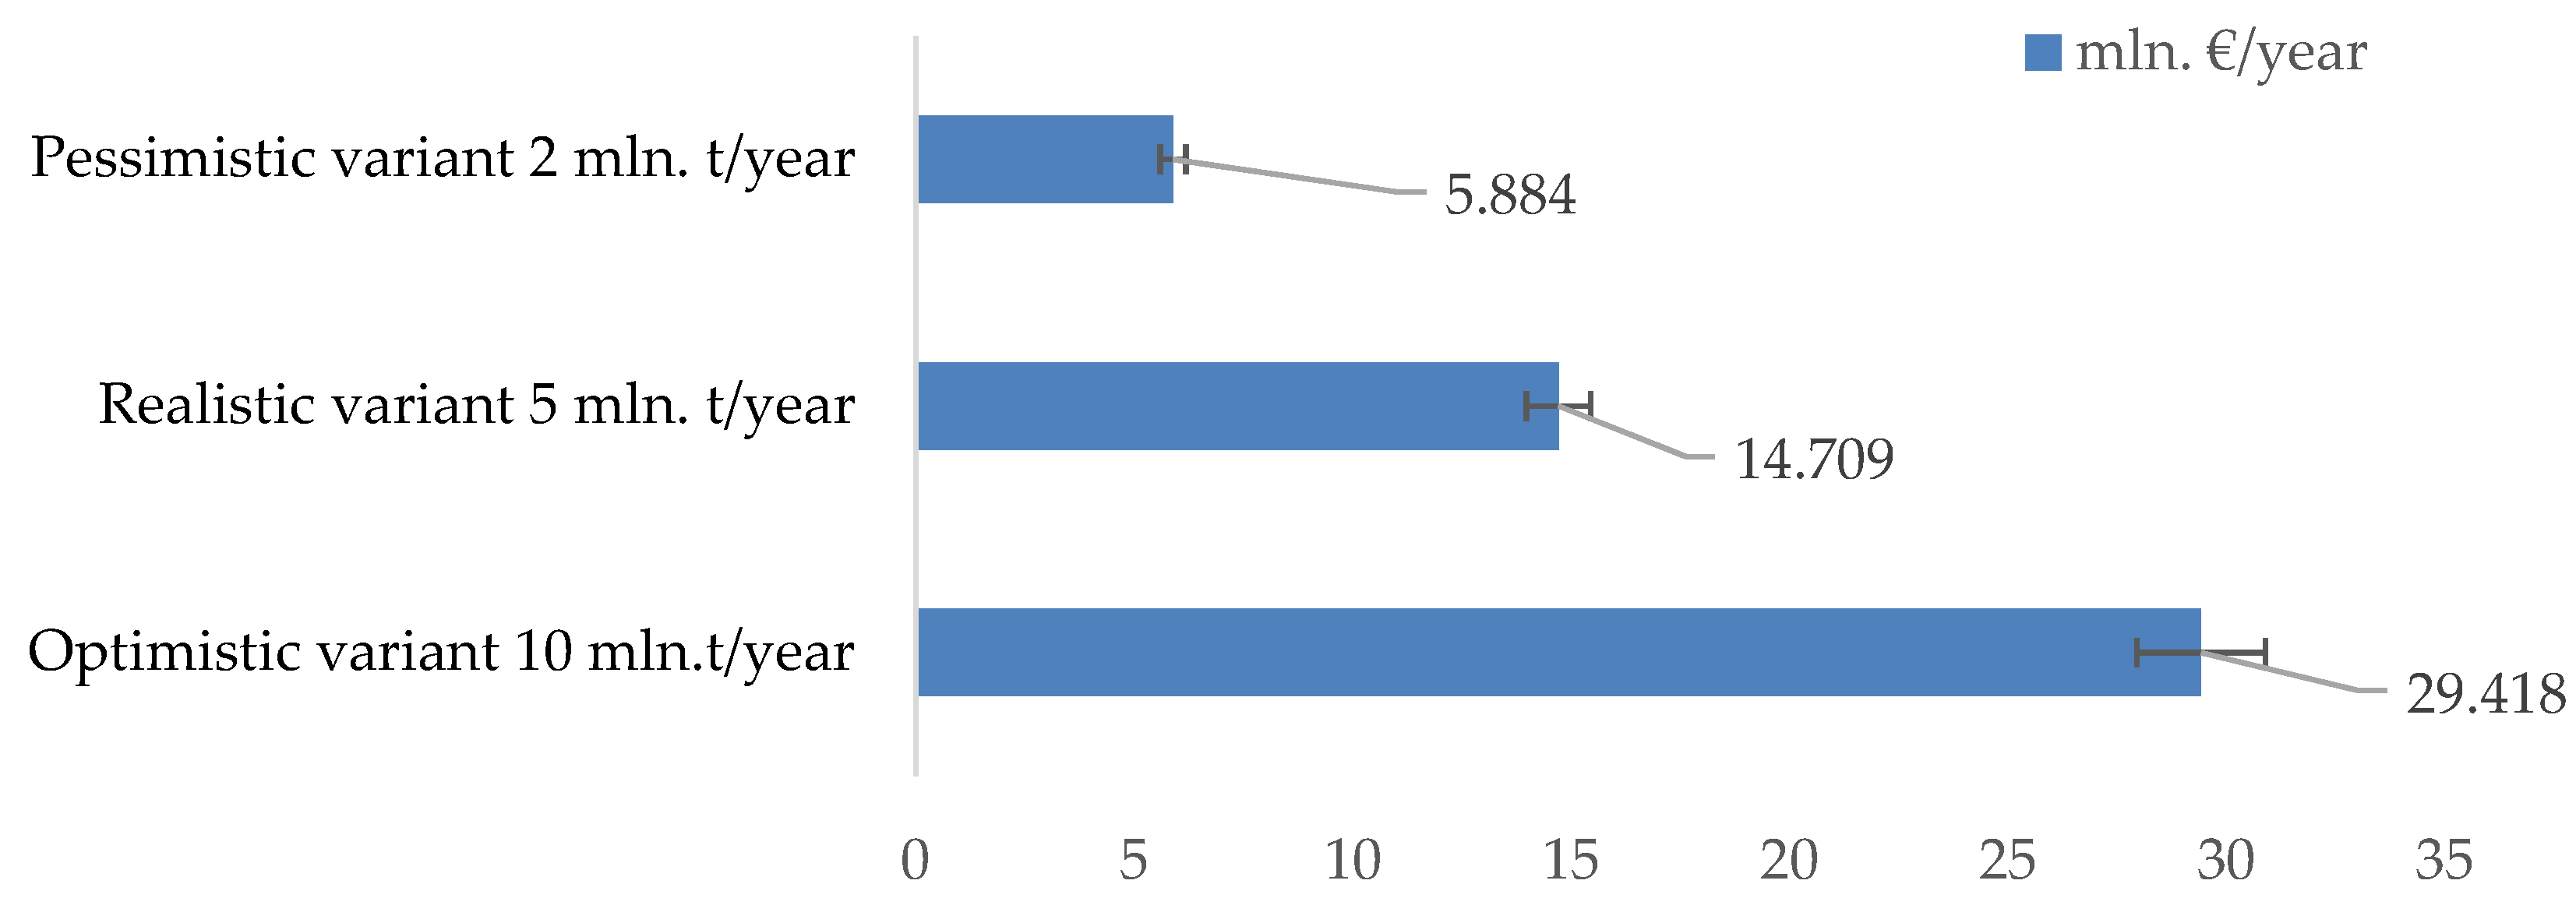
Figure 1 illustrates the positive effect on external costs, modeling the transfer of cargo transportation from the highway to inland waterways on the route Kaunas–Klaipeda, mln. EUR.
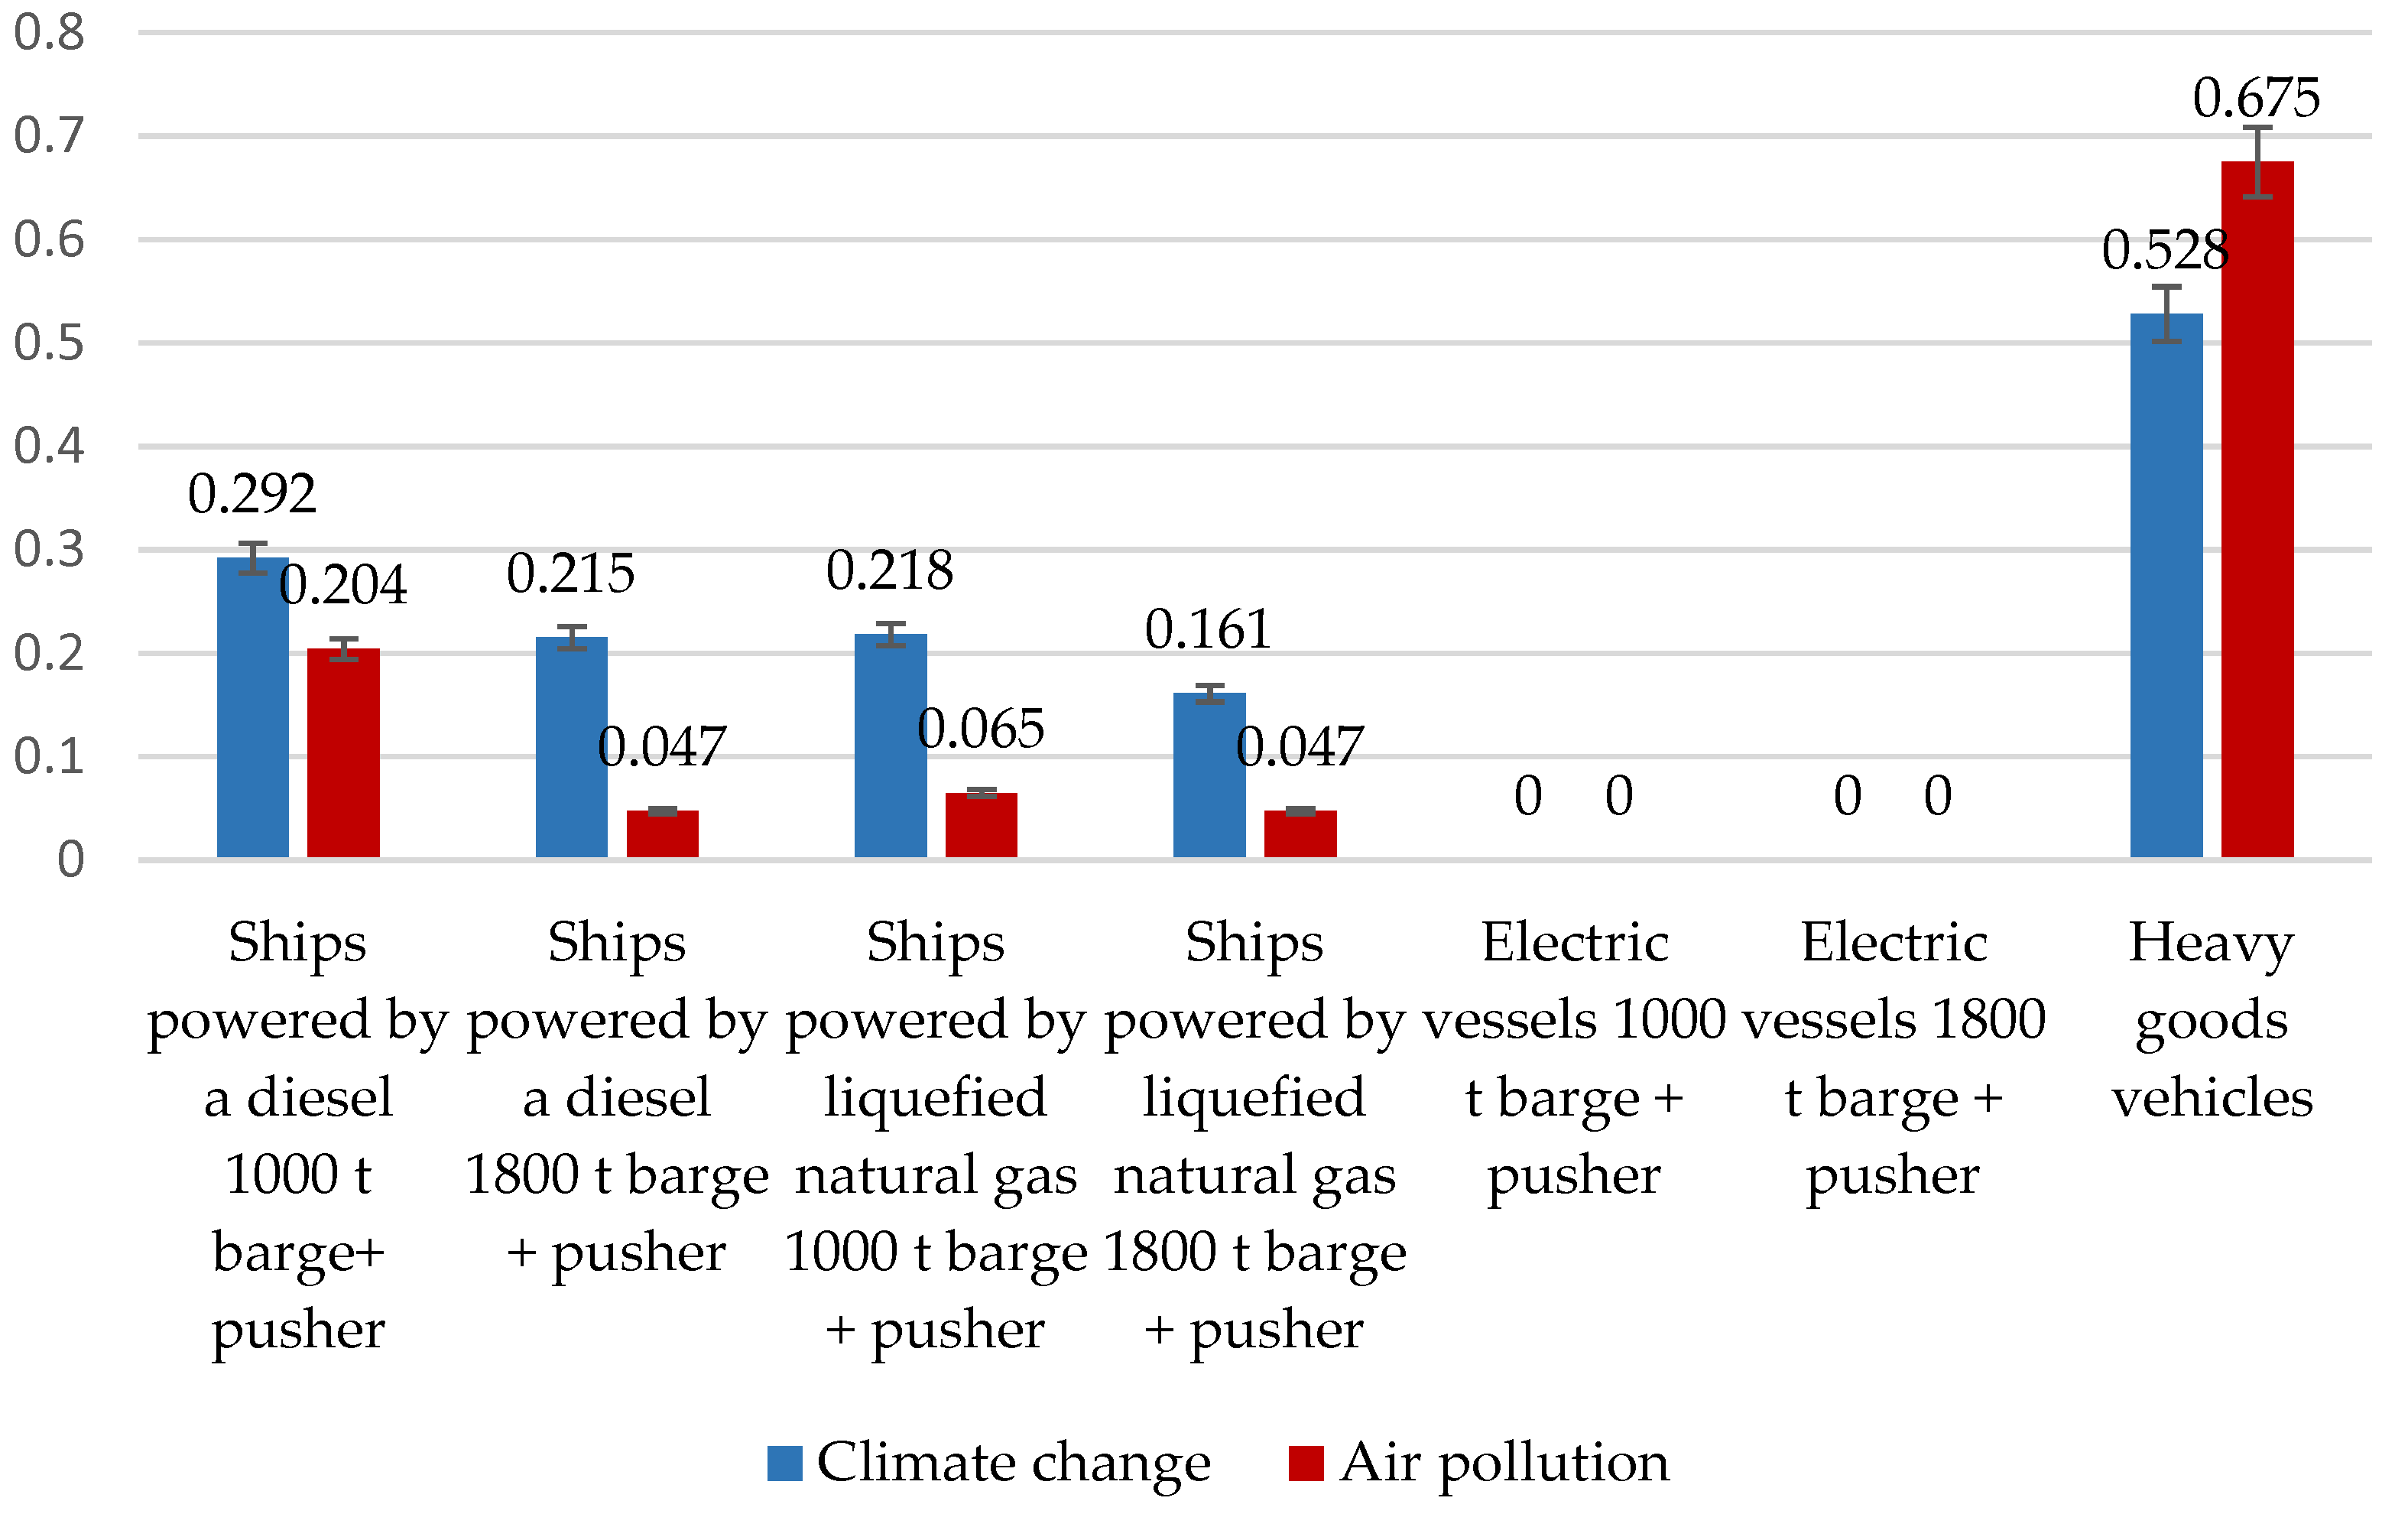
A comparison of the external costs of inland waterway transport with road transport for air pollution and climate change shows a significant reduction in the cost of shipping (see
Figure 2).
The results of the environmental impact modeling show that greenhouse gas emissions are reduced by 25% when the ship’s tonnage is increased from 1000 t to 1800 t and from 15% to 25% when diesel fuel is replaced by liquefied natural gas. Pollution from harmful fumes has the greatest positive impact on the refurbishment of ships by installing new engines that meet the strictest emission standards. Environmental pollution from incineration is minimized by the use of energy from solar or wind power plants for electric vessels.
From the data of the performed calculations,
Table 7 models the influence of ship size, modernization and the use of different energy sources on the variation in air pollution and climate change as external costs.
During the calculations, it was assumed that the 1000 t barge would be pushed by a pusher vessel that meets the requirements of the Euro IIIA stage for fuel emissions. A new pusher vessel was used to push the 1800 t barge, which meets the requirements of the Euro V stage (EPA Tier 3/IMO II). The number of nitrogen oxides in the combustion of these engines was reduced by more than three times, and the emission of solid particles by as much as 13 times, compared to the engines of the previous stage. Therefore, just using a ship with a new engine would reduce environmental pollution costs by ~1.5 times.
According to the modeled calculations of the external costs of air pollution and climate change made in
Table 7, the external costs can be reduced by replacing diesel fuel with natural gas and by transporting cargo with larger capacity (1800 t) barges. The maximum effect is obtained using electric-powered boats.
4.3. Comparison of External Costs in a Realistic Option by Transporting Cargo by Different Types of Ships on the Kaunas–Klaipeda Route
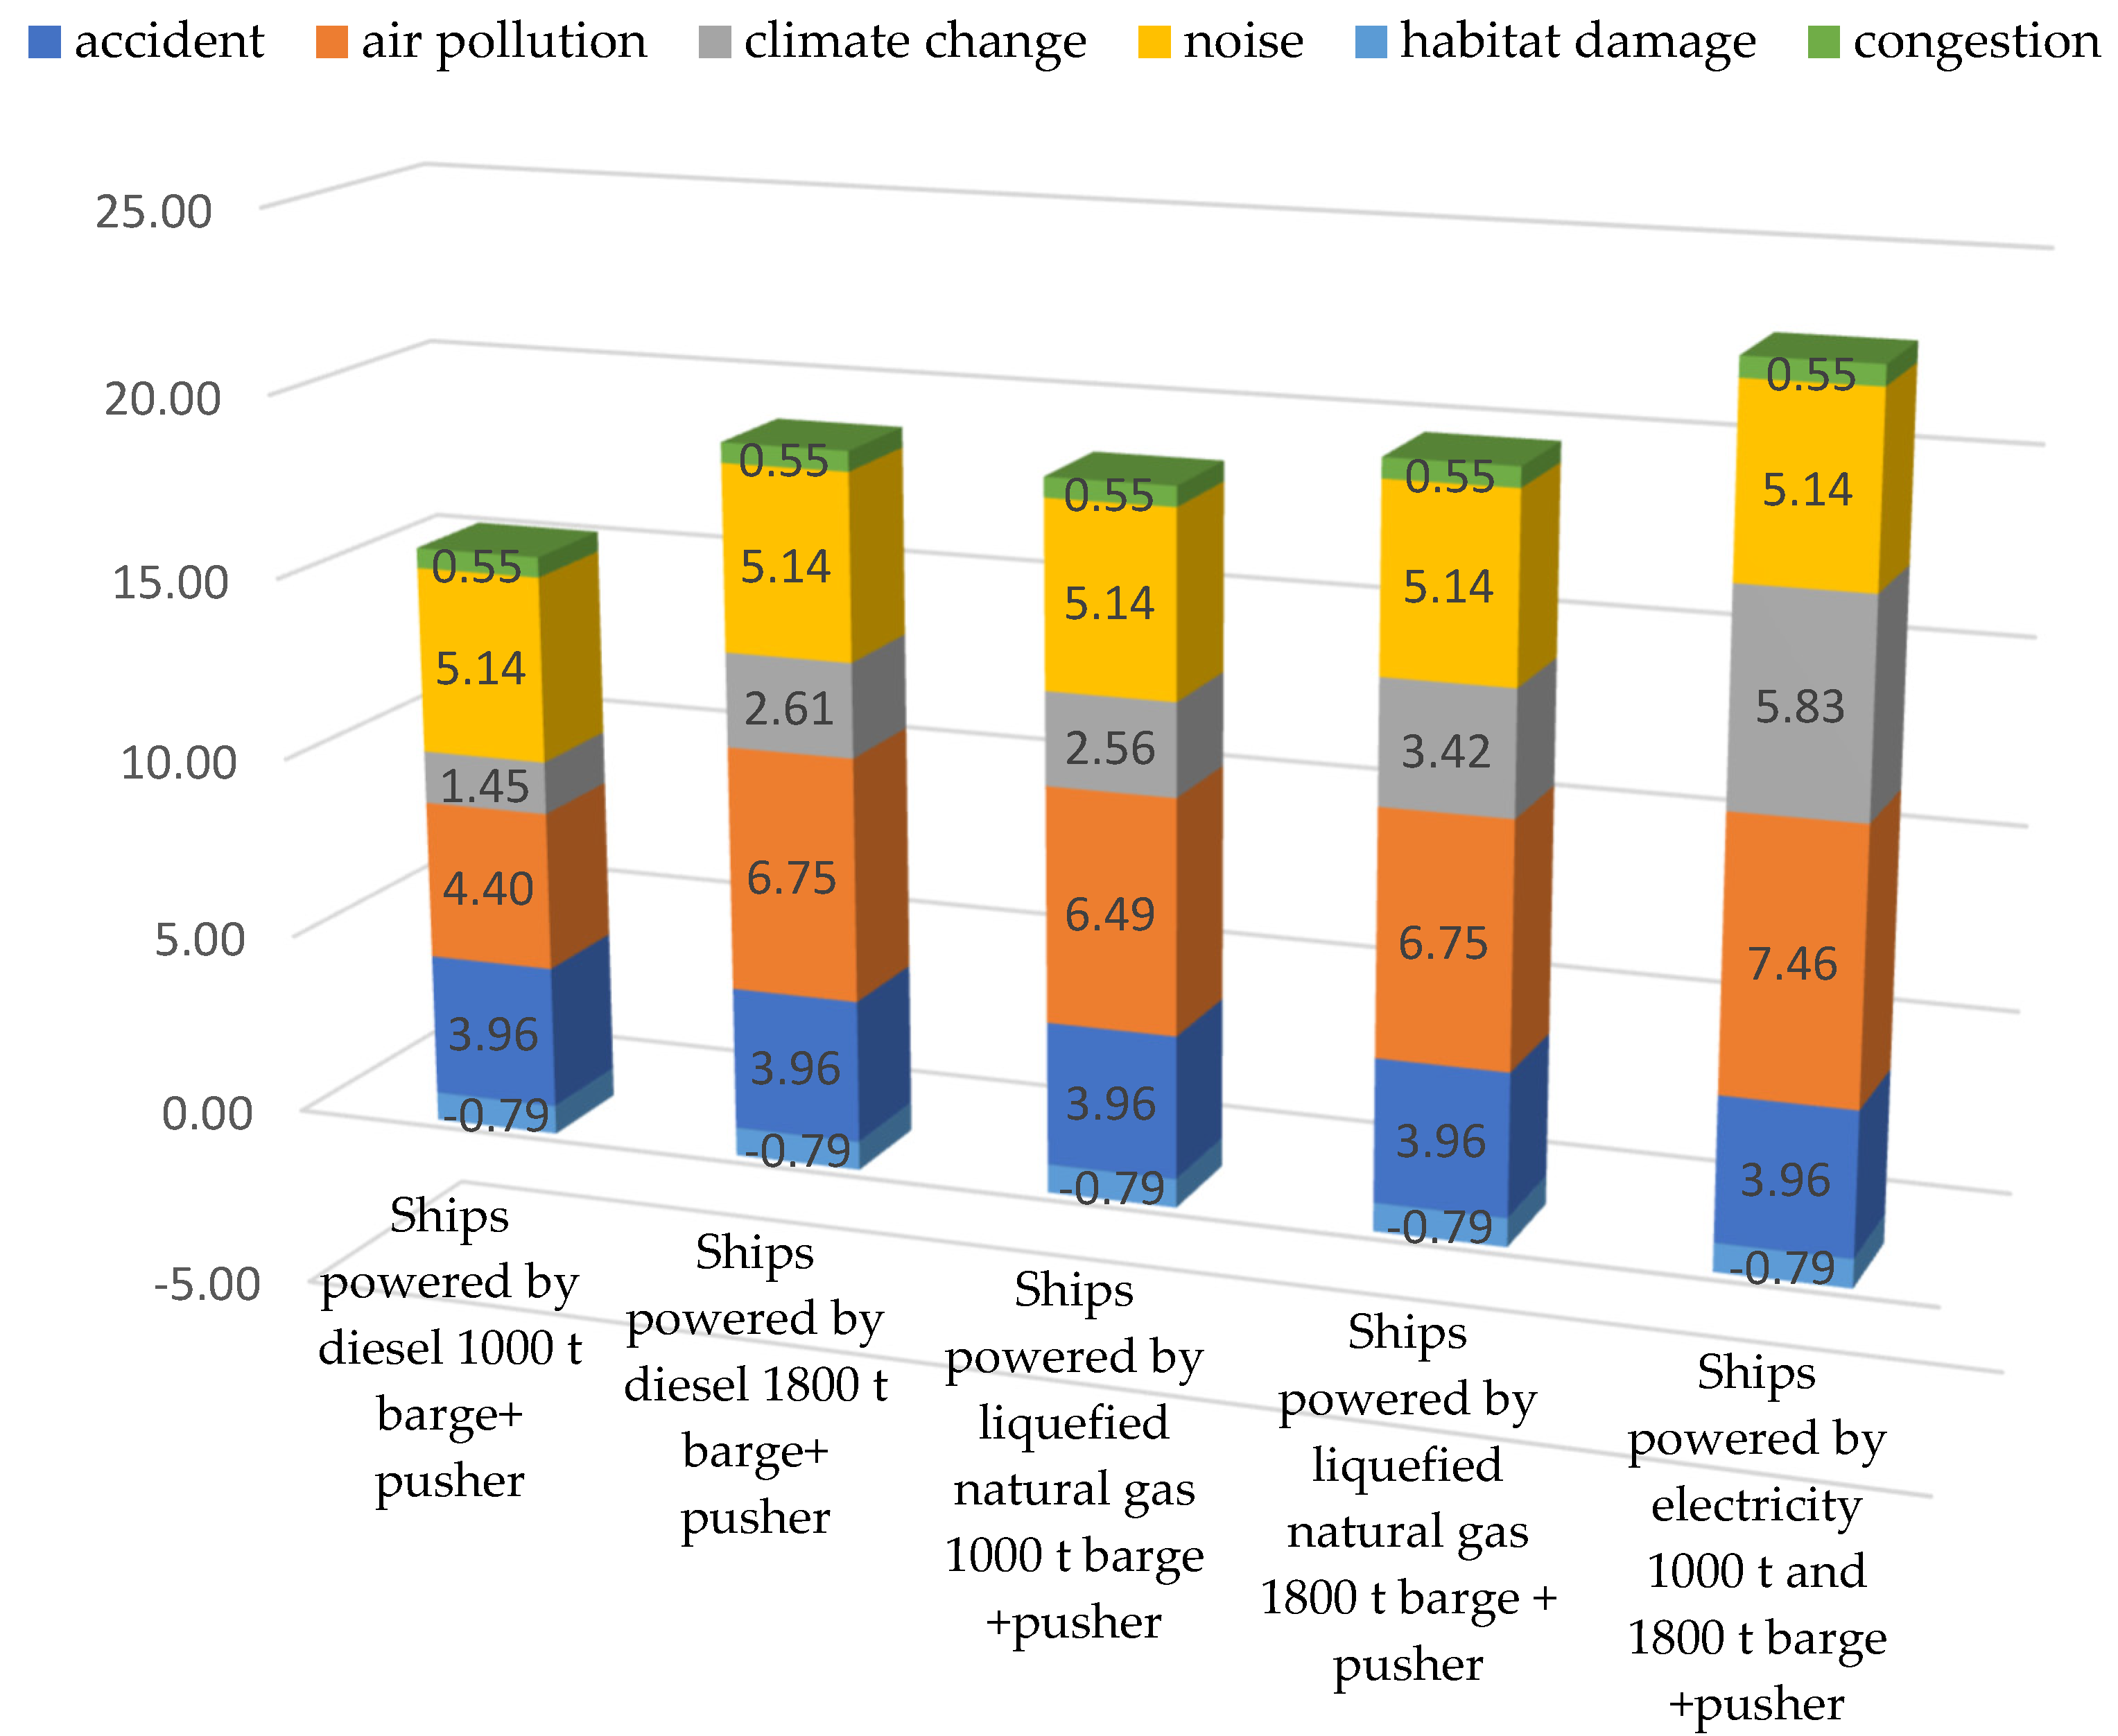
Figure 3 presents the results of calculations of the effect on previously analyzed external costs in an exceptionally realistic variant, when transporting 5 mln t/m, after transferring cargo transportation from trucks to different types of ships, mln. EUR/year. As shown by the data in
Figure 3, external costs such as accidents, noise, habitat damage and congestion are not greatly affected by the type and size of the vessel and the fuel used. Moreover, the costs of air pollution and climate change depend on the various characteristics of ships. Electric ships have the largest positive impact on the external costs of air pollution and climate change.
The positive impact of ship size, fuel, energy source and ship renewal on total external costs is shown below (see
Figure 4).
The best effect was found using electric ships, saving more than 22 million. Eur/year compared to car transport. Changing diesel-powered ships to natural gas-powered ships reduces external costs primarily due to lower climate change impacts. The size of the vessel also has a significant impact in order to obtain a better external cost-saving result. This can be seen by comparing the external costs of gas-powered ships of different sizes. Using an 1800 t barge can save more than 1 million EUR/year, compared to a 1000 t barge.
Even the use of a 1000 t barge with an available pusher ship would allow reducing external costs by over 14 million EUR/year. After purchasing an 1800 t barge and a new (meeting the highest environmental requirements) pusher ship, the positive effect would increase to 18 million EUR/year.
5. Discussion and Conclusions
High rates of environmental pollution in connection with the active use of vehicles is a problem that is given special attention. It is common knowledge that transportation activity is one of the biggest worldwide pollution sources. Meanwhile, automobile air pollution accounts for the bulk of emissions—about 2/3 of transport pollution. Currently, environmental issues have become more serious, and society pays more and more attention to them. Therefore, the use of more environmentally friendly modes of transport is hoped to be one of the future solutions [
7,
11,
22,
26]. Under the current conditions, the presence of the not fully utilized potential of river capacity represents a huge reserve for the development of cargo transportation by this mode of transport [
27,
35,
36]. In this connection, more active participation of waterway transport in the transportation process is inevitable.
Lithuanian inland waterways play a minor role in the country’s transport system. Neman River is underutilized as a waterway and has potential for development, as it would not only enable the river to be used for cargo transportation but would also significantly contribute to the sustainable development of transport.
The calculated (based on the European Commission’s Guide to External Costs of Transport data) and the comparison of external costs for trucks and inland waterway transport show that the total external costs for waterway transport are lower and allow for savings of 0.67 E-cent/tkm. The greatest effect is obtained due to a very low noise level and traffic safety (low number of accidents). This is confirmed by the works of other authors [
8,
15,
35,
36,
37,
38,
39]. For example, Nowakowski et al. [
36] and Kotowska [
38] conducted research in Poland, assessed external costs by comparing road transport, inland shipping and train, and found that the level of emissions of certain pollutants such as sulfur dioxide, particulates and non-methane volatile organic compounds in the inland waterway is lower than in road transport. In addition, road transport has the highest costs, mainly due to heavy congestion and costs related to traffic accidents. Calculations by Otten [
35] showed that the comparative indicators (kg/t) of different types of transport depend not only on the emission factors per ton–kilometer but also essentially on the distance and the amount of upstream and downstream transport. In all cases considered, CO
2 emissions related to road transport are the highest.
In the case of the Lithuania study, various variants of cargo transport by inland waterway transport on the Kaunas–Klaipeda route were modeled (10 million t/year–optimistic variant, 5 million t/year–realistic variant, 2 million t/year—pessimistic variant). Calculations showed that moving freight from the motorway to inland waterways results in external cost savings in most external cost categories, resulting in an overall positive effect, despite the fact that the motorway distance is shorter compared to the inland section.
The results of environmental impact modeling show that greenhouse gas emissions decrease with increasing vessel capacity, but their increase is limited by the shallow depth of the river bed. The results of environmental impact modeling show that increasing the barge capacity from 1000 t to 1800 t reduces the external cost of climate change by 25%. In this article, we analyzed the possibility of using vessels on alternative fuels and calculated specific positive effects in terms of external costs when using different energy sources for inland waterway transport. This is a significant difference and innovation compared to the Handbook on External Costs of Transport published by the European Commission in 2019. Replacing diesel fuel with liquefied natural gas also significantly reduces environmental impact costs. Replacing diesel with liquefied natural gas can reduce the external costs of climate change by 15% to 25%. Favorable conditions for the use of liquefied natural gas are created by the liquefied natural gas terminal operating in Klaipeda.
Regarding the external costs of air pollution, the most positive effect is the renewal of the ships by installing new engines that comply with the strictest emission standards. By purchasing a new pusher vessel that meets the fuel emission requirements of the Euro V stage (EPA Tier 3/IMO II), an even greater effect would be achieved in reducing pollution with harmful fuels. Pollution with harmful nitrogen oxides could be reduced ~4 times; solid particles, ~16.5 times; carbon monoxide, ~1.8 times; and unburned hydrocarbons, ~8.5 times, based on tkm of transported cargo. This was proved by the results of the empirical research of other authors [
8,
35,
38,
39]. Otten noted [
35] that the transport modes core relative to one another with respect to particulate (PMc) and NOx emissions varies significantly from case to case and depends on vessel size, the distance and the amount of up- and downstream transport.
The greatest effect in terms of pollution is achieved by replacing internal combustion engines with electric drives and using electricity produced by solar and wind power plants. Environmental pollution with fuels is minimized by the use of energy produced by solar or wind power plants for ships with an electric drive.
However, in order to fully exploit the potential of Lithuanian inland waterway transport, many expensive investments in infrastructure and maintenance of waterways are needed. However, these investments can provide great potential for Lithuanian waterways and turn into economic, tourist, social and environmental growth in a quick period of time. Business entities should be interested in the development of inland waterway transport in order to reduce costs and obtain the greatest possible financial benefits by using the possibilities of inland waterway transport to carry large quantities of cargo; society should be interested due to less air pollution, climate change, noise, accidents, congestion, greater safety on the road, and the creation of new jobs; municipalities would supplement the budget with income. The case study proved that the use of inland waterways on the route Kaunas–Klaipeda is a significantly cheaper, more efficient and environmentally friendly freight transportation alternative to road transport, the potential of which is not used and is necessary for the sustainable development of inland waterway transport in the Republic of Lithuania.
The main result of this study is proof of the benefit of expanding the use of inland waterway transport by calculating the reduction in external costs and modeling the types of fuel and energy and the size of ships in the case of Lithuania.
The results of our study could inspire scientists and researchers from other countries, as well as practitioners and politicians, to discuss and perhaps make appropriate decisions on how to achieve greater willingness to take advantage of inland waterway transport. In decision-making, they should focus on the environmental impacts that are very important in the modern world.
In conclusion, this article showed the importance of expanding the database for inland waterway transport because, at the moment, it is less studied compared to other modes of transport. In further studies, these calculations may be more detailed. Moreover, it is very important to collect more data from other EU members seeking to improve the correctness of the external costs and factors influencing it for the EU area.
This study has potential limitations. The calculation of the aggregated average external costs was based on the Handbook on External Costs of Transport published by the European Commission in 2019. However, due to the small flow of cargo currently transported by inland waterways, this data are limited. The case study used data from a real flight, but as the volume of transported cargo increases and the infrastructure changes, these data can also change.


