Abstract
Unlike conventional pavements with a service life of 20~30 years, perpetual pavements (PPs) are designed to have a 50-year service life without requiring major maintenance and rehabilitation (M&R) activities. In this way, PPs are more cost-effective than conventional rigid pavements (CRPs) and conventional flexible pavements (CFPs). Nonetheless, even though the economic and mechanical aspects of PPs have been widely studied and well documented, the literature is limited regarding the environmental assessment of PPs. Consequently, this research estimated the environmental burden associated with five pavement structures (one CRP, one CFP, and three PP structures) through the life-cycle assessment (LCA) methodology. Notably, the PaLATE computational tool was used to carry out the LCAs. The results indicated that for CFP, most of the environmental impacts are generated by the M&R activities. Otherwise, for CRP and PP structures, the most impact occurred during the initial construction stage. The study results also revealed that materials production is the sub-stage that most contributed to the generation of environmental detriments. Overall, this comparative case study concluded that the pavement alternative with the slightest environmental damage is the PP structure.
1. Introduction
Perpetual pavements (PPs) are a type of asphalt pavement designed under a long-durability philosophy, i.e., the designs encounter robust enough structural packages that do not require major maintenance and/or rehabilitation (M&R) activities throughout their design life (around 50 years), only demanding surface treatments to guarantee users comfort [1,2]. The durability of PP is associated with the design method of the multi-layer structure: the upper surface layer is designed to resist wear and top-down cracking, the intermediate asphalt layer is designed to resist rutting and fatigue, and the lower asphalt layer is designed to resist bottom-up cracking [3,4]. Consequently, the PP uses a mechanized design that guarantees high rigidity to the upper layers of the pavement to reduce the incidence of the rutting phenomenon while proffering elevated flexibility to the lower layers to prevent bottom-up fatigue cracking [5,6]. The preceding is achieved by limiting the horizontal tensile strain at the bottom of the asphalt layers (≤70 µε) and the vertical compressive strain on the top of the subgrade layer (≤200 µε) [6,7,8,9].
In addition to the strain criteria, other aspects considered in the PP design are traffic (vehicle counts, loads, and speeds), climate conditions, and the availability of materials and construction processes [4,10,11]. According to the Asphalt Pavement Alliance [1,2], a typical PP structure is formed by: (i) a high-quality hot-mix asphalt (HMA), preferably stone matrix asphalt (SMA) or permeable friction course (PFC); (ii) at least one layer of stiff rut resistant HMA; (iii) fatigue-cracking-resistant HMA layer; and finally, (iv) a stabilized granular layer (base or subbase). Figure 1 illustrates the generalized PP design. Moreover, Table 1 exemplifies the PP structures reviewed in the literature.
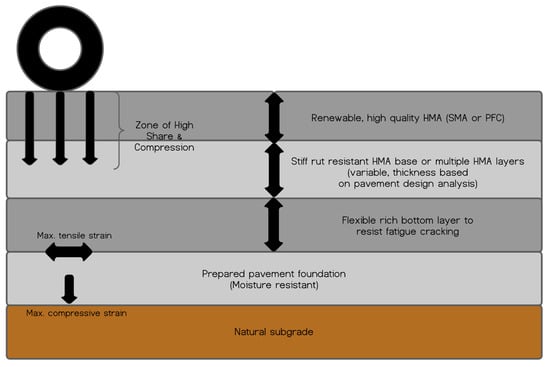
Figure 1.
Generalized PP design. Adapted from [1,2].
Previous studies by [5,6,9,12] optimized the Texas PP design method from mechanistic and economic perspectives. In these studies, it was demonstrated that for an analysis period of 50 years, the PP structures generated lower life-cycle costs (i.e., higher cost-effectiveness) than both conventional flexible pavements (CFP) and conventional rigid pavements (CRP), respectively. This cost-effectiveness was mainly attributed to the superior mechanical performance of the PP structures, which inherently reduces the required M&R activities. Thus, it ultimately reduces the long-term user and agency costs.
On the other hand, the studies listed in Table 2 suggest that the lower requirements in terms of M&R activities could potentially lead to PPs generating less environmental impacts than conventional pavements [13,14,15]. With this background, this research was conducted to comparatively assess the environmental burden of PPs against conventional flexible and rigid pavement structures. For these purposes, the Texas (USA) pavement structures were used as a case study, as documented by [6,9,12,16,17]. Consequently, the life-cycle assessment (LCA) was used to comparatively evaluate, analyze, and quantify the environmental damage produced by these pavement structures. The study’s second objective was to bridge the knowledge gap and contribute to the literature enrichment by proving the potential sustainability benefits of using PP structures.

Table 2.
Summary listing of LCA studies of PPs found in the literature.

Table 1.
Summary listing of PP structures found in the literature.
Table 1.
Summary listing of PP structures found in the literature.
| References | Design Traffic (MESALs *) | Analysis Period (Years) | HMA Thickness (cm) | Granular Layer Thickness (cm) |
|---|---|---|---|---|
| [3] | 80 | 40 | 40 | 15 |
| [4] | - | 70 | 42 | 75 |
| [11] | 120 | 30–40 | 45 | 36 |
| [18] | 200 | 50 | 36 | 20 |
| [19] | - | 40 | 36 | 51 |
| [20] | - | - | 33 | 40 |
| [21] | 80 | 40 | 20 | 70 |
| [22] | 663 | 50 | 25 | 40 |
| [23] | 80–100 | 30 | 30 | 15–65 |
| [24] | 165 | 50 | 25 | 15 |
| [25] | - | 50 | 50 | 30 |
* MESALs = million equivalent single axle loads.
2. Background: LCA Concepts and Related Tools
LCA is a standardized methodology that allows determining and classifying the potential environmental impacts generated by activities, systems, or projects throughout the stages of their life cycle [26,27]. For instance, in the case of pavements, the stages of extraction and processing of raw materials, production of mixtures, transportation, construction process, and end of useful life are typically used [13,28,29,30,31,32]. The international standards associated with LCA are the ISO-14040 and ISO-14044, respectively [26,27]. The ISO-14040 establishes the principles and framework. Meanwhile, the ISO-14044 details the requirements and guidelines. According to these standards, LCA must be executed in four phases, as follows:
- Goal and scope definition phase: include the system boundary and level of detail. The depth and the breadth of LCA can differ depending on the goals of a case.
- Life-cycle inventory (LCI) analysis phase: this is an inventory of input/output data associated with the studied system. It involves the collection of the data necessary to meet the goals.
- Life-cycle impact assessment (LCIA) phase: the environmental category indicators, also called impact categories, are used to condense and explain the LCI results.
- Interpretation phase: LCI and LCIA results are summarized and discussed as the basis for drawing conclusions, recommendations, and decision making.
On the other hand, it is common to employ specialized software to implement the LCA methodology. SimaPro and GaBi are the leading software tools used for LCA [33,34,35]. However, in the field of road infrastructure, it is common to use various pavement-specific LCA tools, including but not limited to the following: ROAD-RES, PaLATE, UK asphalt pavement LCA model, ROADEO, CMS RIPT, CFET, ECORCE-M, DuboCalc, CO2NSTRUCT, Greencalc+, Ecosoft, VTTI/UC asphalt pavement LCA model, and Athena Impact Estimator for Highways [36,37,38,39].
Due to the wide variety of environmental outputs, simplicity, and customization potential to the project goals, PaLATE stands out from the other LCA tools considering that it was explicitly developed for pavements [40]. PaLATE is a free Microsoft Excel add-on tool created by the Consortium on Green Design and the University of California (Berkeley). It evaluates the life-cycle costs and environmental impacts by employing a hybrid life-cycle analysis of various pavement alternatives [41]. This tool has a vast trajectory in the study of road infrastructure projects. In the literature, it is found that it has been successfully used as follows: as a carbon footprint estimator [42], as a decision-making technique [43,44], as a quantifier of environmental benefits caused by recycled materials [45,46,47], as a green highway rating system [48,49], and as a preservation treatment comparator [50], among other applications. On this basis, PaLATE was selected for use in this study.
3. LCA and Results
3.1. Goal and Scope Definition Phase
3.1.1. Goal
As previously mentioned, this study aimed to determine the potential environmental benefits of using PP structures. For this purpose, existing PP structures and several conventional pavement alternatives (CFP and CRP) from the state of Texas (USA) were comparatively assessed. In this way, the present research intends to enrich the state of the knowledge by providing an environmental assessment of PP structures to provide agencies, pavement designers, and other stakeholders with a complete picture of PP implementation’s performance, cost, sustainability, and environmental benefits.
3.1.2. System Description and Boundaries
This investigation was accomplished by applying the LCA in adherence to the current international regulations (namely ISO-14040 and ISO-14044) and the Federal Highway Administration’s Pavement LCA Framework [51]. Figure 2 shows the graphic description of the primary approach for system boundaries used in the road infrastructure industry for LCA execution, namely cradle-to-grave, cradle-to-laid, cradle-to-side, and cradle-to-gate. The cradle-to-laid approach was chosen as the most convenient method to align with previous PP studies [6,9,12]. Thus, the initial construction process and M&R activities are considered in the LCAs [51,52]. Materials production, materials transportation, and materials processing (equipment) were examined for both stages. In this way, Figure 3 presents the system boundaries and processes considered in the study.

Figure 2.
Main system boundaries employed to develop the LCA on road infrastructure. Adapted from [51,52].
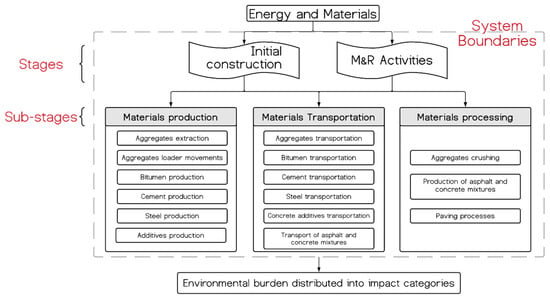
Figure 3.
System boundaries adopted for the development of LCAs.
3.1.3. Functional Unit
The pavement alternatives were analyzed considering a service life of 50 years, 30 million equivalent single axle loads (MESALs), and a typical Texas climate for the Fort Worth area (TX, USA). The structural packages for the PP, CFP, and CRP designed under these conditions were designated as PP-30, CFP-30, and CRP-30, respectively. It was also desired to evaluate the PPs’ environmental impacts on traffic loading sensitivity. Therefore, the PP structures were assessed for 40 and 70 MESALs traffic loading, denoted as PP-40 and PP-70, respectively [6]. For all the cases, the function unit has deemed a width of 24 ft (7.3 m) and a length of 1 mile (1609 m). Following the previous studies that supported this research [6,9], the pavement alternatives were designed using the flexible pavement design system (FPS), Texas mechanistic-empirical flexible pavement design system (TxME), and AASHTOWare® Pavement M-E Design software. Figure 4 shows these structures. In addition, the subgrade properties (gradation, Atterberg limits, specific gravity, moisture-density curves, Texas triaxial, shear strength, and unconfined compressive strength) employed in the design process can be found in the Texas PP database [6,9,53].
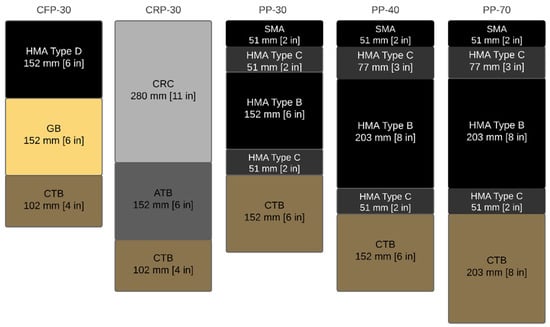
Figure 4.
Pavement structures used for LCA. Acronyms: GB—granular base; CTB—cement-treated base; CRC—continuously reinforced concrete; ATB—asphalt-treated base.
Figure 4 shows that all the PP structures under evaluation have SMA as the surface layer. SMAs are a type of HMA developed to provide maximum resistance to rutting, cracking, noise reduction, high skid resistance, and better wet visibility [54,55]. Nevertheless, due to the mineral skeleton (gap-graded conformed by two parts of coarse aggregate) of the SMAs, it is required to incorporate a stabilizer additive to prevent the drain-down phenomena [56,57]. The inclusion of the stabilizing agent can cause SMA to generate a higher environmental burden than conventional HMA mixtures [58]. In this study, crumb rubber was used as the stabilizing additive. The literature demonstrates that this material provides excellent mechanical performance [59,60,61,62,63].
3.1.4. Data Source
The studies and literature publications by [5,6,9,12,16,17,53] served as the primary data source for the work contained in this paper. For LCA analysis, the PaLATE tool was used. This tool includes a detailed database built on the literature review, which comprises the environmental impact of several materials and processes commonly used in pavement construction [64,65]. PaLATE considers the user inputs for the design, initial construction, maintenance, equipment used, and costs for a roadway and provides the outputs for the life-cycle environmental impacts and associated costs [66,67]. PaLATE was selected because it is specially designed for pavement evaluation, presents an extensive record of use in the literature, incorporates a transparent programming code, and the user interface allows for flexibility in updating the inventory database [68,69].
3.2. LCI Analysis Phase
PaLATE implements its LCI according to the project specifications, i.e., required materials, transport distances, and equipment. Based on the pavement structures, the M&R activities planned for the alternatives (Figure 5), the composition of the pavement layers (Table 3), and the required volume of materials (Table 4) were determined. The M&R activities were adapted from previous research [6]. For the PP alternatives, an asphalt overlay will be placed every 12 years. Regarding the CFP-30 alternative, an asphalt overlay will be placed every 4 years, and the asphalt layer will be rebuilt every 20 years. In all the cases, the asphalt overlay was 2 in (50.8 mm) thick. Likewise, the road surface was not previously milled in any case of asphalt overlay. For its part, the CRP-30 alternative only contemplates a full-depth repair 30 years after the initial construction. Further, the transport distances considered for the materials are listed in Table 5. These distances are representative of the state of Texas, USA. Otherwise, different types of construction equipment can strongly influence the calculated environmental impacts due to the differences in efficiency and fuel consumption. Therefore, it was decided to use the equipment database suggested in PaLATE as representatives of the USA construction practices. Accordingly, Table 6 shows the LCI employed in this study.
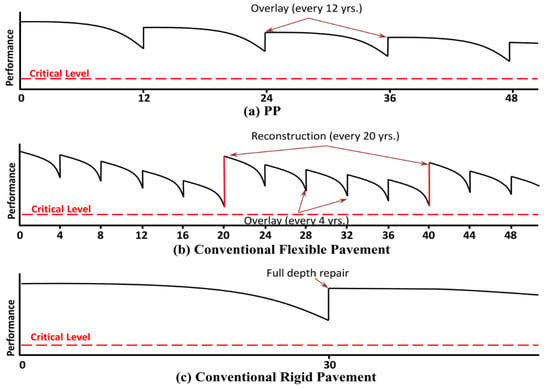
Figure 5.
Pavement M&R activities. Adapted from [6].

Table 3.
Pavement layer material composition (mass).

Table 4.
Material quantity (volume).

Table 5.
Distances considered for LCA.

Table 6.
LCI employed in this study. Source: PaLATE.
3.3. LCIA Phase
PaLATE provides environmental effects into 12 impact categories, namely energy consumption (EC), water consumption (WC), carbon dioxide emissions (CO2), nitrogen oxide emissions (NOx), particle size less than 10 μm emissions (PM10), sulfur dioxide emissions (SO2), carbon monoxide emissions (CO), mercury emissions (Hg), lead emissions (Pb), hazardous waste generated (HWG), aldehydes generated (AG), and benzo[a]pyrene generated (BG) [70,71]. These impact categories can be grouped into three types: resource consumption (i.e., EC and WC), emissions to the atmosphere (i.e., CO2, NOx, PM10, SO2, and CO), and leachate information (i.e., Hg, Pb, HWG, AG, and BG). One of the PaLATE advantages over other tools to develop LCA is its clear distinction of leachates. Leachates are foul-smelling liquids (black or brown) produced by the percolation of moisture through non-containerized solid waste [72,73,74]. In addition, the PaLATE tool clarifies that the HWG refers to the resource conservation and recovery act (RCRA). Furthermore, it is stated that AG and BG represent human toxicity potential cancer (HTPc) and human toxicity potential non-cancer (HTPnc), respectively.
In environmental assessments, the contribution to climate change is one of the most studied aspects due to its significance in contemporary times [75,76,77]. Therefore, it is not surprising that CO2 and NOx emissions are some of the most crucial impact categories of PaLATE. CO2 is often used as a reference gas to quantify the global warming potential (GWP), a benchmark adopted to measure the contribution to climate change [78,79,80]. NOx is one of the major harmful emissions because it is a precursor of tropospheric ozone, i.e., a potent greenhouse gas [81,82]. NOx pollution is mainly formed during fossil fuel combustions at high temperatures [83,84]. Nitrogen oxide emissions are highly harmful to humans and even threaten their lives. This aspect has led to a growing interest in developing techniques and technologies for their reduction. Notably, this is one of the primary targets of the Clean Air Act [85,86,87].
3.4. Interpretation Phase
3.4.1. Characterization Results
Considering the LCA methodology, the data provided, and the assumptions described above, the environmental impacts were determined. Table 7 shows the characterization results associated with the five pavement alternatives evaluated. The alternative that generates the highest and lowest environmental impact for each impact category is highlighted in red and green, respectively. For example, in Table 7, it is noted that: (i) the PP-30 alternative is the one that generates the least environmental impact in most of the impact categories (10 out of 12); (ii) CRP-30 is the most contaminating alternative (in 9 out of 12 criteria); (iii) the PP structures designed with considerably higher traffic (namely PP-40 and PP-70 with 40 and 70 MESALs, respectively) generated less environmental impacts than the conventional pavement alternatives.

Table 7.
LCIA results for a functional unit *.
3.4.2. Relative Environmental Impacts
In order to analyze the relative changes in the environmental burden, one of the pavement alternatives must be used as the reference datum. The PP-30 was selected for this purpose because it allowed comparing (on equal terms) the conventional pavement alternatives (CFP-30 and CRP-30) with the PP structure. Furthermore, this choice permitted the sensitivity evaluation of increasing the design traffic level (PP-40 and PP-70) versus the increase in the environmental impacts. Figure 6 shows these relative environmental damages.
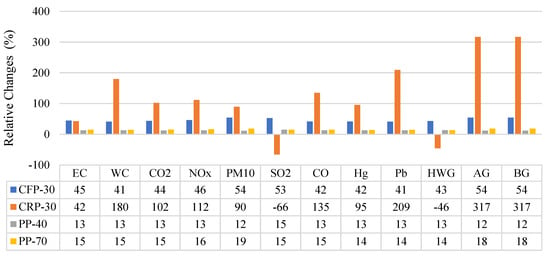
Figure 6.
Relative environmental impacts using PP-30 as the reference datum.
In Figure 6, positive numbers mean that the evaluated pavement alternative has a higher environmental impact (in percentage) than the reference datum (i.e., PP-30). Likewise, negative numbers indicate that the evaluated pavement alternative presents less environmental burden than the reference datum. In this way, the following can be observed:
- Under the same design conditions, CFP generates between 41% and 54% more potential for environmental impact than a PP structure.
- Under the same design conditions, CRP ranks as the most contaminating pavement alternative. In 9 of 12 impact categories, it has the highest potential for environmental impact. Nevertheless, CRP-30 generates the most negligible emissions in two impact categories (SO2 and HWG). Notably, this structure requires less energy consumption than CFP-30.
- The PP-40 was designed to resist 10 MESALs more than PP-30; nonetheless, it only generates about 12~15% more environmental impacts. Meanwhile, the PP-70 was designed to withstand 40 MESALs more than PP-30, causing only 14~19% more environmental impacts.
- The environmental benefits of the PP structures were most prominent in impact categories such as water consumption, CO2 emissions, nitrogen oxide emissions, CO emissions, lead emissions, aldehydes generated, and benzo[a]pyrene generation.
3.4.3. Stages and Sub-Stages Contribution Analysis
This research employs two stages, namely initial construction processes and M&R activities. Figure 7 shows the discrimination of the environmental impacts according to the contribution made by each stage. The findings determined in Figure 7 are listed below:
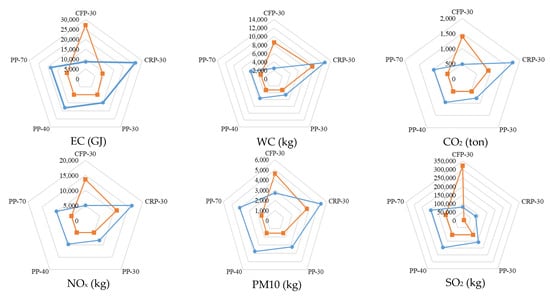
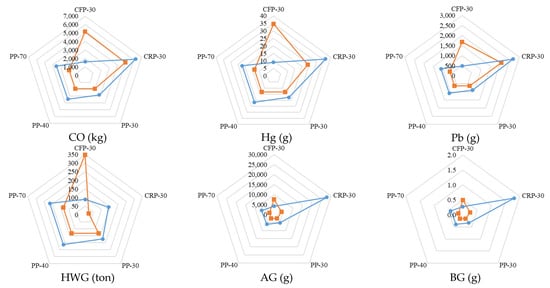
Figure 7.
Environmental impacts by stages: initial construction and M&R activities. Color-coding: blue—initial construction; orange—M&R activities.
- In all the impact categories, the pavement alternative that generated the lowest environmental damage in the initial construction stage was CFP-30.
- In the initial construction stage, the PP alternatives were the largest producers of SO2 and HWG. However, in the other ten impact categories, the most significant environmental impact was generated by CRP-30.
- Regarding the M&R activities stage, the CFP-30 pavement alternative generated the highest environmental impact (except for water consumption and lead emissions, where the CRP-30 was the most contaminating alternative). This response behavior is expected for traditional asphalt pavements since they require frequent intervention activities.
- The PP alternatives were the ones that caused the least environmental impact during the M&R activities stage. Only in three impact categories (EC, SO2, and HWG) were they surpassed by the CRP-30 alternative.
- For the CRP-30 and PP alternatives, most of the environmental impact was predominantly associated with the initial construction stage. For CFP-30, however, the M&R activities stage was the most influential.
At each stage, the contributions made by the sub-stages of materials production, materials transportation, and materials processing were evaluated. Each sub-stage involved the contributions made during the initial construction processes and M&R activities. Figure 8 shows this analysis. From this graph, the following findings can be drawn:
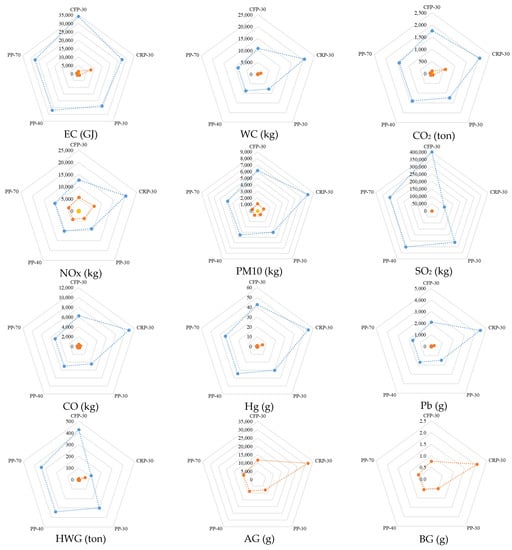
Figure 8.
Environmental impacts by sub-stages: materials production, transportation, and processing. Color-coding: blue—materials production; orange—materials transportation; yellow—materials processing (negligible).
- For all pavement alternatives, the environmental impacts associated with AG and BG occur exclusively in the materials transportation sub-stage. CRP-30 and PP-30 cause the maximum and minimum environmental impact in both categories. Therefore, it is recommended to use local (or at least close) sources of materials as much as possible.
- Most of the environmental burden occurred in the materials production sub-stage for the other impact categories. Meanwhile, marginal impacts were generated in the materials transportation sub-stage. On the other hand, materials processing caused negligible environmental impacts. Hence, to reduce the environmental impact of road infrastructure, it is necessary to diminish the depletion of non-renewable resources. In this way, materials reuse techniques and recycling technologies can be implemented, which for instance, include partial replacement of the raw materials using construction and demolition waste materials, recovery of asphalt binders, and utilization of industrial waste as supplementary cementitious material (SCM), among others [88,89,90,91].
- In the materials production and transportation sub-stages, it is evident that the PP alternatives had the least environmental impact, whilst CRP-30 was the most contaminating.
- Concerning the materials processing sub-stage, the CFP-30 alternative generated the most detrimental environmental effects in most of the impact categories evaluated.
4. Discussion
4.1. Traffic Sensitivity Analysis
A sensitivity analysis was performed to measure how better pavements can be designed and constructed without drastically increasing the environmental impacts. For this purpose, the sensitivity ratio (SR) was determined by varying the traffic design level for the PP structures. The SR is the ratio between the two relative changes and is mathematically computed as expressed in Equation (1) [92]:
According to Equation (1), higher SR values indicate that the parameter alteration has a more significant influence on the results [93]. For example, if a parameter has an SR of two, it implies that when increasing its value by 10%, the final result is increased by 20% [92]. This study evaluated two scenarios: PP-40 versus PP-30 (first scenario) and PP-70 versus PP-30 (second scenario). In both scenarios, the results corresponded to the values obtained in each impact category, and the initial parameter corresponded to a traffic level of 30 MESALs for PP-30. For the first and second scenarios, the △parameter takes a value of 40 MESALs and 70 MESALs, respectively. Figure 9 shows the corresponding SR results. This graph shows that the SR fluctuates within a range of 0.35~0.45 in the first scenario. Meanwhile, in the second scenario, the variation range was 0.10 to 0.14. This decrease in magnitudes and the breadth of the range mean that the relative environmental impact decreases for higher-traffic-designed PP. Therefore, the preceding suggests that designing and constructing PP structures for high-traffic volume (trucks) highways are more eco-efficient.
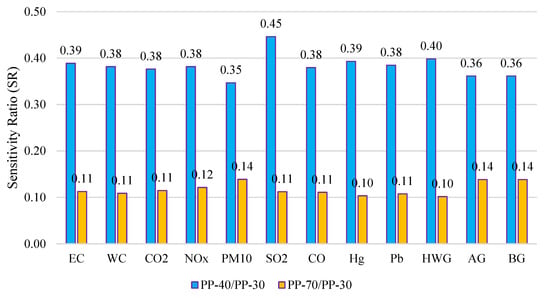
Figure 9.
SR results for PP structures.
4.2. Contribution Analysis of the Binders
Binders are materials capable of combining diverse substances through chemical stabilization and physical solidification. Nevertheless, their use must be prudent because their manufacturing processes seriously contaminate [94,95,96]. Bitumen and Portland Cement (PC) are some of the most widely used organic and inorganic binders, respectively [97]. The bitumen comes from crude oil refinement, making it an environmentally unfriendly material since petroleum is a non-renewable source, and the associated industrial process causes high levels of environmental pollution [88,98]. PC is a powdery substance produced through the high-temperature calcination of lime (which contributes calcium oxide) and clay (which provides silica, alumina, and iron oxide) as the primary ingredients [99,100]. During this process, enormous environmental burdens associated with energy consumption, gas emissions into the atmosphere (CO, CO2, NOx, and SO2), and leachate formation (heavy metals) are generated [101,102].
In this way, binders are considered materials with a high environmental impact. Therefore, it was decided in this study to quantify the contribution that the binders (PC in the case of CRP-30 and bitumen in the other alternatives) have on the totality of the environmental burden (i.e., regarding the characterization results). Figure 10, Figure 11 and Figure 12 show the relative and absolute comparison of the contribution of the binders to the total environmental impact of the pavement alternatives. In the item “Contributed by the binder”, the bitumen and PC from the asphalt-treated base and cement-treated base were not considered. Because PP-40 and PP-70 exhibited the same response trend as that observed for PP-30, it was decided not to graph the data of these two alternatives. The selected impact categories examined for this analysis were EC, CO2, NOx, SO2, CO, Hg, and Pb. From Figure 11, Figure 12 and Figure 13, the following inferences were made:
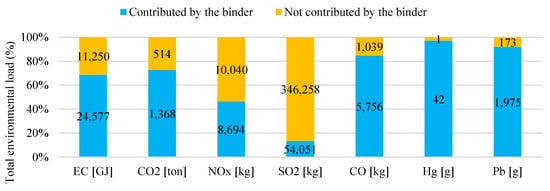
Figure 10.
Environmental impacts of binders for the CFP-30 alternative.
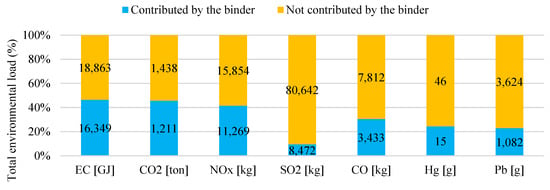
Figure 11.
Environmental impacts of binders for the CRP-30 alternative.
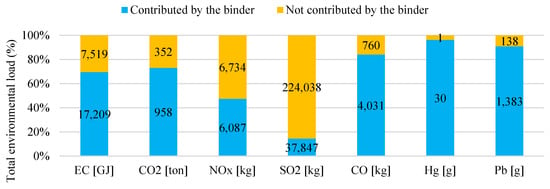
Figure 12.
Environmental impacts of binders for the PP-30 alternative.
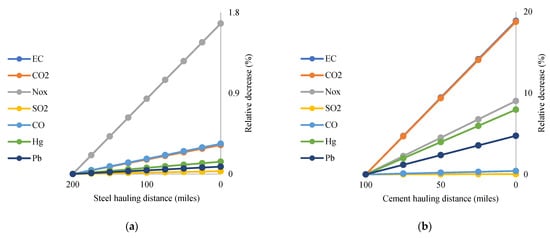
Figure 13.
Scenarios of reducing material hauling distances for CRP-30.
- In the asphalt pavement alternatives (CFP-30, PP-30, PP-40, and PP-70), bitumen is the highest contributor to the environmental burden in the impact categories of EC, CO2, CO, Hg, and Pb. Additionally, the bitumen was also a considerable NOx contributor.
- Regarding CRP-30, the PC contributes almost half of the total environmental burden associated with the impact categories of EC, CO2, and NOx. Additionally, PC plays an essential role in the emission of CO and the generation of heavy metals (Hg and Pb).
- Binders are the main contributors to energy consumption and CO2 emission into the atmosphere. These materials are the principal generators of the global warming potential (within the pavement alternatives assessed) and are therefore boosters of climate change.
4.3. CRP-30 Modification and Enhancement Strategies
In the previous analysis, it was possible to demonstrate that the CRP-30 pavement alternative was the one that generated the highest environmental burden. Consequently, this manuscript section explores several scenarios to mitigate the environmental impacts associated with CRP-30. Only the most essential impact categories (EC, CO2, NOx, SO2, CO, Hg, and Pb) were examined. Two possibilities were evaluated: reducing material hauling distances and including SCM as partial cement replacement.
In Figure 13, two scenarios for reducing material hauling distances (every 25 miles) are shown, namely: (a) decreasing the steel transport distance from 200 to 0 miles and (b) decreasing the cement transport distance from 100 to 0 miles. Meanwhile, Figure 14 exhibits decreasing from 100% to 0% for all the transport distances. Based on these analyses, the following findings were obtained:
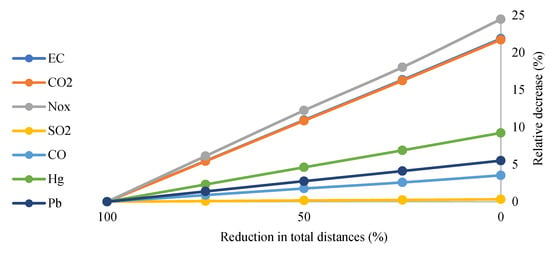
Figure 14.
Decreasing from 100 to 0% all transport distances for CRP-30.
- The steel haulage distance is negligible in contributing to the total environmental impact generated by CRP-30.
- The PC haulage distance generates a considerable environmental burden in the impact categories such as EC, CO2, NOx, and Hg. Hence, it is recommended to use nearby PC supply sources for pavement construction where large quantities of this binder (PC) are required.
- If haulage distances were reduced to zero, the environmental impacts of EC, CO2, and NOx could decrease by 20–25%.
In the previous analysis, it was found that PC generates a significant environmental impact. Notably, a typical way to reduce the environmental burden associated with PC is to replace it with SCMs [103,104]. The powdered residues from various industrial processes have a high value as SCM, even yielding mortars and concretes with better mechanical properties than traditional materials [90,105]. Some of the SCMs are blast furnace slag [106,107], coal bottom ash [108,109], and coal fly ash [110,111]. Blast furnace slag is a fine powder obtained from iron slag grinding that remains after casting a blast furnace into water or steam [112,113]. Coal bottom ash is a non-combustible residue that remains at the bottom of boilers, furnaces, or incinerators after industrial combustion [114,115]. Finally, coal fly ash is the primary residue produced in coal-fired plants; this product flies off with the flue gases and must be trapped by some particle filtration mechanism [116,117].
The previous SCM substances were evaluated as an option to reduce the environmental impacts of CRP-30. Due to its nature of being a waste material, it was considered that the transport distance of these cementitious materials to the concrete plant is equal to zero. In addition, it was decided to use typical densities of these products, namely 2900 kg/m3 for blast furnace slag [106], 2810 kg/m3 for coal bottom ash [117], and 2550 kg/m3 for coal fly ash [118]. For each SCM, partial cement replacements from 5% to 30% were evaluated (analysis points were every 5%). This analysis was carried out under five impact categories: EC, CO2, NOx, PM10, and HGW. The estimates for the three materials under evaluation gave remarkably similar results (i.e., differences among them were less than 3%). Therefore, it was preferred to only plot the data of one of them, the coal fly ash. The corresponding results are shown in Figure 15 and suggest the following:
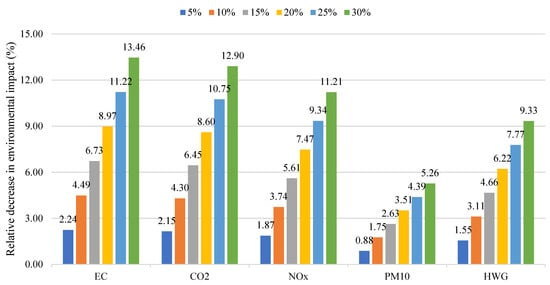
Figure 15.
Environmental benefits caused by the replacement of cement with coal fly ash.
- Replacements in low quantities (up to 15%) fail to generate significant environmental benefits.
- Replacements in high quantities (greater than or equal to 20%) achieved considerable environmental benefits in the impact categories such as EC, CO2, and NOx. However, the reductions in the environmental impact of PM10 and HWG were insignificant.
5. Conclusions
An environmental analysis based on LCAs was conducted using the Texas PP structures as the case study to evaluate the potential environmental benefits generated by perpetual pavements. Two conventional structures (CRP-30 and CFP-30) and three PP structures (namely PP-30, PP-40, and PP-70) were evaluated using the PaLATE tool. Based on the research effort carried out, the following conclusions were drawn:
- In the case of CFP-30, most of the environmental impacts are generated by M&R activities. By contrast, most of the environmental burden occurred during the initial construction stage for CRP-30 and PP-30.
- For the impact categories aldehydes and benzo[a]pyrene, the total contribution to environmental impact is caused by the materials transportation stage. Nonetheless, for the other impact categories, the main contributor was the production of the materials, followed by the transportation of the materials, and the minor contributor was the materials processing stage.
- Water consumption, carbon dioxide emissions, nitrogen oxide emissions, carbon monoxide emissions, lead emissions, aldehydes generated, and benzo[a]pyrene were the impact categories in which the environmental benefits generated by the selection of PP over conventional pavement alternatives are most noticeable.
- In general terms, CRP-30 was the pavement alternative that generated the highest environmental impacts, followed by the CFP-30 alternative. Otherwise, PP-30 was the pavement alternative that produced the most negligible impact on the environment.
- As design traffic increases, the relative environmental impacts decrease. Therefore, one approach to maximize the environmental benefits of implementing PP structures is using them on highly trafficked highways.
- Binders were the main contributors to energy consumption and the CO2 emission into the atmosphere and one of the most prominent generators of nitrogen oxides and heavy metals.
- The partial replacement of PC by SCMs (such as blast furnace slag, coal bottom ash, and coal fly ash) can cause significant reductions in the environmental impacts generated by conventional rigid pavements (especially concerning energy consumption, CO2 emissions, and NOx emissions).
- In conjunction with some studies reported in the literature, the work contained in this paper demonstrated that PP structures could be more competitive than conventional pavements in terms of environmental efficiency.
Overall, while likely results were obtained, it is evident that the environmental benefits generated by implementing PP structures still need to be studied in more detail, along with varying variables such as construction materials and climatic conditions, among other variables. Nonetheless, although limited to the specific materials, traffic loading, and pavement structures evaluated, this research contributes to the literature’s enrichment by providing a datum reference for assessing and quantifying the environmental benefits of PP structures. Consequently, the results of this case study can be used in future investigations as a reference point to delve into various aspects, for instance, the influence reached by other computational tools, impact assessment methodologies, or approaches to define the system boundaries.
Author Contributions
Conceptualization, G.M.-A. and R.P.-M.; methodology, R.P.-M.; software, R.P.-M.; validation, L.F.W., S.I.-L. and L.F.; formal analysis, R.P.-M.; investigation, R.P.-M.; resources, L.F.W.; data curation, G.M.-A.; writing—original draft preparation, R.P.-M.; writing—review and editing, L.F.W.; visualization, S.I.-L.; supervision, L.F.; project administration, L.F.W.; funding acquisition, L.F.W. All authors have read and agreed to the published version of the manuscript.
Funding
This research received no external funding.
Informed Consent Statement
Not applicable.
Data Availability Statement
Not applicable.
Acknowledgments
The authors thank the Texas Department of Transportation (TxDOT) and the Federal Highway Administration (FHWA) for their invaluable support, in particular for providing the Texas PP database, which served as the primary data source to carry out this research effort.
Conflicts of Interest
The authors declare no conflict of interest. The funders had no role in the design of the study; in the collection, analyses, or interpretation of data; in the writing of the manuscript or in the decision to publish the results.
References
- Newcomb, D.; Willis, R.; Timm, D. Perpetual Asphalt Pavements: A Synthesis; Asphalt Pavement Association: Lanham, MD, USA, 2002; pp. 3–36. [Google Scholar]
- Newcomb, D.; Buncher, M.; Huddleston, I. Concepts of Perpetual Pavements. Transp. Res. Circ. 503 Perpetual Bitum. Pavements 2001, 503, 4–11. [Google Scholar]
- Sultan, S.A.; Guo, Z. Evaluating life cycle costs of perpetual pavements in China using operational pavement management system. Int. J. Transp. Sci. Technol. 2016, 5, 103–109. [Google Scholar] [CrossRef]
- El-Hakim, M.Y.; Tighe, S.L. Sustainability of Perpetual Pavement Designs: Canadian Perspective. Transp. Res. Rec. J. Transp. Res. Board 2012, 2304, 10–16. [Google Scholar] [CrossRef]
- Walubita, L.F.; Scullion, T. Texas Perpetual Pavements—New Design Guidelines; Texas Transportation Institute: College Station, TX, USA, 2010. [Google Scholar]
- Lee, S.I.; Walubita, L.F.; Hu, S.; Scullion, T. Sustainable Perpetual Asphalt Pavements and Comparative Analysis of Lifecycle Cost to Traditional 20-Year Pavement Design; Technical Report 0-6856-1; Texas Transportation Institute: College Station, TX, USA, 2018. [Google Scholar]
- Jitsangiam, P.; Nikraz, H.; Leek, C. Development of Hot-Mix Asphalt Layer Thickness Design for Longer-Life Asphalt Pavements. In Proceedings of the 6th PATREC Research Forum, Perth, WA, USA, 28 September 2010. [Google Scholar]
- Amini, A.A.; Mashayekhi, M.; Ziari, H.; Nobakht, S. Life cycle cost comparison of highways with perpetual and conventional pavements. Int. J. Pavement Eng. 2012, 13, 553–568. [Google Scholar] [CrossRef]
- Lee, S.I.; Carrasco, G.; Mahmoud, E.; Walubita, L.F. Alternative Structure and Material Designs for Cost-Effective Perpetual Pavements in Texas. J. Transp. Eng. Part B Pavements 2020, 146, 04020071. [Google Scholar] [CrossRef]
- Hu, S.; Lee, S.-I.; Walubita, L.F.; Zhou, F.; Scullion, T. Incorporation of Endurance Limit in the Mechanistic-Empirical Flexible Perpetual Pavement Design. Transp. Res. Rec. J. Transp. Res. Board 2018, 2672, 108–121. [Google Scholar] [CrossRef]
- Zhu, Y.; Ni, F. Research of Different Perpetual Pavement Structures Based on Performance Comparison and LCCA in Jiangsu Province, China. In Proceedings of the Airfield and Highway Pavements, Miami, FL, USA, 7–10 June 2015; pp. 640–651. [Google Scholar]
- Walubita, L.F.; Liu, W.; Scullion, T. The Texas Perpetual Pavements: Experience Overview and the Way Forward; Technical Report 0-4822-3; Texas Transportation Institute: College Station, TX, USA, 2010. [Google Scholar]
- Schlegel, T.; Puiatti, D.; Ritter, H.-J.; Lesueur, D.; Denayer, C.; Shtiza, A. The limits of partial life cycle assessment studies in road construction practices: A case study on the use of hydrated lime in Hot Mix Asphalt. Transp. Res. Part D Transp. Environ. 2016, 48, 141–160. [Google Scholar] [CrossRef]
- Flintsch, G.; Meijer, J.; Smith, K. Improved Asphalt Pavement Sustainability Through Perpetual Pavement Design; FHWA-HIF-19-080; Federal Highway Administration: Washington, DC, USA, 2020. [Google Scholar]
- Uzarowski, L.; Moore, G. Sustainable Pavements—Making the Case for Longer Design Lives for Flexible Pavements. In Proceedings of the Annual Conference of the Transportation Association of Canada, Toronto, ON, Canada, 21–24 September 2008. [Google Scholar]
- Walubita, L.F.; Lee, S.-I.; Faruk, A.; Scullion, T.; Nazarian, S.; Abdallah, I. Texas Flexible Pavements and Overlays: Year 5 Report—Complete Data Documentation; Technical Report 0-6658-3; Texas Transportation Institute: College Station, TX, USA, 2017. [Google Scholar]
- Walubita, L.F.; Scullion, T. FHWA/TX-07/0-4822-2: Perpetual Pavements in Texas—The Fort Worth SH 114 Project in Wise County; Texas Transportation Institute: College Station, TX, USA, 2007. [Google Scholar]
- Basu, C.; Das, A.; Thirumalasetty, P.; Das, T. Perpetual Pavement—A Boon for the Indian Roads. Proc. Soc. Behav. Sci. 2013, 104, 139–148. [Google Scholar] [CrossRef]
- Behbahani, H.; Khaki, A.M.; Amini, A.A. Assessment of Perpetual Pavement Performance Using Mechanistic-Empirical Pavement Design Guide (M-E PDG) and PerRoad Software Models. In Proceedings of the International Conference on Perpetual Pavement, Columbus, OH, USA, 30 September–2 October 2009; pp. 1–13. [Google Scholar]
- Cao, W.; Norouzi, A.; Kim, Y.R. Application of viscoelastic continuum damage approach to predict fatigue performance of Binzhou perpetual pavements. J. Traffic Transp. Eng. 2016, 3, 104–115. [Google Scholar] [CrossRef]
- Guo, Z.; Sultan, S.A. Feasibility of perpetual pavement stage construction in China: A life cycle cost analysis. Int. J. Transp. Sci. Technol. 2016, 5, 239–247. [Google Scholar] [CrossRef]
- Priyanka, B.; Sarang, G.; Shankar, A.R. Evaluation of Superpave mixtures for perpetual asphalt pavements. Road Mater. Pavement Des. 2018, 20, 1952–1965. [Google Scholar] [CrossRef]
- Sidess, A.; Uzan, J. A design method of perpetual flexible pavement in Israel. Int. J. Pavement Eng. 2009, 10, 241–249. [Google Scholar] [CrossRef]
- Tarefder, R.A.; Bateman, D. Design of Optimal Perpetual Pavement Structure. J. Transp. Eng. 2012, 138, 157–175. [Google Scholar] [CrossRef]
- Yang, Y.; Wei, J.; Lin, W.; Timm, D.; Huber, G. Binzhou Perpetual Pavement Test Road. Dynamic Response of Pavement under Very Heavy Loads. Road Mater. Pavement Des. 2009, 10, 151–165. [Google Scholar] [CrossRef]
- ISO 14040; Environmental Management—Life Cycle Assessment—Principles and Framework. ISO: Geneva, Switzerland, 2006.
- ISO 14044; Environmental Management—Life Cycle Assessment—Requirements and Guidelines. ISO: Geneva, Switzerland, 2006.
- AzariJafari, H.; Yahia, A.; Ben Amor, M. Life cycle assessment of pavements: Reviewing research challenges and opportunities. J. Clean. Prod. 2016, 112, 2187–2197. [Google Scholar] [CrossRef]
- Chester, M.V.; Liban, C.B. Environmental Lifecycle Assessment of Public Transit in Los Angeles. In Engineering for Sustainable Communities: Principles and Practices; ASCE: Reston, VA, USA, 2017; pp. 349–356. ISBN 9780784480755. [Google Scholar]
- Polo-Mendoza, R.; Peñabaena-Niebles, R.; Giustozzi, F.; Martinez-Arguelles, G. Eco-friendly design of Warm mix asphalt (WMA) with recycled concrete aggregate (RCA): A case study from a developing country. Constr. Build. Mater. 2022, 326, 126890. [Google Scholar] [CrossRef]
- Mattinzioli, T.; Sol-Sanchez, M.; Moreno-Navarro, F.; Rubio-Gamez, M.; Martinez, G. Benchmarking the embodied environmental impacts of the design parameters for asphalt mixtures. Sustain. Mater. Technol. 2022, 32, e00395. [Google Scholar] [CrossRef]
- Hou, Y.; Qian, X.; Zhang, R.; Gu, F.; Feng, P. Study on an Integrated LCA-LCC Model for Assessment of Highway Engineering Technical Schemes. Buildings 2022, 12, 1050. [Google Scholar] [CrossRef]
- Herrmann, I.T.; Moltesen, A. Does it matter which Life Cycle Assessment (LCA) tool you choose?—A comparative assessment of SimaPro and GaBi. J. Clean. Prod. 2015, 86, 163–169. [Google Scholar] [CrossRef]
- Vidergar, P.; Perc, M.; Lukman, R.K. A survey of the life cycle assessment of food supply chains. J. Clean. Prod. 2020, 286, 125506. [Google Scholar] [CrossRef]
- Silva, D.A.; Nunes, A.O.; Piekarski, C.M.; da Silva Moris, V.A.; de Souza, L.S.M.; Rodrigues, T.O. Why using different Life Cycle Assessment software tools can generate different results for the same product system? A cause-effect analysis of the problem. Sustain. Prod. Consum. 2019, 20, 304–315. [Google Scholar] [CrossRef]
- Santos, J.; Thyagarajan, S.; Keijzer, E.; Flores, R.; Flintsch, G. Pavement life cycle assessment: A comparison of American and European tools. In Proceedings of the Pavement Life-Cycle Assessment Symposium, Champaign, IL, USA, 12–13 April 2017; pp. 1–10. [Google Scholar] [CrossRef]
- Santos, J.; Thyagarajan, S.; Keijzer, E.; Flores, R.; Flintsch, G. Comparison of Life Cycle Assessment Tools for Road Pavement Infraestructure. In Proceedings of the Transportation Research Board (TRB) 96th Annual Meeting, Washington, DC, USA, 8–12 January 2017; pp. 28–38. [Google Scholar]
- Yarramsetty, S.; Sivakumar, M.; Raj, A. Recent Developments in Life Cycle Assessment and Service Life Prediction: A Review. In Proceedings of the Urbanization Challenges in Emerging Economies—ASCE India Conference, New Delhi, India, 12–14 December 2017; pp. 509–520. [Google Scholar]
- Asres, E.; Ghebrab, T.; Ekwaro-Osire, S. Framework for Design of Sustainable Flexible Pavement. Infrastructures 2021, 7, 6. [Google Scholar] [CrossRef]
- Bloom, E.F.; Del Ponte, K.; Natarajan, B.M.; Ahlman, A.P.; Edil, T.B.; Whited, G. State DOT Life Cycle Benefits of Recycled Material in Road Construction. In Proceedings of the Geo-Chicago, Chicago, IL, USA, 14–18 August 2016; pp. 693–703. [Google Scholar]
- Subedi, S.; Hassan, M.M.; Nie, Q.; Soliman, N.S.T.; Gaspard, K.; Rupnow, T. Decision-Making Tool for Incorporating Cradle-to-Gate Sustainability Measures into Pavement Design. J. Transp. Eng. Part B Pavements 2018, 144, 04018051. [Google Scholar] [CrossRef]
- Melanta, S.; Miller-Hooks, E.; Avetisyan, H.G. Carbon Footprint Estimation Tool for Transportation Construction Projects. J. Constr. Eng. Manag. 2013, 139, 547–555. [Google Scholar] [CrossRef]
- Torres-Machi, C.; Nasir, F.; Achebe, J.; Saari, R.; Tighe, S.L. Sustainability Evaluation of Pavement Technologies through Multicriteria Decision Techniques. J. Infrastruct. Syst. 2019, 25, 04019023. [Google Scholar] [CrossRef]
- Mauro, R.; Guerrieri, M. Comparative life-cycle assessment of conventional (double lane) and non-conventional (turbo and flower) roundabout intersections. Transp. Res. Part D Transp. Environ. 2016, 48, 96–111. [Google Scholar] [CrossRef]
- Zhang, W.; Yang, J.; Fan, X.; Yang, R.; Yu, B. Life-Cycle Cost Analysis of Base Course Using Cold In-Place Recycling: Case Study. In Proceedings of the Geo-Frontiers, Dallas, TX, USA, 13–16 March 2011; pp. 4428–4437. [Google Scholar]
- Saeedzadeh, R.; Romanoschi, S.A.; Akbariyeh, N.; Khajeh-Hosseini, M.; Abdullah, A.Q. Sustainability Assessment of Recycled Asphalt Mixtures Based on Performance in Full-Scale Testing. J. Transp. Eng. Part B Pavements 2018, 144, 04018024. [Google Scholar] [CrossRef]
- Bloom, E.F.; Horstmeier, G.J.; Ahlman, A.P.; Edil, T.B.; Whited, G. Assessing the Life Cycle Benefits of Recycled Material in Road Construction. In Proceedings of the Geo-Chicago 2016, Chicago, IL, USA, 14–18 August 2016; pp. 613–622. [Google Scholar]
- Lee, J.; Edil, T.B.; Benson, C.H.; Tinjum, J.M. Building Environmentally and Economically Sustainable Transportation Infrastructure: Green Highway Rating System. J. Constr. Eng. Manag. 2013, 139, A4013006. [Google Scholar] [CrossRef]
- Lee, J.; Edil, T.; Benson, C.; Tinjum, J. Use of BE2ST In-Highways for Green Highway Construction Rating in Wisconsin. In Proceedings of the Green Streets and Highways 2010, Denver, CO, USA, 14–17 November 2010; pp. 480–494. [Google Scholar]
- Gadsby, A.; Tsai, J. Environmental impact comparison of new micro-milling and thin overlay and conventional milling for sustainable pavement preservation. Int. J. Pavement Res. Technol. 2020, 14, 23–29. [Google Scholar] [CrossRef]
- Harvey, J.T.; Meijer, J.; Ozer, H.; Al-Qadi, I.; Saboori, A.; Kendall, A. Pavement Life Cycle Assessment Framework; FHWA-HIF-1, 1–246; Federal Highway Administration: Washington, DC, USA, 2016. [Google Scholar]
- Vega, D.; Martinez-Arguelles, G.; Santos, J. Life Cycle Assessment of Warm Mix Asphalt with Recycled Concrete Aggregate. IOP Conf. Ser. Mater. Sci. Eng. 2019, 603, 052016. [Google Scholar] [CrossRef]
- Walubita, L.F.; Hassan, R.; Lee, S.-I.; Faruk, A.; Flores, M.; Scullion, T.; Abdallah, I.; Nazarian, S. Data Collection and Population of the Database (The DSS and RDSSP); Texas Transportation Institute: College Station, TX, USA, 2014. [Google Scholar]
- Mashaan, N.S.; Ali, A.H.; Koting, S.; Karim, M.R. Performance Evaluation of Crumb Rubber Modified Stone Mastic Asphalt Pavement in Malaysia. Adv. Mater. Sci. Eng. 2013, 2013, 304676. [Google Scholar] [CrossRef]
- Eskandarsefat, S.; Dondi, G.; Sangiorgi, C. Recycled and rubberized SMA modified mixtures: A comparison between polymer modified bitumen and modified fibres. Constr. Build. Mater. 2019, 202, 681–691. [Google Scholar] [CrossRef]
- Chelovian, A.; Shafabakhsh, G. Laboratory evaluation of Nano Al2O3 effect on dynamic performance of stone mastic asphalt. Int. J. Pavement Res. Technol. 2017, 10, 131–138. [Google Scholar] [CrossRef]
- Yadykina, V.V.; Tobolenko, S.; Trautvain, A.I.; Zhukova, A. The Influence of Stabilizing Additives on Physical and Mechanical Properties of Stone Mastic Asphalt Concrete. Proc. Eng. 2015, 117, 376–381. [Google Scholar] [CrossRef][Green Version]
- Fernandes, S.R.; Silva, H.M.; Oliveira, J.R. Carbon dioxide emissions and heavy metal contamination analysis of stone mastic asphalt mixtures produced with high rates of different waste materials. J. Clean. Prod. 2019, 226, 463–470. [Google Scholar] [CrossRef]
- Dong, Y.M.; Tan, Y.Q. Laboratory Evaluation on Performance of Crumb Rubber SMA. Adv. Mater. Res. 2010, 168-170, 1749–1755. [Google Scholar] [CrossRef]
- Ameli, A.; Maher, J.; Mosavi, A.; Nabipour, N.; Babagoli, R.; Norouzi, N. Performance evaluation of binders and Stone Matrix Asphalt (SMA) mixtures modified by Ground Tire Rubber (GTR), waste Polyethylene Terephthalate (PET) and Anti Stripping Agents (ASAs). Constr. Build. Mater. 2020, 251, 118932. [Google Scholar] [CrossRef]
- Ziari, H.; Divandari, H.; Akbar, S.M.S.A.; Hosseinian, S.M. Investigation of the Effect of Crumb Rubber Powder and Warm Additives on Moisture Resistance of SMA Mixtures. Adv. Civ. Eng. 2021, 2021, 6653594. [Google Scholar] [CrossRef]
- Chissama, K.S.; Picado-Santos, L.G. Assessment of crumb rubber Stone Mastic asphalt potential to be used in Angola. Case Stud. Constr. Mater. 2021, 15, e00598. [Google Scholar] [CrossRef]
- Sangiorgi, C.; Tataranni, P.; Simone, A.; Vignali, V.; Lantieri, C.; Dondi, G. Stone mastic asphalt (SMA) with crumb rubber according to a new dry-hybrid technology: A laboratory and trial field evaluation. Constr. Build. Mater. 2018, 182, 200–209. [Google Scholar] [CrossRef]
- Hamdar, Y.S.; Kassem, H.A.; Chehab, G.R. Using different performance measures for the sustainability assessment of asphalt mixtures: Case of warm mix asphalt in a hot climate. Road Mater. Pavement Des. 2018, 21, 1–24. [Google Scholar] [CrossRef]
- Nathman, R.; McNeil, S.; van Dam, T.J. Integrating Environmental Perspectives into Pavement Management. Transp. Res. Rec. J. Transp. Res. Board 2009, 2093, 40–49. [Google Scholar] [CrossRef]
- Cross, S.A.; Chesner, W.H.; Justus, H.G.; Kearney, E.R. Life-Cycle Environmental Analysis for Evaluation of Pavement Rehabilitation Options. Transp. Res. Rec. J. Transp. Res. Board 2011, 2227, 43–52. [Google Scholar] [CrossRef]
- Hong, F.; Prozzi, J.A. Evaluation of recycled asphalt pavement using economic, environmental, and energy metrics based on long-term pavement performance sections. Road Mater. Pavement Des. 2017, 19, 1816–1831. [Google Scholar] [CrossRef]
- Georgiou, P.; Loizos, A. Environmental assessment of warm mix asphalt incorporating steel slag and high reclaimed asphalt for wearing courses: A case study. Road Mater. Pavement Des. 2021, 22, S662–S671. [Google Scholar] [CrossRef]
- Del Ponte, K.; Natarajan, B.M.; Ahlman, A.P.; Baker, A.; Elliott, E.; Edil, T.B. Life-Cycle Benefits of Recycled Material in Highway Construction. Transp. Res. Rec. J. Transp. Res. Board 2017, 2628, 1–11. [Google Scholar] [CrossRef]
- Nathman, R. PaLATE User Guide, Example Exercise, and Contextual Discussion. Master Thesis, University of Delaware, Newark, DE, USA, 2008. [Google Scholar]
- Horvath, A. PaLATE User Manual: Pavement Life-Cycle Assessment Tool for Environmental and Economic Effects. Available online: http://faculty.ce.berkeley.edu/horvath/palate.html (accessed on 25 November 2021).
- Ibrahim, A.; Yaser, A.Z. Colour removal from biologically treated landfill leachate with tannin-based coagulant. J. Environ. Chem. Eng. 2019, 7, 103483. [Google Scholar] [CrossRef]
- Ahmed, F.N.; Lan, C.Q. Treatment of landfill leachate using membrane bioreactors: A review. Desalination 2012, 287, 41–54. [Google Scholar] [CrossRef]
- Abunama, T.; Othman, F.; Seyam, M.; Moodley, T.; Kumari, S.; Bux, F. Proposed formulations for error reduction in leachate pollution index (LPI) estimation due to the absence of leachate parameters. Environ. Technol. Innov. 2021, 23, 101623. [Google Scholar] [CrossRef]
- Souza, R.; Rosenhead, J.; Salhofer, S.; Valle, R.; Lins, M. Definition of sustainability impact categories based on stakeholder perspectives. J. Clean. Prod. 2015, 105, 41–51. [Google Scholar] [CrossRef]
- McClelland, S.; Arndt, C.; Gordon, D.; Thoma, G. Type and number of environmental impact categories used in livestock life cycle assessment: A systematic review. Livest. Sci. 2018, 209, 39–45. [Google Scholar] [CrossRef]
- Esnouf, A.; Heijungs, R.; Coste, G.; Latrille, É.; Steyer, J.-P.; Hélias, A. A tool to guide the selection of impact categories for LCA studies by using the representativeness index. Sci. Total Environ. 2018, 658, 768–776. [Google Scholar] [CrossRef] [PubMed]
- Flanagan, A.; Priyadarshini, A. A study of consumer behaviour towards food-waste in Ireland: Attitudes, quantities and global warming potentials. J. Environ. Manag. 2021, 284, 112046. [Google Scholar] [CrossRef] [PubMed]
- Greene, J.M.; Gulden, J.; Wood, G.; Huesemann, M.; Quinn, J.C. Techno-economic analysis and global warming potential of a novel offshore macroalgae biorefinery. Algal Res. 2020, 51, 102032. [Google Scholar] [CrossRef]
- Yang, W.; Yang, M.; Wen, H.; Jiao, Y. Global Warming Potential of CH4 uptake and N2O emissions in saline–alkaline soils. Atmos. Environ. 2018, 191, 172–180. [Google Scholar] [CrossRef]
- Geng, P.; Tan, Q.; Zhang, C.; Wei, L.; He, X.; Cao, E.; Jiang, K. Experimental investigation on NOx and green house gas emissions from a marine auxiliary diesel engine using ultralow sulfur light fuel. Sci. Total Environ. 2016, 572, 467–475. [Google Scholar] [CrossRef]
- Price, C.G. Lightning Applications in Weather and Climate Research. Surv. Geophys. 2013, 34, 755–767. [Google Scholar] [CrossRef]
- Thurston, G.D. Outdoor Air Pollution: Sources, Atmospheric Transport, and Human Health Effects. In International Encyclopedia of Public Health; Elsevier Science & Technology: Amsterdam, The Netherlands, 2016; Volume 5. [Google Scholar]
- Xu, Q.; Shen, M.; Shi, K.; Liu, Z.; Feng, J.; Xiong, Y.; Liu, L.; Wang, J.; Han, J.; Tang, Z.; et al. Influence of jet angle on diffusion combustion characteristics and NOx emissions in a self-reflux burner. Case Stud. Therm. Eng. 2021, 25, 100953. [Google Scholar] [CrossRef]
- Wang, Y.; Li, J.; Huang, S.; Huang, X.; Hu, W.; Pu, J.; Xu, M. Evaluation of NOx removal from flue gas and Fe(II)EDTA regeneration using a novel BTF–ABR integrated system. J. Hazard. Mater. 2021, 415, 125741. [Google Scholar] [CrossRef]
- Orooji, Y.; Javadi, M.; Karimi-Maleh, H.; Aghaie, A.Z.; Shayan, K.; Sanati, A.L.; Darabi, R. Numerical and experimental investigation of natural gas injection effects on NOx reburning at the rotary cement kiln exhaust. Process Saf. Environ. Prot. 2021, 151, 290–298. [Google Scholar] [CrossRef]
- Lee, Y.; Lee, S.; Lee, S.; Choi, H.; Min, K. Characteristics of NOx emission of light-duty diesel vehicle with LNT and SCR system by season and RDE phase. Sci. Total Environ. 2021, 782, 146750. [Google Scholar] [CrossRef] [PubMed]
- Plati, C. Sustainability factors in pavement materials, design, and preservation strategies: A literature review. Constr. Build. Mater. 2019, 211, 539–555. [Google Scholar] [CrossRef]
- Sanchez-Cotte, E.H.; Fuentes, L.; Martinez-Arguelles, G.; Quintana, H.A.R.; Walubita, L.F.; Cantero-Durango, J.M. Influence of recycled concrete aggregates from different sources in hot mix asphalt design. Constr. Build. Mater. 2020, 259, 120427. [Google Scholar] [CrossRef]
- De Paiva, F.F.G.; Tamashiro, J.R.; Silva, L.H.P.; Kinoshita, A. Utilization of inorganic solid wastes in cementitious materials—A systematic literature review. Constr. Build. Mater. 2021, 285, 122833. [Google Scholar] [CrossRef]
- Zhang, J.; Simate, G.S.; Hu, X.; Souliman, M.; Walubita, L.F. Impact of recycled asphalt materials on asphalt binder properties and rutting and cracking performance of plant-produced mixtures. Constr. Build. Mater. 2017, 155, 654–663. [Google Scholar] [CrossRef]
- Clavreul, J.; Guyonnet, D.; Christensen, T.H. Quantifying uncertainty in LCA-modelling of waste management systems. Waste Manag. 2012, 32, 2482–2495. [Google Scholar] [CrossRef] [PubMed]
- Veja, A.D.L.; Santos, J.; Martinez-Arguelles, G. Life cycle assessment of hot mix asphalt with recycled concrete aggregates for road pavements construction. Int. J. Pavement Eng. 2022, 23, 923–936. [Google Scholar] [CrossRef]
- Tariq, A.; Yanful, E.K. A review of binders used in cemented paste tailings for underground and surface disposal practices. J. Environ. Manag. 2013, 131, 138–149. [Google Scholar] [CrossRef]
- Bumanis, G.; Vitola, L.; Pundiene, I.; Sinka, M.; Bajare, D. Gypsum, Geopolymers, and Starch—Alternative Binders for Bio-based Building Materials: A Review and Life-Cycle Assessment. Sustainability 2020, 12, 5666. [Google Scholar] [CrossRef]
- Polo-Mendoza, R.; Martinez-Arguelles, G.; Peñabaena-Niebles, R. A multi-objective optimization based on genetic algorithms for the sustainable design of Warm Mix Asphalt (WMA). Int. J. Pavement Eng. 2022, 1–21. [Google Scholar] [CrossRef]
- Zhang, G.; Sun, Y.; Xu, Y. Review of briquette binders and briquetting mechanism. Renew. Sustain. Energy Rev. 2018, 82, 477–487. [Google Scholar] [CrossRef]
- Bebeteidoh, O.L.; Kometa, S.; Pazouki, K.; Norman, R. Sustained impact of the activities of local crude oil refiners on their host communities in Nigeria. Heliyon 2020, 6, e04000. [Google Scholar] [CrossRef] [PubMed]
- Naqi, A.; Jang, J.G. Recent Progress in Green Cement Technology Utilizing Low-Carbon Emission Fuels and Raw Materials: A Review. Sustainability 2019, 11, 537. [Google Scholar] [CrossRef]
- Zhang, C.-Y.; Han, R.; Yu, B.; Wei, Y.-M. Accounting process-related CO2 emissions from global cement production under Shared Socioeconomic Pathways. J. Clean. Prod. 2018, 184, 451–465. [Google Scholar] [CrossRef]
- Salas, D.A.; Ramirez, A.D.; Rodríguez, C.R.; Petroche, D.M.; Boero, A.J.; Duque-Rivera, J. Environmental impacts, life cycle assessment and potential improvement measures for cement production: A literature review. J. Clean. Prod. 2016, 113, 114–122. [Google Scholar] [CrossRef]
- Dunuweera, S.P.; Rajapakse, R.M.G. Cement Types, Composition, Uses and Advantages of Nanocement, Environmental Impact on Cement Production, and Possible Solutions. Adv. Mater. Sci. Eng. 2018, 2018, 4158682. [Google Scholar] [CrossRef]
- Duchesne, J. Alternative supplementary cementitious materials for sustainable concrete structures: A review on characterization and properties. Waste Biomass Valoriz. 2020, 12, 1219–1236. [Google Scholar] [CrossRef]
- Olafusi, O.S.; Sadiku, E.R.; Snyman, J.; Ndambuki, J.M.; Kupolati, W.K. Application of nanotechnology in concrete and supplementary cementitious materials: A review for sustainable construction. SN Appl. Sci. 2019, 1, 580. [Google Scholar] [CrossRef]
- Aprianti, E.; Shafigh, P.; Bahri, S.; Farahani, J.N. Supplementary cementitious materials origin from agricultural wastes—A review. Constr. Build. Mater. 2015, 74, 176–187. [Google Scholar] [CrossRef]
- Burciaga-Díaz, O.; Betancourt-Castillo, I. Characterization of novel blast-furnace slag cement pastes and mortars activated with a reactive mixture of MgO-NaOH. Cem. Concr. Res. 2018, 105, 54–63. [Google Scholar] [CrossRef]
- Cho, B.S.; Lee, H.H.; Choi, Y.C. Effects of aluminate rich slag on compressive strength, drying shrinkage and microstructure of blast furnace slag cement. Constr. Build. Mater. 2017, 140, 293–300. [Google Scholar] [CrossRef]
- Gooi, S.; Mousa, A.A.; Kong, D. A critical review and gap analysis on the use of coal bottom ash as a substitute constituent in concrete. J. Clean. Prod. 2020, 268, 121752. [Google Scholar] [CrossRef]
- Topçu, I.B.; Toprak, M.U.; Uygunoğlu, T. Durability and microstructure characteristics of alkali activated coal bottom ash geopolymer cement. J. Clean. Prod. 2014, 81, 211–217. [Google Scholar] [CrossRef]
- Coopamootoo, K.; Rughooputh, R. Effects of sulphate salts on concrete with untreated coal fly ash (CFA) as partial cement replacement. Struct. Surv. 2016, 34, 117–134. [Google Scholar] [CrossRef]
- Teixeira, E.R.; Camões, A.; Branco, F.G.; Aguiar, J.B.; Fangueiro, R. Recycling of biomass and coal fly ash as cement replacement material and its effect on hydration and carbonation of concrete. Waste Manag. 2019, 94, 39–48. [Google Scholar] [CrossRef]
- Sanjuán, M.Á.; Estévez, E.; Argiz, C.; del Barrio, D. Effect of curing time on granulated blast-furnace slag cement mortars carbonation. Cem. Concr. Compos. 2018, 90, 257–265. [Google Scholar] [CrossRef]
- Lafond, E.; Coumes, C.C.D.; Gauffinet, S.; Chartier, D.; Stefan, L.; Le Bescop, P. Solidification of ion exchange resins saturated with Na+ ions: Comparison of matrices based on Portland and blast furnace slag cement. J. Nucl. Mater. 2017, 483, 121–131. [Google Scholar] [CrossRef]
- Menéndez, E.; Álvaro, A.M.; Hernández, M.; Parra, J. New methodology for assessing the environmental burden of cement mortars with partial replacement of coal bottom ash and fly ash. J. Environ. Manag. 2014, 133, 275–283. [Google Scholar] [CrossRef]
- Argiz, C.; Sanjuán, M.; Menéndez, E. Coal Bottom Ash for Portland Cement Production. Adv. Mater. Sci. Eng. 2017, 2017, 6068286. [Google Scholar] [CrossRef]
- Tan, H.; Nie, K.; He, X.; Deng, X.; Zhang, X.; Su, Y.; Yang, J. Compressive strength and hydration of high-volume wet-grinded coal fly ash cementitious materials. Constr. Build. Mater. 2019, 206, 248–260. [Google Scholar] [CrossRef]
- Brake, N.A.; Oruji, S.; Haselbach, L. Increasing Compressive Strength of Recycled Aggregate Concrete Using High Fineness Bottom Ash Blended Cement. In Proceedings of the International Conference on Transportation and Development 2018, Pittsburgh, PA, USA, 15–18 July 2018. [Google Scholar] [CrossRef]
- Hwang, S.S.; Cortés, C.M.M. Properties of mortar and pervious concrete with co-utilization of coal fly ash and waste glass powder as partial cement replacements. Constr. Build. Mater. 2020, 270, 121415. [Google Scholar] [CrossRef]
Publisher’s Note: MDPI stays neutral with regard to jurisdictional claims in published maps and institutional affiliations. |
© 2022 by the authors. Licensee MDPI, Basel, Switzerland. This article is an open access article distributed under the terms and conditions of the Creative Commons Attribution (CC BY) license (https://creativecommons.org/licenses/by/4.0/).