Article

Examining the Provincial-Level Difference and Impact Factors of Urban Household Electricity Consumption in China—Based on the Extended STIRPAT Model

1
School of Civil Engineering, Chongqing University of Science and Technology, Chongqing 401331, China
2
School of Construction Management and Real Estate, Chongqing University, Chongqing 400045, China
3
School of Management, Xi’an University of Architecture and Technology, Xi’an 710055, China
*
Author to whom correspondence should be addressed.
Sustainability 2022, 14(16), 9960; https://doi.org/10.3390/su14169960
Submission received: 13 July 2022 / Revised: 7 August 2022 / Accepted: 9 August 2022 / Published: 11 August 2022

Abstract

:
With increasing urbanisation, urban household electricity consumption (UHEC) has become the most dynamic aspect of China’s energy growth. However, existing studies suffer from outdated data, a small scope, and a lack of research into new influencing factors. There are significant challenges to the promotion of urban household energy-efficiency strategies, which may arise from the intervention of several new inter-provincial differences and other influencing factors. To better understand the variability, volatility characteristics, and influencing factors of change in provincial UHEC, this study analyses and assesses the influencing factors based on an extended STIRPAT model of Chinese provincial panel data from 2005 to 2020. The findings revealed rapid increases in provincial urban household electricity consumption and significant provincial differences in UHEC in China stemming from variation in economic level and energy use. Urbanisation, income, the size of the older population, and area per capita contributed to household electricity consumption. Conversely, household size, heating days (HDD), and air conditioning dampened household electricity consumption. However, television and cooling days (CDD) did not accurately explain the variation in household electricity use in this study. Finally, this study suggests targeted policy recommendations that could promote the implementation of energy-efficiency strategies in Chinese urban households.

1. Introduction

Owing to rising living standards, population growth, rapid mobility, and industrialisation, the number of cities is expanding and China’s energy needs are increasing significantly [1]. In recent years, energy use in the household sector has increased dramatically, putting additional pressure on energy systems [2].
In China, the residential sector already significantly contributes to overall energy consumption, which is growing rapidly [3,4]. According to a report published by the Department of Energy Statistics (2021), 14.68% of the total final energy consumption in 2020 was used by this sector (Figure 1) (China Energy Statistics Yearbook (CESY) 2021). Recently, some new energy figures were released by the China Energy Bureau. In the first half of 2022, China’s total electricity consumption reached 4097.7 billion kWh, up 2.9% year-on-year. Urban and rural residential use accounted for 611.2 billion kWh, up 9.6% year-on-year. From Figure 1, we can see that household electricity consumption (HEC) is growing faster than industry and agriculture. Therefore, the residential sector has excellent potential in terms of energy saving and emission reduction and improving energy efficiency [5].
Some interesting research angles suggest that HEC impacts residents’ well-being [6]. Therefore, it is necessary to balance the needs of residents with efforts to save energy and reduce emissions. Further targeted policies and strategies are required for different households to improve energy efficiency and reduce electricity demand [7,8]. Provincial-level differences in HEC can provide implications for designing further policies and strategies. Some studies worth exploring in depth have examined provincial electricity consumption in terms of spill over effects on residential income [9], and rebound effects on electricity consumption [10] and temperature [11], but these studies may suffer from old data, a small scope, and a lack of research into new influencing factors. This study builds on previous research to provide a new exploration of UHEC variability using more recent data and additional influencing factors. The residential sector is considered to have the greatest potential for reducing energy consumption [12], which has been growing at an average annual rate of 8.54% over the last five years. At present, there is an urgent need to present a research framework to identify provincial-level differences in UHEC. Hence, this study intends to observe the changing trends and provincial differences in UHEC in China from the five indicators of total electricity consumption, electricity consumption per capita, electricity consumption per square metre, average annual growth rate, and electricity consumption per capita based on gross domestic product (GDP) per capita.
Previous studies have shown that HEC is related to various factors. In terms of economic income, Wang et al. [13] investigated the heterogeneity of household consumption data in Chongqing and found that households with higher incomes tended to consume more electricity. Adrienne’s [14] study showed that households’ reliance on electricity for space and some equipment decreased as income increased. From a sociodemographic perspective, Daniel’s [15] study demonstrated that high electricity consumption is significantly correlated with household members’ social status and occupational class. Other studies have found that home and appliance ownership affects household electricity consumption [16]. The architectural and geographic characteristics of the home also have an impact. Shen [7] used vector regression models to determine that both architectural and personality characteristics are associated with household energy efficiency. Jo [17] employed a weighted regression model for apartment buildings and found that homes have different electricity consumption levels in different locations. Indeed, environmental and climatic factors often play an essential role. Li [18] studied the different responses of households to climate change, with per capita and household electricity consumption increasing by 47% and 41%, respectively, when temperatures increase. Teresa [19] studied eight temperate countries and showed that climate-induced increases in air conditioning demand could increase energy poverty. In addition, energy costs affect household electricity consumption [20]; Du et al. [21] found that tiered tariffs affected approximately 20% of household electricity consumption. Furthermore, age structure and gender significantly impact HEC. Younger people in the household tend to have lower electricity consumption, which is related to their higher level of education and the idea of energy saving and environmental protection [22]. Parisa’s [23] study found that while female households tend to consume 3.4 times more electricity than male households, the effect of children’s electricity consumption was not significant.
The above studies demonstrate that research on the influences affecting UHEC regarding inter-provincial differences and individual evaluations is still somewhat lacking and stale; therefore, developing a practical approach to overcoming such problems in the current phase is an urgent task. The choice of the research level usually leads to the question of why investigations are conducted at the provincial level. The study of UHEC is essentially to achieve the dual carbon target of energy saving and emissions reduction at the national level. However, to better achieve targets, we need overall planning and control at the macro level (provincial level) so that we can develop more localised strategies under the framework of provincial planning. Accordingly, the above-mentioned provincial-level differences and impact factors should be evaluated based on specific HEC data at a quantitative analysis level to assist the Chinese government in formulating and implementing targeted goals and policies to improve China’s HEC strategy. Moreover, this approach promotes the HEC and sustainable development. Therefore, evaluating the impact factors affecting UHEC and conducting further analysis of the evaluation results are crucial and significant tasks.
Several excellent studies have enriched our understanding of HEC drivers. However, the current rapid growth in energy consumption in the provincial residential sector raises several concerns. At the same time, promotion of urban energy-efficiency strategies faces several challenges. We suspect that the previously outdated data and narrow scope of the study may be insufficient to effectively address these challenges and issues. Based on this, the authors propose that these challenges and difficulties may be due to the intervention of some temporarily unstudied provincial differences and influences.
The main work, innovations, and overall contributions of this study are as follows. First, the inter-provincial variability and volatility characteristics of UHEC were examined based on the most recent and reliable data (CEYB 2006–2021), which, in turn, led to the establishment of a validated evaluation method for exploring factors that influence UHEC, thus complementing previous studies in terms of data. Using the real, up-to-date data described above, a reasonable selection of influencing factors and the validated extended STIRPAT model, UHEC equations for panel data were established, which facilitated comparisons with other provincial studies and overcame the limited research scope of some past studies. Finally, a regression analysis of provincial panel data was conducted to investigate the influence of exogenous factors, such as human life and urban development planning on UHEC, to determine the influence weights of each influencing factor, and to propose targeted policy recommendations, which will, to some extent, facilitate the implementation of urban household energy-efficiency strategies in China.
The remainder of this paper is organised as follows. Section 2 introduces the theoretical background and the hypothesis framework. Section 3 presents the study’s research methodology. Section 4 and Section 5 discuss the results of provincial-level differences and data panel analysis during the period 2005–2020. Section 6 provides the conclusions and policy recommendations.

2. Theoretical Background

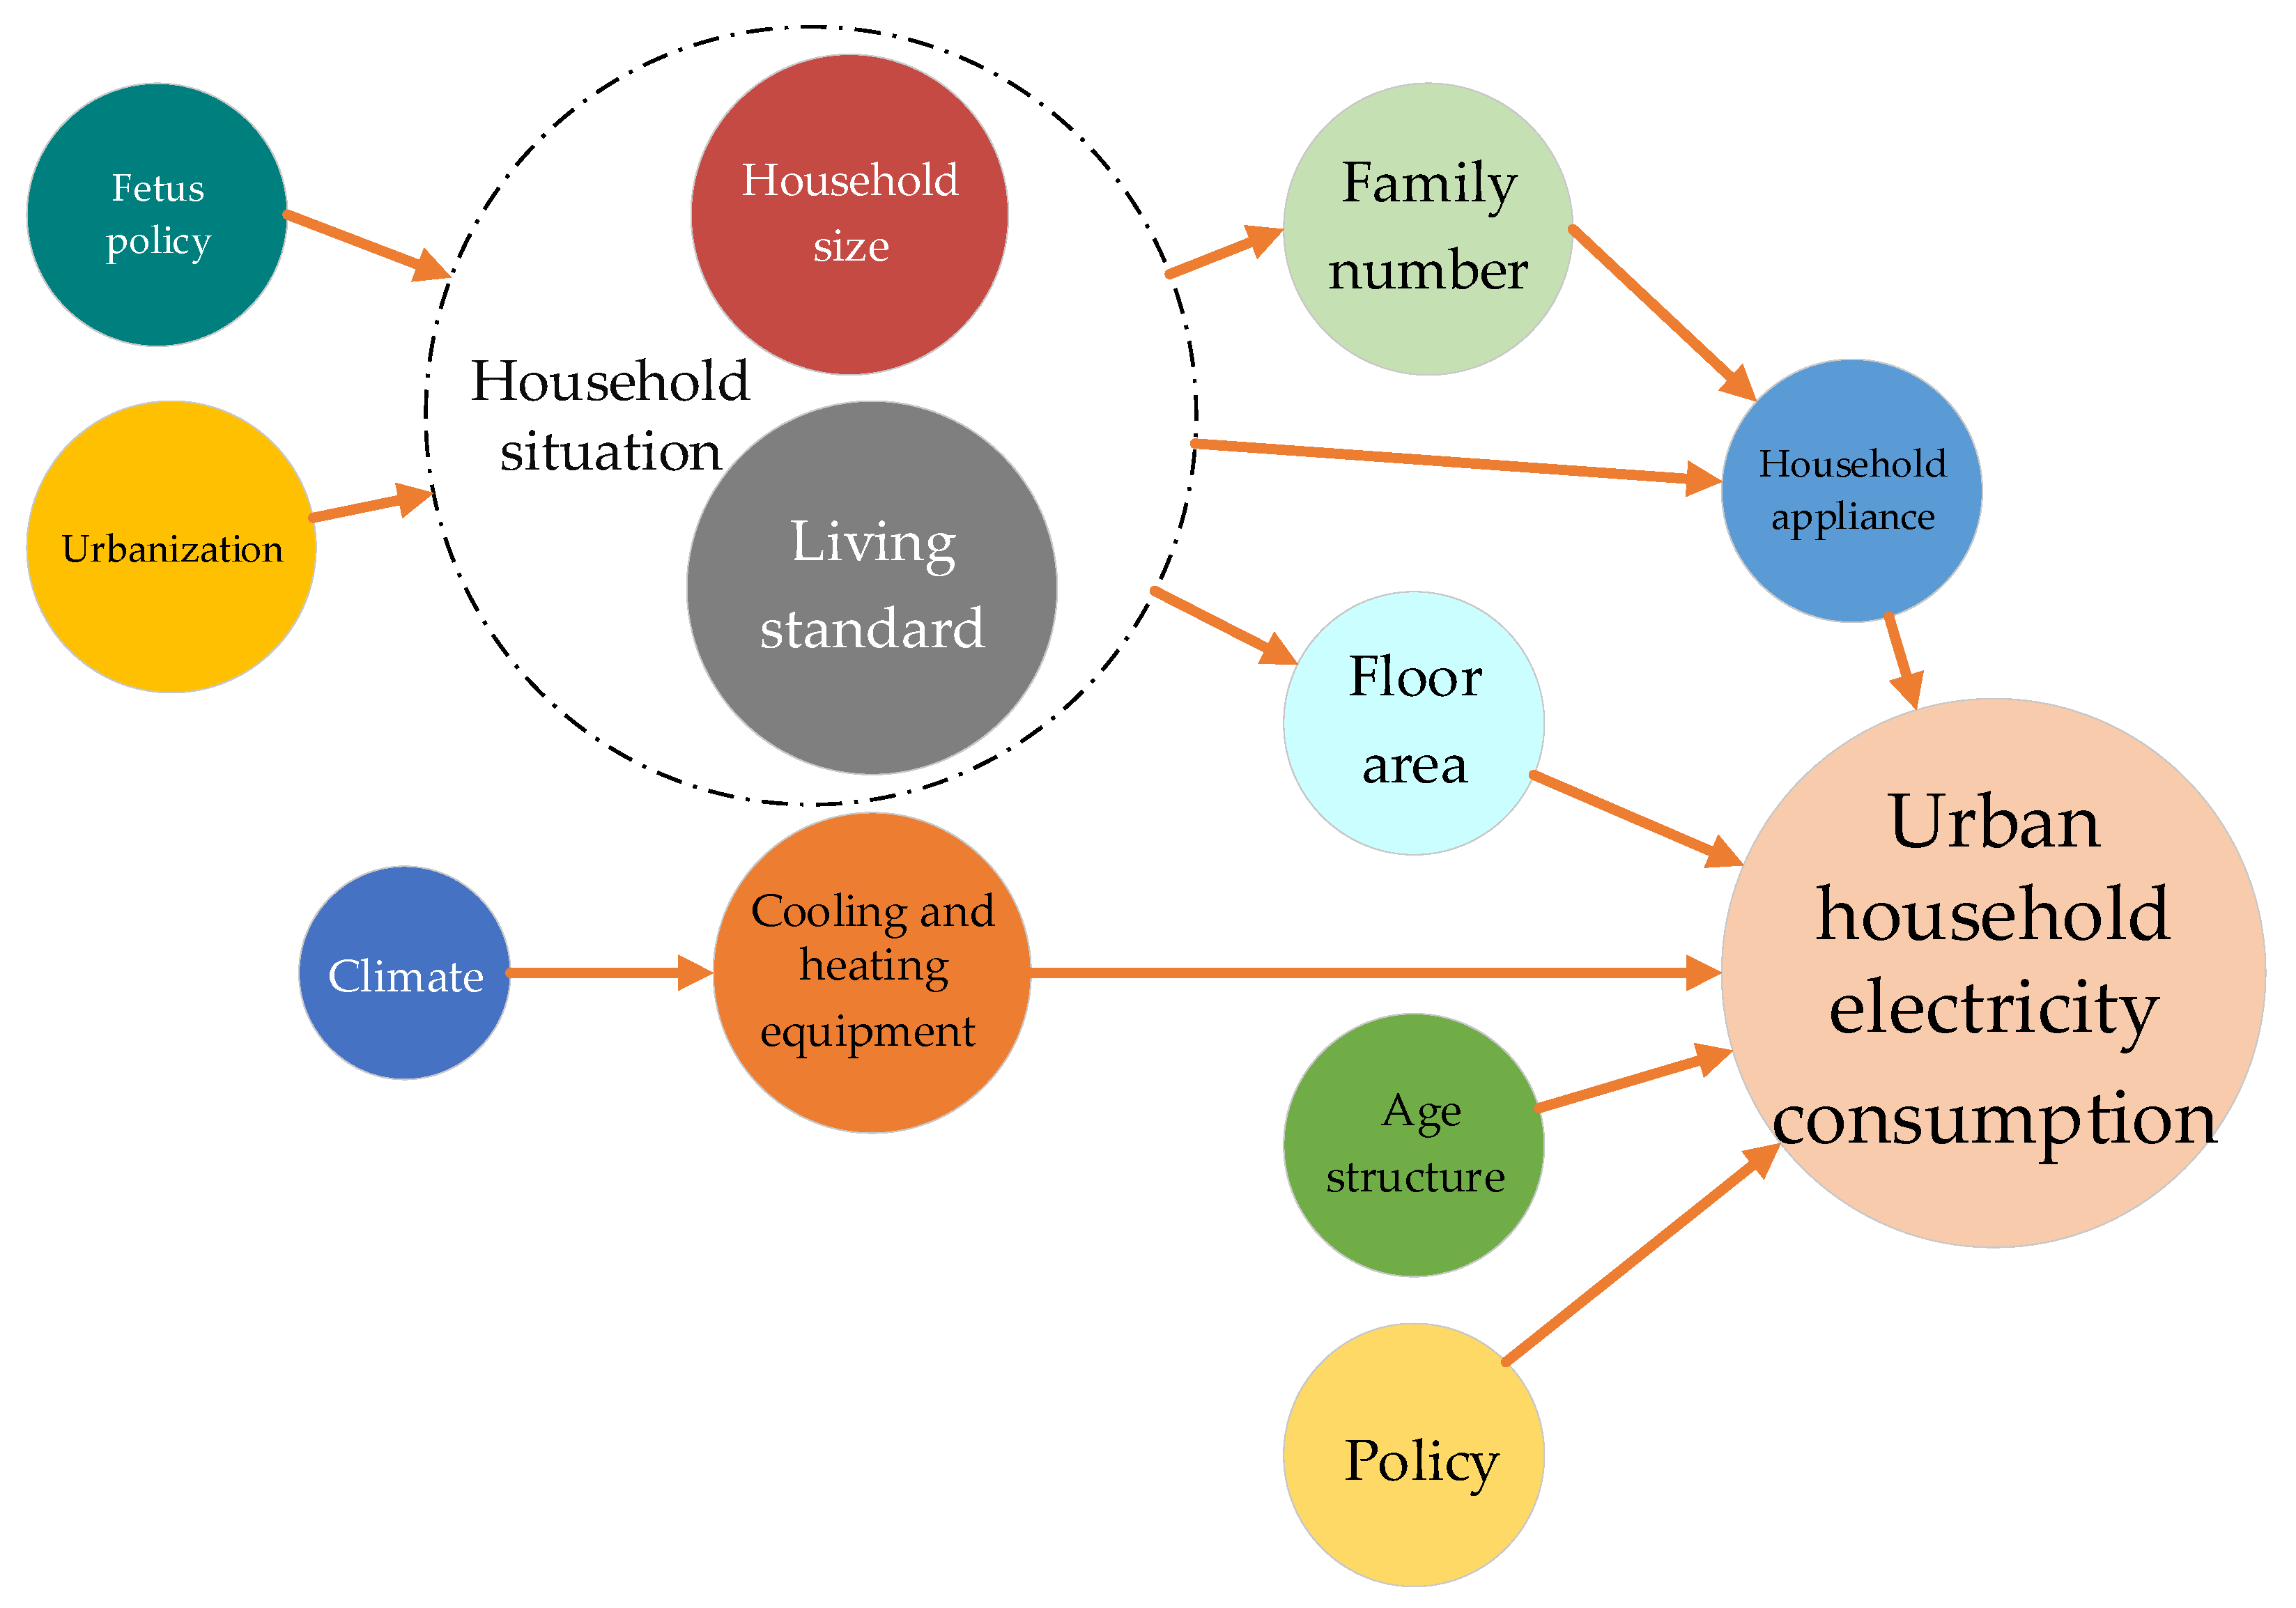
2.1. Theoretical Framework

Urbanisation in China entered a rapid growth stage from 2005 to 2020 after China’s reform and opening up. Electric energy, a symbol of industrial civilisation, plays an important role in modern life owing to its convenient usage, reasonable price, and low pollution. According to the National Bureau of Statistics of China, the HEC per capita in China increased from 220 kWh in 2005 to 808 kWh in 2020. Between 2005 and 2020, the growth rate was 267.27%, with an average annual growth rate of 9.06%.
The growth of urbanisation means improvements in living standards and increases in income, for which sustainable urban development requires correct and intelligent solutions [24]. As a result, the income elasticity of residential electricity consumption increases, as does the consumption level of domestic appliances and demand for residential electricity consumption [25]. Houses become bigger and domestic appliances become more luxurious, leading to increases in energy consumption when living standards improve [26]. Because of the high correlation between electric power and other asset specificities, for example, there is a 100% correlation between electric power and the use of air conditioners; the quantity of electric consumption correlates closely with the popularity and frequency of domestic appliance use. Thus, residential electricity consumption is positively correlated with household income level [26]. This means that the higher the income, the higher the disposable income, which, in turn, increases domestic appliances’ popularity rate and utilisation ratio and electricity consumption [25]. With the development of the economy and constant improvement of people’s living standards, domestic appliances, such as electric water heaters, air conditioners, electric warmers, and electric cookers, progressively come into use and the income elasticity of living electricity further increases. Thus, it can be seen that income growth is the main reason for the rapid growth in household electricity consumption [27].
The continuous promotion of urbanisation and the implementation of China’s one-child policy minimise the scale of urban families. The family structure shows a tendency toward nuclear families, and the style of small families has become more diversified. Apart from nuclear families, other styles of non-nuclear families, such as empty nests, Dink families, bachelordom families, and single-parent families are now important components of China’s urban families. Most families purchase domestic appliances. With the growth of the population and the minimisation of families’ scales, the rate of domestic appliances consumed by the family as a unit is increasing [28]. According to statistics, given a stable population, the greater the number of families, the greater domestic appliance ownership and the higher the total household electricity consumption [29].
There is a problem with using electric power for decoration and comfort. According to Engel’s law, with the growth of national income, people’s consumption habits changed and the demand for luxuries increased after people’s daily requirements were met. The development of modern science and technology and the improvement of residents’ living standards enhance the public consciousness of what constitutes a “good life”, meaning that the requirements for electric power are expanded beyond basic necessities such as lighting and some key domestic appliances. This is especially true for urban high-income households, in which obvious characteristics of comfort and advanced electric power use can be observed. Such households are keen on owning new appliances, sensitive to new appliances, and purchase them frequently. They have started to pay attention to improving their sense of quality and taste, which often begins with the use of many advanced domestic appliances that contain all kinds of high and new science and technology, such as home computers, microwave ovens, electromagnetic ovens, second or more TV sets, washing machines for small pieces of clothing, refrigerators for only cold drinks, and air conditioners. All of these have increased residential electricity consumption.
It is widely recognised that the age structure of household members (children, adults, and the elderly) significantly impacts residential electricity consumption [28]. In general, residential electricity consumption is expected to decrease due to price increases [30]. This may be related to the lower disposable salaries and greater awareness of energy efficiency and environmental protection among those generally responsible for households (18–35 years old), whose electricity consumption will be reduced by rising tariffs [22]. Climate change might also impact electricity consumption, owing to its influence on usage patterns and purchasing decisions for heating and cooling appliances [31]. Older people’s reduced physical abilities and extended stays at home can lead to increased electricity consumption for heating equipment [32], but traditionally frugal older people may reduce their consumption of electricity in the house when faced with rising electricity prices. In addition, climate influences the purchase of heating and energy equipment in several ways. First, heating and cooling equipment is often purchased in the winter or summer. Second, climate conditions bring about more significant temperature differences that need to be overcome. Finally, people are more likely to turn on heating or cooling equipment when they are very cold or hot, respectively. In the long run, the decision to use such equipment is often influenced by extreme weather (high or low temperatures) factors [33]. Thus, we can speculate that climate-induced temperature extremes may be a future socioeconomic driver that will also impact UHEC.
Policies may have a promotional effect on household electricity saving behaviour [34]. The Chinese government plays a positive role in people’s livelihoods compared to other countries by using macro-policy tools to reasonably regulate the market economy.

2.2. Hypothesis Framework

Based on the above analysis, this study proposes a hypothesis regarding UHEC. It is assumed that UHEC is affected by urbanisation, household size, age structure, GDP per capita, floor area, climate, and policy factors, as shown in Figure 2.

3. Research Methodology

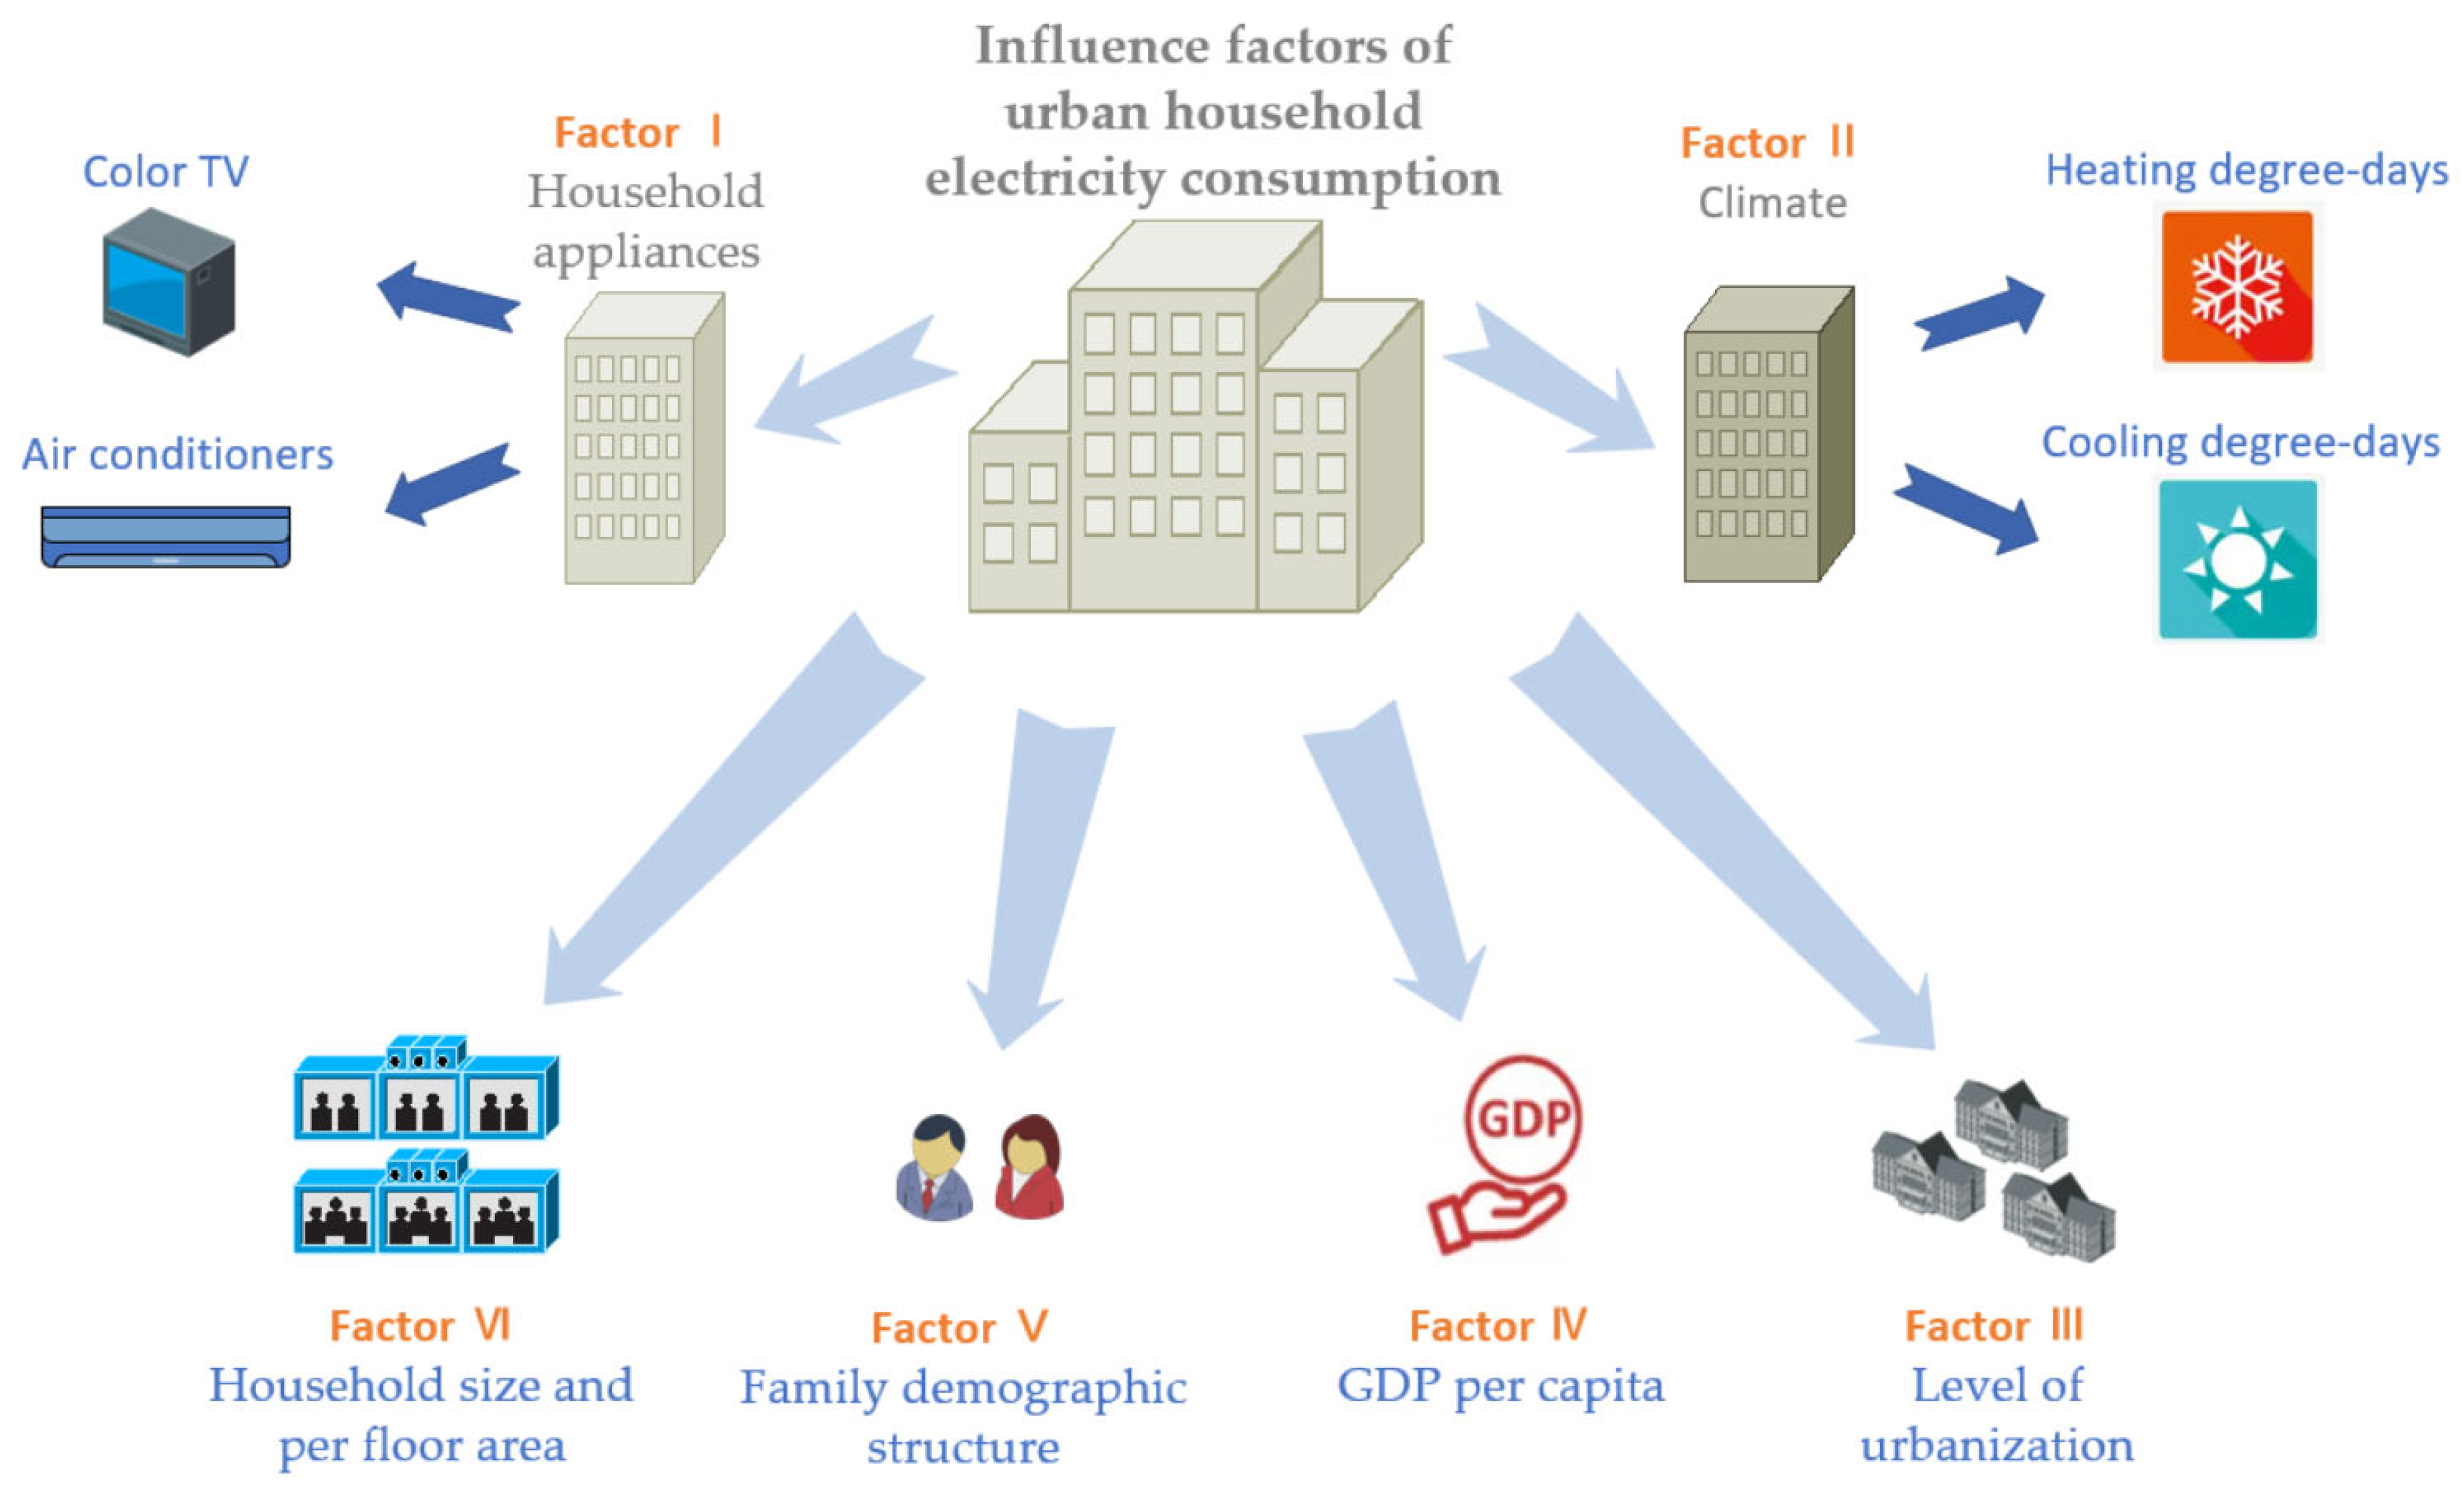
3.1. Factors Influencing UHEC

There are many factors that promote the growth of UHEC. These include population factors (total population, household size, and age structure); economic development factors (GDP per capita, household consumption level index, disposable household income, etc); urban development level factors (urbanisation level, indicating urban and rural population distribution/urbanisation rate); factors associated with residents’ living conditions (e.g., floor area per capita); household electric appliances factors (quantity owned, duration of use); climate factors (climate zone, weather, temperature, precipitation, sunshine duration); and policy factors (electricity saving policies, tiered electricity prices in China).
Owing to limited manuscript space, this study only analyses the influencing factors of UHEC that are the most direct and concrete, including the average family size (FSIZE), presence of elderly (65 years and above) (ELDER), GDP per capita (PGDP), urbanisation (U), floor area per capita (F), air conditioner per household (AC), colour TV ownership per household (TV), cooling degree days (CDD), and heating degree days (HDD) (see Figure 3).

3.2. STIRPAT Model

The STIRPAT model was developed on the basis of the IPAT model. York [35] points out that the IPAT model does not allow for non-monotonic, differentially scaled changes in the influencing factors and is therefore extremely limited in its use; to overcome this shortcoming, the York STIRPAT model is put forward.
I = a P i b A I C T i d e i
where a , b , c ,   and d   are the parameters to be estimated by the model and e i is the random error term. In practice, the above equation is generally estimated in a logarithmic form. In the STIRPAT model, the excellent topology allows P, A, and T to be decomposed into many factors that affect the environment [36,37]; therefore, this model has received more research attention [38,39]. The logarithmic form is given by Equation (2).
L n I i = L n a + b L n ( P i ) + c L n ( A i ) + d L n ( T i ) + e i
The prominent advantage of the STIRPAT model is that it significantly enriches the types of relevant impact factors considered in this study. To further estimate the impact factors of UHEC in Chinese provinces, we incorporated indicators of population, economic, and urban development effects; household electric appliances; floor area; and climate into a refined STIRPAT model. Therefore, this study utilised average family size and age as proxy indicators of demographic change. We utilised the urbanisation level indicator to represent urban development, defined as the proportion of the urban population to the total population. CDD and HDD are proxies for climate change. In addition, some variables that were highly related to UHEC were considered in the model. The refined and extended STIRPAT model is expressed by Equation (3).
L n E i t = a i t + β 1 L n F S I Z E i t + β 2 L n E L D E R i t + β 3 L n P G D P i t + β 4 L n U i t + β 5 L n A C i t + β 6 L n T V i t + β 7 L n F i t + β 8 L n C D D i t + β 9 H D D i t + ε i t ( i = 1 ,   2 ,   ,   N ;   t = 1 ,   2 ,   ,   T )
where (i = 1, 2, L, 30) represents China’s 30 mainland provinces (except Tibet), and t (t = 2005, 2006, L, 2020) is the sample observation period. β 1 , β 2 , β 3 , β 4 , β 5 , β 6 , β 7 ,   β 8   a n d   β 9 denote the model coefficients. Equation (3) involves nine variables (E, FSIZE, ELDER, PGDP, U, AC, TV, F, CDD, and HDD), as shown in Table 1.
We used panel data from 30 provinces from 2005 to 2020. Data on FSIZE, ELDER, AC, T, and PGDP were directly derived or calculated from CSY (2006–2021). Data for UHEC were calculated from the CESY (2006–2021). Data for floor area per capita were calculated from the Urban Statistical Yearbook of China (2006–2021). U was directly derived or calculated from the China Demographic and Employment Statistics Yearbook, and CDD and HDD data were obtained from the China Meteorological Administration. Data on E were derived from the regional energy balance table of the China Energy Statistics Yearbook (2006–2021). Table 1 presents the variable descriptions.

4. Results

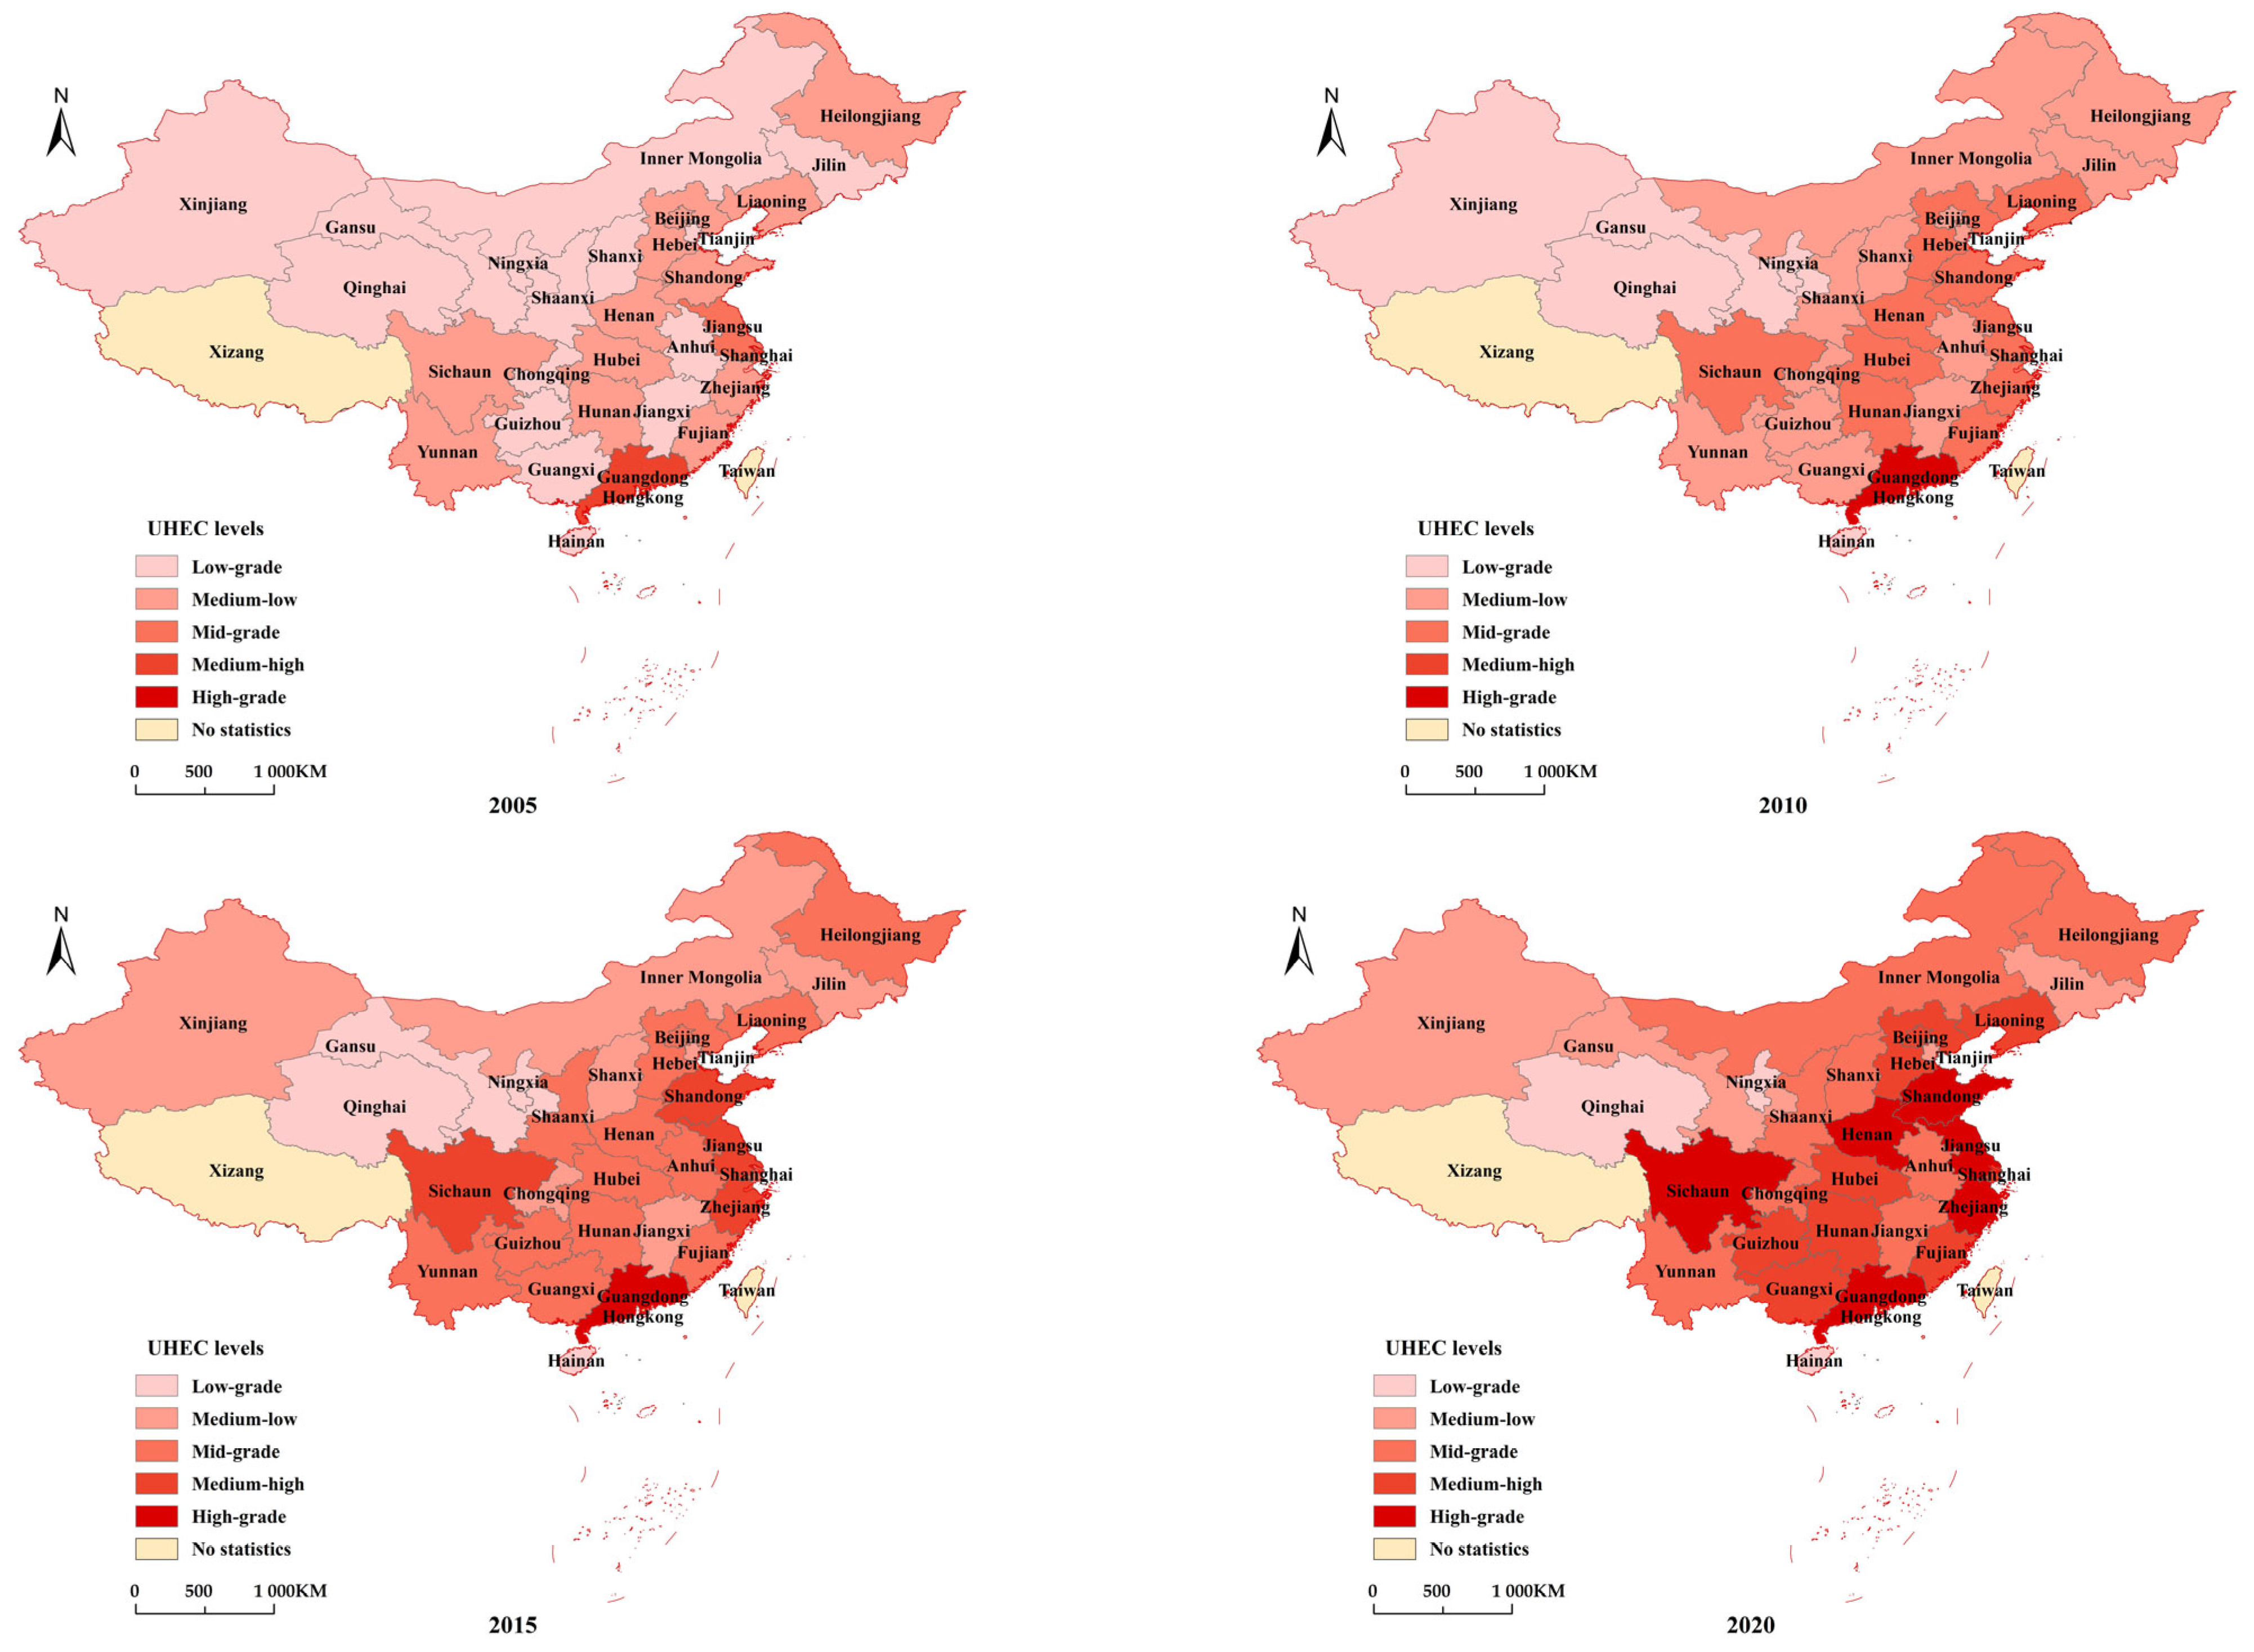
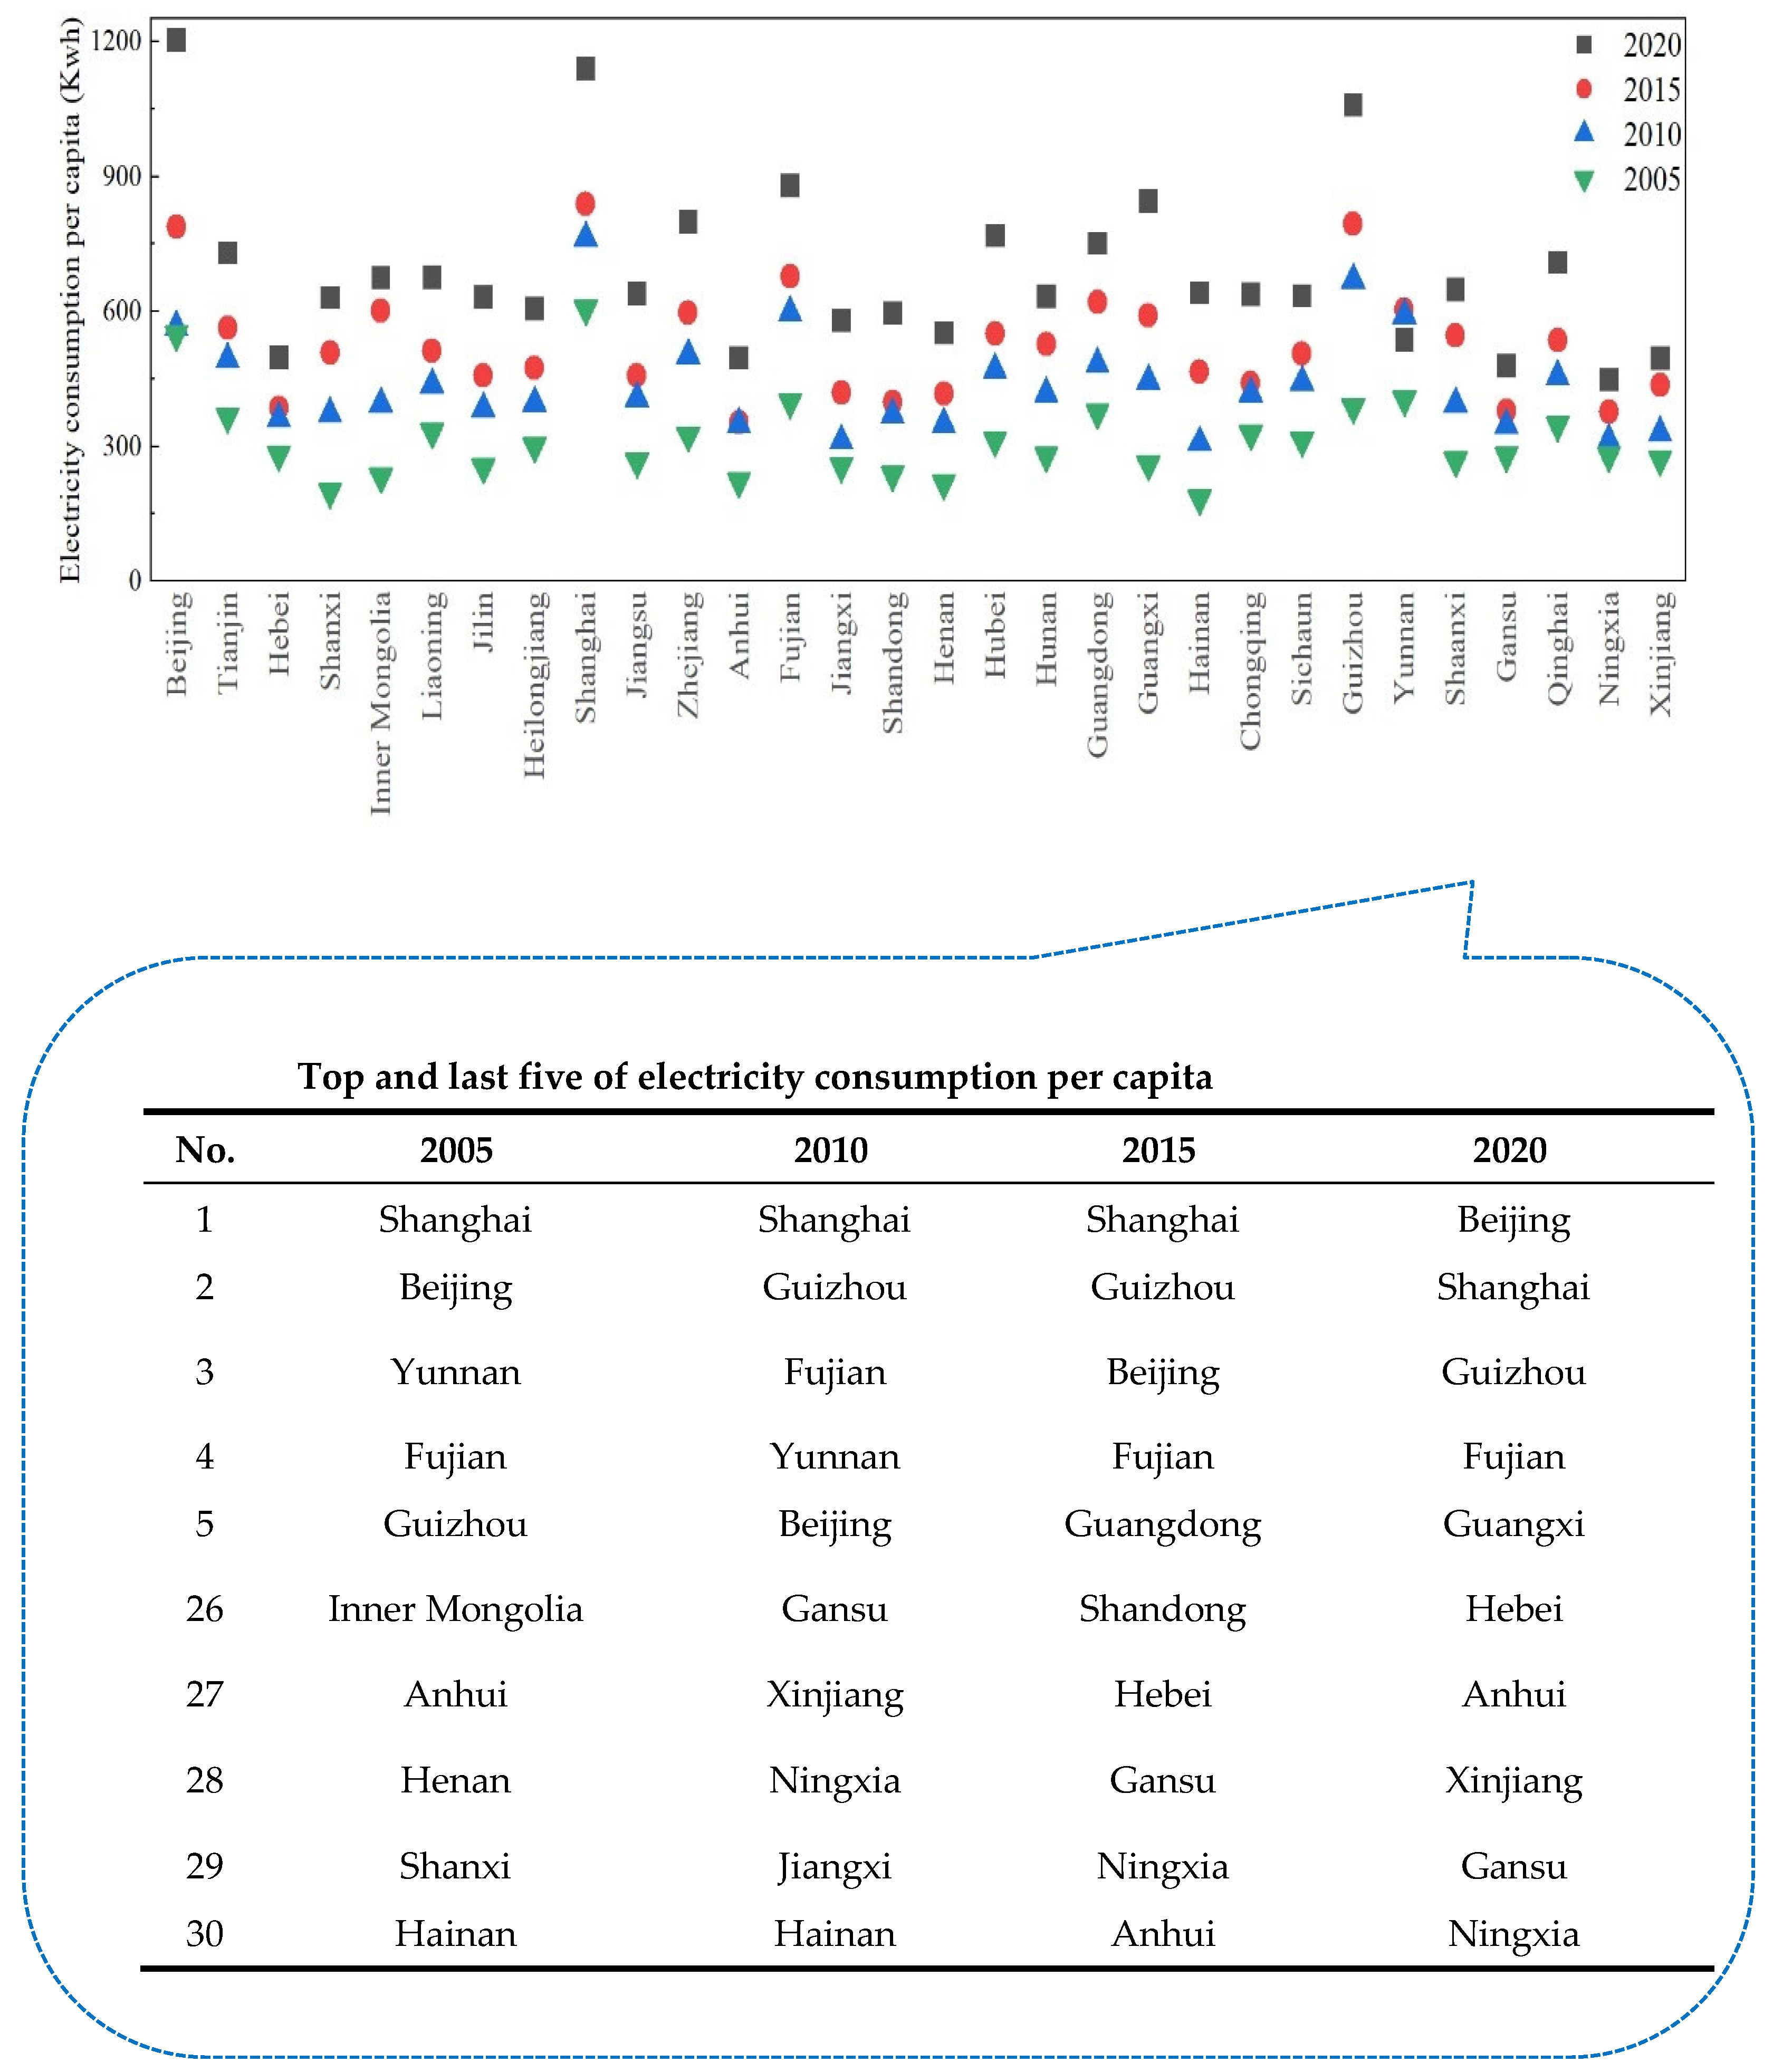
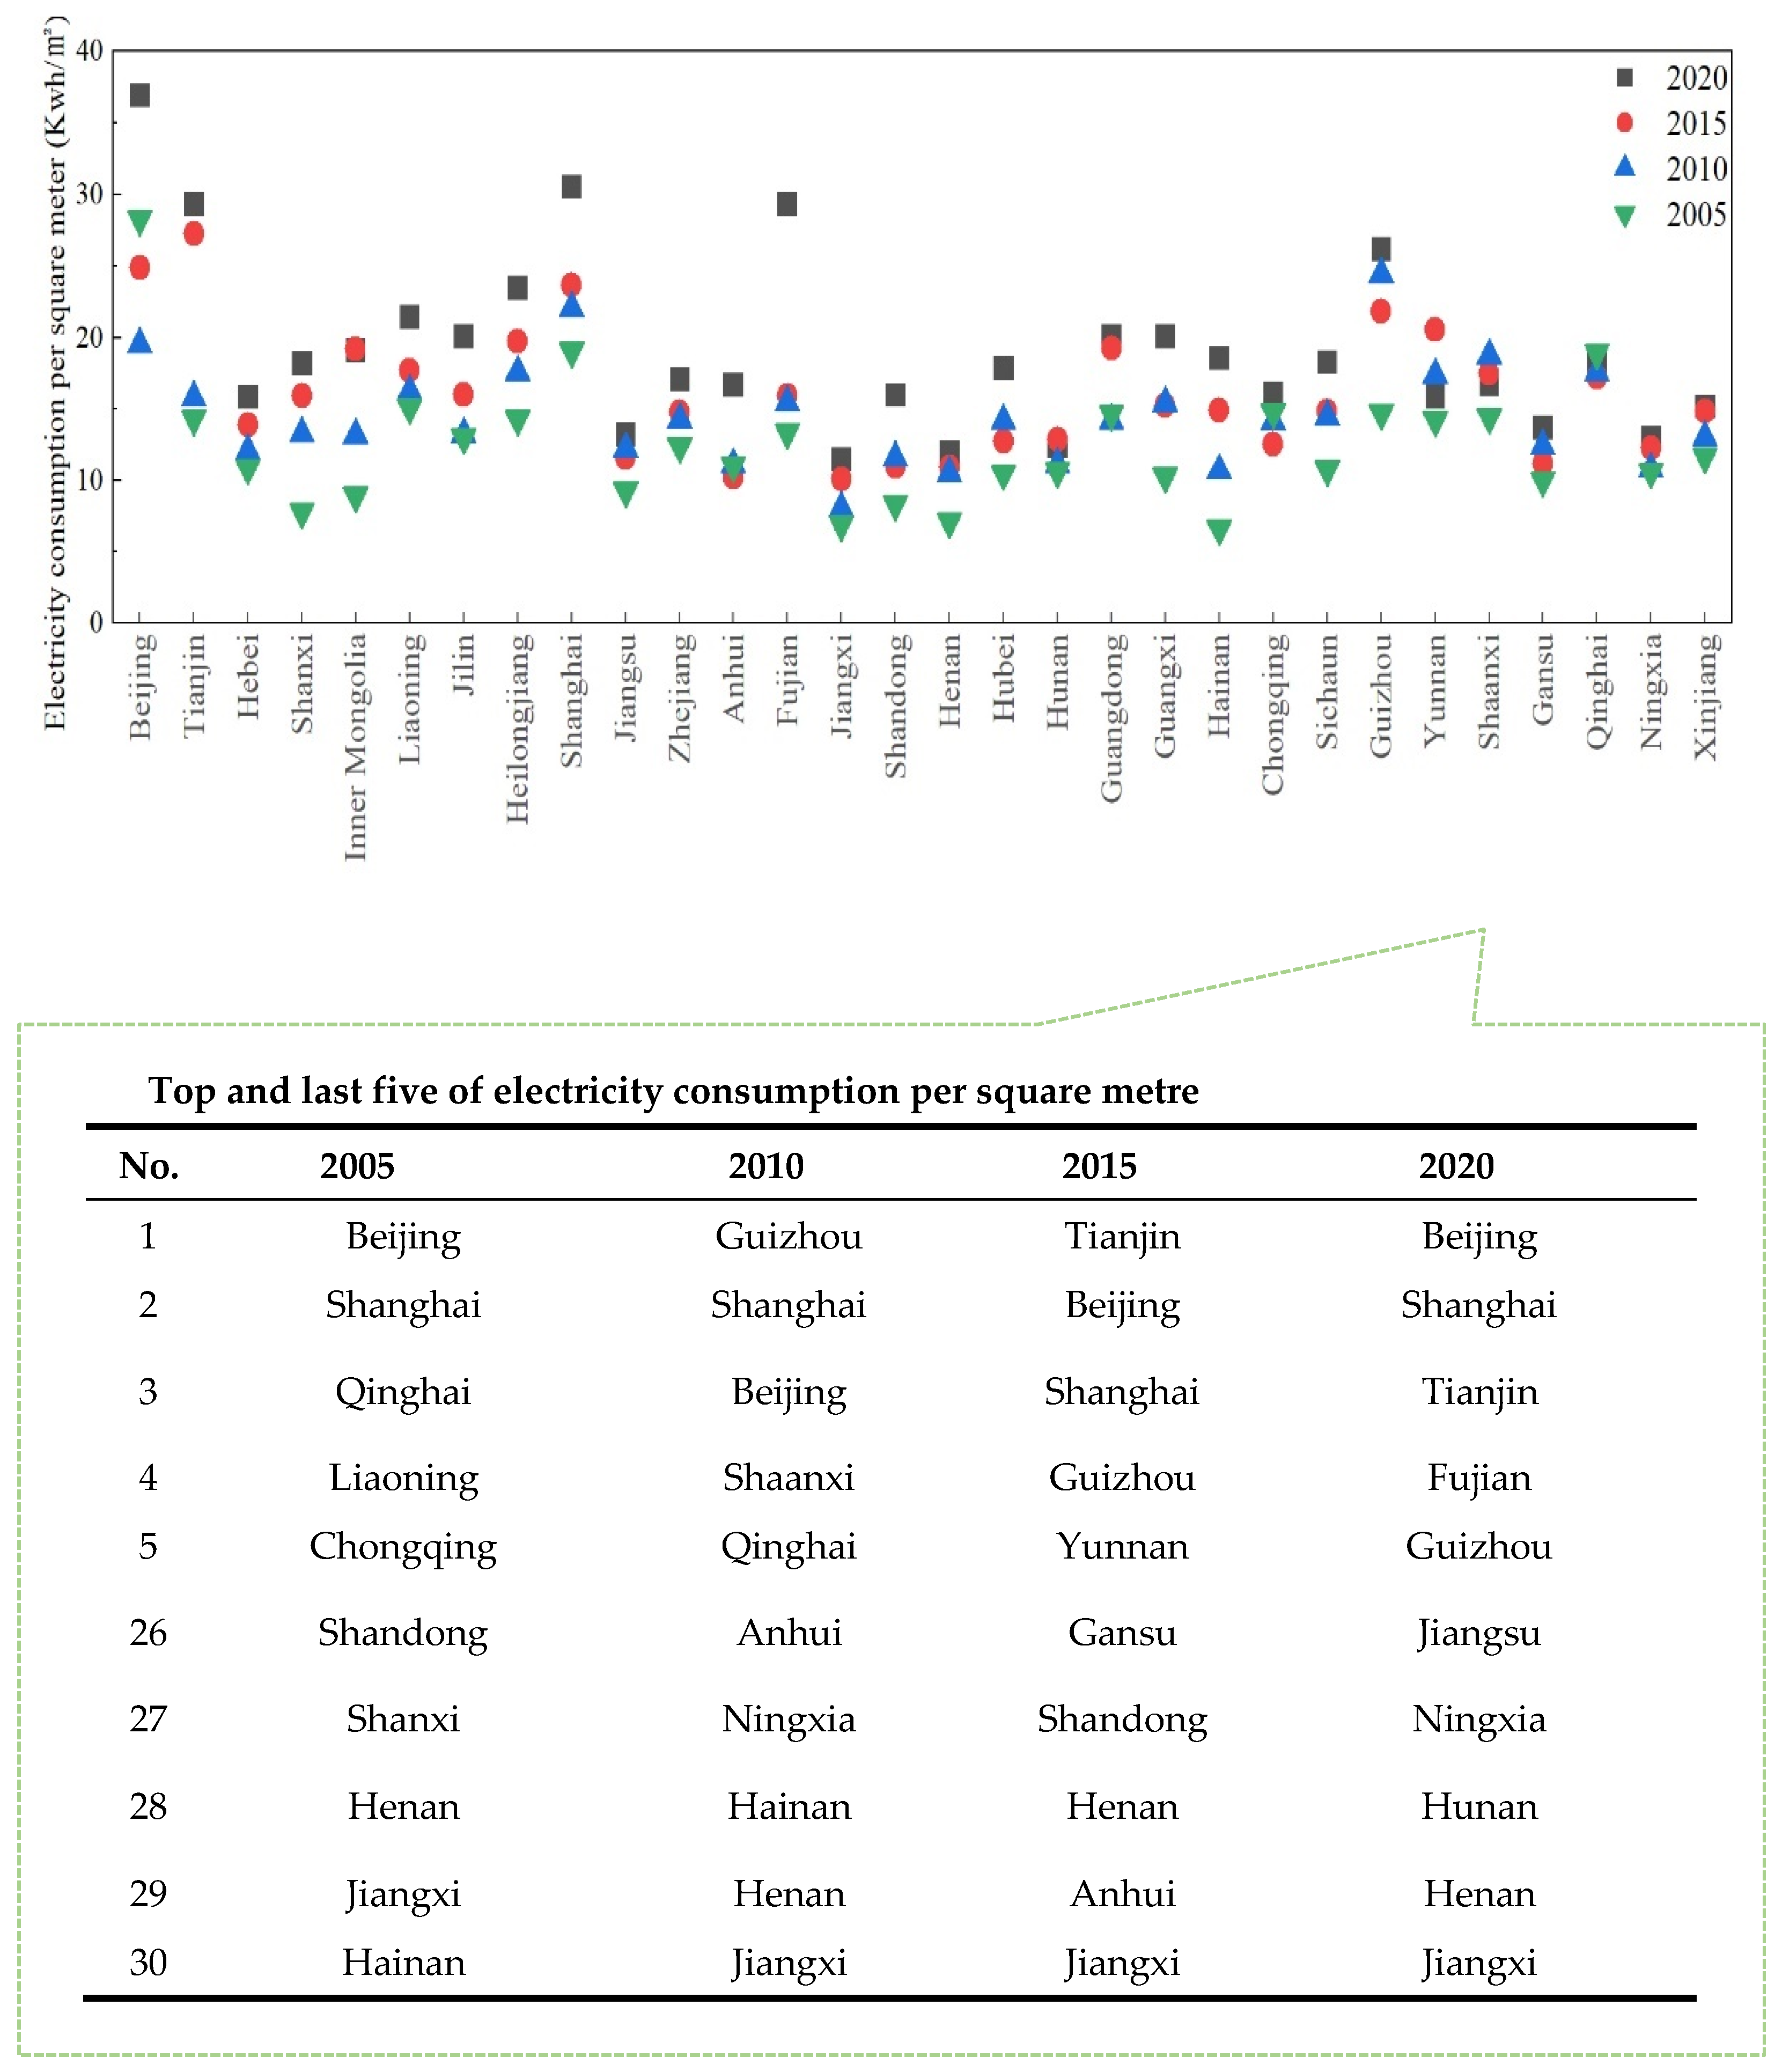
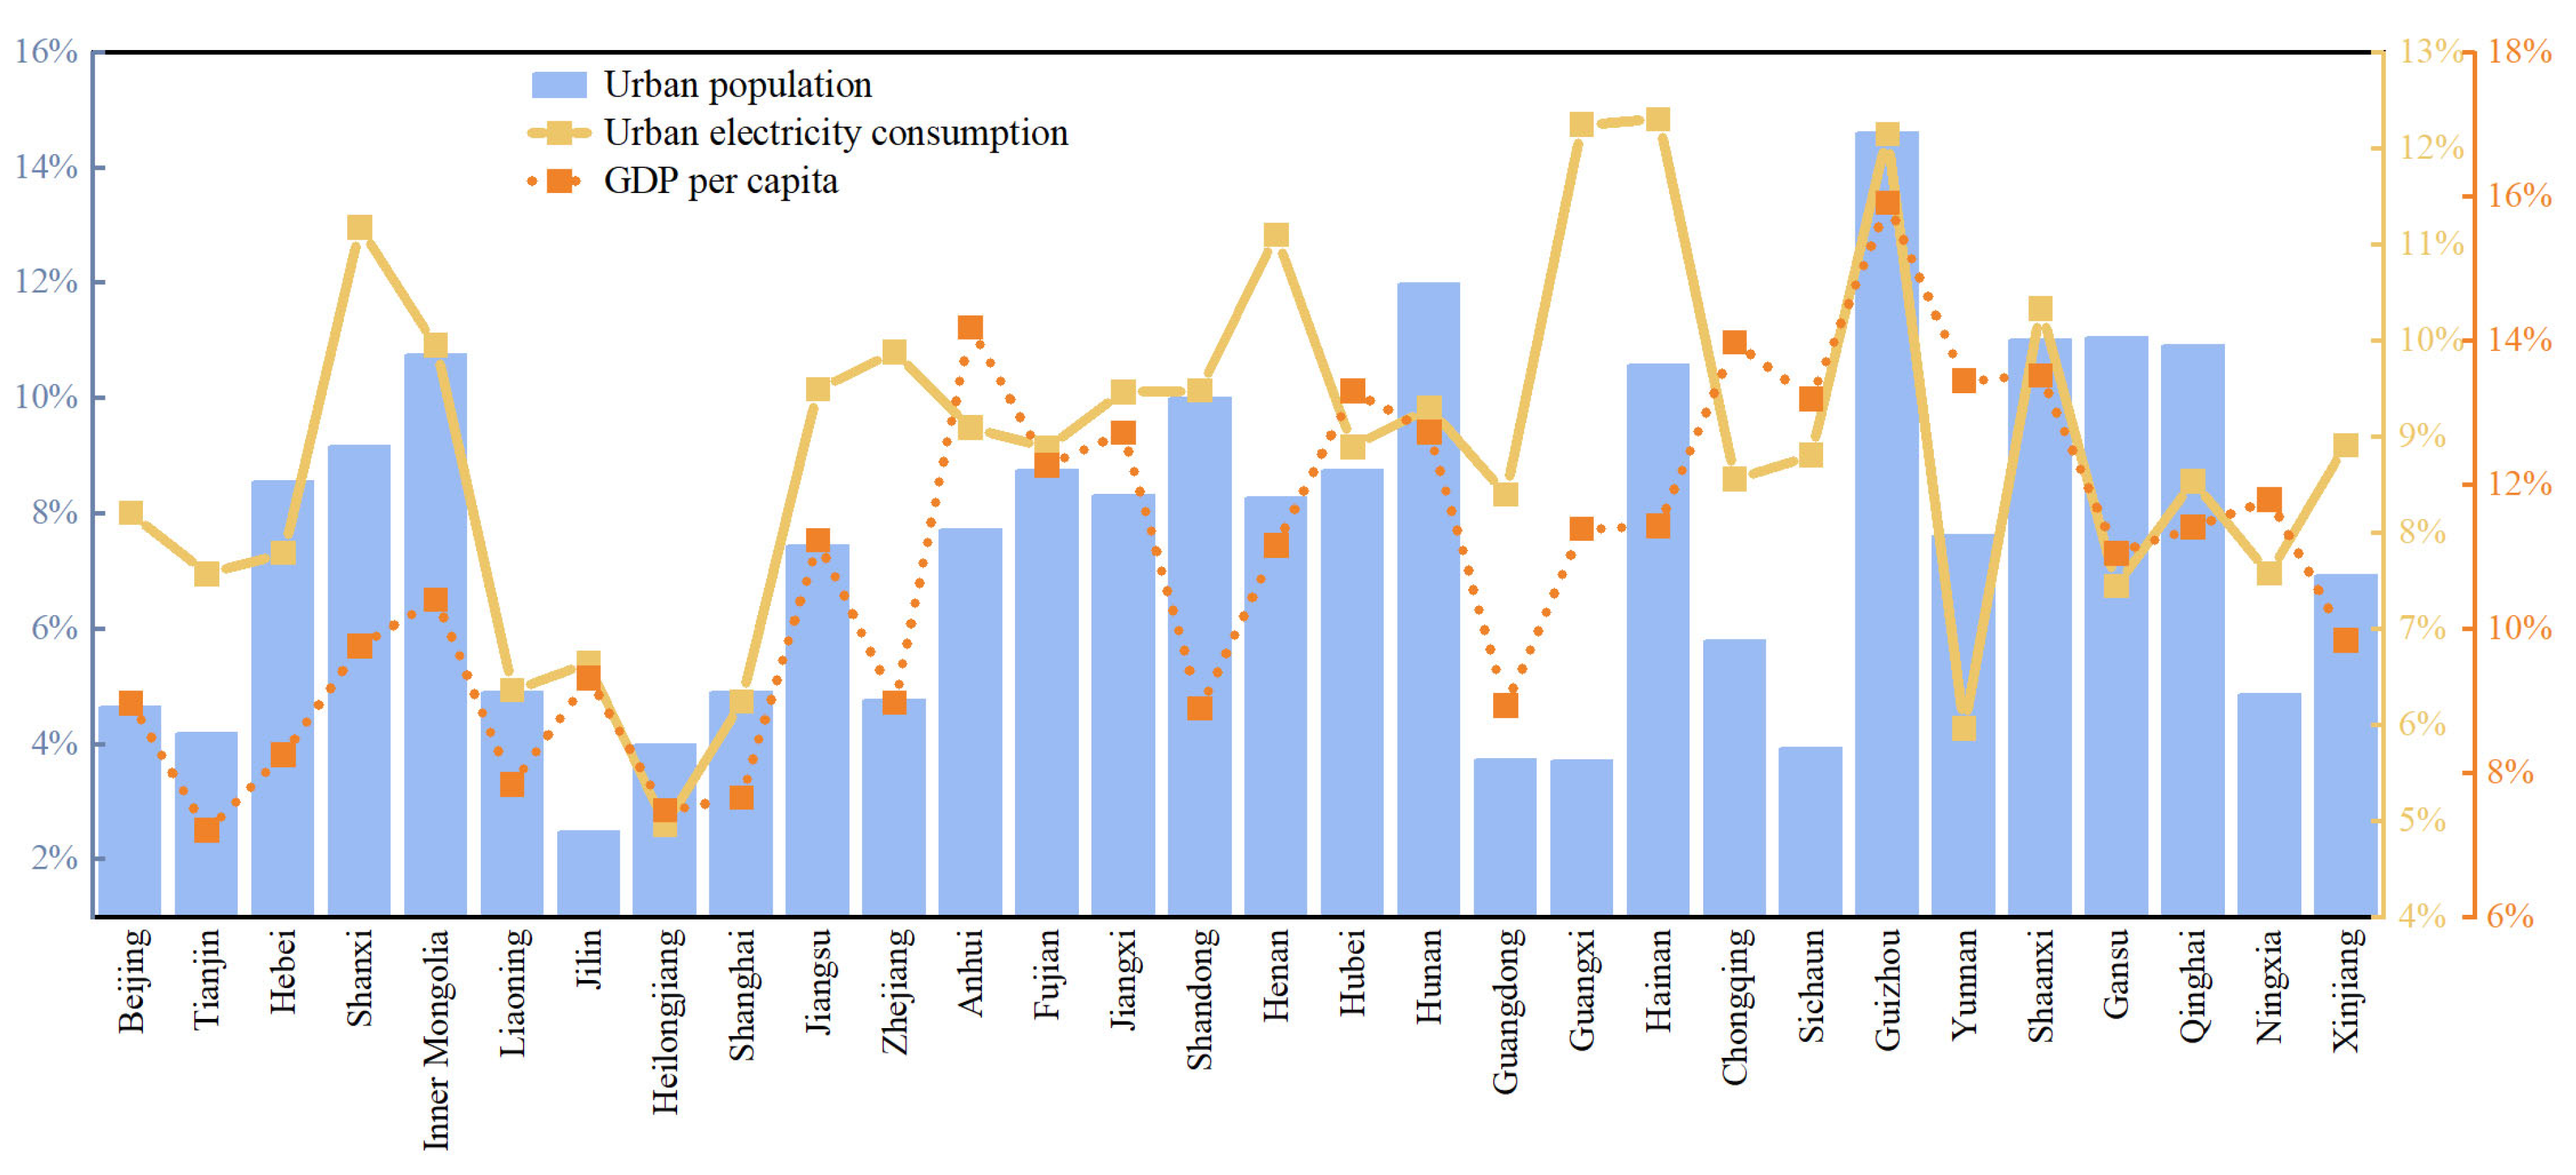
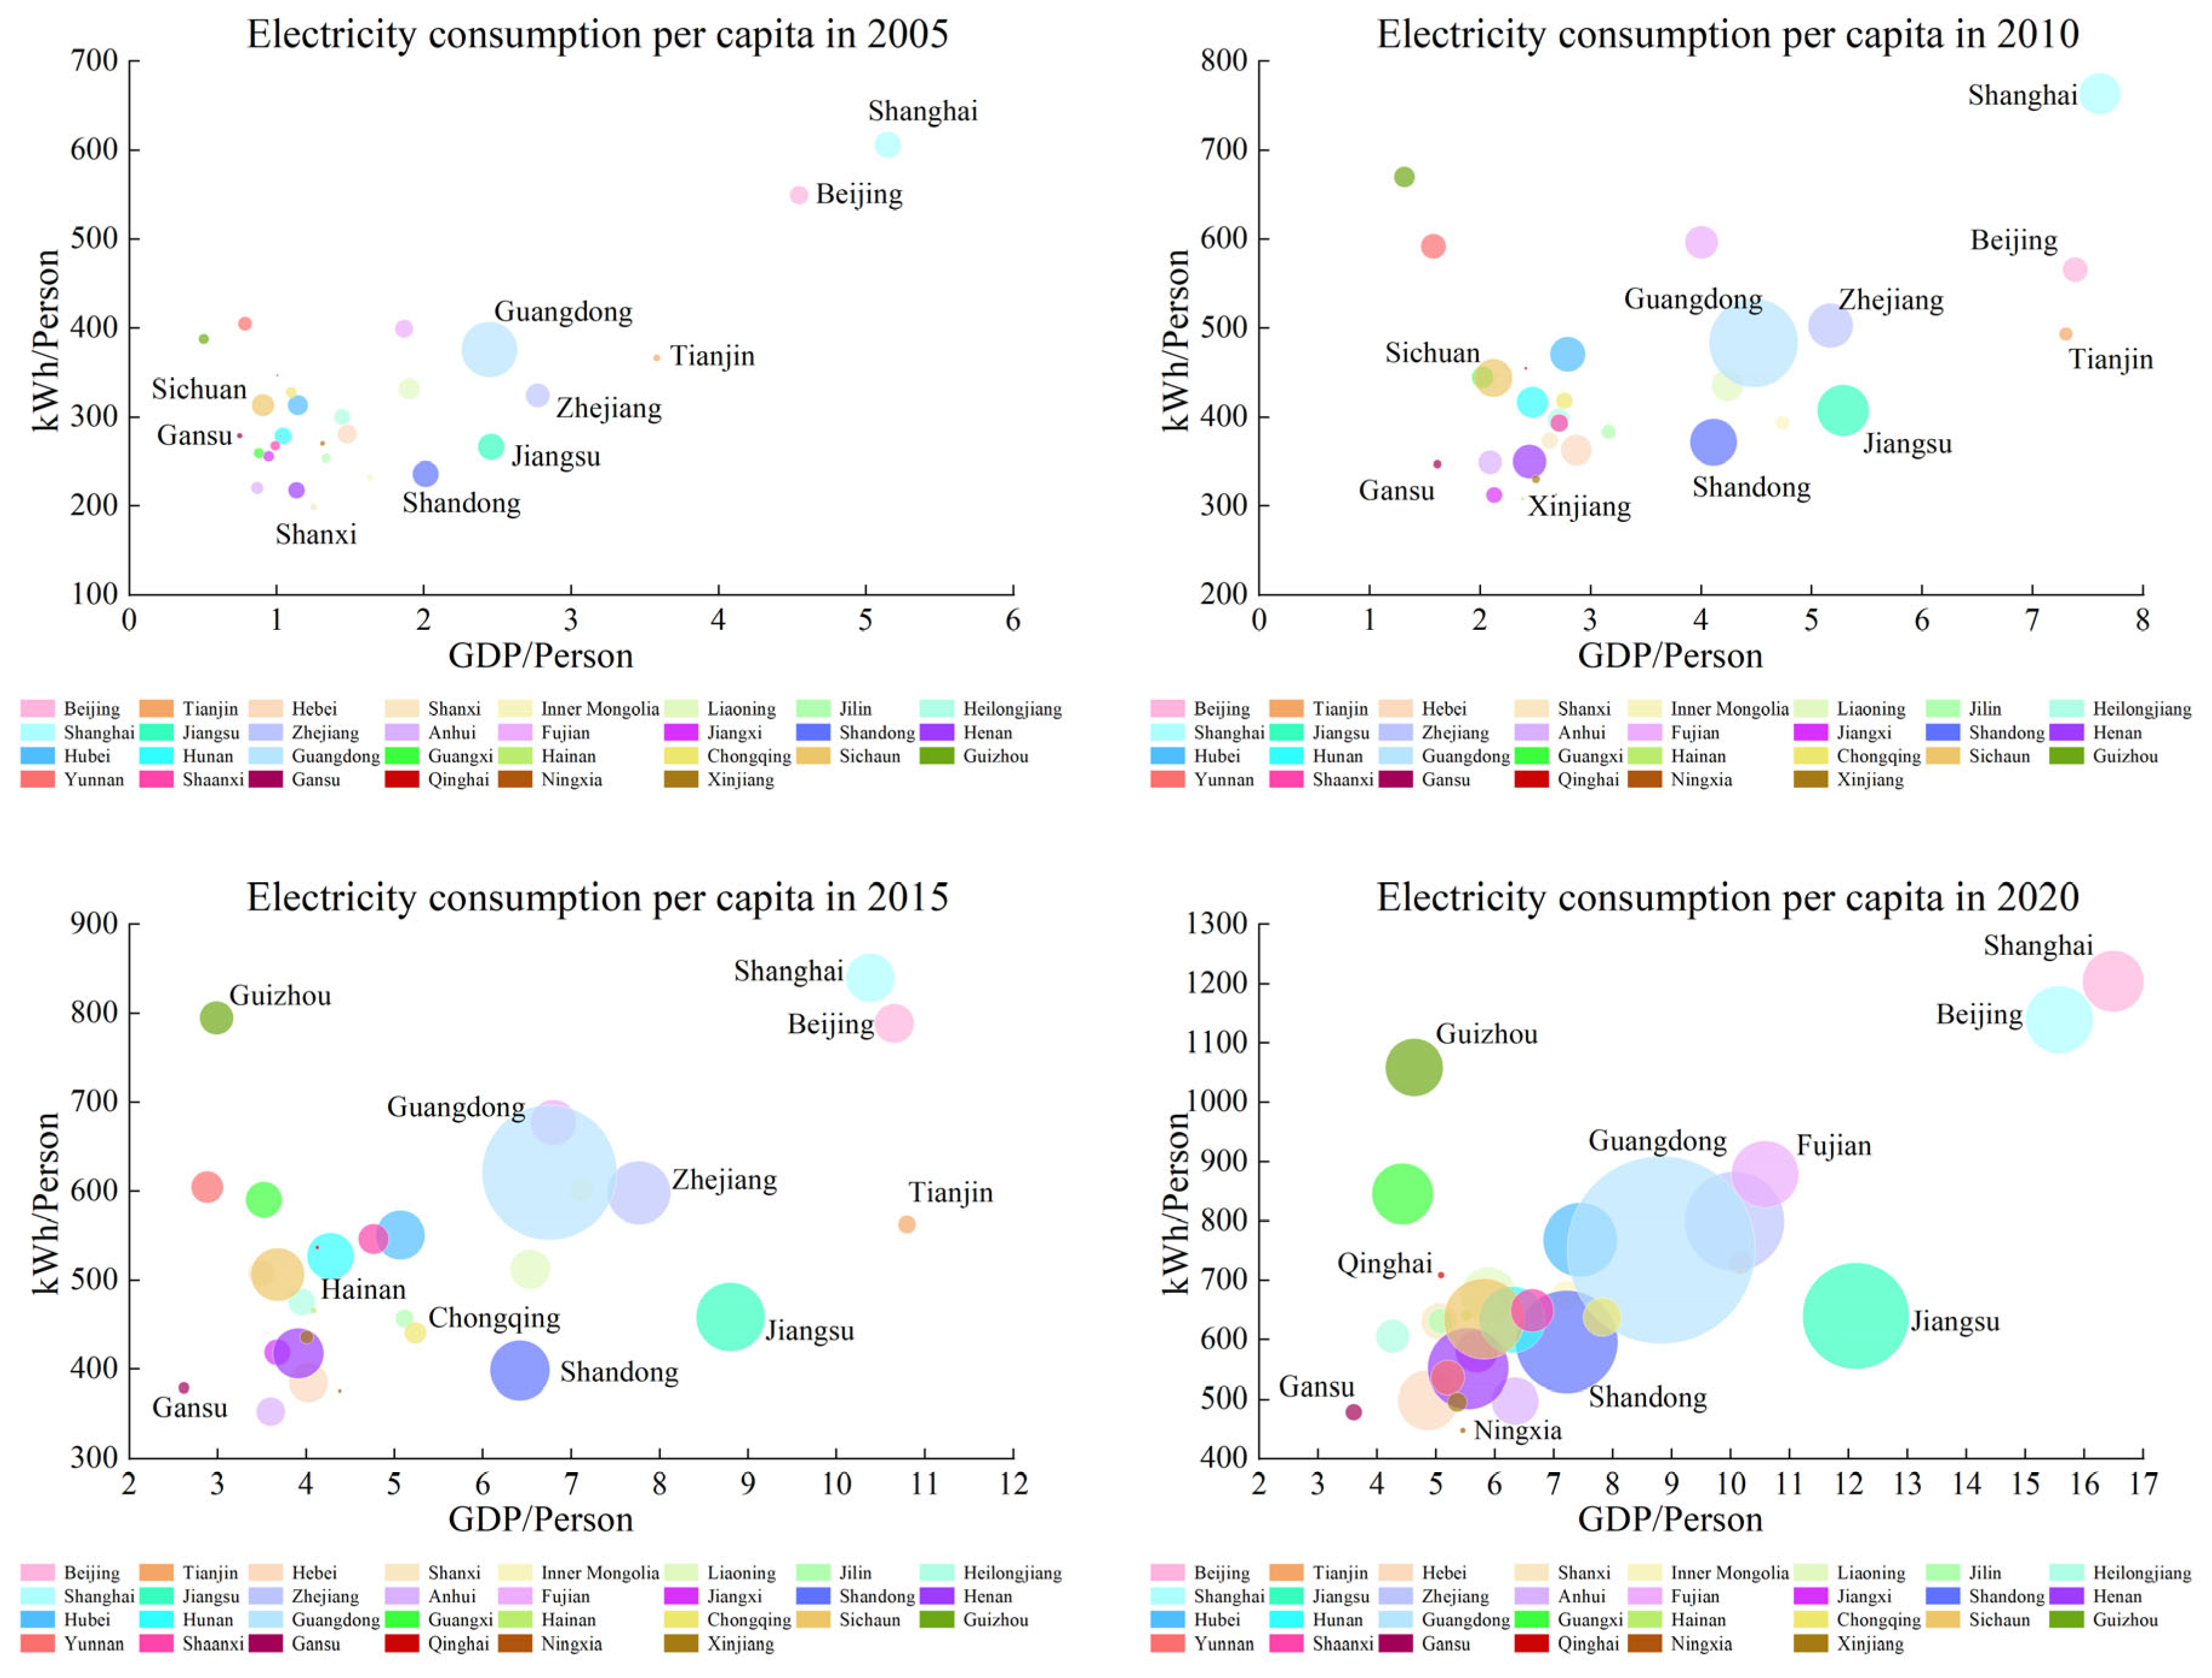
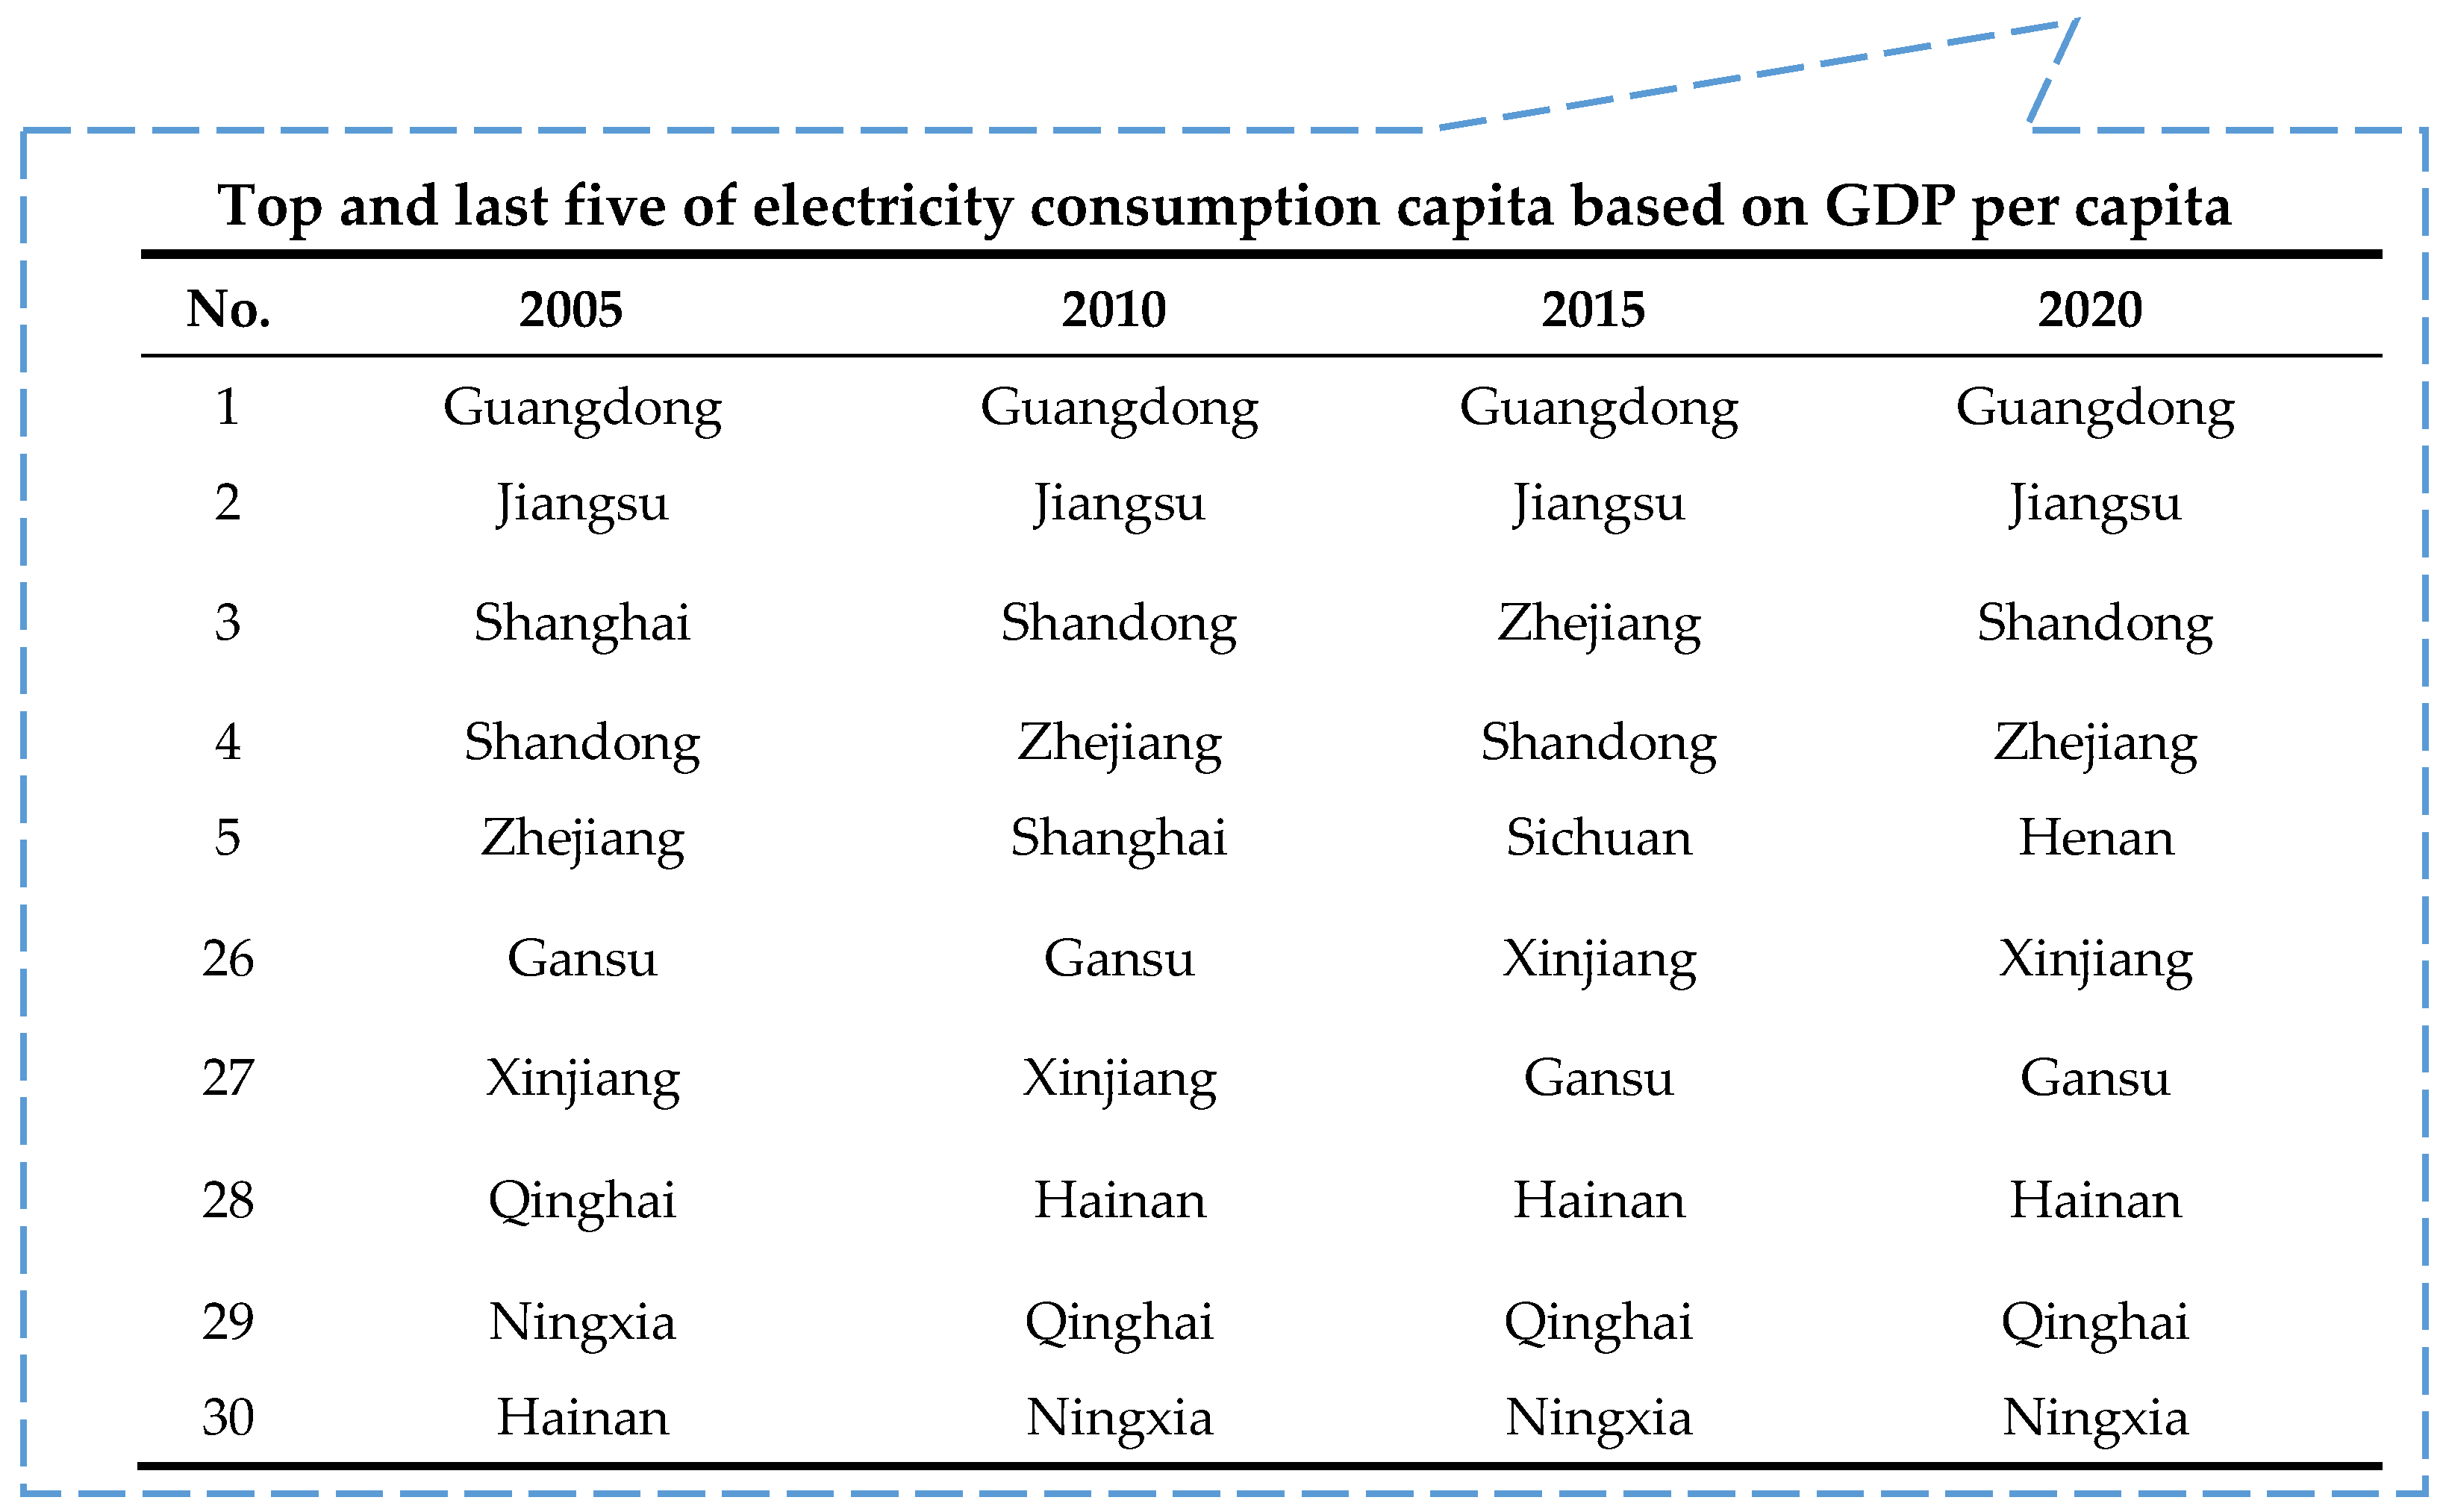
4.1. Analysis of the Results of UHEC in China

According to the data of relevant variables, the five indicators related to UHEC (electricity consumption per capita, electricity consumption per square metre, average annual growth rate, and electricity consumption per capita based on GDP per capita) were sorted and calculated. The measurement results are shown in Figure 4, Figure 5, Figure 6 and Figure 7.
Owing to the vastness of the Chinese territory, the region’s economic development status, living habits, population distribution, and geographical locations have extremely significant differences. Thus, China’s provincial UHEC differs greatly. Figure 4 presents the spatial distribution of UHEC in 2005, 2010, 2015, and 2020, in which provincial differences in UHEC are evident. It can be seen that the total electricity consumption in the north-western provinces, e.g., Qinghai, Xinjiang, Gansu, and Ningxia, is always at medium-to-low levels. Meanwhile, for the south-eastern regions, e.g., Zhejiang, Jiangsu, Shanghai, and Fujian, it is generally at high levels. Guangdong, the province with the highest GDP in our country, has the highest electricity consumption among the four times analysis. Because the eastern provinces are situated near the sea and develop faster than their inland counterparts, their electricity consumption has increased rapidly.
The electricity consumption per capita of all provinces in China also varies significantly, as shown in Figure 5. In 2005, Shanghai, Beijing, Yunnan, Fujian, and Guizhou were the top five provinces in terms of per capita electricity consumption. The top five provinces in terms of electricity consumption per capita remained unchanged from 2005 to 2010, with Hainan still in last place. In 2015, Guangdong was in the top five and Anhui had the lowest per capita electricity consumption. In 2020, Guangxi was in the top five, Beijing had the highest per capita electricity consumption, and Ningxia had the lowest.
Figure 6 shows that electricity consumption per square metre varies greatly across provinces. In 2005, Beijing, Shanghai, Qinghai, Liaoning, and Chongqing were the top five highest consumers of electricity in China with 28.24, 19.04, 18.90, 15.09, and 14.80 kWh per square metre, respectively. Shandong, Shanxi, Henan, Jiangxi, and Hainan had the lowest levels of electricity consumption, with 8.30, 7.70, 7.01, 6.89, and 6.63 kWh per square metre, respectively. Beijing uses the most electricity and is four times larger in area than Hainan, where residents use the least.
In 2010, Guizhou surpassed Shanghai to rank first and Jiangxi ranked last. In 2015, Tianjin ranked first compared to 2010, when Beijing and Shanghai swapped places. In 2020, Beijing overtook Tianjin to top the rankings again, whereas Jiangxi remained in last place.
Figure 7 shows the average annual growth rate of the selected indicators. In terms of average annual growth rates for UHEC, Hainan, Guangxi, Guizhou, Shanxi, and Henan rank in the top five in China, with growth rates of over 10%. Jilin, Liaoning, Shanghai, Yunnan, and Heilongjiang are in the last five. Heilongjiang Province has the slowest growth at less than 5%. At the same time, simple observation shows that the higher the average annual growth rate of urban electricity consumption, the higher the average annual growth rate of the urban population and the average annual growth rate of GDP per capita.
Figure 8 shows the per capita electricity consumption, per capita GDP, and total electricity consumption of the 30 provinces in 2005, 2010, 2015, and 2020. The size of the circle represents the total UHEC. As can be seen from the graph, Shandong and Jiangsu are among the top five countries in terms of per capita electricity consumption based on GDP per capita in the four years. Shanghai fell out of the top five countries in 2015. Sichuan and Henan were in the top five in 2015 and 2020, respectively. From 2005 to 2020, the bottom five were Gansu, Xinjiang, Qinghai, Ningxia, and Hainan.
In summary, we observed changing trends and provincial differences in UHEC in China from the five indicators of total electricity consumption, per capita electricity consumption, electricity consumption per square metre, average annual growth rate, and electricity consumption per capita based on GDP per capita. Some provinces are similar while others are quite different.

4.2. Analyses of the Impact Factors of UHEC

Parameter Estimation Results of Panel Data Model

Based on panel data for 30 provincial administrative regions in China from 2005 to 2020 (excluding the Tibet Autonomous Region, Macau Special Administrative Region, Hong Kong Special Administrative Region, and Taiwan Province), this study analyses the factors influencing the total UHEC using the STIRPAT model extended above. Stata 16.0 (StataCorp., College Station, TX, USA) was employed for the analysis.
Prior to the analysis of the panel data, a correlation test for the nine explanatory variables was conducted. The results are shown in Table 2. Some of the correlation coefficients are greater than 0.6, which indicates that there may be some degree of linear correlation in these explanatory quantities. Therefore, the possibility of multicollinearity for these explanatory variables should be tested.
All data were logged and standardised in advance and tested for multicollinearity using Stata 16.0. The results are shown in Table 3, which shows that the variance inflation factor (VIF) values for these data are all below 10, thus proving that there is no strong multicollinearity between these explanatory variables and that our results will have relative reliability and stability.
To test the effects of TV and CDD days on UHEC, two models were set up in this study. TV and CDD days were introduced as explanatory variables in Model (1). They were subsequently removed to obtain Model (2), which proved to have a negligible or insignificant effect on TV and CDD days on UHEC. The results of the Hausman test for Models (1) and (2) are shown in Table 4, with fixed effects models chosen for both models. The estimation results of the fixed effects model are presented in Table 5. From the estimation results of Model (2), the adjusted regression models are close to 1, and the overall significance test of the model of the F test indicated that the p value was less than 0.05; thus, the overall model fit was good, as was each coefficient.
The above empirical studies indicate that different influencing factors can have different effects on UHEC. U, PGDP, HDD, OLD, FSIZE, F, and AC all provide significant explanations for the changes in the UHEC in China. However, factors such as TV and CDD do not accurately explain the change in UHEC from 2005 to 2020. Although all seven variables mentioned above significantly affect UHEC, the most significant factor is U.

5. Discussion

5.1. Analysis of the Difference in UHEC in China

We observed the changing trends and provincial differences of UHEC in China from the five indicators of total electricity consumption, electricity consumption per capita, electricity consumption per square metre, average annual growth rate, and electricity consumption per capita based on GDP per capita. Some provinces are very similar, while others are quite different.
The provinces cover large areas and have relatively large populations. Even though Beijing and Shanghai are not dominant in terms of population and area, they have well-developed economies and highly mobile populations and are at the top of the 30 provinces in terms of electricity consumption. In contrast, Qinghai, Ningxia, Hainan, Gansu, and Xinjiang, the majority of which are located in the mid-west, have smaller populations and are less economically developed.
Overall, the provinces are in a period of a rapid growth and increased electricity consumption, which has much to do with China’s rising living standards and rapid economic development. At the same time, differences in the country’s provincial electricity consumption are significant. There are many reasons for this, including different levels of provincial economic development, different speeds of development, and different forms of energy use.

5.2. Different Contributions of Impact Factors Affecting UHEC

  • Population factors can be classified as (i) average family size and (ii) age structure, including the presence of elderly people (65 years and above). The increasing average family size in China (FSIZE) negatively contributes to UHEC, with an effect coefficient of −0.383, as supported by Brantley [40], who found that larger households were associated with lower levels of electricity in both developed and developing countries. The coefficient of influence for the presence of older people was 0.315, which suggests that an increase in the number of older individuals will lead to an increase in UHEC. This conclusion is supported by Liu [41], whose study of 150 countries showed that younger age groups consume less than older age groups, and that population aging will, to some extent, lead to an increase in heat and electricity consumption. Fintan [22] found that households with young people (18–35 years) tended to have lower electricity consumption than households in other age groups (36–55 years or 56+). Elderly people are a group of people who do not have full-time jobs and whose physical functions are declining, have an increased need for air conditioning, and are at home for extended periods of the day [32,41].
  • Economic factors can be categorised as: (i) GDP per capita and (ii) factors such as electricity prices that were not included in this study. Of these, GDP per capita ranks high in terms of the impact coefficient and significantly impacts UHEC. This result is supported by Wang [42], who found that higher GDP per capita tends to be accompanied by a higher quality of life and electricity consumption. However, Yalcintas [27] demonstrated that the price of electricity has no significant impact on household electricity consumption and is not a good indicator to study; thus, it was not included in this study.
  • Table 5 shows that increasing levels of urbanisation (U) had the most significant positive contribution to UHEC, with an impact coefficient of 0.657. This result is supported by Bilgili [43], who investigated ten Asian countries and found that the impact of urbanisation on energy intensity can be long or short. An analysis of Tahsin’s research shows a panel Granger causality between energy consumption [44], urbanisation, and economic growth, and that they all influence each other. Thus, it can be seen that China’s rapid urbanisation and economic development have directly led to an increase in household electricity consumption.
  • Per capita housing size is also a significant factor affecting household electricity consumption. Huang [45] identified the characteristics of high-electricity-consuming households through his study, in which he found that the larger the dwelling size (larger housing area per capita), the higher the household electricity consumption for same-same populations.
  • A negative correlation between HDD and UHEC was observed under the influence of temperature. Berkouwer’s [46] study of nearly 6000 households showed that an increase in temperature and a decrease in the number of HDD days results in a 6.2% reduction in annual electricity consumption per household, which supports our conclusion. However, the impact of CDD on UHEC was not as pronounced.
  • Factors such as the number of household appliances owned (AC and TV) may have different effects on household electricity consumption. For example, AC may reduce household electricity consumption to some extent, possibly because households choose to purchase and use expensive but more energy-efficient AC equipment to reduce the expenditures associated with electricity consumption [47]. However, this finding is valid only for AC, and the effect for other household appliances, such as TVs, is not significant [48].
Summary: U, PGDP, OLD, and F followed the same trend as the UHEC. HDD, FSIZE, and AC, on the other hand, moved in the opposite direction. However, other factors, such as TV and CDD, do not accurately explain the changes in household electricity consumption.
Although this study makes some crucial discoveries, it has several limitations. Studies at home and abroad have shown that policy and other variables significantly impact electricity consumption [49]; however, these variables could not be included in this study because a data set consistent with the panel data model could not be obtained. Collecting and adding reliable data to the model would strengthen its explanatory ability, and it could then be used to predict the power demand of future urban residents. At present, the study of residential electricity consumption and less consideration through social psychological intervention affect the possibility of residential electricity intensity; a foreign study found that residents of electricity intensity may also be affected by their environmental awareness and attitudes toward electricity [50].
Nevertheless, some exogenous factors (energy-saving behaviour, living comfort, and policy) also significantly impact household electricity consumption. Theoretically, including these factors in the extended STIRPAT model would improve the credibility and accuracy of assessment results. However, the current problem is that Equation (3) cannot incorporate abstract factors that cannot be quantified. Therefore, this issue should be considered in subsequent studies, which could formulate an acceptable quantitative idea or a reasonably feasible approach.
In summary, this study’s findings will positively impact the Chinese government’s efforts to develop practical strategies for saving energy in household electricity consumption.

6. Conclusions and Policy Recommendations

Based on the STIRPAT model and provincial panel data analysis, this study examined a range of factors affecting household electricity consumption in China from 2005 to 2020. The authors argue that effectively assessing the contribution of different factors of household electricity consumption as a means of promoting the implementation of energy-efficiency strategies for urban households and residential energy-efficiency efforts in China is an essential step in advancing China’s sustainable development strategy. There are some concluding remarks and policy recommendations.
This study examined five indicators related to electricity consumption and found that China’s household electricity consumption has varied considerably between provinces in recent years. Typically, provinces with a higher total provincial electricity consumption are accompanied by faster and advanced development. It is also essential to optimise the provincial energy mix as large coal reserves are used to generate electricity to keep cities powered. Considering the specific circumstances of different regions, provincial authorities should promote the development and structural weight of new energy sources, increase the use of clean energy generation such as hydro, wind, and solar power, reduce the use of and dependency on coal power, and develop price measures according to local conditions.
U, PGDP, ELD, HDD, F, AC, and FSIZE are important in explaining the changes in household electricity consumption in China. However, in this study, some household appliances (TV) and CDD could not accurately explain the changes in household electricity consumption. This study’s findings suggest that households with larger floor area per capita and more elderly residents tend to consume more electricity. These influences will become more critical for household electricity consumption as population aging increases and celibacy becomes more prevalent. A good way for the government to try and introduce energy-efficient equipment for older people’s homes at a local level is to try and do this. The larger the household size per capita, the lower the energy consumption. In the face of increasing aging rates and the weakness of the two- and three-child policy, the government should provide better incentives and policy protection for households that qualify for the two- and three-child policy. Urbanisation and per capita income are also important factors. At the provincial level, the government should promote urbanisation rates to boost the economy in terms of food, clothing, and housing, rather than simply increasing the controversial urbanisation rate by converting farmers to non-farmers.
Different household devices may have different effects; as they are essential factors in reducing electricity consumption, it is necessary to improve their efficiency. The government encourages the market and households to phase out energy-intensive and old household devices and promote energy-efficient intelligent appliances for the home that can be turned on and off using intelligent algorithms. Therefore, appropriate policy subsidies should be promoted.
In terms of climate impacts, provincial governments should take a complete account of each province’s climate when revising provincial energy-efficiency standards, even those that are relatively up-to-date. They should also strengthen the assessment of the sustainability of the entire life cycle of residential construction.
This study adds to previous studies and findings and makes appropriate policy recommendations. However, despite considerable progress in energy conservation and emission reduction in China, there are still shortcomings in quantifying primary household electricity consumption data at the regional level, which is a shortcoming of this study. Government provision of detailed and reliable data is a prerequisite for the successful implementation of the related study. These data are also important indicators for evaluating the effectiveness of energy efficiency at the national and provincial levels. Therefore, it is necessary for China to vigorously promote the construction of a sound statistical system for household electricity consumption at the provincial and regional levels, which is a key requirement to improve China’s household energy efficiency.

Author Contributions

Conceptualisation, Y.W.; methodology, Y.W.; software, L.H.; verification, Y.W. and J.B.; investigation, Y.W.; analysis, Y.W. and L.H.; data curation, W.C. and L.H.; writing—original draft preparation, Y.W.; writing—review and editing, Y.W. and L.H.; visualisation, L.H.; supervision, Y.W. and W.C.; project management, W.C. and Z.Z.; funding access, Y.W. and Z.Z. All authors have read and agreed to the published version of the manuscript.

Funding

This research was funded by the Chongqing Housing and Urban–Rural Development Commission (Grant No. 2021-2-8) and Natural Science Basic Research Program of Shaanxi (Grant No. 2022JQ-733).

Institutional Review Board Statement

Not applicable.

Informed Consent Statement

Informed consent was obtained from all the subjects involved in the study.

Data Availability Statement

Not applicable.

Acknowledgments

We thank all anonymous reviewers for their invaluable and constructive comments on an earlier draft of this manuscript and hence their contribution to the substantial revisions made since that time.

Conflicts of Interest

The authors declare no conflict of interest.

References

  1. Wang, Y.; Lin, M.; Gao, J.; Zhou, Z. Fading Attraction of the Shrinking City: An Empirical Study from an Urban Resource Perspective. Sustainability 2021, 13, 11550. [Google Scholar] [CrossRef]
  2. Asadoorian, M.O.; Eckaus, R.S.; Schlosser, C.A. Modeling climate feedbacks to electricity demand: The case of China. Energy Econ. 2008, 30, 1577–1602. [Google Scholar] [CrossRef]
  3. Ma, M.; Ma, X.; Cai, W.; Cai, W. Low carbon roadmap of residential building sector in China: Historical mitigation and prospective peak. Appl. Energy 2020, 273, 115247. [Google Scholar] [CrossRef]
  4. Boogen, N.; Datta, S.; Filippini, M. Demand-side management by electric utilities in Switzerland: Analyzing its impact on residential electricity demand. Energy Econ. 2017, 64, 402–414. [Google Scholar] [CrossRef]
  5. Zhang, Z.; Cai, W.; Feng, X. How do urban households in China respond to increasing block pricing in electricity? Evidence from a fuzzy regression discontinuity approach. Energy Policy 2017, 105, 161–172. [Google Scholar] [CrossRef]
  6. Wu, Y.; Wu, Y.; Zhang, Y.; Wang, X.; Song, Z. The Effect of Building Electricity Consumption on Residents’ Subjective Well-Being: Evidence from China. Buildings 2022, 12, 710. [Google Scholar] [CrossRef]
  7. Shen, M.; Lu, Y.; Wei, K.H.; Cui, Q. Prediction of household electricity consumption and effectiveness of concerted intervention strategies based on occupant behaviour and personality traits. Renew. Sustain. Energy Rev. 2020, 127, 109839. [Google Scholar] [CrossRef]
  8. Freier, J.; von Loessl, V. Dynamic electricity tariffs: Designing reasonable pricing schemes for private households. Energy Econ. 2022, 112, 106146. [Google Scholar] [CrossRef]
  9. Liu, S.W.; Zhang, Z.; Yang, J.H.; Hu, W. Exploring Increasing Urban Resident Electricity Consumption: The Spatial Spillover Effect of Resident Income. Energies 2022, 15, 4249. [Google Scholar] [CrossRef]
  10. Wang, Z.H.; Lu, M.L.; Wang, J.C. Direct rebound effect on urban residential electricity use: An empirical study in China. Renew. Sustain. Energy Rev. 2014, 30, 124–132. [Google Scholar] [CrossRef]
  11. Zhang, M.Y.; Chen, Y.L.; Hu, W.Y.; Deng, N.X.; He, W.J. Exploring the impact of temperature change on residential electricity consumption in China: The ‘crowding-out’ effect of income growth. Energy Build. 2021, 245, 111040. [Google Scholar] [CrossRef]
  12. Borge-Diez, D.; Icaza, D.; Trujillo-Cueva, D.F.; Acikkalp, E. Renewable energy driven heat pumps decarbonization potential in existing residential buildings: Roadmap and case study of Spain. Energy 2022, 247, 123481. [Google Scholar] [CrossRef]
  13. Wang, X.; Fang, Y.; Cai, W.G.; Ding, C.; Xie, Y.P. Heating demand with heterogeneity in residential households in the hot summer and cold winter climate zone in China -A quantile regression approach. Energy 2022, 247, 123462. [Google Scholar] [CrossRef]
  14. Ohler, A.; Loomis, D.G.; Marquis, Y. The Household Appliance Stock, Income, and Electricity Demand Elasticity. ENERGY J. 2022, 43, 241–262. [Google Scholar] [CrossRef]
  15. Godoy-Shimizu, D.; Palmer, J.; Terry, N. What Can We Learn from the Household Electricity Survey? Buildings 2014, 4, 737–761. [Google Scholar] [CrossRef]
  16. Kavousian, A.; Rajagopal, R.; Fischer, M. Determinants of residential electricity consumption: Using smart meter data to examine the effect of climate, building characteristics, appliance stock, and occupants’ behavior. Energy 2013, 55, 184–194. [Google Scholar] [CrossRef]
  17. Jo, H.; Kim, H. Analyzing Electricity Consumption Factors of Buildings in Seoul, Korea Using Multiscale Geographically Weighted Regression. Buildings 2022, 12, 678. [Google Scholar] [CrossRef]
  18. Li, X.X. Linking residential electricity consumption and outdoor climate in a tropical city. Energy 2018, 157, 734–743. [Google Scholar] [CrossRef]
  19. Randazzo, T.; De Cian, E.; Mistry, M.N. Air conditioning and electricity expenditure: The role of climate in temperate countries. Econ. Model. 2020, 90, 273–287. [Google Scholar] [CrossRef]
  20. Kalani, M.J.; Kalani, M. Energy cost control of LEDs considering the price of electricity and the desired lighting levels to meet the requirements of smart grids, smart cities, and unregulated energy markets. Optik 2022, 258, 168926. [Google Scholar] [CrossRef]
  21. Du, G.; Lin, W.; Sun, C.W.; Zhang, D.Z. Residential electricity consumption after the reform of tiered pricing for household electricity in China. Appl. Energy 2015, 157, 276–283. [Google Scholar] [CrossRef]
  22. McLoughlin, F.; Duffy, A.; Conlon, M. Characterising domestic electricity consumption patterns by dwelling and occupant socio-economic variables: An Irish case study. Energy Build. 2012, 48, 240–248. [Google Scholar] [CrossRef]
  23. Esmaeilimoakher, P.; Urmee, T.; Pryor, T.; Baverstock, G. Identifying the determinants of residential electricity consumption for social housing in Perth, Western Australia. Energy Build. 2016, 133, 403–413. [Google Scholar] [CrossRef]
  24. Wang, Y.; Ren, H.; Dong, L.; Park, H.-S.; Zhang, Y.; Xu, Y. Smart solutions shape for sustainable low-carbon future: A review on smart cities and industrial parks in China. Technol. Forecast. Soc. Chang. 2019, 144, 103–117. [Google Scholar] [CrossRef]
  25. Romero-Jordán, D.; del Río, P. Analysing the drivers of the efficiency of households in electricity consumption. Energy Policy 2022, 164, 112828. [Google Scholar] [CrossRef]
  26. Lei, M.; Cai, W.; Liu, W.; Wang, C. The heterogeneity in energy consumption patterns and home appliance purchasing preferences across urban households in China. Energy 2022, 253, 124079. [Google Scholar] [CrossRef]
  27. Yalcintas, M.; Kaya, A. Roles of income, price and household size on residential electricity consumption: Comparison of Hawaii with similar climate zone states. Energy Rep. 2017, 3, 109–118. [Google Scholar] [CrossRef]
  28. Moll, H.C.; Noorman, K.J.; Kok, R.; Engstrom, R.; Throne-Holst, H.; Clark, C. Pursuing more sustainable consumption by analyzing household metabolism in European countries and cities. J. Ind. Ecol. 2005, 9, 259–275. [Google Scholar] [CrossRef]
  29. Jones, R.V.; Fuertes, A.; Lomas, K.J. The socio-economic, dwelling and appliance related factors affecting electricity consumption in domestic buildings. Renew. Sustain. Energy Rev. 2015, 43, 901–917. [Google Scholar] [CrossRef]
  30. Hu, S.; He, J.; Yang, C. Evaluating the impacts of the increasing block tariffs on residential electricity consumption in China. Sustain. Prod. Consum. 2022, 29, 180–187. [Google Scholar] [CrossRef]
  31. Du, K.; Yu, Y.; Wei, C. Climatic impact on China’s residential electricity consumption: Does the income level matter? China Econ. Rev. 2020, 63, 101520. [Google Scholar] [CrossRef]
  32. Brounen, D.; Kok, N.; Quigley, J.M. Residential energy use and conservation: Economics and demographics. Eur. Econ. Rev. 2012, 56, 931–945. [Google Scholar] [CrossRef]
  33. Davis, L.W.; Gertler, P.J. Contribution of air conditioning adoption to future energy use under global warming. Proc. Natl. Acad. Sci. USA 2015, 112, 5962–5967. [Google Scholar] [CrossRef]
  34. Han, P.; Kimura, F.; Sandu, S. Household-level analysis of the impacts of electricity consumption on welfare and the environment in Cambodia: Empirical evidence and policy implications. Econ. Model. 2020, 89, 476–483. [Google Scholar] [CrossRef]
  35. York, R.; Rosa, E.A.; Dietz, T. STIRPAT, IPAT and ImPACT: Analytic tools for unpacking the driving forces of environmental impacts. Ecol. Econ. 2003, 46, 351–365. [Google Scholar] [CrossRef]
  36. Ma, M.; Shen, L.; Ren, H.; Cai, W.; Ma, Z. How to Measure Carbon Emission Reduction in China’s Public Building Sector: Retrospective Decomposition Analysis Based on STIRPAT Model in 2000–2015. Sustainability 2017, 9, 1744. [Google Scholar] [CrossRef]
  37. Huo, T.F.; Li, X.H.; Cai, W.G.; Zuo, J.; Jia, F.Y.; Wei, H.F. Exploring the impact of urbanization on urban building carbon emissions in China: Evidence from a provincial panel data model. Sustain. Cities Soc. 2020, 56, 102068. [Google Scholar] [CrossRef]
  38. Gao, J.X.; Zhong, X.Y.; Cai, W.G.; Ren, H.; Huo, T.F.; Wang, X.; Mi, Z.F. Dilution effect of the building area on energy intensity in urban residential buildings. Nat. Commun. 2019, 10, 4944. [Google Scholar] [CrossRef]
  39. Ma, M.D.; Yan, R.; Cai, W.G. A STIRPAT model-based methodology for calculating energy savings in China’s existing civil buildings from 2001 to 2015. Nat. Hazards 2017, 87, 1765–1781. [Google Scholar] [CrossRef]
  40. Liddle, B.; Lung, S. Revisiting energy consumption and GDP causality: Importance of a priori hypothesis testing, disaggregated data, and heterogeneous panels. Appl. Energy 2015, 142, 44–55. [Google Scholar] [CrossRef]
  41. Liu, W.; Luo, Z.C.; Xiao, D. Age Structure and Carbon Emission with Climate-Extended STIRPAT Model-A Cross-Country Analysis. Front. Environ. Sci. 2022, 9, 719168. [Google Scholar] [CrossRef]
  42. Wang, Y.; Yang, G.C.; Dong, Y.; Cheng, Y.; Shang, P.P. The Scale, Structure and Influencing Factors of Total Carbon Emissions from Households in 30 Provinces of China-Based on the Extended STIRPAT Model. Energies 2018, 11, 1125. [Google Scholar] [CrossRef]
  43. Bilgili, F.; Kocak, E.; Bulut, U.; Kuloglu, A. The impact of urbanization on energy intensity: Panel data evidence considering cross-sectional dependence and heterogeneity. Energy 2017, 133, 242–256. [Google Scholar] [CrossRef]
  44. Bakirtas, T.; Akpolat, A.G. The relationship between energy consumption, urbanization, and economic growth in new emerging-market countries. Energy 2018, 147, 110–121. [Google Scholar] [CrossRef]
  45. Huang, W.-H. The determinants of household electricity consumption in Taiwan: Evidence from quantile regression. Energy 2015, 87, 120–133. [Google Scholar] [CrossRef]
  46. Berkouwer, S.B. Electric Heating and the Effects of Temperature on Household Electricity Consumption in South Africa. Energy J. 2020, 41, 209–230. [Google Scholar] [CrossRef]
  47. Zhang, S.; Guo, Q.; Smyth, R.; Yao, Y. Extreme temperatures and residential electricity consumption: Evidence from Chinese households. Energy Econ. 2022, 107, 105890. [Google Scholar] [CrossRef]
  48. Leahy, E.; Lyons, S. Energy use and appliance ownership in Ireland. Energy Policy 2010, 38, 4265–4279. [Google Scholar] [CrossRef]
  49. Lin, B.Q.; Chen, X. Is the implementation of the Increasing Block Electricity Prices policy really effective?—Evidence based on the analysis of synthetic control method. Energy 2018, 163, 734–750. [Google Scholar] [CrossRef]
  50. Paco, A.; Lavrador, T. Environmental knowledge and attitudes and behaviours towards energy consumption. J. Environ. Manag. 2017, 197, 384–392. [Google Scholar] [CrossRef]
Figure 1. Final electricity consumption by different sectors. Note: “Electricity power” is a brief expression for “electricity, coal, and water supply industries”.
Sustainability 14 09960 g001
Figure 2. Hypothesis framework.
Sustainability 14 09960 g002
Figure 3. Factors of urban household electricity consumption in China.
Sustainability 14 09960 g003
Figure 4. The spatial distribution of total urban household electricity consumption.
Sustainability 14 09960 g004
Figure 5. Electricity consumption per capita.
Sustainability 14 09960 g005
Figure 6. Electricity consumption per square metre.
Sustainability 14 09960 g006
Figure 7. Average annual growth rate of some indicators.
Sustainability 14 09960 g007
Figure 8. The relationship between GDP per capita and electricity consumption per capita in each province. (Note: Circle sizes represent provincial-level urban household electricity consumption).
Sustainability 14 09960 g008aSustainability 14 09960 g008b
Table 1. Declaration of the model variables.
ClassificationVariableVariable NameTypeSource of Data
Dependent
variable
EUrban
household
electricity
consumption
Explained
variable
China Energy Statistical
Yearbook
Demographic factorFSIZEAverage
family size
(person/household)
Explanatory
variable
China
Statistical
Yearbook
ELDERPresence of
elderly
people
Explanatory
variable
China
Statistical
Yearbook
Economic
factors
PGDPPer capita gross domestic
product
Explanatory
Variable
China
Statistical
Yearbook
UrbanisationUUrbanisation level in ChinaExplanatory
variable
China demographic and employment
statistics yearbook
Household
appliances
ACAir
conditioner
per
household
Explanatory
Variable
China
Statistical
Yearbook
TVColour TV per householdExplanatory
variable
China
Statistical
Yearbook
Floor areaFFloor area per capitaExplanatory
variable
City statistical yearbooks
TemperatureCDDCooling
degree days
Explanatory
Variable
National Weather
Service
China
HDDHeating
degree days
Explanatory
Variable
National Weather
Service
China
Table 2. Correlation matrix of explanatory variables of LnE.
Ln (FSIZE)Ln (PGDP)Ln (U)Ln (AC)Ln (TV)Ln (F)Ln (CDD)Ln (HDD)Ln (OLD)
Ln (FSIZE)1
Ln (PGDP)−0.635 ***1
Ln (U)−0.705 ***0.885 ***1
Ln (AC)−0.311 ***0.433 ***0.422 ***1
Ln (TV)−0.243 ***0.120 ***0.231 ***0.566 ***1
Ln (F)−0.113 **0.455 ***0.221 ***0.425 ***0.234 ***1
Ln (CDD)−0.084 *0.253 ***0.297 ***0.800 ***0.577 ***0.438 ***1
Ln (HDD)−0.266 ***−0.002000.0130−0.440 ***−0.269 ***−0.304 ***−0.613 ***1
Ln (OLD)−0.198 ***0.080 *−0.04400.538 ***0.338 ***0.332 ***0.328 ***−0.086 *1
Note: *, **, and *** indicate significance at the 1%, 5%, and 10% levels, respectively.
Table 3. Explanation of variables’ VIF diagnosis.
Model (LnE)CoefficientsStd. ErrorP > |t|ToleranceVIF
C−10.5140.7050.00000
Ln (FSIZE)−0.1370.1570.3840.3562.81
Ln (PGDP)0.4520.0500.0000.1119.03
Ln (U)0.5930.1340.0000.1069.45
Ln (AC)−0.0400.0170.0230.2014.97
Ln (TV)0.2210.0880.0130.5431.84
Ln (F)0.3710.0830.0000.4552.20
Ln (CDD)−0.0480.0100.0000.2214.52
Ln (HDD)−0.1340.0180.0000.5021.99
Ln (OLD)0.8780.0190.0000.4702.13
Table 4. Outputs of the Hausman test.
Test SummaryChi-Sq. StatisticChi-Sq. d. f.Prob.
Model (1)Cross-section random62.62290.000
Model (2)Cross-section random52.84870.000
Table 5. Estimated results of the fixed effect model.
VariableModel (1)Model (2)
Ln (U)0.671 *** (5.627)0.657 *** (5.520)
Ln (PGDP)0.515 *** (15.628)0.535 *** (17.618)
Ln (HDD)−0.106 *** (−2.497)−0.113 *** (−2.674)
Ln (OLD)0.286 *** (4.841)0.315 *** (5.520)
Ln (TV)−0.182 (−1.572)
Ln (FSIZE)−0.367 *** (−3.738)−0.383 *** (−3.910)
Ln (F)0.152 *** (2.682)0.149 *** (2.624)
Ln (CDD)0.007 (0.889)
Ln (AC)−0.065 *** (−2.258)−0.073 *** (−2.580)
C−4.079 *** (−4.3355)−5.202 *** (−8.333)
Adjust R20.9850.985
F776.553816.978
P0.0000.000
DW0.4710.480
Note: *, **, and *** indicate significance at the 1%, 5%, and 10% levels, respectively.
Publisher’s Note: MDPI stays neutral with regard to jurisdictional claims in published maps and institutional affiliations.

