1. Introduction
In recent years, environmental issues have escalated significantly, including increased carbon emission which further enhances global warming, as well as excessive pollution, due to toxic emissions and massive amounts of garbage [
1]. As one means to counteract this evolution, there has been a surge in the invention and production of so-called “green products”, which are often made of recycled or low-polluting materials.
Despite this, one of the most important parts for managing the imminent environmental challenge, is consumers’ awareness rooted in individual dedication and commitment towards the solution [
2,
3]. The motivation for green purchasing should begin with the consumer [
2,
4]. The most common motivations behind the increasing demand for sustainable production and products are compliance and avoiding negative effects; these two factors are the most frequent drivers of companies to act sustainably [
4].
As the environmental issues grow, it becomes vital to make plans for the future. Sustainability poses multiple challenges and opportunities for businesses [
1]. Consequently, tremendous benefits lie ahead for businesses who develop sustainable products and services. It is, therefore, important to study how consumers are responding to products’ lowered environmental impact to be able to adjust green marketing strategies accordingly, and for manufacturers to see value in moving towards sustainable manufacturing processes.
In this paper, we study consumers’ attitudes towards green products and compare them to actual purchases of such goods. Our approach is two-fold. On the one hand, we study consumers’ attitudes and intentions towards green products through a survey. The survey presents a direct response from the consumer and gives us the opportunity to study their views and intentions to choose environmentally friendly products. On the other hand, we take a data-driven approach to consumers’ purchasing behavior, specifically focusing on products that have gone through a ‘green’ transition towards decreasing their environmental impact. The data were provided by a large retail store in Iceland. Analysis of the purchasing data allows us to investigate the consumers’ actual responses to the introduction of green products and whether this introduction actually affects their purchasing behavior.
Our research is based on the following two research questions, in which the first one is oriented towards survey data analysis, while the second one is oriented towards purchasing data analysis:
- i
What type of attitudes do consumers have when it comes to green purchases?
- ii
Does the environmental impact of products have an effect on consumers’ purchasing behavior?
The main contribution of this paper is the conceptualization of consumers’ green purchases. We show through our survey data that consumers in general have high maturity when it comes to environmental awareness and would like to make green purchases; however, through the purchasing data, we show that there is a low follow-through. The purchases are generally not green. This calls for new types of initiatives that can support consumers in their in-store decision-making processes, since the consumers want to act in a more sustainable manner, but are, to a large extent, unable to do so.
The rest of this paper is organized as follows: In the next section, we present literature related to our research, focusing on green products and green purchasing.
Section 3 explains the research approach and the methods used.
Section 4 presents the results and their interpretation. Finally,
Section 5 presents the discussion about this research and
Section 6 presents the conclusions and direction for future work.
2. Literature Review
Nowadays, there is a growing popularity of ‘green’ products to increase sustainability and decrease the carbon footprint. To date, there is no unified definition of the concept ‘green products’. One definition of green products is “when its environmental and societal performance, in production, use and disposal, is significantly improved and improving in comparison to conventional or competitive products offerings” [
5].
More simply put, green products are products that have a lower environmental impact compared either to other products, or to prior versions of the same product. Producing a product with a low environmental impact means ensuring that, throughout the complex life cycle (from extraction of raw materials to disposal as waste (or recycling)), the contribution to environmental change, in at least one of its matrices, e.g., air, water and soil, is reduced. A reduction in environmental impact can be achieved by those who make the product through improvements in production processes or technologies, either directly managed or influenced upstream or downstream of their position in the production chain.
From a purchasing perspective, with increasing threats to the environment, an increasing number of people have started to pay attention to sustainable development to protect the environment and society. The concepts of green purchase and green marketing have gradually become popular [
6,
7]. Theories such as the Theory of Reasoned Action and Theory of Planned Behavior underline the research in consumers’ purchasing behavior [
8,
9,
10]. These models aim to explain volitional behaviors and have been used to predict behavioral intentions and behaviors [
11], and identify strategies for changing behavior. These theories have been used, to a large extent, to shed light on the sustainability debate. Green purchase intention (GPI) is the concept of consumers’ willingness and probability to give preference to products which have environmentally friendly features over other products in their purchase intention. Regarding consumers’ experiences with green products, it plays an influential role in their green purchase decisions [
12]. In relation to consumers’ inquisitiveness to gain knowledge on the environmental aspects and features of green products, the consumers strive to gain knowledge on their ingredients, the environmental impact, and their functionality [
7]. This further influences consumers’ purchasing decisions, enabling them to make the right informed purchasing decisions and develop their willingness to pay more for green products [
13,
14]. Purchasing decisions are in a form of purchasing green products, supporting green companies [
15,
16], and adopting sustainable consumption [
7]. Green consumers are those who take the environmental impact of their consumption pattern into consideration and intend to modify their purchasing and consumption patterns to reduce their environmental impact [
6]. It is interesting to understand what the difference is between consumers’ perception of their actions towards sustainable purchases and what their behavior is, by studying purchasing patterns [
17,
18]. There has already been other studies that compare consumers’ attitudes and their actual behavior towards green products, such as the study in South Africa that compared female attitudes and purchase intentions towards green cosmetics [
19]. That study demonstrated that there is a positive correlation between women’s intention and their purchasing behavior. However, other research shows that consumers are inclined to buy green products only when there are immediate and tangible benefits, as well as being more environmentally friendly [
20].
3. Materials and Methods
This research study relied on a quantitative data analysis approach, as the research focuses on a numerical analysis of purchase data and analysis of survey results. The quantitative approach is structured for numerical and statistical analysis where prearranged processes, questions, and design pose certain flexibility issues [
21].
To answer the research question “Does the environmental impact of products have an effect on consumers’ purchasing behavior?”, data are obtained by two methods.
First we conducted a survey which provided data directly from the consumer and gave a perspective on their purchasing attitudes and intentions towards green products, and secondly, we gathered consumers’ purchasing data from a large retail store on selected products. The purpose of the purchasing data analysis is to study how consumers react to products with a lowered environmental impact. The results are then compared to research on how consumers’ attitudes and intentions differ from their actual purchasing behavior.
All the analyses were conducted in an abductive manner [
22].
3.1. Purchasing Attitude
3.1.1. Survey Methodology
To answer our first research question, we created a survey in a web- and email-based configuration. The web-based section was distributed to consumers using social media. This proves beneficial in reaching large number of respondents with a quick turnaround time. To conduct the email-based survey, the Reykjavik University (RU) email service was utilized. The respondents are students and faculty in the university.
For the structure of the survey, we used a 5-point Likert scale. The possible answers were: Strongly agree, Agree, Neither agree nor disagree, Disagree, and Strongly disagree.
Each possibility was given a corresponding number for Statistical Package for the Social Sciences (SPSS) analysis, ranging from 5 to 1, with 5 representing strongly agree, and 1 representing strongly disagree. These options should represent a symmetric and balanced choice selection with the position of the neutrality exactly between the two extremes of strongly disagree and strongly agree [
23].
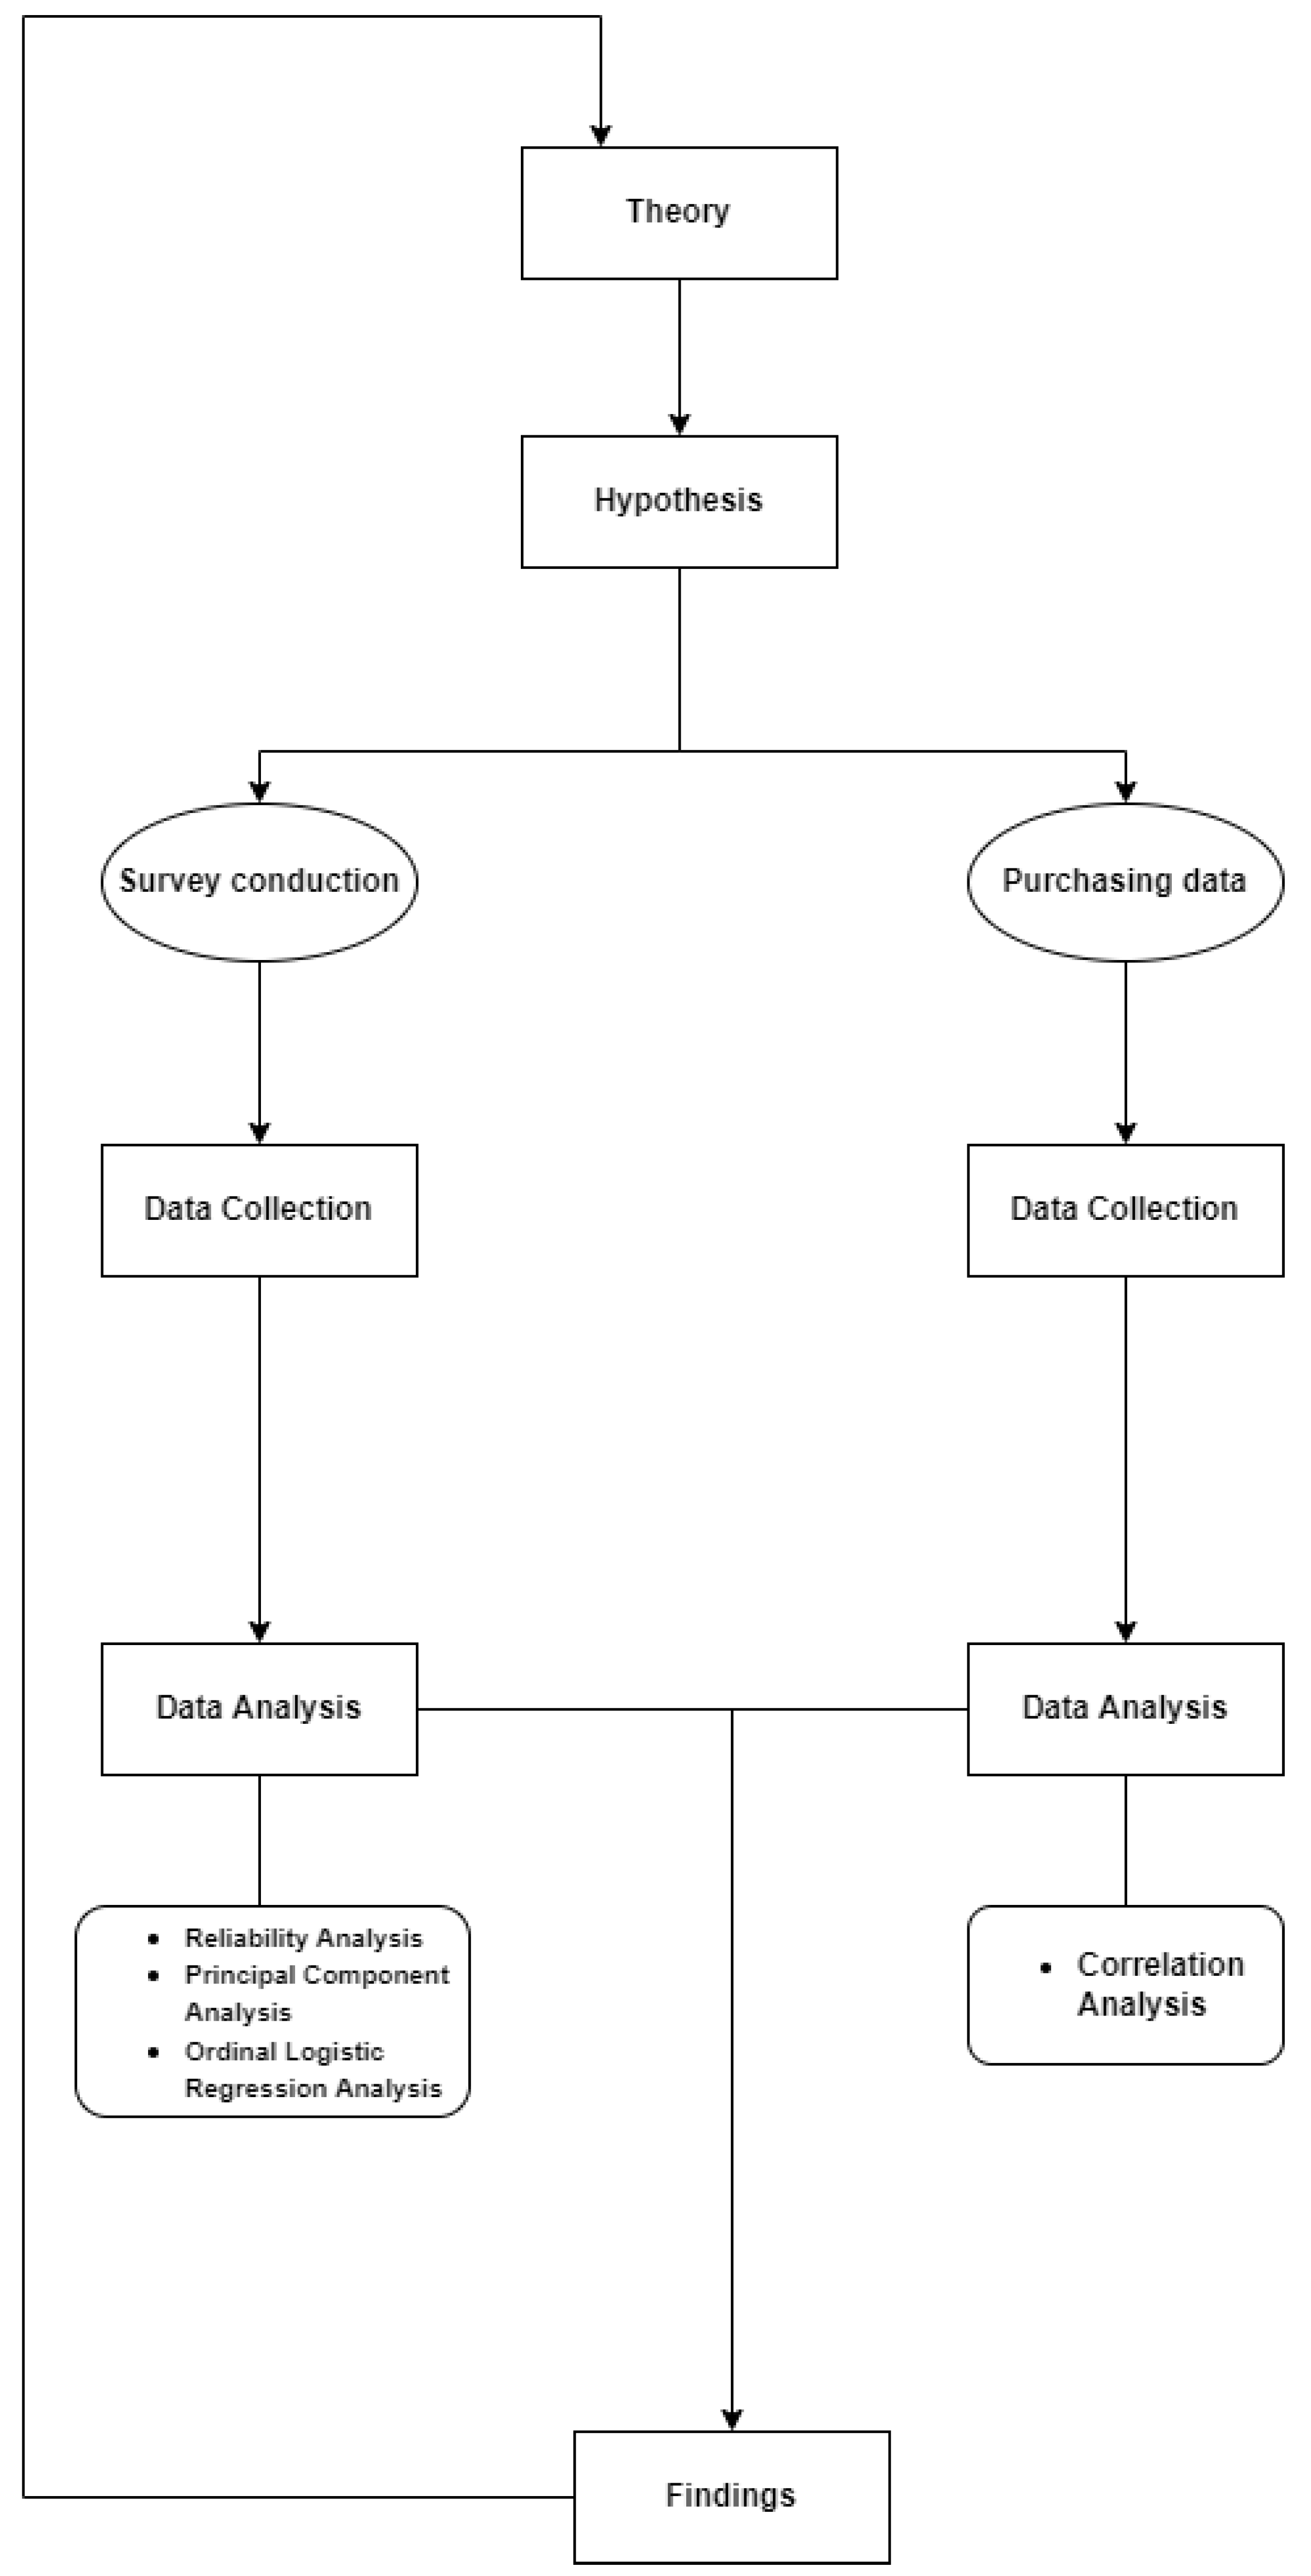
Figure 1 shows the research process of the present study.
3.1.2. Survey Questions
The questions in the survey were derived from a number of studies on similar topics [
10,
12,
24,
25], but structured in a way to fit this research more adequately.
Table 1 shows the survey questions.
The survey was sent by email to the students of Reykjavik University and by social media on 30 March 2021 and ended on 6 April 2021. The survey contained ten questions, took two minutes to complete, and participants were encouraged to answer all questions consciously. Anonymity and confidentiality was also guaranteed.
3.1.3. Survey Analysis
Survey analysis is used to answer the first research question. The survey questions are analysed through Reliability Analysis, Principal Component Analysis (PCA), and Ordinal Logistic Regression Analysis (OLRA). This procedure is necessary to study the reliability of the scale used and how questions correlate with each other for guidance on classifying the questions in components.
Reliability analysis allows to study the properties of measurement scales and the items that compose the scales [
26]. As parameters for the analysis, we used corrected item-to-total correlation (CITC), Cronbach’s alpha, variance, and standard deviation. The Cronbach’s alpha coefficient is a commonly used indicator of internal consistency and a measure of the underlying construct [
27]. A Cronbach’s alpha of 0.7 or higher is considered acceptable [
28]. However, since the survey contained fewer than ten questions, low Cronbach’s values are commonly found [
27]. The CITC value depicts how each question correlates to all other questions in the analysis.
The Principal Component Analysis (PCA) method transforms variables into a set of new composite variables (principal components) that are not directly correlated [
29]. This approach is useful to reduce the number of related variables to smaller dimensions to explore the underlying structure of the set variables [
27]. The questions were then classified in sections depending on the joint components between questions.
Ordinal Logistic Regression Analysis (OLRA) is a statistical analysis method used in this research to answer the first research question. PCA analysis in
Section 4.1.4 was used to analyze both GPI and Environmentally Convern (EC), and a mean value was calculated.
3.2. Purchasing Behavior
3.2.1. Purchasing Data
To study the actual purchasing behavior, we analyzed time series data on the quantities of daily product purchases provided by a major Icelandic supermarket. We had information about the daily number of quantities sold of each product, spanning over two years, from 1 January 2019 until mid March 2021.
As the goal of this research is to study the consumption of green products, we narrowed the dataset to products that met the following requirements:
- 1
The product underwent changes to lower its environmental impact;
- 2
The product has been on the market for longer than the period which the retrieved data covers;
- 3
The product has information on the lowered environmental impact on its exterior or packaging.
Among all the brands and products available in the dataset, the Tresemmé products satisfied all the above mentioned conditions; therefore, this research will focus on the Tresemmé product line. Their products had undergone a transition on its environmental impact in the time frame that this research is focusing on, with information on these changes clearly stated on the product container. Moreover, they launched a marketing campaign, stating that their new packaging was more environmental friendly. That, in addition to the noticeable information clearly stated on the product container about the lower carbon footprint, rendered the product feasible. While the Tresemmé containers are comprised of plastic, they are recyclable but have been indistinguishable by the sorting machine at the recycling center. To sort this issue, Tresemmé developed a new detectable pigment for the plastic containers which allows them to be detected by sorting machines at the recycling centers. According to Tresemmé, these changes will save up to 2.500 tonnes of black plastic going to waste each year. These changes have already been implemented to Tresemmé products with hopes to decrease black plastic waste. At this point, we would like to highlight that the products illustrated specifically (for instance, Tresemmé) are used for illustrative purposes, and as such, it is not the product per se that we focus on, instead, the focal point is on the impact that the product represents.
The purchasing data cover over two years, and depicts ten different Tresemmé products bought from 28 stores from early January in 2019, until middle of March in 2021. The data are split in three sections: Tresemmé regular (REG), Tresemmé recyclable (REC), and the comparison products (NORM). REG are the Tresemmé products which have not experienced any changes in their containers in terms of recycling and REC are the Tresemmé products that have undergone the pigment modifications. NORM are the Tresemmé products used for direct comparison with REG and REC in terms of correlation between 2019 and 2020.
3.2.2. Analysis of Purchasing Data
The data was analyzed by conducting a correlation analysis between Tresemmé NORM, Tresemmé REC, and Tresemmé REG, comparing with the correlations of the same sections from a period before the lowered environmental impact of the Tresemmé products. This allowed us to study consumer reactions towards these changes. A Pearson correlation analysis for 2019/2020 was conducted after normalizing the data and ANOVA linearity testing was established.
To study the significance of correlation coefficients between 2019 and 2020, calculations of correlations between NORM20Q2 and REC20Q2, and NORM19 and REC19 will be conducted by the following equation:
and are respectively the total usable days for 2019–2020 and for 2020 Q2–2021 Q1.
Using Correlation Coefficient Table in [
27] and considering NORM20Q2 and REG20Q2 as r1 and NORM19 and REG19 as r2, inserting r1 = 0.125 and gaining a corresponding
value of 0.126 and same for the r2 = 0.212 with a
value of 0.213, the equation gives with
= 348 and
= 363 a
value of 1.154. If the
value is between −1.96 and +1.96, there is not a statistically significant difference between the two correlation coefficients [
27].
Same procedure is done for NORM20Q2 and REG20Q2 using r1 = 0.283 and NORM19 and REG19 with r2 = 0.270, the results give a value of 0.212, which is also between the −1.96 and +1.96 range, signifying that there is not a statistically significant difference between the two correlation coefficients.
4. Results
The results of the present research work are divided into survey results and data results. All analyses were conducted using SPSS.
4.1. Survey Results
First of all, we present the main characteristics (gender, age) of the survey participants. Then, we describe the results of the analysis and testing.
4.1.1. Participants Characteristics
The target audience for the survey were people 18 years or older, since the subject of sustainability and Environmentally Friendly Products (EFP) may be difficult to comprehend for minors [
30]. A total of 166 people responded to the survey, of whom 93 were male (56%), 71 were female (43%), and two individuals (1%) self-identified as other. The participant age range was from 20 to 69 years old, with 92 (55%) aged between 20–29 years old. the respondents’ origin were predominantly from Iceland, 161 (97%), and the email-based survey accounted for 118 (71%) of the participants. The participation ratio from the email-based survey was around 5.5%, but the ratio is uncertain from the social media survey.
Table 2 shows the survey’s participant characteristics.
4.1.2. Reliability Analysis
The internal scale consistency is one of the main concerns, or the degree by which the questions that make up the scale “hang together”.
Question 6 (Q6) showed a negative CITC value of −0.052 which may have indicated that the question was negatively worded and was moving in a different direction compared with other questions. To adjust for this, a re-coding process was conducted where each value in the 1–5 Likert scale was reversed to correlate with the other questions [
31]. After re-coding Q6, the CITC value was positive at 0.052 but still too low [
27], and was, therefore, excluded from further analysis.
Table 3 depicts the reliability analysis.
All CITC values were within the acceptable range of 0.3 [
27], apart from Q5, which was then revised. Additionally, the Cronbach’s alpha value was above 0.7, which was acceptable, with the mean inter-item correlation factor of 0.288, which was within the range of 0.2–0.4 [
27]. These questions were used in a Principal Component Analysis for guidance on forming the Environmental Concern (EC) and Green Purchase Intention (GPI) sections.
4.1.3. Principal Component Analysis
Table 4 shows the correlation matrix of the PCA, i.e., how each question relates to one another. This should not be directly compared to the CITC value explained above, as the CITC value compares each question and the other questions are a total corrected value.
As per the literature, the correlation values should preferably be 0.3 or above for the majority of the matrix [
27]. Here, of the 21 values, 8 are above 0.3 and 7 are close to the 0.3 value, and are used in further analysis.
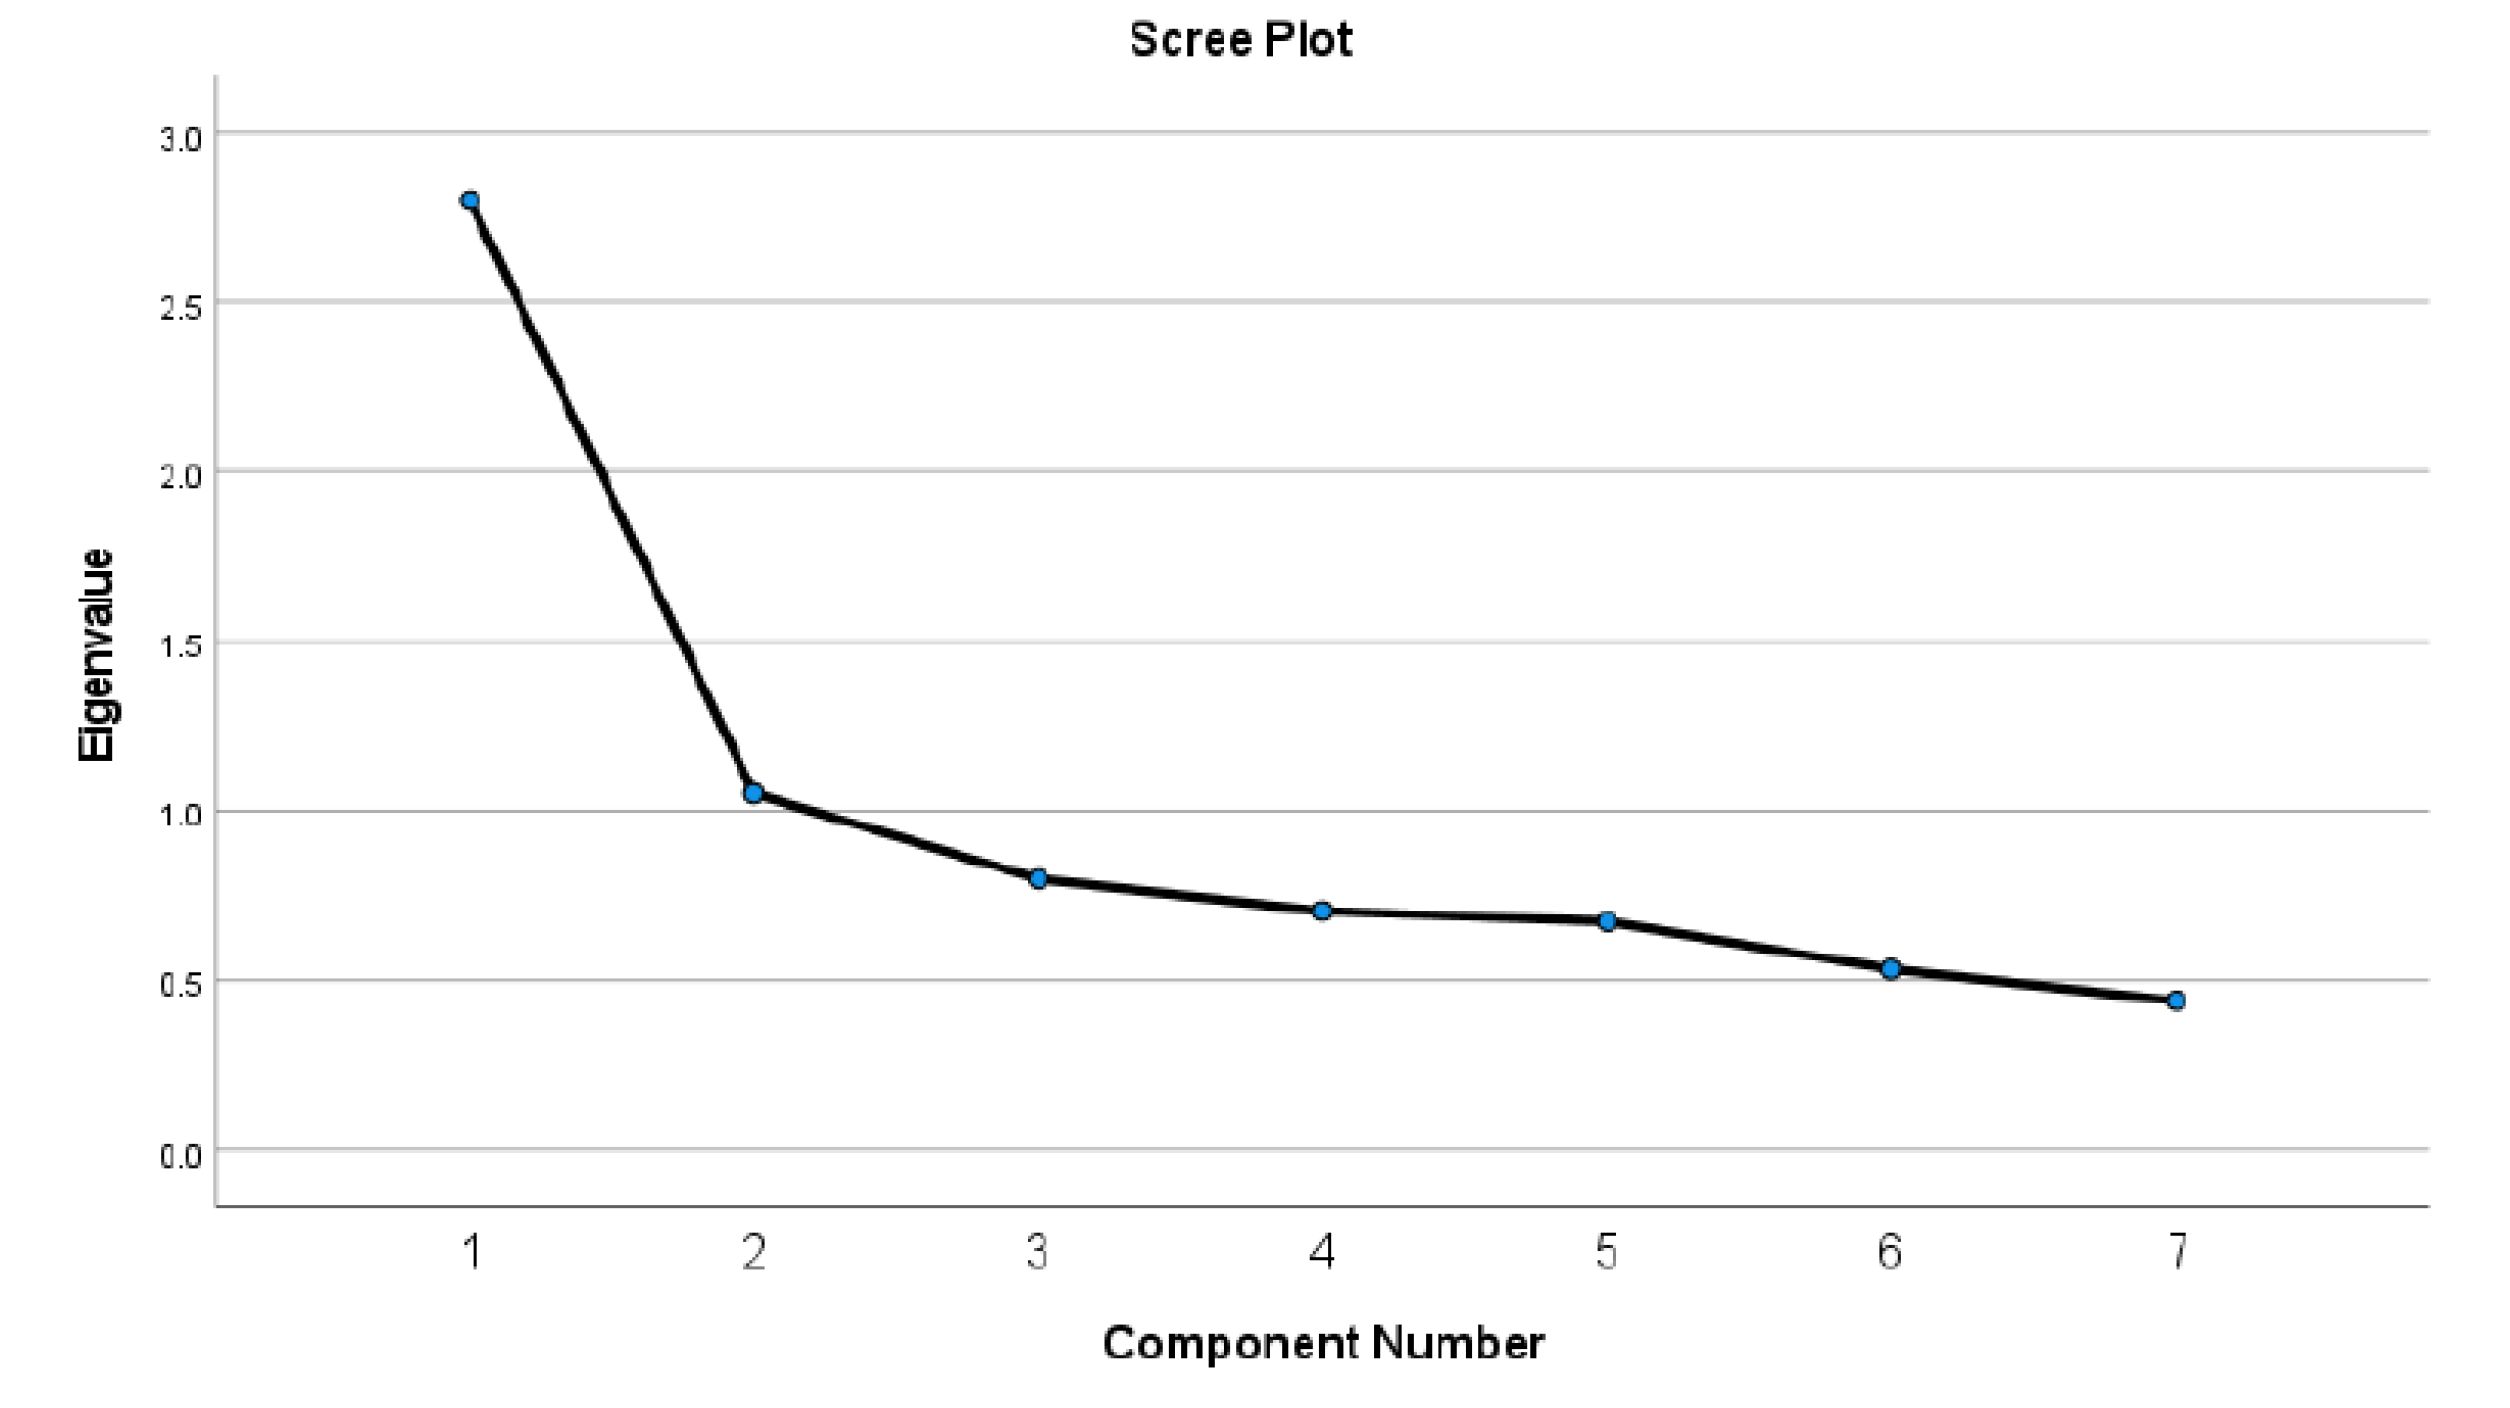
Figure 2 demonstrates how the variance is distributed among the components graphically.
For the principal components (labelled component) shown on the x-axis, the corresponding eigenvalue is plotted on the y-axis [
32]. Since component one and two have eigenvalues greater than one, two components are used to divide the questions into components, with component one and two accounting for 55% of the total variance. The Kaiser–Meyer–Olkin Measure of Sampling Adequacy (KMO) value is required to be 0.6 or higher, and the Bartlett’s Test of Sphericity value is required to be significant (
p < 0.05) [
27]. These values are crucial for verification before proceeding with the Principal Component Analysis, and both of these requirements are met with the KMO of 0.806 and Bartlett’s Test of Sphericity significant value of (
p < 0.01).
Table 5 shows the Communalities matrix, Component matrix, and the Pattern matrix. The table depicts how questions Q3, Q8, and Q9 fit in component one, which represents that they have commonalities or underlying traits, and will be classified together to represent Green Purchase Intention (GPI). This is the same for Q5, Q7 and Q10; their values favor component two, and will be classified together to represent the Environmental Concern (EC) section. As seen in the pattern matrix, Q4 is closely related to both sections but will be classified in the EC section, since the wording of the question adheres more to that section.
4.1.4. Reliability Analysis on PCA
Table 6 depicts the sectioning of questions to EC and GPI. A reliability analysis reveals the CITC values are all above the acceptable limit of 0.3 [
27], and the Cronbach’s values are above 0.6. As discussed in
Section 4.1.2, the Cronbach’s values may be low when there are fewer than 10 questions.
4.1.5. Ordinal Logistic Regression Analysis
Before conducting the OLRA, a normality test of the data was carried out; this depicted a goodness-of-fit value for Pearson’s chi-square values of 159.479 with a significance value of 0.850, and a deviance chi-square value of 148.285 with a significant value of 0.955. See
Table A5. A test of normality under Kolmogorov–Smirnov was carried out, and it showed a significance value of (
p < 0.05), which indicates that the data are not normally distributed. See
Table A6. Additionally, there was a model-fitting chi-squared value of 42.149 with a significant value of (
p < 0.01). See
Table A7.
These factors indicate that the model fits the data well but since the data do not satisfy the normally distributed condition, the Spearman’s correlation coefficient is used in answering the first research question [
27].
Table 7 shows the correlation between EC, GPI, age, and gender. Age proves not to be statistically significant to either EC or GPI. However, gender depicts a positive correlation to EC; the gender of participants was categorized and females were given a value of two and males were given a value of one. This correlation is positive, which indicates that females have more correlation with EC than males, with the correlation value indicating the strength of the relationship between the two variables. According to [
33] in [
27], the range for a medium correlation value is Rho = 0.30 to 0.49. The correlation value between EC and GPI is
, which is then considered as a medium positive correlation value. With the significance level of (
p < 0.01) for EC and GPI, the result of the first research question is that there is a positive correlation between consumers EC and GPI.
4.2. Purchasing Behavior Results
In this section, we first present the trend analysis of Tresemmé purchasing products through the entire time period (2019–2021), then we analyze the correlation between comparison products (NORM), Tresemmé REC, and Tresemmé REG, for 2019 and 2020–2021 separately.
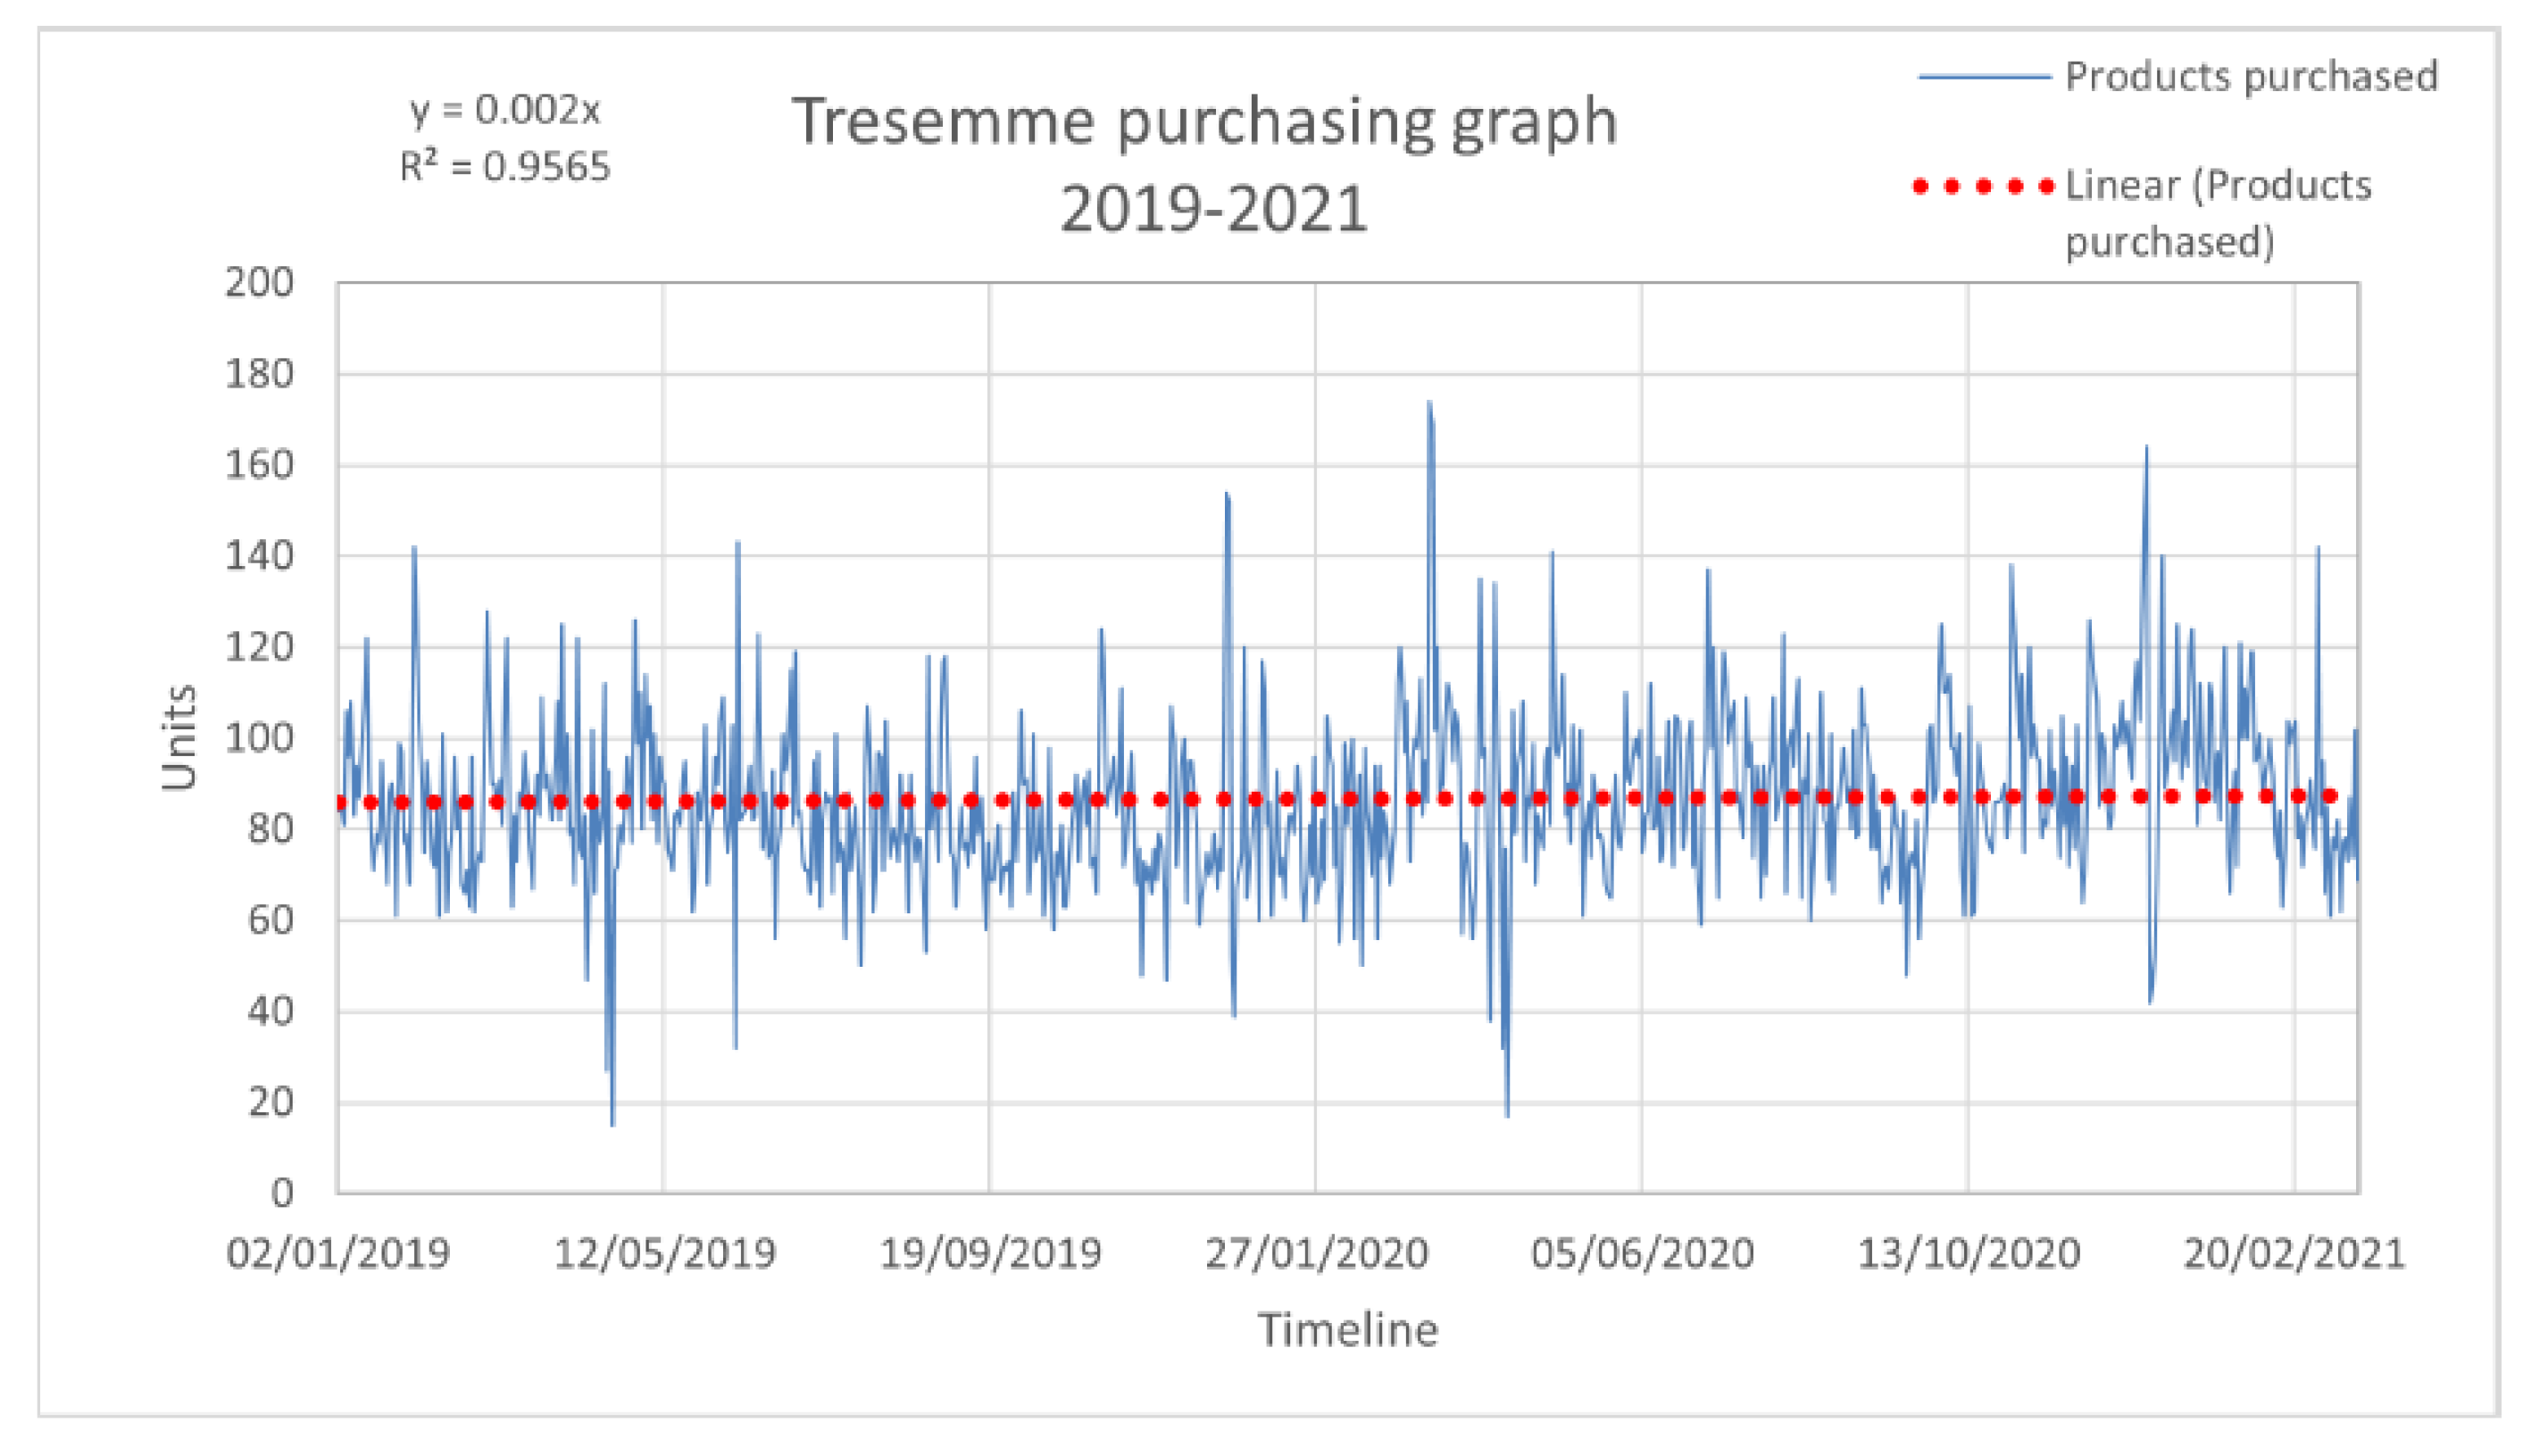
Trend Analysis
The purchasing of all the Tresemmé products through the time period is depicted in
Figure 3.
A linear trend line fits the data well with a R squared value of
= 0.9565, indicating a slight increase in quantity bought. This purchasing graph is comprised of the cumulative purchasing of both REC and REG Tresemmé products, which is then separated and analyzed separately in
Table 8 and
Table 9.
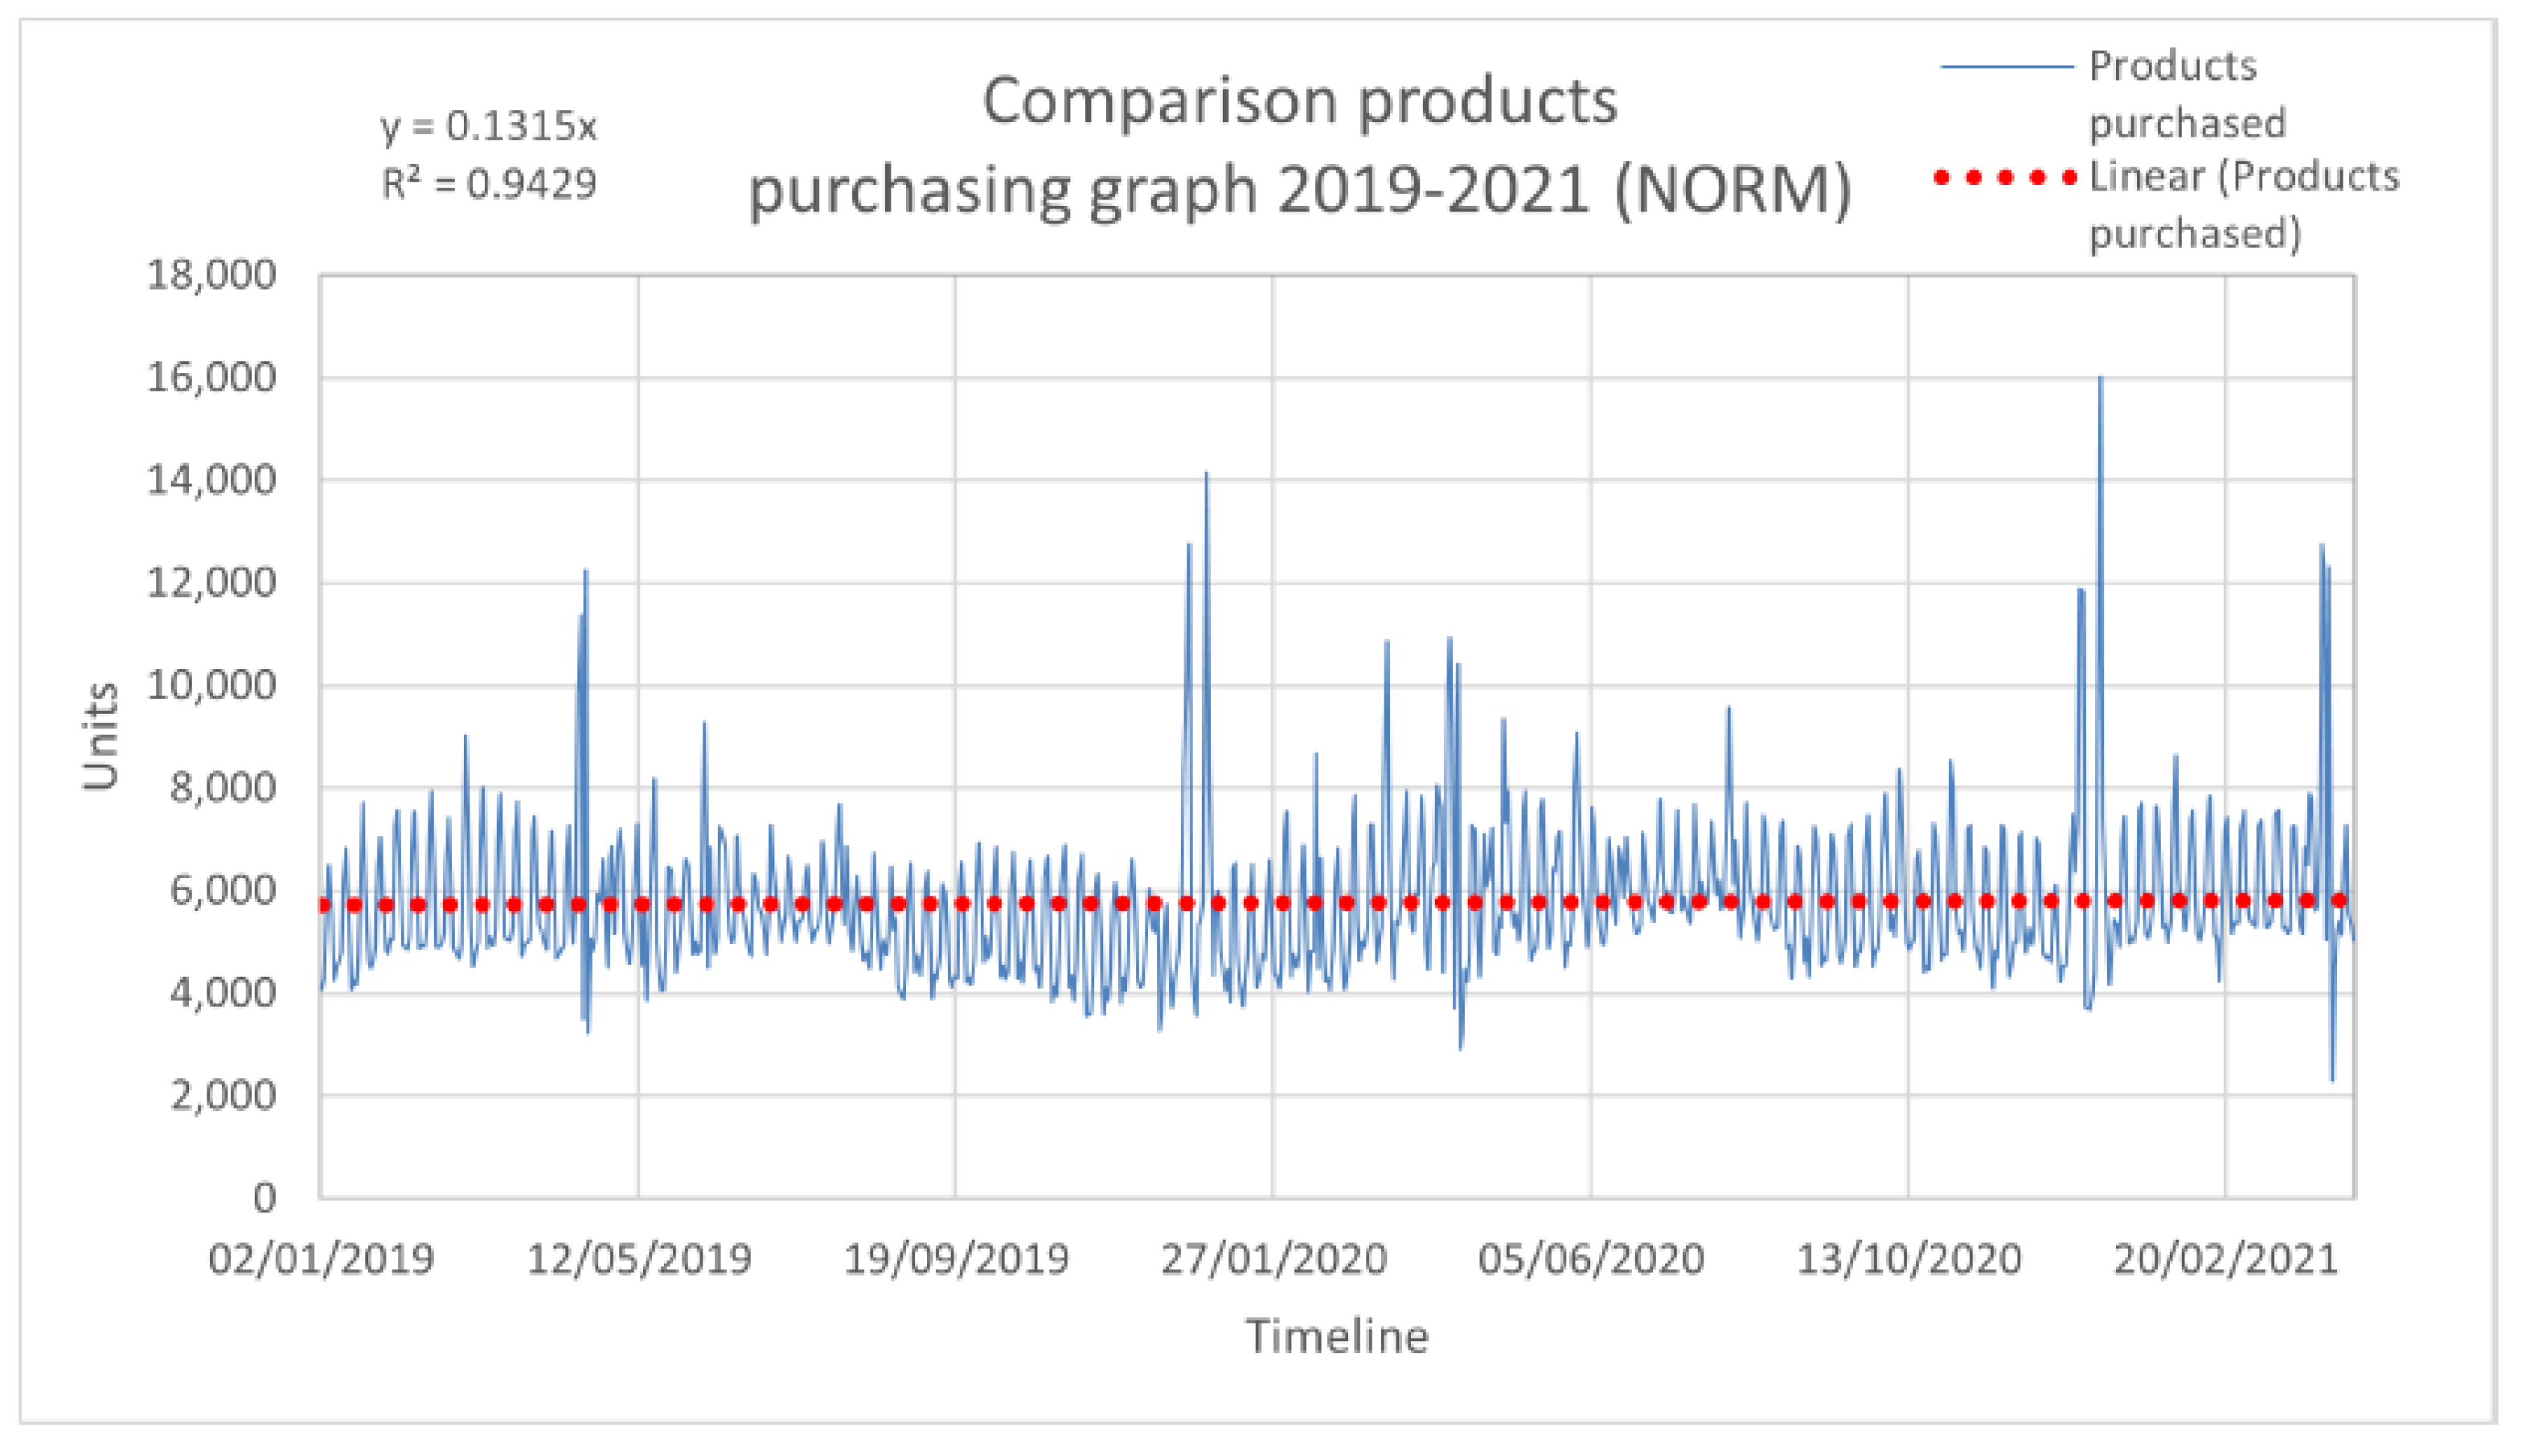
Figure 4, with a linear trend line with a R squared value of
= 0.9429, shows the purchasing data of the 45 different products which are used for a comparison with Tresemmé REG and Tresemmé REC; the data are shown in
Figure 3.
Analyzing the correlation between the comparison products (NORM), Tresemmé recyclable products (REC), and Tresemmé regular products (REG), and comparing with the correlations of the same sections from a period before the lowered environmental impact of the Tresemmé products, enabled us to research the consumers’ reactions towards these changes. A Pearson correlation analysis for 2019 was conducted after normalizing the data and ANOVA linearity testing to check differences between different groups, respectively: NORM/REC and NORM/REG for 2019 and NORM/REC NORM/REG for 2020. See
Table A1 and
Table A2 for 2019, and
Table A3 and
Table A4 for 2020.
Table 8 depicts the correlation in 2019 for:
- 1
NORM19 and REG19 as r = 0.270;
- 2
NORM19 and REC19 as r = 0.212;
- 3
REG19 and REC19 as r = 0.215.
All of these correlations have a significant value of (p < 0.01).
According to Tresemmé in [
34], the containers’ pigment changes and recyclable labeling entered the consumer market in 2019. However, Nathan & Olsen, the Tresemmé product distributor in Iceland, states that the recyclable labeled containers would have entered the Icelandic market in Q2 of 2020 [
35].
Table 9 accounts for this and depicts the correlation between:
- 1
REC20Q2 and NORM20Q2 as r = 0.125 with a significance level of (p < 0.05);
- 2
REG20Q2 and NORM20Q2 is r = 0.283 with a significance level of (p < 0.01);
- 3
REG20Q2 and REC20Q2 as r = 0.199 with a significance level of (p < 0.01).
5. Discussion
The current food system neither works for all habitats of the planet, nor does it work for the environment. Changing our food system to a system based on the principles of a circular economy to a larger extent, would be one of the utmost important steps towards building biodiversity on the one hand, and tackling climate change on the other [
36]. One small step towards building a more sustainable food system, one that could over time lead to a regenerative food production and in turn lead to more stable soil, improved biodiversity, better air and water quality with both local and global benefits, would be to change the way each individual makes their individual choices [
37]. Although eliminating food waste and shifting towards the principles of circular economy are the ultimate target, the individual choice, and follow-through, is where we are contributing to the change. Reaching towards the sustainability goals and analyzing aspects of managing the grand challenge related to the environmental impact of our actions is a vital way forward in studying how consumers react to products’ attributes and environmental impact [
37].
The survey’s results in
Section 4.1 show how consumers’ Environmental Concern and their Green Purchase Intention are positively correlated by a value of 0.465, a medium correlation value. Thus, for the first research question, the results show that although consumers may be concerned about the environment and intend to purchase green products, their actions do not reflect these concerns and intentions. Additionally,
Table 7 shows how female consumers correlate more with Environmental Concern than males. This indicates that women have a higher tendency towards environmental concern. However, when analyzing the purchasing behavior of consumers, through actual purchasing data, the findings do not indicate a high environmental concern in action, as consumers do not seem to have responded with Tresemmé’s products’ lowered environmental impact.
We would like to highlight that the products highlighted specifically in the purchasing data are used for illustrative purposes, and as such, it is not the product per se that we focus on, instead, the focal point is on the impact that the product represents. As depicted in
Table 9, the correlation is lower for Tresemmé recyclable and the comparison data than for Tresemmé regular and comparison data. With Tresemmé recyclable products in this period now displaying the recyclable label, it can be assumed that with a lower correlation than Tresemmé regular and comparison data, consumers may be responding to Tresemmé’s recyclable labeling. However, as
Section 3.2.2 depicts, the difference between correlations in 2019 and 2020 does not reach statistical significance. Consequently, for the second research question, the results indicate that even though consumers are aware of their purchasing behavior, they do not react to products’ lowered environmental impact.
The results are in accordance with the findings by [
38], where the results indicated that the perception of green products, labels, packaging, and ingredients did not influence consumers’ perception. Other product attributes played an important role in the consumer purchasing process, such as price and quality [
39,
40].
The results of this research can be deepened and used for further psychological and economic studies to understand how to influence consumers towards the purchase of green products. In addition, the use of data-driven analysis was useful to understand the difference between consumers’ perceptions of their actions and their actual behavior. As pointed out earlier, our aim was not to link specific individuals’ perceptions of their actions and their behavior, but instead, we used the two-fold analysis to shed light on the views of the general public, and the purchasing behavior of a wide range of shoppers within the general public too. We did that to illustrate the intentions and actions of the general public, but not to pinpoint the intentions and actions of certain individuals.
Limitations and Future Work
The present research has certain limitations. The sample data are limited in two ways; firstly, the survey had a limited sample of 166 participants, and secondly, the purchasing data were collected from a single retail store with a limited selection of suitable products for consumers’ purchasing data analysis. Additionally, part of the data was related to the COVID-19 period, so the purchasing data results may be skewed because of the restrictions.
Then, the two parts of our analysis, i.e., on the purchase intention and the actual purchase, did not include the same participants, and we do not know if they are from the same social groups. Additionally, the survey more broadly examined the environmental impact, while our purchasing data shows purchasing patters for specific product categories. This could potentially affect the results in some way. Since our intention was to shed light on the gap between attitude and intent versus consumers’ green purchasing behavior, and not to draw specific conclusions, the data are suffice for that purpose.
Additionally, before conducting a survey of a similar nature to this research, it would be wise to use a control group for testing the preliminary results in conducting a quantitative analysis to ensure the suitability for its purpose in the research. Furthermore, there are multiple purchase considerations in the consumers’ decision process. Bias towards the author of this study may be present in the survey participants from Reykjavik University or through social media. Additionally, the author of this study had previously encountered the products used in the study, which may have influenced the decision process in search of suitable products for data analysis. Measures should be taken by future researchers to minimize such bias if possible, or take the bias into consideration when interpreting the results.
For further research in this area, it could be interesting to conduct a more complete analysis and include purchasing patterns of a larger assortment of products that meet the requirements discussed in
Section 3.2. Additionally, future research could emphasize other relevant factors, such as environmental, health, personal, and social benefits of better aligning environmental intentions with purchasing actions. This could, furthermore, be extended to situations where more emphasis is on consumers’ behavior towards the environment, whereby conducting in-depth interviews with consumers could be explored to hopefully gain an enriched understanding of green consumer purchasing behavior.
6. Conclusions
This study presents a two-fold analysis of survey data and purchasing data in Iceland. In terms of a theoretical contribution, our analysis shows that there is a discrepancy between consumers’ concern for the environment and their intention to purchase green products, and actual purchasing green products. Based on the findings from the survey and the purchasing data analysis, the answer to the research question is that despite high environmental concern detected within the general population, there is low concern detected from purchasing data from consumers when grocery shopping. Ergo, consumers have a difficulty translating their intentions into purchasing behavior based on the environmental impact of the products available to them. Based on this, we conclude that there is a discrepancy between consumers’ intentions and their actions; this discrepancy can be defined as a gap related to how consumers perceive their purchasing behavior versus how they actually conduct their purchasing. They see themselves as environmentally responsible, but when analyzing purchasing patterns, there is less impact to be detected. In terms of a practical contribution, we suggest that there is a need for a change in the way grocery stores line up their products in order to nudge consumers to align intentions with actions. This could be done by more visibly portraying products with a lower environmental impact so they are in eyesight. It is clear that consumers want to make an impact, so allowing them to more easily grab green products compared and less easily products with a higher carbon footprint would be beneficial for the environment.
Author Contributions
Conceptualization, C.C., E.T.E.R., A.S.I. and H.S.; methodology, E.T.E.R.; validation, C.C., E.T.E.R., A.S.I. and H.S.; formal analysis, E.T.E.R. and C.C.; investigation, C.C. and E.T.E.R.; data curation, E.T.E.R. and C.C.; writing—original draft preparation, C.C.; writing—review and editing, A.S.I., C.C., E.T.E.R., H.S. and M.Ó.; visualization, E.T.E.R.; supervision, A.S.I., H.S. and M.Ó. All authors have read and agreed to the published version of the manuscript.
Funding
This research received no external funding.
Informed Consent Statement
Not applicable.
Data Availability Statement
The data used in the present study are not publicly available.
Acknowledgments
We would like to thank Krónan, an Icelandic supermarket chain, for providing the purchasing data used for this research.
Conflicts of Interest
The authors declare no conflict of interest.
Abbreviations
The following abbreviations are used in this manuscript:
| EFP | Environmentally Friendly Product |
| GPI | Green Purchase Intention |
| EC | Environmentally Concern |
| SPSS | Statistical Package for the Social Sciences |
| PCA | Principal Component Analysis |
| OLRA | Ordinal Logistics Regression Analysis |
| CITC | Corrected Item-to-Total Correlation |
| CCM | Component Correlation Matrix value |
| REG | Regular Tresemme products |
| REC | Recyclable Tresemme products |
| NORM | Comparison products |
Appendix A
Table A1.
ANOVA correlation test of Linearity for 2019 NORM/REC.
Table A1.
ANOVA correlation test of Linearity for 2019 NORM/REC.
| | | | Sum of Squares | df | Mean Square | F | Sig. |
|---|
| REC2019O | Between Groups | (Combined) | 50,784.001 | 332 | 152.964 | 0.872 | 0.723 |
| NORM2019O | | Linearity | 2512.934 | 1 | 14.319 | 0.831 | 0.782 |
| | | Deviation from Linearity | 48,271.067 | 331 | 145.834 | 0.831 | 0.782 |
| | Within Groups | | 5264.875 | 30 | 175.496 | | |
| | Total | | 56,048.876 | 362 | | | |
Table A2.
ANOVA correlation test of Linearity for 2019 NORM/REG.
Table A2.
ANOVA correlation test of Linearity for 2019 NORM/REG.
| | | | Sum of Squares | df | Mean Square | F | Sig. |
|---|
| REG2019O | Between Groups | (Combined) | 11,939.868 | 332 | 35.963 | 0.883 | 0.707 |
| NORM2019O | | Linearity | 957.319 | 1 | 957.319 | 23.502 | <0.001 |
| | | Deviation from Linearity | 10,982.549 | 331 | 33.180 | 0.815 | 0.804 |
| | Within Groups | | 1222.000 | 30 | 40.733 | | |
| | Total | | 13,161.868 | 362 | | | |
Table A3.
ANOVA correlation test of Linearity for 2020 NORM/REC.
Table A3.
ANOVA correlation test of Linearity for 2020 NORM/REC.
| | | | Sum of Squares | df | Mean Square | F | Sig. |
|---|
| REC20_Q2 | Between Groups | (Combined) | 89,634.670 | 331 | 270.800 | 1.194 | 0.358 |
| NORM20_Q2 | | Linearity | 1465.859 | 1 | 1465.859 | 6.461 | 0.022 |
| | | Deviation from Linearity | 88,168.810 | 330 | 267.178 | 1.178 | 0.371 |
| | Within Groups | | 3630.167 | 16 | 226.885 | | |
| | Total | | 93,264.836 | 347 | | | |
Table A4.
ANOVA correlation test of Linearity for 2020 NORM/REG.
Table A4.
ANOVA correlation test of Linearity for 2020 NORM/REG.
| | | | Sum of Squares | df | Mean Square | F | Sig. |
|---|
| REG20_Q2 | Between Groups | (Combined) | 12,376.083 | 331 | 37.390 | 2.055 | 0.047 |
| NORM20_Q2 | | Linearity | 1013.343 | 1 | 1013.343 | 55.685 | <0.001 |
| | | Deviation from Linearity | 11,362.740 | 330 | 34.433 | 1.892 | 0.068 |
| | Within Groups | | 291.167 | 16 | 18.198 | | |
| | Total | | 12,667.250 | 347 | | | |
Table A5.
Goodness-of-Fit.
Table A5.
Goodness-of-Fit.
| | Chi-Square | df | Sig. |
|---|
| Pearson | 159.479 | 179 | 0.850 |
| Deviance | 148.285 | 179 | 0.955 |
Table A6.
OLRA normality test.
Table A6.
OLRA normality test.
| Kolmogorov–Smirnov * | Shapiro-Wilk |
|---|
| | Statistic | df | Sig. | Statistic | df | Sig. |
| GPI_N | 0.131 | 166 | <0.001 | 0.968 | 166 | <0.001 |
| EC_N | 0.096 | 166 | <0.001 | 0.984 | 166 | 0.046 |
Table A7.
OLRA model fitting.
Table A7.
OLRA model fitting.
| Model | −2 Log Likelihood | Chi-Square | df | Sig. |
|---|
| Itercept Only | 316.099 | | | |
| Final | 237.950 | 42.149 | 1 | <0.001 |
References
- Charter, M.; Tischner, U. (Eds.) Sustainable Solutions: Developing Products and Services for the Future; Taylor and Francis Group: Sheffield, UK, 2001. [Google Scholar]
- Divyapriyadharshini, N. Consumer Awareness towards Green Products and Its Impact. Int. J. Res. Innov. Soc. Sci. (IJRISS) 2019, 3, 2454–6186. [Google Scholar]
- Vazifehdoust, H.; Taleghani, M.; Esmaeilpour, F.; Nazari, K.; Khadang, M. Purchasing green to become greener: Factors influence consumers’ green purchasing behavior. Manag. Sci. Lett. 2013, 3, 2489–2500. [Google Scholar] [CrossRef]
- Vörösmarty, G.; Dobos, I.; Tátrai, T. Motivations behind sustainable purchasing. In Environmental Management Accounting and Supply Chain Management; Burritt, R., Schaltegger, S., Bennett, M., Pohjola, T., Csutora, M., Eds.; Springer: Dordrecht, The Netherlands, 2011; pp. 41–54. [Google Scholar]
- Baumann, H.; Boons, F.; Bragd, A. Mapping the green product development field: Engineering, policy and business perspectives. J. Clean. Prod. 2002, 10, 409–425. [Google Scholar] [CrossRef]
- Zhang, X.; Dong, F. Why do consumers make green purchase decisions? Insights from a systematic review. Int. J. Environ. Res. Public Health 2020, 17, 6607. [Google Scholar] [CrossRef]
- Laroche, M.; Bergeron, J.; Barbaro-Forleo, G. Targeting Consumers Who Are Willing to Pay More for Environmentally Friendly Products. J. Consum. Mark. 2001, 18, 503–520. [Google Scholar] [CrossRef] [Green Version]
- Vallerand, R.; Deshaies, P.; Cuerrier, J.-P.; Pelletier, L.; Mongeau, C. Ajzen and fishbein’s theory of reasoned action as applied to moral behavior: A confirmatory analysis. J. Personal. Soc. Psychol. 1992, 62, 98–109. [Google Scholar] [CrossRef]
- Ajzen, I. The theory of planned behavior. Organ. Behav. Hum. Decis. Process. 1991, 50, 179–211. [Google Scholar] [CrossRef]
- Paul, J.; Modi, A.; Patel, J. Predicting green product consumption using theory of planned behavior and reasoned action. J. Retail. Consum. Serv. 2016, 29, 123–134. [Google Scholar] [CrossRef]
- Madden, T.; Ellen, P.; Ajzen, I. A comparison of the theory of planned behavior and the theory of reasoned action. Personal. Soc. Psychol. Bull. 1992, 18, 3–9. [Google Scholar] [CrossRef]
- Kumar, P.; Ghodeswar, B. Factors affecting consumers’ green product purchase decisions. Mark. Intell. Plan. 2015, 33, 330–347. [Google Scholar] [CrossRef]
- Zhao, H.-H.; Gao, Q.; Wu, Y.-P.; Wang, Y.; Zhu, X.-D. What affects green consumer behavior in china? a case study from qingdao. J. Clean. Prod. 2014, 63, 143–151. [Google Scholar] [CrossRef]
- Nelson, B.; Taylor, D.; Strick, S. Wine consumers’ environmental knowledge and attitudes: Influence on willingness to purchase. Int. J. Wine Res. 2009, 1, 59–72. [Google Scholar] [CrossRef] [Green Version]
- Albayrak, T.; Aksoy, S.; Caber, M. The effect of environmental concern and scepticism on green purchase behavior. Mark. Intell. Plan. 2013, 31, 27–39. [Google Scholar] [CrossRef]
- Schlegelmilch, B.; Bohlen, G.M.; Diamantopoulos, A. The link between green purchasing decisions and measures of environmental consciousness. Eur. J. Mark. 1996, 30, 35–55. [Google Scholar] [CrossRef] [Green Version]
- Lisnawati, H.; Sinaga, A. Data Mining with Associated Methods to Predict Consumer Purchasing Patterns. Int. J. Mod. Educ. Comput. Sci. (IJMECS) 2020, 12, 16–28. [Google Scholar] [CrossRef]
- Fedushko, S.; Ustyianovych, T. E-Commerce Customers Behavior Research Using Cohort Analysis: A Case Study of COVID-19. J. Open Innov. Technol. Mark. Complex 2022, 8, 12. [Google Scholar] [CrossRef]
- Shimul, A.S.; Cheah, I.; Khan, B.B. Investigating Female Shoppers’ Attitude and Purchase Intention toward Green Cosmetics in South Africa. J. Glob. Mark. 2022, 35, 37–56. [Google Scholar] [CrossRef]
- Chomova, K. Evolution of Sustainability in Marketing. In Proceedings of the Central and Eastern Europe in the Changing Business Environment, Bratislava, Slovakia, 19–20 May 2022. [Google Scholar] [CrossRef]
- Charter, M.; Tischner, U. (Eds.) A Step-by-Step Guide for Beginners, 5th ed.; Sage Publications: Thousand Oaks, CA, USA, 2019. [Google Scholar]
- Gregory, R.; Muntermann, J. Theorizing in Design Science Research: Inductive versus Deductive Approaches. In Proceedings of the International Conference on Information Systems 2011, ICIS 2011, Shanghai, China, 4–7 December 2011. [Google Scholar]
- Joshi, A.; Kale, S.; Chandel, S.; Pal, D. Likert scale: Explored and explained. Br. J. Appl. Sci. Technol. 2015, 7, 396–403. [Google Scholar] [CrossRef]
- Roberts, J.A. Green consumers in the 1990s: Profile and implications for advertising. J. Bus. Res. 1996, 36, 217–231. [Google Scholar] [CrossRef]
- Kilbourne, W.; Pickett, G. How materialism affects environmental beliefs, concern, and environmentally responsible behavior. J. Bus. Res. 2008, 61, 885–893. [Google Scholar] [CrossRef]
- Reliability Analysis Statistics. IBM. (n.d.) Available online: https://www.ibm.com/docs/en/spss-statistics/25.0.0?topic=analysis-reliability-statistics (accessed on 27 June 2022).
- Pallant, J. SPSS Survival Manual: Step by Step Guide to Data Analysis Using SPSS; Allen & Unwin Book Publishers: Sydney, Australia, 2010. [Google Scholar]
- Tay, L.; Jebb, A. The SAGE Encyclopedia of Industrial and Organizational Psychology. In Scale Development; SAGE Publications: Thousand Oaks, CA, USA, 2016; Volume 2. [Google Scholar]
- Gan, C.; Wee, H.Y.; Ozanne, L.; Kao, T. Consumers’ purchasing behavior towards green products in new zealand. Innov. Mark. 2008, 4, 93–102. [Google Scholar]
- Chan, R. Determinants of chinese consumers’ green purchase behavior. Psychol. Mark. 2001, 18, 389–413. [Google Scholar] [CrossRef]
- Kyriazos, T.; Stalikas, A. Applied psychometrics: The steps of scale development and standardization process. Psychology 2018, 9, 2531–2560. [Google Scholar] [CrossRef] [Green Version]
- Landau, S.; Everitt, B.S. A Handbook of Statistical Analyses Using SPSS; Chapman & Hall/CRC Press LLC: Boca Raton, FL, USA, 2003. [Google Scholar]
- Cohen, J. Statistical Power Analysis for the Behavioral Sciences, 2nd ed.; Taylor & Francis Group: Abingdon, UK, 1988. [Google Scholar]
- Einarsson Reynis, E.T.; (University of Reykjavìk, Reykjavìk, Iceland). Personal communication, February 2021.
- Einarsson Reynis, E.T.; (University of Reykjavìk, Reykjavìk, Iceland). Personal communication, April 2021.
- Norström, L.; Ganesh, S.; Preeti, M.; Lindman, J.; Islind, A.S. Beyond Social Auditing: Towards Self-governance and Empowerment of Textile Workers. In Proceedings of the 45th Information Systems Research Seminar in Scandinavia, Helsinge, Denmark, 14–17 August 2022. [Google Scholar]
- Islind, A.S.; Norström, L. Learning sustainable work through critical design: A case study of a hackathon to prepare the future workforce. J. Workplace Learn. 2020, 32, 641–651. [Google Scholar] [CrossRef]
- D’Souza, C.; Taghian, M.; Lamb, P.; Peretiatkos, R. Green products and corporate strategy: An empirical investigation. Soc. Bus. Rev. 2006, 1, 144–157. [Google Scholar] [CrossRef] [Green Version]
- Johri, L.M.; Sahasakmontri, K. Green marketing of cosmetics and toiletries in thailand. J. Consum. Mark. 1998, 15, 265–281. [Google Scholar] [CrossRef]
- Peattie, K. Environmental Marketing Management: Meeting the Green Challenge; Pitman Publishing: London, UK, 1995. [Google Scholar]
| Publisher’s Note: MDPI stays neutral with regard to jurisdictional claims in published maps and institutional affiliations. |
© 2022 by the authors. Licensee MDPI, Basel, Switzerland. This article is an open access article distributed under the terms and conditions of the Creative Commons Attribution (CC BY) license (https://creativecommons.org/licenses/by/4.0/).


 ,
, 


