Article

Optimized Self-Adaptive Power Distribution for Microgrids in a Typical Tourism Water Village of Northern China under COVID-19 Background

1
State Grid Hebei Electric Power Research Institute, Shijiazhuang 050021, China
2
State Grid Hebei Electric Power Co., Ltd., Shijiazhuang 050022, China
3
Hebei Key Laboratory of Electric Machinery Maintenance and Failure Prevention, Baoding 071003, China
4
SuZhou Institute, North China Electric Power University, Suzhou 215000, China
*
Authors to whom correspondence should be addressed.
Sustainability 2022, 14(16), 9839; https://doi.org/10.3390/su14169839
Submission received: 30 April 2022 / Revised: 5 August 2022 / Accepted: 8 August 2022 / Published: 9 August 2022

Abstract

:
This work presents an improved self-adaptive power distribution approach for the microgrid in five modes under different pandemic conditions in a typical tourism water village in Northern China. Differently from the other studies, this work concentrates on satisfying the specific power supply requirements under the COVID-19 background, with the maximum value of the composite index as the object function. Composite index includes not only the economic factors, but also some compulsive factors to ensure the requested power supply of the residents/tourists. The improved particle swarm optimization method which employs the modified weighted factor and the elite strategy is utilized to optimize the power dispatching of the microgrid. Moreover, the impact of the pandemic has been fully considered by comparing the power dispatching before and after the pandemic. The case study in Baiyangdian Region confirms the effectiveness of the proposed method. With this method, the optimal power dispatching is determined under different modes.

1. Introduction

With the development of modern society and the increasing electricity demand, the power system is developing toward “smart grid” based on the advanced information and the communication technologies [1]. The Opinions on Improving Institutional Mechanisms and Policy Measures for Green and Low-Carbon Energy Transition, released by the National Development and Reform Commission of China and the National Energy Administration of China on 10 February, clearly encourages the construction integration of source, network, load and storage, multi-energy complementary smart energy system and microgrid [2]. In order to make efficient use of the distribution generation, the microgrid is an important technology in the power industry and the environmental concerns.
By far, a lot of scholars have made a lot of efforts in studying the control and the operation reliability of the microgrid. For instance, the self-optimization droop control strategy for AC microgrid is presented by Lagrange multiplier method considering operation cost and efficiency simultaneously [3]. Meanwhile, Ali Elrayyah proposed a novel load-flow analysis algorithm to select the droop parameters that optimize the reactive power sharing for droop-based islanded microgrids [4]. W. Rohouma examined an alternative distribution static synchronous compensator based on a matrix converter in order to regulate the voltage profile to meet the relevant standards [5]. M. Moghbel introduced a new custom power device for real-time control of reactive power and improving network voltage quality [6]. Further, B. Ismail discussed the techniques for determining the optimal location and sizing of various reactive power compensation devices in the power system to access the power loss, voltage stability, and voltage profile [7]. Jintae Cho suggested a centralized operation method for the DC system that optimizes the operation of a DC microgrid on an island [8]. Oluleke Babayomie accurately regulated both the secondary frequency and voltage based on the fast-dynamic properties of the model predictive-controlled in the distributed secondary regulation [9]. Similarly, Josep M. Guerrero also presented new distributed controllers for secondary frequency and voltage control in islanded microgrids [10] and restorations for both voltage and frequency in the droop-controlled inverter-based islanded microgrid are addressed [11]. Moreover, the operation reliability also needs to be taken into consideration due to the microgrid security. The internal congestion of the microgrid system is reduced by the reduction of maximum line flow to supply to the customers smoothly [12]. Meanwhile, in order to prevent the environmental and operational failures, Hossein Hosseini comprehensively established the decentralized microgrid control architecture [13]. Moreover, a mixed integer linear programming-based model to determine the optimal sizing of the stand-alone microgrid is proposed to guarantee the supply adequacy [14]. It can be seen that there are many objects that need to be optimized in the process of power grid operation, and the ultimate goal is to improve the reliability of power grid operation.
Moreover, the reasonable planning of the microgrid is a major concern. The power prediction of the new energy should be fully considered in the power dispatching of the microgrid. The error between the wind power prediction model and the actual data is less than 5.7% [15,16]. Meanwhile, the prediction accuracy of the photovoltaic power generation based on known environmental input data is more than 95% [17]. An economic evaluation method of the controlled air-conditioning load combined echelon utilization batteries in the micro-grid system of a commercial park participating in the demand side management is discussed in depth [18]. G. Gonzalo established a mathematical model called optimization to optimally solve the location and sizing of capacitor banks in a micro-grid of electrical distribution by swarm of particles [19]. Then, a demand response management system is proposed here, in which a service provider determines a mutual optimal solution for utility and the customers in a microgrid setting [20]. In the meantime, Ahmed M. Helmi proposed a novel effective optimization framework for the reconfiguration problem of modern distribution networks. The objective of reconfiguration is minimizing the overall power losses while ensuring an enhanced voltage profile [21].
In addition to the key technologies of the microgrid operation mentioned above, the economy and the environment of the microgrid play an important role in the spread of new energy sources. Considering the economy and stability of the microgrid cluster system, Zhiyu Zhang proposed a two-level energy optimization dispatching strategy to coordinate the economy and the operational risks of the microgrid and reduce line loss [22]. Salman Harasis developed the flexible control algorithms based on the tradeoff between the operating cost and the reliability of microgrids [23]. Moreover, Lingfeng Wang designed the control system of smart and energy-efficient buildings to minimize power consumption without compromising on customers’ comfort [24]. A valid modeling of both distribution generation and load demand is carried out to obtain the optimal economic operation with minimum cost based on the power transaction between the microgrids and main grids [25]. In addition, three economic evaluation indicators including levelized energy cost, emission reduction benefits, and payback period are proposed in the small-scale microgrids for industries; both evaluate economic performances and investment risk of the microgrids are taken into account [26].
Particle swarm optimization (PSO) is an advanced heuristic bionic algorithm and has been widely applied in the electrical field due to the robust performance and the high search capability. The unknown photovoltaic model parameters are obtained by using PSO [27]. The output power of the photovoltaic generation is then forecasted in the microgrid based on the PSO algorithm [28,29]. Moreover, Kai Ma studied the energy management problem with unknown dynamics of consumer appliances by integrating the extremum seeking control with PSO [30]. Shi-Bo Li proposed a wind-hydrogen-storage microgrid capacity optimization model for hydrogen production from surplus wind power based on the characteristics of a low-temperature environment in Northeast China [31]. By adjusting the weighted factor in PSO algorithm, Gang Chen focused on the power dispatching optimization of the microgrid under different weather conditions in China [32].
O. A. Qudsi presented analytical techniques for reducing the switching losses of inverter by using the method of Spontaneous Evolutionary GA. The results show that the inverter loss can be reduced to 2% [33]. Moreover, G. Gohil proposed a multi-objective optimization algorithm to simplify the calculations of power loss [34]. However, the consumption and the characteristics of the electrical power have been dramatically altered in the context of the COVID-19 pandemic. The consumption structure of the electricity market has changed significantly, and electricity consumption in all sectors of the country has decreased significantly. Hence, the power dispatching needs to be considered comprehensively in order to reduce the economic losses from the pandemic. At the same time, the impact of the microgrid on the ecological environment, line loss, and power loss are also taken into consideration.
This paper presents an optimized self-adaptive power distribution approach for the microgrid based on the dynamic factors and the elite strategy under five different modes in a typical tourism water village in northern China. In the work, the voltage profiles are considered stable due to the static reactive power compensation device in the power system. The optimized method takes the ecological environment, the line loss, and the power loss into account. The construction of the whole paper is as follows. In Section 2, the case study is described in detail. In Section 2.3, the PSO algorithm is effectively improved by the dynamic factors and the elite strategy is proposed for power dispatching optimization under the case study. In Section 3, taking the economic, line loss, power loss, and the environmental factors into account, the optimal operating mode of the microgrid is selected by using the improved PSO algorithm in Banyangdian region with different restricted conditions. Furthermore, the primary conclusions are clearly expressed in Section 4.

2. Materials and Methods
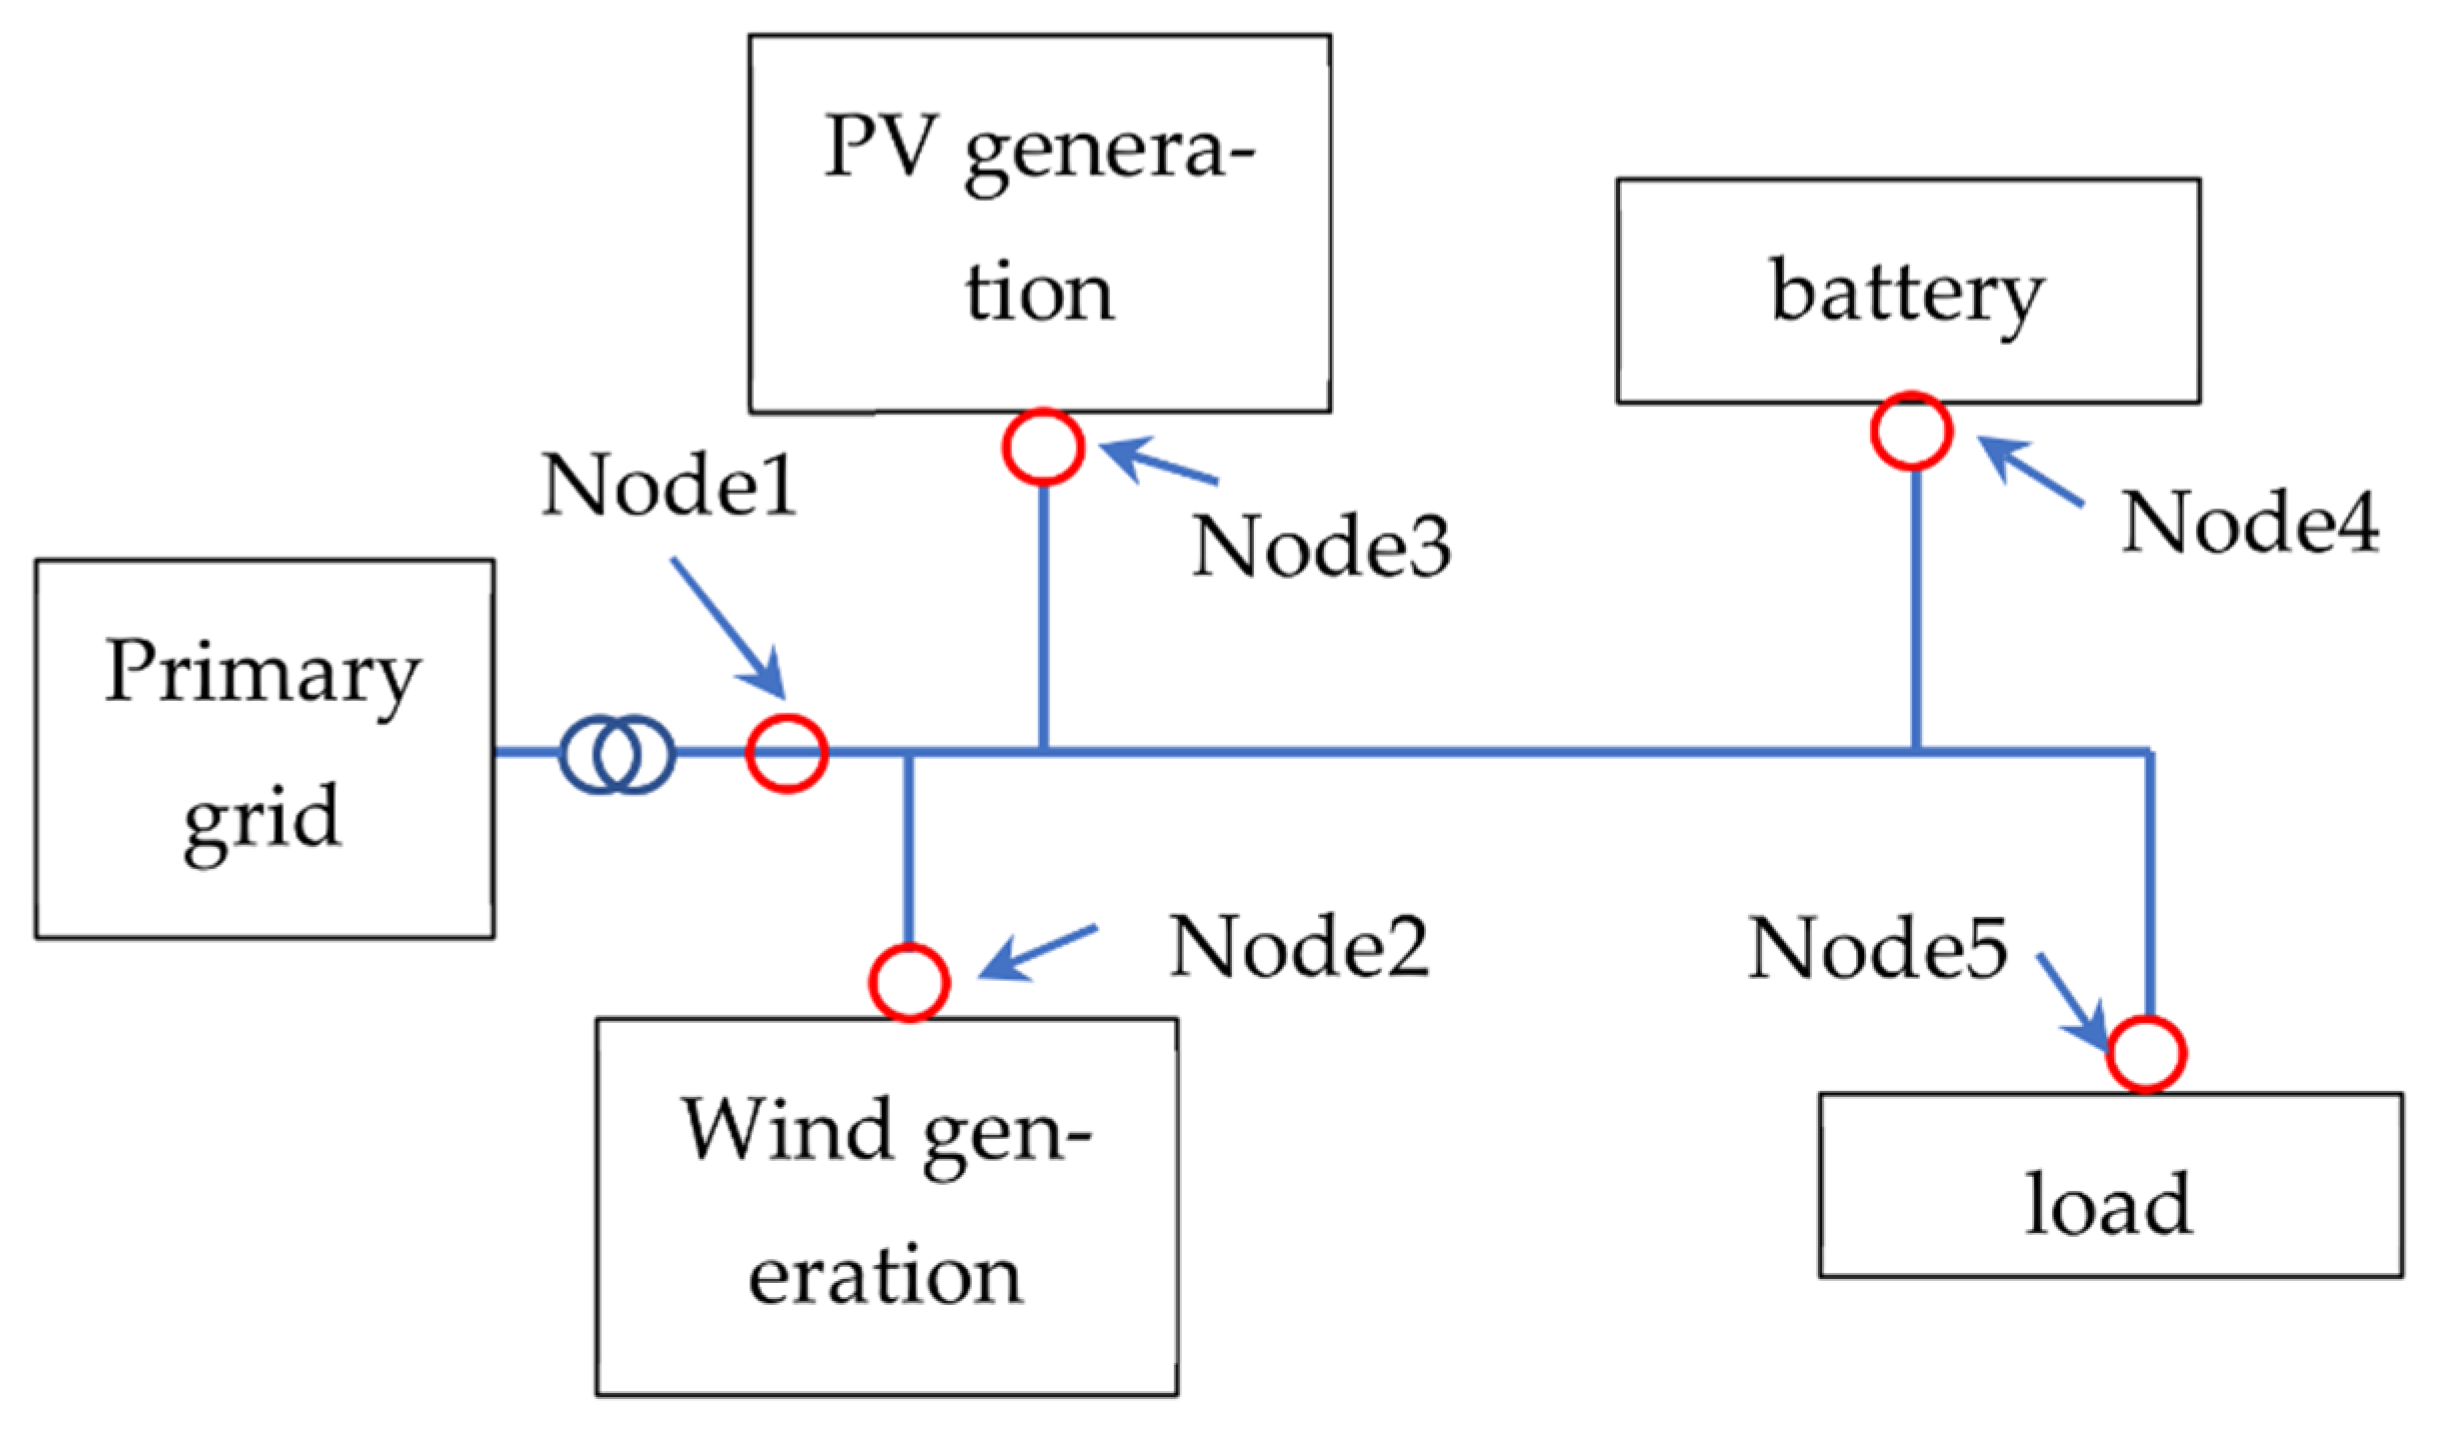
2.1. Study Object

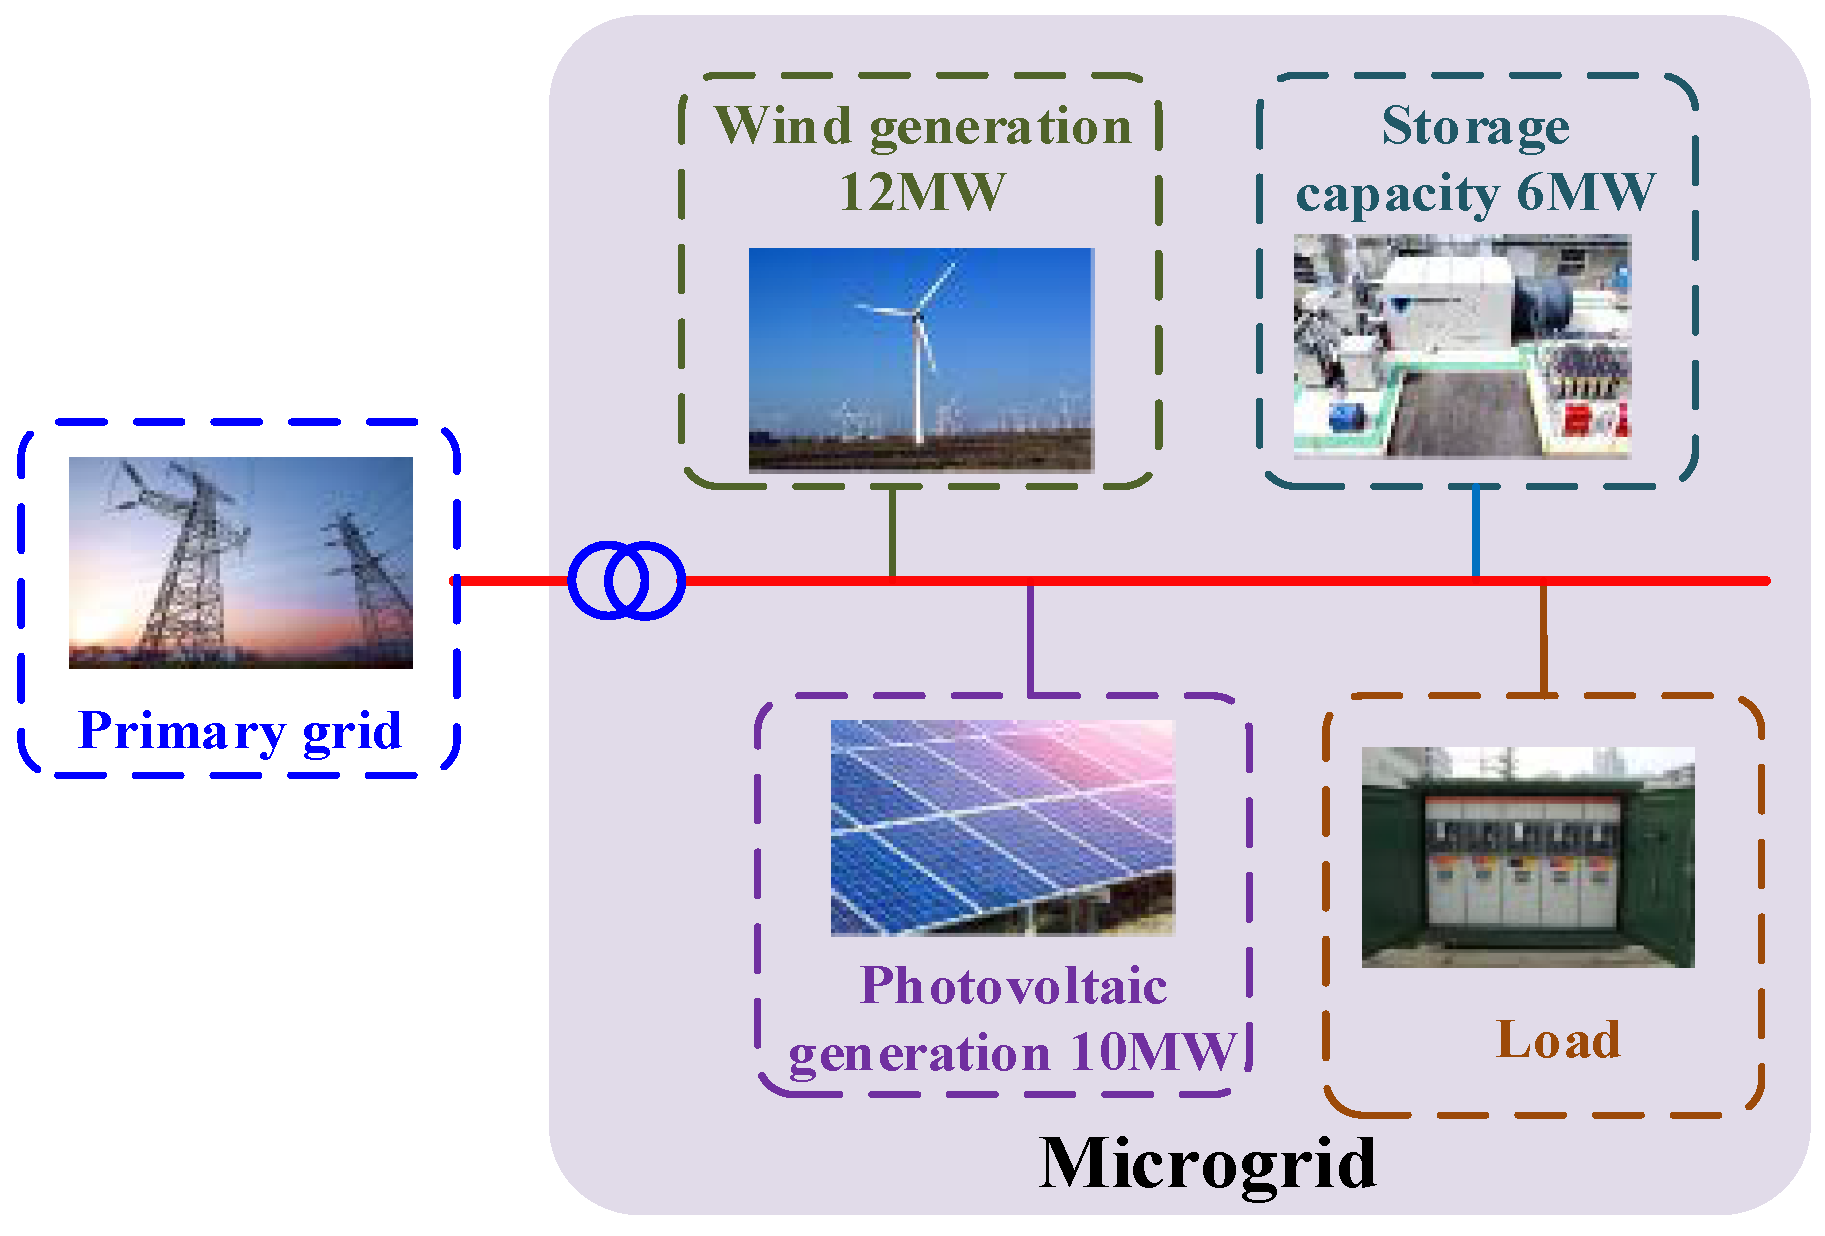
2.1.1. Microgrid Topology

In recent years, the new energy generation is utilized gradually due to energy shortage and environmental pollution. The study object of this work is a typical tourism water village in Baiyangdian Region, which is a famous scenery located in northern China. According to the regional characteristics and the physical characteristics, the microgrid of the Baiyangdian Region contains multiple elements of the source-network-load-storage.
Further, the source is usually the distributed generations including the wind generation and the photovoltaic generation. Moreover, the microgrid is closely connected with the primary grid in order to exchange electric power due to load need. The storage is used to store power in order to distribute electricity more rationally. The load refers to the electricity for the schools, the docks, and the residential villages in the Baiyangdian Region. The rated power of the distributed generations and the storage capacity is indicated in Figure 1.

2.1.2. Specific Conditions under COVID-19 Background

The load of the Baiyangdian Region in different conditions is indicated in Figure 2. There is obviously the load difference between the existing COVID-19 pandemic and normal condition. As a tourist area, Baiyangdian Region used to attract a large number of tourists every year due to the quality of water prior to the COVID-19 pandemic. Hence, large numbers of tourists directly increase electricity consumption by a considerable amount. However, the number of the tourists fell sharply based on the country’s no-travel policy during the pandemic. It is clear that the load during an pandemic is about half as low as it would be without an pandemic. Moreover, it is quite volatile for the distributed generations output, see Figure 2. However, the overall distribution of the power in the microgrid has obvious patterns throughout the day.
Moreover, the load also changes significantly over time due to electric power use by visitors. In our work, a day is divided into 96 periods on average in order to achieve fine energy scheduling. In other words, one period represents 15 min. The period is divided, with time 0 as the starting point. The corresponding relationship between period serial number and time is shown in Table 1. Hence, the optimal solution of the power dispatching is necessary in the microgrid in order to get more economic benefits. Meanwhile, the power price and the environmental cost need to be taken into consideration.
As indicated in Figure 3, the key power characteristics of the distribution generations are described in detail with varied time. For the sake of clarity, the amount of the generator output is plotted on the same chart. Moreover, the photovoltaic generation output is superimposed to the wind generation output in Figure 3. To be specific, the power of the wind distribution is concentrated at night due to high wind speed in North China, while the photovoltaic power generation exists from 7:30 to 17:30 because the light is pretty strong at this time.

2.2. Optimized Self-Adaptive Power Distribution Scheme

2.2.1. Microgrid Model

  • Model of wind generator;
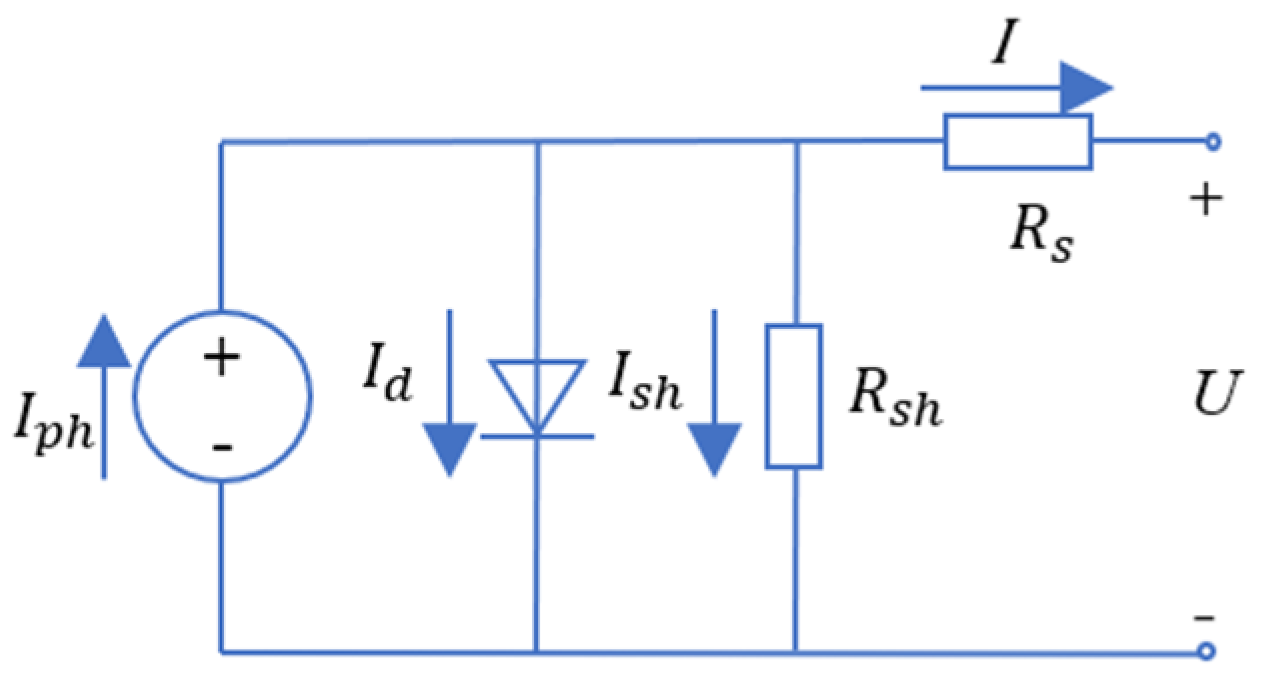
According to the wind power generator principle, the output power can be written as [35]:
P W T = 1 2 ρ π R 2 v 3 C p ( θ , γ )
where PWT is the output power of the wind generation, ρ is the air density, R is the blade radius of the wind generator, v is the wind speed, θ is the blade pitch angle, γ is the blade tip ratio, and Cp(θ, γ) denotes the power coefficient, which depend on θ and γ. According to (1), the output power can be maintained at maximum by adjusting the key parameter γ to control the max power Cpmax(θ, γ) coefficient.
  • Photovoltaic;
  • Figure 4 shows the equivalent circuit of a PV panel with a load. The current output of the PV panel is modeled by the following equations [36,37]. It can be written as:
{ I = I p h I d I s h I p h = G 1000 [ I s c + K t ( T 298 ) ] I d = I 0 { exp [ q ( U + I R s ) A K T ] 1 } I s h = U + I R s R s h
where Id is the output current of the solar panel, U is the output voltage of the solar panel, I denotes the output current flowing through the series resistor Rs, Ish denotes the leakage current through the parallel resistor, Rsh, Iph, Isc, and Io are the diode current, the photocurrent, the short circuit current, and the diode reverse saturation current respectively. G is the solar intensity, A represents the diode ideal factor, q stands for the electronic quantity, generally 1.602−19, K stands for Boltzmann constant and Kt is the temperature coefficient.
  • Battery.
The battery is utilized to store energy in the microgrid when there is too much new energy power generation output or the electric price is low. The terminal voltage and the state of charge (SOC) are represented by the state of the battery and can be written as [35]:
{ V b = V o + R b · i b K Q Q + i b d t + A · exp ( B i b d t ) SOC = 100 ( 1 + i b d t Q )
where Rb is internal resistance of the battery, Vo is the open circuit voltage of the battery, ib is battery charging current, Vb is polarization voltage, Q is battery capacity, A is exponential voltage, and B is exponential capacity.

2.2.2. Boundary Condition and Limitation

In the microgrid system, the output of each DG (distribution generation) must be within the upper and lower limits of its own output so as to ensure the stable operation of the microgrid system. Hence, the output constraint conditions of each DG are as follows:
P i , min ( t ) P i ( t ) P i , max ( t )
where Pi,min and Pi,max represent the minimum allowable output power and the maximum allowable output power of each DG at time t, respectively. Pi(t) denotes the output power of each DG at time t.
The reactive power output of the wind generator and the photovoltaic generator grid-connected inverter should meet the capacity constraints of the wind generator and the photovoltaic generator grid-connected inverter, as shown in the following equation:
{ S w t 2 P w t 2 Q w t , t S w t 2 P w t 2 S p v 2 P p v 2 Q p v , t S p v 2 P p v 2
where Qwt,t and Qpv,t represent the reactive power output of the wind generator and the photovoltaic generator grid-connected inverter at time period t; Swt and Spv represent the rated capacity of the wind generator inverter and the photovoltaic generator inverter; Pwt and Ppv represent the output of the wind generator and the photovoltaic generator.
The reactive power regulation ability of the static reactive power compensator is limited by the capacity, and its constraint is shown as follows:
Q s v c i min Q s v c i ( t ) Q s v c i max , s v c i N s v c
where Nsvc is the set of static reactive power compensators in the distribution network. Qsvci(t) is the compensation power of the svci discrete capacitor bank at time t, Q s v c i min and Q s v c i max are respectively the lower and upper limits of the svci operational capacity of the SVC station.
The battery can be charged and discharged during the operation. Hence, based on the physical properties, the state-of-charge (SOC) of the battery should satisfy
S min S t S max
where St is the SOC at period t, while Smin and Smax are the minimum value and the maximum value of SOC, respectively. Usually, Smin is set to 0.3 while Smax is set to 0.9.
Moreover, in order to ensure the safety of the battery and take the rate of the battery charge and discharge, the state difference of the battery in the adjacent time period should not be too obvious. It should meet [32]:
| S t S t 1 | 0.2
Power constraints that the i-th microgrid and the j-th microgrid can allow interaction:
P i , j , min P i , j ( t ) P i , j , max
The grid-connected micro-grid system should satisfy the sum of all output power equal to all load consumption at any time, and the specific equation is as follows:
P P V ( t ) + P W T ( t ) + P B A T ( t ) + P b ( t ) P s ( t ) = P l o a d   ( t )
Q l o a d ( t ) = Q C B ( t ) + Q S V C ( t ) ( I i j ( t ) 2 ) x i j
where PPV(t) represents the output power of PV, PBAT(t) denotes the charge and discharge power of BAT. Pb(t) and Ps(t) mean that the whole system buys and sells electric power from the primary grid, respectively, And Pload(t) indicates the power consumed by the load. Qload(t) is the reactive load power during period t, QCB(t), QSVC(t) are the reactive power of the capacitor banks and the static reactive compensator at period t respectively. Iij(t) represents the branch ij current value at time period t, and xij is the reactance of branch ij.
Distribution network is closed loop design, open loop operation form. The operation mode and state information are power distribution, node voltage amplitude, voltage phase. Angle and network loss can be obtained by power flow calculation of distribution network. The parameter structure R/X ratio of the distribution network is in the form of high impedance ratio. According to the structural characteristics of the distribution network, the paper adopts the Newton–Raphson power flow calculation method:
J Δ U = Δ S
in the type, Δ U = [ ( Δ f 1 , Δ e 1 ) , ... , ( Δ f n , Δ e n ) ] T , Δ S = [ ( Δ P 1 , Δ Q 1 ) , ... , ( Δ P n , Δ Q n ) ] T , J is the Jacobian, the node voltage and power corresponding to node i can be expressed as V i = e i + j f i , S i = P i + j Q i .

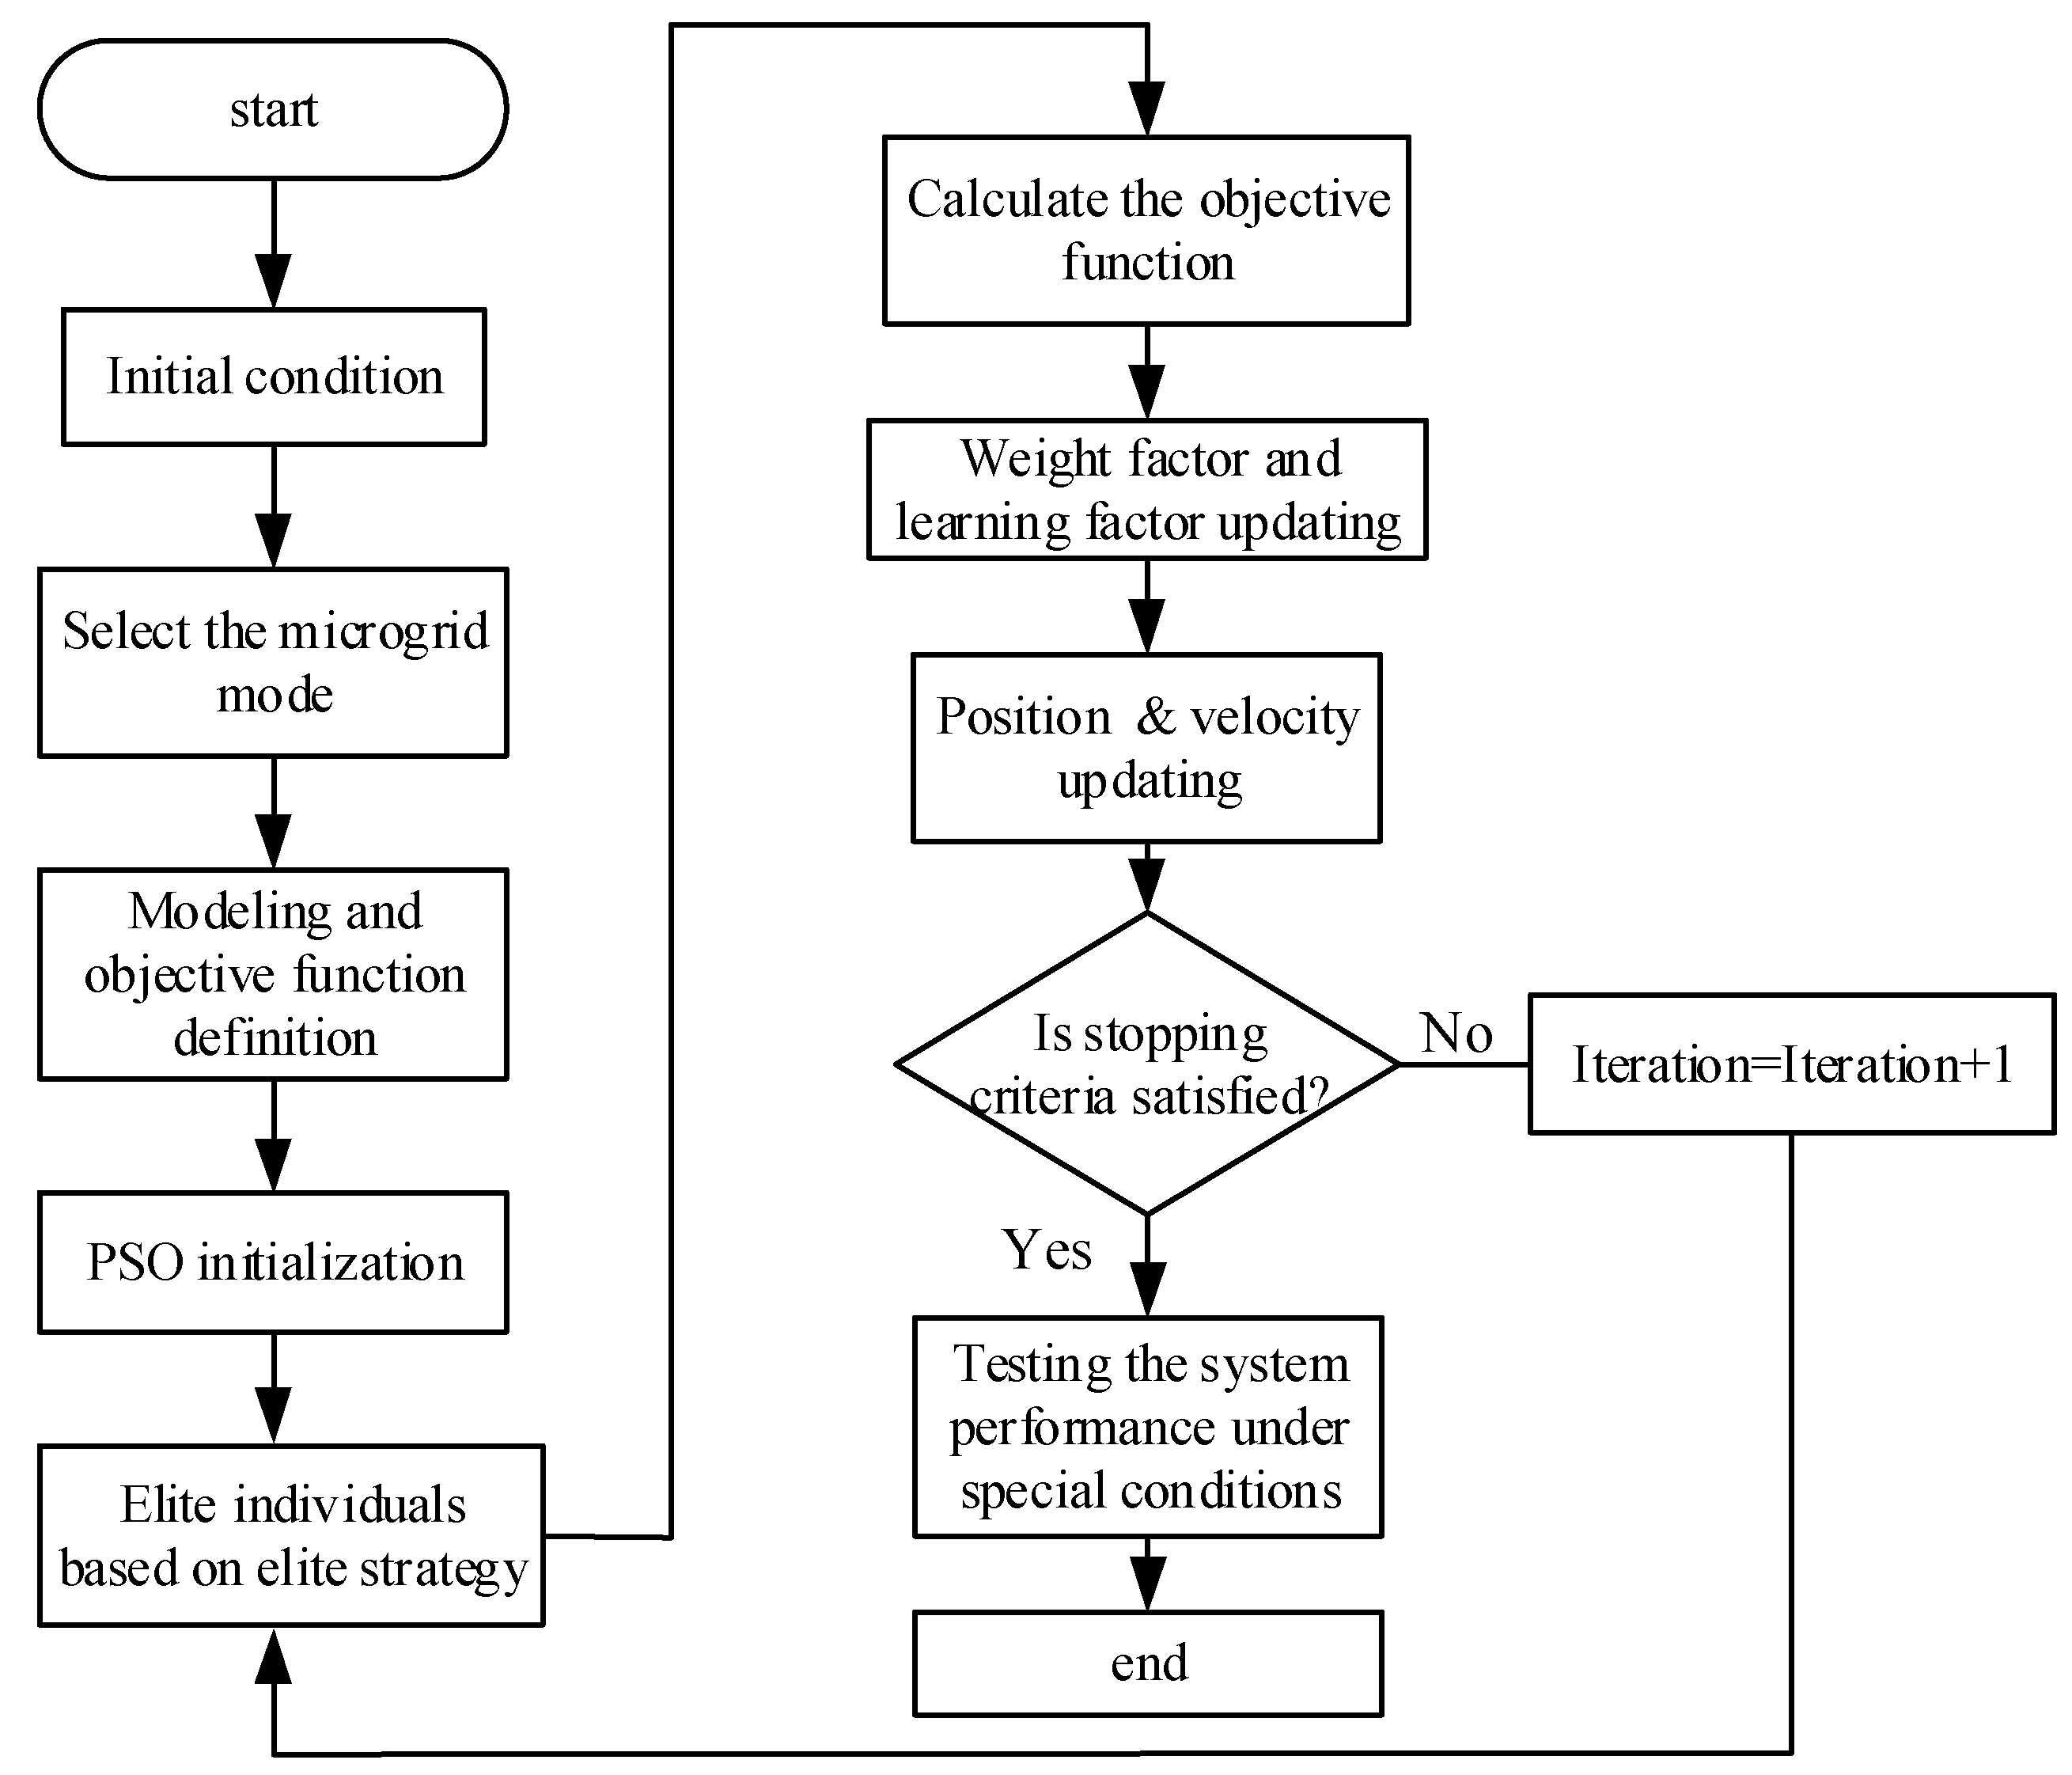
2.2.3. Improved PSO Algorithm for Typical Condition under COVID-19 Background

  • Improved PSO algorithm application;
Particle swarm optimization (PSO) is a random search algorithm based on the swarm intelligence. By sharing location and fitness information among the particles, the particles gradually converge to the global optimal solution. The traditional parameter selection can easily obtain the local optimal solution, but not the global optimal solution [38,39]. In order to improve the search efficiency of PSO and avoid premature convergence, the elite strategy is used to expand the search space for particles. Meanwhile the dynamic factors are utilized to improve the accuracy and speed of the algorithm solution.
  • elite strategy;
  • The elite strategy is used to generate elite reverse individuals. The fitness value of each particle is calculated. Meanwhile, the fitness value of the particle is stored in pBest. Further, the next generation population is generated based on the best value of the objective function. Moreover, the fitness value of the best individual is stored in gBest.
  • Weight factor and acceleration updating.
The inertia weight factor w and learning factor (c1, c2) are very important parameters that have an obvious effect on the algorithm performance in PSO algorithm. The traditional parameter selection based on selecting constant is easy to obtain the local optimal solution, but not the global optimal solution. Aiming at the shortcoming, PSO algorithm is improved from the inertial weight factor and the learning factor. The improved strategy is as follows:
w = w e + ( w s w e ) ( T t ) / T
{ c 1 = c 1 s + ( c 1 e c 1 s ) t 2 / T 2 c 2 = c 2 s + ( c 2 e c 2 s ) t 2 / T 2
where ws and we are the initial value and the end value, respectively. t and T are the current number and the maximum number during the iteration, respectively. c1s and c1e are the beginning and final value of c1, respectively, while c2s and c2e are the beginning and final value of c2, respectively.
Hence, the improved PSO algorithm based on the elite strategy and the dynamic factors is shown in Figure 5 in order to optimize dispatching power of the microgrid in Baiyangdian Region under COVID-19 background.
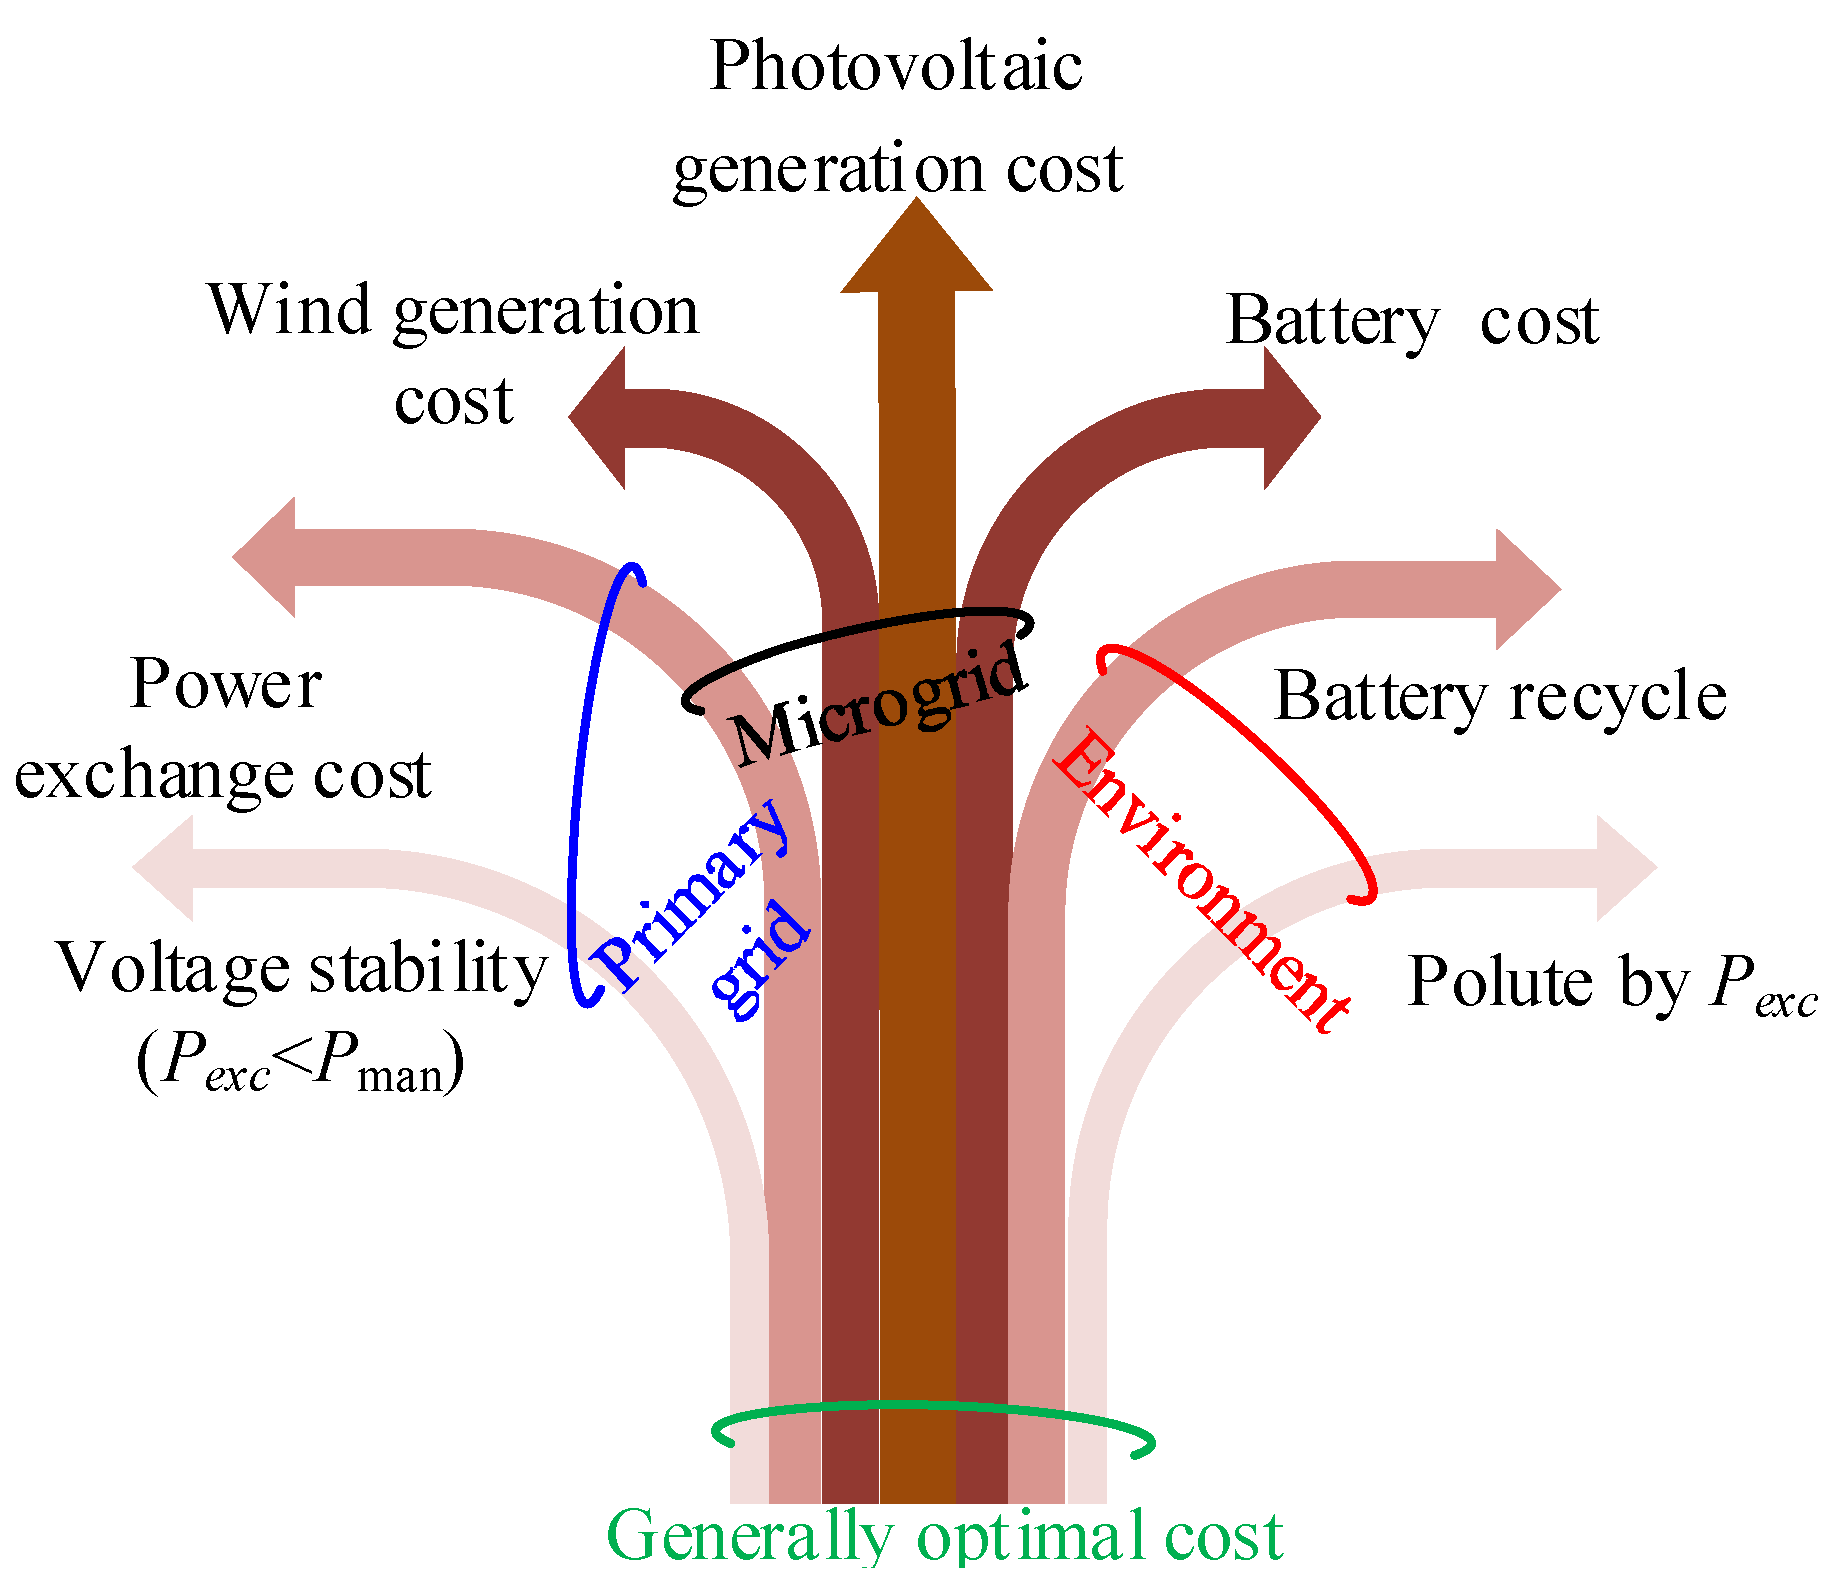
  • Objective functions and optimization scheme.
Various costs are incurred during the microgrid operation. The microgrid power costs mainly include the operation and maintenance cost, the depreciation cost, environmental protection cost, and the power exchange cost between the primary grid and the microgrid based on the power flow, see Figure 6.
During the operation of the microgrid, the distributed generation incurs the maintenance cost due to the labor cost. The costs can be written as:
C r m = g x p ( t )
where p(t) denotes the energy yield of each distributed generation, and gx represents the relationship between the generating capacity of each distributed generation and it corresponds to the operation and maintenance cost, usually taking the empirical value. gPV and gWT are 0.61 rmb/kWh and 0.75 rmb/kWh, respectively.
The wind turbine generator, the photovoltaic, and the battery lead to the wear of service life. Hence the depreciable cost should be taken into consideration, and it can be expressed by:
{ C D E P = i = 1 N C i n s i × f c r i p c r i × τ g i P g i × Δ t f c r i = s ( 1 + s ) n i ( 1 + s ) n i 1
where C i n s i represents the price and the installation cost of the equipment, f c r i denotes the recovery coefficient, τ g i indicates the service life or the depreciation life of equipment, ni represents the available duration of the device.
In the process of the energy recycling, a variety of pollution are produced. Hence, the environmental governance cost should be taken into account based on the environmental policy. The environmental governance cost can be written as:
C E N V = n = 1 N α n E n ( P ( n ) )
where P(n) denotes the output power of the pollutant, En represents the cost of treating the pollution (rmb/kg), αn represents the pollutant emission, n represents the pollutant number.
In the process of connecting wind turbines, photovoltaic generators, and batteries to the grid, the output power of distributed power supply will have different degrees of losses affected by the efficiency of transformer, inverter, and other equipment, which, in turn, causes economic damage. This part of loss can be expressed as [40]:
C D M P = t = 1 T n = 1 N β n γ P n ( t )
where Pn(t) denotes the output power of the distributed power supply, βn represents the power losses rate of device n, γ represents the economic loss caused by unit power loss. N and T indicate the total number of devices and periods.
The grid plays a supporting role for the whole system under the grid-connected mode. If the output of all distributed power sources in the micro grid is greater than all load consumption, the power is sold to the grid. If the output of all distributed power sources in the micro-grid cannot meet all load consumption, it needs to buy power from the grid. Economic model between micro-grid and power grid can be written as:
C p = t = 1 T ( A b u y ( t ) P b ( t ) B s e l l   ( t ) P s ( t ) )
where, T represents the optimization cycle, Abuy represents the price of the electricity bought from the grid; Bsell represents the price of the electricity sold to the large grid, Pb is the amount of electricity bought from the grid; Ps represents the amount of electricity sold to the grid. The corresponding electricity price within a period is shown in Figure 7. The electric price is the same for the same period of time every day. Hence, the price is supposed to be constant.
In the process of equipment operation and power transmission, the power loss and the line loss are unavoidable. Hence, the power loss and the line loss while calculating the operation economy of microgrid must be taken into consideration. The expressions for power loss and line loss can be written as [41]:
C L O S S = n N t = 1 T P n 2 ( t ) 2 U n 2 r n L n
where Pn(t) represents the output power of device n in period t, and N and T are the total number of devices in microgrid and the total number of hours. Un, rn, and Ln are the output power of equipment n, the resistance of device n, and the distance between device n and the main line of the grid.
In this paper, the microgrid optimization scheduling model proposed takes the economy and the environment of the microgrid as the objective function to optimize the micro-source output with different modes. Hence, taking the economy and the environment into account, the objective function can be written as:
min C L = w 1 C C r m + w 2 C C D E P + w 3 C t = 1 T R e x c C p ( t ) + w 4 C C E N V + w 5 C C L O S S + ω 6 C C D M P
and ω1C to ω6C are the weighted factors for the economic operation. In different modes, based on (13) and (14), the weighted factors are dynamic in order to better find the optimal solution.

2.3. Power Dispatching Optimization Case Study

2.3.1. Five Modes

Taking the impact of the pandemic into consideration, five modes of the microgrid in Baiyangdian Region are proposed in order to fully meet various policy restrictions. As shown in Table 2, three special factors, including the battery, the new energy generation, and exchange between microgrid and primary grid are considered as three variables among five modes.
In mode 1 and mode 2, the battery is not considered and the electric power can be exchanged between the microgrid and the primary grid. The new energy generation is mandatory in mode 1 due to power generation policy in China while the new energy generation can be abandoned in mode 2 in order to obtain high economic benefits. Further, in mode 3, the battery is considered to work as mode 1. Meanwhile, both the abandoned energy power and the battery are taken into account in mode 4 and mode 5. The difference is that the electric power exchange between the microgrid and the primary grid is limited strictly in mode 5 due to the pollution from the thermal power generation.
The objective functions of the five modes can be written separately as:
min C L = { C B + ω 3 C , m 1 t = 1 T C P ( t ) + ω 5 C , m 1 [ C L O S S , W T + C L O S S , P V ] ( mode   1 ) C B + ω 3 C , m 2 t = 1 T C P , C ( t ) + ω 5 C , m 2 [ a C L O S S , W T + b C L O S S , P V ] ( mode   2 ) C B + ω 3 C , m 3 t = 1 T C P , B ( t ) + ω 5 C , m 3 [ C L O S S , W T + C L O S S , P V + C L O S S , B A T ] ( mode   3 ) C B + ω 3 C , m 4 t = 1 T C P , C B ( t ) + ω 5 C , m 4 [ a C L O S S , W T + b C L O S S , P V + C L O S S , B A T ] ( mode   4 ) C B + ω 3 C , m 5 t = 1 T C P , C B L ( t ) + ω 5 C , m 5 C L O S S , C B L ( mode   5 )
where
{ C B = w 1 C C r m + w 2 C C D E P + w 4 C C E N V + ω 6 C C D M P C P ( t ) = μ ( t ) [ P l o a d ( t ) P W T ( t ) P P V ( t ) ] C P , C ( t ) = μ ( t ) [ P l o a d ( t ) a P W T ( t ) b P P V ( t ) ] C P , B ( t ) = μ ( t ) [ P l o a d ( t ) P W T ( t ) P P V ( t ) P B A T ( t ) ] C P , C B ( t ) = μ ( t ) [ P l o a d ( t ) a P W T ( t ) b P P V ( t ) P B A T ( t ) ] C P , C B L ( t ) = A b u y ( t ) P b u y ( t ) B s e l l ( t ) P s e l l ( t ) P b u y ( t ) = max { 0 , min { P l o a d ( t ) a P W T ( t ) b P P V ( t ) P B A T ( t ) , P e x c , max } } P s e l l ( t ) = max { 0 , min { a P W T ( t ) + b P P V ( t ) + P B A T ( t ) P l o a d ( t ) , P e x c , max } } μ ( t ) = A b u y ( t ) + B s e l l ( t ) C L O S S , W T = t = 1 T P W T 2 ( t ) r W T L W T 2 U W T 2 ( t ) C L O S S , P V = t = 1 T P P V 2 ( t ) r P V L P V 2 U P V 2 ( t ) C L O S S , B A T = t = 1 T P B A T 2 ( t ) r B A T L B A T 2 U B A T 2 ( t )
and ω3C,m1 to ω3C,m5 are the weighted factors ω3C for mode 1 to mode 5. In different cases, the weighted factors are assigned with different values. For example, ω3C,m1 is smaller than ω3C,m3 and much smaller than ω3C,m5. CB is the basic cost including the maintenance costs Crm, the depreciable costs CDEP, and the environment costs CENV. Moreover, ω1C, ω2C, ω4C are the weighted factors for the economic operation. CP(t), CP,C(t), CP,B(t), CP,CB(t), and CP,CBL(t) are the electricity transaction cost for different mode, respectively, and Pload(t), PWT(t), PPV(t), and PBAT(t) are the load power, the output power of wind generator, photovoltaic generator and batteries at period t. µ(t) represents the electricity transaction coefficient, which contains Abuy(t), and Bsell(t) indicates the purchase price of electricity per unit in period t and the selling price per unit in period t. Pbuy(t) and Psell(t) donate the power sold to the grid and the power bought from the gird. In addition, Pexc,max represents the upper limit of power exchange between microgrid and grid. CLOSS,PV, CLOSS,WT, and CLOSS,BAT are the power loss and the line loss from photovoltaic power generation, wind power generation, and batteries. In general, a identifies the abandon of the wind generator, a = {0, 1}; and b identifies the abandon of the photovoltaic generator.

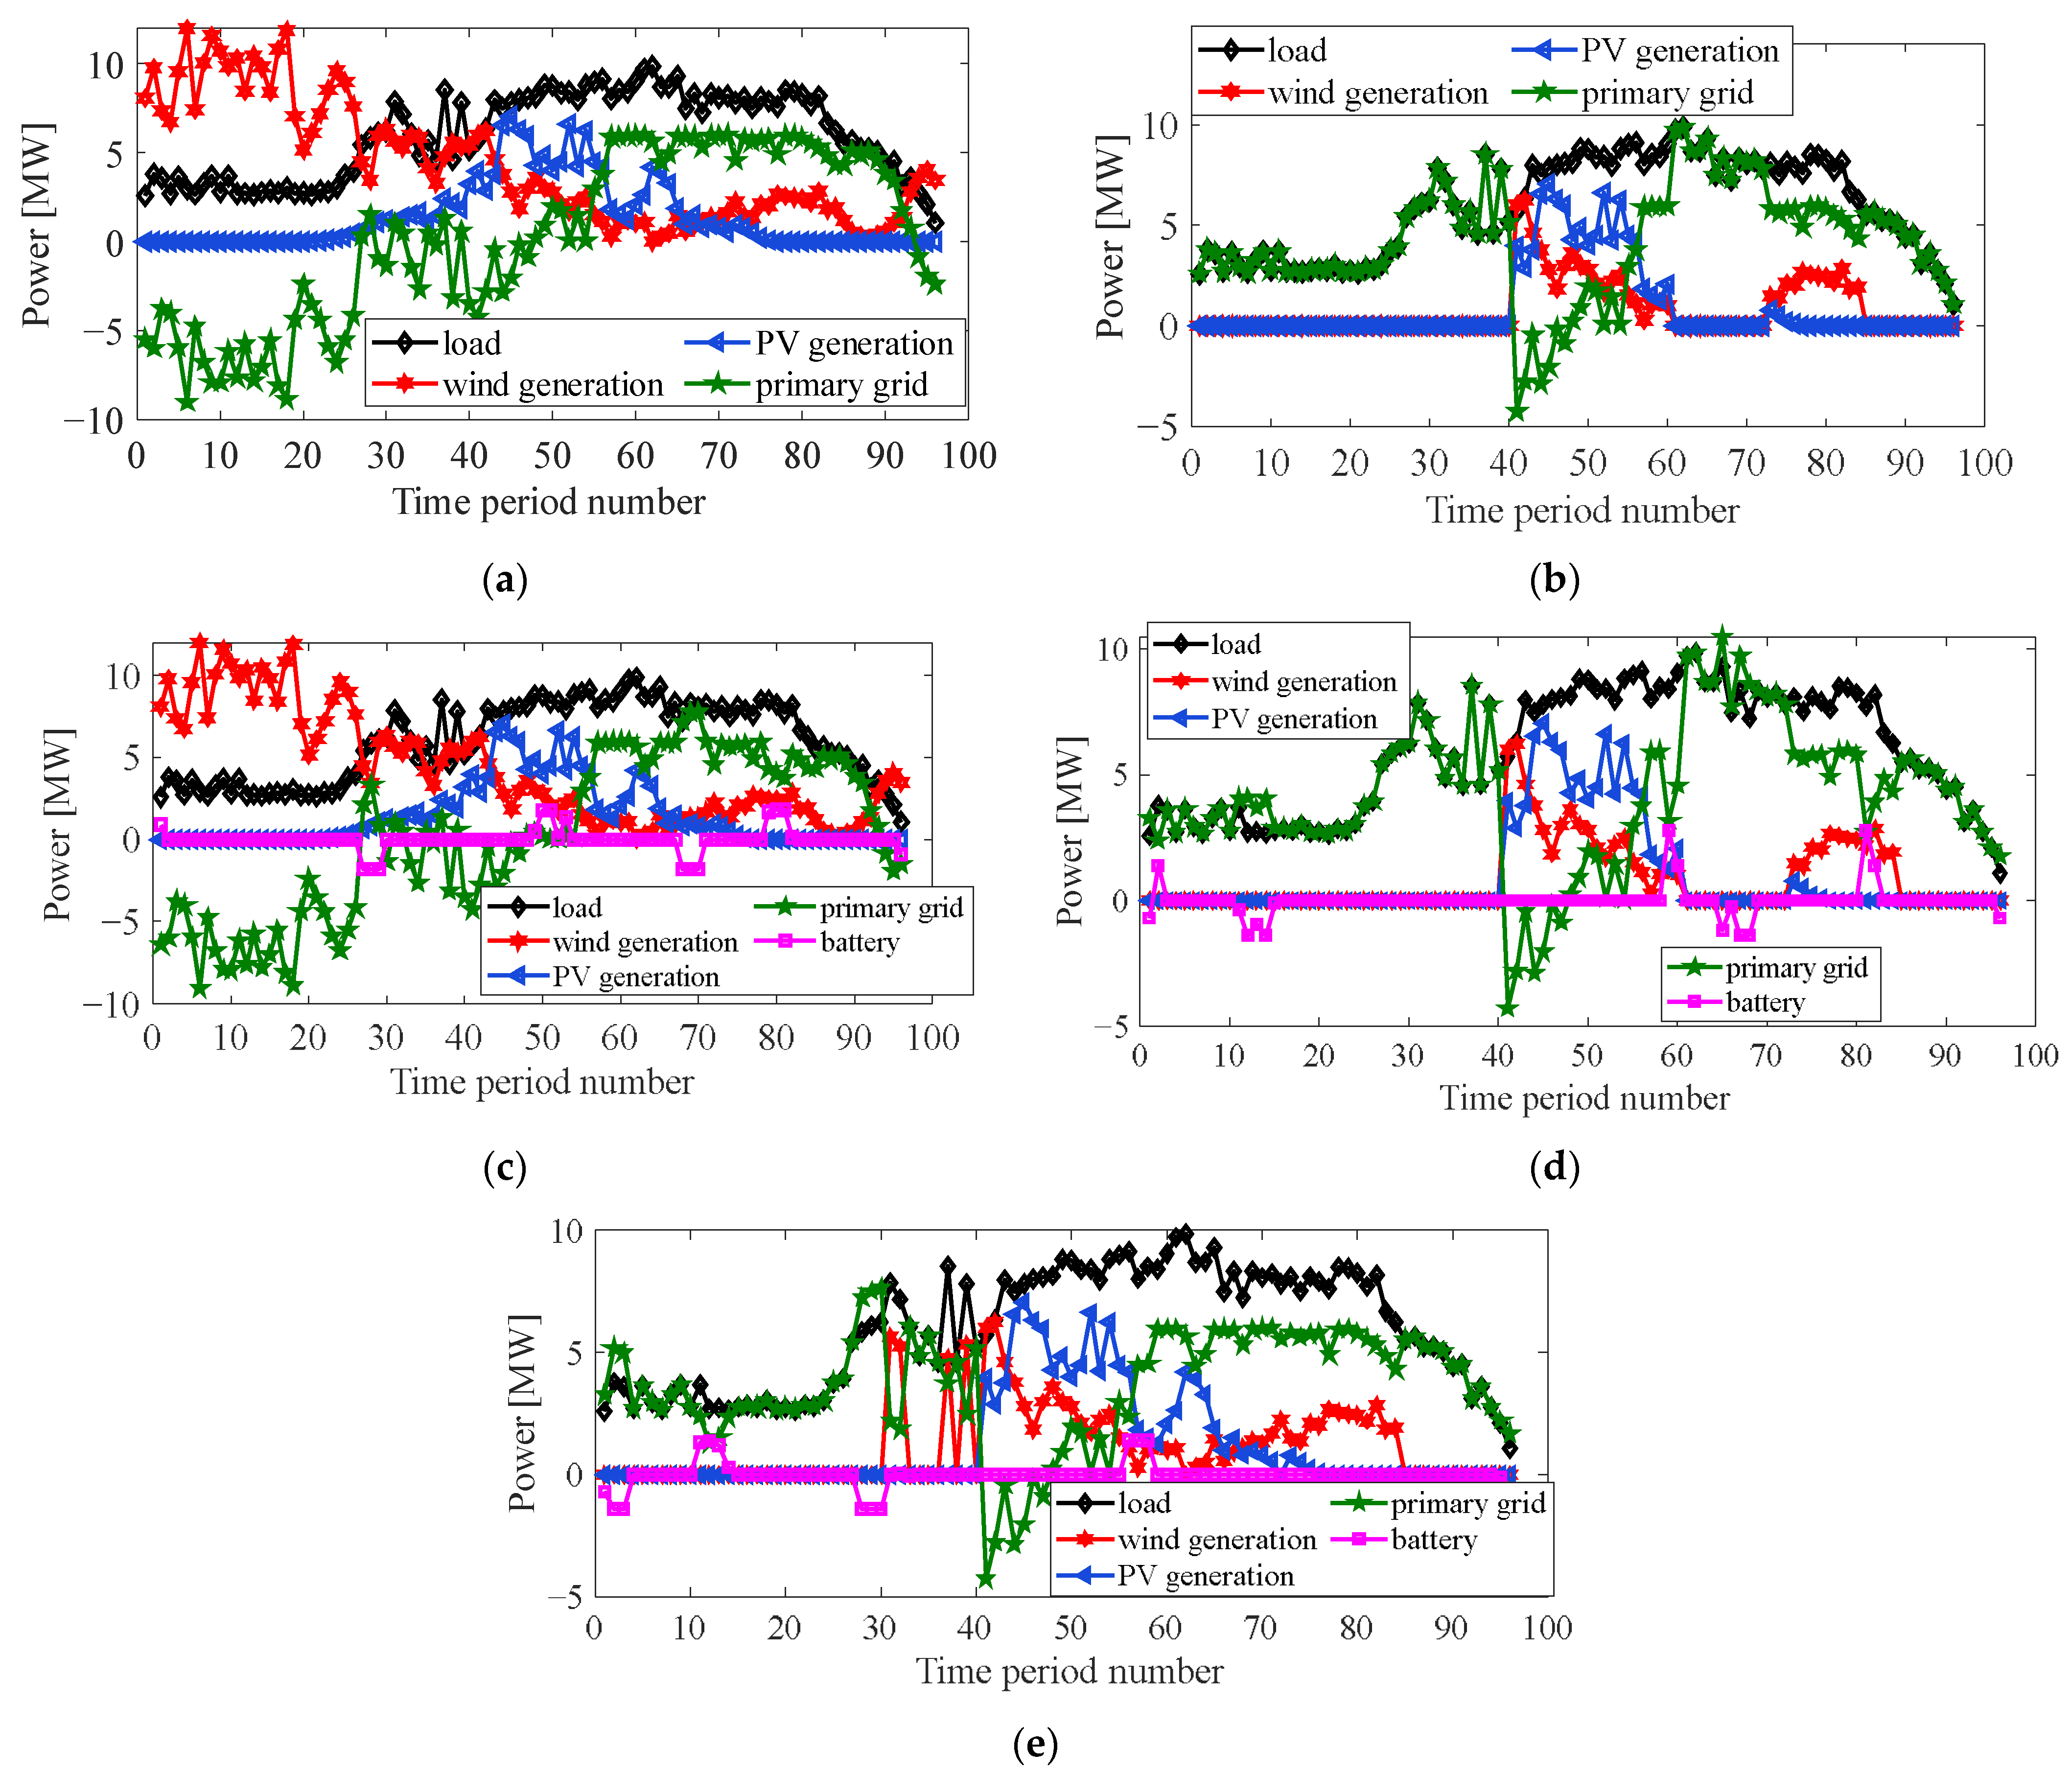
2.3.2. Power Dispatching Optimization without Epidemic

Figure 8 shows comprehensively the sources including the new energy power, the battery, and the exchanged power form the primary grid. The proportion of the wind generation and the photovoltaic generation to the load changes during different time periods due to the varying power price and the characteristics of the distributed generator. Generally, the main source of the load is still from the primary grid due to the small amount of new energy installation without the pandemic.
Observing the different power curves in Figure 8a, the load power is mainly provided by the new energy generation from 0:00 to 7:00. Moreover, the excess power is sold to the primary grid for the more economic benefit at the time. The primary grid is in play due to the lack of the new energy generation, while the load is from the primary grid during 0:00 to 10:00 in mode 2 due to the lower electricity price.
In mode 3, mode 4, and mode 5, the battery is used in the microgrid in order to acquire more economic benefits. Comparing the curves in three modes, it is clear that the electricity is stored in the battery when the purchase price is high. Specially, the exchange between the primary and the microgrid is allowed to exceed the limit in order to meet the load need.

2.3.3. Power Dispatching Optimization with Epidemic

As shown in Figure 9, the power of the load from the new energy power, the battery, and the exchanged power from the primary grid is calculated in detail. The proportion of the wind generator power and the photovoltaic generation power to the load changes during different time periods due to the varying power price and the characteristics of the distributed generator.
Comparing the different power curves in Figure 9a, the load power is mainly provided by the new energy generation from 0:00 to 10:00. Meanwhile, the excess power is sold to the primary grid for the more economic benefit at the time. Moreover, the load supply is mainly from the exchanged power by the primary grid due to the insufficient power of the new energy generation. In mode 2, the power of the new energy generation is utilized during 10:00 to 15:00 and 18:00 to 21:00 due to the lower electric price. The microgrid buys the electric power from the primary in order to meet the load need for the rest of the day.
The operating economy of the microgrid is gradually highlighted under COVID-19 background due to the decline of the tourism economy. Hence, the energy storage device is utilized to improve the economy of the power distribution. Based on the comparation between the generation price and the power price of the primary grid, the battery can store electric power when there is too much power generation, and release the power to the microgrid in order to meet the load demand by observing the curves in Figure 9c,d. In mode 5, the max value of the exchanged power from the primary is limited strictly and is less than 6 MW in order to decrease the thermal power. Comparing the mode 5 with mode 4, it is clear that the electric power from the primary grid is limited during 7:00 to 9:00 and 15:00 to 18:00.

3. Results and Discussion

For the sake of comparing the curves of the new energy generation, the battery discharging, and the exchanged power from the primary grid, the same kind of the distributed generation power curve under each mode is indicated in Figure 10 and Figure 11.

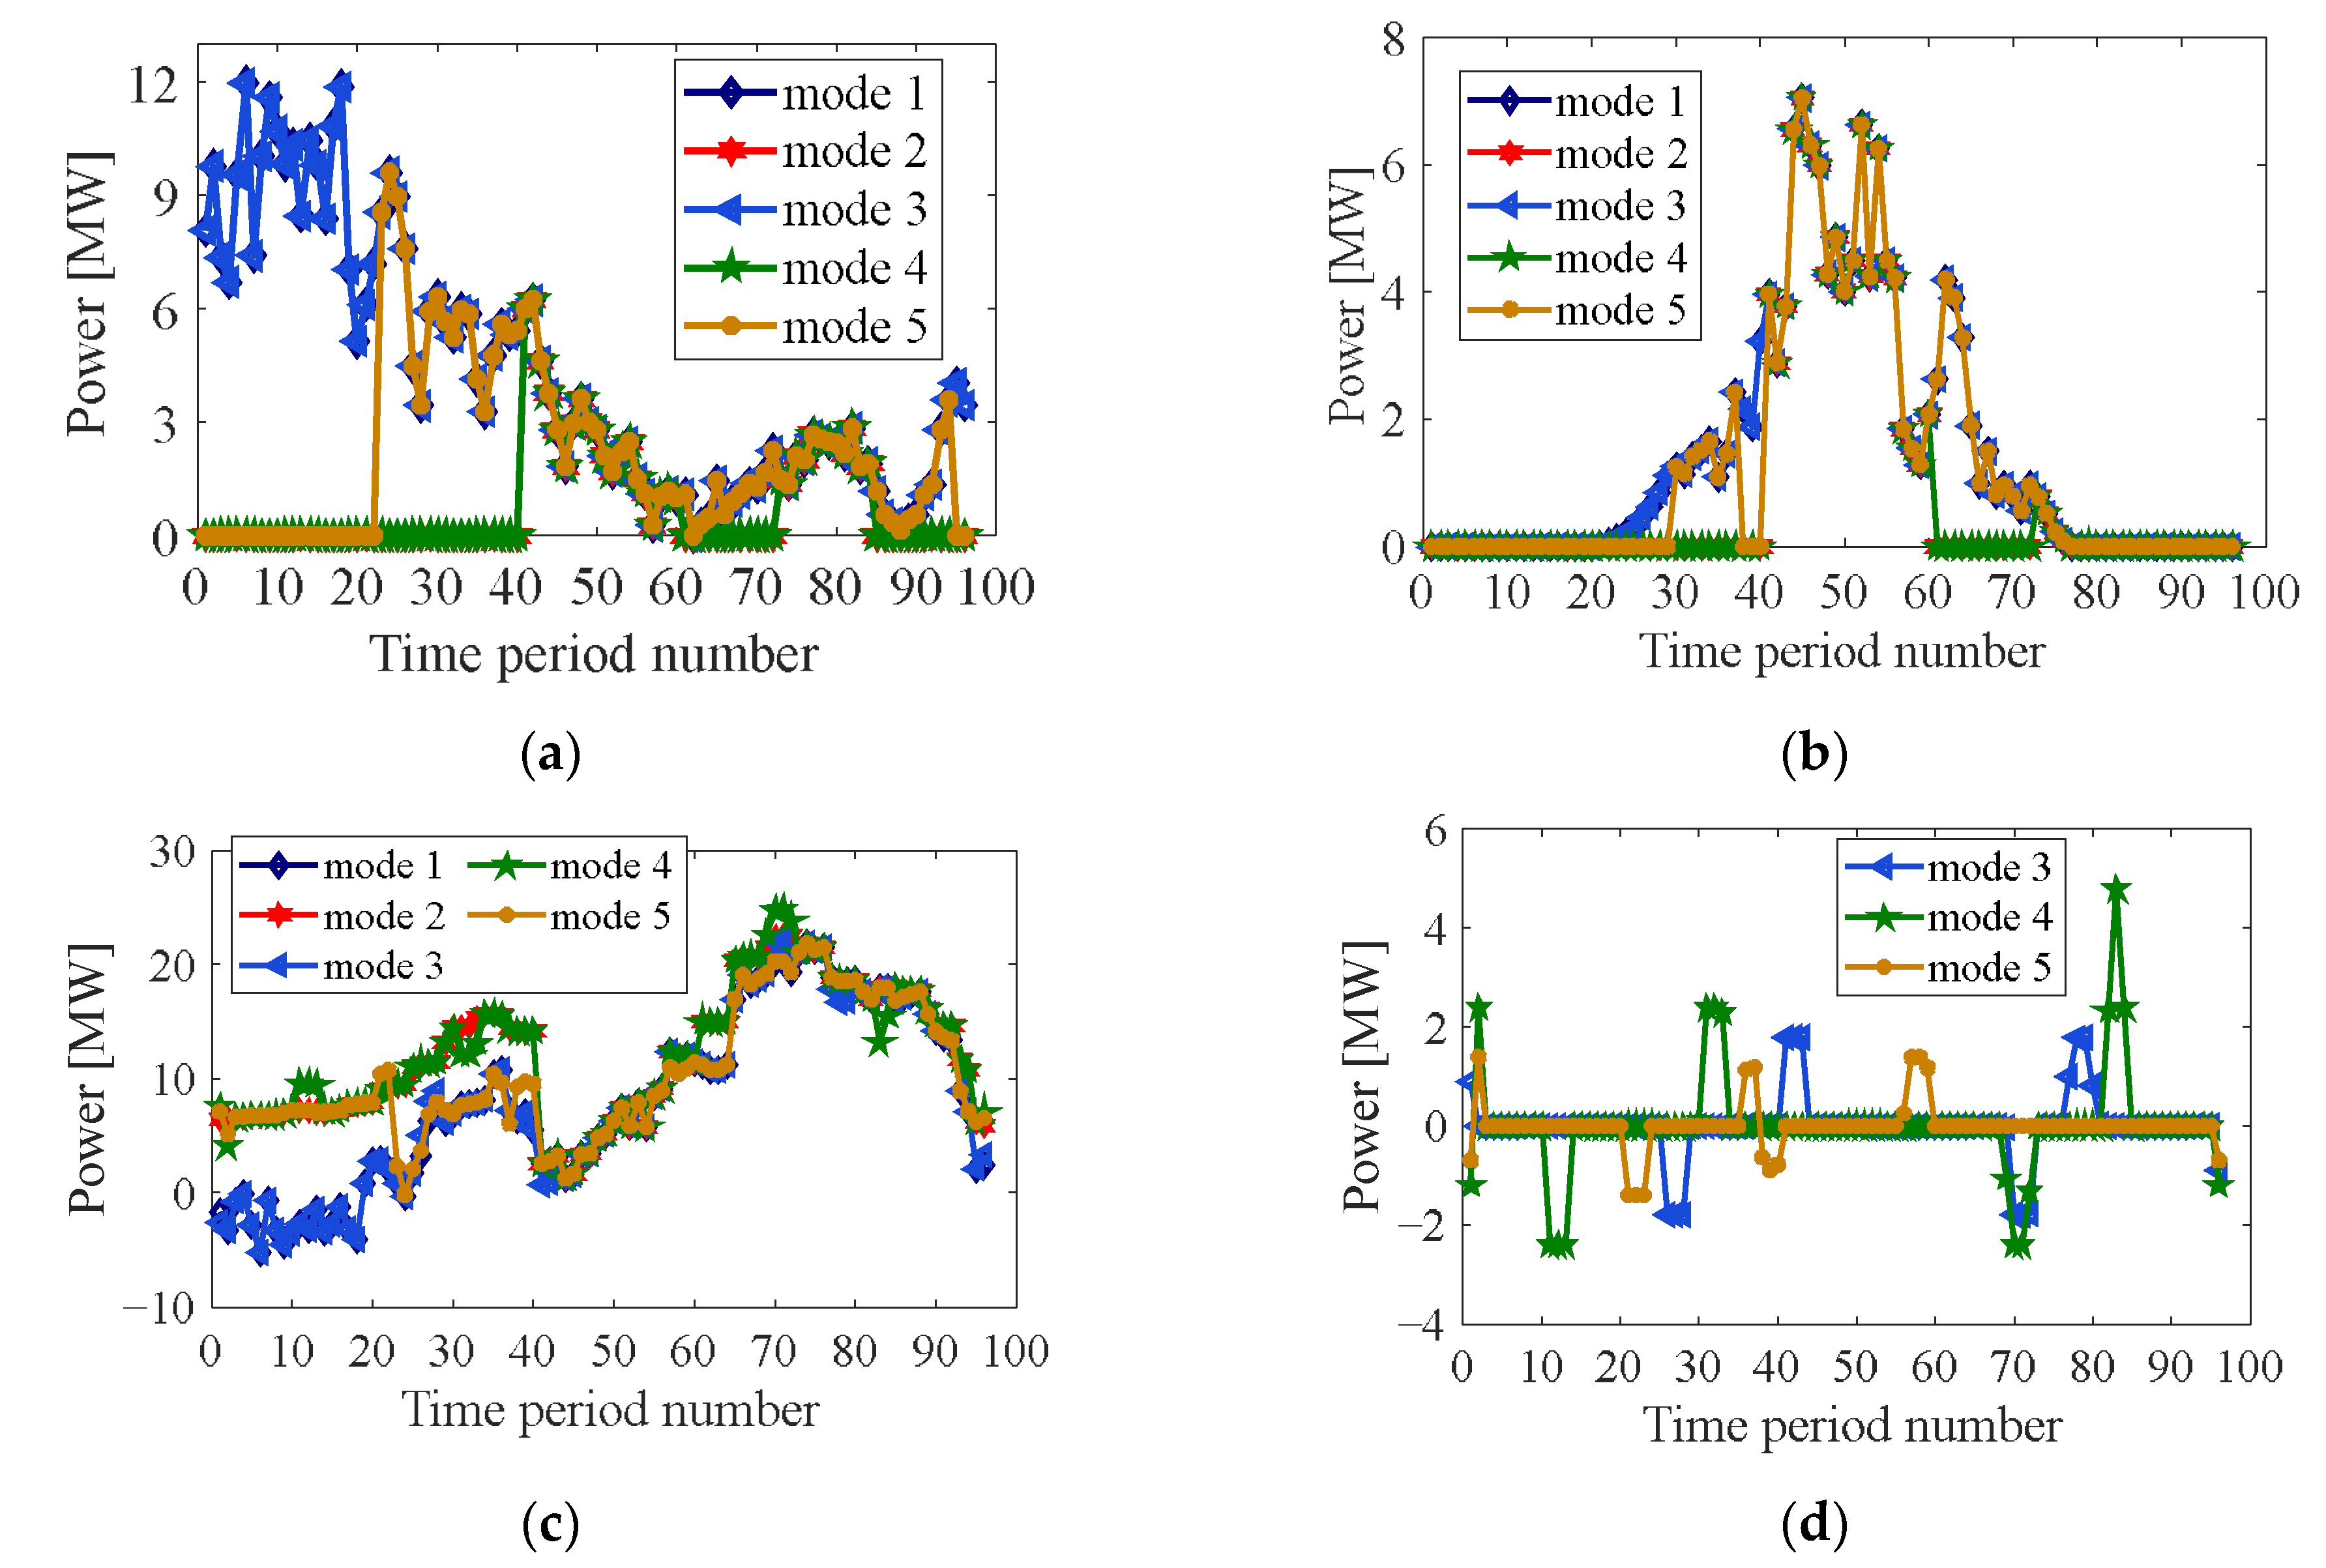
3.1. Comparison among Five Modes

As shown in in Figure 10a and Figure 11a, the wind generation power dispatching under different modes is divided into two time quantum, which is the period 1 to 40 (0:00–10:00) and the period 44 to 92 (11:00–23:00). It is very similar for five modes during later period, while the power curves have an obvious difference among different modes. Only in mode 1 and mode 3 the wind generation is fully used to fulfill the load in order to improve the utilization rate of new energy, while in other cases it is rarely utilized due to the high price. Hence, the wind generation power dispatching in mode 1 and mode 3 is independent of the pandemic. Meanwhile, the mode 5 has been most affected by the pandemic.
Figure 10b and Figure 11b illustrate the photovoltaic generation curves in five modes. The photovoltaic generation is the most during 10:00–19:00. Taking the economy and the environmental management request into account, the photovoltaic power output is the most utilized in mode 1 and mode 3. Comparing the curves of the photovoltaic power output under different modes, the utilization rate of the photovoltaic in mode 5 is higher than that in mode 4 due to the lower price in order to meet the load need. Since photovoltaic power generation is less than that of wind turbines, the pandemic has less impact on photovoltaic power dispatching.
Figure 10c and Figure 11c show the purchase and the sale of the electric power from the primary grid in the microgrid. Generally, the abandonment of the new energy generation must be taken into consideration due to the poor power quality. In fact, the exchanged power from primary grid depends on the load. The pandemic caused the load of Baiyangdian area to drop significantly. Hence, it is suggested that the exchanged power from the primary grid still takes up the largest proportion of the load in each case, especially before the pandemic.
Observing the battery discharging, it is illustrated in Figure 10d and Figure 11d that the battery outputs more power in economic condition. Meanwhile, in mode 1 and mode 2 the battery is not utilized in order to reduce the battery pollution. Moreover, the pandemic has significantly increased the number of battery uses and the amount of power used.
As shown in Figure 12, the nodes are clearly distributed in the microgrid. Generally, the nodes are selected as the position where the source-network-load-storage is connected to the microgrid. Further, due to space constraints, the voltage profiles of the different nodes in the microgrid only under mode 3 and mode 4 are indicated in Figure 13.
The voltage profiles are closely related to the new energy power utilization. Observing the curves of the voltage profiles in Figure 13, it is clear that the voltages of the node 1 and node 5 are significantly stable. Meanwhile, the voltage fluctuation is very small. The stable voltage shows that the reactive power of the system is balanced due to the reactive power compensation device. For wind generation at node 2, the voltage is generally constant and equal to 1p.u. in mode 3, while there is no voltage in mode 4 due to unused wind generation. For PV generation at mode 3, there is a significant change in the voltage due to no PV generation at night. Similarly, the voltage of node4 is present only during the battery charging and discharging.

3.2. Impact on Microgrid Economic Due to Epidemic

Taking five modes and the impact of the pandemic into consideration, the total cost and the average electric price are shown in Table 3.
By comparing the five modes it is obtained that the power dispatching considering the economy and the environment in mode 4 will spend a lower cost by considering the battery and the abandoned new energy. The cost in mode 5 is higher than that in mode 4 due to the energy exchange restriction between the microgrid and the primary grid. In general, the battery is obviously beneficial to improve the economic efficiency of the microgrid. Hence, the microgrid construction needs to consider many factors.
Moreover, in the same mode, the pandemic decreased the total cost of the microgrid in the Baiyangdian Region because the total load during the pandemic is lower than at other times while the average electric price in pandemic condition is higher than that under normal condition. Hence, the pandemic can actually increase the cost of living.
As a tourist region, the government should reduce the discharge of all kinds of pollution. The microgrid operated in an environment-friendly manner in the absence of the COVID-19. However, the economy, which is tourism-driven, decreases greatly after COVID-19. Hence, the power dispatching of the microgrid needs to be properly considered based on the economic and environmental factors. Therefore, based on the factual conditions and the real-time policy, the appropriate model should be selected. The mode 4 is most optimal if there is no restriction.

4. Conclusions

In the paper, the optimized power dispatching of the microgrid is comprehensively proposed based on improved PSO algorithm taking multiple elements of the source-network-load-storage into consideration. The novelty of this paper mainly lies in three aspects: (1) the PSO algorithm is improved by the modified weighted factor and the elite strategy in order to add the accuracy and the speed of the algorithm solution. (2) According to the factual conditions and the real-time policy, five modes of the microgrid in the Baiyangdian region are proposed and the optimal mode is obtained. (3) The impact of the pandemic has been fully considered by comparing the power dispatching before and after the pandemic.
It is shown that the pandemic caused a decrease in the total cost of the microgrid while the average electric price increased. Moreover, mode 4 is the optimal mode by comparing the economic benefits between the five modes.
The proposed method confirmed its effectiveness in the case study on the Baiyangdian Region. It is shown that photovoltaic generation and wind generation, the storage system as well as the exchanged power from the primary grid will get a high degree of use in order to obtain the obvious economic benefits due to the tourism decrease in COVID-19 background. However, the pandemic will disappear in the future, and the operating mode of the microgrid should be selected based on microgrid construction and national policies.

Author Contributions

Conceptualization, J.-L.Z. and S.-M.Z.; methodology, X.-D.D.; software, X.-D.D.; validation, J.-L.Z., S.-M.Z. and W.-T.X.; formal analysis, Y.-L.H.; investigation, Y.-L.H.; resources, Y.-L.H.; data curation, J.-L.Z.; writing—original draft preparation, J.-L.Z.; writing—review and editing, J.-L.Z.; visualization, X.-D.D.; supervision, X.-D.D.; project administration, J.-L.Z.; funding acquisition, Y.-L.H. All authors have read and agreed to the published version of the manuscript.

Funding

This work was supported by the Hebei Provincial Key Research and Development Program (Grant No. 21312102D), Suzhou Social Developing Innovation Project of Science and Technology (SS202134), and the Top Youth Talent support Program of Hebei Province ([2018]-27).

Informed Consent Statement

Not applicable.

Data Availability Statement

Data is contained within the article.

Conflicts of Interest

The authors declare that there is no conflict of interest regarding the publication of this paper.

References

  1. Ding, S.; Liu, L. Review of microgrid research. Pop. Stand. 2021, 22, 225–227. [Google Scholar]
  2. Xin, B.; Shan, B.; Li, Q.; Yan, H.; Wang, C. Rethinking of the “Three Elements of Energy” Toward Carbon Peak and Carbon Neutrality. Proc. CSEE 2022, 42, 311. [Google Scholar]
  3. Yuan, W.; Wang, Y.; Chen, Z. New Perspectives on Power Control of AC Microgrid Considering Operation Cost and Efficiency. IEEE Trans. Power Syst. 2021, 36, 4844–4847. [Google Scholar] [CrossRef]
  4. Elrayyah, A.; Sozer, Y.; Elbuluk, M.E. A Novel Load-Flow Analysis for Stable and Optimized Microgrid Operation. IEEE Trans. Power Deliv. 2014, 29, 1709–1717. [Google Scholar] [CrossRef]
  5. Rohouma, W.; Metry, M.; Balog, R.S.; Peerzada, A.A.; Begovic, M.M.; Zhou, D. Analysis of the Capacitor-Less D-STATCOM for Voltage Profile Improvement in Distribution Network with High PV Penetration. IEEE Open J. Power Electron. 2022, 3, 255–270. [Google Scholar] [CrossRef]
  6. Moghbel, M.; Masoum, M.A.; Fereidouni, A.; Deilami, S. Optimal Sizing, Siting and Operation of Custom Power Devices with STATCOM and APLC Functions for Real-Time Reactive Power and Network Voltage Quality Control of Smart Grid. IEEE Trans. Smart Grid 2018, 9, 5564–5575. [Google Scholar] [CrossRef]
  7. Ismail, B.; Wahab, N.I.A.; Othman, M.L.; Radzi, M.A.M.; Vijyakumar, K.N.; Naain, M.N.M. A Comprehensive Review on Optimal Location and Sizing of Reactive Power Compensation Using Hybrid-Based Approaches for Power Loss Reduction, Voltage Stability Improvement, Voltage Profile Enhancement and Loadability Enhancement. IEEE Access 2020, 8, 222733–222765. [Google Scholar] [CrossRef]
  8. Cho, J.; Kim, H.; Cho, Y.; Kim, H.; Kim, J. Demonstration of a DC Microgrid with Central Operation Strategies on an Island. In Proceedings of the 2019 IEEE Third International Conference on DC Microgrids (ICDCM), Matsue, Japan, 20–23 May 2019; pp. 1–5. [Google Scholar]
  9. Babayomi, O.; Li, Z.; Zhang, Z. Distributed secondary frequency and voltage control of parallel-connected vscs in microgrids: A predictive VSG-based solution. CPSS Trans. Power Electron. Appl. 2020, 5, 342–351. [Google Scholar] [CrossRef]
  10. Simpson-Porco, J.W.; Shafiee, Q.; Dörfler, F.; Vasquez, J.C.; Guerrero, J.M.; Bullo, F. Secondary Frequency and Voltage Control of Islanded Microgrids via Distributed Averaging. IEEE Trans. Ind. Electron. 2015, 62, 7025–7038. [Google Scholar] [CrossRef]
  11. Guo, F.; Wen, C.; Mao, J.; Song, Y.D. Distributed Secondary Voltage and Frequency Restoration Control of Droop-Controlled Inverter-Based Microgrids. IEEE Trans. Ind. Electron. 2015, 62, 4355–4364. [Google Scholar] [CrossRef]
  12. Basu, A.K.; Chowdhury, S.; Chowdhury, S.P. Chowdhury, Impact of Strategic Deployment of CHP-Based DERs on Microgrid Reliability. IEEE Trans. Power Deliv. 2010, 25, 1697–1705. [Google Scholar] [CrossRef]
  13. Bani-Ahmed, A.; Rashidi, M.; Nasiri, A.; Hosseini, H. Hosseini, Reliability Analysis of a Decentralized Microgrid Control Architecture. IEEE Trans. Smart Grid 2019, 10, 3910–3918. [Google Scholar] [CrossRef]
  14. Wu, X.; Zhao, W.; Wang, X.; Li, H. An MILP-Based Planning Model of a Photovoltaic/Diesel/Battery Stand-Alone Microgrid Considering the Reliability. IEEE Trans. Smart Grid 2021, 12, 3809–3818. [Google Scholar] [CrossRef]
  15. Tan, L.; Han, J.; Zhang, H. Ultra-Short-Term Wind Power Prediction by Salp Swarm Algorithm-Based Optimizing Extreme Learning Machine. IEEE Access 2020, 8, 44470–44484. [Google Scholar] [CrossRef]
  16. Wu, F.; Liao, X. Short-term Wind Power Forecast for Wind Farm Base on Artificial Neural Network. In Proceedings of the 2017 International Conference on Computer Technology, Electronics and Communication (ICCTEC), Dalian, China, 19–21 December 2017. [Google Scholar]
  17. Kim, G.G.; Choi, J.H.; Park, S.Y.; Bhang, B.G.; Nam, W.J.; Cha, H.L.; Ahn, H.K. Prediction Model for PV Performance with Correlation Analysis of Environmental Variables. IEEE J. Photovolt. 2019, 9, 832–841. [Google Scholar] [CrossRef]
  18. Han, X.H.; Wang, F.; Chen, M. Economic Evaluation of Micro-Grid System in Commercial Parks Based on Echelon Utilization Batteries. IEEE Access 2019, 7, 65624–65634. [Google Scholar] [CrossRef]
  19. Gonzalo, G.; Aguila, A.; González, D.; Ortiz, L. Optimum location and sizing of capacitor banks using VOLT VAR compensation in micro-grids. IEEE Lat. Am. Trans. 2020, 18, 465–472. [Google Scholar] [CrossRef]
  20. Herath, P.U.; Fusco, V.; Cáceres, M.N.; Venayagamoorthy, G.K.; Squartini, S.; Piazza, F.; Corchado, J.M. Computational Intelligence-Based Demand Response Management in a Microgrid. IEEE Trans. Ind. 2018, 55, 732–740. [Google Scholar] [CrossRef]
  21. Helmi, A.M.; Carli, R.; Dotoli, M.; Ramadan, H.S. Efficient and Sustainable Reconfiguration of Distribution Networks via Metaheuristic Optimization. IEEE Trans. Autom. Sci. Eng. 2021, 19, 82–98. [Google Scholar] [CrossRef]
  22. Zhang, Z.; Wang, Z.; Cao, R.; Zhang, H. Research on Two-Level Energy Optimized Dispatching Strategy of Microgrid Cluster Based on IPSO Algorithm. IEEE Access 2021, 9, 120492–120501. [Google Scholar] [CrossRef]
  23. Harasis, S.; Sozer, Y.; Elbuluk, M. Reliable Islanded Microgrid Operation Using Dynamic Optimal Power Management. IEEE Trans. Ind. Appl. 2020, 57, 1755–1766. [Google Scholar] [CrossRef]
  24. Wang, L.; Wang, Z.; Yang, R. Intelligent Multiagent Control System for Energy and Comfort Management in Smart and Sustainable Buildings. IEEE Trans. Smart Grid 2012, 3, 605–617. [Google Scholar] [CrossRef]
  25. Nikmehr, N.; Ravadanegh, S.N. Optimal Power Dispatch of Multi-Microgrids at Future Smart Distribution Grids. IEEE Trans. Smart Grid 2015, 6, 1648–1657. [Google Scholar] [CrossRef]
  26. Mao, M.; Jin, P.; Chang, L.; Xu, H. Economic Analysis and Optimal Design on Microgrids With SS-PVs for Industries. IEEE Trans. Sustain. Energy 2014, 5, 1328–1336. [Google Scholar] [CrossRef]
  27. Soon, J.J.; Low, K.S. Photovoltaic Model Identification Using Particle Swarm Optimization with Inverse Barrier Constraint. IEEE Trans. Power Electron. 2012, 27, 3975–3983. [Google Scholar] [CrossRef]
  28. Semero, Y.K.; Zhang, J.; Zheng, D. PV power forecasting using an integrated GA-PSO-ANFIS approach and Gaussian process regression based feature selection strategy. CSEE J. Power Energy Syst. 2018, 4, 210–218. [Google Scholar] [CrossRef]
  29. Huang, Y.C.; Huang, C.M.; Chen, S.J.; Yang, S.P. Optimization of Module Parameters for PV Power Estimation Using a Hybrid Algorithm. IEEE Trans. Sustain. Energy 2019, 11, 2210–2219. [Google Scholar] [CrossRef]
  30. Ma, K.; Hu, S.; Hu, G.; Bai, Y.; Yang, J.; Dou, C.; Guerrero, J.M. Energy Management Considering Unknown Dynamics Based on Extremum Seeking Control and Particle Swarm Optimization. IEEE Trans. Control Syst. Technol. 2019, 28, 1560–1568. [Google Scholar] [CrossRef]
  31. Li, S.B.; Kang, Z.T. Capacity Optimization of Clean Renewable Energy in Power Grid Considering Low Temperature Environment Constraint. IEEE Access 2021, 10, 2740–2752. [Google Scholar] [CrossRef]
  32. Chen, G.; Wang, J.M.; Yuan, X.D.; Chen, L.; Zhao, L.J.; He, Y.L. Chinese National Condition Based Power Dispatching Optimization in Microgrids. J. Control Sci. Eng. 2018, 2018, 8695391. [Google Scholar] [CrossRef]
  33. Qudsi, O.A.; Windarko, N.A.; Priyadi, A.; Purnomo, M.H. Optimized GDPWM based on Spontaneous Evolutionary GA for reducing switching losses on inverter. In Proceedings of the 2013 International Conference on Information Technology and Electrical Engineering, Yogyakarta, Indonesia, 7–8 October 2013; pp. 391–396. [Google Scholar]
  34. Gohil, G.; Bede, L.; Teodorescu, R.; Kerekes, T.; Blaabjerg, F. Comparative evaluation of modulation schemes for grid-connected parallel interleaved inverters. In Proceedings of the 2016 IEEE 7th International Symposium on Power Electronics for Distributed Generation Systems, Vancouver, BC, Canada, 27–30 June 2016; pp. 1–8. [Google Scholar]
  35. Liu, L. Research on Power Coordination Control and Economic Operation Strategy of Low Voltage Microgrid; Xihua University: Chengdu, China, 2019. [Google Scholar]
  36. Ropp, M.E.; Gonzalez, S. Development of a MATLAB/Simulink model of a single-phase grid-connected photovoltaic system. IEEE Trans. Energy Conv. 2009, 24, 195–202. [Google Scholar] [CrossRef]
  37. Chao, K.H.; Li, C.J.; Ho, S.H. Modeling and fault simulation of photovoltaic generation systems using circuit-based model. In Proceedings of the 2008 IEEE International Conference on Sustainable Energy Technologies, Singapore, 24–27 November 2008; pp. 290–294. [Google Scholar]
  38. Tharwat, A.; Elhoseny, M.; Hassanien, A.E.; Gabel, T.; Kumar, A. Intelligent Bézier curve-based path planning model using Chaotic Particle Swarm Optimization algorithm. Clust. Comput. 2019, 22, 4745–4766. [Google Scholar] [CrossRef]
  39. Liu, Q.; Wang, K. Research on civil aviation universal service standard based on tessellation model and particle swarm optimization. Int. J. Adv. Manuf. Technol. 2020, 106, 3381–3388. [Google Scholar] [CrossRef]
  40. Wang, X. The way of estimation and evaluation methods for loss of power transmission and transformation in the energy assessment process. Energy Energy Conserv. 2013, 2013, 79–80. [Google Scholar]
  41. Guo, Z. Research on Optimal Scheduling of Microgrid Considering Efficiency of Energy Conservation and Emission Reduction. Ph.D. Thesis, Shandong University of Technology, Zibo, China, 2017. [Google Scholar]
Figure 1. Equivalent microgrid topology.
Sustainability 14 09839 g001
Figure 2. Load of Baiyangdian Region in different conditions.
Sustainability 14 09839 g002
Figure 3. New energy power generation output.
Sustainability 14 09839 g003
Figure 4. The equivalent circuit of a single solar cells.
Sustainability 14 09839 g004
Figure 5. Improved PSO algorithm flow chart.
Sustainability 14 09839 g005
Figure 6. Layer structure diagram of microgrid costs.
Sustainability 14 09839 g006
Figure 7. Power prices in different times of the whole day.
Sustainability 14 09839 g007
Figure 8. Power dispatching under different mode in microgrid without pandemic (a) mode 1; (b) mode 2; (c) mode 3; (d) mode 4; (e) mode 5.
Sustainability 14 09839 g008
Figure 9. Power dispatching under different mode in microgrid (a) mode 1; (b) mode 2; (c) mode 3; (d) mode 4; (e) mode 5.
Sustainability 14 09839 g009
Figure 10. Power dispatching comparison without pandemic respectively for (a) wind generation; (b) photovoltaic generation; (c) exchanged power from primary grid; (d) battery discharging.
Sustainability 14 09839 g010
Figure 11. Power dispatching comparison respectively for (a) wind generation; (b) photovoltaic generation; (c) exchanged power from primary grid; (d) battery discharging.
Sustainability 14 09839 g011
Figure 12. Nodes distribution in microgrid.
Sustainability 14 09839 g012
Figure 13. Voltage profiles in microgrid under different modes (a) mode 3 (b) mode 4.
Sustainability 14 09839 g013
Table 1. Corresponding relationship between period serial number and time.
The Serial NumberTime Serial NumberCorresponding Period of Time
10–240:00~6:00
225–406:00~10:00
341–6010:00~15:00
461–7215:00~18:00
573–8418:00~21:00
685–9621:00~24:00
Table 2. Comparison among five modes.
ModeDescription
Use of BatteryUse of New Energy GenerationExchange between Microgrid and Primary Grid
mode 1nomandatoryno
mode 2nofreeno
mode 3yesmandatoryno
mode 4yesfreeno
mode 5yesfreeyes
Table 3. Total cost and average price in different modes and different pandemic conditions.
ModeWithout PandemicWith Pandemic
Total Cost (105 RMB)Change RatioAverage Price (RMB/kWh)Change RatioTotal Cost (105 RMB)Change RatioAverage Price (RMB/kWh)Change Ratio
mode 18.58/0.78/4.81/0.820.00%
mode 28.016.64%0.6911.54%3.9418.01%0.7212.20%
mode 38.392.21%0.727.69%4.1513.72%0.758.54%
mode 47.6810.49%0.6023.08%3.6124.95%0.6323.17%
mode 57.818.97%0.6516.67%3.7921.21%0.6520.73%
Publisher’s Note: MDPI stays neutral with regard to jurisdictional claims in published maps and institutional affiliations.

