Article

Estimation of Critical Nitrogen Concentration Based on Leaf Dry Matter in Drip Irrigation Spring Maize Production in Northern China

School of Agriculture, Ningxia University, Yinchuan 750021, China
*
Author to whom correspondence should be addressed.
Sustainability 2022, 14(16), 9838; https://doi.org/10.3390/su14169838
Submission received: 23 June 2022 / Revised: 21 July 2022 / Accepted: 6 August 2022 / Published: 9 August 2022

Abstract

:
The application of nitrogen (N) fertilizer not only increases crop yield but also improves the N utilization efficiency. The critical N concentration (Nc) can be used to diagnose crops’ N nutritional status. The Nc dilution curve model of maize was calibrated with leaf dry matter (LDM) as the indicator, and the performance of the model for diagnosing maize N nutritional status was further evaluated. Three field experiments were carried out in two sites between 2018 and 2020 in Ningxia Hui Autonomous Region with a series of N levels (application of N from 0 to 450 kg N ha−1). Two spring maize cultivars, i.e., Tianci19 (TC19) and Ningdan19 (ND19), were utilized in the field experiment. The results showed that a negative power function relationship existed between LDM and leaf N concentration (LNC) for spring maize under drip irrigation. The Nc dilution curve equation was divided into two parts: when the LDM < 1.11 t ha−1, the constant leaf Nc value was 3.25%; and when LDM > 1.11 t ha−1, the Nc curve was 3.33LDM−0.24. The LDM-based Nc curve can well distinguish data on the N-limiting and non-N-limiting N status of maize, which was independent of maize varieties, growing seasons, and stages. Additionally, the N nutrition index (NNI) had a significant linear correlation with the relative leaf dry matter (RLDM). This study revealed that the LDM-based Nc dilution curve could accurately identify spring maize N status under drip irrigation. NNI can thus, be used as a robust and reliable tool to diagnose the N nutritional status of maize.

1. Introduction

Nitrogen (N) is a key element for maintaining crop growth [1]. Under N deficiency, an increase in N application can dramatically stimulate the growth of crops and maintain a good grain yield [2]. However, the applied N in the soil cannot be fully absorbed by the crop, and consequently, about 60% of the N fertilizer is lost through ammonia volatilization, nitrification, denitrification, leaching, and runoff [3]. The N utilization efficiency has become an important factor restricting the sustainable development of agricultural production since N utilization efficiency is generally low as a result of excessive N application for maintaining high grain yield [4,5]. The major challenge is how to achieve optimum water-fertilizer management and obtain a continuous increase in crop production and efficiency in intensive planting [6,7]. At different growth stages of crops, optimizing its N application rate is especially helpful to further improve crop yield and quality [8,9]. Therefore, rapidly and accurately characterizing plant N status becomes particularly important.
Diagnosis of N nutrition in crops mainly includes the measurement of chlorophyll using a chlorophyll meter [10], spectral diagnosis [11], remote sensors [12], and image processing [13]. One of the common disadvantages of these methods is that there are large variations in the results obtained, especially under luxury absorption [14,15]. Greenwood et al. (1991) [15] summarized the characteristics of crop growth and N absorption and proposed the concept of critical N concentration (Nc), which is the minimum N required for maximum crop growth. Nc has received significant attention from numerous researchers related to reliable N diagnosis with sufficient accuracy, and it can be used as an index to evaluate the crop N nutritional status of crops. The Nc dilution curve is a crop diagnostic approach based on the allometry between the dynamics of N uptake and dry matter accumulation in crops. Plant dry matter (PDM)-based Nc dilution curves have been successfully constructed and applied in rice [14,16,17], wheat [18,19], and other crops [20]. However, some previous reports show that Nc dilution curves may vary with environmental conditions, crops, and varieties [21,22]. Therefore, a robust Nc dilution curve is especially important for diagnosing N requirements during the growth of specific crops.
Maize (Zea mays L.) is one of the most important crops in the world, which is widely cultivated in tropical to temperate climatic zones [23]. Growth and yield of maize are significantly affected by the application of fertilizers, especially for N. Previous studies have reported calibrated Nc curves model for maize in different regions using plant dry matter (PDM) [21,24]. Leaves are the main tissues and organs of maize, while the Nc dilution curves model is also varied with tissues and organs [25]. Leaves are extremely sensitive to N nutritional status. For instance, when N was applied within a certain dosage, the leaf dry matter (LDM) and PDM were similar, and N of maize generally increased with increased N application. However, when N was applied above a certain dosage, the N concentration continued to increase, but LDM actually decreased [22]. With maize growth, the dry matter accumulation in leaves increases, but the leaves’ N concentration (LNC) decreases [22]. Therefore, LNC can be used as an important agronomic index for evaluating the status of crop growth. For instance, LDM based Nc curve has been successfully established and applied in several main crops, such as rice [26,27] and winter wheat [28]. Based on the LDM-derived Nc dilution curves, various diagnostic tools have been established for the assessment of the N status of crops for the purpose of improving N management practices [26,29]. However, the LDM-based Nc curve model in maize has not been calibrated under the condition of integrated drip irrigation and fertilizer. Therefore, this study aimed (1) to calibrate and validate the LDM-based Nc dilution curve in maize, (2) to compare the validated model with other crops’ Nc curve models and to evaluate its reliability in spring maize, and (3) to offer a novel method for precisely managing N fertilizer application in spring maize cultivated under drip irrigation conditions. Collectively, the Nc dilution curve model for spring maize established a rapid diagnostic method for N status, which further developed the N fertilizer topdressing model for the supply of N fertilizer at different growth stages under N deficiency conditions.

2. Materials and Methods

2.1. Field Experiment Design

Three experiments were carried out in two experimental sites, Pingjibu (38°25′ N, 106°1′ E) and Yongning (38°13′ N, 106°14′ E) in 2018, 2019, and 2020 in Ningxia Hui Autonomous Region of China. In this region, the annual cumulative total temperatures above 10 °C range from 2800 to 3600 °C day, and the annual total precipitation range from 200 to 300 mm per year, of which about 60% occurs between July and September [23]. The spring maize cultivars were, Tianci19 (TC19) and Ningdan19 (ND19). Six N fertilizer (urea) application rates included 0 (N0), 90 (N1), 180 (N2), 270 (N3), 360 (N4), and 450 kg ha−1 (N5). A randomized complete block design with three replicates was used in the experimental plots. Each plot (15 m × 4.5 m) had eight rows of spring maize, with 40–70 cm row spacing and 20 cm distance between each hill within each row, following typical mechanically planted and harvested spring maize fields in the region. The plant density reached 90,000 plants ha−1. The spring maize was sown by mechanical seeding at a soil depth of about 5 cm in late April and harvested from mid to late September in two experiment sites, where maize is planted one season per year. The basic soil properties are shown in Table 1, including sowing and harvesting date information.
The integrated technology of water and fertilizer was adopted in field experiments. The total irrigation amount applied during the maize growing season in each plot was 400 mm water via drip irrigation, mainly including 20 mm at the seedling, 100 mm at jointing-bell, 140 mm tasseling-silk, and 140 mm at the filling stage, respectively. Urea dissolved in drip irrigation was applied as N fertilizer, with 10% of the N applied at seedling, 45% applied at jointing-bell, 20% applied at tasseling-silk, and 25% applied at filling stage, and 138 kg potassium dihydrogen (P2O5 ha−1) and 120 kg potassium sulfate (K2O ha−1) were applied as the phosphorus and potassium fertilizer for each plot. The other remaining management (i.e., irrigation times and fertilizer application times) practices were the same as those used by local farmers.

2.2. Sampling and Measurement

Three spring maize plants with uniform growth were randomly selected from each plot at the fourth leaf collar (V4), the sixth leaf collar (V6), the tenth leaf collar (V10), the twelfth leaf collar (V12), tasseling stage (VT), and silking stage (R1). The plants were separated into stems and leaves. Plant tissues were oven-dried at 105 °C for 30 min and then at 80 °C until reaching a constant weight. All sampled leaves were weighted to calculate the LDM and stored in hermetic bags for the downstream chemical analysis. The leaf N content was measured by using the micro-Kjeldahl method [31].

2.3. Critical Nitrogen Dilution Curve

The critical nitrogen dilution (Nc) was calculated following the method reported by Justes et al. [32]. A typical power-law function was adopted to regress the correlation between Nc and LDM. The two-year data (i.e., experiments 1 and 2) were used to calibrate the Nc model for the two spring maize cultivars. The calibrated curve model was further validated by an independent dataset from experiment 3. Nc was derived from the equation described by Plénet and Lemaire [33]:
Nc = a LDM−b
where Nc means the Nc concentration (%), LDM represents the leaf dry matter (t ha−1), a indicates the Nc concentration when LDM equals to 1 t ha−1, while b is the statistical parameter controlling the slope of the curve, representing the ratio of the relative dry matter accumulation rate to the relative N content accumulation rate.

2.4. Nitrogen Nutrition Index

The N nutrition index (NNI) was derived from the equation reported by Plénet and Lemaire [33]:
NNI = LNC/Nc
NNI = 1, >1, and <1 mean plant N nutritional status is optimal, excessive, and deficient, respectively.

2.5. Relative LDM

Relative LDM (RLDM) was calculated by dividing the LDM at each growth stage by the maximum LDM in the whole growing season. The following equation was used:
RLDMi = LDMi/LDMmax (0 < RLDMi < 1)
where RLDMi is the relative leaf dry matter within growth stage i, LDMi is the measured leaf dry matter within growth stage i (t ha−1), and LDMmax is the maximum dry matter of maize leaves in the whole growing season (t ha−1) [27,34].

2.6. Statistical Analysis

ANOVA was used to analyze the significant difference between LDM and LNC in different nitrogen fertilizer application rates. Means were determined using the least significant difference at the p < 0.05 level, and analytical data were classified into the N-limiting and non-N-limiting group. The non-linear relationship between NNI and RLDM was fitted using Origin 2018 (Origin Lab Corporation, Northampton, MA, USA).

3. Results

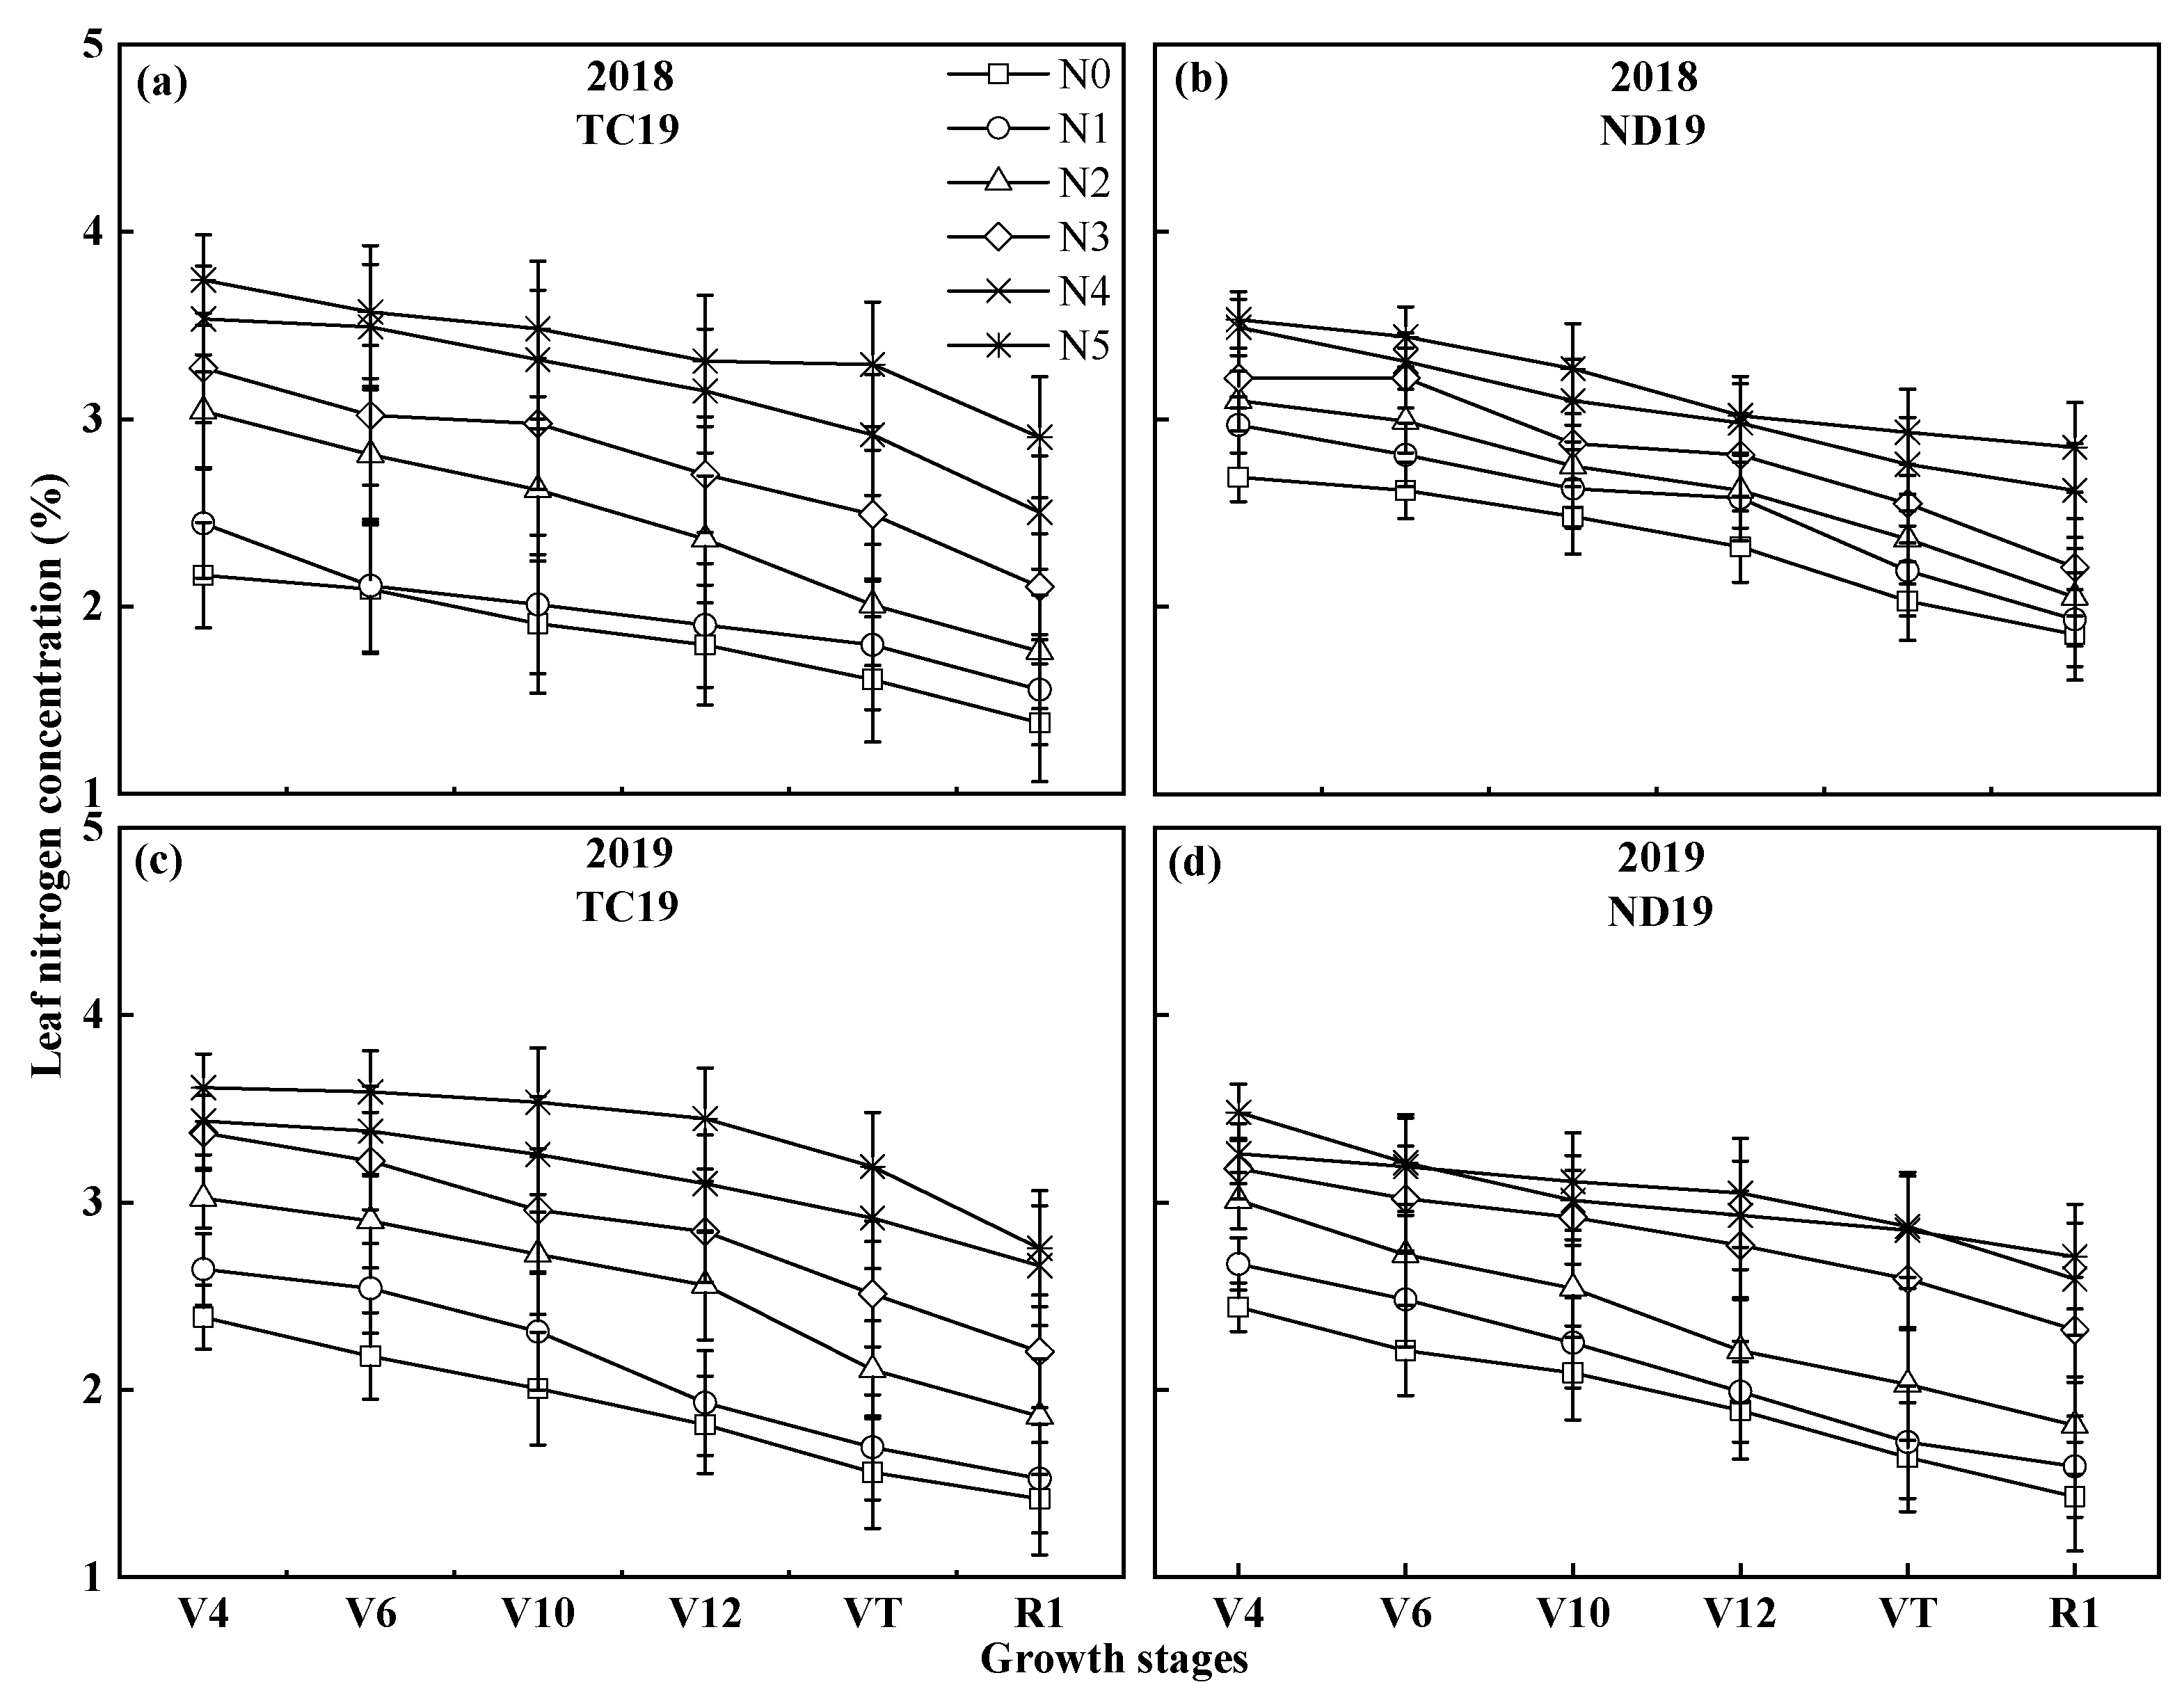
3.1. The Dynamic Change in the Status of Both Spring Maize Cultivar’s LDM and LNC

The leaf dry matter (LDM) of both spring maize cultivars increased as the growth stage increased in all the six N fertilizer application rates. The increase followed an S-shaped pattern (See Figure 1). The LDM of TC19 and ND19 ranged from 0.32 t ha−1 (N0) at the fourth leaf collar stages (V4) to 4.06 (N5) t ha−1 at the silking stages (R1) (See Figure 1a) and 0.23 t ha−1 (N0) at the V4 stages to 3.73 (N5) t ha−1 at R1 stages (See Figure 1b) in 2018, and from 0.39 t ha−1 (N0) at the V4 stages to 4.30 (N5) t ha−1 at R1 stages (See Figure 1c) and 0.34 t ha−1 (N0) at the V4 stages to 3.97 (N5) t ha−1 at R1 stages (See Figure 1d) in 2019, respectively. Significant differences in LDM were observed from N0 to N3 rates in both 2018 and 2019. However, no significant differences in LDM of both maize cultivars were observed between N4 and N5 rates.
The leaves’ nitrogen content (LNC) of both spring maize cultivars also increased as the growth stage increased in all the six N fertilizer application rates. In general, for all the crop growth stages, a decrease in LNC was accompanied by an increase in LDM (See Figure 2). The LNC of TC19 and ND19 ranged from 1.38% (N0) at V4 stages to 3.74% and 1.85% (N0) at V4 stages to 3.53% (N5) at R1 stages in 2018 (See Figure 2a,b), and from 1.42% (N0) at V4 stages to 3.61% (N5) at R1 stages and 1.43% (N0) at V4 stages to 3.48% (N5) at R1 stages in 2019 (See Figure 2c,d), respectively. The LNC of the same cultivar had a similar variation tendency.

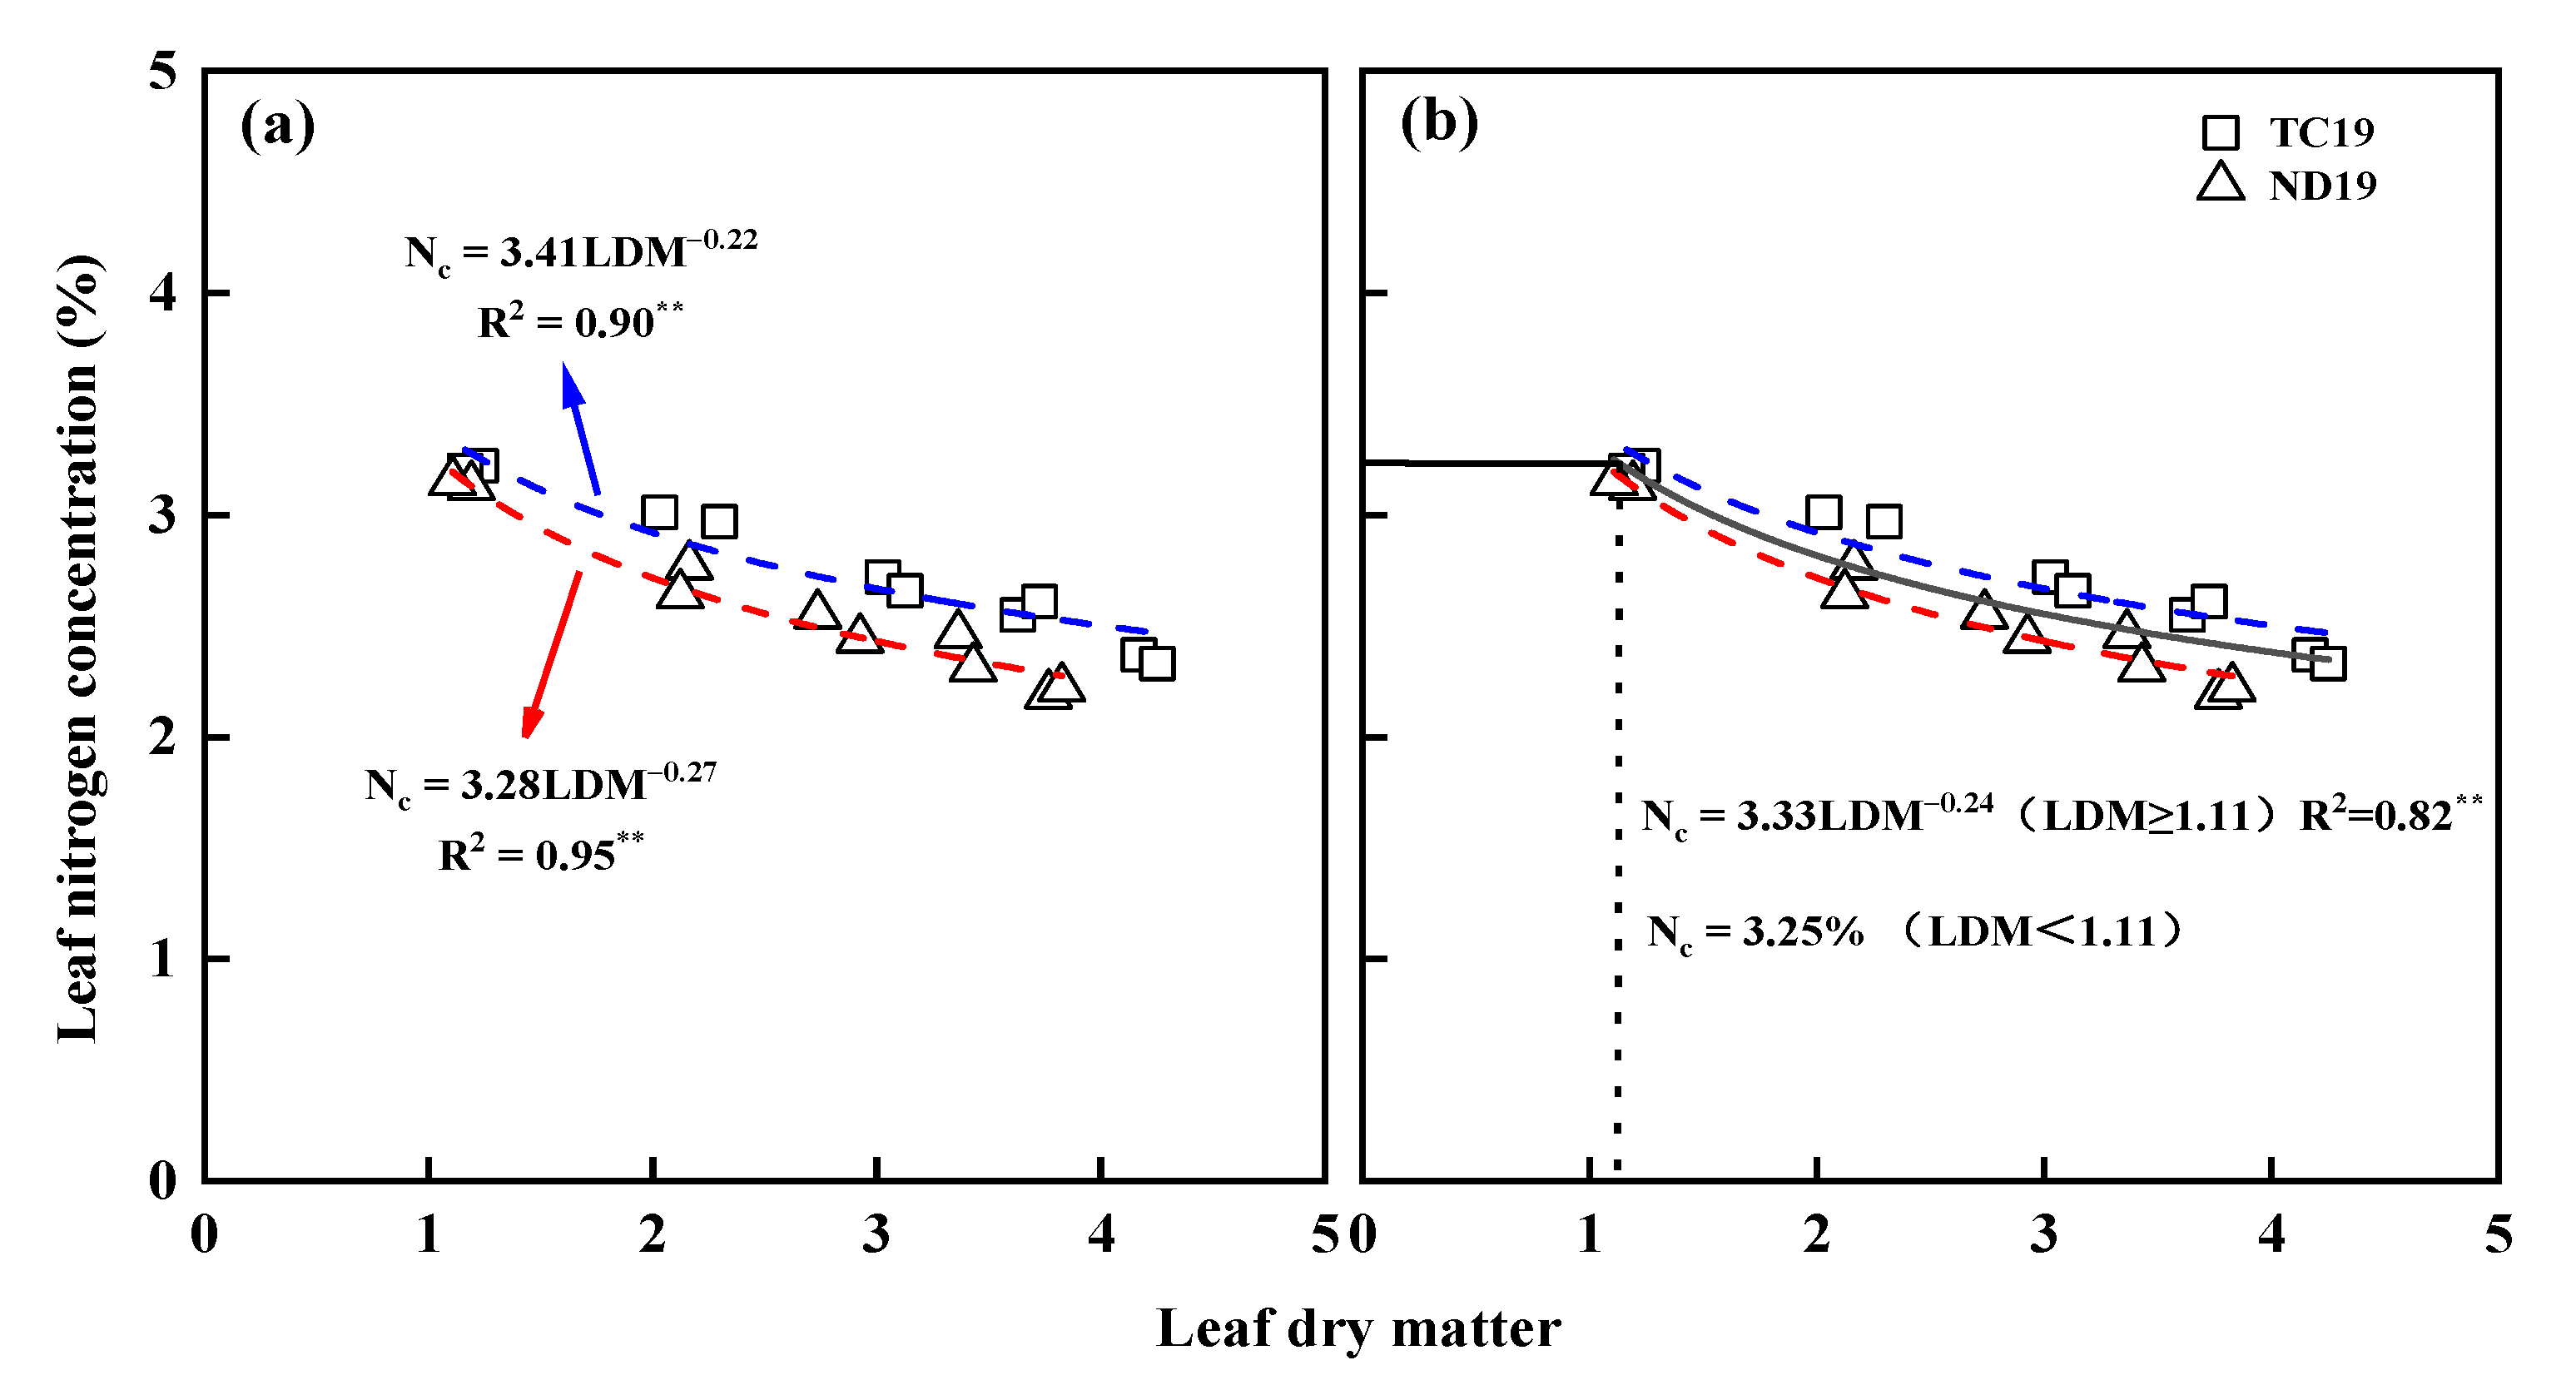
3.2. Calibration of Nc Curves

The Nc values were calculated from V6 to R1 for the two spring cultivars (TC19 and ND19) using experimental data 1 and 2 between 2018 and 2019. The Nc dilution curves for the two spring cultivars (TC19 and ND19) were calibrated using twenty data points (LDM range from 1.11 to 4.25 t ha−1) during the vegetative growth stages of spring maize (See Figure 3a). The Nc values decreased with an increase in LDM. The coefficients of equations determination of TC19 and ND19 cultivars were 0.90 and 0.95 (p < 0.01), respectively (Figure 3a).
TC19: Nc = 3.41LDM−0.22
ND19: Nc = 3.28 LDM−0.27
The coefficients of the two Nc curves for TC19 and ND19 (See Figure 3a) were analyzed based on the method described by Mead and Curnow [35]. We did not observe a significant difference (tslope = 0.548 < t (0.05, 20) = 2.086, and tintercept = 0.435 < t (0.05, 20) = 2.086) at the 95% confidence level. Therefore, the Nc curves of the two spring cultivars were combined and fitted to obtain the unified Nc curve of maize under drip-irrigated (See Figure 3b). However, we could not obtain a robust Nc curve in the early growth stages (V4) of spring maize since LNC does not change significantly with the increase in the low LDM. There is no obvious competition between plants’ utilization of water, fertilizer, light, and other resources. When LDM increases, the LNC does not be significantly reduced. The low LDM data were acquired in the early growth stage of maize when the plants were very small. In this study, the Nc curves were not applied to the early growth of maize. Instead, a minimum LNC value (3.31%) was defined for the non-N-limiting group, while a maximum LNC value (3.19%) for the N-limiting groups. The LNC value of 3.25% was defined as the constant leaf Nc value for the early growth stage of maize (See Figure 3b) when LDM < 1.11 t ha−1 (See Figure 3b). Therefore, the Nc curve can be described as follows:
{ N c = 3 . 33 LDM - 0 . 24   LDM 1 . 11 N c = 3 . 25 %                               LDM < 1 . 11

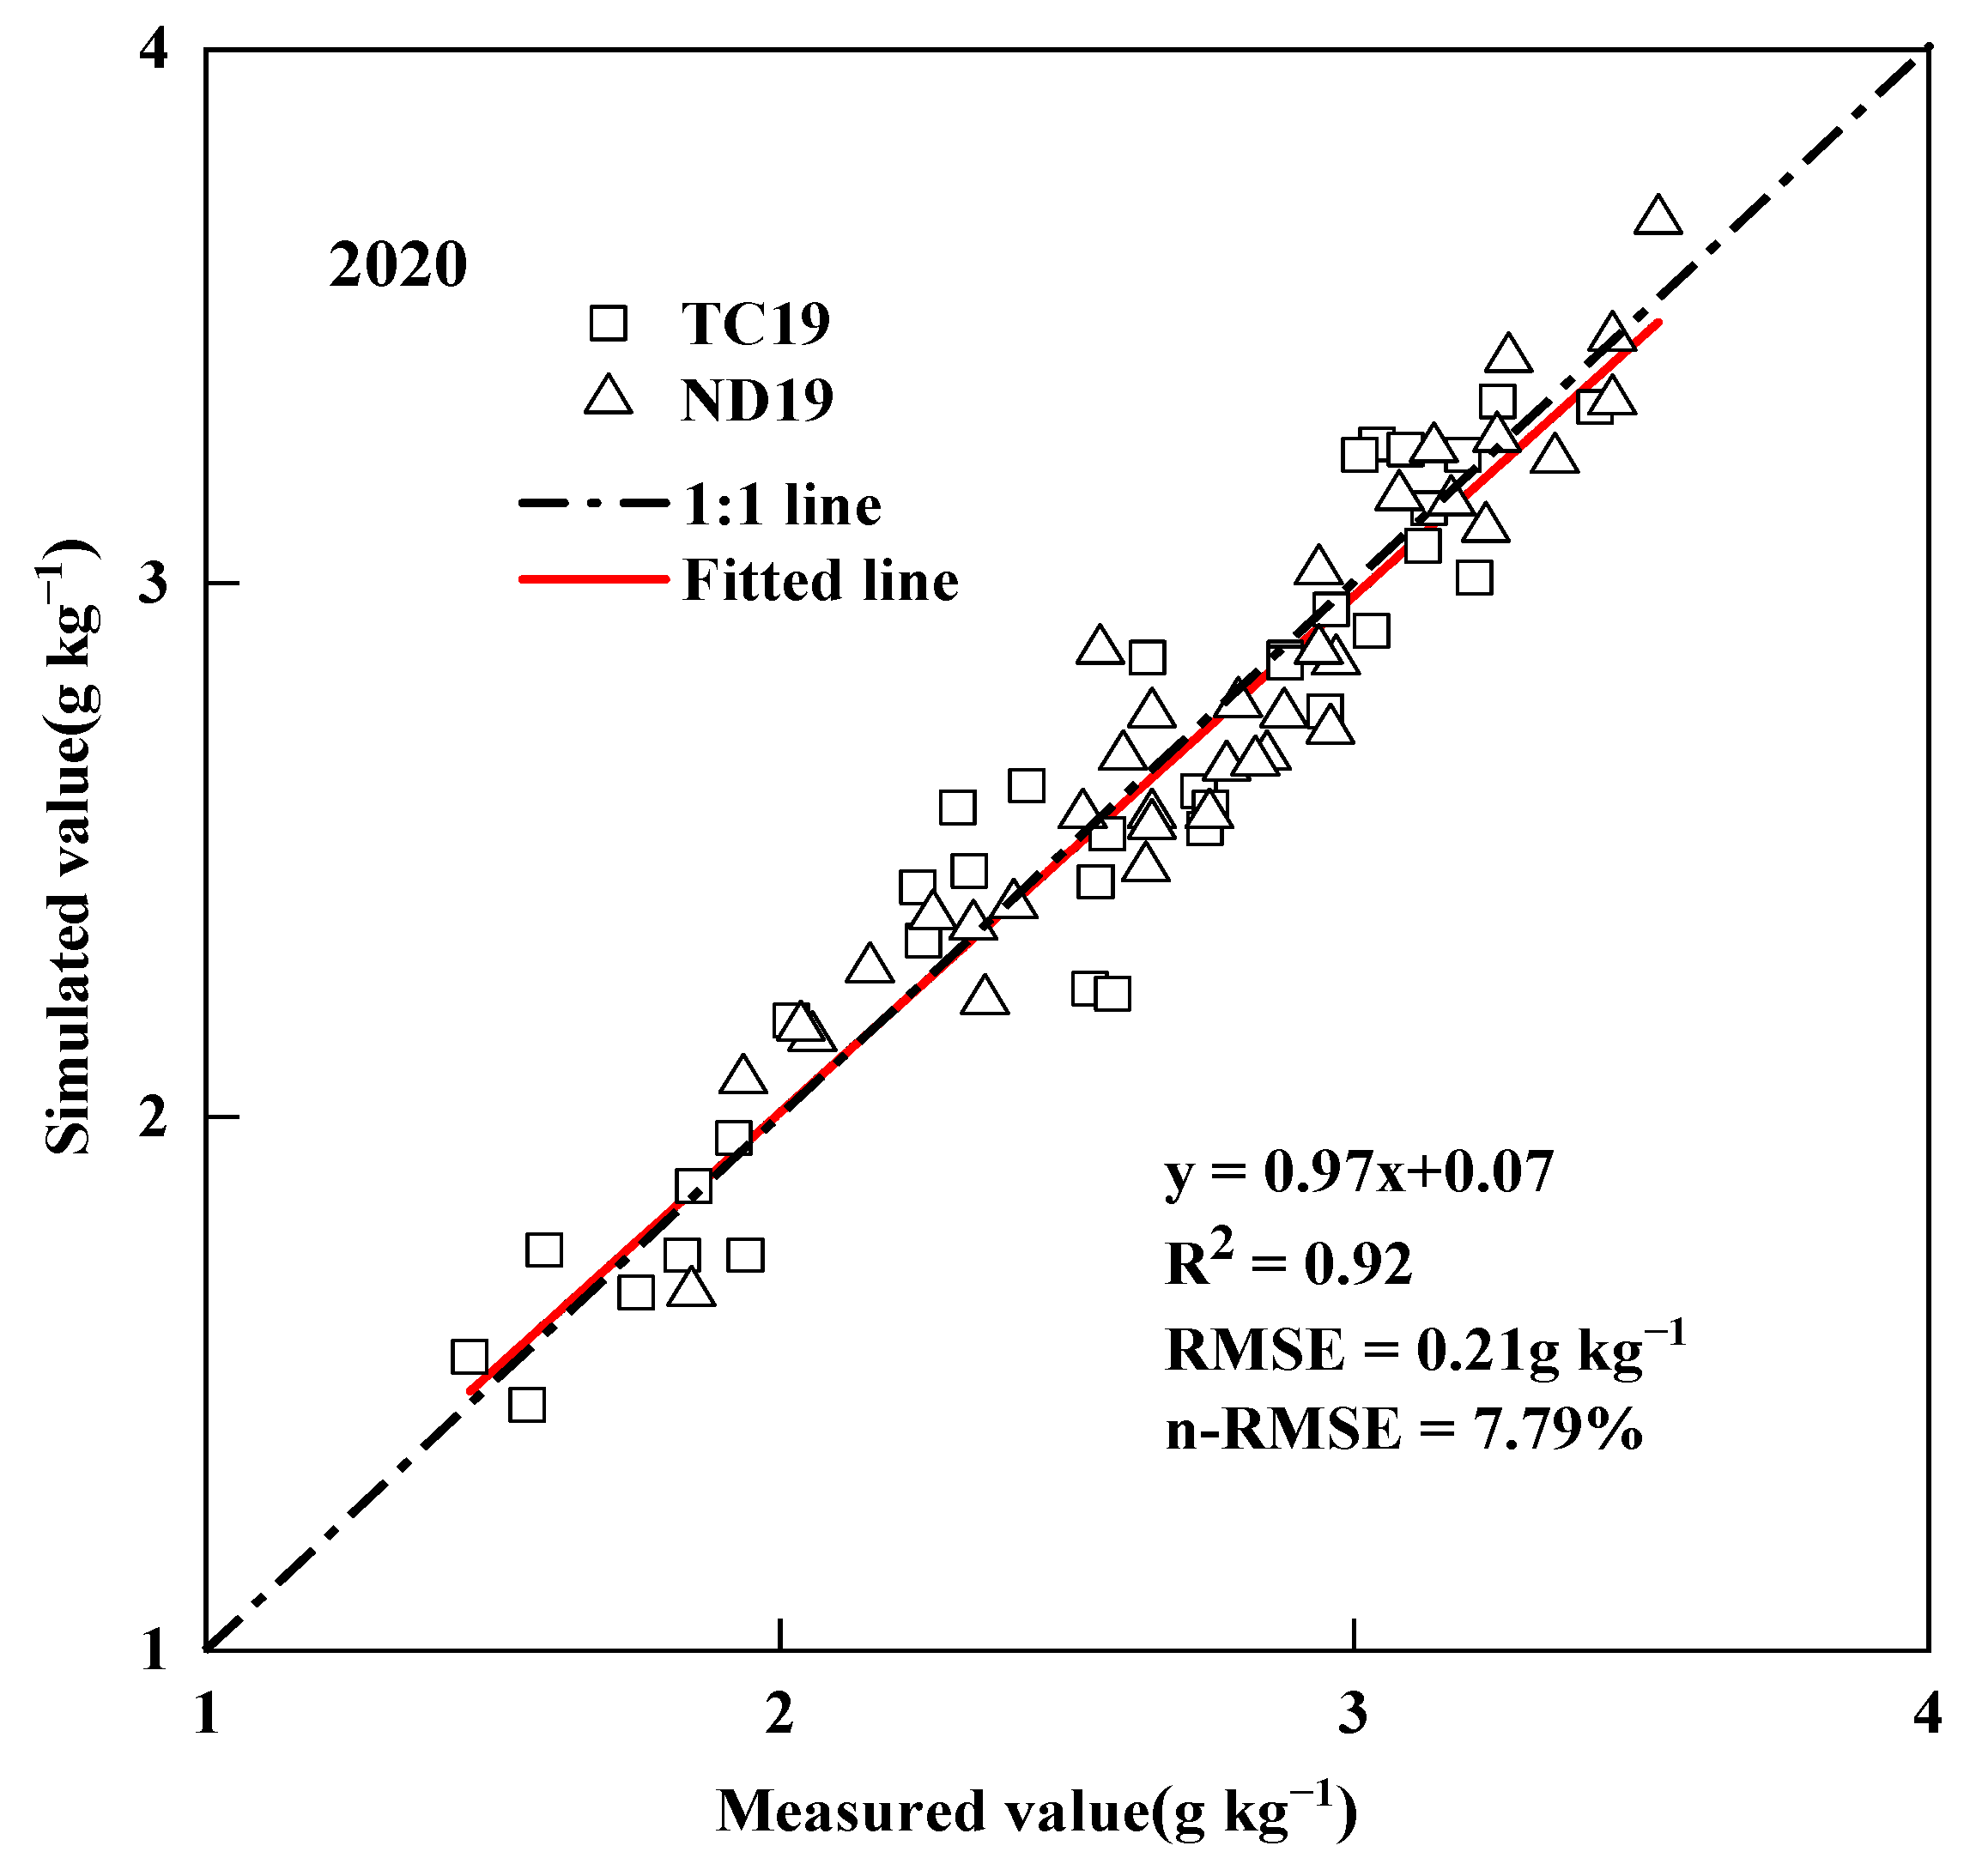
3.3. Validation of the Nc Curve

The LDM-based Nc model was validated using data from a one-year independent experiment 3 in two spring maize cultivars (TC19 and ND19) in 2020 (n = 72) (See Figure 4). The results showed that the non-N-limiting and N-limiting group data were located above and below the Nc curve, respectively. The Nc curve effectively distinguished the N-limiting from the non-N-limiting groups in the independent experimental data and was not affected by the growing seasons, growth stages, and cultivars. Therefore, the calibrated LDM-based Nc curve in this study can be applied for evaluating and diagnosing the N nutritional status of spring maize.

3.4. Changes of NNI Values under Various N Levels

There was substantial variation in NNI between different N levels, cultivars growing seasons, and stages (See Figure 5). NNI increased with an increase in N application. NNI values of TC19 and ND19 ranged from 0.61 (N0) to 1.45 (N5) and from 0.60 (N0) to 1.32 (N5), respectively (Figure 5a,b) in 2018, and from 0.55 (N0) to 1.29 (N5) and from 0.62 (N0) to 1.37 (N5) (See Figure 5c,d) in 2019, respectively. Furthermore, the NNI values were N0, N1, and N2 rates less than 1.0 in 2018 and 2019, which indicated that LNC was low and that the N fertilizer application rates were insufficient. However, the NNI values in N4 and N5 rates in 2018 and 2019 were greater than 1.0, which indicated that LNC was high and that the N fertilizer rates were excessively applied. NNI values in the N3 rate were around 1.0, which indicated the N application dose of 270 kg ha−1 not only ensured the accumulation of LDM but also prevented N extravagant absorption. Therefore, this is a cost-effective method to get NNI value in N diagnosis and management compared with the traditional destructive and laboratory analysis methods.

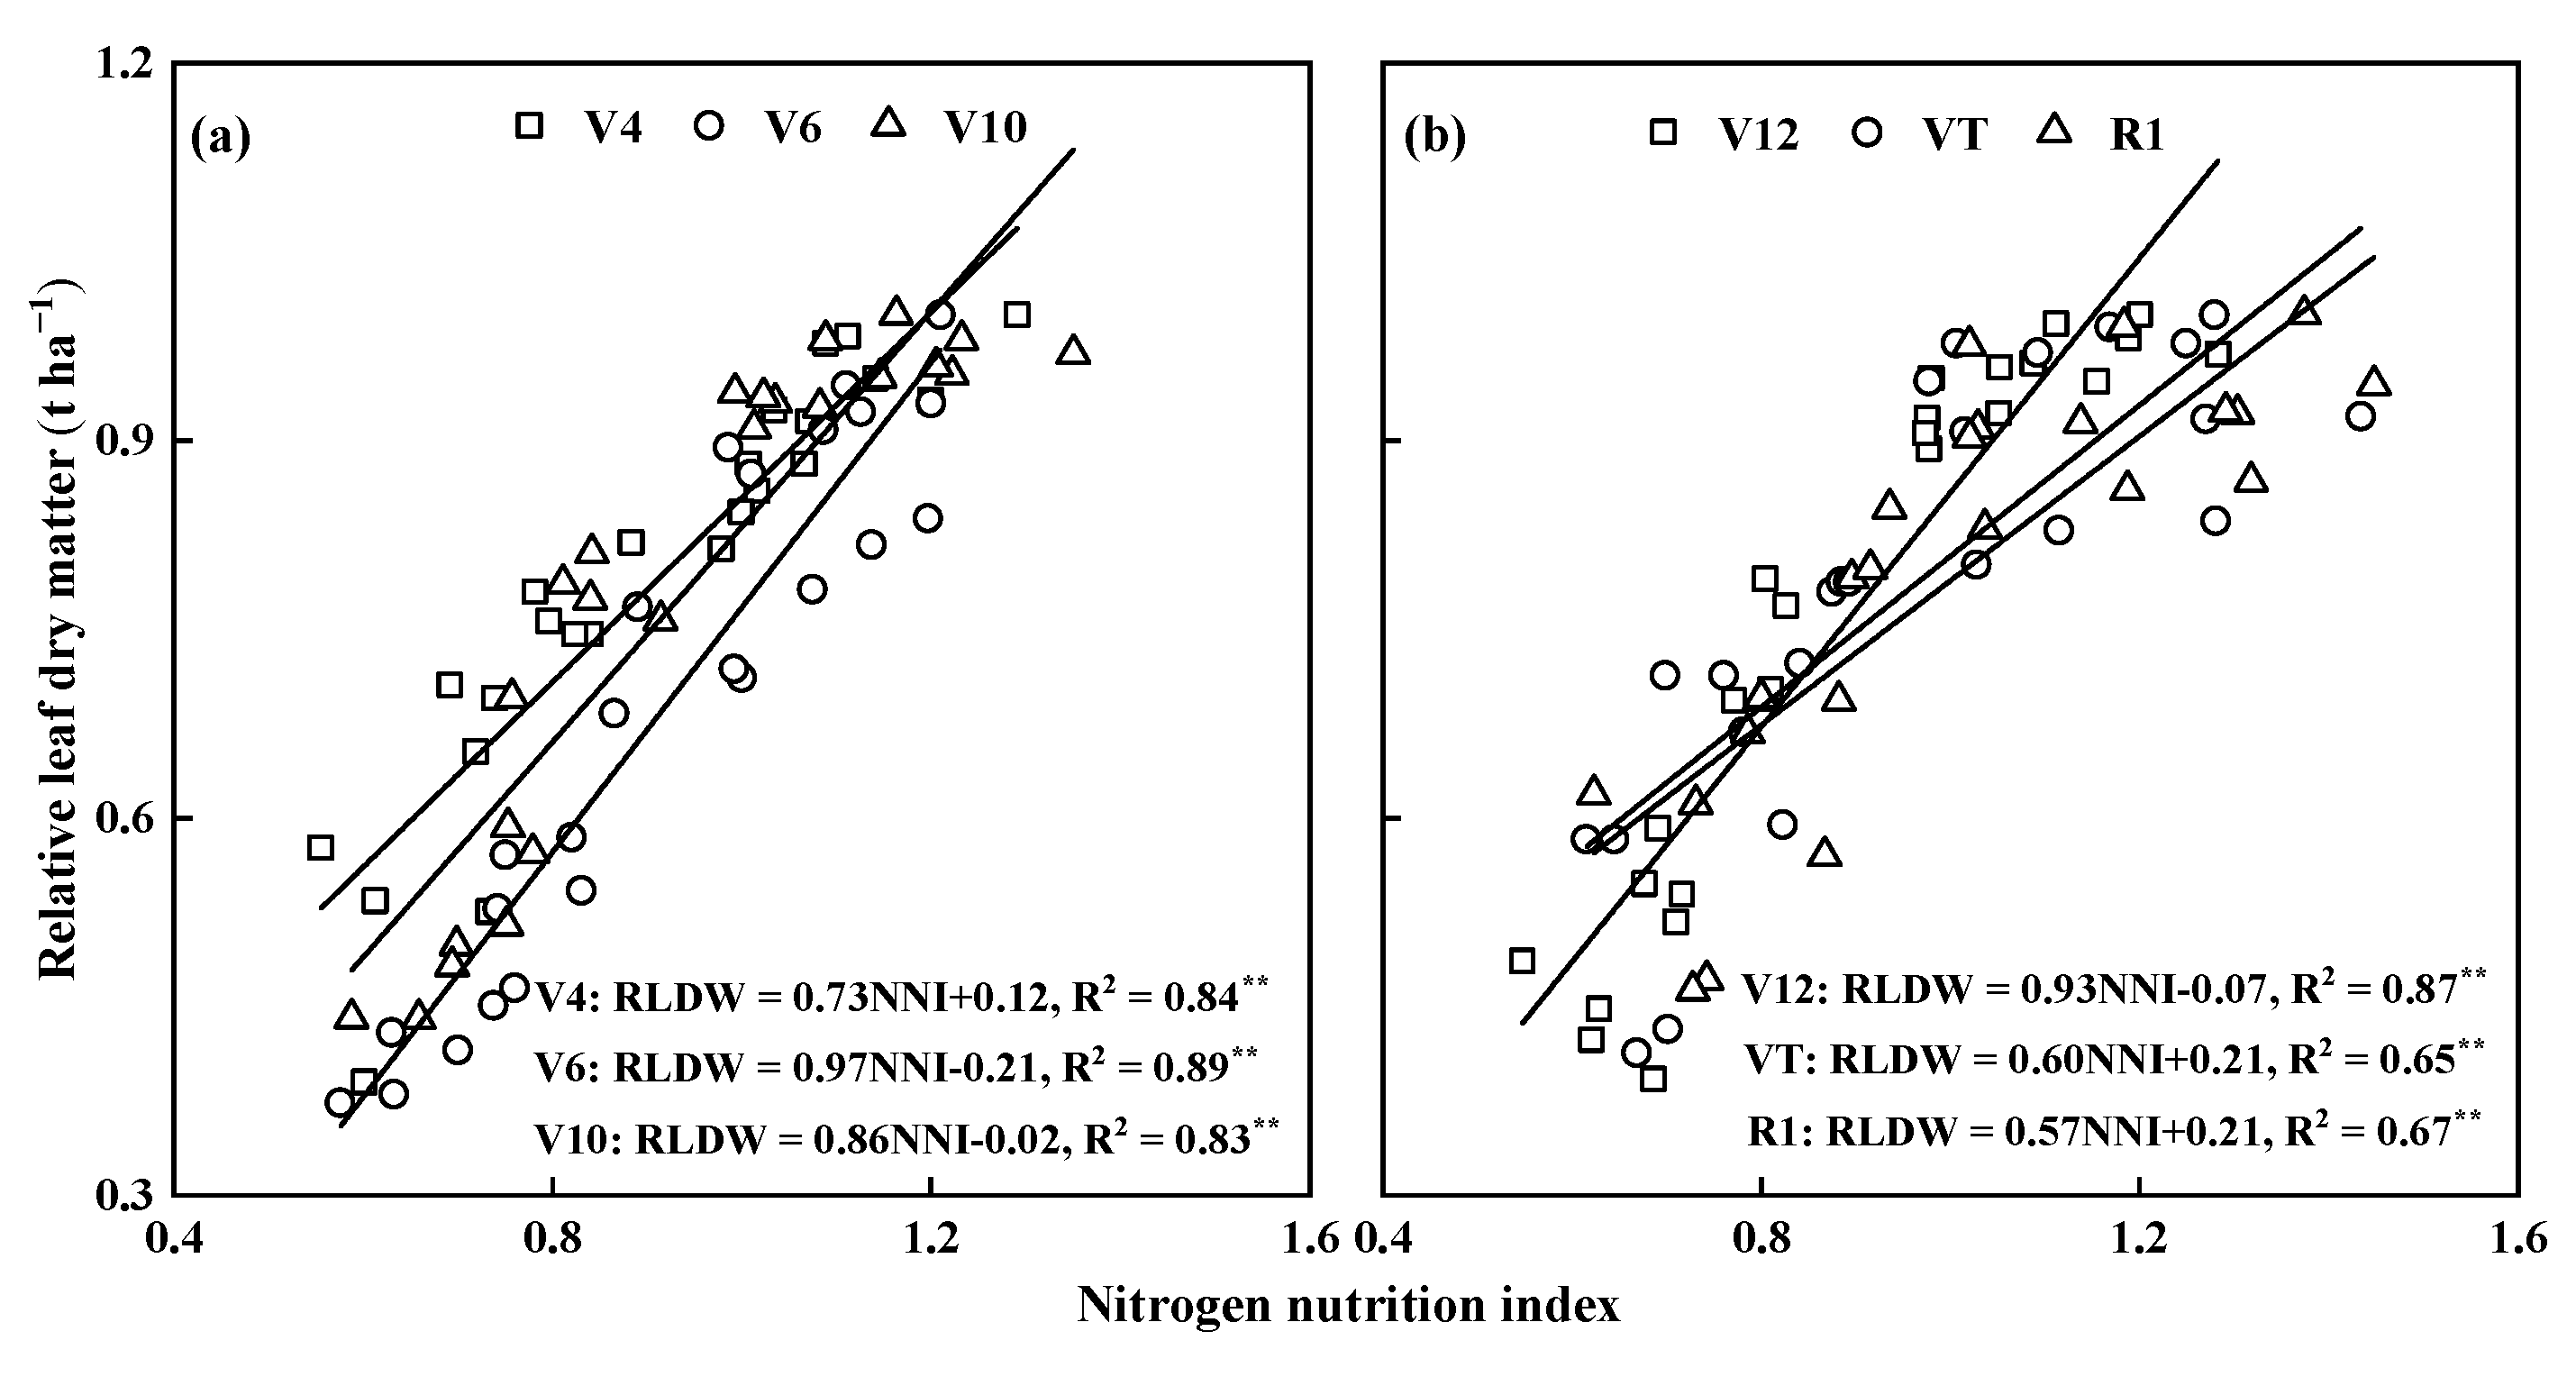
3.5. Relationships between NNI and RLDM

The correlation between NNI and RLDM was studied with data from experiments 1 and 2, obtained in 2018 and 2019. NNI and RLDM showed a significant linear correlation at different growth stages, and RLDM increased with an increase in NNI (See Figure 6). The coefficients of determination from V4 to R1 were 0.84, 0.89, 0.83, 0.87, 0.65, and 0.67, respectively.

4. Discussion

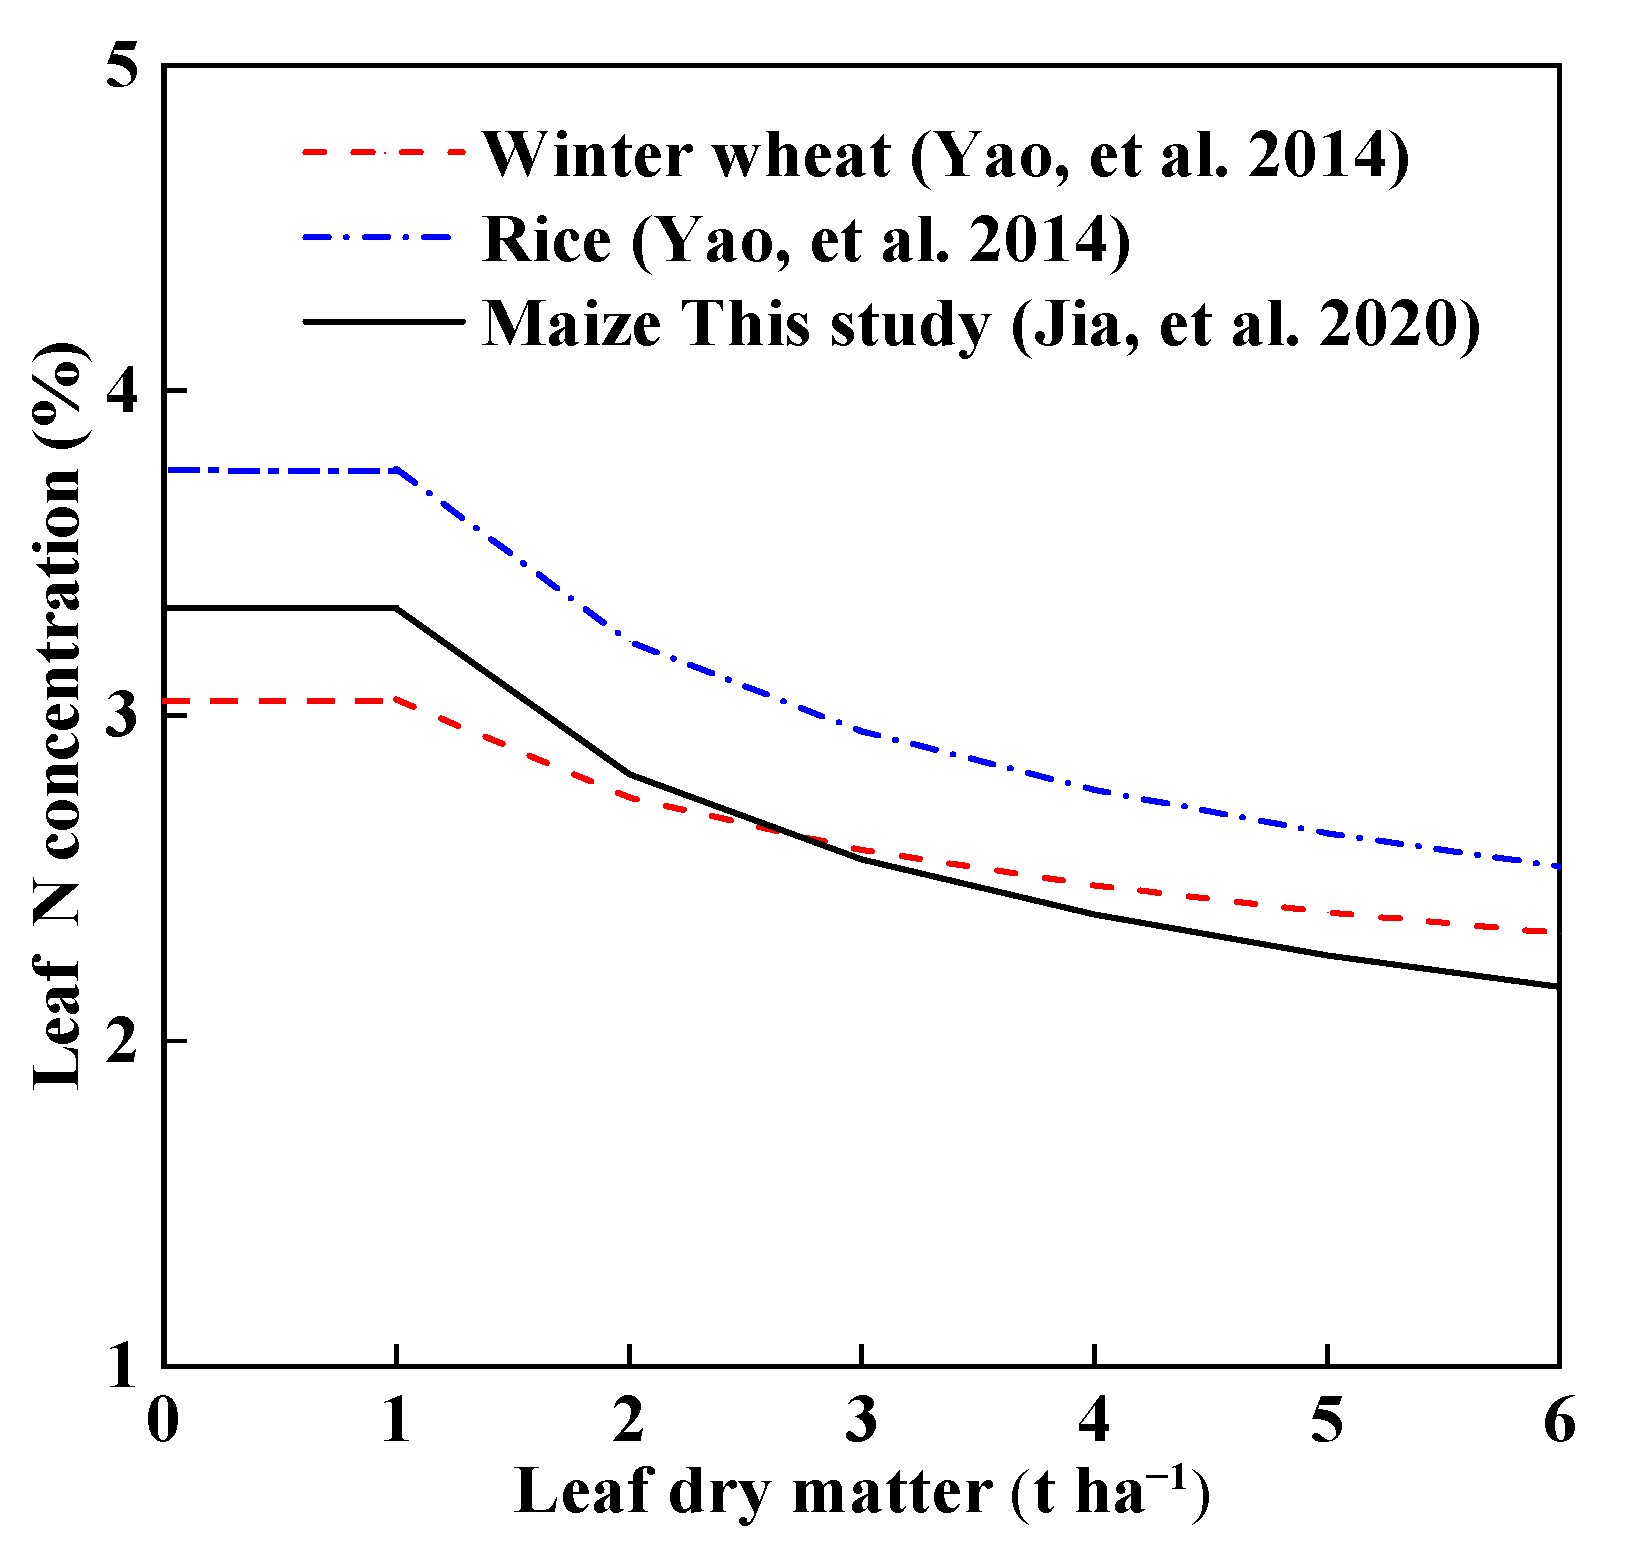
4.1. Critical Nitrogen Dilution Curves Compared with Other Crops

Precise estimation of crops’ N nutritional status is essential for improving their N utilization efficiency. The Nc has been broadly utilized for diagnosing crops’ N nutritional status [36]. In the present study, the Nc value in the vegetative growth stage of spring maize gradually decreased with increased LDM (See Figure 3a), and this is consistent with that reported in rice (either the whole plant or the specific organ) [7,8,10,14,16,17,26], wheat [5,11,13,19,22,28,32,34] and cotton [37]. The Nc curve consisted of two parts: when LDM < 1.11 t ha−1, the Nc value was defined as 3.25%, and when LDM ≥ 1.11 t ha−1, the Nc curve was defined as 3.33LDM−0.24 (See Figure 3b). Due to the few individual plants and minimal dry matter accumulation in leaves before the early growth stages (V4) of spring maize, there was no obvious competition for water, fertilizer, light, and other resources. The increase in LDM did not significantly reduce LNC. Therefore, the leaf Nc value was relatively stable in the early growth stage of spring maize. After the jointing stage (V6), leaf area index and leaf number increased, stalk growth occurred due to the phenomenon of shading, and this led to N dilution [23,38,39].
From a mathematical view, the parameter a equals the value of LNC when LDM is 1.0 t ha−1, which represents the inherent N demand characteristics of the spring maize at the early growth stage. Parameter b indicates the LNC value with the change of LDM, whose value is determined by the proportional ratio between leaf N absorption and dry matter. In the present study, the value of parameter b (0.24) was less than that of the Nc dilution curve based on PDM for maize [5,22,38,39] (See Figure 3b). Low parameter b means that the leaf N dilution process is slow. The differences in PDM and LDM curves were mainly reflected in the calibrated model. Based on the Nc curve determined by LDM, the leaves were regarded as the central locations of crop growth. The N absorbed by the crop met the leaf growth, photosynthesis, and respiration needs and led to a slow decline in LNC [40,41]. For PDM based Nc curve, the stem N concentration was lower than that of leaf during the vegetative growth stages, while the dilution rate was lower than that of the stem [21,22], which was related to the leaf being the main organ of photosynthesis, and requires a certain N concentration to ensure efficient photosynthesis and yield formation [42,43]. Additionally, the Nc dilution curve b value of spring maize leaves under drip irrigation was higher than the reported Nc dilution curve b value of winter wheat and rice leaves (0.15, 0.22) [28,32,34] (See Figure 7). The b value of the Nc curve varies with crop types.

4.2. Application and Feasibility Analysis of LNC Based Nc Curve

The main purpose of calibrating the Nc dilution curve was to assess the N nutritional status of maize through agronomic research methods in this study. This scientific N application technology can reduce the cost of production and anthropogenic N pollution [44,45]. The Nc curve provides an alternative to assess the N nutritional status in the growth stage of maize under drip irrigation. Previous studies indicate that only the LDM and LNC of the maize can reflect its N nutritional status using the Nc curve. For example, when LNC values were on the Nc curve, which indicated that the N application rate was optimum, LNC values ranged between the lower limit curve (Nmin) [27,34] and Nc, indicating a deficiency in the N application rate. LNC values were between Nc and the upper limit curve (Nmax) [27,34], which indicated that excessive N was applied. The calibrated Nc curve can be used to distinguish the N deficiency from the surplus states of crops, and the Crop-Syst model [6,36,37,38,46] is used to calculate the N demand with the assistance of the Nc curve [47].
NNI can serve as an ideal indicator to diagnose the N nutritional status of crops [10,24,29,48,49,50]. In this study, the NNI values of leaves in the two spring maize cultivars ranged between 0.55 and 1.45 under different N rates (See Figure 5). The NNI value per N rate was lowest in V12, which increased with an increase in the N fertilizer application rate from V12 to the R1 stage. This was associated with the vigorous spring maize growth and development in V12 to R1 stage, the high absolute and relative quantities of nutrients required by maize, and the high absorption rate during this stage [5,22,23]. Secondly, the NNI was recovered in R1(See Figure 5), which was linked to the N status of spring maize converting from vegetative growth to reproductive growth stage, and the demand for N fertilizer was not as urgent as that in V12 (See Figure 5). This indicates that the N status of spring maize can be affected by the amount of N fertilizer application at different fertilization periods, which NNI can confirm, and this was in line with the results of a few previous studies [10,24,29]. This conclusion could be adopted to obtain a quantitative NNI and to diagnose N deficiency in spring maize with sufficient efficiency and effectiveness. NNI values were changed dynamically during the growth stages in two spring maize cultivars (See Figure 6). Therefore, it could not be used an average value of certain stages to take the place of the NNI value of the whole period of spring maize. The present study found that there was a positive correlation between NNI and RLDM for two maize cultivars at various growth stages (from V4 to R1) in the 2018 and 2019 growing seasons (See Figure 6), especially for V6 stages (R2 = 0.89**) and V12 stages (R2 = 0.87**). Although there was a positive relationship between NNI and RLDM value, the efficient N fertilizer management strategy may need to assess not only maize yield but also soil residual N, soil type, and annual climatic conditions [5,22,23,38,39,46,48].
The Nc dilution curves of crops are calibrated under different N rates in most studies, and other conditions are found to be relatively suitable. However, crops are subjected to stress caused by different factors in real agricultural production. For example, severe drought stress severely affected the final yield of spring wheat during the growth stages in Northern China [51]. Previous studies show that Nc dilution curves and NNI values of crops under drought stress are lower than normal [24,37,48,50,52]. This can be associated with the lack of water, which limits plant growth and causes a reduction in dry matter, thus causing a decrease in N accumulation. Additionally, because water content has a close relationship with the N availability, water deficiency reduces the bio-available N in soils, thus causing a decrease in the soil N supply capacity [6,38,53,54,55]. Therefore, the crop N deficiency was seen when NNI was lower than 1.0, and topdressing with N was needed. Besides water, the interaction between other elements such as phosphorus and potassium with N also affected the N status of crops [37,56]. Therefore, clarifying the factors affecting the Nc dilution curve of crops under different conditions is of great significance for its application and the use of NNI in accurately diagnosing crops’ N nutritional status.

5. Conclusions

The Nc dilution model was calibrated for two spring maize cultivars with different N application rates in Northern China, and the Nc dilution curve equation used is Nc = 3.25%, when LDM < 1.11 t ha−1, and Nc = 3.33 LDM−0.24 when LDM ≥ 1.11 t ha−1. The calibrated Nc curve effectively distinguishes the N-limiting from the non-N-limiting groups based on LDM, and the curve is not independent of the cultivars, growing seasons, and stages. The Nc dilution curve specific to spring maize could therefore be used to diagnose the N nutrition status. Further, the resulting NNI is utilized to assess the N nutritional state of maize plants. NNI of N3 fertilizer application (270 kg ha−1) is considered to be closest to 1.0, the LDMmax can be obtained with the N3 application rate, and NNI is significantly positively correlated with RLDM. Therefore, the N3 application may be used as the reference for the N application for spring maize under drip irrigation in Northwest China. The results are expected to provide a theoretical basis for accurate management of N fertilizer application in spring maize production and the validation of future crop models on larger simulation scales.

Author Contributions

Conceptualization, B.J.; Formal analysis, J.F., Z.L. and H.L.; Funding acquisition, B.J.; Investigation, Y.L., X.W., Y.Z., B.Y., J.M. and H.Z.; Methodology, B.J. and J.F.; Supervision, B.J. and J.F.; Writing—original draft, B.J. and J.F.; Writing—review and editing, B.J. and J.F. All authors have read and agreed to the published version of the manuscript.

Funding

The financial support of the Natural Science Foundation of Ningxia (2021AAC03025) is acknowledged.

Institutional Review Board Statement

Not applicable.

Informed Consent Statement

Not applicable.

Data Availability Statement

Not applicable.

Conflicts of Interest

The authors declare no conflict of interest.

Abbreviations

N, nitrogen; Nc, critical N concentration; PDM, plant dry matter; LDM, leaf dry matter; LNC, Leaf N concentration; TC19, Tianci19; ND19, Ningdan19; NNI, N nutrition index; RLDM, relative leaf dry matter; LDMmax, the maximum dry matter of maize leaves in the whole growing seasons; Nmin, the lower limit curve; Nmax, the upper limit curve.

References

  1. El-Sorady, G.A.; El-Banna, A.A.A.; Abdelghany, A.M.; Salama, E.A.A.; Ali, H.M.; Siddiqui, M.H.; Hayatu, N.G.; Paszt, L.S.; Lamlom, S.F. Response of bread wheat cultivars inoculated with azotobacter species under different nitrogen application rates. Sustainability 2022, 14, 8394. [Google Scholar] [CrossRef]
  2. Pan, J.; Meng, Q.; Chen, R.; Cui, Z.; Chen, X. In-season nitrogen management to increase grain yields in maize production. Agron. J. 2017, 109, 2063–3071. [Google Scholar] [CrossRef]
  3. Zaman, M.; Blennerhassett, J.D. Effects of the different rates of urease and nitrification inhibitors on gaseous emissions of ammonia and nitrous oxide, nitrate leaching and pasture production from urine patches in an intensive grazed pasture system. Agric. Ecosyst. Environ. 2010, 136, 236–246. [Google Scholar] [CrossRef]
  4. Ata-Ul-Karim, S.T.; Zhu, Y.; Liu, X.; Cao, Q.; Tian, Y.; Cao, W. Comparison of different critical nitrogen dilution curves for nitrogen diagnosis in rice. Sci. Rep. 2017, 7, 42679. [Google Scholar] [CrossRef] [Green Version]
  5. Ciampitti, I.A.; Makowski, D.; Fernandez, J.; Lacasa, J.; Lemaire, G. Does water availability affect the critical N dilution curves in crops? A case study for maize, wheat, and tall fescue crops. Field Crop Res. 2021, 273, 108301. [Google Scholar] [CrossRef]
  6. Yoon, C.G.; Kwun, S.K.; Ham, J.H. Effects of treated sewage irrigation on paddy rice culture and its soil. Irrig. Drain. 2001, 50, 227–236. [Google Scholar] [CrossRef]
  7. Zhou, W.; Yang, Z.; Wang, T.; Fu, Y.; Chen, Y.; Hu, B.; Yamagishi, J.; Ren, W. Environmental compensation effect and synergistic mechanism of optimized nitrogen management increasing nitrogen use efficiency in Indica hybrid rice. Front. Plant Sci. 2019, 10, 0245. [Google Scholar] [CrossRef]
  8. Ata-Ul-Karim, S.T.; Liu, X.; Lu, Z.; Zheng, H.; Cao, W.; Zhu, Y. Estimation of nitrogen fertilizer requirement for rice crop using critical nitrogen dilution curve. Field Crop Res. 2017, 201, 32–40. [Google Scholar] [CrossRef]
  9. Miao, Y.; Stewart, B.A.; Zhang, F. Long-term experiments for sustainable nutrient management in China. A review. Agron. Sustain. Dev. 2011, 31, 397–414. [Google Scholar] [CrossRef] [Green Version]
  10. Zhang, K.; Yuan, Z.F.; Yang, T.C.; Lu, L.L.; Cao, Q.; Tian, Y.C.; Zhu, Y.; Cao, W.X.; Liu, X.J. Chlorophyll meter–based nitrogen fertilizer optimization algorithm and nitrogen nutrition index for in-season fertilization of paddy rice. Agron. J. 2020, 112, 288–300. [Google Scholar] [CrossRef]
  11. Grohs, D.S.; Bredemeier, C.; Mundstock, C.M.; Poletto, N. Model for yield potential estimation in wheat and barley using the GreenSeeker sensor. Exp. Agr. 2009, 29, 101–112. [Google Scholar]
  12. Schlemmer, M.; Gitelson, A.; Schepers, J.; Ferguson, R.; Peng, Y.; Shanahan, J.; Rundquist, D. Remote estimation of nitrogen and chlorophyll contents in maize at leaf and canopy levels. Int. J. Appl. Earth Obs. 2013, 25, 47–54. [Google Scholar] [CrossRef] [Green Version]
  13. Elsayed, S.; Barmeier, G.; Schmidhalter, U. Passive reflectance sensing and digital image analysis allows for assessing the biomass and nitrogen status of wheat in early and late tillering stages. Front. Plant Sci. 2018, 9, 1478. [Google Scholar] [CrossRef] [PubMed]
  14. Ata-Ul-Karim, S.T.; Yao, X.; Liu, X.; Cao, W.; Zhu, Y. Development of critical nitrogen dilution curve of japonica rice in Yangtze river reaches. Field Crop Res. 2013, 149, 149–158. [Google Scholar] [CrossRef]
  15. Greenwood, D.J.; Gastal, F.; Lemaire, G.; Draycott, A.; Millard, P.; Neeteson, J.J. Growth rate and % N of field grown crops: Theory and experiments. Ann. Bot. 1991, 67, 181–190. [Google Scholar] [CrossRef]
  16. He, Z.; Qiu, X.; Ata-Ul-Karim, S.T.; Li, Y.; Liu, X.; Cao, Q.; Zhu, Y.; Cao, W.; Tang, L. Development of a critical nitrogen dilution curve of double cropping rice in South China. Front. Plant Sci. 2017, 8, 0638. [Google Scholar] [CrossRef] [Green Version]
  17. Huang, S.Y.; Miao, Y.X.; Cao, Q.; Yao, Y.K.; Zhao, G.M.; Yu, W.F.; Shen, J.N.; Yu, K.; Georg, B. A new critical nitrogen dilution curve for rice nitrogen status diagnosis in Northeast China. Pedosphere 2018, 28, 814–822. [Google Scholar] [CrossRef]
  18. Yin, M.H.; Li, Y.N.; Xu, L.Q.; Shen, S.L.; Fang, H. Nutrition diagnosis for nitrogen in winter wheat based on critical nitrogen dilution curves. Crop Sci. 2018, 58, 416–420. [Google Scholar] [CrossRef]
  19. Ziadi, N.; Belanger, G.; Claessens, A.; Lefebvre, L.; Cambouris, A.N.; Tremblay, N.; Nolin, N.C.; Parent, L. Determination of a critical nitrogen dilution curve for spring wheat. Agron. J. 2010, 102, 241–250. [Google Scholar] [CrossRef]
  20. Giletto, C.M.; Echeverría, H.E. Critical nitrogen dilution curve for processing potato in Argentinean Humid Pampas. Am. J. Potato Res. 2012, 89, 102–110. [Google Scholar] [CrossRef]
  21. Yue, S.C.; Sun, F.; Meng, Q.F.; Zhao, R.F.; Li, F.; Chen, X.P.; Zhang, F.S.; Cui, Z.L. Validation of a critical nitrogen curve for summer maize in the North China plain. Pedosphere 2014, 24, 76–83. [Google Scholar] [CrossRef]
  22. Zhao, B.; Niu, X.; Ata-Ul-Karim, S.T.; Wang, L.; Duan, A.; Liu, Z.; Lemaire, G. Determination of the post-anthesis nitrogen status using ear critical nitrogen dilution curve and its implications for nitrogen management in maize and wheat. Eur. J. Agron. 2020, 113, 125967. [Google Scholar] [CrossRef]
  23. Liu, W.; Ming, B.; Xie, R.; Liu, G.; Wang, K.; Yang, Y.; Guo, X.; Hou, P.; Li, S. Change in maize final leaf numbers and its effects on biomass and grain yield across China. Agric. 2020, 10, 411. [Google Scholar] [CrossRef]
  24. Liang, X.; Zhang, Z.; Zhou, L.; Shen, S.; Gao, Z.; Zhang, L.; Lin, S.; Pan, Y.; Zhou, S. Localization of maize critical N curve and estimation of NNI by Chlorophyll. Int. J. Plant Prod. 2018, 12, 85–94. [Google Scholar] [CrossRef]
  25. Kage, H.; Alt, C.; Stützel, H. Nitrogen concentration of cauliflower organs as determined by organ size, N supply, and radiation environment. Plant Soil. 2002, 246, 201–209. [Google Scholar] [CrossRef]
  26. Yao, X.; Ata-Ul-Karim, S.T.; Zhu, Y.; Tian, Y.; Liu, X.; Cao, W. Development of critical nitrogen dilution curve in rice based on leaf dry matter. Eur. J. Agro. 2014, 55, 20–28. [Google Scholar] [CrossRef]
  27. Song, L.; Wang, S.; Ye, W. Establishment and application of critical nitrogen dilution curve for rice based on leaf dry matter. Agron. 2020, 10, 367. [Google Scholar] [CrossRef] [Green Version]
  28. Yao, X.; Zhao, B.; Tian, Y.; Liu, X.; Ni, J.; Cao, W.; Zhu, Y. Using leaf dry matter to quantify the critical nitrogen dilution curve for winter wheat cultivated in Eastern China. Field Crops Res. 2014, 159, 33–42. [Google Scholar] [CrossRef]
  29. Li, X.; Ata-UI-Karim, S.T.; Li, Y.; Yuan, F.; Miao, Y.; Yoichiro, K.; Cheng, T.; Tang, L.; Tian, X.; Liu, X.; et al. Advances in the estimations and applications of critical nitrogen dilution curve and nitrogen nutrition index of major cereal crops. A review. Comput. Electron. Agron. 2022, 197, 106998. [Google Scholar] [CrossRef]
  30. Dalal, R.C.; Sahrawat, K.L.; Myers, R.J.K. Inclusion of nitrate and nitrite in the Kjeldahl nitrogen determination of soils and plant materials using sodium thiosulphate. Commun. Soil Sci. Plant Anal. 1984, 15, 1453–1461. [Google Scholar] [CrossRef] [Green Version]
  31. Nelsonand, D.W.; Sommers, L.E.A. Simple digestion procedure for estimation of total nitrogen in soils and sediments. J. Environ. Qual. 1972, 1, 423–425. [Google Scholar] [CrossRef]
  32. Justes, E.; Mary, B.; Meynard, J.M.; Machet, J.M.; Thelier-Huche, L. Determination of a critical nitrogen dilution curve for winter wheat crops. Ann. Bot. 1994, 74, 397–407. [Google Scholar] [CrossRef]
  33. Plenet, D.U.D.A.; Lemaire, G. Relationships between dynamics of nitrogen uptake and dry matter accumulation in maize crops. Determination of critical N concentration. Plant Soil. 1999, 216, 65–82. [Google Scholar] [CrossRef]
  34. Guo, B.; Zhao, X.; Meng, Y.; Liu, M.; Duan, J.; He, L.; Jiao, N.; Feng, W.; Zhu, Y. Establishment of critical nitrogen concentration models in winter wheat under different irrigation levels. Agronomy 2020, 10, 556. [Google Scholar] [CrossRef]
  35. Mead, R.; Curnow, R.N. Statistical Methods in Agriculture and Experimental Biology; Mead, G., Ed.; Champan and Hall: London, UK, 1983; pp. 157–163. [Google Scholar]
  36. Rahimikhoob, H.; Sohrabi, T.; Delshad, M. Simulating crop response to nitrogen-deficiency stress using the critical nitrogen concentration concept and the AquaCrop semi-quantitative approach. Sci. Hortic. 2021, 285, 110194. [Google Scholar] [CrossRef]
  37. Feng, W.; Li, X.; Dong, H.; Qin, Y.; Sun, M.; Shao, J.; Zheng, C.; Li, P. Fruits-based critical nitrogen dilution curve for diagnosing nitrogen status in cotton. Front. Plant Sci. 2022, 13, 801968. [Google Scholar] [CrossRef]
  38. Zhou, L.; Feng, H.; Zhao, W. Plastic film mulching affects the critical nitrogen dilution curve of drip-irrigated maize. Field Crop Res. 2021, 263, 108055. [Google Scholar] [CrossRef]
  39. Du, L.; Li, Q.; Li, L.; Wu, Y.; Zhou, F.; Liu, B.; Zhao, B.; Li, X.; Liu, Q.; Kong, F.; et al. Construction of a critical nitrogen dilution curve for maize in Southwest China. Sci. Rep. 2020, 10, 13084. [Google Scholar] [CrossRef]
  40. Fernandez, J.A.; van Versendaal, E.; Lacasa, J.; Makowski, D.; Lemaire, G.; Ciampitti, I.A. Dataset characteristics for the determination of critical nitrogen dilution curves: From past to new guidelines. Eur. J. Agron. 2022, 139, 126568. [Google Scholar] [CrossRef]
  41. Chowdhury, M.A.H.; Sultana, T.; Rahman, M.A.; Chowdhury, T.; Enyoh, C.E.; Saha, B.K.; Qingyue, W. Nitrogen use efficiency and critical leaf N concentration of Aloe vera in urea and diammonium phosphate amended soil. Heliyon 2020, 6, e5718. [Google Scholar] [CrossRef]
  42. Zhao, B.; Ata-Ul-Karim, S.T.; Duan, A.; Liu, Z.; Wang, X.; Xiao, J.; Liu, Z.; Qin, A.; Ning, D.; Zhang, W.; et al. Determination of critical nitrogen concentration and dilution curve based on leaf area index for summer maize. Field Crop Res. 2018, 228, 195–203. [Google Scholar] [CrossRef]
  43. Zunfu, L.; Ruoyi, J.; Lijuan, D.; Weichen, H.; Ximing, X.; Yongxin, L.; Huqing, Y.; Guoquan, L. A model of plant and ear nitrogen for the diagnosis of nitrogen nutrition of malting barley to coordinate the relationship between grain yield and quality. Eur. J. Agron. 2022, 136, 126488. [Google Scholar] [CrossRef]
  44. Stoicea, P.; Chiurciu, I.; Soare, E.; Iorga, A.; Dinu, T.; Tudor, V.; Gîdea, M.; David, L. Impact of reducing fertilizers and pesticides on sunflower production in Romania versus EU countries. Sustainability 2022, 14, 8334. [Google Scholar] [CrossRef]
  45. Arash, R.; Ali, R.; Hamed, E.; Maryam, V. Determination of critical nitrogen dilution curve based on canopy cover data for summer maize. Commun. Soil Sci. Plant 2020, 51, 2244–2256. [Google Scholar]
  46. Araya, A.; Prasad, P.V.V.; Ciampitti, I.A.; Jha, P.K. Using crop simulation model to evaluate influence of water management practices and multiple cropping systems on crop yields: A case study for Ethiopian highlands. Field Crop Res. 2021, 260, 108004. [Google Scholar] [CrossRef]
  47. Ciampitti, I.; van Versendaal, E.; Rybecky, J.F.; Lacasa, J.; Fernandez, J.; Makowski, D.; Lemaire, G. A global dataset to parametrize critical nitrogen dilution curves for major crop species. Sci. Data 2022, 9, 277. [Google Scholar] [CrossRef]
  48. Soratto, R.P.; Sandaña, P.; Fernandes, F.M.; Fernandes, A.M.; Makowski, D.; Ciampitti, I.A. Establishing a critical nitrogen dilution curve for estimating nitrogen nutrition index of potato crop in tropical environments. Field Crop Res. 2022, 286, 108605. [Google Scholar] [CrossRef]
  49. Sieling, K.; Kage, H. Organ-specific critical N dilution curves and derived NNI relationships for winter wheat, winter oilseed rape and maize. Eur. J. Agron. 2021, 130, 126365. [Google Scholar] [CrossRef]
  50. Bohman, B.J.; Rosen, C.J.; Mulla, D.J. Relating nitrogen use efficiency to nitrogen nutrition index for evaluation of agronomic and environmental outcomes in potato. Field Crop Res. 2021, 262, 108041. [Google Scholar] [CrossRef]
  51. Ji, X.M.; Shiran, B.; Wan, J.L.; Lewis, D.C.; Jenkins, C.L.D.; Condon, A.G.; Richards, R.A.; Dolferus, R. Importance of pre-anthesis anther sink strength for maintenance of grain number during reproductive stage water stress in wheat. Plant Cell Environ. 2010, 33, 926–942. [Google Scholar] [CrossRef]
  52. Hoogmoed, M.; Neuhaus, A.; Noack, S.; Sadras, V.O. Benchmarking wheat yield against crop nitrogen status. Field Crops Res. 2018, 222, 153–163. [Google Scholar] [CrossRef]
  53. Kunrath, T.R.; Lemaire, G.; Sadras, V.O.; Gastal, F. Water use efficiency in perennial forage species: Interactions between nitrogen nutrition and water deficit. Field Crop Res. 2018, 222, 1–11. [Google Scholar] [CrossRef]
  54. Irmak, S.; Mohammed, A.T.; Kukal, M.S. Maize response to coupled irrigation and nitrogen fertilization under center pivot, subsurface drip and surface (furrow) irrigation: Growth, development and productivity. Agr. Water Manag. 2022, 263, 107457. [Google Scholar] [CrossRef]
  55. Xu, S.; Wei, Y.; Laghari, A.H.; Yang, X.; Wang, T. Modelling effect of different irrigation methods on spring maize yield, water and nitrogen use efficiencies in the North China Plain. Math. Biosci. Eng. 2021, 18, 9651–9668. [Google Scholar] [CrossRef]
  56. Duncan, E.G.; O’Sullivan, C.A.; Roper, M.M.; Palta, J.; Whisson, K.; Peoples, M.B. Yield and nitrogen use efficiency of wheat increased with root length and biomass due to nitrogen, phosphorus, and potassium interactions. J. Plant Nutr. Soil Sci. 2018, 181, 364–373. [Google Scholar] [CrossRef]
Figure 1. Changes in maize LDM at various growth stages under different nitrogen (N) fertilizer application dosages in two years of experimental data ((a) 2018 TC19, (b) 2019 TC19, (c) 2018 ND19, and (d) 2019 ND19). Bars in the same growing stages with different lowercase letters are significant among different N rates at the same spring maize cultivar at the level of p < 0.05. Vertical error bars represent standard error.
Sustainability 14 09838 g001
Figure 2. Changes in maize LNC at various growth stages under different N fertilizer application dosages in two years of experimental data ((a) 2018 TC19, (b) 2018 ND19, (c) 2019 TC19, and (d) 2019 ND19). Vertical error bars represent standard error.
Sustainability 14 09838 g002
Figure 3. The leaf Nc for two maize cultivars (TC19 and ND19) in 2018 and 2019. (a) The Nc dilution curves for two spring cultivars (TC19 and ND19) calibrated using twenty data points; (b) the curves of two spring cultivars combined and fitted to obtain the unified Nc curve of maize. ** indicates significant difference at p < 0.01. The blue dashed line represents Nc fitted line of maize cultivar TC19. The red dashed line represents Nc fitted line of maize cultivar ND19.
Sustainability 14 09838 g003
Figure 4. Validation of the established leaf Nc dilution curve. The data were collected from an independent experiment using two maize cultivars (TC19 and ND19), which was conducted in 2020.
Sustainability 14 09838 g004
Figure 5. Dynamic changes in the N nutrition index (NNI) for two varieties (TC19 and ND19) at various growth stages (from V4 to R1) under different N application dosages. ((a) 2018 TC19, (b) 2018 ND19, (c) 2019 TC19, and (d) 2019 ND19). Vertical error bars represent standard error.
Sustainability 14 09838 g005
Figure 6. The correlation between NNI with relative leaf dry matter (RLDM) for two maize cultivars (TC19 and ND19) at various growth stages (V4 to R1) during the 2018 and 2019 growing seasons. ((a) V4, V6, and V10 stages of maize; (b) V12, VT, and R1 stages of maize). ** indicates significant difference at p < 0.01.
Sustainability 14 09838 g006
Figure 7. Comparison of LDM-based Nc curves in different crops [26,28].
Sustainability 14 09838 g007
Table 1. Basic soil properties (0–60 cm soil depth).
ParameterUnitsExperiments
Experiment 1Experiment 2Experiment 3
Year 201820192020
Site PingjibuYongningPingjibuYongningPingjibuYongning
Cultivar TC19ND19TC19ND19TC19ND19
pH value 7.828.537.988.447.768.57
Organic matterg kg114.8310.5611.458.0712.8214.83
Total Ng kg10.920.960.80.980.750.92
Available Nmg kg137.8140.2337.4240.4736.8239.44
Available Pmg kg120.6318.9619.0418.3319.3720.63
Available Kmg kg1109.17108.92102.53106.25105.31111.25
Sowing date 20/424/426/422/428/420/4
Harvesting date 22/920/916/918/918/922/9
Notes: Measurement of Soil properties were carried out according to Dalal and Nelsonand et al. [30,31].
Publisher’s Note: MDPI stays neutral with regard to jurisdictional claims in published maps and institutional affiliations.

