Article

The Trend of Grassland Restoration and Its Driving Forces in Ningxia Hui Autonomous Region of China from 1988 to 2018

1
College of Pastoral Agriculture Science and Technology, Lanzhou University, Lanzhou 730000, China
2
College of Agriculture and Husbandry, Qinghai University, Xining 810000, China
*
Author to whom correspondence should be addressed.
Sustainability 2022, 14(16), 10404; https://doi.org/10.3390/su141610404
Submission received: 16 July 2022 / Revised: 14 August 2022 / Accepted: 15 August 2022 / Published: 21 August 2022

Abstract

:
Since the implementation of the grassland ecological protection policy of prohibition grazing on natural grasslands throughout the territory in 2003, the growth of grasslands in Ningxia has improved. This study investigated the spatial differentiation mechanism of normalized vegetation index (NDVI) in Ningxia grasslands from 1988 to 2018, analyzed the relative contributions of climate change (CC) and human activities (HA) to NDVI changes, and predicted the future trend of grassland changes. The results show that except in winter, the annual, seasonal and monthly average values of NDVI after grazing prohibition were higher than those before grazing prohibition. After grazing prohibition, the growth rate decreased by 17.91%, but the degradation rate increased by 3.92%. After grazing prohibition, the proportion of medium coverage increased by 16.15%, mainly in the path of “lower coverage grassland→medium coverage grassland”. The transformation trend was mainly positive, and the ecological construction project has achieved remarkable results. The main factors affecting NDVI differentiation in Ningxia grassland were snow depth, potential evapotranspiration, radiation, and precipitation. After grazing prohibition, the explanatory power of each factor and the interaction between the factors decreased significantly, but the explanatory power of wind speed was greatly improved. After the grazing prohibition, 53.22% of the total area was affected by human activities and climate change. The relative contribution of human activities decreased in NDVI-increased areas but increased in NDVI-decreased areas.

1. Introduction

The term grassland bridges pastureland and rangeland and may be either a natural or an imposed ecosystem [1]. As the largest terrestrial ecosystem in China, grasslands play a vital role in ecological security and food security [2]. The growth process of grassland is affected by environmental factors such as temperature, precipitation, soil type [3], and human activities such as policy regulation and economical driving [4]. By studying the spatial differentiation and evolution trend of vegetation coverage, finding out the response relationship between vegetation changes and climate and human activities is of great significance for the evaluation of regional ecosystems and the construction of ecological civilization [5,6]. The normalized difference vegetation index (NDVI) is closely related to vegetation cover, biomass [7], and the leaf area index [8,9].
The basic control methods of grassland ecological management include grazing, rest grazing, and grazing prohibition. These methods regulate grassland ecosystems by focusing on the three links of livestock–vegetation–soil [10]. Moderate grazing and rest grazing can restore degraded grasslands and soils. They play an active role in promoting plant growth and maintaining community richness and diversity [10], improving the nutritional quality of forages, enhancing microbial activity [11], improving grassland ecological productivity [12], and maintaining sustainable utilization of grassland resources [13]. Grazing creates multiple regenerative niches that increase plant species richness [14]. Light grazing had a positive effect on the abundance of surface arthropods and parasitic insects [15] and the composition of mite community in the residual [16]. Overgrazing can affect grassland coverage, height, and biomass, leading to grassland degradation [17]. Grassland degradation leads to fragmentation and functional degradation of grassland wildlife habitat, which indirectly affects herbivore biomass [18]. For example, the reduction of vegetation height and coverage makes some rodents who like to hide more easily exposed, causing rodents to migrate or die due to unsuitable environment [19]. As an important link in the food chain of terrestrial ecosystems, rodents are also a food source for many carnivores, leading to the destruction of grassland ecosystems. Overgrazing also reduces arthropod biomass, especially predatory arthropods [15]. High-intensity grazing reduces the abundance of high-quality vegetation species in arid and semi-arid regions of North America, allowing species that are resistant to high-intensity grazing to become dominant, leading to the spread of toxic species and an increase in bare land [20]. Grazing reduces community resistance by preventing perennial herbs from competing with exotic plants [21], while grazing prohibition reduces the increase in exotic plant species [22]. At the same time, grazing prohibition is beneficial to the recovery of beetle communities [23], promotes the growth of nematodes [24], arbuscular mycorrhizae [25] and cryptosporidium [26], and is conducive to the expansion of woody plants [27]. Vegetation changes and bare land reduction [26] caused by the short-term grazing prohibition are beneficial for grassland birds to build nests and improve wildlife habitat quality [28,29]. Population densities of Sturnella loyca obscura were higher in non-grazing areas of Argentina [30]. Mammal species richness and abundance increased in the riparian zones of southwestern Pennsylvania after 1–2 years of grazing prohibition [31]. There has been controversy over the effectiveness of grazing prohibition. The optimal grazing prohibition time of grassland in different regions and under different degradation conditions also varies greatly. A certain period of grazing prohibition can not only reduce grazing pressure but also significantly increase the role of grassland biomass, allowing plants to gain more space [32]. One year after grazing prohibition, grassland biomass at Hongyuan Station on the Qinghai Tibet Plateau in China increased significantly, but grass plant richness and diversity did not change significantly [33]. Slightly degraded grassland can recover to its ideal state after 1–2 years of grazing prohibition under the conditions of sufficient water, heat, and nutrients [33]. Magellanic meadows return to grassy state in about four years [34]. After five years of grazing prohibition in the grasslands on the northern slope of the Tianshan Mountains in Xinjiang, the content of carbon sediments and active components in the soils of grasslands was lower than that of the grazing grassland [35]. Long-term grazing prohibition will also reduce the grassland community diversity index and affect grassland ecological function [36]. Therefore, grassland management requires rational planning of grazing intensity and scientific adjustment of grazing prohibition and rest time.
Ningxia, located in the upper reaches of the Yellow River, is one of the ten largest pastoral areas in China. Its natural grassland area is 24,433.33 km2, accounting for 47% of the total area, playing an important ecological role [37]. In the process of historical development, Ningxia has gradually formed a typical agro-pastoral complex ecosystem through the long-term integration of agriculture and animal husbandry, grasslands, and deserts. In addition, the region is located in the transition zone between arid and semi-arid, with serious soil erosion, frequent sandstorm disasters, and fragile natural ecological environment [38]. Human disturbance also exacerbates grassland degradation and desertification [39], such as chronic overgrazing, Ophiocordyceps sinensis rotting [40], and “grain-based” policies [41]. Since May 2003, in order to prevent the further deterioration of grassland resources, all areas of Ningxia have implemented the grassland ecological protection policy of prohibiting grazing and enclosing natural grasslands. It is the first province in China to prohibit grazing in the whole region. In 2011, Ningxia promulgated the “Regulations on the Prohibition of Grazing and Fences in the Ningxia Hui Autonomous Region”, which is the first local regulation in China to prohibit grazing and fences in grasslands. Therefore, it is necessary to study the change of grassland coverage before and after grazing prohibition in Ningxia, which is of great significance for testing the effect of current grazing prohibition and guiding the future management of grassland resources in this area.
Based on NDVI remote sensing data, this paper conducts research in three time periods: before the grazing prohibition (1988–2003), after the grazing prohibition (2003–2018) and 1988–2018 (31 years before and after the grazing prohibition). The purposes of this study are as follows: (1) Using trend analysis and the Hurst index model to analyze the temporal variation characteristics, trends, and future sustainable characteristics. (2) The spatial change characteristics of grassland in Ningxia were analyzed by a spatial transfer matrix. (3) Using the geographic detector model to detect and analyze the climatic and surface factors affecting grassland changes, and to clarify the spatial differentiation of NDVI and the dominant driving factors of grassland changes in Ningxia. (4) The relative contributions of climate change and human activities to NDVI were analyzed. The research results can be used to identify the ecological effects of the grazing prohibition policy in Ningxia since 2003 and provide a scientific basis for the innovation of grassland utilization and management models in Ningxia and the promotion of grassland ecological construction in the future.

2. Materials and Methods

2.1. Study Area

Ningxia (35°14′–39°23′ N, 104°17′–107°39′ E) is located on the eastern edge of Northwest China. The terrain of this area is high in the south and low in the north, and the whole area is gradually inclined from southwest to northeast. The southern loess hills are about 2000 m above sea level, the central Lingtai and mountain plains are 1300–1500 m above sea level, and the northern Ningxia Plain (the aggregate of Yinchuan Plain and Weining Plain) is 1100–1200 m above sea level, forming a three-step terrain ladder in Ningxia. The geographical distribution of the region is divided into three plates: the northern Yellow River irrigation area, the central arid zone, and the southern mountainous area. The area belongs to a temperate continental arid and semi-arid climate, with low temperatures, significant temperature changes, and significant evaporation. Ningxia has four distinct seasons, and enjoys the reputation of “the South of the Yangtze River”. The annual average temperature ranges from 5.6 to 10.1 °C; the annual rainfall is between 167.2 and 618.3 mm, decreasing from south to north. The annual average wind speed is between 2.0 and 7.0 m·s−1, the highest in spring and the lowest in autumn. There are twelve CSCS (comprehensive and sequential classification system of grassland) grassland types in Ningxia (Figure 1). The soil types include brown mountain soil, mountain black loessial soil, mountain gray cinnamon soil, loessial soil, light gray calcareous soil, etc. Herbaceous plants are: Stipa tianshanica var. gobica, S. grandis, Kengia gracilis, Kengia squarrosa, Leymus secalinus, Heteropappus altaicus, Saussurea iodostegia, Leontopodium leontopodiodes, Artemisia subdigitata, A. frigda, Caree serreana, Astragalus hoantchy, Polygonum viviparum, etc.; semi-shrubs are: A. gmelinii, Thymus serpyllum Var. mongolicus, Cynanchum komarovii, Lysimachia clethrodies, Convolvulus tragacanthoides, Salsola arbuscular, Ajania achilleoides, Oxytropis aciphylla, etc.; shrubs are: Caragana stenophylla, Qstryopsis davidiana, Syringa oblate, Spiraea alpine, Salix cupularix, Rosa hugonis, etc.; arbores are: Pinus armandii, Populus davidiana, Quercus liaotungensis, Picea asperata, etc.

2.2. Data Sources and Preprocessing

The data used in this study include meteorological data, soil data, and remote sensing data. The meteorological data and soil attribute data are mainly from the National Qinghai-Tibet Plateau Science Data Center; http://data.tpdc.ac.cn (accessed on 16 November 2021). The temperature, wind speed, radiation, and precipitation data are from the China Regional Ground Element-Driven Dataset with a resolution of 0.1°. The soil data were obtained from the China Soil Dataset (V 1.2), based on the World Soil Data Bank (HWSD). The NDVI data were obtained from the China 5 km resolution monthly NDVI dataset (1982–2020) from the National Earth System Science Data Center; http://geodata.cn (accessed on 15 December 2021). The land use data were obtained from the Resource and Environmental Science Data Center of the Chinese Academy of Sciences; https://www.resdc.cn/ (accessed on 28 November 2021) with a resolution of 90 m. The projected coordinate system for all data calculations in ArcGIS is D_WGS_1984, with a spatial resolution of 1 km.

2.3. Methods

2.3.1. Trend Analysis of NDVI

In this study, a combination of ordinary least squares and F-test were used to analyze the variation of NDVI [42]. The calculation formula is as follows:
s l o p e = n × i = 1 n i × v i i = 1 n i i = 1 n v i n × i = 1 n i 2 [ i = 1 n i ] 2
where the slope means the inter-annual variation characteristics. If slope is positive, it means that a factor shows an increasing trend in Ningxia; otherwise, it represents a decreasing trend.
The F-test method was used to calculate the significance of changes in spatial trends [43]. The expression is:
F = U × ( n 2 Q )
where U indicates the error sum of squares and Q means the regression sum of squares. According to the above significance test results, this study divided the change trend of NDVI into four categories: significant increase (p < 0.05, slope > 0), weak increase (p > 0.05, slope > 0), weak decrease (p > 0.05, slope < 0), and significantly decreased (p < 0.05, slope < 0). In this study, ordinary least squares and F-test were implemented with MATLAB 2017b and ArcGIS 10.2.

2.3.2. The Spatial Transition Matrix

The spatial transition matrix can quantitatively identify the transformation process of an element from time T to time T + 1 in a certain period. It can directly reflect the regional transfer-in and transfer-out of each grade type or patch [44]. The expression is:
S i j [ S 11 S 21 S 1 n S 21 S 22 S 2 n S n 1 S n n ]
where S is the study area, i and j are the grassland coverage grades in different years, and n is the grassland coverage grades.

2.3.3. The Spatial Transition Matrix

A geographical detector is a mathematical model for detecting spatial heterogeneity and driving-force distribution relationships [45]. Compared with the traditional mathematical statistical models, it can not only reflect the explanatory power of each factor to the dependent variable but also reflect the interaction between the two factors. As shown in Table 1, this paper selects nine factors to test their influence on NDVI in Ningxia grassland. We set a 2 km regular fishing net to divide the study area and generate sampling points. Then, we use the sampling points to extract the point values of NDVI and factors, and use the geographic detector model to calculate.
Factor detector is used to test the explanatory power of factors that explain the spatial variations in NDVI. The explanatory power of the factor is represented by q. The expression is:
q = 1 1 N σ 2 h = 1 L N h σ h 2
where L is the classification or division of the dependent variable NDVI or the independent variable influencing factor X. Nh and σh2 are the number of units and variance of layer h, respectively. N and σ2 are the number of units and variance in the region, respectively. The larger the q value, the more obvious the spatial differentiation of the factors.
The interaction detector is mainly used to analyze the interaction among factors such as human activities, meteorology, and land surface, and can evaluate the influence of multi-factor interaction on the interpretive ability of NDVI.
The ecological detector used the F-test to analyze whether there is a significant difference in the influence of the two influencing factors on the spatial differentiation of the dependent variable NDVI. If there is a significant difference, mark it as Y; otherwise, mark it as N. This can identify which factors influence NDVI.
The risk detector is used to evaluate the difference of the mean values of attributes in different sub-regions, which can be used to identify the regional vegetation coverage. The risk detector is checked by using the t statistic. The expression is:
t = Y h = 1 ¯ Y h = 2 ¯ [ var ( Y h = 1 ¯ ) n h = 1 + var ( Y h = 2 ¯ ) n h = 2 ] 1 2
where h is a sub-region, Yh and nh correspond to the NDVI value and number of samples of h, respectively, and var represents the corresponding variance.

2.3.4. Relative Contributions of Driving Forces

We use multiple regression residual analysis to distinguish the impact of climate change and human activities on grassland NDVI [46]. Then, we calculated the relative contribution of climate change and human activities to grassland NDVI changes. Taking the NDVI of the time series as the dependent variable, and the precipitation and temperature of the corresponding years as the independent variables, the predicted value of NDVI was obtained by multiple regression. The difference between the predicted NDVI and the real NDVI is used to calculate the annual residual. The expression is:
N D V I c l i ( i , t ) = a × t e m p ( i , t ) + b × p r e c ( i , t ) + c
where NDVIcli is the predicted NDVI value representing the response of climate change to grass growth. Temp is the annual temperature and prec is the annual precipitation. a, b, and c represent the regression coefficients.
N D V I r e s = N D V I o b s N D V I c l i
where NDVIres indicates the response of human activities to grass growth. NDVIobs is the original value of NDVI.
According to the residual trend analysis results, the factors driving the spatiotemporal evolution of grass NDVI are divided into six categories. The identification criteria and contribution calculation methods are shown in Table 2 [47,48]. In this study, residual analysis was implemented with MATLAB 2017b and ArcGIS 10.2.

2.3.5. Future Trend Analysis

The Hurst index is often used to quantify the sustainability of long-time series in nature [49]. For the NDVI time series {NDVI (t)}, T = 1, 2 … n, the basic principles and expressions are as follows:
The mean series is
NDVI ( T ) ¯ = 1 T t = 1 T NDVI ( T ) , T = 1 , 2 , , n
The cumulative dispersion is
X ( t , T ) = t = 1 t ( NDVI ( t ) NDVI ( t ) ¯ ) , 1 t T
The range sequence is
R ( T ) = max X ( t , T ) min X ( t , T ) , T = 1 , 2 , n
The standard deviation sequence is
S ( T ) = [ 1 T t T ( N D V I ( t ) N D V I ( T ) ) 2 ] 1 2 , T = 1 , 2 , n
The Hurst index is
R ( T ) S ( T ) = ( c T ) H
where H is the Hurst index, calculated by the least squares log(R/S)n = a + H × log(n) [50]. If R/S ∝ TH, it indicates the existence of the Hurst phenomenon in the analyzed time series [51]. The value range of H is 0 to 1. If 0.5 < H < 1, it indicates that NDVI has a long-range positive correlation in the time series, and the closer H is to 1, the stronger the sustainability. If H = 0.5, it indicates that the trend of the NDVI time series is a random sequence and has no sustainability. If 0 < H < 0.5, it indicates that the NDVI trend is anti-sustainable in the time series [52].

3. Results

3.1. Changes in the Distribution of Grass NDVI

3.1.1. Temporal-Spatial Variations in Grass NDVI

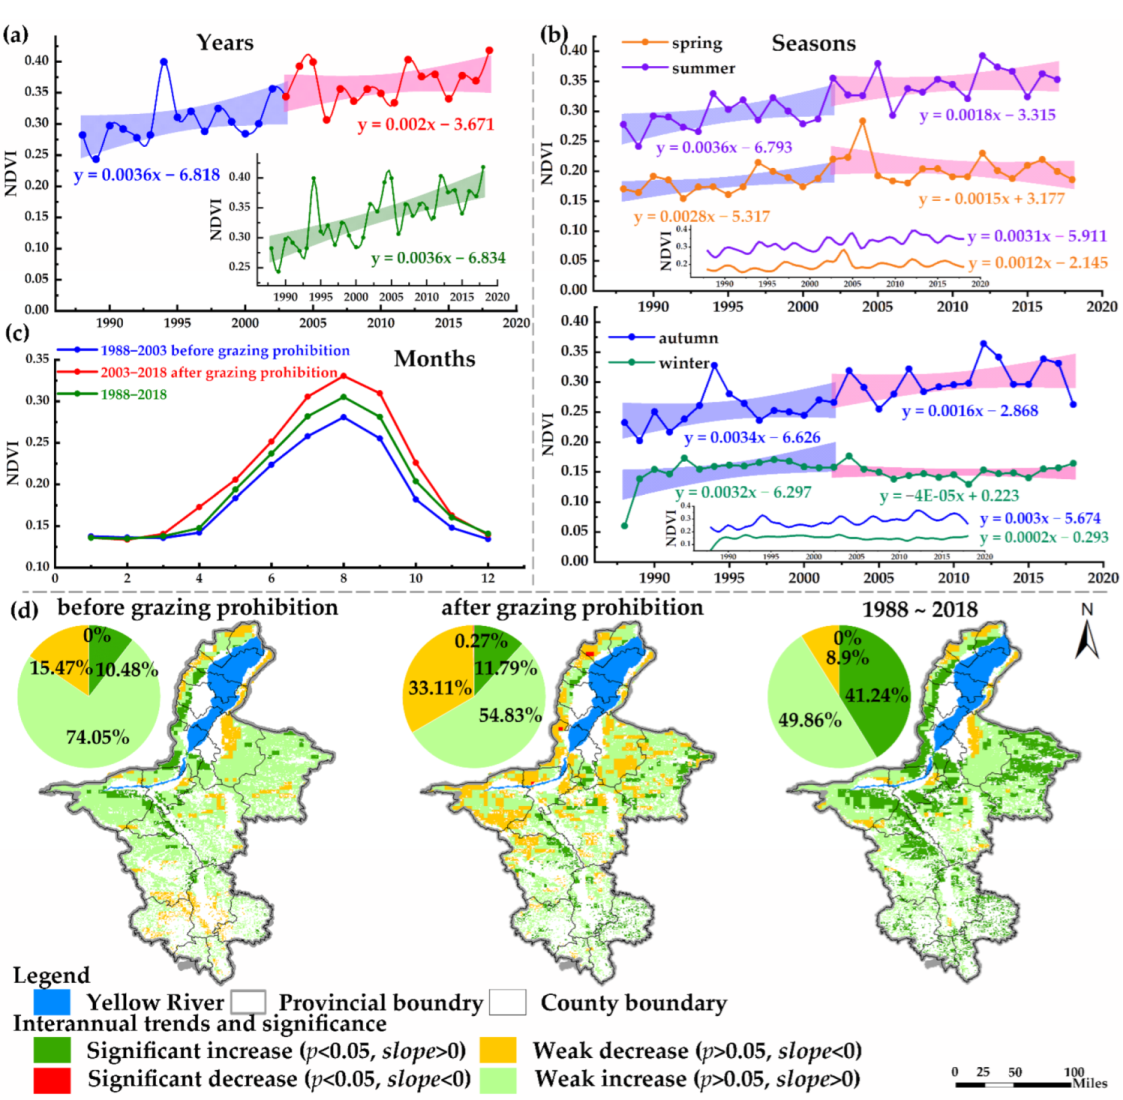
In this study, the annual, seasonal, and monthly averages of NDVI at the regional scale of Ningxia grassland were calculated for three periods. In terms of the interannual variation characteristics of NDVI (Figure 2a), the grasslands in Ningxia showed an overall increasing trend in the three periods of 1988 to 2003 (before grazing prohibition), 2003 to 2018 (after grazing prohibition), and 1988 to 2018, with rates of increase of 0.0036 ya−1, 0.0020 ya−1, and 0.0036 ya−1, respectively. The interannual change rate after grazing prohibition was 0.0016 ya−1 lower than that before grazing prohibition. Variation ranged from 0.24 (1989) to 0.42 (2018). The 31-year average NDVI was 0.34, and the average value after grazing prohibition was 0.07 higher than before grazing prohibition. The change rate after grazing prohibition was 0.0016 ya−1 lower than that before grazing prohibition.
In terms of seasons (Figure 2b), the highest NDVI value was in summer (June to August), with a 31-year average of 0.32, followed by autumn (September to November) with 0.28, spring (March to May) with 0.19, and winter (December to February of the second year) with the lowest value of 0.15. Except in winter, the seasonal averages after the grazing prohibition were higher than those before grazing prohibition. From 1988 to 2018, the NDVI of Ningxia grass showed a fluctuating upward trend in spring, summer, and autumn, and the change rates were 0.0031 ya−1, 0.003 ya−1, and 0.0012 ya−1, respectively. Winter at 0.0002 ya−1 is a relatively stable trend. However, the seasonal change rates decreased after grazing prohibition, and the change rates decreased by 0.0018 ya−1 in summer and autumn. In particular, it decreased by 0.0043 ya−1 in spring and 0.0032 ya−1 in winter, showing a decreasing trend.
From the monthly NDVI change trend (Figure 2c), the lowest value appeared in February, the NDVI value increased significantly from February to August, reached a peak in August, and then decreased rapidly. The change curve is unimodal. This characteristic is mainly affected by climate. Ningxia belongs to a temperate continental arid and semiarid climate and is located on the western edge of China’s monsoon region. Affected by the southeast monsoon in summer, the time is short and the precipitation is low. In winter, affected by the northwest monsoon, the time is long, and the temperature fluctuates violently. The monthly average NDVI value after grazing prohibition was higher than that before the grazing prohibition.
According to the trend analysis and F-test results, the NDVI variation trend was divided into four levels (Figure 2d). During the three periods, the variation trend of NDVI in Ningxia was mainly a weak increase. From 1988 to 2018, the level with a weak increase accounted for 74.05% of the regional area, and the level with a significant increase accounted for 10.48% of the regional area. The overall trend of change was positive. Before and after grazing prohibition, the proportion of the level with slow growth accounted for 74.05.24% and 54.83%, respectively. After grazing prohibition, the proportion of increased levels decreased by 17.91%, the proportion of significant growth decreased by 1.31%, and the proportion of slow growth decreased by 19.22%. The proportion of decreased levels increased by 3.92%. After the grazing prohibition, the NDVI in the southern mountainous areas changed greatly. Before grazing prohibition, some areas of Xiji County and Guyuan City in the south of the mountainous area showed a slow downward trend, and after grazing prohibition, turned to a slow growth trend. The central location of Ningxia showed a weak increase trend, and turned to a weak decrease trend after the grazing prohibition. The area near the Tengger Desert in northwest Ningxia showed an obvious increase trend, but it turned to a weak decrease trend after the grazing prohibition.

3.1.2. The Spatial Pattern of Grass NDVI

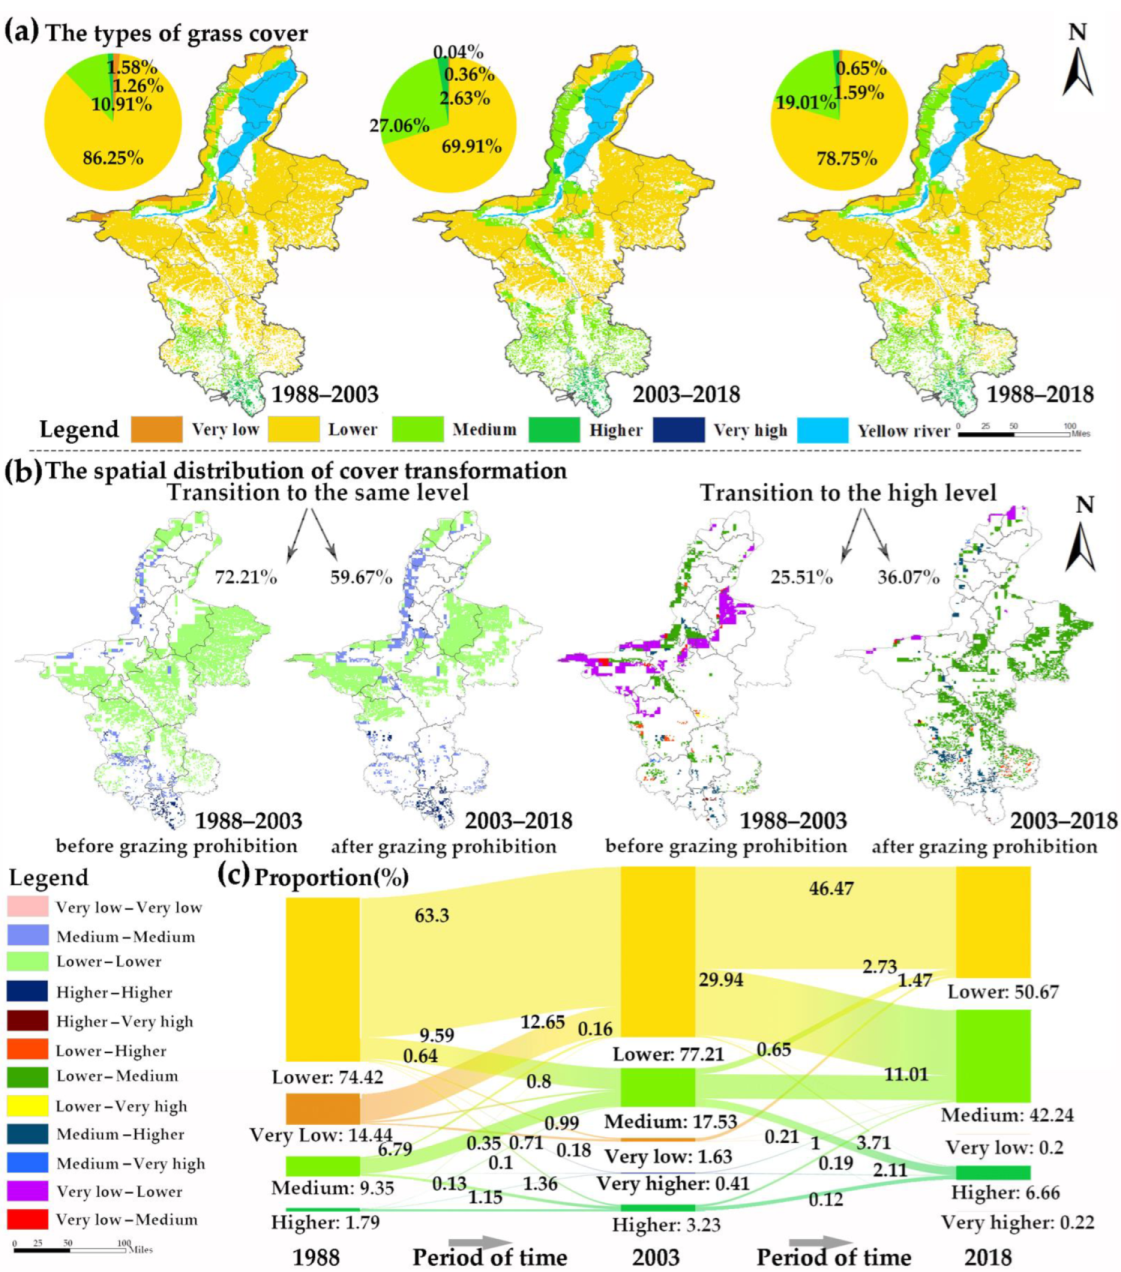
The types of grass coverage in Ningxia were divided into five grades by the equal spacing method: very low grass coverage (<0.2), lower grass coverage (0.2–0.4), medium grass coverage (0.4–0.6), higher grass coverage (0.6–0.8), and very high grass coverage (>0.8). The grassland coverage grade in Ningxia showed a decreasing trend from south to north (Figure 3a). During the three periods of 1988 to 2003, 2003 to 2018, 1988 to 2018, the grassland coverage types in Ningxia were dominated by low coverage, accounting for 78.74%, 86.24%, and 69.91%, respectively, mainly in the central and northern regions. Higher and very high coverage grasslands were mainly distributed in southern Ningxia, accounting for 1.26% of the area before grazing prohibition, 2.67% of the area after grazing prohibition, and 1.59% from 1988 to 2018. After the grazing prohibition, the proportion of medium grass coverage increased by 16.15%. The increased areas were mainly distributed in the southern mountainous areas of Ningxia, the west side of the Ningxia Plain, Wuzong city, Zhongning County, and Tongxin County. Low grass coverage was mainly distributed in the northwest of Zhongwei County and scattered in Pingluo County. The proportion of low grass coverage was 1.58% before grazing prohibition, and decreased by 1.22% after grazing prohibition.

3.1.3. Spatial Pattern Transformation of Grass NDVI

The spatial transfer matrix of grassland cover in the three periods is shown in Figure 3b,c. From the perspective of grass cover types at the same level conversion, the proportion after the prohibition of grazing (59.67%) decreased by 12.54% compared with that before the prohibition of grazing (72.21%). From 1988 to 2018, the area where the grassland coverage remained unchanged accounted for 44.23%.
From the perspective of grass cover types at the high-level conversion, the proportion after grazing prohibition (2003–2018, 36.07%) increased by 10.56% compared with that before grazing prohibition (1988–2003, 25.51%). From 1988 to 2018, the high-level transformation of grass cover types accounted for 54.54%, and the transformation trend was dominated by positive evolution. The areas where the grassland types changed to high levels before the grazing prohibition were mainly distributed in the northwestern area of Ningxia, mainly on the path of “low coverage grassland→lower coverage grassland”, accounting for 12.65%; followed by the path of “lower coverage grassland→medium coverage grassland”, accounting for 9.59%. The transition of grassland types to high level after grazing prohibition mainly occurred in southern Ningxia, the central part of Ningxia, and the eastern part of Ningxia. The path mainly occurred on the “lower covered grassland→medium covered grassland”, accounting for 29.94%; the second was the path of “medium covered grassland→higher covered Grassland”, accounting for 3.71%. The ecological environment has been significantly optimized.
From the perspective of grassland coverage types at a low level, the proportion after grazing prohibition (4.24%) increased by 2.00% compared with that before grazing prohibition (2.24%). The transition of grassland types to low level after grazing prohibition mainly occurred on the path of “medium coverage grassland→lower coverage grassland, accounting for 2.73%”. From 1988 to 2018, the area where grassland coverage turned to a low level accounted for 1.21%.

3.2. Geographical Detector of Spatial Differentiation Variation of Grass NDVI

3.2.1. Analysis of the Influence of Dominant Factors on Grass NDVI

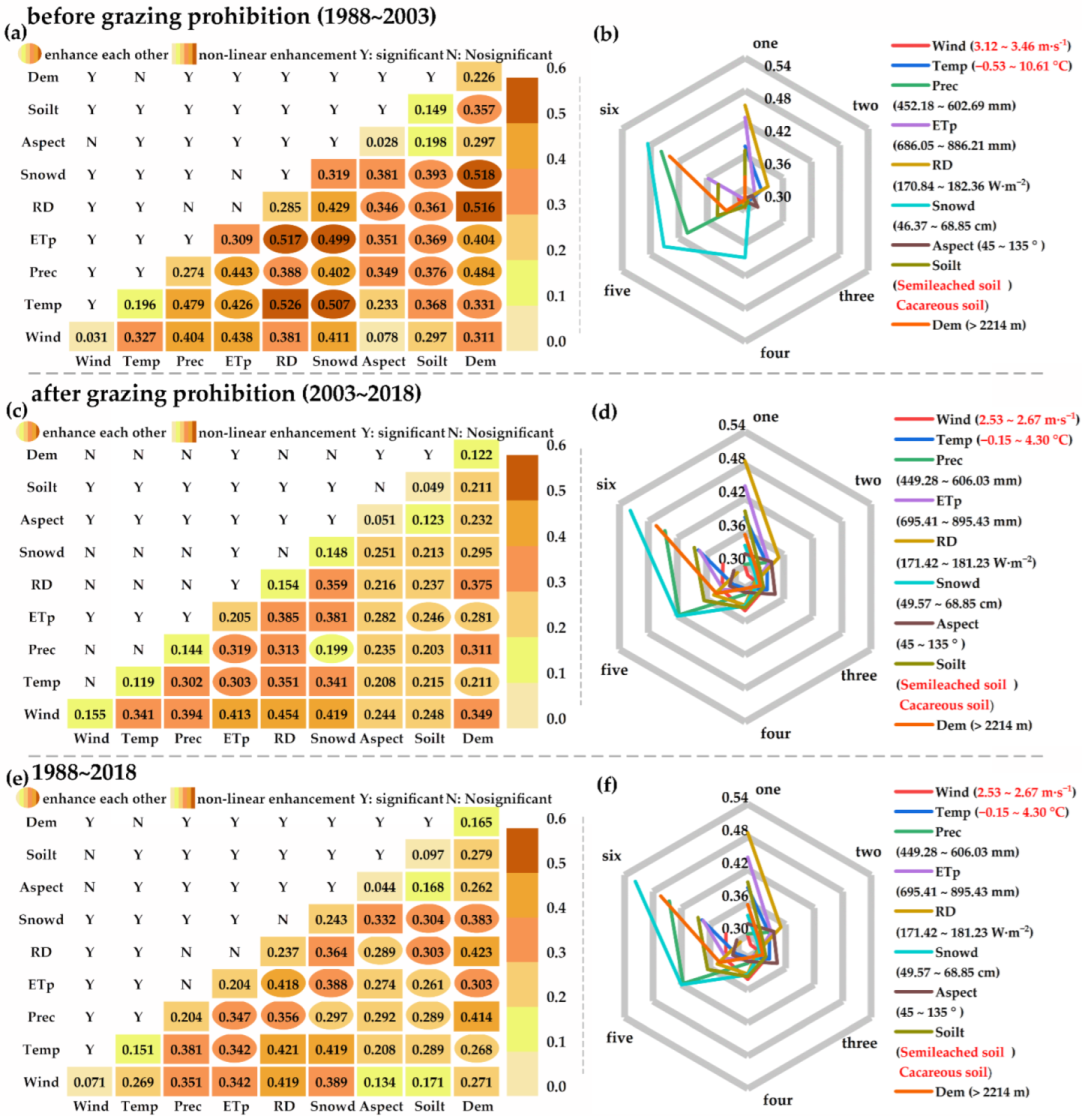
By analyzing the q value of each factor, the factor detector can intuitively display the mechanism and degree of NDVI differentiation and explain the spatial differentiation characteristics of NDVI. Figure 4 shows the explanatory power of the three periods. The top four factors were mainly Snowd, ETp, RD, and Prec. This result reflects that climate factors, including snow depth, potential evaporation, radiation, and precipitation, are the dominant factors affecting the NDVI of Ningxia grassland. Before grazing prohibition: Snowd (0.319) > ETp (0.309) > RD (0.285). After grazing prohibition: ETp (0.206) > RD (0.154) > Wind (0.155). From 1988 to 2018: Snowd (0.243) > RD (0.237) > Prec and ETp (0.204). Before grazing prohibition, the three factors of Temp, RD, and Dem had little difference. Aspect and Wind had little effect on the NDVI because q < 0.1. After grazing prohibition, the explanatory power of each influencing factor was significantly reduced, while the explanatory power of Wind was greatly improved. The secondary factors in 1988–2018 were similar to those before grazing prohibition. The grasslands were affected by a variety of environmental factors in all three periods, and the contribution of these factors varied over time. Especially after the grazing prohibition, the q value of each natural environment decreased significantly.

3.2.2. Analysis of Dominant Factors of Interaction Detector and Ecological Detector

The interaction detector mainly identifies interactions between different environmental factors (X). During the three periods (Figure 5a,c,e), the interaction of natural factors on NDVI was not a simple superposition process, but manifested as enhancing each other or nonlinear enhancement. The q value of the interaction after grazing prohibition was generally smaller than that before grazing prohibition, which was consistent with the factor detector results. The top 4 interactions before grazing prohibition were RD ∩ Temp, Dem ∩ Snowd, RD ∩ ETp, and RD ∩ Dem. The interactions of temperature and altitude with the dominant factors were enhanced (Figure 5a). Wind ∩ RD, Wind ∩ Snowed, Wind ∩ ETp, Wind ∩ Prec. The top four interactions after grazing prohibition were: Wind ∩ RD, Wind ∩ Snowed, Wind ∩ ETp, Wind ∩ Prec, and Wind interaction with the dominant factors was enhanced (Figure 5c). The top four interactions from 1988 to 2018 were RD ∩ Dem, RD ∩ Temp, RD ∩ Wind, and Temp ∩ Snowd, and the interactions of wind speed, temperature, and altitude with the dominant factor were enhanced (Figure 5e). The ecological detector can reflect whether the influence of these two factors on the spatial distribution of NDVI is significant (Figure 5a,c,e). There were no significant differences between Dem and Temp or RD and Prec in the three periods. Before the grazing prohibition, ETp and RD, ETp and Snowd, Aspect and Wind had similar mechanisms of action. After grazing prohibition, the mechanisms of action of various factors were similar.

3.2.3. Appropriate Range or Type of Impact Factor

According to the risk detector, the adaptive range or type of each factor affecting the distribution of grass NDVI was calculated and analyzed. The optimum wind speed decreased from zone 6 to zone 5 (Figure 5b). The optimum temperature increased from zone 1 to zone 6 (Figure 5d). The suitable soil types were changed from semi-solubilized leaching and calcareous soil to alpine soil and water bodies (Figure 5f). The adaptation range and types of other factors were similar in the three periods. In terms of meteorological factors, the most suitable ranges of precipitation were 449.28–609.38 mm, potential evaporation was 686.05–911.34 mm, near-surface radiation was 170.84–182.36 W m−2, and snow depth was 45.92–82.05 cm. In terms of surface factors, semi-sunny slopes (45°–135°) and altitudes above 2214 m were more suitable for grassland growth.

3.3. The Influences and Relative Contributions of Climate Change and Human Activities on Grass NDVI

3.3.1. The Response of Grass NDVI to Climate Change

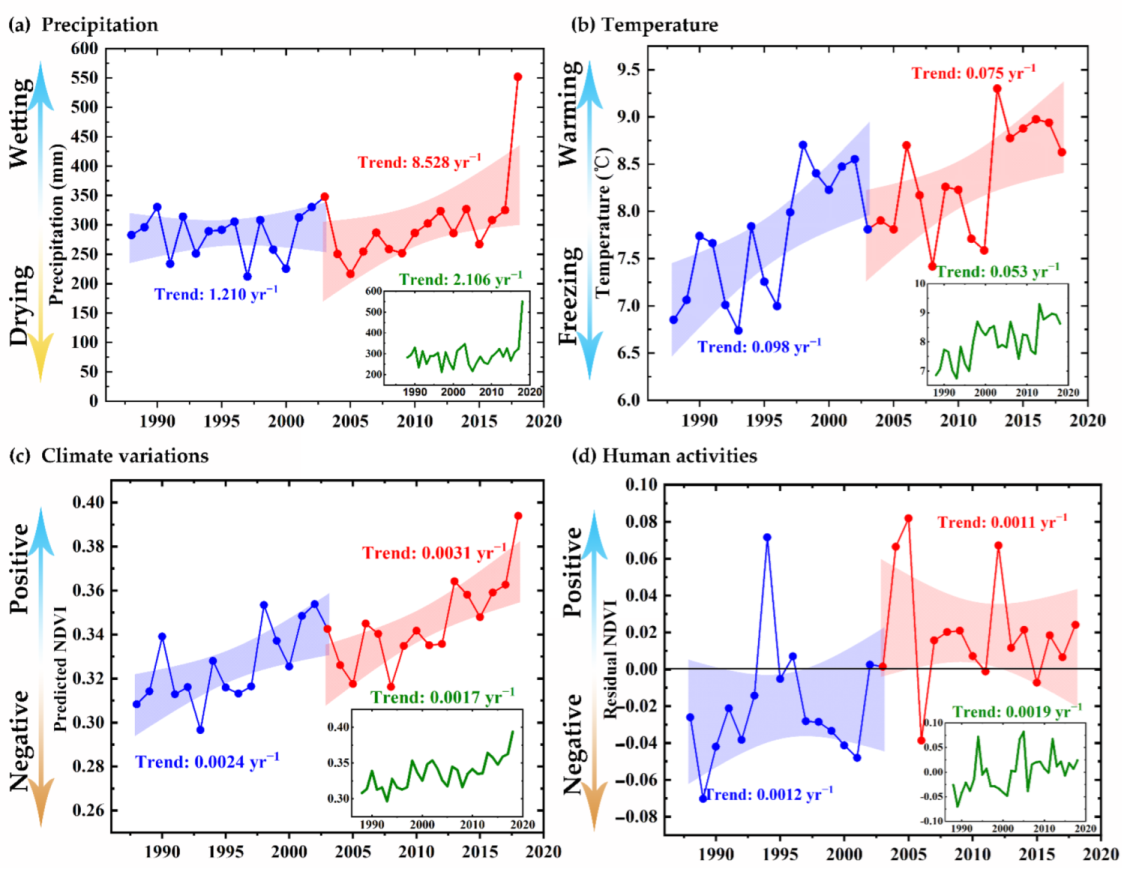
Ningxia is located in arid and semi-arid regions, and precipitation and temperature have significant effects on NDVI (Figure 6a,b). In the past 31 years, the precipitation and temperature in Ningxia have shown an increasing trend. Precipitation increased significantly after the grazing prohibition, with a change rate of 8.528 yr−1, but the annual temperature change rate was 0.023 yr−1 lower than that before grazing prohibition. The predicted NDVI showed an increasing trend, and the growth rate after the grazing prohibition was 0.0007 yr−1 higher than that before grazing prohibition (Figure 6c).
Affected by the climate, NDVI increased significantly in all three periods. The proportion of the area increased after the grazing prohibition was 7.61% higher than that before the grazing prohibition (Figure 7a). From 1988 to 2018, the area with obvious increase accounted for 72.52% of the total area. The northwestern part of Ningxia showed an obvious increasing trend before and after grazing prohibition. The southern mountainous experienced significant growth before grazing prohibition. Yanchi County and Tongxin County increased significantly after grazing prohibition. After the grazing prohibition, the negative impact of climate on the area decreased by 2.74%. Before grazing prohibition, NDVI degradation areas were mainly distributed in the southwest of Zhongwei County and Lingwu city. After grazing prohibition, the degree of degradation in some regions of Lingwu County increased, while the degree of degradation in the Zhongwei area decreased.

3.3.2. The Response of Grass NDVI to Human Activities

In this study, residual trend analysis was used to explore grass NDVI responses to human activities (Figure 6d). The residual values before grazing prohibition were mostly negative, indicating that human activities mainly had a negative impact on NDVI. During this period, the residual value growth rate was 0.0012 yr−1, indicating that the negative impact of human activities was gradually diminishing. Especially from 1988 to 1994, the residual value increased rapidly, and the negative impact of human activities on NDVI was gradually turned positive. However, from 1994 to 2002, the residual value gradually decreased, showing a negative impact. After grazing prohibition, the residual values fluctuated up and down, but were mostly positive, indicating that human activities had a positive impact on grassland growth. Overall, residual values increased continuously from 1988 to 1994, decreased from 1994 to 2001, and increased volatility from 2002 to 2018 (Figure 6d).
The increase in NDVI caused by human activities before grazing prohibition accounted for 66.25% of the total area of the study area, mainly distributed in central Ningxia. The degradation area accounts for 33.75%, mainly distributed in the southern mountainous area and the Helan Mountain area (Figure 7b). After grazing prohibition, the area of NDVI reduced by human activities increased by 21.51% compared with that before grazing prohibition, which was mainly distributed in the central region. The significant increase in NDVI caused by human activities was mainly distributed in the southern mountainous area. From 1988 to 2018, the area where NDVI increased due to human activities accounted for 88.41% of the total area.

3.3.3. Spatial Distribution of Climate Change and Human Activities for Grass NDVI Change

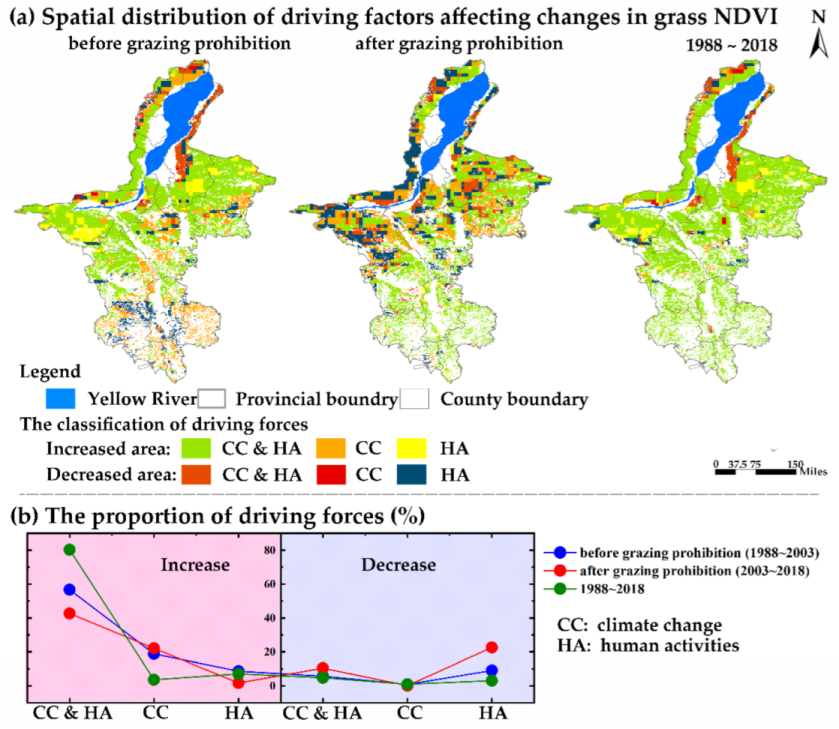
Figure 8 shows the spatial distribution of changes in NDVI caused by climate change and human activities. The increase in NDVI caused by the combined effects of climate change and human activities from 1988 to 2018 was almost distributed in all regions, accounted for 80.28% of the study area. After grazing prohibition, these areas decreased by13.99% compared with that before grazing prohibition, and were mainly distributed in the central area before grazing prohibition and the southern mountainous area after grazing prohibition. The increase in NDVI caused by climate change was relatively scattered from 1988 to 2018, accounting for 3.66% of the study area. After grazing prohibition, these areas increased by 3.18% compared with that before grazing prohibition, and were mainly distributed in the south before grazing prohibition and in the central region after grazing prohibition. The increase in NDVI caused by human activities accounted for 7.08% of the total area from 1988 to 2018, mainly concentrated in the southern part of Zhongwei County and parts of Lingwu County. After grazing prohibition, these areas decreased by 6.86% compared with before grazing prohibition.
The decrease in NDVI caused by the combined effects of climate change and human activities from 1988 to 2018 was almost distributed in northwestern Lingwu County, accounting for 4.82% of the study area. These areas were mainly distributed in the east of the Yellow River Plain before the prohibition of grazing, and scattered in the central area after grazing prohibition. The decrease in NDVI caused by climate change was less distributed. The decrease in NDVI caused by human activities was mainly distributed in the southern mountainous areas before the prohibition of grazing, concentrated in the northwestern areas of Zhongwei city and Zhongning city, and scattered in other central regions after the prohibition of grazing. In general, grassland cover changes in Ningxia were mainly affected by climate change and human activities, but they alone had a limited impact on NDVI.

3.3.4. Relative Contributions of Climate Change and Human Activities to Grass NDVI Changes

Based on multiple linear regression and residual analysis, this study quantified the relative contributions of driving forces to grass NDVI (Figure 9). The original NDVI change area was divided into the NDVI-increased area and NDVI-decreased area to further clarify the contribution of driving forces to grassland growth. In the NDVI-increased area, the areas affected by climate change from 1988 to 2018 were 49.98%, and the human activities were 56.17%. Before grazing prohibition, the NDVI increased in the areas affected by climate change, and human activities were 62.51% and 56.63%, respectively. After grazing prohibition, the contribution of climate change increased by 8.84%, but human activities decreased by 18.85%. In the NDVI-decreased area, the original NDVI from 1988 to 2018 was mainly affected by human activities, accounting for 73.68% of the area. Among them, the area before and after the prohibition of grazing accounted for 85.39% and 93.04%, respectively. Before grazing prohibition, the increase of grassland in the southern mountainous areas was mainly caused by climate change, while after grazing prohibition, it was mainly caused by human activities. Before grazing prohibition, the increase of grass in southern Zhongwei County and Lingwu County and the decrease of grass in southern mountainous areas were mainly caused by human activities. Human activities were the main reason for grass reduction in the central and the northwestern regions after grazing prohibition.

3.4. Future Trend Change in Grass NDVI

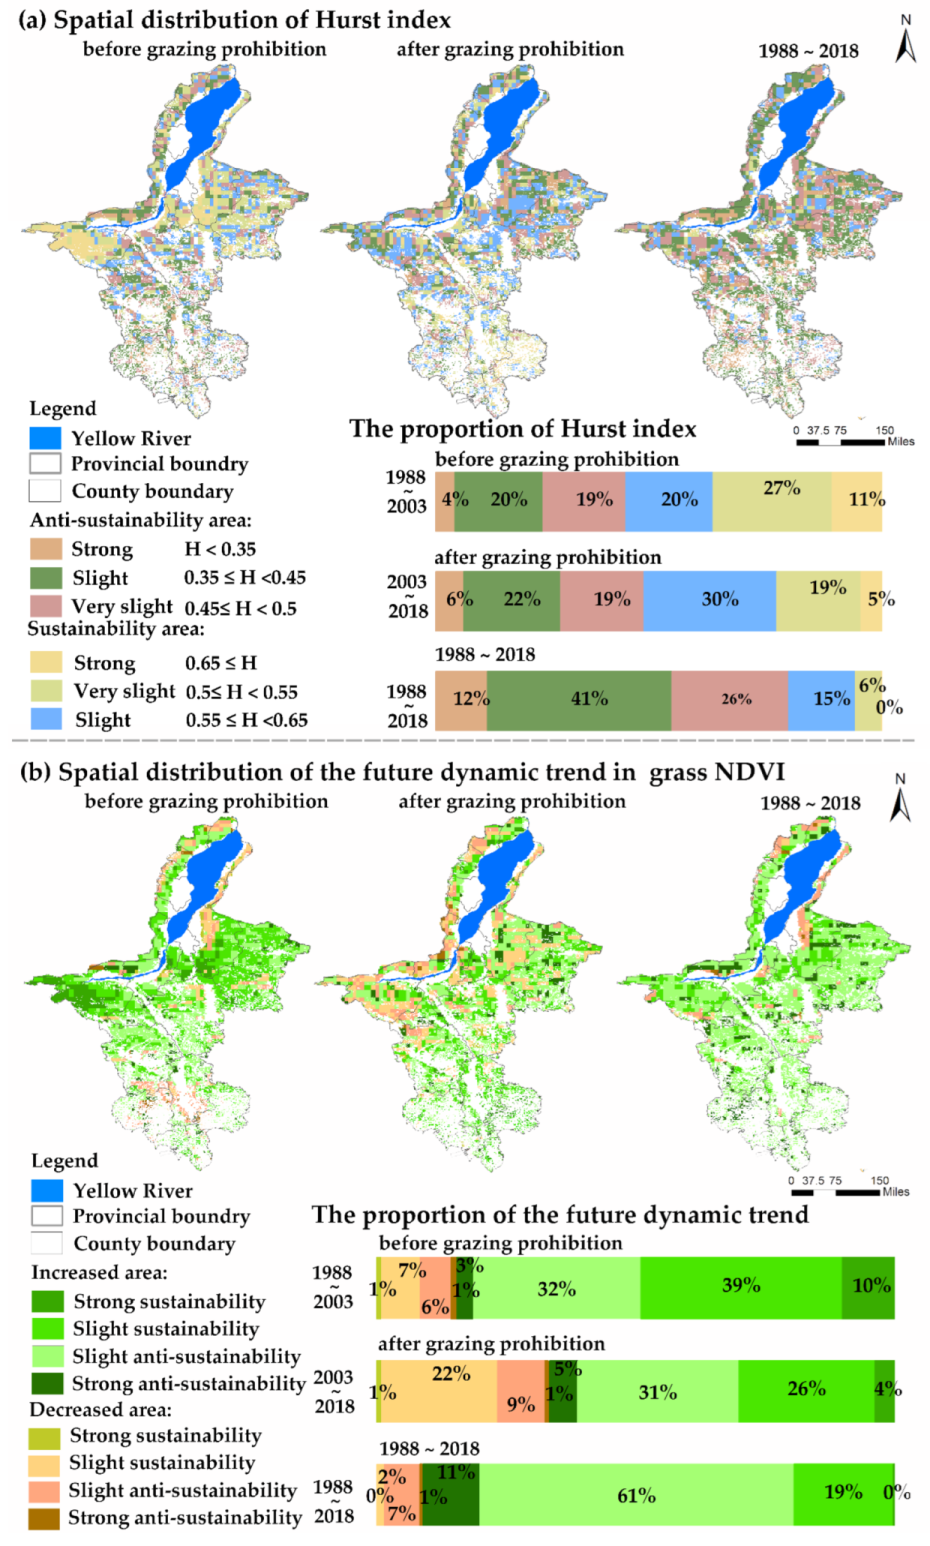
Figure 10a shows the spatial distribution of sustainability based on the Hurst index. The average Hurst index before grazing prohibition was 0.53, indicating that future NDVI changes are mainly sustainable. The average Hurst index after grazing was 0.50, indicating that NDVI changes in the future are mainly unsustainable. From 1988 to 2018, The Hurst index averaged 0.44, indicating that future changes in NDVI are mainly anti-sustainable. From1988 to 2003, 2003 to 2018, and 1988 to 2018, the slight sustainability areas were accounting for 84.51%, 88.95%, and 88.21%, respectively. The areas with Hurst index < 0.50 were scattered in the three periods, accounting for 42.62% of the total area before grazing prohibition, 46.59% after grazing prohibition, and 79.04% from 1988 to 2018. The future NDVI changes in these areas may be contrary to the historical trends. The regional grasslands with sustainable changes (Hurst index > 0.5) were mainly distributed in the southwest of Zhongwei County, Lingwu County, Wuzong city, Yanchi, and other places before grazing prohibition. It can be inferred that changes in these areas will be similar to the historical trend. After the grazing prohibition, Hurst index in these areas decreased slightly, and places such as Zhongwei County even turned into anti-sustainability features. However, places such as Pengyang County and southern Ningxia have persistent positive features.
In this study, the NDVI trend map and Hurst index classification map were superimposed to judge the future trend of NDVI. Figure 10b shows the spatial distribution of future NDVI trends. Before grazing prohibition, the slight unsustainable degradation area in southern Ningxia showed slight sustainable improvement after grazing prohibition. This was consistent with the variation trend of NDVI after grazing prohibition. This result indicates that the grazing prohibition policy is beneficial to the restoration of grassland and improves the ecological environment of the area. From the perspective of the future trend of NDVI after grazing prohibition, 33.40% of the regions will show a downward trend, and 9.16% of the regions will show a slight anti-sustainability and improvement trend, mainly in Zhongwei County. On the other hand, 66.60% of the area showed an increasing NDVI trend, of which 26.24% showed a slight sustainability and improvement trend. The proportion of regions with significant NDVI changes (strong sustainable degradation and strong sustainable improvement) are relatively small. Judging from the future trend of NDVI from 1988 to 2018, 91.04% of the area NDVI showed an increasing trend, of which 71.60% showed an anti-sustainability trend. In general, due to the comprehensive influence of natural, human, policy, and other factors, the predicted NDVI trends in different periods are quite different, and the ecological protection work needs to be further improved and strengthened.

4. Discussion

This paper analyzed the temporal and spatial changes and driving forces of NDVI in Ningxia grassland from three periods, and explored the response mechanism of climatic conditions and surface factors to grassland growth. In the past 31 years, the grassland coverage in Ningxia showed an overall improvement trend, and there were differences in spatial differentiation. Especially after grazing prohibition, Ningxia implemented a series of ecological projects, such as razing prohibition on natural grassland, grazing restoration project, and construction of rat-free demonstration area on natural grassland [53]. Since the implementation of the grazing prohibition policy in Ningxia, the grassland coverage has steadily improved and the ecological environment has been optimized. The positive feedback from the natural environment on policy implementation shows that environmental construction has achieved remarkable results.
Before grazing prohibition, the slight unsustainable degradation area in southern Ningxia showed slight sustainable improvement after grazing prohibition. After grazing prohibition, the Hurst index in Pengyang County and other places in southern Ningxia turned into a positive continuous feature. The grassland types in the southeastern part of Pengyang County in southern Ningxia are mainly warm temperate subhumid forest steppe (Figure 1). The climate is hot and rainy in summer and sunny and dry in winter. Vegetation is dominated by secondary shrub. The grassland types on the Loess Plateau in southern Ningxia and the east of Liupan Mountain are mainly cool temperate humid forest steppe deciduous broad-leaved forest (Figure 1). This type of grassland had a small area, the grassland vegetation is the transition from forest grassland to forest, and shrubs and herbs are widely distributed [54,55,56,57,58]. In addition, the grassland types in this area include cold temperate perhumid cold taiga forest and cool temperate perhumid mixed coniferous broad-leaved forest (Figure 1). Grazing prohibition policies can help restore these types of grasslands. However, under the premise of improving the overall ecological environment, negative feedback appeared in some areas. From the negative feedback of the actual change trend, the growth rate decreased by 17.91% after grazing prohibition, but the degradation rate increased by 3.92% (Figure 2d). From the perspective of vegetation degradation caused by human activities (Figure 9), it was mainly distributed in the southern mountainous areas before the prohibition of grazing, and concentrated in the northwestern areas of Zhongwei City and Zhongning City after the prohibition of grazing, and scattered in other central areas. After the grazing prohibition (Figure 10), the main grassland types in the northwest of Zhongwei City, Lingwu and other areas with negative feedback are mainly warm temperate arid warm temperate semi-desert (Figure 1). The climate is warm and dry, and the vegetation is dominated by xerophyte perennial herbs, and xerophyte subshrubs also account for a large proportion. The grassland vegetation is sparse, the community structure is simple and the grassland quality is low, which is easily damaged by environmental and human factors, leading to vegetation degradation and desertification [54,55,56,57,58]. The grassland types in southern Zhongwei County and most of central Ningxia are mainly cool temperate arid temperate zonal semi-desert (Figure 1). The area has an arid continental climate with aridity and little rainfall. The vegetation is dominated by perennial small xerophytic herbs, accompanied by a large number of xerophytic subshrubs. The structure of grassland plants is relatively simple, but there are many types of poisonous weeds. The grass layer is sparse, the grassland coverage is low, the grassland quality is good but the yield is low, and the grassland ecosystem is fragile and prone to desertification [54,55,56,57,58].
The reasons for negative feedback are analyzed from the following points: (1) from the policy point of view, the favorable factors affecting the change in grassland coverage in Ningxia include the government’s attention, legal guarantee, and increasing capital investment; unfavorable factors include population pressure, a certain degree of loosening and lax supervision after the implementation of the grazing prohibition policy, and interest driven factors [53]. To assess the long-term impact of grazing prohibition on rangelands, the Nevada plots closed system was established. Over 65 years, pasture recovery rates were similar between moderately grazing and grazing exclusion conditions, with little change in species composition, cover, density, and yield [59]. As planners of regional development, local government managers adjust grazing prohibition policies according to business models and limited time and space, which have an important impact on grassland resources and the sustainable development of farming and pastoral areas [60].
(2) From the perspective of community productivity and diversity of grassland ecosystem caused by grazing prohibition, moss [61], grass layer [62], shrub layer, and woody vegetation will recover rapidly after grazing prohibition [27]. After 5 years of grazing prohibition, bryophytes in Austrian Tyrol have increased significantly, and the tall species in the subalpine steppe increased [61]. After 8 years of grazing prohibition, the number of flowers, young pods, mature pods and seeds, seed weight and vigor of Caragana microphylla increased significantly [27].
Long-term grazing prohibition will reduce the community diversity index and affect the ecological function of grassland [27]. Long-term grazing prohibition will also reduce the grassland community diversity index and affect grassland ecological function [36]. Snow bed species decline with grazing prohibition at the upper alpine Carex curvula grassland [61]. The number of plant species in the grazing prohibition area was lower than that in other wild horses grazing areas in the grasslands of the North American Midwest [63]. The effects of grazing prohibition on species were related to seed size traits. Grazing exclusion at nearly all sites favored species with large size traits, while species with medium and small size traits showed lesser or no responses. However, seed densities for tiny species in high-yielding river valleys dropped dramatically [64]. Long-term grazing prohibition also affects the dominant grass species. For example, long-term fencing can negatively affect the regeneration of Stipa populations [65].
The effects of long-term grazing prohibition on species richness come from multiple sources, including reducing vegetation diversity by reducing soil seed banks [66], limiting prairie shrub expansion by reducing sexual reproduction and thus inhibiting shrub population growth [27], reducing willow species diversity by reducing the new stem height growth and supplementation forms a closed canopy [67]. After 34 years of grazing prohibition, the seed yield, single flower weight, sex distribution, seed weight, and seed vigor of C. microphylla were severely reduced [27]. Long-term fencing led to a significant decrease in plant density and abundance in meadow communities, which was not conducive to the growth and renewal of new seedlings, and affected the succession and development of alpine meadow communities [68].
Long-term grazing prohibition in grassland lacks production efficiency, resulting in excess dry matter in grassland, hindering material circulation and energy flow, and affecting grassland ecological function [69]. The litter mainly comes from the increase of grass biomass, which may be related to the preference of herbivores to grass food [70]. When grazing was prohibited in the early stage, the community was in an open environment, and plant functional traits were mostly resource acquisition strategies [71]. However, as succession progressed, litter accumulation leads to closure of the environmental canopy, and plant functional traits favor resource-conservative strategies [72]. It is suggested to make rational use of long-term enclosure communities (such as moderate grazing, mowing, etc.) to promote the regeneration of the grassland community.
Soil microbial communities are highly sensitive to the effects of grazing prohibition [73]. The responsiveness soil bacterial community in desert steppe was higher than that other typical steppe and meadow steppe [74]. After grazing prohibition, the metabolic efficiency of microorganisms was relatively low, and soil enzyme activity and microbial biomass were reduced [73]. Long-term grazing prohibition inhibits phosphatase activity and increases the abundance of pathogenic fungi [13].
(3) From the perspective of surface factors, the optimal time scale of artificial enclosure is related to the degree of grassland degradation and different soil conditions of grassland. In degraded soils in Brazil’s semi-arid region, pH, total organic carbon, particulate organic carbon, total nitrogen, particulate organic nitrogen, Ca2+ and K+ increased while Al3+ content decreased after 17 years of grazing prohibition. In contrast, effective phosphorus content, Mg2+ and Na+ did not show significant changes [75]. Large-scale grazing prohibition can significantly increase grassland carbon storage. Nitrogen availability in grassland soil increases ecosystem carbon sequestration capacity [76]. However, long-term grazing promoted the enrichment of unstable soil carbon pools [76,77]. The soil carbon and nitrogen levels were higher in fenced plots enclosed with lime zebra soil and Aeolian sandy soil for six years. However, 10 years later and 15 years later, there was no significant difference inside and outside the fence [78]. Desert steppe lime calcium soil has the best enclosure age, and the soil nutrients gradually decrease after the enclosure age. Plants have limited hyper compensatory mechanisms, which reduce the production turnover [79]. Effective grazing prohibition can improve soil nutrients and structure, but long-term grazing prohibition is not conducive to the restoration of degraded grasslands in semi-arid regions [80]. After 2.5 years of grazing prohibition in grasslands near Armidale, Australia, unsaturated hydraulic conductivity increased significantly at tensions of 5–15 mm. After 27 years of grazing prohibition, the unsaturated hydraulic conductivity and bulk density of the grassland topsoil were similar to those of 2.5 years of grazing prohibition [81]. After the desert steppe has been enclosed for a period of time, it should be moderately mowed or moderately grazed seasonally [82]. The suitable soil types before the grazing prohibition in this study were semi-solubilized leaching soil and calcareous soil, and changed to alpine soil, water body, and others after the grazing prohibition (Figure 5b,d,f).
(4) From the perspective of climatic factors, the increase in temperature on the Qinghai-Tibet Plateau can improve the net primary productivity of grasslands [83], but the restoration of grassland in agricultural and pastoral areas was significantly negatively correlated with temperature [84]. In Ningxia Yanchi, the water source mainly comes from atmospheric precipitation. Rising temperature in the region will directly exacerbate drought, which is not conductive to grassland recovery [85]. This study showed that the adaptive range of the annual average temperature increased after grazing prohibition (Figure 6). The increase in temperature is also the reason for the negative feedback on the growth of some Ningxia grasslands. The fully enclosed grassland in Ningxia Salt Pond has formed high-coverage soil crusts due to long-term closure. This will affect water infiltration and reduces the water use effectiveness of vegetation, resulting in compromised vegetation growth and reduced community diversity. However, community diversity in seasonally enclosed grasslands increased [86]. Based on the analysis of policy implementation, grassland growth laws, surface factors, and climatic factors, it is recommended to implement precise policies and adjust measures according to local conditions in areas with persistent stress resistance characteristics.
The influence of natural factors on NDVI is not independent, but geographical detectors with significant mutual effect can detect spatial differentiation and accurately identify the relationship and interaction between multiple factors, which are widely used in various fields, especially the detector of NDVI (Figure 4 and Figure 5). Previous studies on grassland NDVI in Ningxia only responded to climate change. In this study, geographic detectors were used to more comprehensively analyze the driving effects of nine natural factors on NDVI changes in the Ningxia grassland. With the change and increase in human and natural interventions, the next step should be combined with human activities to further determine the contribution rate of major ecological projects such as grazing prohibition policies to NDVI changes in the Ningxia grasslands.

5. Conclusions

This paper analyzed the temporal and spatial changes and driving forces of NDVI in Ningxia grassland from three periods, and explored the response mechanism of climatic conditions and surface factors to grassland growth. From this study, the following conclusions can be drawn:
(1) The variation trend of NDVI in Ningxia was mainly a slow increase. Except in winter, the annual, seasonal and monthly average values of NDVI after grazing prohibition were higher than those before grazing prohibition, but the annual and seasonal variation rates decreased. The average value in spring and winter showed a decreasing trend after grazing prohibition. (2) After grazing prohibition, the proportion of medium coverage increased by 16.15%, which was mainly reflected in the path of “lower coverage grassland→medium coverage grassland”. In the southern mountainous area of the Ningxia Plain, the ecological environment has been significantly optimized. (3) Snow depth, potential evapotranspiration, radiation, and precipitation were the main factors affecting NDVI differentiation in Ningxia grassland. The explanatory power of each influencing factor decreased significantly after grazing prohibition, while the explanatory power of Wind improved greatly. The explanatory power of the interaction decreased after grazing prohibition. (4) Human activities are the main factor affecting NDVI change, and climate change is the secondary factor. After grazing prohibition, the relative contribution of human activities in the improved area decreased and the degraded area increased. (5) In the future, the entire study area will mainly show an increasing trend, but anti-sustainability is the main feature of future NDVI changes. On the whole, the ecological protection policy of grazing prohibition throughout Ningxia has achieved relatively successful results. However, we urgently need to recognize that large-scale, long-term grazing protection should not be implemented in all climate zones. For regions with negative feedback characteristics, precise policy implementation and local conditions are the key.

Author Contributions

Conceptualization, X.Z. and Y.Z.; methodology, X.Z. and Y.Z.; software, X.Z., Y.Z. and K.M.; validation, X.Z. and D.W.; formal analysis, X.Z.; investigation, X.Z. and Y.Z.; resources, X.Z. and D.W.; data curation, X.Z.; writing—original draft preparation, X.Z.; writing—review and editing, X.Z.; visualization, H.L.; supervision, H.L.; project administration, H.L.; funding acquisition, H.L. All authors have read and agreed to the published version of the manuscript.

Funding

This research was funded by Key Research and Development Program of Forestry and Grassland Administration of Ningxia Autonomous Region, China-Study on Construction Mode, and Key Technology of Grassland Ecological Civilization Demonstration Area in Ningxia Hui Autonomous Region (20210239).

Institutional Review Board Statement

Not applicable.

Informed Consent Statement

Not applicable.

Data Availability Statement

Not applicable.

Conflicts of Interest

The authors declare no conflict of interest.

References

  1. Allen, V.G.; Batello, C.; Berretta, E.J.; Hodgson, J.; Kothmann, M.; Li, X.; McIvor, J.; Milne, J.; Morris, C.; Peeters, A.; et al. An international terminology for grazing lands and grazing animals. Grass Forage Sci. 2011, 66, 2–28. [Google Scholar] [CrossRef]
  2. Han, Y.W.; Gao, J.X. Analysis of main ecological problems of grasslands and relevant counter measure in China. Res. Environ. Sci. 2005, 18, 60–62. [Google Scholar] [CrossRef]
  3. Guo, S.; Pei, H.S.; Hu, S.; Yany, D.D.; Qiu, H.J.; Cao, M.M. Response of vegetation index to climate change and their relationship with runoff-sediment change in Yellow River Bastion. Bull. Soil Water Conserv. 2020, 40, 2–13. [Google Scholar] [CrossRef]
  4. Tu, Y.; Jiang, L.L.; Liu, R.; Xiao, Z.L.; Min, J. Spatiotemporal changes of vegetation NDVI and its driving forces in China during 1982–2015. Trans. Chin. Soc. Agric. Eng. 2005, 37, 75–84. [Google Scholar] [CrossRef]
  5. Zhou, X.Y.; Shi, D.H.; Wang, X.R. Impact of climate change and human activities on vegetation coverage in the Mongolian Plateau. Arid Zone Res. 2014, 31, 604–610. [Google Scholar] [CrossRef]
  6. Xin, Z.B.; Xu, J.X.; Zheng, W. Response of vegetation cover change to climate change and human activities in Loess Plateau. Sci. China Ser. 2007, 37, 1504–1514. [Google Scholar] [CrossRef]
  7. Aalto, J.; Niittynen, P.; Riihimäki, H. Cryogenic land surface processes shape vegetation biomass patterns in northern European tundra. Commun. Earth Environ. 2021, 2, 222. [Google Scholar] [CrossRef]
  8. Forzieri, G.; Miralles, D.G.; Ciais, P. Increased control of vegetation on global terrestrial energy fluxes. Nat. Clim. Chang. 2020, 10, 356–362. [Google Scholar] [CrossRef]
  9. Gutman, G.; Ignatov, A. The derivation of the green vegetation fraction from NOAA/AVHRR data for use in numerical weather prediction models. Int. J. Remote Sen. 1998, 19, 1533–1543. [Google Scholar] [CrossRef]
  10. Liu, Y.D.; Wu, R.L.G.; Li, Y.H. Production efficiency and ecological effects of typical steppe under different grazing systems. J. Inner Mongolia Agric. Univ. 2021, 37, 425–436. [Google Scholar] [CrossRef]
  11. Ren, H.Y.; Eviner, V.T.; Gui, W.Y. Livestock grazing regulates ecosystem multi-functionality in semiarid grassland. Funct. Ecol. 2018, 32, 2790–2800. [Google Scholar] [CrossRef] [Green Version]
  12. Wang, L.; Delgado-baquerizo, M.; Wang, D.L. Diversifying livestock promotes multi-diversity and multi-functionality in managed grasslands. Proc. Natl. Acad. Sci. USA 2019, 116, 6187–6192. [Google Scholar] [CrossRef] [Green Version]
  13. Yin, Y.L.; Wang, Y.Q.; Li, S.X.; Liu, Y.; Zhao, W.; Ma, Y.S.; Bao, G.S. Soil microbial character response to plant community variation after grazing prohibition for 10 years in a Qinghai-Tibetan alpine meadow. Plant Soil. 2019, 458, 175–189. [Google Scholar] [CrossRef]
  14. Milchunas, D.G.; Noy-Meir, I. Grazing refuges, external avoidance of herbivory and plant diversity. Oikos 2002, 99, 113–130. [Google Scholar] [CrossRef]
  15. Wang, Y.D. Effects of grazing livestock type and intensity on ground-dowelling arthropod steppe of Inner Mongolia. Master’s Thesis, Inner Mongolia University, Hohhot, China, 2012. [Google Scholar] [CrossRef]
  16. Yang, Z.M.; Hasitamier; Liu, X.M. Effects of grazing on the composition of soil animals and their decomposition function to Stipa grandis litter in Inner Mongolia typical steppe, China. J. Appl. Ecol. 2016, 27, 2864–2874. [Google Scholar] [CrossRef]
  17. Liu, W.T. Individual reproductive strategy of Stipa breviflora under different grazing pressures. Grassl. Sci. 2020, 66, 174–182. [Google Scholar] [CrossRef]
  18. Liu, W.; Zhou, L.; Wang, X. Responses of plant and rodents to different grazing intensity. Acta Ecol. Sin. 1999, 19, 376–382. [Google Scholar] [CrossRef]
  19. Li, J.S.; Song, Y.L.; Wang, X.Z.; Zeng, Z.G. Spatial pattern of small mammals community diversity in different grazing pressure in montane desert-steppe. Acta Ecol. Sin. 2005, 25, 51–58. [Google Scholar] [CrossRef]
  20. Fleischner, T.L. Ecological costs of livestock grazing in western North America. Conserv. Biol. 1994, 8, 629–644. [Google Scholar] [CrossRef] [Green Version]
  21. Wardle, D.A. Experimental demonstration that plant diversity reduces invasibility evidence of a biological mechanism or a consequence of sampling effect? Oikos 2001, 95, 161–170. [Google Scholar] [CrossRef] [Green Version]
  22. de Villalobos, A.E.; Zalba, S.M. Continuous feral horse grazing and grazing exclusion in mountain pampean grasslands in Argentina. Acta Oecol. 2010, 36, 514–519. [Google Scholar] [CrossRef]
  23. Olivier, B.; Sylvain, F.; Jérôme, O.; Philippe, P.; Elise, B.; Thierry, D. Using stone cover patches and grazing exclusion to restore ground-active beetle communities in a degraded pseudo-steppe. J. Insect Conserv. 2011, 15, 561–572. [Google Scholar] [CrossRef]
  24. Virtanen, R.; Salminen, J.; Strömmer, R. Soil and decomposer responses to grazing exclusion are weak in mountain snow-beds. Acta Oecol. 2007, 33, 207–212. [Google Scholar] [CrossRef]
  25. Chen, X.J.; Lin, Q.M.; Zhao, X.R.; Chen, H.; Wen, J.; Li, Y.; Li, G.T. Long-term grazing exclusion influences arbuscular mycorrhizal fungi and their association with vegetation in typical steppe of Inner Mongolia, China. J. Integr. Agr. 2018, 17, 1445–1453. [Google Scholar] [CrossRef]
  26. Jeffrey, J.Y. Effects of grazing exclusion on rangeland vegetation and soils, East Central Idaho. West. N. Am. Naturalist. 2005, 65, 91–102. [Google Scholar]
  27. Xie, L.N.; Guan, L.J.; Guo, H.Y.; Chen, W.Z.; Liu, Z.; Li, Q.F.; Ma, C.C. Reproductive effort of Caragana microphylla under long term grazing exclusion in a semiarid grassland. Grassl. Sci. 2021, 67, 328–336. [Google Scholar] [CrossRef]
  28. Zalba, S.M.; Cozzani, N.C. The impact of feral horses on grassland bird communities in Argentina. Anim. Conserv. 2004, 7, 35–44. [Google Scholar] [CrossRef] [Green Version]
  29. Barros, A.; Pickering, C.M.; Renison, D. Short-Term Effects of Pack Animal Grazing Exclusion from Andean Alpine Meadows. Arct. Antarct. Alp. Res. 2014, 46, 333–343. [Google Scholar] [CrossRef] [Green Version]
  30. Bellis, L.M.; Muriel, N. Response of the endemic Long-tailed Meadowlark (Sturnella loyca obscura) to grazing exclusion in herbivore-dependent upland grasslands of Argentina. Emu Austral Ornithol. 2015, 115, 176–184. [Google Scholar] [CrossRef]
  31. Giuliano, W.M.; Homyack, J.D. Short-term grazing exclusion effects on riparian small mammal communities. J. Range Manag. 2004, 57, 346–350. [Google Scholar] [CrossRef]
  32. Song, N.P.; Zhang, F.R.; Li, B.G.; Chen, H.W.; Yao, H.M.; Cao, L.X. Prohibiting Graze Policy and Its Effect. J. Nat. Resour. 2004, 19, 316–323. [Google Scholar] [CrossRef]
  33. Zheng, Z.C. The above-and below-ground processes of degradation and restoring efficiency of grazing exclusion in typical alpine grasslands on the Tibetan Plateau. Ph.D. Thesis, Beijing Forestry University, Beijing, China, 2020. [Google Scholar] [CrossRef]
  34. Marta, B.C.; Celina, E.N.; Karen, B.; Ana, C.; Juan, A. Grazing and Grazing Exclusion Along a Resource Gradient in Magellanic Meadows of Tierra del Fuego. Rangel. Ecol. Manag. 2013, 66, 688–699. [Google Scholar] [CrossRef]
  35. Fan, Y.M.; Wu, H.Q.; Xie, Z.J.; Xie, Y.; He, J.; Chai, D.P. Effects of fencing on the soil organic carbon of desert grassland in the northern slope of Tianshan. Acta Agrestia. Sinica. 2014, 22, 65–69. [Google Scholar] [CrossRef]
  36. Shaltout, K.H.; Elhalawany, E.F.; Eikady, H.F. Consequences of protection from grazing on diversity and abundance of the coastal lowland vegetation in eastern Saudi Arabia. Biodivers. Conserv. 1996, 5, 27–36. [Google Scholar] [CrossRef]
  37. Wang, W.N.; Zhang, N.; Liu, X.B.; Liu, X.P.; Xue, Y.X.; Yang, J.; Li, K.C.; Hou, W.Y. Research progress in the ecosystem services function and value of grasslands. Acta Ningxia J. Agri. 2017, 58, 71–72. [Google Scholar] [CrossRef]
  38. Liu, X.Z.; Li, Y.C.; Su, Z.J. Characteristics of average temperature and extreme temperature in Ningxia from 1962 to 2015. Arid. Zone Res. 2018, 35, 1173–1180. [Google Scholar] [CrossRef]
  39. Wu, Y. Thinking on ecological environment construction in Ningxia. China Forest. Eco. 2017, 2, 79–97. [Google Scholar] [CrossRef]
  40. Guo, S.J.; Xin, Z.Z.; Cao, H.G. Sand fixation and countermeasures of grassland in Ningxia. J. Arid. Land. Res. Environ. 1995, 9, 70–73. [Google Scholar]
  41. Zhou, J.; Song, N.P.; Li, T.S.; Pan, J.; An, C.P.; Xie, Y.Z. Dynamic changes of land use in deserting-grazing village under the policy of “taking grain as the highest priority” in Yanchi country from 1964 to 1970. Agric. Res. Arid. Areas 2017, 35, 193–198. [Google Scholar] [CrossRef]
  42. Stow, D.; Daeschner, S.; Hope, A.; Douglas, D.; Petersen, A.; Myneni, R.; Zhou, L.; Oechel, W. Variability of the seasonally integrated normalized difference vegetation index across the North slope of Alaska in the 1990s. Int. Remote Sens. 2010, 24, 1111–1117. [Google Scholar] [CrossRef]
  43. Naeem, S.; Zhang, Y.; Zhang, X.; Tian, J.; Abbas, S.; Luo, L.; Meresa, H.K. Both climate and socioeconomic drivers contribute to vegetation greening of the Loess Plateau. Sci. Bull. 2021, 66, 1160–1163. [Google Scholar] [CrossRef]
  44. Yuan, L.J.; Bi, R.T.; Xu, L.S.; Zhu, H.F. Spatiotemporal differentiation of vegetation coverage in Qinhe Basin. Chin. J. Ecol. 2019, 38, 1093–1103. [Google Scholar] [CrossRef]
  45. Wang, J.F.; Xu, C.D. Geodetector: Principle and prospective. Acta Geogr. Sin. 2017, 72, 116–134. [Google Scholar] [CrossRef]
  46. Evans, J.; Geerken, R. Discrimination between climate and human-induced dryland degradation. J. Arid. Environ. 2004, 57, 535–554. [Google Scholar] [CrossRef]
  47. Sun, W.; Song, X.; Mu, X.; Gao, P.; Wang, F.; Zhao, G. Spatiotemporal vegetation cover variations associated with climate change and ecological restoration in the Loess Plateau. Agric. For. Meteorol. 2015, 209, 87–99. [Google Scholar] [CrossRef]
  48. Jiang, W.; Yuan, L.; Wang, W.; Cao, R.; Zhang, Y.; Shen, W. Spatio-temporal analysis of vegetation variation in the Yellow River Basin. Ecol. Indic. 2015, 51, 117–126. [Google Scholar] [CrossRef]
  49. Tao, S.; Kuang, T.T.; Peng, W.F. Analyzing the spatio-temporal variation and drivers of NDVI in upper reaches of the Yangtze River from 2000 to 2015: A case study of Yibin City. Acta Ecol. Sin. 2020, 40, 5029–5043. [Google Scholar] [CrossRef]
  50. Yuan, L.H.; Jiang, W.G.; Shen, W.M.; Liu, Y.H.; Wang, W.J.; Tao, L.L.; Zheng, H.; Liu, X.F. The spatio-temporal variations of vegetation cover in the Yellow River basin from 2000 to 2010. Acta Ecol. Sin. 2013, 33, 7798–7806. [Google Scholar] [CrossRef]
  51. Feng, X.L.; Feng, Z.L.; Luo, L.C.; Qiu, L.L.; Liu, P. Fractal analysis of climate change and Hurst index experiment in Tibetan Plateau in future. Arid. Land Geogr. 2008, 31, 175–181. [Google Scholar]
  52. Wen, X.J.; Liu, Y.X.; Yang, X.J. A resilience-based Analysis on the spatial heterogeneity of Vegetation restoration and its Affecting Factors in the Construction of Eco-cities: A case study of Shangluo, Shaanxi. Acta Ecol. Sin. 2015, 35, 4377–4389. [Google Scholar] [CrossRef]
  53. Huang, W.G.; Liu, X.D.; Yu, Z.; Ma, X.M.; Ma, Z.; Wang, L. Effects of grazing prohibition on grassland coverage—A case study at Yanchi country of Ningxia. Pratac. Sci. 2011, 28, 1502–1506. [Google Scholar]
  54. Hu, Z.Z. New progress in grassland classification. Grassland. Turf. 1994, 4, 1–9. [Google Scholar] [CrossRef]
  55. Hu, Z.Z. Introduction to the Classification of Grassland, 1st ed.; China Agricultural Press: Beijing, China, 1997; pp. 225–242. [Google Scholar]
  56. Ma, H.B.; Wang, N. Classification of grassland in Ningxia. J. Ningxia Agric. Colg. 2000, 21, 62–67. [Google Scholar]
  57. Liu, X.P.; Chen, S.R.; Guo, Z.J.; Zhao, Y.; Huang, Y. Research on regionalization of grassland agriculture in Ningxia. J. Northwest Normal Univ. (Nat.Sci. Ed.) 2014, 1, 115–120. [Google Scholar] [CrossRef]
  58. Ren, J.Z.; Hu, Z.Z.; Zhao, J.; Zhang, D.G.; Hou, F.J.; Lin, H.L.; Mu, X.D. A grassland classification system and its application in China. Rangel. J. 2008, 30, 199–209. [Google Scholar] [CrossRef]
  59. Courtois, D.R.; Perryman, B.L.; Hussein, S. Vegetation Change after 65 Years of Grazing and Grazing Exclusion. J. Range Manag. 2004, 57, 574. [Google Scholar] [CrossRef]
  60. Zhou, L.H.; Wang, Y.; Yang, G.J. Study on the Timely Adjustment of the Grazing Prohibition Policy Ban or Lift Empirical Research from Local Government Managers. Sustainability 2018, 10, 4852. [Google Scholar] [CrossRef] [Green Version]
  61. Rüdiger, K.; Roland, M.; Nikolaus, S.; Brigitta, E. Effects of Climate Change vs. Grazing Exclusion on Species Diversity Over 18 Years Along an Elevation Gradient in the European. Alps. Front. Ecol. Evol. 2021, 9, 640103. [Google Scholar] [CrossRef]
  62. Lenzi-Grillini, C.R.; Viskanic, P.; Mapesa, M. Effects of 20 years of grazing exclusion in an area of the Queen Elizabeth National Park, Uganda. Afr. J. Ecol. 1996, 34, 333–341. [Google Scholar] [CrossRef]
  63. Fahnestock, J.T.; Detling, J.K. The influence of herbivory on plant cover and species composition in the Pryor Mountain Wild Horse Range, USA. Plant Ecol. 1999, 144, 145–157. [Google Scholar] [CrossRef]
  64. Yagil, O.; Avi, P.; Jaime, K.; Francisco, P. Size Traits and Site Conditions Determine Changes in Seed Bank Structure Caused by Grazing Exclusion in Semiarid Annual Plant Communities. Ecography 2006, 29, 11–20. [Google Scholar] [CrossRef]
  65. Wu, J.B.; Bao, X.Y.; Li, J.; Zhao, N.X.; Gao, Y.B. Influence of fencing duration on community and population of Stia grandis in a typical steppe. Acta Agrestia Sin. 2010, 18, 490–495. [Google Scholar] [CrossRef]
  66. Saatkamp, A.; Henry, F.; Dutoit, T. Vegetation and soil seed bank in a 23-year grazing exclusion chronosequence in a Mediterranean dry grassland. Plant Biol. 2018, 152, 1020–1030. [Google Scholar] [CrossRef]
  67. Kathryn, A.H.; Wayne, C.L.; Trlica, M.J. Grazing History Affects Willow Communities in a Montane Riparian Ecosystem. Rangel. Ecol. Manag. 2005, 58, 148–154. [Google Scholar] [CrossRef]
  68. Wu, G.L.; Du, G.Z.; Liu, Z.H.; Thirgood, S. Effect of fencing and grazing on a Kobresia-dominated meadow in the Qinghai-Tibetan Plateau. Plant Soil. 2009, 319, 115–126. [Google Scholar] [CrossRef]
  69. Xu, Q.; Xu, Z.Q.; Wang, Y.S. Evaluation on impacts of grazing prohibition on services of typical steppe ecosystem. Pratac. Sci. 2012, 29, 364–369. [Google Scholar]
  70. Díaz, S.; Lavorel, S.; McIntyre, S.; Falczuk, V.; Casanoves, F.; Milchunas, D.G.; Skarpe, C.; Rusch, G.; Sternberg, M.; Noy-Meir, I. Plant trait responses to grazing—A global synthesis. Glob. Chang. Biol. 2007, 13, 313–341. [Google Scholar] [CrossRef]
  71. Zhang, Y.; Cheng, J.; Su, J.S.; Cheng, J.M. Diversity-productivity relationship of plant communities in typical grassland during the long-term grazing exclusion succession. Chin. J. Plant Ecol. 2022, 46, 176–187. [Google Scholar] [CrossRef]
  72. Zhang, J.H.; Huang, Y.M.; Chen, H.Y.; Gong, J.R.; Qi, Y.; Li, E.G.; Wu, X.C. Response of plant functional traits at species and community levels to grazing exclusion on Inner Mongolian steppe, China. Rangel. J. 2018, 40, 179–189. [Google Scholar] [CrossRef]
  73. Aldezabal, A.; Moragues, L.; Odriozola, I.; Mijangos, I. Impact of grazing abandonment on plant and soil microbial communities in an Atlantic mountain grassland. Appl. Soil Ecol. 2015, 96, 251–260. [Google Scholar] [CrossRef]
  74. Wang, F.F.; Li, Z.M.M.; Fu, B.J.; Lü, Y.H.; Liu, G.P.; Wang, D.B.; Wu, X. Short-Term Grazing Exclusion Alters Soil Bacterial Co-occurrence Patterns Rather Than Community Diversity or Composition in Temperate Grasslands. Front. Microbiol. 2022, 13, 824192. [Google Scholar] [CrossRef] [PubMed]
  75. José, D.S.O.F.; Jonas, N.V.; Eliane, M.R.D.S.; José, G.B.D.O.; Marcos, G.P.; Felipe, G.B. Assessing the effects of 17 years of grazing exclusion in degraded semi-arid soils: Evaluation of soil fertility, nutrients pools and stoichiometry. J. Arid Environ. 2019, 166, 1–10. [Google Scholar] [CrossRef]
  76. Deng, L.; Shangguan, Z.P.; Wu, G.L.; Chang, X.F. Effects of grazing exclusion on carbon sequestration in China’s grassland. J. Integr. Agr. 2017, 173, 84–95. [Google Scholar] [CrossRef]
  77. Shrestha, G.; Stahl, P.D. Carbon accumulation and storage in semi-arid sagebrush steppe: Effects of long-term grazing exclusion. Agr. Ecosyst. Environ. 2007, 125, 173–181. [Google Scholar] [CrossRef]
  78. Xie, L.; Song, N.Y.; Meng, C.; Wu, T.; Chen, X.Y.; Li, M.L.; Yue, J.M. Time course of changes in soil particle size and carbon and nitrogen reserves after fencing Ningxia desert steppe. Acta Pratac. Sin. 2020, 29, 1–10. [Google Scholar] [CrossRef]
  79. Yang, X.G.; Song, N.P.; Li, X.B.; Liu, B.R. Effects of short-term fencing on organic carbon fractions and physical stability of sandy sierozem in desert steppe of northwest China. Chin. J. Appl. Ecol. 2012, 23, 3325–3330. [Google Scholar] [CrossRef]
  80. Gao, Y.N.; Liao, L.R.; Wang, J.; Wan, Q.; Liu, G.B.; Zhang, C. Effects of grazing exclusion on the fractal characteristics of soil particle size in semiarid grassland on the Loess Plateau. J. Soil Water Conserv. 2012, 35, 312–326. [Google Scholar] [CrossRef]
  81. Greenwood, K.L.; MacLeod, D.A.; Scott, J.M.; Hutchinson, K.J. Changes to soil physical properties after grazing exclusion. Soil Use Manag. 1998, 14, 19–24. [Google Scholar] [CrossRef] [Green Version]
  82. Li, Q.; Yang, J.; Song, B.Y. The impacts of different closure durations on degraded Stipa Grandis grassland productivity and soil carbon and nitrogen storage. Chin. J. Ecol. 2014, 33, 896–901. [Google Scholar] [CrossRef]
  83. Yang, Y.H.; Pu, S.L. Variations in grassland vegetation cover in relation to climatic factors on the Tibetan plateau. J. Plant Eco. 2006, 30, 1–8. [Google Scholar] [CrossRef]
  84. Cao, X.J.; Gan, Z.Z.B.; Liang, Y.; Gao, Q.Z.; Zhang, Y.; Li, Y.E.; Wan, Y.F.; Dan, J.L.B. Temporal and spatial distribution of grassland degradation in northern Tibet based on NDVI. Acta Pratac. Sin. 2016, 25, 1–8. [Google Scholar] [CrossRef]
  85. Zhong, J.T.; Wang, P.; Mi, W.B.; Mao, W.T.; Yang, X.M.; Yang, M.L. Effect of grazing prohibition on grassland cover changes in Yanchi Country. Pratac. Sci. 2018, 35, 2855–2864. [Google Scholar] [CrossRef]
  86. Miao, J.; Zhang, K.B.; Liu, X.D.; Li, H.T. Diversity of plant community in relation to environment factors based on CCA in fencing region in Yanchi, Ningxia. Ecol. Environ. Sci. 2015, 24, 762–766. [Google Scholar] [CrossRef]
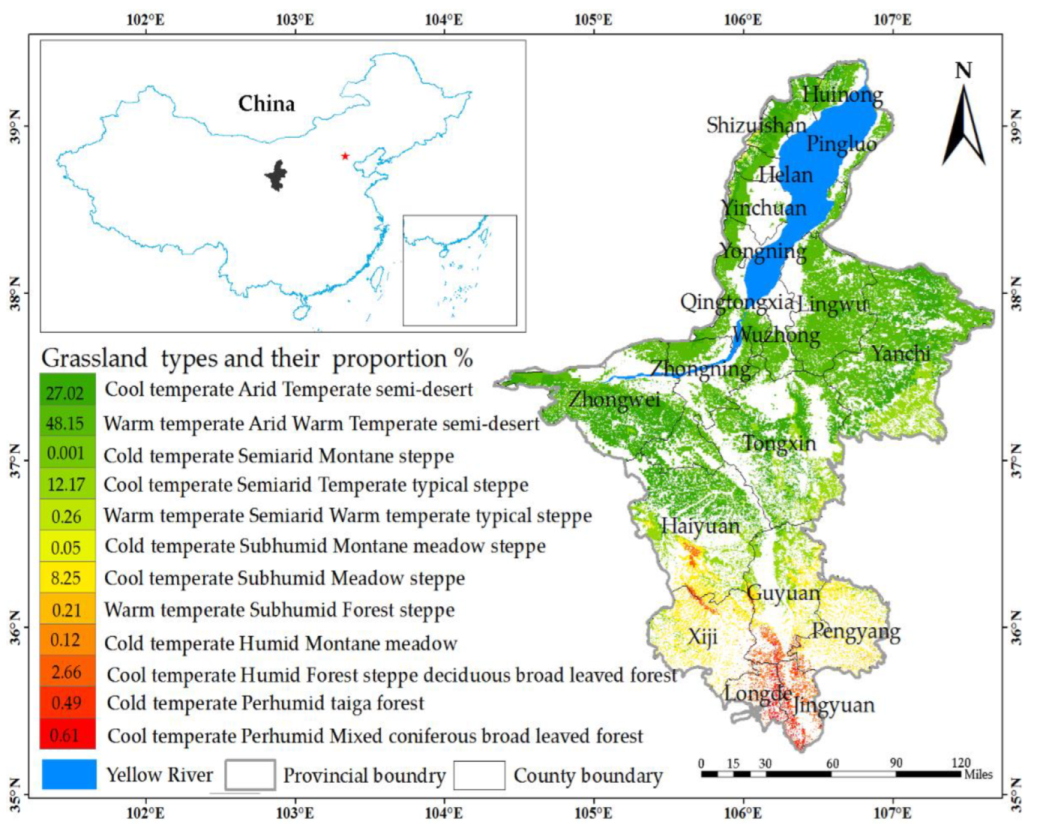
Figure 1. The first class of grassland in the Ningxia Hui Autonomous Region: a distribution diagram of the classes. Red star represent Beijing.
Sustainability 14 10404 g001
Figure 2. Temporal and spatial variation of grass NDVI in three periods (1988–2003, 2003–2018, and 1988–2018): (a) the annual variation; (b) seasonal variation; (c) monthly variation; (d) the spatial variation trend of NDVI and its proportion (p represents the p-value, Slop is the trend value).
Sustainability 14 10404 g002
Figure 3. (a) The grass cover types in three periods (1988–2003, 2003–2018, and 1988–2018); (b) the spatial distribution of cover transformation; (c) transition Sankey diagram of grass cover is a figure. Schemes follow the same formatting.
Sustainability 14 10404 g003
Figure 4. The factor detector results for spatial differentiation of NDVI in three periods.
Sustainability 14 10404 g004
Figure 5. (a,c,e) Interaction detector and ecological detector results for spatial differentiation of NDVI; (b,d,f) the risk detector for spatial differentiation of NDVI.
Sustainability 14 10404 g005
Figure 6. Temporal variation of climatic factors and predicted and residual values in three periods: (a) precipitation; (b) temperature; (c) predicted NDVI; (d) residual NDVI.
Sustainability 14 10404 g006
Figure 7. Response of grass NDVI to climate change and human activities in three periods: (a) the response of grass NDVI to climate change; (b) the response of grass NDVI to human activities (p represents the significance level, Slop is the trend value).
Sustainability 14 10404 g007
Figure 8. (a) Spatial distribution of grass NDVI changes caused by climate change and human activities; (b) the proportion of driving forces.
Sustainability 14 10404 g008
Figure 9. (a) The relative contribution of driving forces in the increased area to NDVI; (b) the relative contribution of driving forces in the decreased area to NDVI; (c) the average of the relative contributions.
Sustainability 14 10404 g009
Figure 10. (a) Hurst index of grass NDVI; (b) future dynamic trend in grass NDVI.
Sustainability 14 10404 g010
Table 1. The indicators of natural factors.
Factors
Types
Detector FactorsUnitAbbreviations
Climate factorsAverage annual wind speedm·s−1Wind
Average annual temperature°CTemp
Average annual precipitationmmPrec
Average annual potential evapotranspirationmmETp
Average annual downward shortwave radiationW·m−2RD
Snow depthmmSnowd
Surface factorsAspect°Aspect
Soil type-Soilt
Digital Elevation ModelmDem
Table 2. Identification criteria and contribution calculations of the drivers of grass NDVI change.
Slopeobs 1Driving ForcesPartition Relative Roles of CC 2 %Relative Roles of HA 2 %
Slopecli 1Sloperes 1
>0CC&HA>0>0Slopecli/SlopeobsSloperes/Slopeobs
CC>0<01000
HA<0>00100
<0CC&HA<0<0Slopecli/SlopeobsSloperes/Slopeobs
CC<0>00100
HA>0<01000
1 Slopecli, Sloperes, and Slopeobs denote the slopes of the predicted NDVI, residual NDVI, and observed NDVI, respectively. 2 CC represents climate change, and HA represents human activities.
Publisher’s Note: MDPI stays neutral with regard to jurisdictional claims in published maps and institutional affiliations.