Article

Spatio-Temporal Dynamics of Water Conservation Service of Ecosystems in the Zhejiang Greater Bay Area and Its Impact Factors Analysis

School of Economics and Management, Zhejiang Ocean University, Zhoushan 316022, China
*
Author to whom correspondence should be addressed.
Sustainability 2022, 14(16), 10392; https://doi.org/10.3390/su141610392
Submission received: 11 July 2022 / Revised: 9 August 2022 / Accepted: 14 August 2022 / Published: 21 August 2022

Abstract

:
The Zhejiang Greater Bay Area (ZGBA) is the main functional area of water conservation in Zhejiang Province, China. It has 44.2% of the ecological red line area of Zhejiang Province. There are many mountains, plains, water systems, and tidal flat resources. It is an essential ecological barrier in the water supply area of the Hang-Jia-Hu area and the northern Zhejiang area. This paper aimed to clarify the water conservation services and influencing factors in the ZGBA, so as to provide reference and policy inspiration for local improvement of water resources. Based on the improved water balance method, the temporal and spatial dynamic changes of water conservation in the ZGBA from 2000 to 2019 were estimated, the impact of climate and land use and land cover change on water conservation was assessed, and geographic detectors were employed to explore the main influencing factors of water conservation. The following results can be summarized from this research: (1) The water conservation level of the ZGBA is relatively high and the water conservation amount showed a phased upward trend from 2000 to 2019; (2) The main reason for the significant increase in the level of water conservation from 2010 to 2019 was the increase in precipitation by 11% in the next 10 years compared with the previous 10 years, and land use exerted a low negative impact on water conservation; (3) Precipitation and evapotranspiration were the main single-factor influencing factors on water conservation, and the interactions between precipitation and vegetation/terrain were the main multi-factor influencing factors on water conservation.

1. Introduction

Water conservation is the redistribution of precipitation by the ecosystem through the vegetation canopy, litter layer and soil layer to effectively conserve water sources. It is one of the crucial ecological service functions of the ecosystem [1,2]. At the same time, it is indispensable in the regulation of water flow and water cycle to intercept precipitation, regulate and moderate seasonal fluctuations in runoff and river flow, increase available water resources, and ensure water quality [3,4]. What is more, it is a critical indicator of the status of the regional ecosystem and an essential reference indicator for the construction of ecological protection red line areas [5].
The water conservation function of the ecosystem presents the characteristics of temporal and spatial dynamic changes closely related to the ecological structure and ecological function [6]. Some researchers have studied grassland [7,8], forest [9,10,11], wetland [12,13], farmland [14], and other types of ecosystems, as well as plateau [15,16], mountain [17], hill [18,19], and other regions. The differences in ecosystem functions are reflected in different types and regions, laying a foundation for the regional management and formulation of ecosystems [20]. The targeted scope of the research area is currently insufficient, and the regional research is limited with a focus on the inland areas, and the coastal area is less researched. Moreover, the research results have certain adaptability owing to the geographical limitations of water conservation. Due to the differences in geographical and ecological structures, the reference value is lower than that in coastal areas [21].
Water conservation involves the intersection of ecology and hydrology, with complex composition, lack of completeness and systematicness in functional definition, and undefined research objects and scale characteristics of calculation methods [22]. Researchers have adopted different methods based on related concepts, with ambiguous definitions and different degrees of ignoring the natural conditions and socio-economic characteristics of the study area, resulting in some flaws in the results [9,23]. The methods for measuring water conservation mainly consist of the water balance method [24], the precipitation storage method [25], and the comprehensive water storage method [26]. The result obtained by the precipitation storage method is the relative value of the bare land, instead of the absolute value of its area [27]. The comprehensive water storage method has values and regional restrictions. When calculating the water-holding capacity of litter, the maximum water-holding capacity of the litter is taken, and the natural water-holding capacity is not considered, which leads to an increase in error, and evapotranspiration and runoff are also ignored. The area is suitable for forest ecosystems, and other ecosystems have limitations in using this method [27,28]. Besides, some calculation methods such as the underground runoff method, annual runoff method, canopy interception method, and soil water storage method [22,29] are deficient in the consideration of the relevant factors, which lead to large errors.
Regarding regional problems, the Zhejiang Greater Bay Area (ZGBA), which has many islands, a long coastline, and is close to the East China Sea, is selected in this paper to improve the data reference of coastal areas. The research method adopts the water balance method, which is closer to the water conservation theory, and this method can fully reflect the regional precipitation distribution under the comprehensive consideration of meteorological, soil, runoff and other factors. From the perspective of investigating the mechanism of water conservation, the improved water balance method is employed to more accurately calculate water conservation [21]. The temporal and spatial variation characteristics of water conservation from 2000 to 2019 were quantitatively analyzed using the water balance method and the InVEST model. Meanwhile, the current status of the water conservation function in the ZGBA was evaluated. Additionally, the influence of climate and land use and land cover change (LUCC) on the change of water conservation was explored with the control variable method, contributing to further revealing the influence of meteorology, soil, terrain, human activities, and multi-factor synergy on water conservation through the geographic detector. This lays a foundation for restoration and rational allocation of water resources. According to The Ecological Conservation Redlines [30], the importance of water conservation capacity was classified and divided. Hence, corresponding measures were taken under different ecological service levels according to local conditions in the process of formulating relevant regional economic development policies. It is of great strategic significance for the green and high-quality development of the ZGBA. Furthermore, the calculation of runoff in the water conservation calculation method provides relevant ideas and references for areas lacking hydrological data.

2. Materials and Methods

2.1. Study Area

The ZGBA is located in the subtropical zone, covers an area of 66,227.2 km2 and belongs to the subtropical monsoon climate, with a mild and humid climate and four distinct seasons. The latitude and longitude ranges are 27°02′–31°11′ N and 118°21′–123°10′ E, respectively. The frost-free period in this area is 8–9 months, the annual average temperature is 17 °C, and the precipitation is seasonally distributed. The average annual precipitation is 1319.7 mm, with abundant precipitation and water resources. Spring rain, plum rain, and typhoon rain are the main seasons, and there are droughts in July and August. The primary vegetation types contain coniferous forest, broad-leaved forest, mixed coniferous and broad-leaved forest, and cultivated plants. The terrain slopes from southwest to northeast, the mountains are concentrated in the southwest, and the middle is a hilly basin. The northeast is located in the alluvial plain of the middle and lower reaches of the Yangtze River. The area is flat with a dense river network, fertile soil, sufficient water resources, high yield of food crops, and relatively developed agriculture. The ZGBA’s total population is 52,733,325 in the seventh census. Its population density is large, and human activities are frequent. The ZGBA includes “One Ring, One Belt, and One Channel”, namely the Hangzhou Bay Economic Zone, the Yongtaiwen Port-adjacent industrial belt, and the Yiyongzhou Open Channel, covering Hangzhou, Ningbo, Wenzhou, Huzhou, Jiaxing, Shaoxing, Zhoushan, and Taizhou. It possesses strong economic strength and a high level of urbanization and is located at the T-shaped intersection hub where the “Belt and Road” and the Yangtze River Economic Belt are integrated (Figure 1). The geographical position is superior, plays a role in the evacuation of Shanghai’s population, industries, and urban functions, and has great development potential.

2.2. Data Sources

The digital elevation model (DEM) with a resolution of 30 m came from the Geospatial Data Cloud website (http://www.Gscloud.cn (accessed on 10 March 2022).). The LUCC data with the five years of 2000, 2005, 2010, 2015, and 2019 came from the Resource and Environmental Science Data Center of the Chinese Academy of Sciences (https://www.resdc.cn/ (accessed on 10 March 2022).). Soil data with a soil absolute depth of 200 m (the depth from the surface to the rock layer) came from ISRIC (https://data.isric.org/ (accessed on 11 March 2022).). Plant available water with the 200 m of available soil water capacity (volume fraction) until the point of wilting came from ISRIC (https://data.isric.org/ (accessed on 14 March 2022).). The meteorological data with the monthly precipitation data and monthly evapotranspiration from 2000 to 2019 came from the National Earth System Science Data Center (http://www.geodata.cn (accessed on 14 March 2022).). The watershed data with the Class I watershed came from the Chinese Academy of Sciences Resource and Environmental Science Data Center (https://www.resdc.cn/ (accessed on 15 March 2022).). NDVI, POP, and GDP data came from the Chinese Academy of Sciences Resource and Environmental Science Data Center (https://www.resdc.cn/ (accessed on 15 March 2022).). The runoff coefficients of different underlying surfaces came from the runoff coefficient table of Code for Design of Highway Drainage [31]. The evapotranspiration coefficient and root depth in the InVEST model came from the reference model guidebook and related literature [32,33,34]. Details are listed in Table 1.

2.3. Water Balance Model

Water conservation is the redistribution of precipitation through the retention of precipitation in ecosystems, soil water storage, and runoff interception [36,37]. Considering the actual situation of the ZGBA, the water balance method, whose principle is the balance of water input and output, was adopted in this paper. The water yield of the area was estimated by the InVEST model, and the runoff was derived from the runoff coefficient table. Water conservation was precipitation minus evapotranspiration from vegetation, soil, and other consumption such as surface runoff. The specific formula is [38]:
Q wr = P AET R
where Q wr denotes the water conservation in the area (mm); P represents the annual precipitation in the study area (mm); AET indicates the actual evapotranspiration in the study area (mm); R signifies the surface runoff (mm).
The principle of the InVEST model defines the water yield of each grid cell as the amount of water remaining after deducting evapotranspiration (including plant transpiration and surface evaporation) from the precipitation within the grid range. The model does not distinguish between surface, subsurface, and baseflow. It assumes that all the water yield of each grid cell reaches the outlet of the watershed through surface runoff or underground runoff, and the water yield of each grid is finally summed or averaged at the sub-watershed scale. The calculation method is expressed as [16,34]:
Y = ( 1 AET P ) P
where Y represents the annual water yield (mm) in the area; P indicates the precipitation in the area; AET indicates the actual evaporation (mm) in the area. The calculation method is also written as [39]:
AET P = 1 + PET P [ ( 1 + PET P ) w ] 1 w
where PET indicates the potential evapotranspiration (mm) of the soil properties in the area and is affected by factors such as climate and vegetation; w denotes a dimensionless empirical parameter proposed by Donohue et al. (2012) [40] to represent soil properties, expressed as Linear function [32,40]:
PET P = K ET P
W = Z AWC P + 1.25
where K refers to the evapotranspiration coefficient; ET denotes the evapotranspiration (mm) of the ground covered by specific short plants under the condition that the soil is kept sufficiently moist; Z represents the seasonal characteristic of precipitation (the value is between 1–10). Specifically, if the precipitation is mainly concentrated in winter, the value is 10; if the precipitation is concentrated in summer or evenly distributed, the value is 1. It is obtained by repeated verification and calculation according to related literature and site measurement values. AWC is the effective water available to plants and is influenced by soil depth and characteristic. The calculation formula is [15]:
AWC = Min ( Max   Soil   Depth ,   Root   Depth ) PAWC
PAWC = 54.509 0.132 S   and 0.003 ( Sand ) 2 0.055 Silt 0.006 ( Silt ) 2 0.738 Clay 0.007 ( Clay ) 2 2.688 OM + 0.501 ( OM ) 2
Among them, Max   Soil   Depth indicates the maximum soil depth (mm); Root   depth denotes the root depth (mm); PAWC represents the water available to plants (mm), which can be calculated according to the physical and chemical properties of the soil; Sand signifies the soil sand content (%); Silt is the soil silt content (%); Clay refers to the soil clay content (%); OM designates the soil organic matter content (%).
The runoff is obtained from the precipitation and the runoff coefficient, and the calculation formula is [38]:
R = u P  
where u is the runoff coefficient. According to the literature [31], the runoff coefficients of different underlying surfaces were obtained. The average value was obtained [41] after different underlying surfaces were reclassified (Table 2).

2.4. Slope Trend Test

Slope trend analysis is a linear regression analysis used to obtain trend changes in time series. Taking time as the independent variable and the water conservation amount as the dependent variable, the slope of the interannual variation of water conservation is calculated pixel by pixel, which can reflect the spatial trend of the study area [16]. When the slope is positive, water conservation shows an increasing trend, and when the slope is negative, water conservation shows a decreasing trend. Larger values indicate faster changes. The slope is calculated as follow [42]:
Q slope = n i = 1 n ( i Q i ) i = 1 n Q i i = 1 n i n i = 1 n i 2 ( i = 1 n i ) 2
The i is the number of the year (i = 1, 2, 3, …, n), and Q i is the amount of water conservation corresponding to the ith year (mm).

2.5. Contribution Rate of Climate and LUCC to Changes in Water Conservation

The control variable method was adopted to explore the influence of climate and LUCC on changes in water conservation. The principle was to fix a single layer of climate or LUCC for exploring the impact of another layer on water conservation. In this paper, 2000–2009 was taken as the base period, and 2010–2019 was taken as the change period. During the process of exploring climate impacts, land use data were used in the base period of 2005, and 10-year average climate data were utilized for the changing period. When exploring the impact of LUCC, the researchers adopted the 10-year average climate in the base period and the LUCC in 2015 in the change period. The formula is [43,44,45]:
Δ W 0 = mean Δ W the   change   period mean Δ W the   base   period
Δ W 1 = mean Δ W Control   land   use   unchanged mean Δ W the   base   period
Δ W 2 = mean Δ W Control   the   climate   remains   unchanged mean Δ W the   base   period  
K i = Δ W i Δ W 0
where Δ W 0 denotes the change of water conservation in the base period and the change period due to the combined action of two factors; Δ W 1 represents the change in water conservation caused by climate change; Δ W 2 indicates the change in water conservation caused by LUCC; K i is the contribution rate of changes in different factors to changes in water conservation.

2.6. Geodetector

By determining whether the degree of influence of the independent variable on the dependent variable is proportional to the spatial distribution, the geographic detector was employed to explore the explanatory power of climate factors and human activity factors on the spatial differentiation of water conservation and the impact of the interaction of various influencing factors on water conservation [46]. The expression is:
q = 1 h = 1 L N h σ h 2 N σ 2 = 1 SSW SST
SSW = h L N h σ h 2 SST = N σ 2
The q value is a measure of the explanatory degree of the influence factors on the spatial differentiation of water conservation; h represents the stratification of water conservation or influence factors; N h indicates the number of units in the h layer; N denotes the number of units in the whole layer; σ h 2 signifies the variance sum of the water conservation in the h layer; σ 2 designates the variance sum of the whole-layer water conservation; SSW refers to the intra-layer variance sum;   SST is the whole-layer variance sum.

3. Results

3.1. The InVEST Model Validation

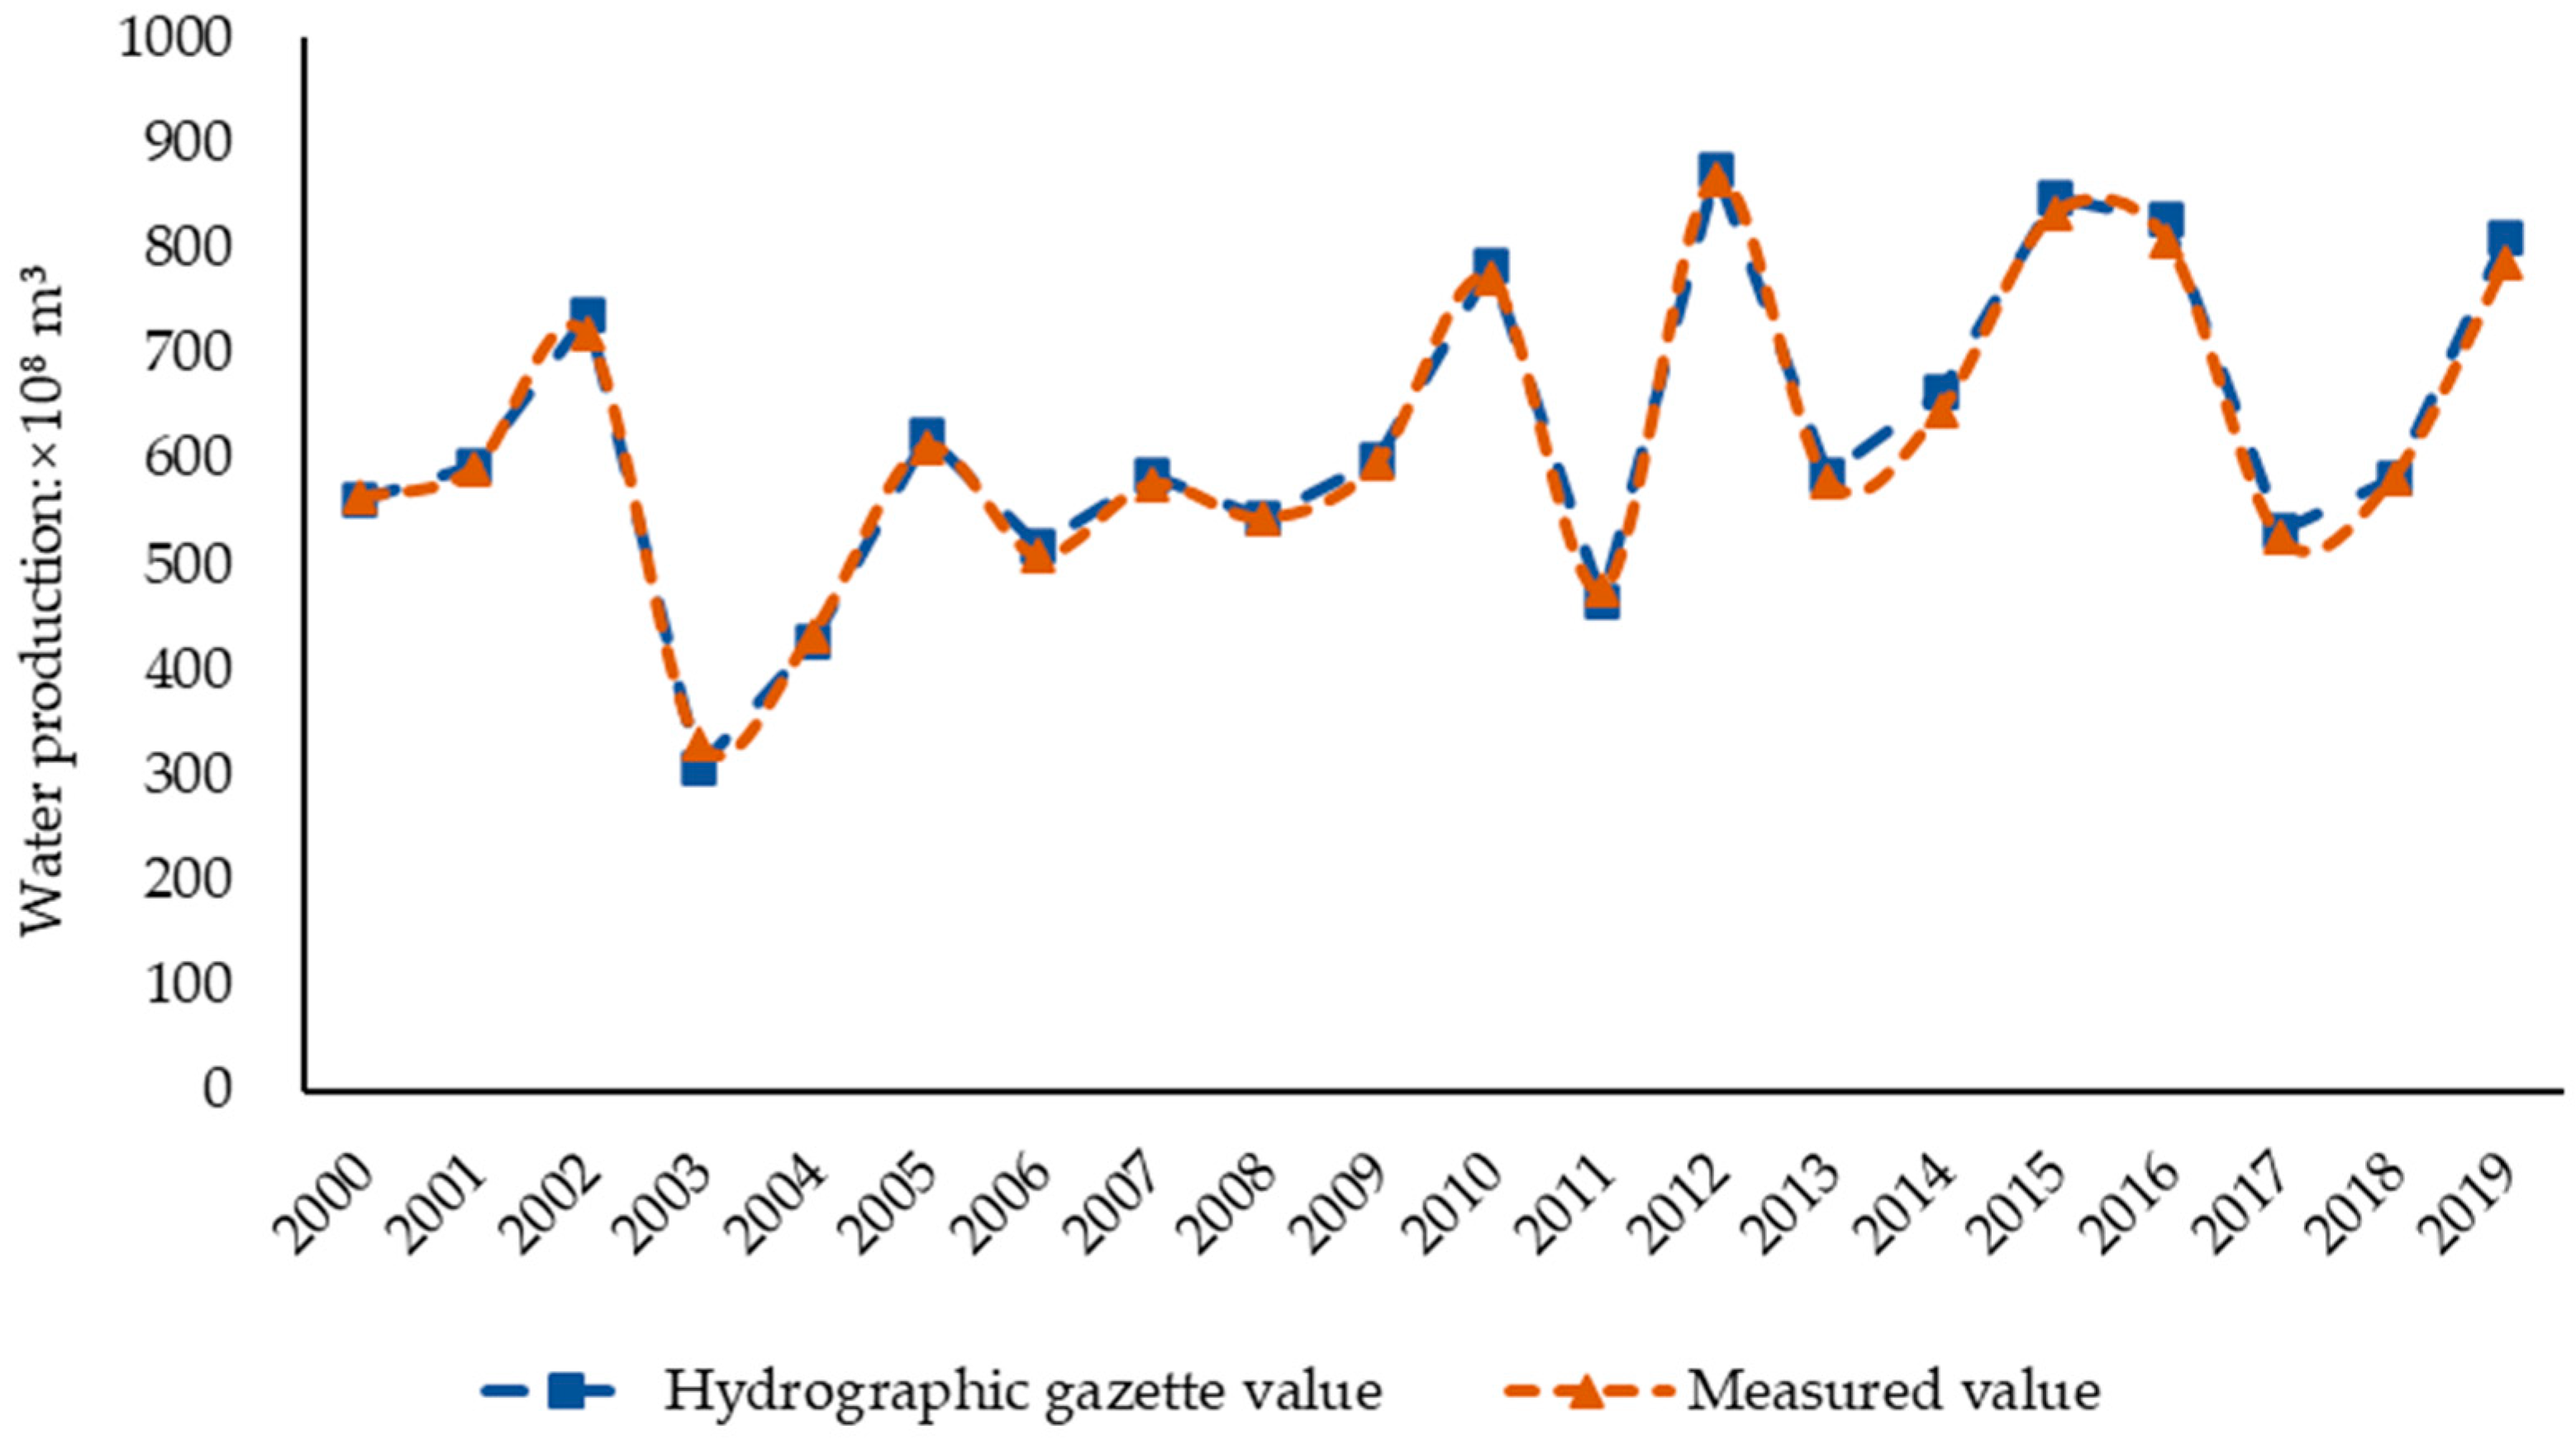
The water yield includes meteorological, soil, and other factors in the model, and the soil property W is affected by the Z value. After other data were determined, the range of Z value variation was selected, and the value was adjusted within the relevant range. Then, the fitting degree was evaluated by testing the results obtained and the total amount of water resources in the water resources bulletin issued by Zhejiang Hydrology [2,20]. The final multi-year mean value of Z was 6.1, which is a little smaller than that of Wang [35] and Li [47], while the order of magnitude was the same. The relative error between the water yield in the inspection results and the total water resources in the bulletin was about 2% (Figure 2) and less error and thus the water yield calculated by the InVEST model had certain reliability.

3.2. Temporal and Spatial Dynamics of Climate and LUCC

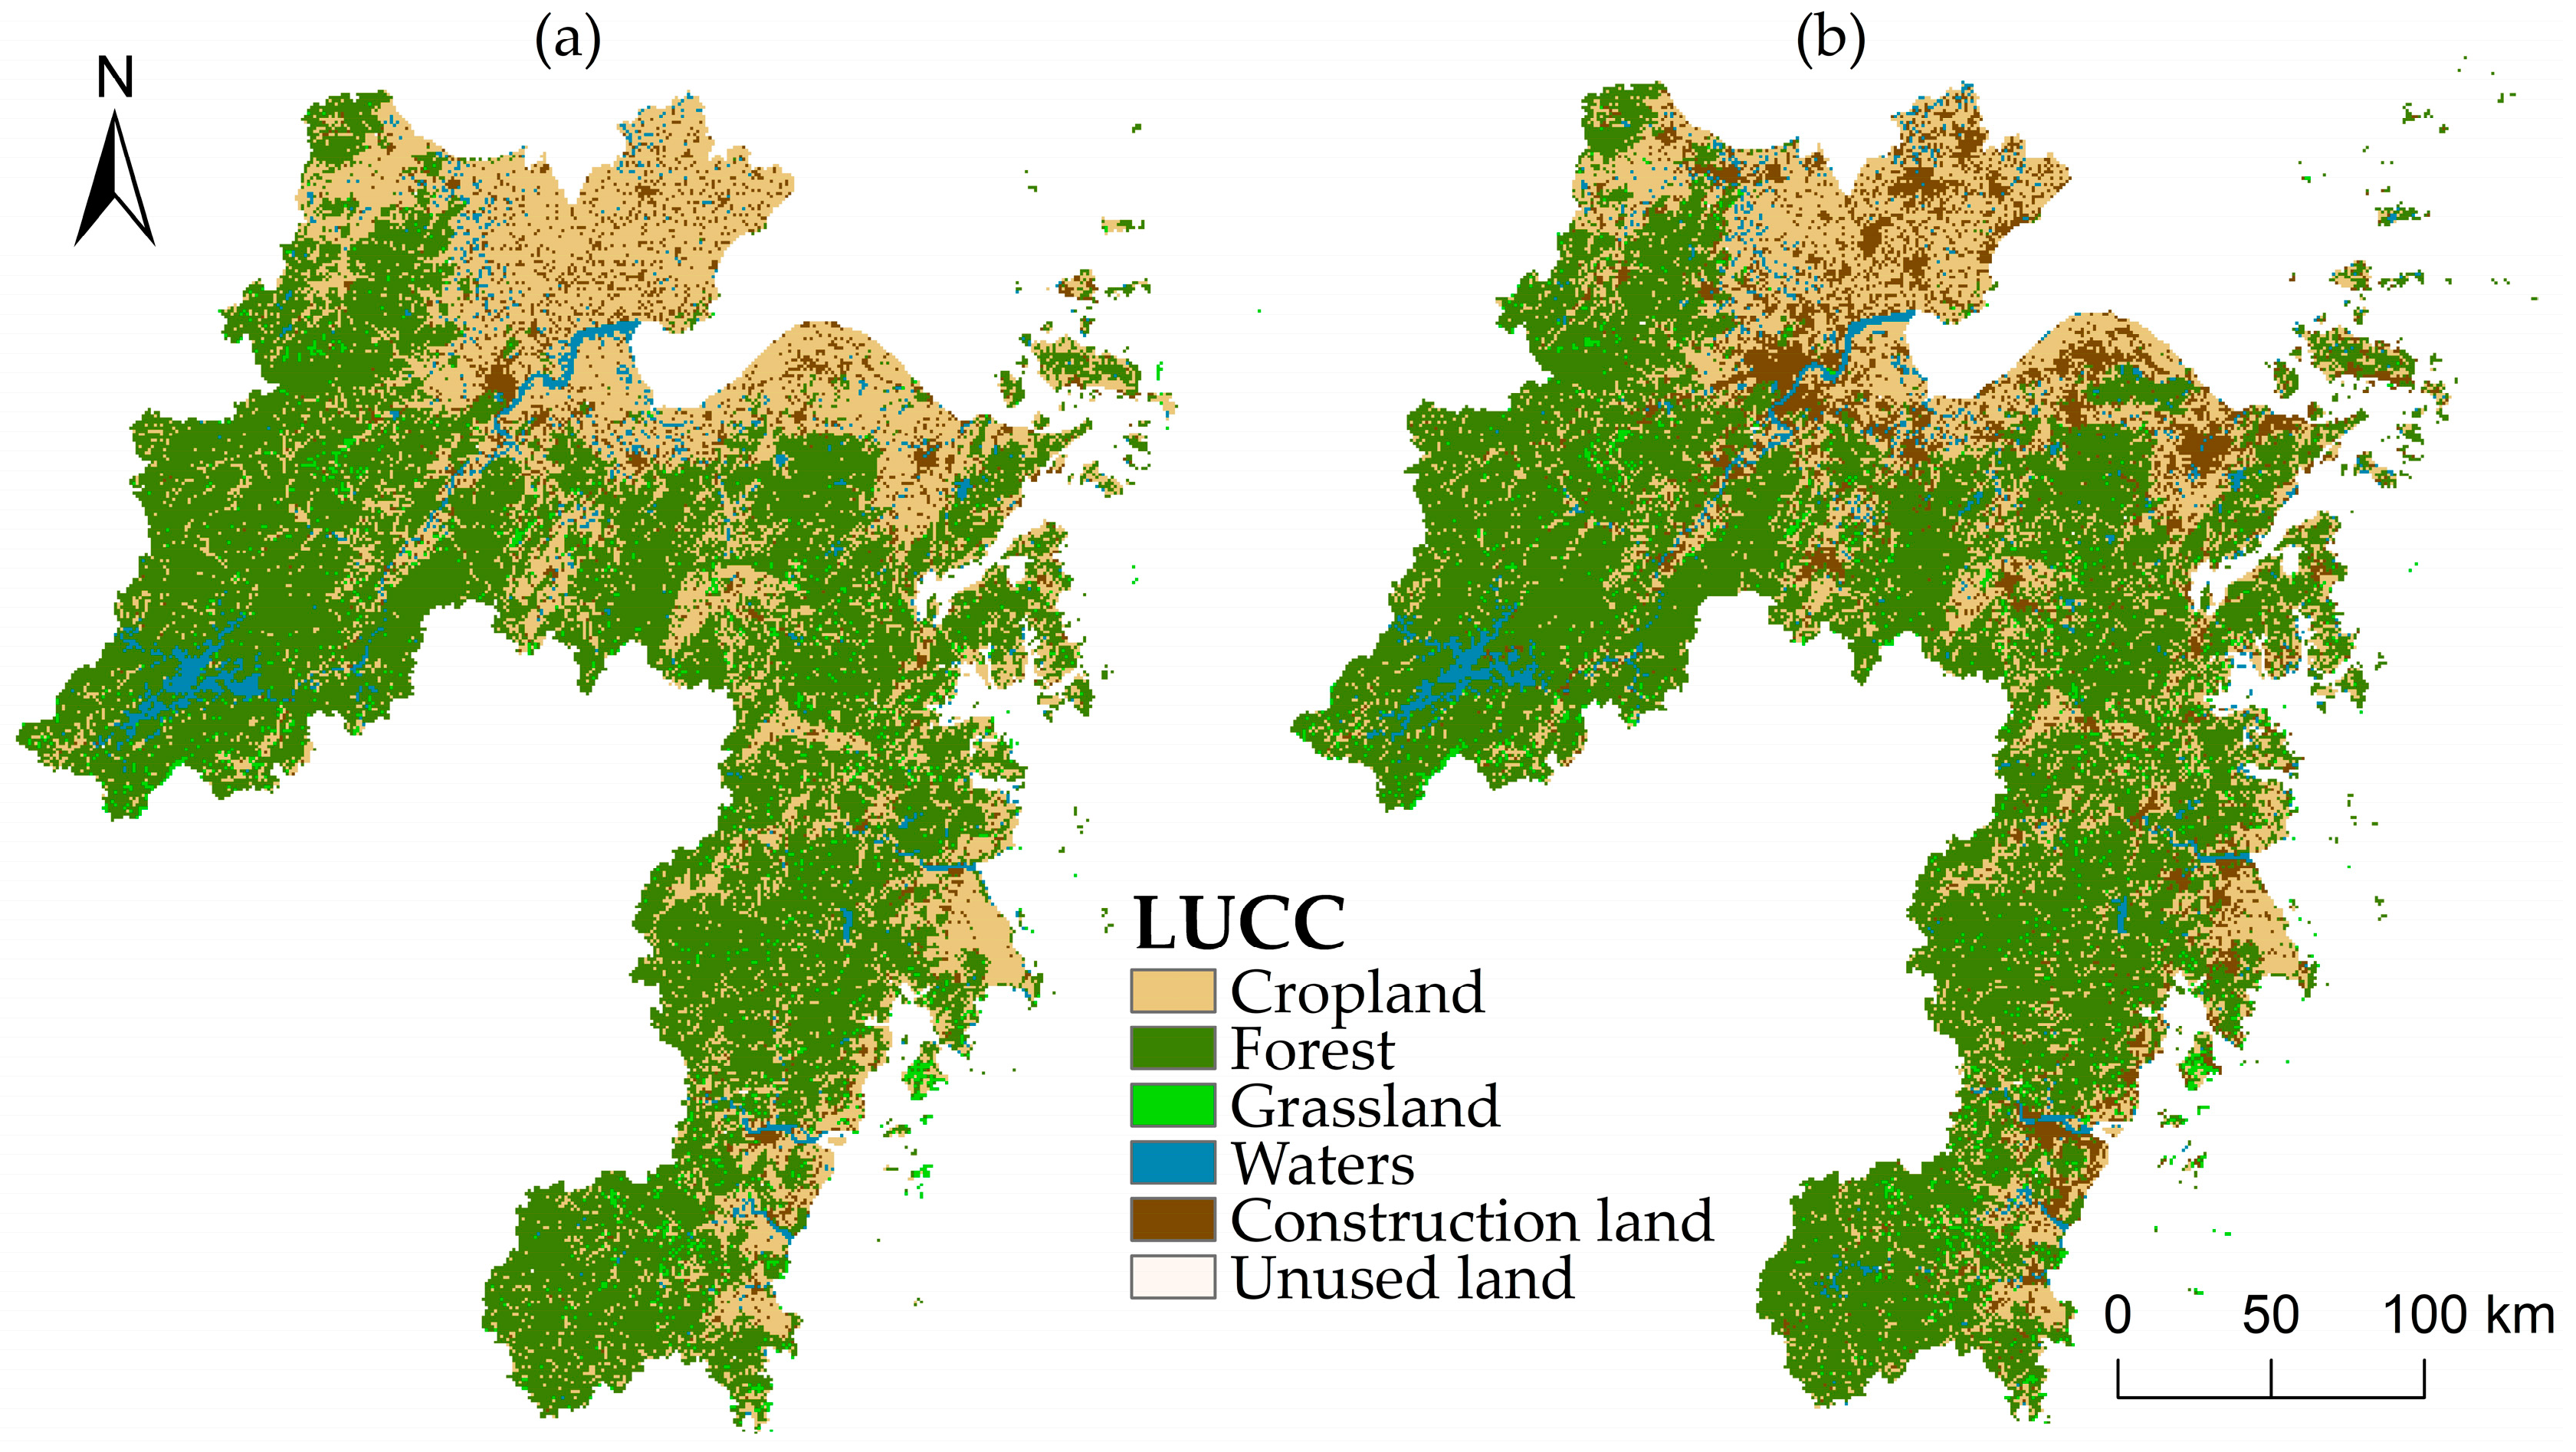
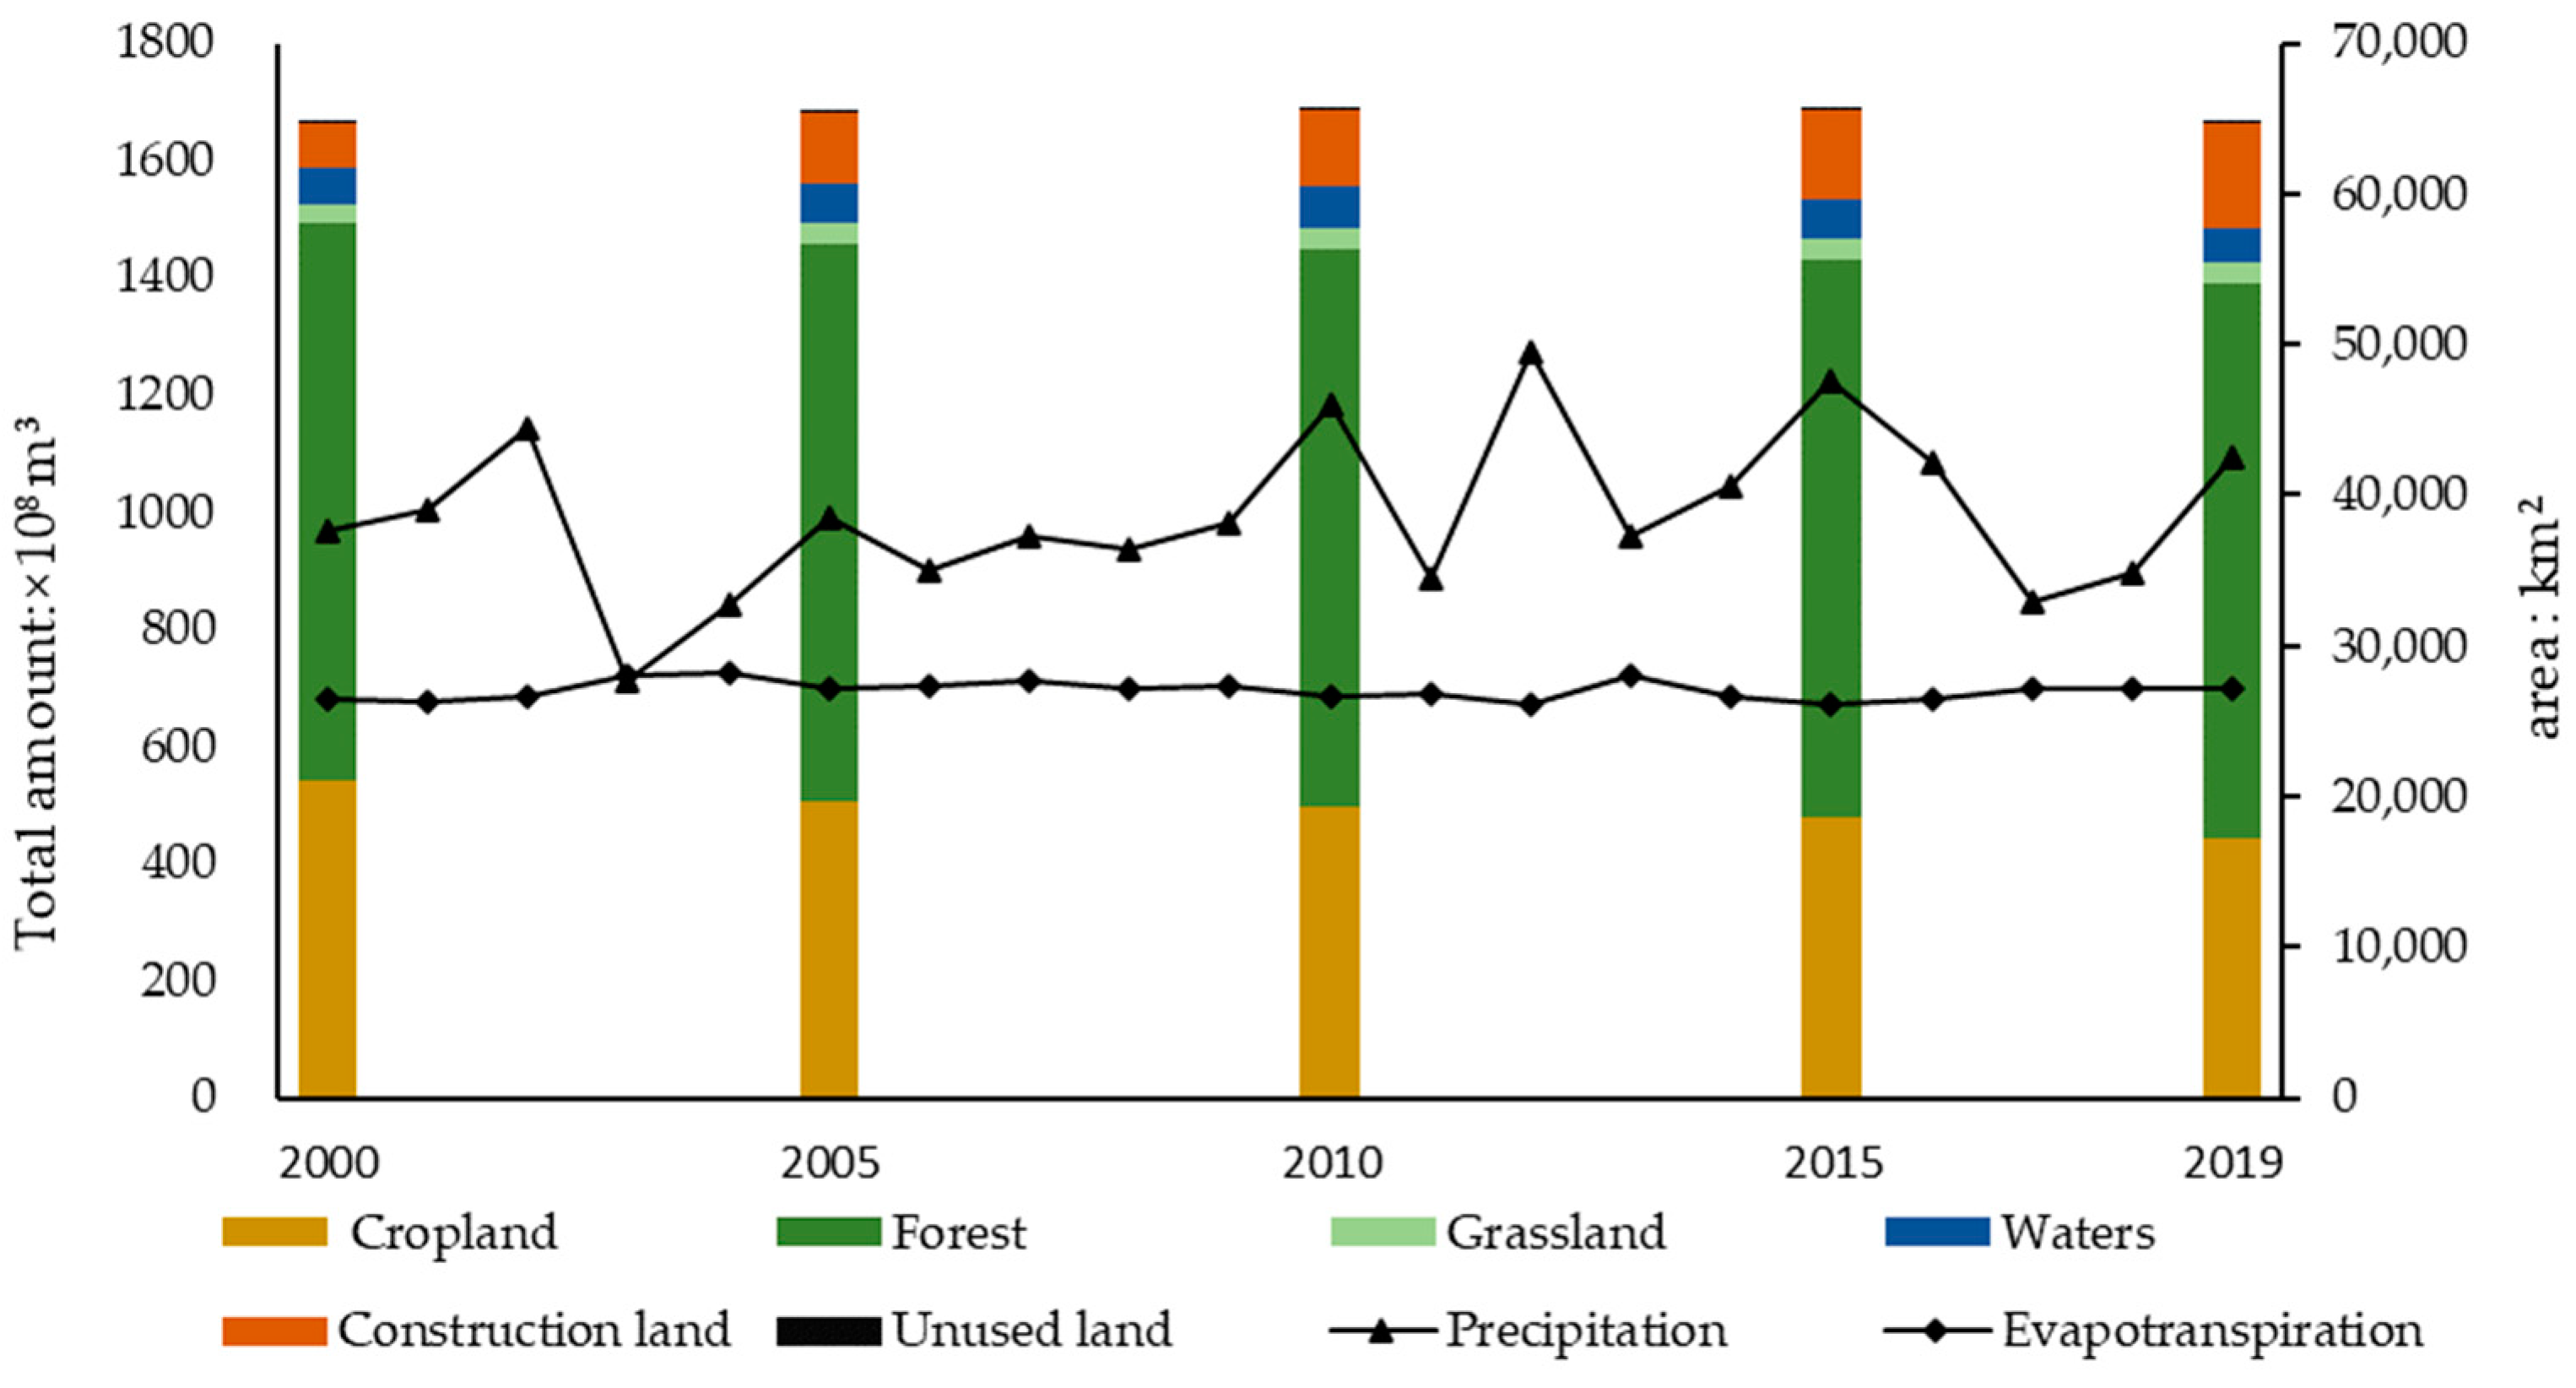
The ZGBA is located in the Wuyi Mountains, with hills and mountains as the main terrain. Its land use is mainly forest land (36,780 km2) in the southwest, cropland (17,305 km2) in the middle and lower reaches of the Yangtze River, and construction land (6897 km2) along the coastal waters. The grassland is only 1372 km2. The area of cropland changed the most from 2000 to 2019 (Figure 3 and Figure 4), decreasing year by year (with a decrease of 3766 km2 in 20 years: decreasing by 17.87%). Among the areas with reduced cropland, the largest ones had been turned to construction land (Table 3), and the converted area was 4213.14 km2, accounting for 44.35% of the reduced cropland area, followed by the conversion to the forest, with a converted area of 4414 km2, accounting for 46.46% of the reduced cropland area. The forest area slightly fluctuated at 37,000 km2, with little change overall. Since 2000, China has been in a period of rapid economic growth. The state has boosted investment in infrastructure construction, continuously improved the level of urbanization, and rapidly expanded the construction land from 2000 to 2019. Only from 2000 to 2005, Construction land area in the ZGBA increased by 1740 km2, with an expansion of 58.47%. By 2019, the area of construction land increased to 6897 km2, with an increase of 3921 km2, more than double that of 2000. Main sources of area increase were cropland (accounting for 61.1% of the increase in construction land) and forest land (accounting for 12.4% of the increase in construction land).
From 2000 to 2019, the total precipitation in the ZGBA fluctuated around 1000 × 108 m3. After 2010, the total precipitation reached a high value many times and significantly fluctuated. Compared with 2000–2009, the average precipitation depth from 2010 to 2019 was 167.55 mm higher, the average total precipitation was 105.22 × 10⁸ m3 higher, and the precipitation level increased by 11%. The average precipitation depth for 20 years was generally above 1400 mm. The area above 1600 mm accounted for 48.68%, mainly distributed in the coastal hilly plains, the alluvial plains around Hangzhou Bay, and the southwest of Qiandao Lake. The evapotranspiration remained stable in the past 20 years, presenting a small fluctuation range. The higher values were primarily distributed in the mountains and hills and the northern Zhejiang plain.

3.3. Temporal and Spatial Dynamic Changes of Water Conservation

The total amount of water conservation in the ZGBA was between 57.43 × 10⁸–334.69 × 10 8 m3 from 2000 to 2019, exhibiting a large changing range (Table 4). Among them, the minimum three years for total amount of water conservation were 2003 (57.43 × 10⁸ m3), 2004 (79.89 × 10⁸ m3), and 2011 (97.26 × 10⁸ m3), and their values were all lower than 100 × 108 m3. Affected by the extreme weather in the south in 2003, the total amount of water conservation was abnormally low. There was flood in the north and drought in the south during this year. The precipitation in the south was the least from 1961 to 2019, and the temperature was high. Water conservation had demonstrated the lowest levels from 2000 to 2019. The maximum three years for total amount of water conservation were 2016 (334.69 × 10⁸ m3), 2019 (309.02 × 10⁸ m3), 2015 (303.44 × 10⁸ m3), and their values were all higher than 300 × 108 m3. Before 2009, the total amount of water conservation for many years was 100–200 × 108 m3, and more than 200 × 108 m3 were only 234.11 × 10⁸ m3 in 2002. After 2009, the total amount of water conservation was mainly 250–350 × 108 m3. It generally presents an increasing order. The water conservation per unit of the ZGBA was between 94.6–554.82 mm, and the area of more than 300 mm accounted for between 3.78%–83.58% during the period of 2010–2019. The phenomenon of 2010–2019 higher than 2000–2009 also appears for the water conservation ability. In the first 10 years, the average water conservation capacity was 245.24 mm, the average area of high-level conservation areas (water conservation per unit area > 300 mm) accounted for 31.15%; the average water conservation capacity of the next 10 years was 382.87 mm, and the average area of high-level conservation areas accounted for 54.08%. Overall, the level of water conservation in 2010–2019 was significantly higher than that in 2000–2009.
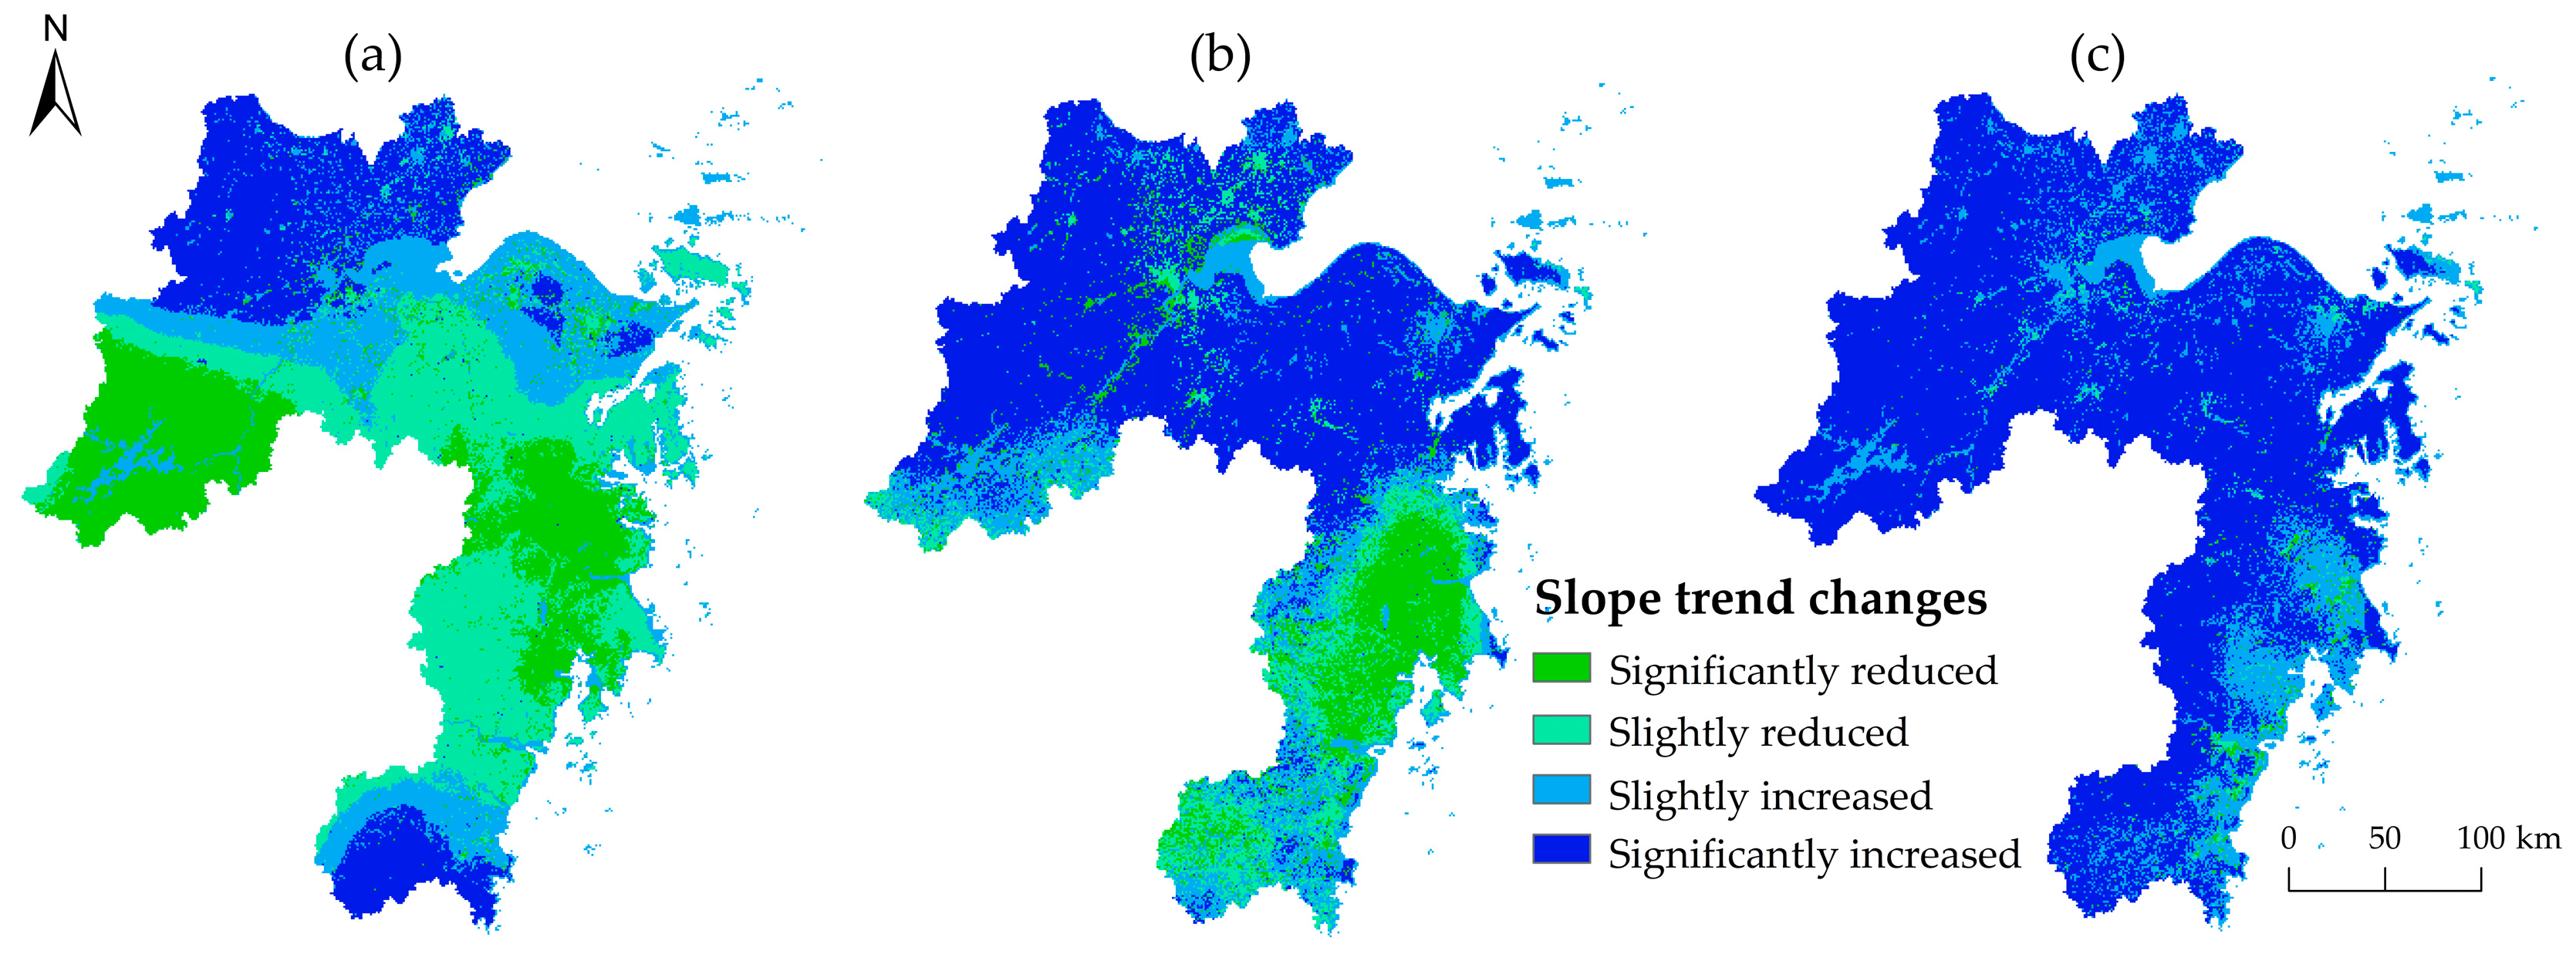
Based on the water conservation data from 2000 to 2019, the 20-year change trend of water conservation was observed through the slope trend, and the natural interval method was used to divide the study area into a significant decrease (<−5), a slight decrease (−5–0), a slight increase (0–5), and a significant increase (>5) (Figure 5). It was found that the area with 96.97% of water conservation in the ZGBA showed an increasing trend in the past 20 years, of which the area with slight increase was 21.46%, and the area with significant increase was 75.51%; the area with 3.03% showed a water conservation decreasing trend, of which the area with slight decrease was 1.11% and the area with significant increase was 1.62%. In terms of stages, Figure 5 shows that the change of water conservation in the ZGBA from 2000 to 2009 showed an increase-decrease-increase distribution pattern from north to south. The area showing a water conservation decreasing trend was 35,647 km2, accounting for 53.84%, showing an increasing trend area was 30,557 km2, accounting for 46.16%. From 2010 to 2019, the change of water conservation showed an increasing–decreasing and north–south differentiation pattern. The area showing an increasing trend was 49,398 km2 and the area expanded by 61.65% compared with the previous 10 years. From the overall results, affected by the main factors of increased rainfall, the change of water conservation in the ZGBA showed an increasing trend and a rapid increase in most areas from 2000 to 2019. Only a small part of the surrounding Hangzhou Bay and its coastal hilly areas showed a slow increase in water conservation. However, the decreasing trend was only sporadically distributed in a few coastal hills and plains.
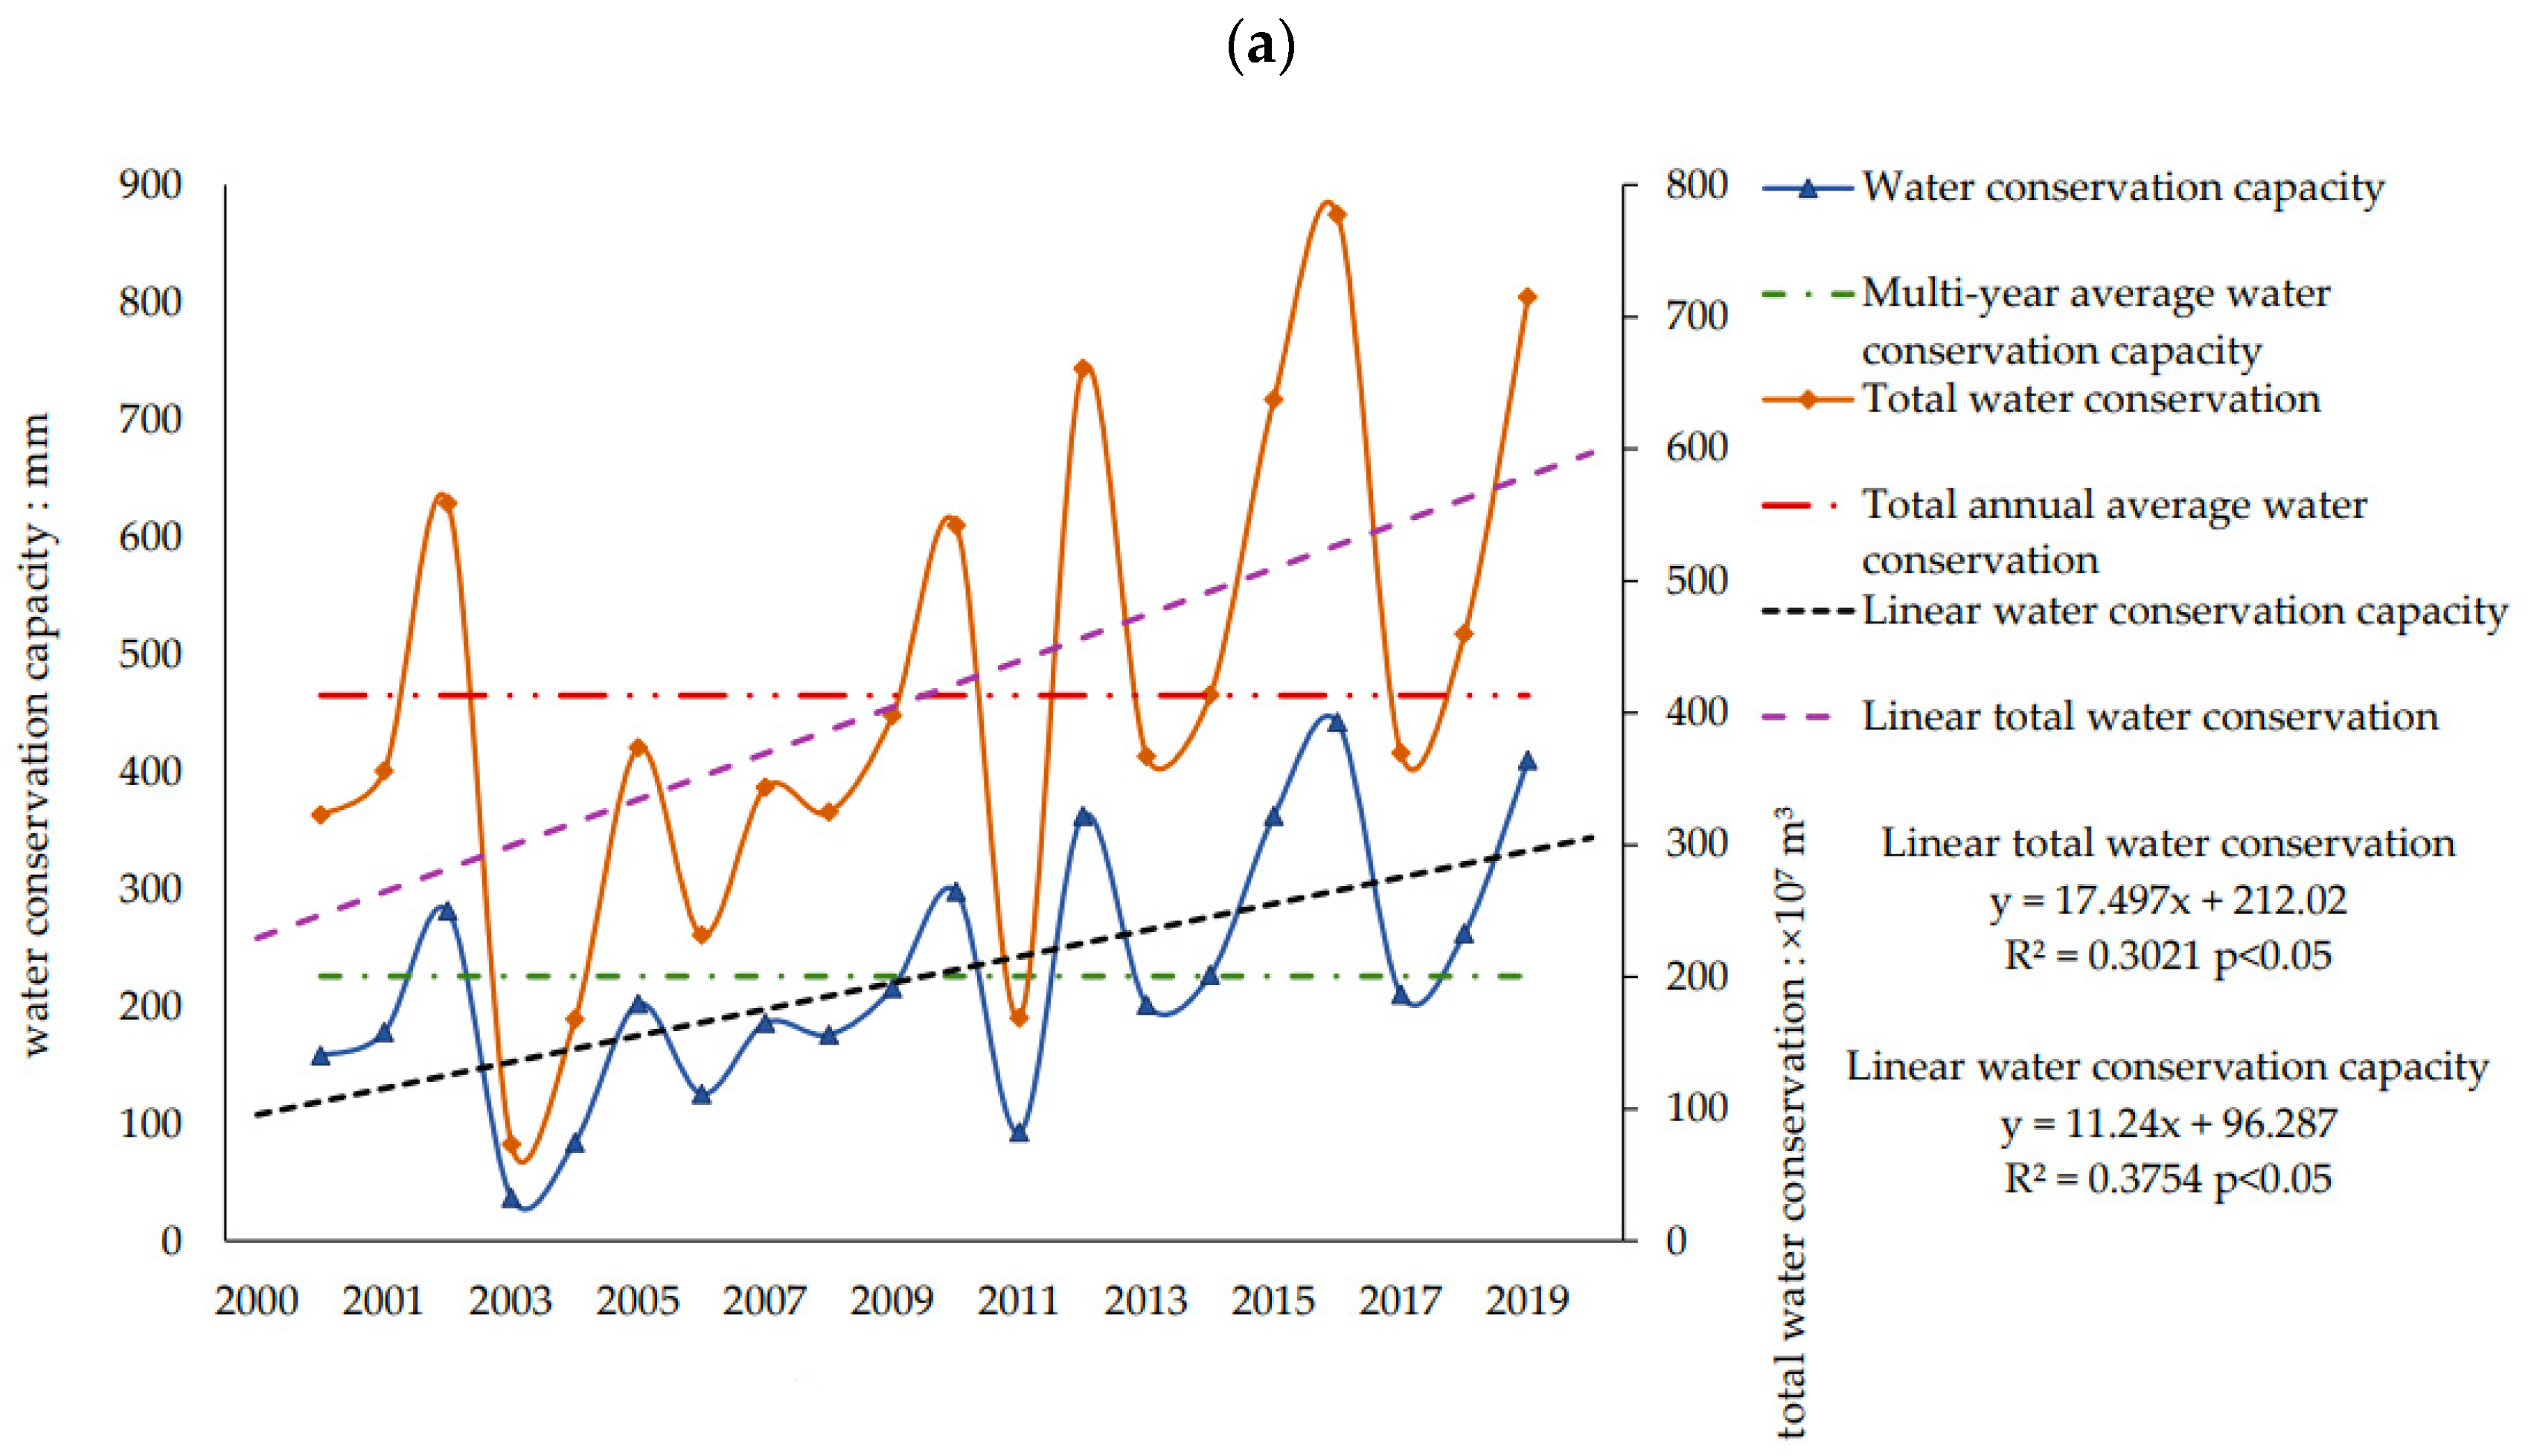
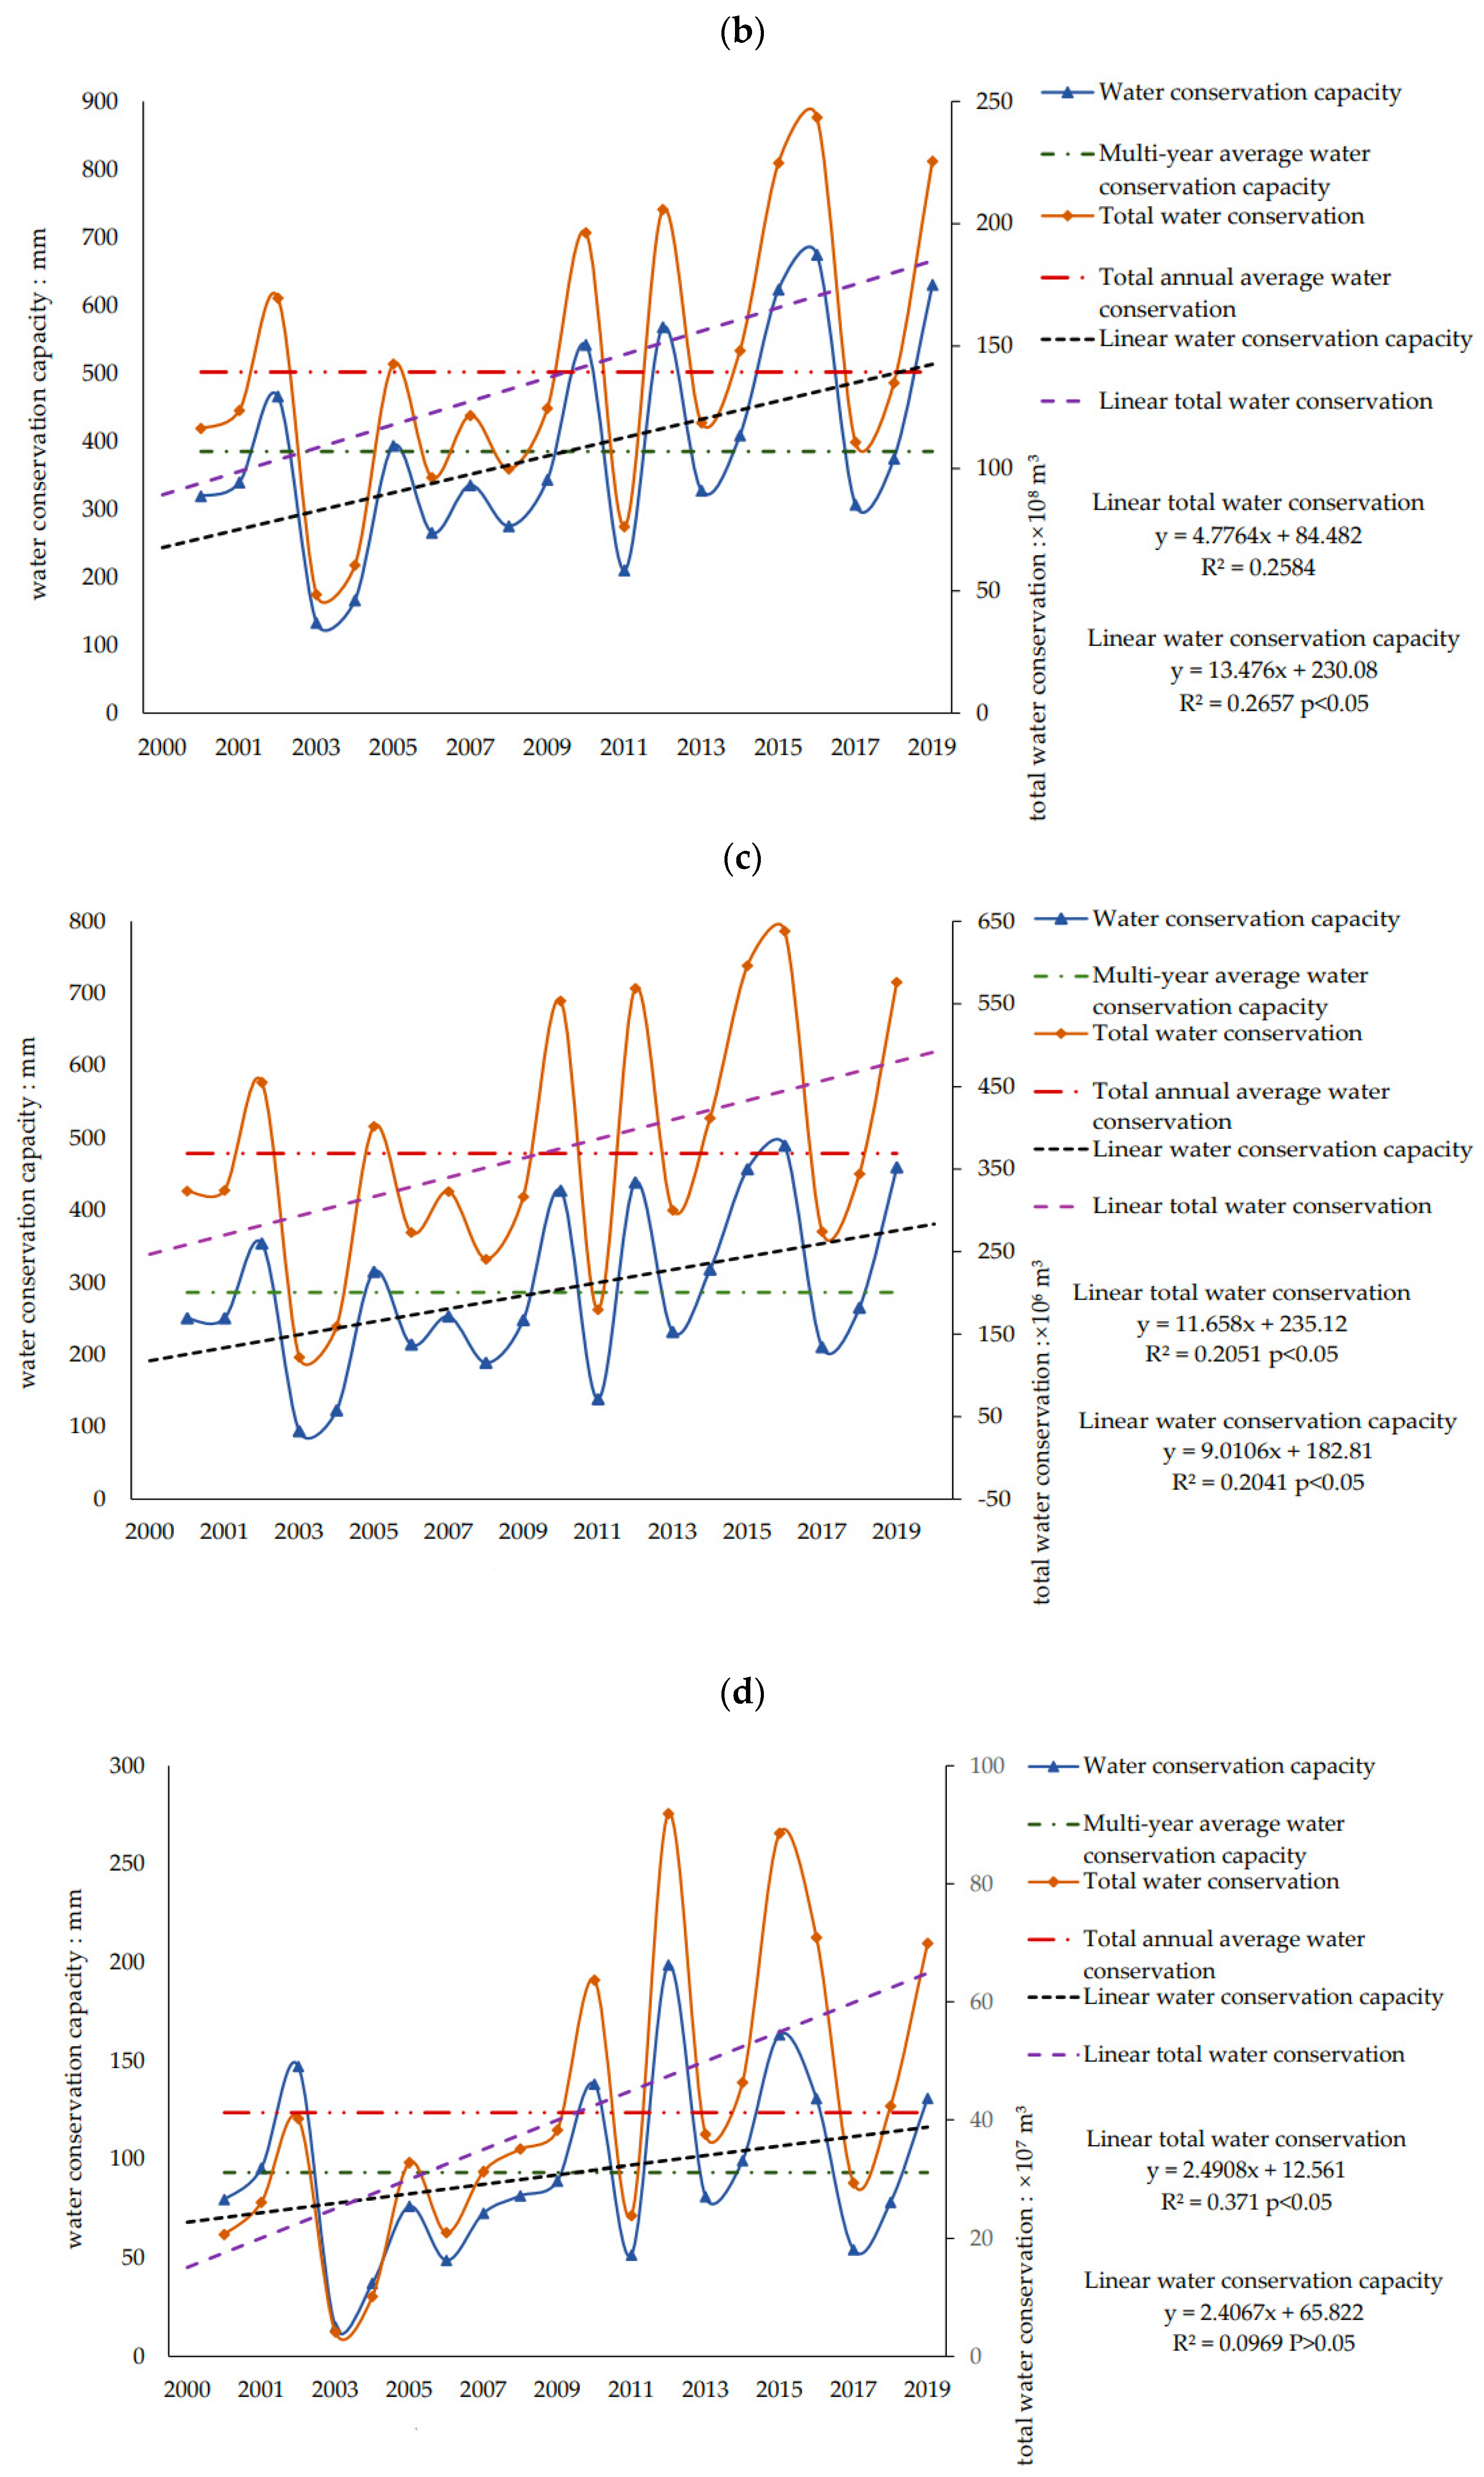
Different soil surfaces demonstrate different levels of water conservation capacity [48]. The water conservation capacity and total water conservation of different land use types from 2000 to 2019 were extracted from partition statistics. Figure 6 shows that the water conservation capacity and the total amount of water conservation in the last 10 years of the four land uses were significantly higher than those in the first 10 years. The average water conservation capacity of 2000–2019 was forest land (385.06 mm, which was close to Gong Shihan’s calculation results [38]), grassland (286.44 mm), cropland (225.55 mm), and construction land (93.5 mm). From 2000 to 2019, the water conservation capacity and total water conservation of each land use generally exhibited an upward trend. The improvement rate of water conservation capacity was forest land (R2 = 0.26, p < 0.05), cropland (R2 = 0.38, p < 0.05), grassland (R2 = 0.2, p < 0.05), and construction land (R2 = 0.09, p > 0.05). From 2010 to 2019, the average water conservation capacity of cropland, forest land, grassland, and construction land were 286.81 mm, 446.50 mm, 343.67 mm, and 112.67 mm, respectively; the total amount of water conservation of cropland, forest land, grassland, and construction land were 511.30 × 10⁷ m3, 148.83 × 10⁸ m3, 444.36 × 10⁶ m3, and 25.97 × 10³ m7, respectively. From 2010 to 2019, the order of increase in water conservation capacity which compared with 2000 to 2009 was as follows: cropland (increased by 122.51 mm), construction land (increased by 38.34 mm), grassland (increased by 114.46 mm), and forest (increased by 108.69 mm). The increase in the total amount of water conservation was followed by building land (increased by 30.48 × 10⁷ m3), cropland (increased by 196.12 × 10⁷ m3), forest land (increased by 38.47 × 10⁸ m3), and grassland (increased by 94.97 × 10⁶ m3). In general, the water conservation capacity of forest land in the ZGBA was high, and the growth rate had been fast in the past 20 years, which is an important way for the regional ecosystem to play the water conservation function.

3.4. Quantitative Analysis of the Impact of Climate and LUCC on Water Conservation

The water conservation depth in the base period was 234.45 mm, and the water conservation depth in the change period was 384.77 mm. The water conservation capacity in the change period was increased by 144.24 mm, with an increasing rate of 61.02% compared with the base period (Table 5). Among them, the water conservation capacity caused by climate change was increased by 150.32 mm, accounting for 98.78% of the total change value. LUCC exerted a negative impact on water conservation, reducing water conservation by 1.86 mm, accounting for 1.22% of the total change value. As various types of land changes accounted for a very small proportion of the total area, with a maximum of no more than 6%, their proportion was very small relative to the overall change. Generally, the significant increase in water conservation from 2000 to 2019 was mainly induced by the positive effect of climate factors, while LUCC had a low negative contribution rate to water conservation, presenting a small impact.

4. Discussion

4.1. The Response Relationship and Sensitivity Analysis of Water Conservation

The water conservation in the study was affected by the water yield and runoff. In the calculation, the amount of water yield in the construction land was discovered to be greater than that in the forest land, and the water conservation in forest land was more than that in other lands. Water yield is mainly impacted by evapotranspiration and under-infiltration [49]. Runoffs are affected by vegetation, soil, and terrain factors [50]. In a hydrological cycle, the evaporation effect of soil, water surface, and the evapotranspiration effect of crops are essential mechanisms to convert liquid water into gaseous water [51]. The surface evapotranspiration volume is comprehensively influenced by micro-weather, vegetation, and soil. The forest had high precipitation interception, even if it had strong evapotranspiration, its water yield was much higher than runoff, and the comprehensive water conservation capacity was high. The construction land is mainly impervious surface, has less difference between water yield and runoff, and the comprehensive water conservation capacity was low. Water conservation was mainly affected by precipitation factors, which increased in stages from 2000 to 2019. Although the runoff showed an upward trend and the cropland area was greatly reduced, the enhancement of precipitation was much higher than the weakening of runoff and land. The overall water conservation improved. In order to further explore the response relationship and sensitivity of four key factors of rainfall, evapotranspiration, soil depth and runoff to water conservation, the paper, by controlling the other three key factors in 2019 and changing another key factor at 5% intervals, found that the change range is −25%–25%, and finally the water conservation amount under the change of different factors was obtained. The results were that the slope of the precipitation factor was 78.15, the evapotranspiration was −12.78, the soil depth was −2.56, and the runoff was −37.03. Therefore, rainfall and water conservation were positively correlated, and evapotranspiration, soil depth, and runoff were negatively correlated, and the factor sensitivity was rainfall > runoff > evapotranspiration > soil depth.

4.2. Influencing Factors of Water Conservation

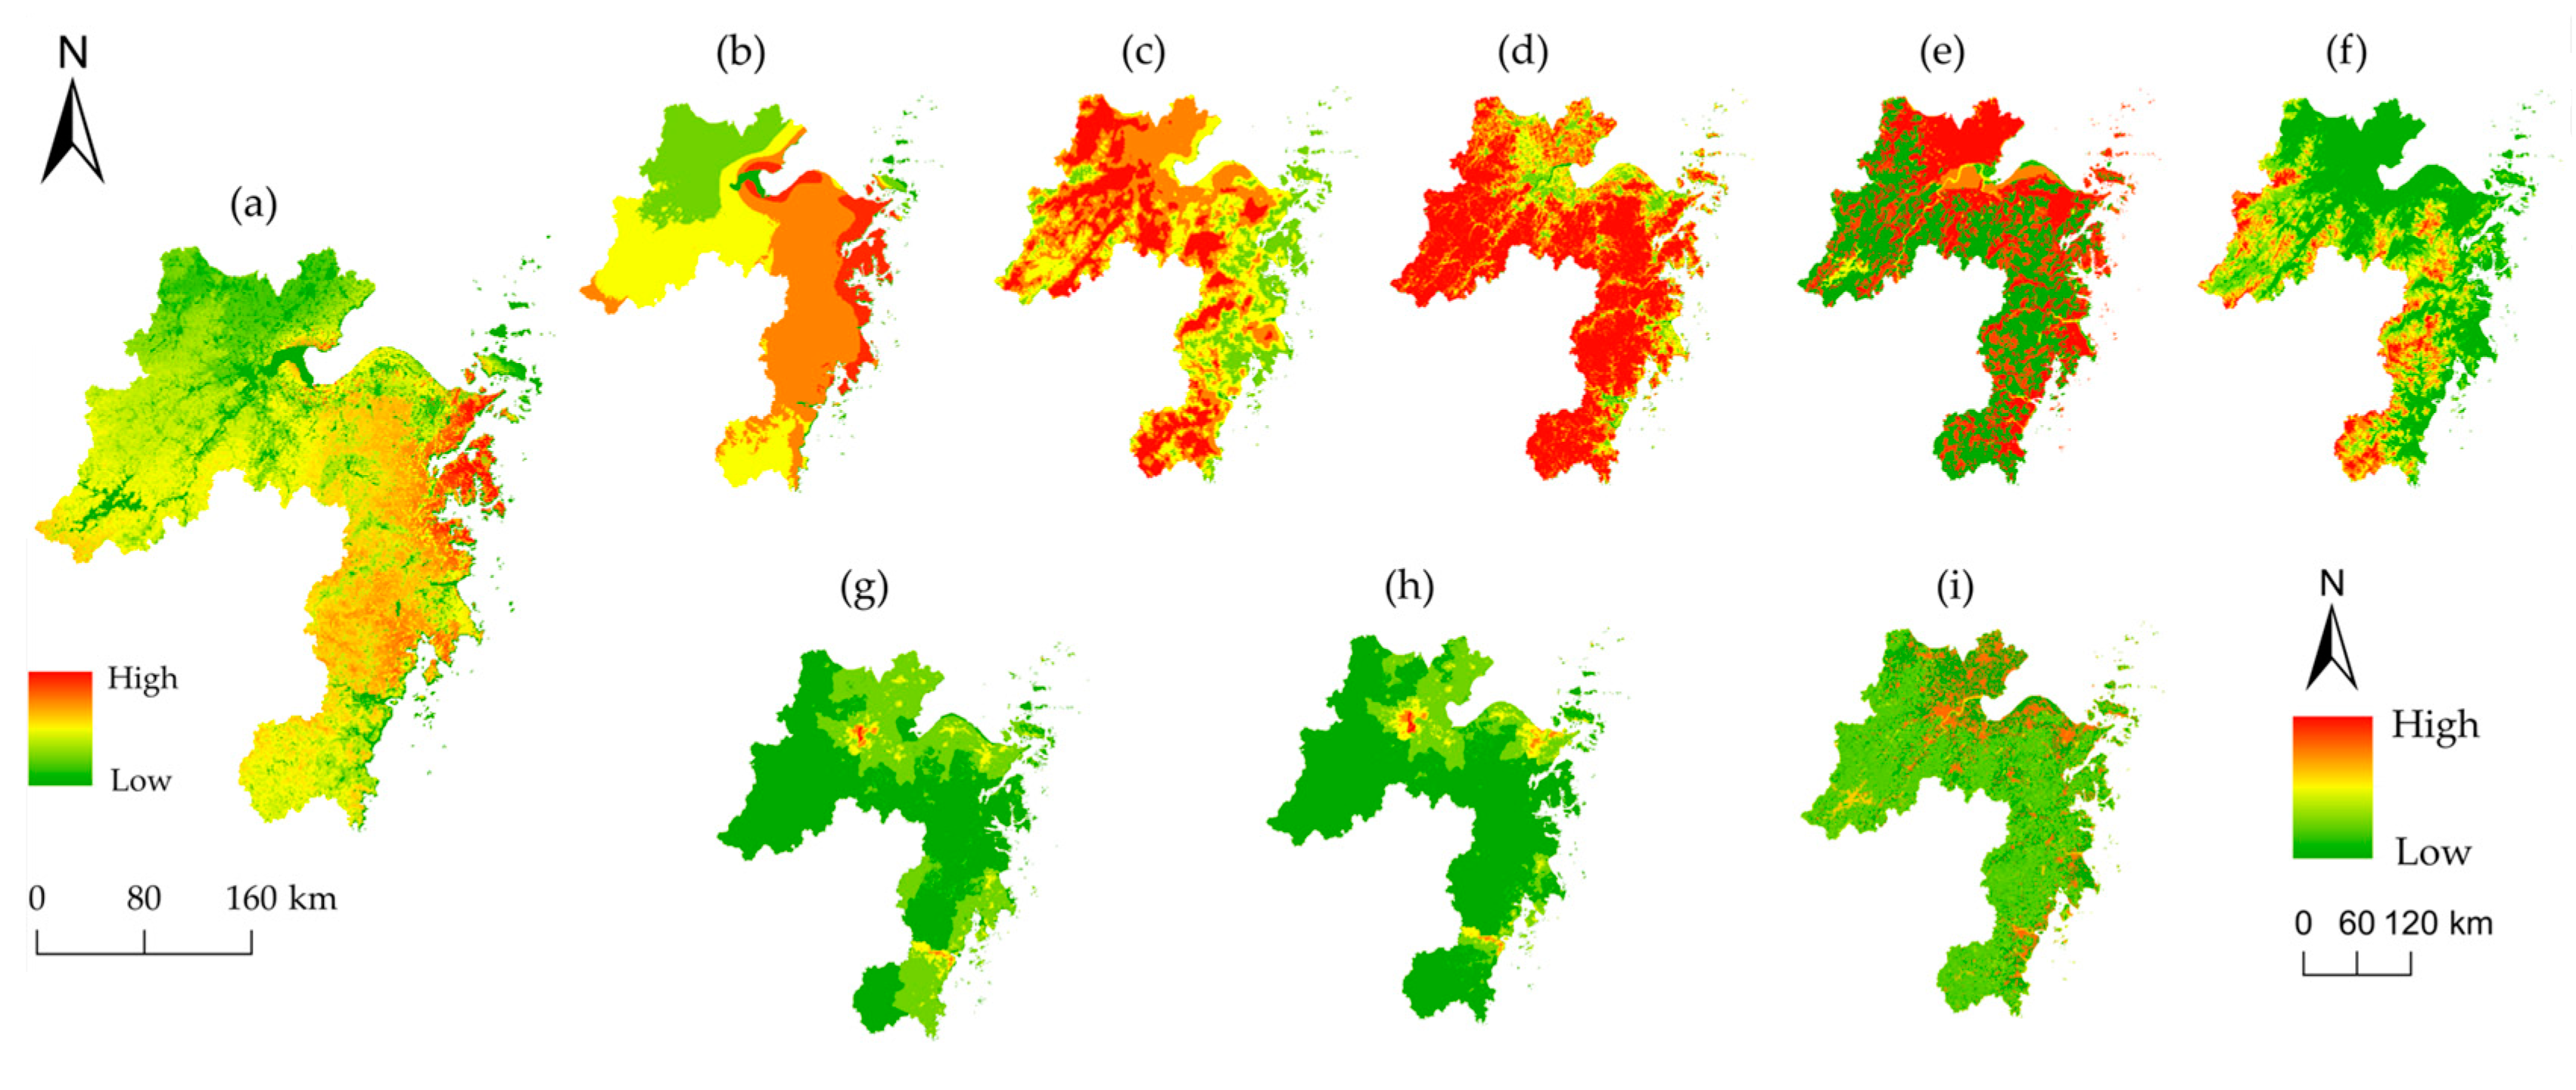
The amount of water conservation is obtained through the interception, penetration, and savings of precipitation. It is affected to varying degrees by ecosystem types, soil physicochemical properties, topographic features, precipitation, evapotranspiration, and runoff [38,52]. On this basis, natural factors and human activity factors which are strongly related to water conservation [53,54,55] were selected to explore the degree of spatial differentiation and multi-factor interaction effects on water conservation (Figure 7). Concerning natural factors, the value of the precipitation factor had the highest q-value and the most impact. It explained 44% of the amount of water conservation, followed by the steam factors (31%), vegetation (22%), soil (21%), and terrain (18%). They had a certain degree of influence on water conservation (Table 6). However, human activity factors had a lower impact on water conservation, and the degree of interpretation was 0.07–0.18. At the same time, the interaction between factors also can enhance their influence on water conservation. The biggest impact was the precipitation ∩ vegetation (q = 0.63), which was a dual-factor enhancement interaction, followed by precipitation ∩ soil (q = 0.62) and precipitation ∩ terrain (q = 0.60). The influence of human activity factors on water conservation significantly increased when interacting with other natural factors. The largest changes were GDP ∩ precipitation (0.54) and POP ∩ precipitation (0.54), exhibiting a non-linear enhancement interaction, followed by GDP ∩ evaporation (q = 0.36) and POP ∩ evaporation (q = 0.36), which was a dual-factor enhancement interaction. The main degree of influence on water conservation in natural factors was precipitation and evaporation. Additionally, multi-factor influence in precipitation was remarkably impacted when interacting with vegetation and terrain. The influence of single-factor human activities on water conservation was weaker, and the influence was produced when interaction with natural factors significantly increases.

4.3. Space Grading of Water Conservation

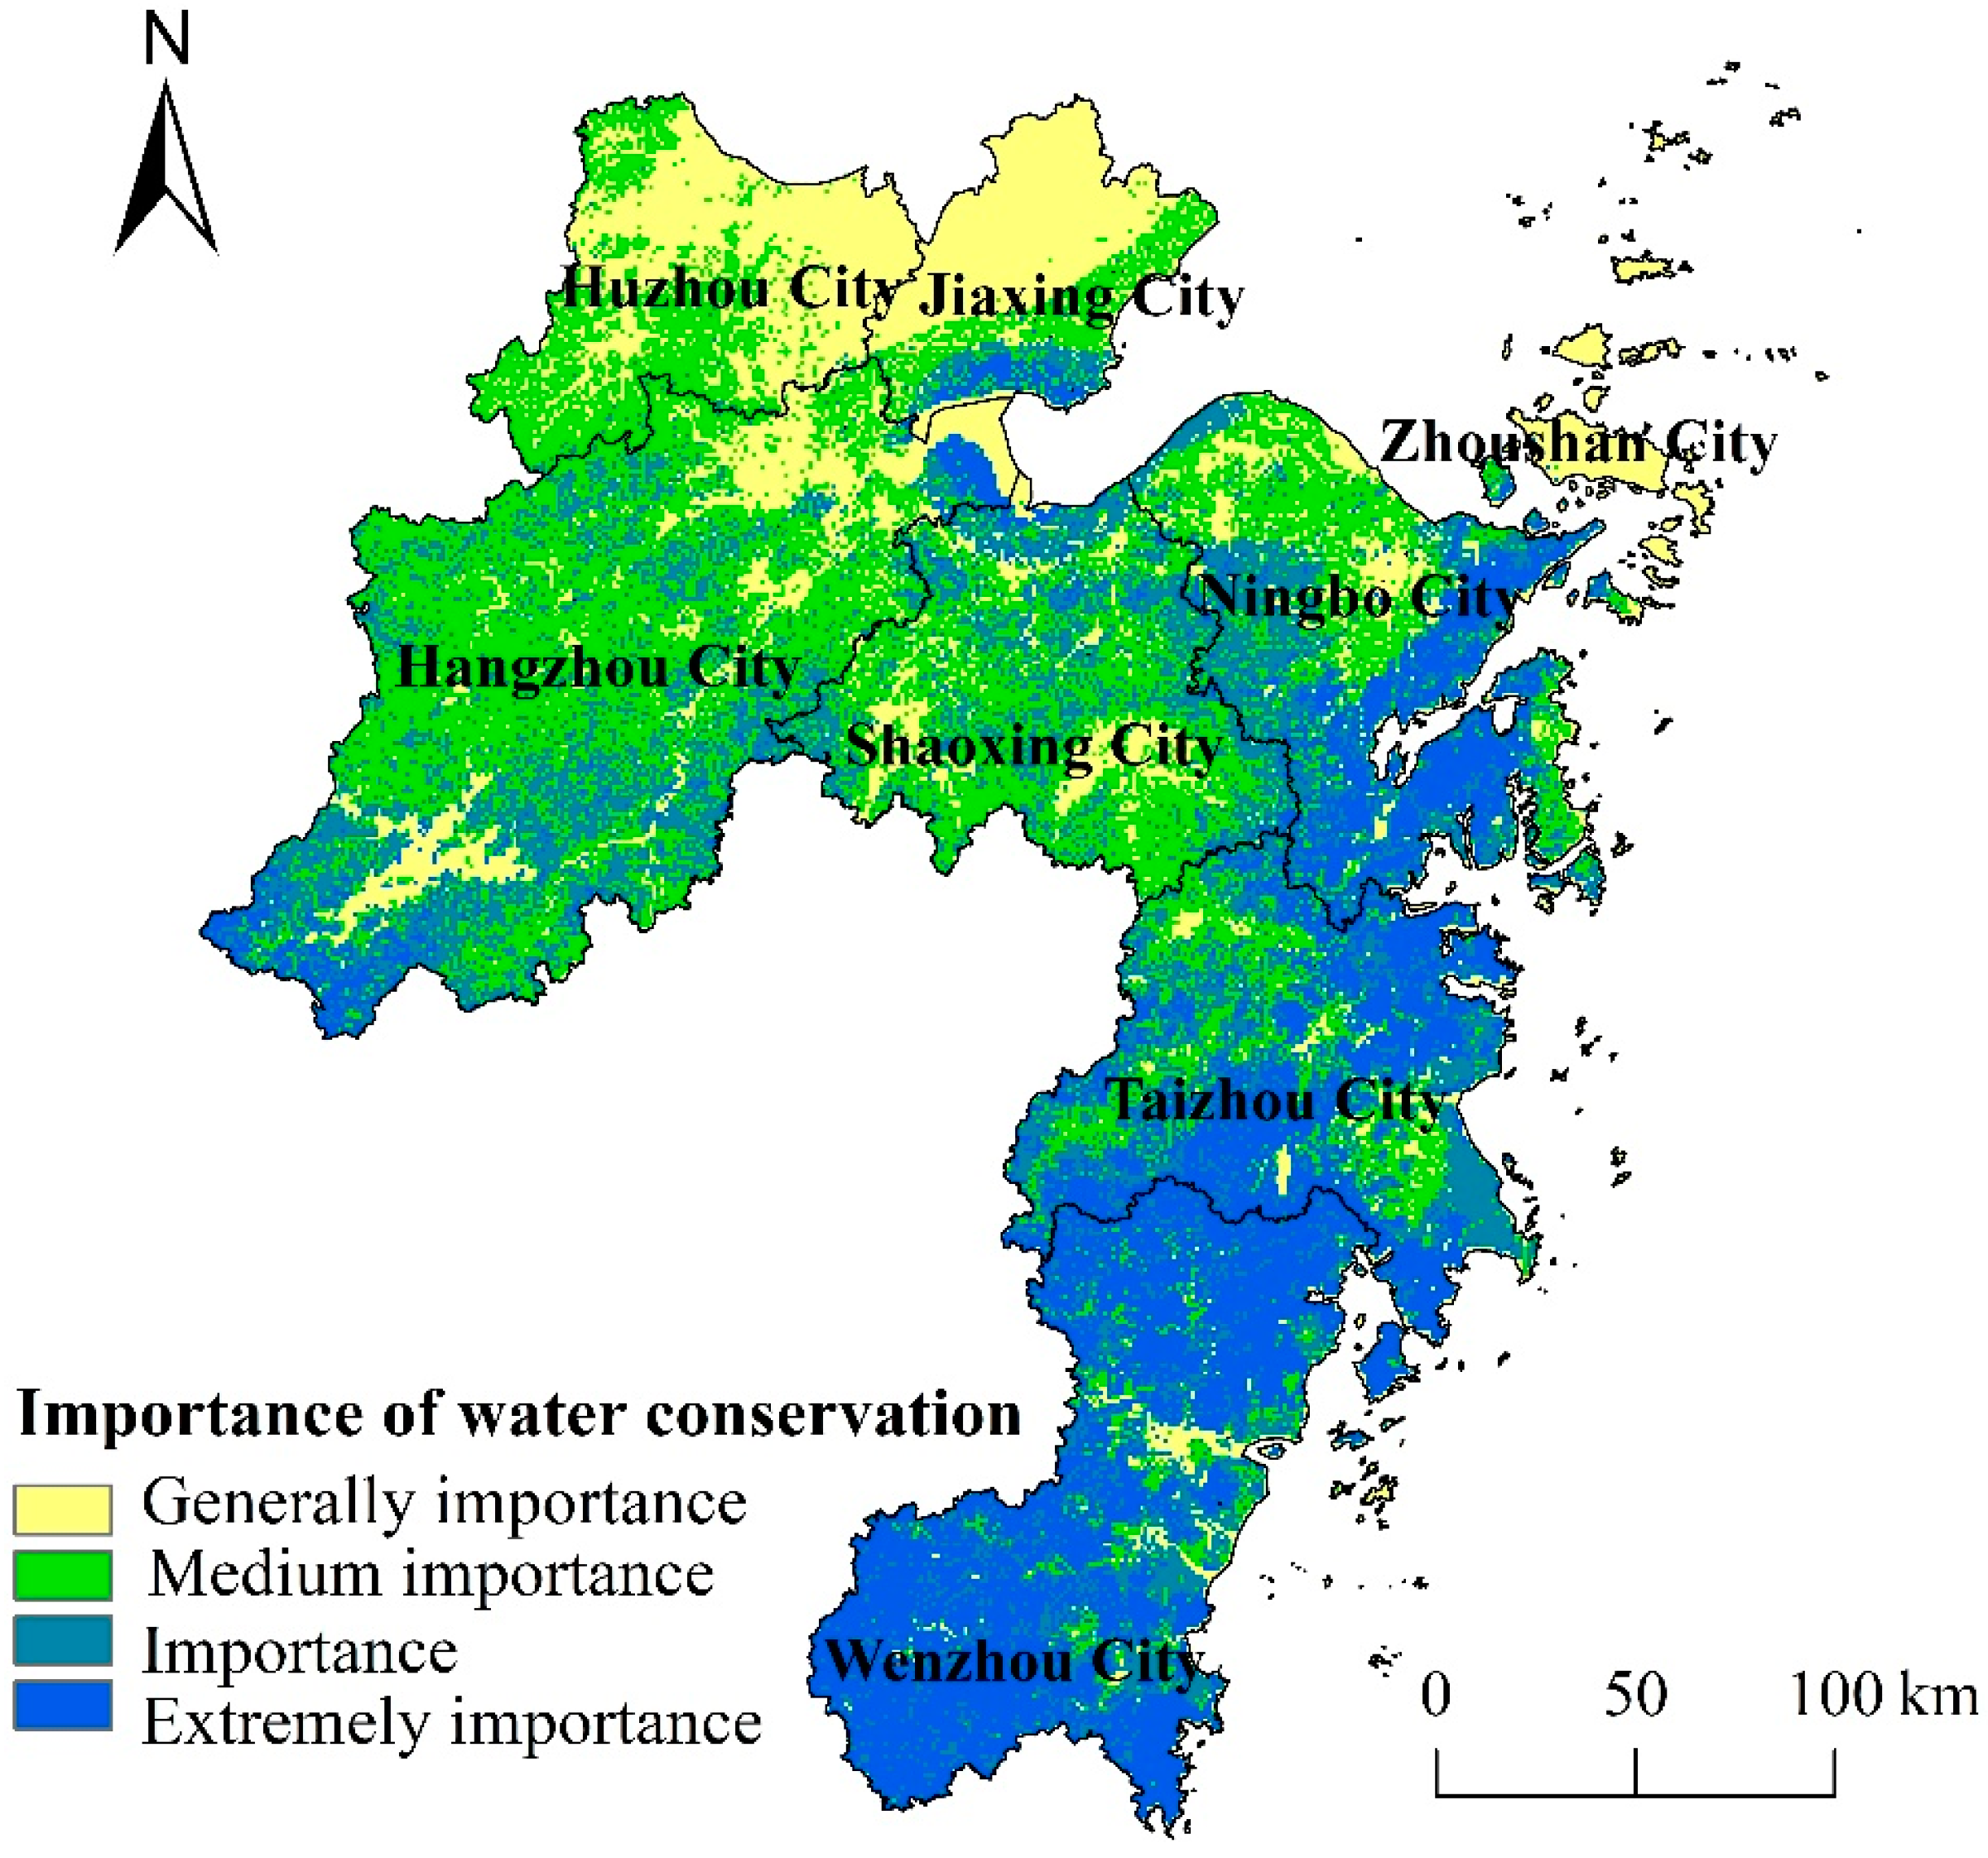
According to the ecological red line guide [56] and related literature [57], the water conservation service of the ZGBA was divided into four grades (Figure 8): generally important (<150 mm), moderately important (150–300 mm), important (300–400 mm), and extremely important (>400 mm). The generally important areas of water conservation services were located in Huzhou and Jiaxing City, accounting for 23.47%. The average water conservation capacity was 60 mm, and the total amount of water conservation was 9.32 × 10⁸ m3. The moderately important areas were located in the northeast of Hangzhou and Shaoxing City, with the area accounting for 31.49%. The average water conservation capacity was 233 mm, and the total amount of water conservation was 48.57 × 10⁸ m3. The important areas were located in southwestern Hangzhou and southwestern Ningbo, with the area accounting for 28.23%, the average water conservation capacity was 344 mm, and the average total water conservation was 49.52 × 10⁸ m3. The extremely important district was primarily located in Wenzhou, Taizhou, and southeast of Ningbo. The area accounted for 16.81%, with the average water conservation capacity of 508 mm, and the average water conservation total was 78.33 × 10⁸ m3. On the whole, the important parts of water conservation were mainly concentrated in the southern part of the ZGBA.

4.4. Limitation

The determination of the runoff coefficient is based on the average parameter method of hydrological calculation research in places with scarce data [41]. The range of the runoff coefficient was selected after re-classification and then we calculated the annual runoff. The water conservation ability calculated by the runoff volume was compared with the relevant values of multiple pieces of literature, and results of the income were more compatible, but there were certain uncertainties in the calculation of water conservation in the ZGBA because of the differences in factors such as water yield, runoff and calculation methods. In the paper, there was a difference of 1.8–8.76% in the water conservation capacity of forestland in similar areas calculated by Gong et al. [2,38,58], and there was a difference of 0.88% with the multi-year average water conservation capacity of the Guangdong-Hong Kong-Macao Greater Bay Area calculated by Wang [59]. Liu [31] employed the average value to verify the model measurement results when calculating the runoff in the Soil Conservation Service (SCS) model. However, this method had not yet been verified with enough data, leading to an uncertain accuracy. Thus, the accuracy of water conservation and runoff should be verified and adjusted after improving the accuracy of precipitation, etc., optimizing the research method, and completing the relevant hydrological data in the future. Besides, when exploring the impact of climate and land change on the degree of water conservation through the control variable method, the total influence of the two factors slightly exceeded 100% due to the calculation error of GIS, the error of the model structure, the data input and output error, and the redundancy and correlation of the parameter, destroying the ideal state of   W i = 1 . Although the results were not affected, the uncertainty of the value and the confidence interval of the calculation results need to be evaluated in the future to enhance the accuracy of the results.

5. Conclusions

In 2019, the land use of the ZGBA was mainly forest land (56.88%), cropland (26.76%), and construction land (10.67%). The grassland occupied a small area, only 2%. The cropland and construction land in the ZGBA had changed significantly in 20 years. During the period 2000–2019, the construction land area expanded by 131.77%, mainly from cropland and forest land. The area of cropland was reduced and it mainly turned to construction land and forest land under the policy of economic and retreating forests. The precipitation in the ZGBA rose from 2000 to 2019.
The 20-year total average water conservation of each land use in the ZGBA was ranked as forest land (139.41 × 10⁸ m3), cultivated land (413.24 × 10⁷ m3), construction land (412 × 106 m3), and grassland (369.19 × 10⁶ m3). The average water conservation was the highest for forest land (385.06 mm) and lowest for building land (93.5 mm). In 2000–2019, water conservation increased in phases. The total amount of water conservation in 2010–2019 increased by 55.74% compared to the period of 2000–2009, demonstrating a significantly increased water conservation capacity. The high-level area of water conservation was majorly distributed in southwestern Hangzhou, Wenzhou, Taizhou, and southeast Ningbo, accounting for 45.04%.
The impact of climate change on the water conservation service of the ZGBA had become more significant and thus boosted the level of water conservation in each land use type with increased precipitation. Changes in land use had a weakening impact on water conservation services, which was minimal compared to the overall increase in changes. The precipitation (q = 0.44) and evapotranspiration (q = 0.31) in the climate are the main natural factors influencing water conservation. The two-factor combinations of precipitation and vegetation/terrain enhance their impact on water conservation.

Author Contributions

All the authors significantly contributed to this study. F.Y. proposed the idea and designed the experiments. L.Z. wrote the manuscript and processed the data. All authors have read and agreed to the published version of the manuscript.

Funding

This paper was jointly supported by the National Natural Science Foundation of China (Grant No. 42001235) and the Science and Technology Plan Program of Zhoushan (Grant No. 2021C21022).

Institutional Review Board Statement

Not applicable.

Informed Consent Statement

Not applicable.

Data Availability Statement

The data that support the findings of this study are available from the corresponding author (F.Y.) upon justifiable request.

Conflicts of Interest

The authors declare no conflict of interest.

References

  1. Brauman, K.A.; Daily, G.C.; Duarte, T.K.; Mooney, H.A. The nature and value of ecosystem services: An overview highlighting hydrologic services. Annu. Rev. Environ. Resour. 2007, 32, 67–98. [Google Scholar] [CrossRef]
  2. Shen, Y.; Xiao, Y.; Ouyang, Z.; Zhang, P. Water Conservation Service Evaluation Based on Ecosystem Quality in Southwestern China. Mt. Res. 2020, 38, 816–828. [Google Scholar]
  3. Vigerstol, K.L.; Aukema, J.E. A comparison of tools for modeling freshwater ecosystem services. J. Environ. Manag. 2011, 92, 2403–2409. [Google Scholar] [CrossRef] [PubMed]
  4. Zhang, B.; Li, W.; Xie, G.; Xiao, Y. Water conservation of forest ecosystem in Beijing and its value. Ecol. Econ. 2010, 69, 1416–1426. [Google Scholar]
  5. Kong, L.; Wang, Y.; Zheng, H.; Xiao, Y.; Xu, W.; Zhang, L.; Xiao, Y.; Ouyang, Z. A method for evaluating ecological space and ecological conservation redlines in river basins: A case of the Yangtze River Basin. Acta Ecol. Sin. 2019, 39, 835–843. [Google Scholar]
  6. Xie, G.; Zhang, C.; Zhang, L.; Chen, W.; Li, S. Improvement of the evaluation method for ecosystem service value based on per unit area. J. Nat. Resour. 2015, 30, 1243–1254. [Google Scholar]
  7. Ji, Z.; Pei, T.; Chen, Y.; Wu, H.; Hou, Q.; Shi, F.; Xie, B.; Zhang, J. The driving factors of grassland water use efficiency along degradation gradients on the Qinghai-Tibet Plateau, China. Glob. Ecol. Conserv. 2022, 35, e02090. [Google Scholar] [CrossRef]
  8. Cao, W.; Wu, D.; Huang, L.; Liu, L. Spatial and temporal variations and significance identification of ecosystem services in the Sanjiangyuan National Park, China. Sci. Rep. 2020, 10, 6151. [Google Scholar] [CrossRef]
  9. Ferraz, S.F.; de Paula Lima, W.; Rodrigues, C.B. Managing forest plantation landscapes for water conservation. For. Ecol. Manag. 2013, 301, 58–66. [Google Scholar] [CrossRef]
  10. Tiemann, A.; Ring, I. Challenges and opportunities of aligning forest function mapping and the ecosystem service concept in Germany. Forests 2018, 9, 691. [Google Scholar] [CrossRef] [Green Version]
  11. Liu, L.; Bian, Z.; Ding, S. Consequences of Spatial Heterogeneity of Forest Landscape on Ecosystem Water Conservation Service in the Yi River Watershed in Central China. Sustainability 2020, 12, 1170. [Google Scholar] [CrossRef] [Green Version]
  12. Hu, W.; Li, G.; Gao, Z.; Jia, G.; Wang, Z.; Li, Y. Assessment of the impact of the Poplar Ecological Retreat Project on water conservation in the Dongting Lake wetland region using the InVEST model. Sci. Total Environ. 2020, 733, 139423. [Google Scholar] [CrossRef]
  13. Hu, W.; Li, G.; Li, Z. Spatial and temporal evolution characteristics of the water conservation function and its driving factors in regional lake wetlands—Two types of homogeneous lakes as examples. Ecol. Indic. 2021, 130, 108069. [Google Scholar] [CrossRef]
  14. Khanal, S.; Lal, R.; Kharel, G.; Fulton, J. Identification and classification of critical soil and water conservation areas in the Muskingum River basin in Ohio. J. Soil Water Conserv. 2018, 73, 213–226. [Google Scholar] [CrossRef]
  15. Bao, Y.; LI, T.; Liu, H.; Ma, T.; Wang, H.; Liu, K.; Shen, X.; Liu, X. Spatial and temporal changes of water conservation of Loess Plateau in northern Shaanxi province by InVEST model. Geophys. Res. 2016, 35, 664–676. [Google Scholar]
  16. Wang, Y.; Ye, A.; Peng, D.; Miao, C.; Di, Z.; Gong, W. Spatiotemporal variations in water conservation function of the Tibetan Plateau under climate change based on InVEST model. J. Hydrol. Reg. Stud. 2022, 41, 101064. [Google Scholar] [CrossRef]
  17. Li, M.; Liang, D.; Xia, J.; Song, J.; Cheng, D.; Wu, J.; Cao, Y.; Sun, H.; Li, Q. Evaluation of water conservation function of Danjiang River Basin in Qinling Mountains, China based on InVEST model. J. Environ. Manag. 2021, 286, 112212. [Google Scholar] [CrossRef]
  18. Zhu, Q.; Guo, J.; Guo, X.; Chen, L.; Han, Y.; Liu, S. Relationship between ecological quality and ecosystem services in a red soil hilly watershed in southern China. Ecol. Indic. 2021, 121, 107119. [Google Scholar] [CrossRef]
  19. Fu, B.; Xu, P.; Wang, Y.; Yan, K.; Chaudhary, S. Assessment of the ecosystem services provided by ponds in hilly areas. Sci. Total Environ. 2018, 642, 979–987. [Google Scholar] [CrossRef] [PubMed]
  20. Chen, S.; Liu, K.; Bao, Y.; Chen, H. Spatial pattern and influencing factors of water conservation service function in Shangluo city. Sci. Geol. Sin. 2016, 36, 1546–1554. [Google Scholar]
  21. Xu, J.; Xiao, Y.; Xie, G.; Wang, S.; Zhu, W. Spatiotemporal analysis of water supply service in the Dongjiang Lake Basin. Acta Ecol. Sin. 2016, 36, 4892–4906. [Google Scholar]
  22. Zhang, B.; Li, W.; Xie, G.; Xiao, Y. Water conservation function and its measurement methods of forest ecosystem. Chin. J. Ecol. 2009, 28, 529–534. [Google Scholar]
  23. Šatalová, B.; Kenderessy, P. Assessment of water retention function as tool to improve integrated watershed management (case study of Poprad river basin, Slovakia). Sci. Total Environ. 2017, 599, 1082–1089. [Google Scholar] [CrossRef]
  24. Leh, M.D.; Matlock, M.D.; Cummings, E.C.; Nalley, L.L. Quantifying and mapping multiple ecosystem services change in West Africa. Agric. Ecosyst. Environ. 2013, 165, 6–18. [Google Scholar] [CrossRef]
  25. Goldstein, J.H.; Caldarone, G.; Duarte, T.K.; Ennaanay, D.; Hannahs, N.; Mendoza, G.; Polasky, S.; Wolny, S.; Daily, G.C. Integrating ecosystem-service tradeoffs into land-use decisions. Proc. Natl. Acad. Sci. USA 2012, 109, 7565–7570. [Google Scholar] [CrossRef] [Green Version]
  26. Hou, G.; Bi, H.; Wei, X.; Wang, N.; Cui, Y.; Zhao, D.; Ma, X.; Wang, S. Optimal configuration of stand structures in a low-efficiency Robinia pseudoacacia forest based on a comprehensive index of soil and water conservation ecological benefits. Ecol. Indic. 2020, 114, 106308. [Google Scholar] [CrossRef]
  27. Si, J.; Han, P.; Zhao, C. Review of Water Conservation Value Evaluation Methods of Forest and Case Study. J. Nat. Resour. 2011, 26, 2100–2109. [Google Scholar]
  28. Sun, Q.; Li, Y.; Guo, J.; Wu, X. Assessment of Water Conservation Function of Forest Ecosystem in Yunhe County, Zhejiang Province. Acta Sci. Nat. Univ. Pekin. 2015, 51, 888–896. [Google Scholar]
  29. Wang, X.; Shen, H.; Li, X.; Jing, F. Concepts, processes and quantification methods of the forest water conservation at the multiple scales. Acta Ecol. Sin. 2013, 33, 1019–1030. [Google Scholar] [CrossRef]
  30. Lu, Y.; Zhang, L.; Zeng, Y.; Fu, B.; Whitham, C.; Liu, S.; Wu, B. Representation of critical natural capital in China. Conserv. Biol. 2017, 31, 894–902. [Google Scholar] [CrossRef]
  31. Liu, C.; Liu, W.; Wang, N.; Yang, B. Application of SCS model in runoff simulation of non-data region: A case study in Qinghe river basin. Chin. J. Agric. Resour. Reg. Plann. 2019, 40, 56–63. [Google Scholar]
  32. Allen, R.G.; Pereira, L.S.; Raes, D.; Smith, M. Crop Evapotranspiration—Guidelines for Computing Crop Water Requirements—FAO Irrigation and Drainage Paper 56; FAO: Rome, Italy, 1998; pp. 103–134. [Google Scholar]
  33. Allen, R.G.; Pruitt, W.O.; Raes, D.; Smith, M.; Pereira, L.S. Estimating evaporation from bare soil and the crop coefficient for the initial period using common soils information. J. Irrig. Drain. Eng. 2005, 131, 14–23. [Google Scholar] [CrossRef]
  34. Chen, J.; Wang, D.; Li, G.; Sun, Z.; Wang, X.; Zhang, X.; Zhang, W. Spatial and Temporal Heterogeneity Analysis of Water Conservation in Beijing-Tianjin-Hebei Urban Agglomeration Based on the Geodetector and Spatial Elastic Coefficient Trajectory Models. GeoHealth 2020, 4, e2020GH000248. [Google Scholar] [CrossRef]
  35. Wang, B.; Chen, H.; Dong, Z.; Zhu, W.; Qiu, Q.; Tang, L. Impact of land use change on the water conservation service of ecosystems in the urban agglomeration of the Golden Triangle of Southern Fujian, China, in 2030. Acta Ecol. Sin. 2020, 40, 484–498. [Google Scholar]
  36. Pan, Y.; Zhen, L.; Long, X.; Cao, X. Ecosystem service interactions and their affecting factors in Jinghe watershed at county level. Chin. J. Appl. Ecol. 2012, 23, 1203–1209. [Google Scholar]
  37. Gong, S.; Xiao, Y.; Xiao, Y.; Zhang, L.; Ouyang, Z. Driving forces and their effects on water conservation services in forest ecosystems in China. Chin. Geogr. Sci. 2017, 27, 216–228. [Google Scholar] [CrossRef] [Green Version]
  38. Gong, S.; Xiao, Y.; Zheng, H.; Xiao, Y.; Ouyang, Z. Spatial patterns of ecosystem water conservation in China and its impact factors analysis. Acta Ecol. Sin. 2017, 37, 2455–2465. [Google Scholar]
  39. Zhang, L.; Hickel, K.; Dawes, W.; Chiew, F.H.; Western, A.; Briggs, P. A rational function approach for estimating mean annual evapotranspiration. Water Resour. Res. 2004, 40, 107500. [Google Scholar] [CrossRef]
  40. Donohue, R.J.; Roderick, M.L.; McVicar, T.R. Roots, storms and soil pores: Incorporating key ecohydrological processes into Budyko’s hydrological model. J. Hydrol. 2012, 436, 35–50. [Google Scholar] [CrossRef]
  41. Liu, C.; Bai, P.; Wang, Z.; Liu, S.; Liu, X. Study on prediction of ungaged basins: A case study on the Tibetan Plateau. J. Hydraul. Eng. 2016, 47, 272–282. [Google Scholar]
  42. Liu, X.; Zhang, J.; Zhu, X.; Pan, Y.; Liu, Y.; Zhang, D.; Lin, Z. Spatiotemporal changes in vegetation coverage and its driving factors in the Three-River Headwaters Region during 2000–2011. J. Geog. Sci. 2014, 2, 288–302. [Google Scholar] [CrossRef]
  43. Liu, Y.; Xiong, L. Research on streamflow responses to land use change and climate variability in Xunhe catchment. Water Resour. Res. 2013, 2, 181–187. [Google Scholar] [CrossRef]
  44. Pandey, B.K.; Khare, D.; Kawasaki, A.; Meshesha, T.W. Integrated approach to simulate hydrological responses to land use dynamics and climate change scenarios employing scoring method in upper Narmada basin, India. J. Hydrol. 2021, 598, 126429. [Google Scholar] [CrossRef]
  45. Zhao, Y.; Zhou, J.; Lei, L.; Xiang, J.; Huang, M.; Feng, W.; Zhu, G.; Wei, W.; Wang, J. Identification of drivers for water yield in the upstream of Shiyang River based on InVEST model. Chin. J. Ecol. 2019, 38, 3789–3799. [Google Scholar]
  46. Wang, J.; Xu, C. Geodetector: Principle and prospective. Acta Geogr. Sin. 2017, 72, 116–134. [Google Scholar]
  47. Zhang, C.; Li, W.; Zhang, B.; Liu, M. Water yield of Xitiaoxi river basin based on InVEST modeling. J. Resour. Ecol. 2012, 3, 50–54. [Google Scholar]
  48. Anand, J.; Gosain, A.K.; Khosa, R. Prediction of land use changes based on Land Change Modeler and attribution of changes in the water balance of Ganga basin to land use change using the SWAT model. Sci. Total Environ. 2018, 644, 503–519. [Google Scholar] [CrossRef]
  49. Pei, H.; Liu, M.; Shen, Y.; Xu, K.; Zhang, H.; Li, Y.; Luo, J. Quantifying impacts of climate dynamics and land-use changes on water yield service in the agro-pastoral ecotone of northern China. Sci. Total Environ. 2022, 809, 151153. [Google Scholar] [CrossRef]
  50. Wei, M.; Yuan, Z.; Xu, J.; Shi, M.; Wen, X. Attribution Assessment and Prediction of Runoff Change in the Han River Basin, China. Int. J. Environ. Res. Public Health 2022, 19, 2393. [Google Scholar] [CrossRef]
  51. Penman, H. The dependence of transpiration on weather and soil conditions. J. Soil Sci. 1950, 1, 74–89. [Google Scholar] [CrossRef]
  52. Yin, Y.; Wu, S.; Zhao, D.; Dai, E. Ecosystem water conservation changes in response to climate change in the Source Region of the Yellow River from 1981 to 2010. Geogr. Res. 2016, 35, 49–57. [Google Scholar]
  53. Li, J.; Zhou, K.; Xie, B.; Xiao, J. Impact of landscape pattern change on water-related ecosystem services: Comprehensive analysis based on heterogeneity perspective. Ecol. Indic. 2021, 133, 108372. [Google Scholar] [CrossRef]
  54. Yang, D.; Liu, W.; Tang, L.; Chen, L.; Li, X.; Xu, X. Estimation of water provision service for monsoon catchments of South China: Applicability of the InVEST model. Landsc. Urban Plan. 2019, 182, 133–143. [Google Scholar] [CrossRef]
  55. Xu, F.; Zhao, L.; Jia, Y.; Niu, C.; Liu, X.; Liu, H. Evaluation of water conservation function of Beijiang River basin in Nanling Mountains, China, based on WEP-L model. Ecol. Indic. 2022, 134, 108383. [Google Scholar] [CrossRef]
  56. Gao, J.; Wang, Y.; Zou, C.; Xu, D.; Lin, N.; Wang, L.; Zhang, K. China’s ecological conservation redline: A solution for future nature conservation. Ambio 2020, 49, 1519–1529. [Google Scholar] [CrossRef]
  57. Hu, P.; Zhou, Y.; Zhou, J.; Wang, G.; Zhu, G. Uncovering the willingness to pay for ecological red lines protection: Evidence from China. Ecol. Indic. 2022, 134, 108458. [Google Scholar] [CrossRef]
  58. Zhang, H.; Zhang, M.; Wang, K.; Qin, J.; Fu, J. Characteristics of Variation of Water Conservation in Southern Hilly and Mountainous Region of China. Res. Agric. Modern. 2014, 35, 345–348. [Google Scholar]
  59. Wang, S.; Huang, L.; Xu, X.; Xu, S. Spatial and temporal evolution of ecosystem services and its trade-offs and synergies in Guangdong-Hong Kong-Macao Greater Bay Area. Acta Ecol. Sin. 2020, 40, 8403–8416. [Google Scholar]
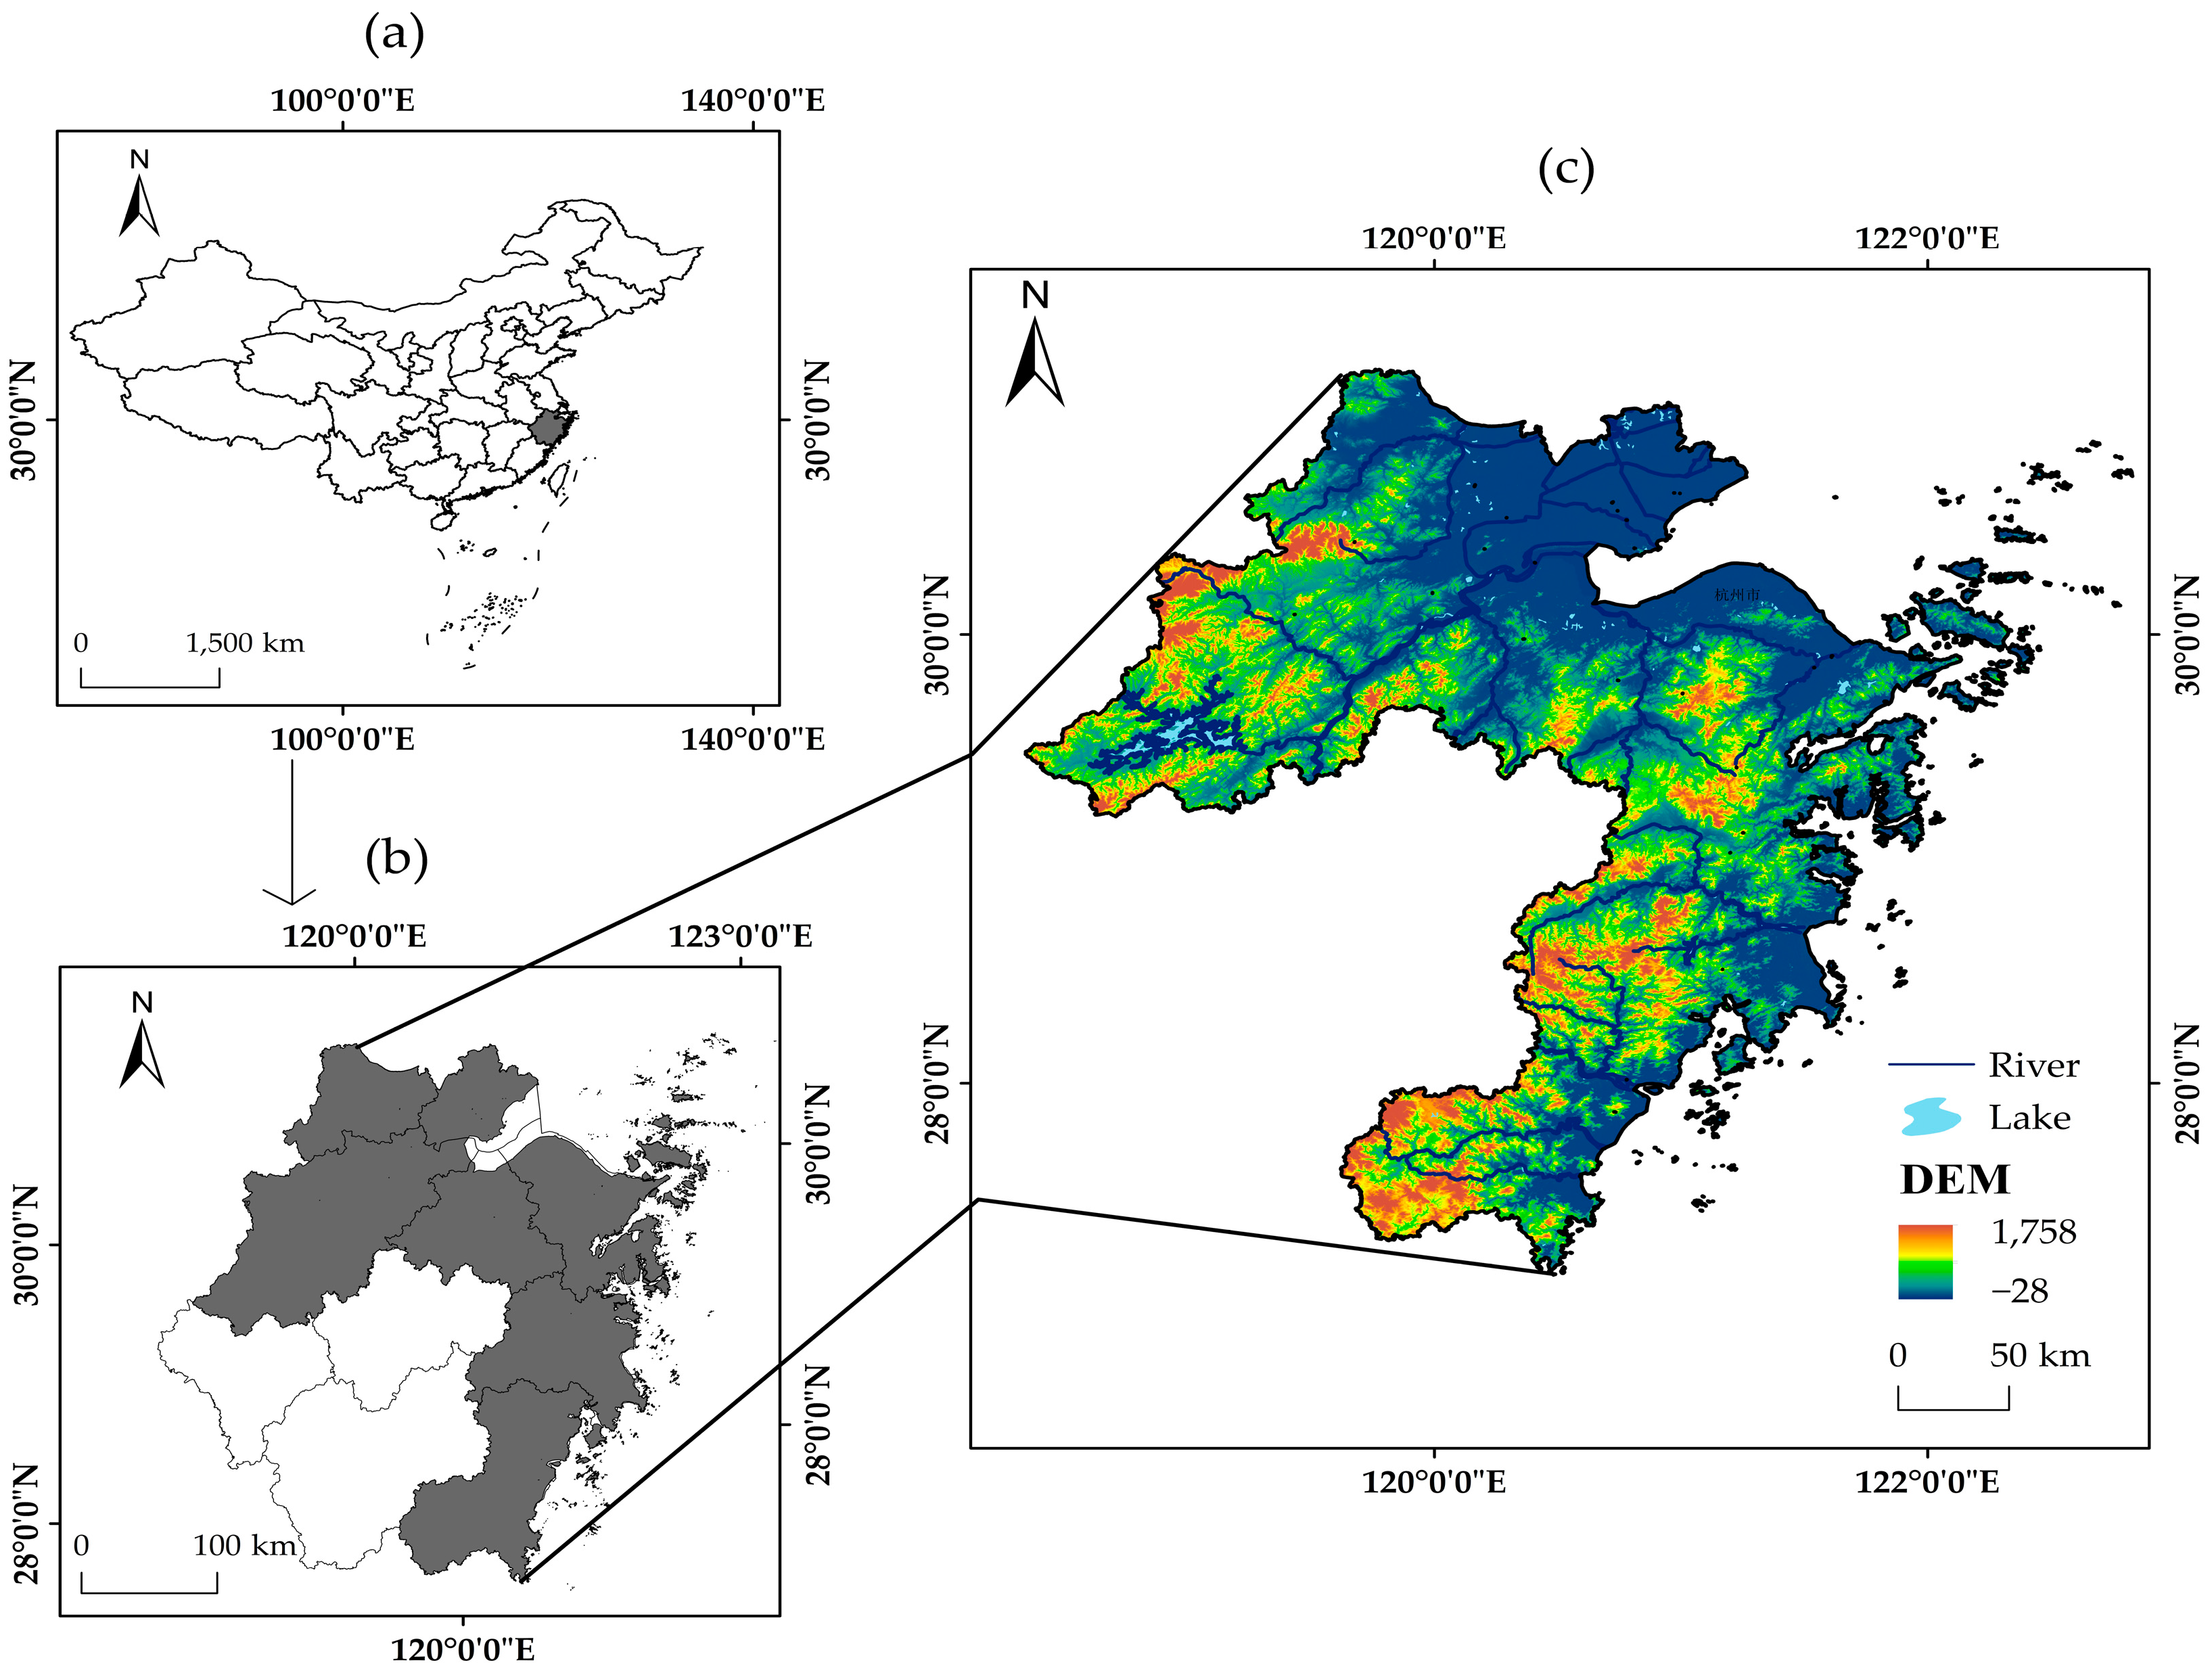
Figure 1. Location, rivers, lakes, DEM of the study area in Zhejiang Province, South China. (a) China; (b) Zhejiang Province; (c) Study area.
Sustainability 14 10392 g001
Figure 2. Fitting results of measured and hydrographic gazette value.
Sustainability 14 10392 g002
Figure 3. Changes in LUCC from 2000 to 2019. (a) LUCC of 2000; (b) LUCC of 2019.
Sustainability 14 10392 g003
Figure 4. Changes in precipitation, evapotranspiration, and land use from 2000 to 2019.
Sustainability 14 10392 g004
Figure 5. 2000–2009, 2010–2019, 2000–2019 water conservation slope trend. (a) water conservation slope trend of 2000–2009; (b) water conservation slope trend of 2010–2019; (c) water conservation slope trend of 2000–2019.
Sustainability 14 10392 g005
Figure 6. Dynamic changes of water conservation in different land uses from 2000 to 2019. (a) land use type: cropland; (b) land use type: forest; (c) land use type: grassland; (d) land use type: construction land.
Sustainability 14 10392 g006aSustainability 14 10392 g006b
Figure 7. The influencing factors of natural conditions and human activities on water conservation in the ZGBA. (a) water conservation; (b) influencing factor: precipitation; (c) influencing factor: evapotranspiration; (d) influencing factor: NDVI; (e) influencing factor: soil types; (f) influencing factor: DEM; (g) influencing factor: POP; (h) influencing factor: GDP; (i) influencing factor: land use.
Sustainability 14 10392 g007
Figure 8. The graded diagram of the importance of water conservation in the ZGBA.
Sustainability 14 10392 g008
Table 1. The InVEST model biophysical table [32,35].
CodeLand UseEvapotranspiration CoefficientSoil Depth of RootVegetation Cover and Management Factor
1Cropland0.932401
2Forest113001
3Grassland0.755001
4Waters110
5Construction land0.2310
6Unused land0.210
Table 2. Runoff coefficient (u) [31,41].
Surface SpeciesRunoff Coefficient Range (u)Mean Runoff Coefficient (u)
Cropland0.45–0.60.53
Forest0.25–0.50.37
Grassland0.4–0.650.53
Construction land0.6–0.950.78
Unused land0.5–0.850.67
Table 3. Land Transfer Matrix Model (2000–2019).
20002019Area Reduction (2000)Total Area (2000)
CroplandForestGrasslandWatersConstruction LandUnused Land
Cropland11,570441416870442133950121,071
Forest387331,0587393688558584436,902
Grassland155705420135119241344
Waters583332351104302112542357
Construction land1123263101061474015022976
Unused land1801231216
Area increase (2019)573557219521191542314
Total area (2019)17,30536,78013722295689717
Table 4. Spatio-temporal characteristics of water conservation (2000–2019).
YearWater Conservation Per Unit Area
(mm)
Total Water Conservation
(×108 m3)
Water Conservation Capacity (>300 mm)
Area (×108 m2)Ratio (%)
2000255.38153.95233.8635.38
2001275.63165.22269.0640.70
2002391.12234.11428.4964.82
200394.6057.4324.973.78
2004132.2179.8974.4511.26
2005310.37187.43237.8935.99
2006206.37124.36157.6323.85
2007269.48162.40212.6832.18
2008231.46138.18155.7323.56
2009285.79171.47264.4140.00
2010438.04262.49393.1359.48
2011162.6997.2656.368.53
2012481.06286.89492.4574.50
2013269.52162.16239.9136.30
2014330.27198.27325.1449.19
2015506.66303.44500.4575.71
2016554.82334.69552.4483.58
2017253.59153.40194.4729.42
2018313.92188.77320.2648.45
2019518.08309.02499.8075.61
Table 5. The contribution table of changes in climate and LUCC to changes in water conservation.
LUCC in the Base Period
Climate in the Base Period
LUCC in the Base Period
Climate in the Change Period
Climate in the Base Period
LUCC in the Change Period
Climate in the Change Period
Average annual water conservation depth (mm)234.45384.77232.59382.66
Mutant average 150.32−1.86148.21
The percentage of the variable volume (%) 98.781.22
Table 6. The value of the one-way factor and the interaction (q).
Precipitation EvapotranspirationNDVISoil TypesDEMPOPGDPLand Use
Precipitation 0.44
Evapotranspiration0.54 0.31
NDVI0.63 0.42 0.22
Soil types0.62 0.42 0.27 0.21
DEM0.60 0.42 0.26 0.25 0.18
POP0.54 0.36 0.23 0.22 0.21 0.07
GDP0.54 0.36 0.23 0.22 0.20 0.09 0.07
Land use0.59 0.40 0.25 0.25 0.24 0.19 0.19 0.18
Publisher’s Note: MDPI stays neutral with regard to jurisdictional claims in published maps and institutional affiliations.