
Study on Interface Interaction between Uniaxial Geogrid Reinforcement and Soil Based on Tensile and Pull-Out Tests

 , , ,
, , ,
Abstract
:1. Introduction
2. Experimental Preparation
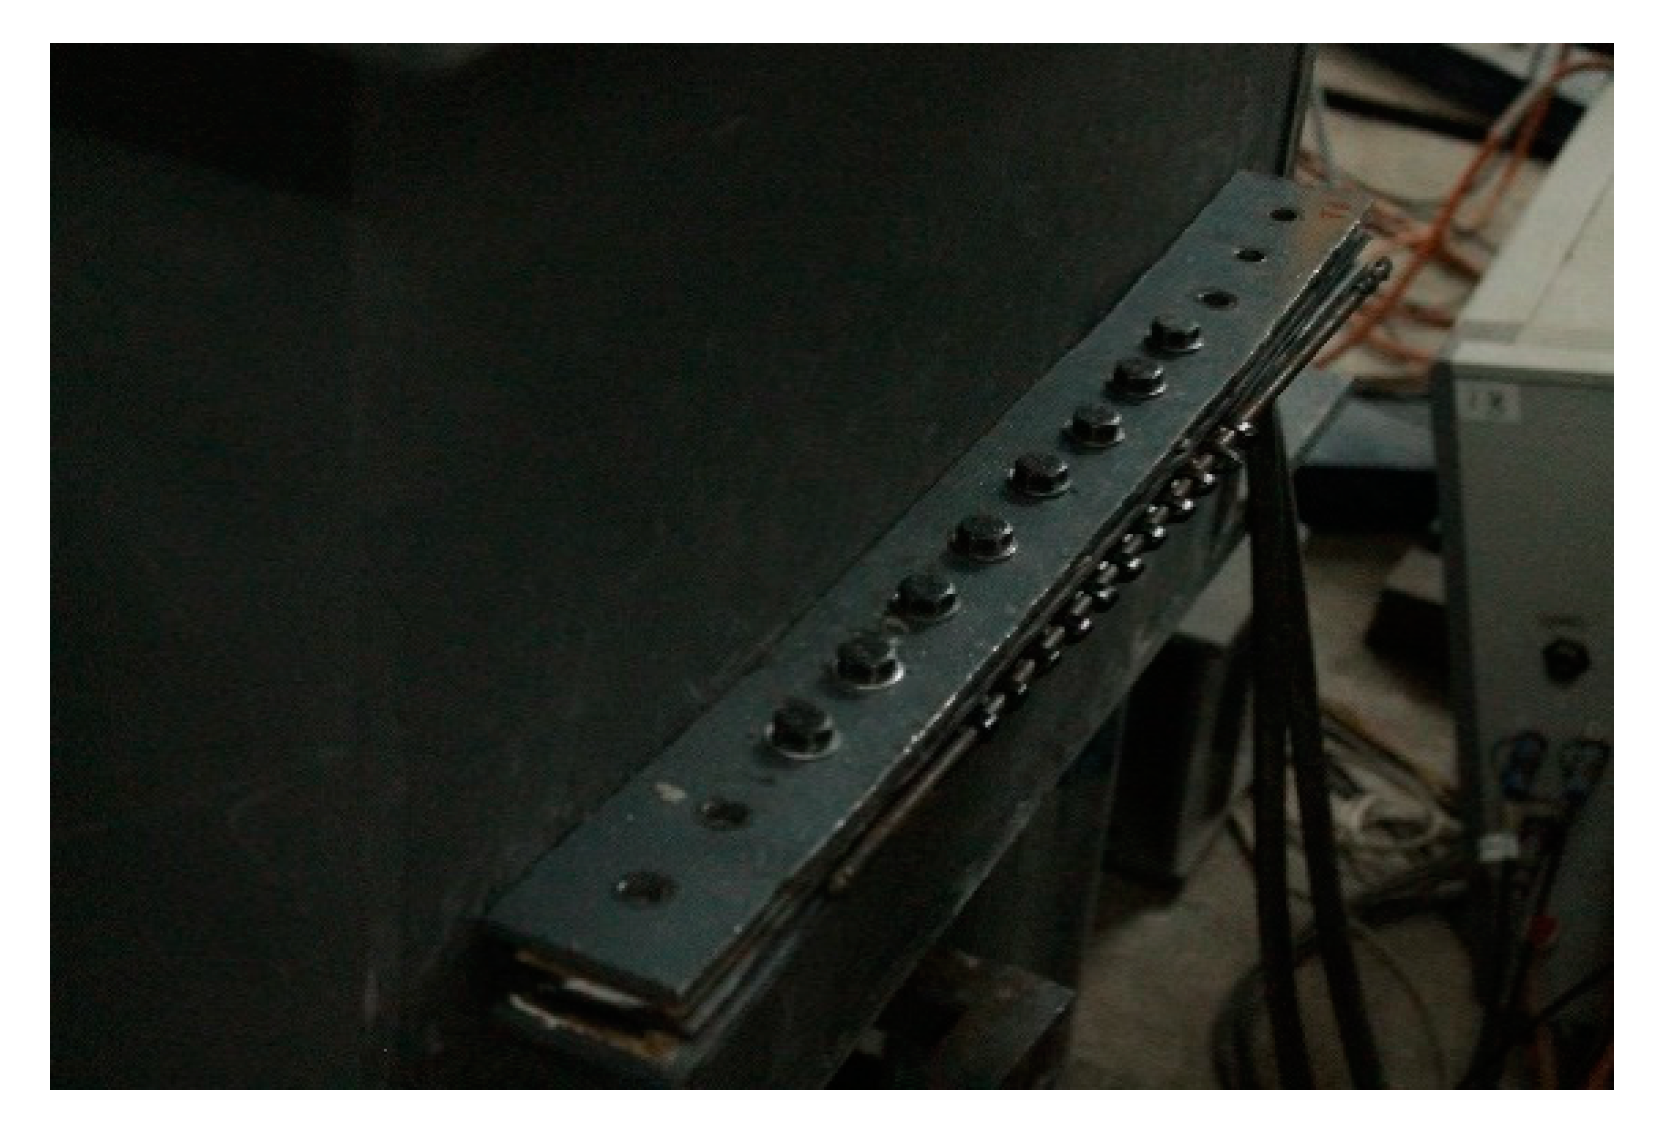
2.1. Testing Apparatus
2.2. Material Used
2.2.1. Sand
2.2.2. Geogrid
2.3. Testing Program
3. Results
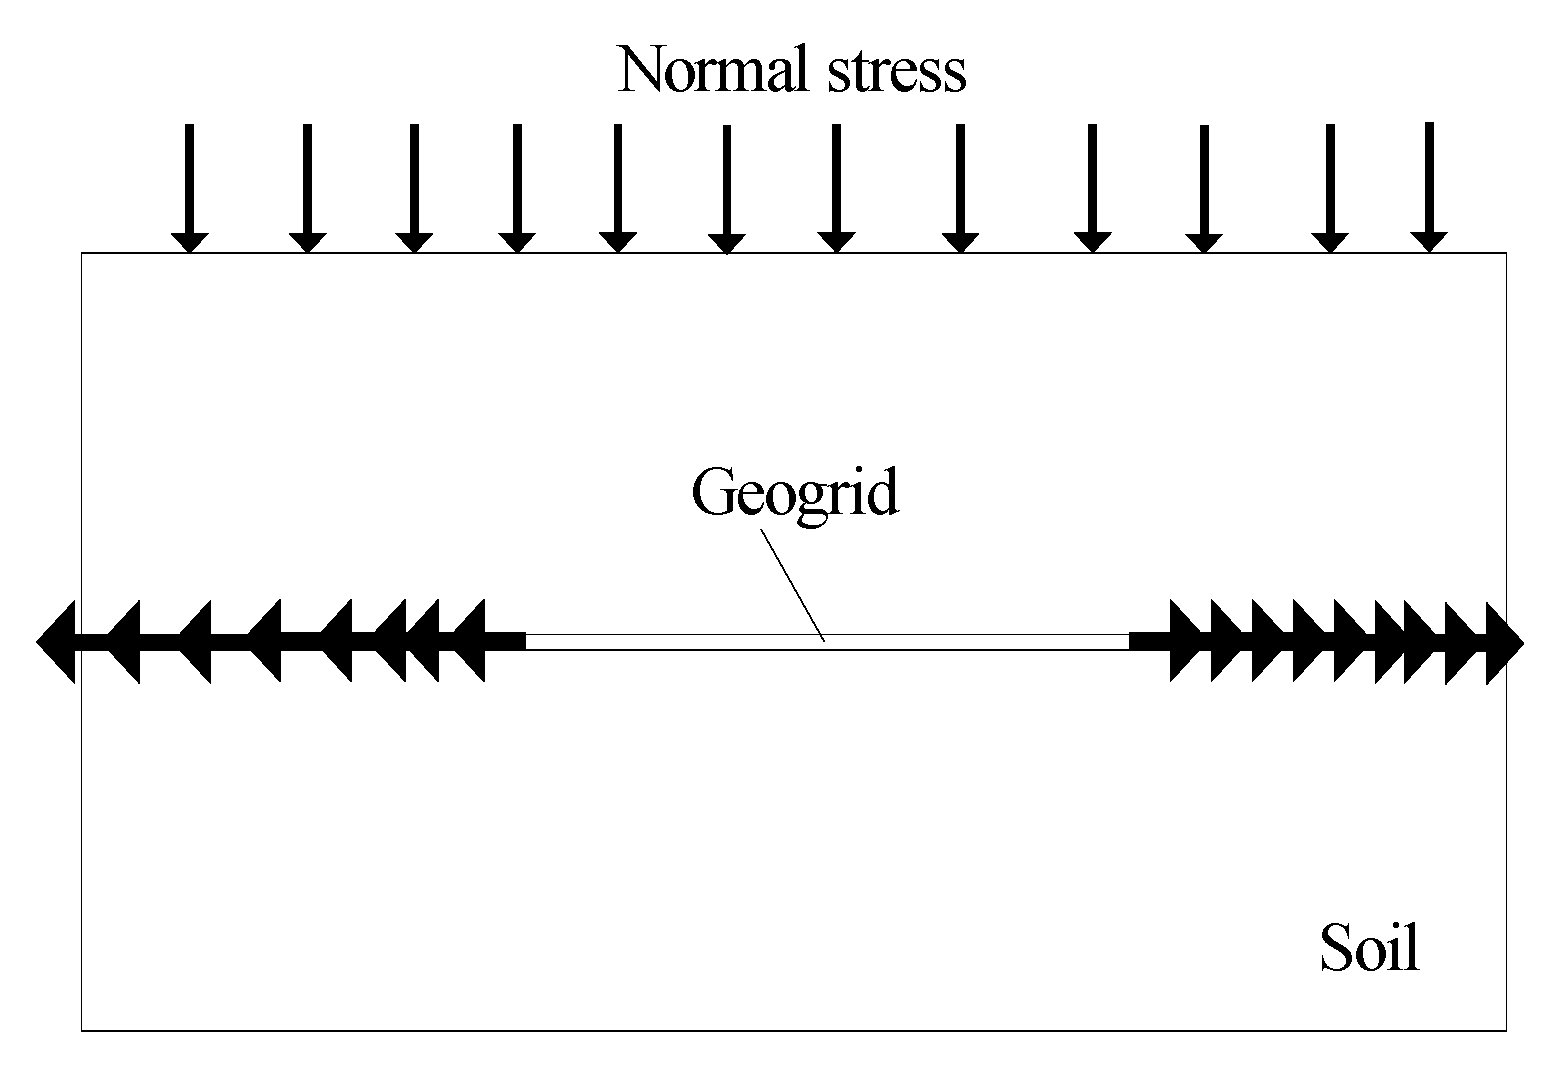
3.1. Tensile Test
3.1.1. Effect of Normal Stress
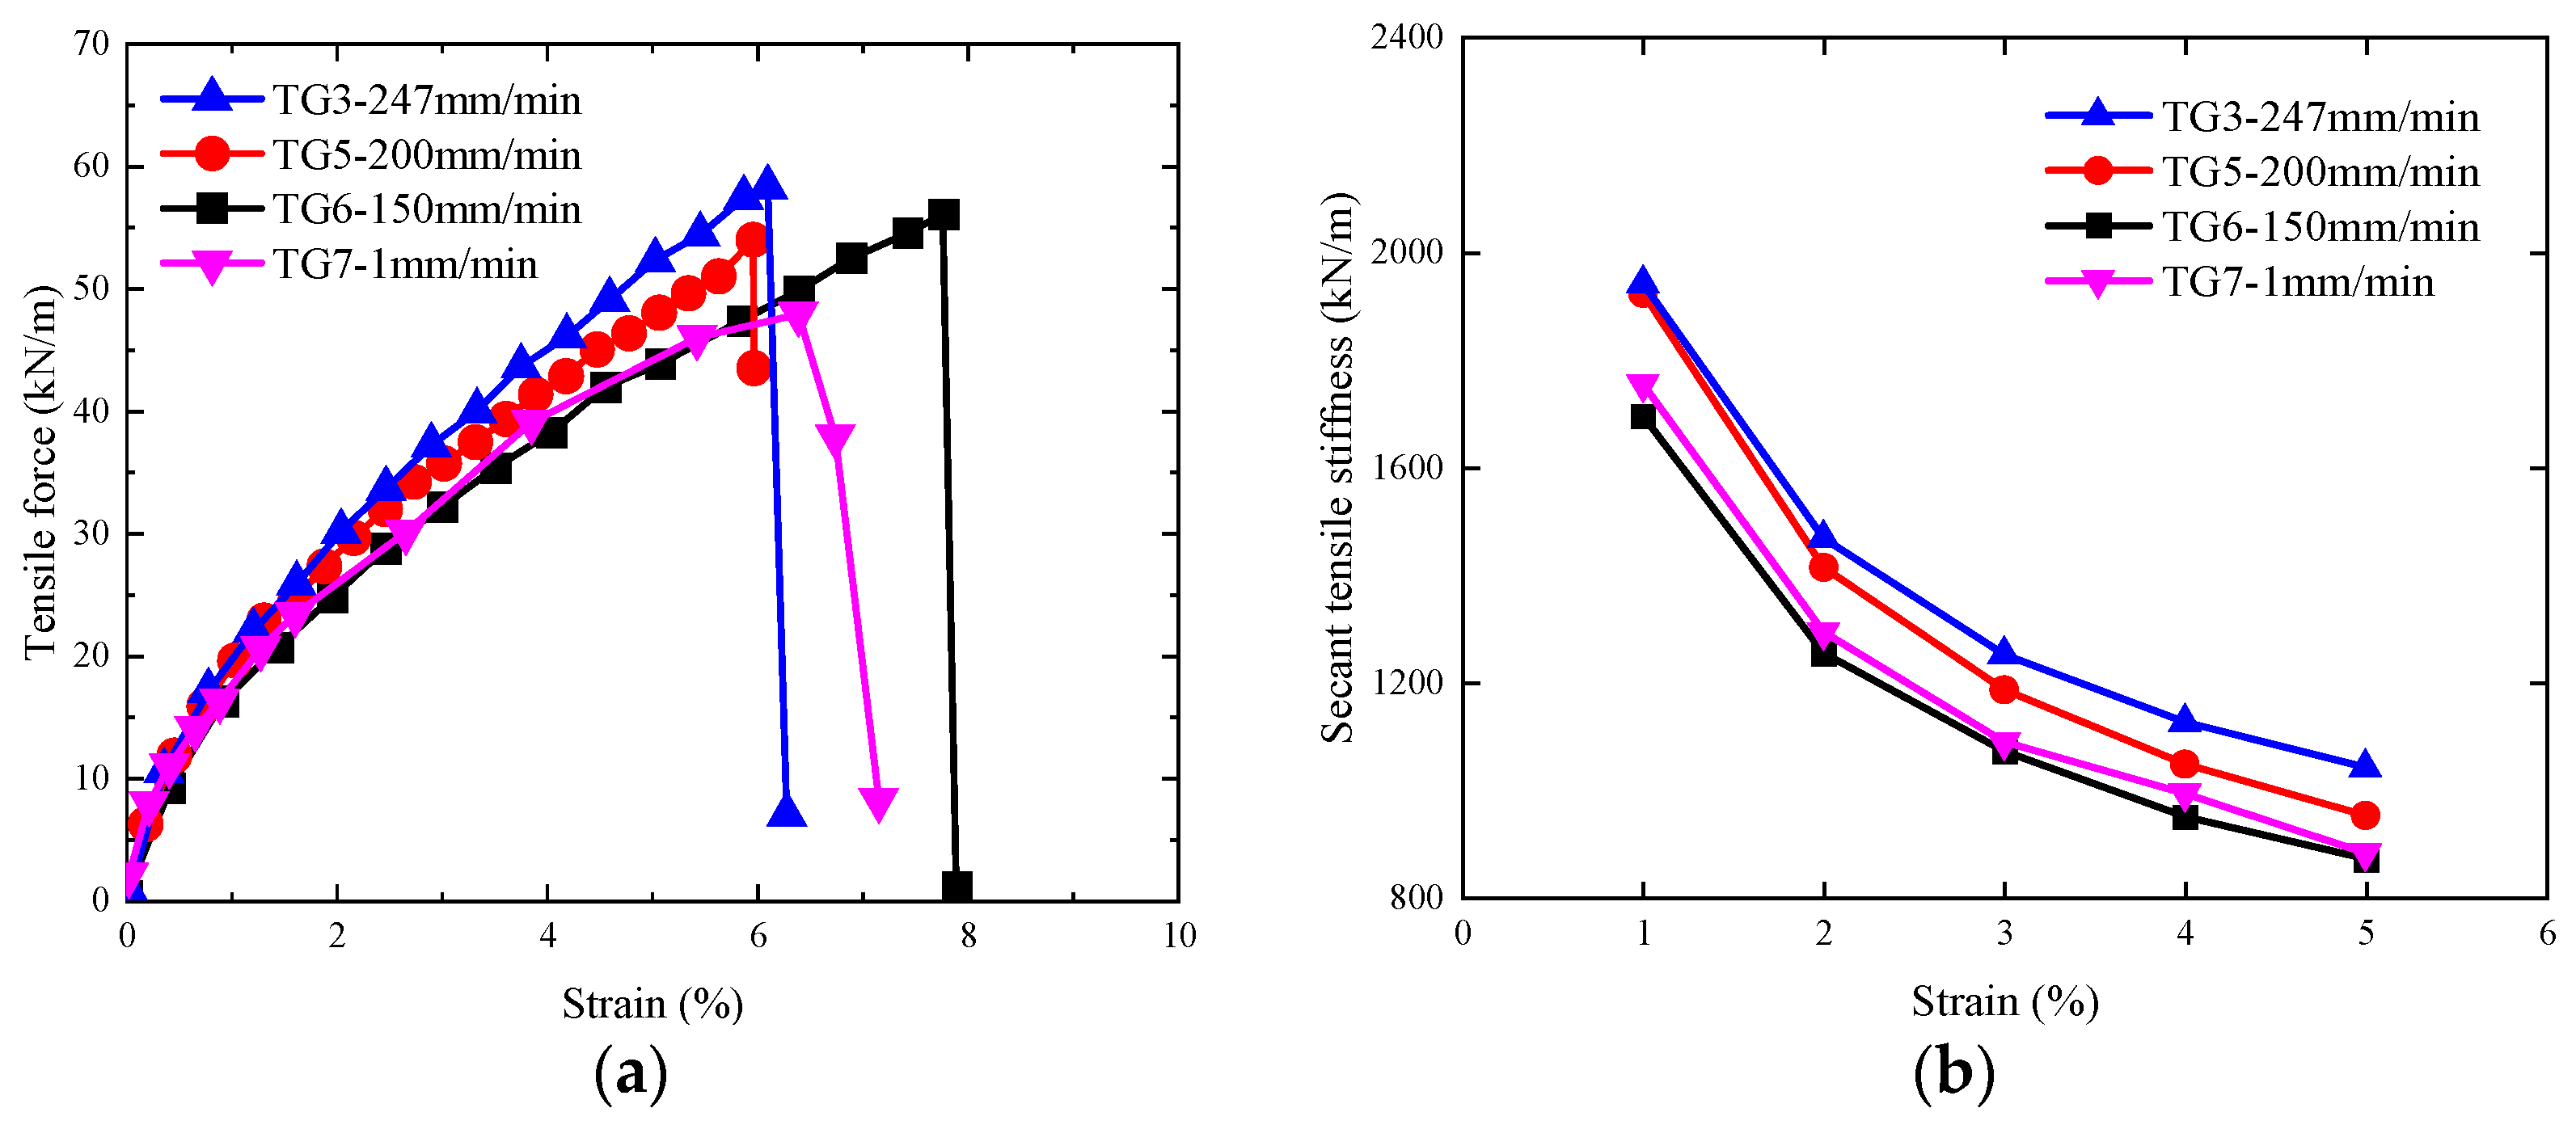
3.1.2. Effect of Loading Rate
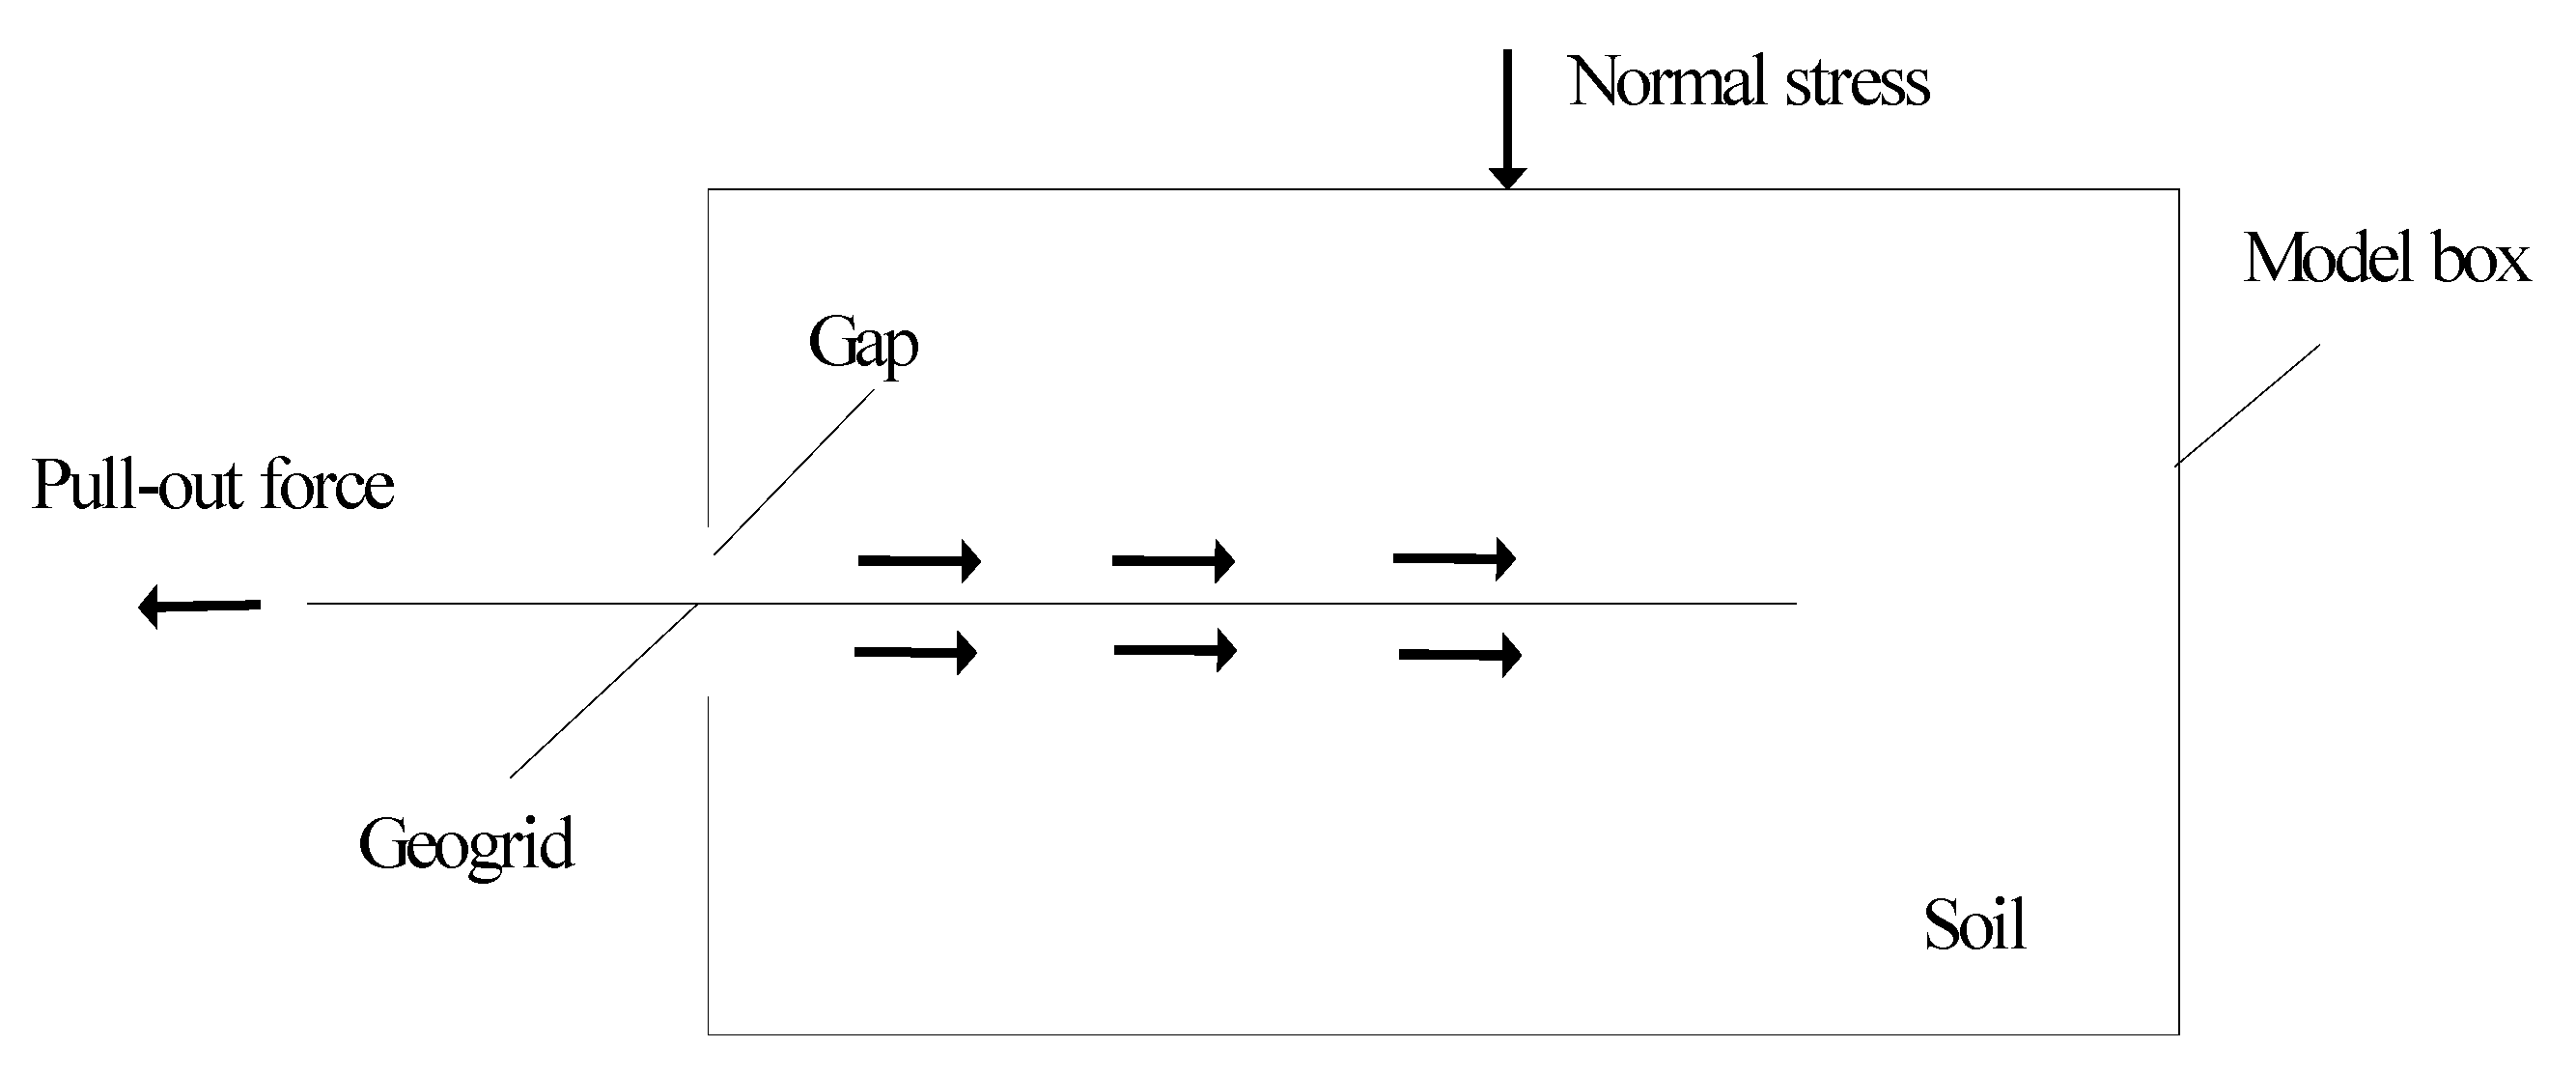
3.2. Pull-Out Test
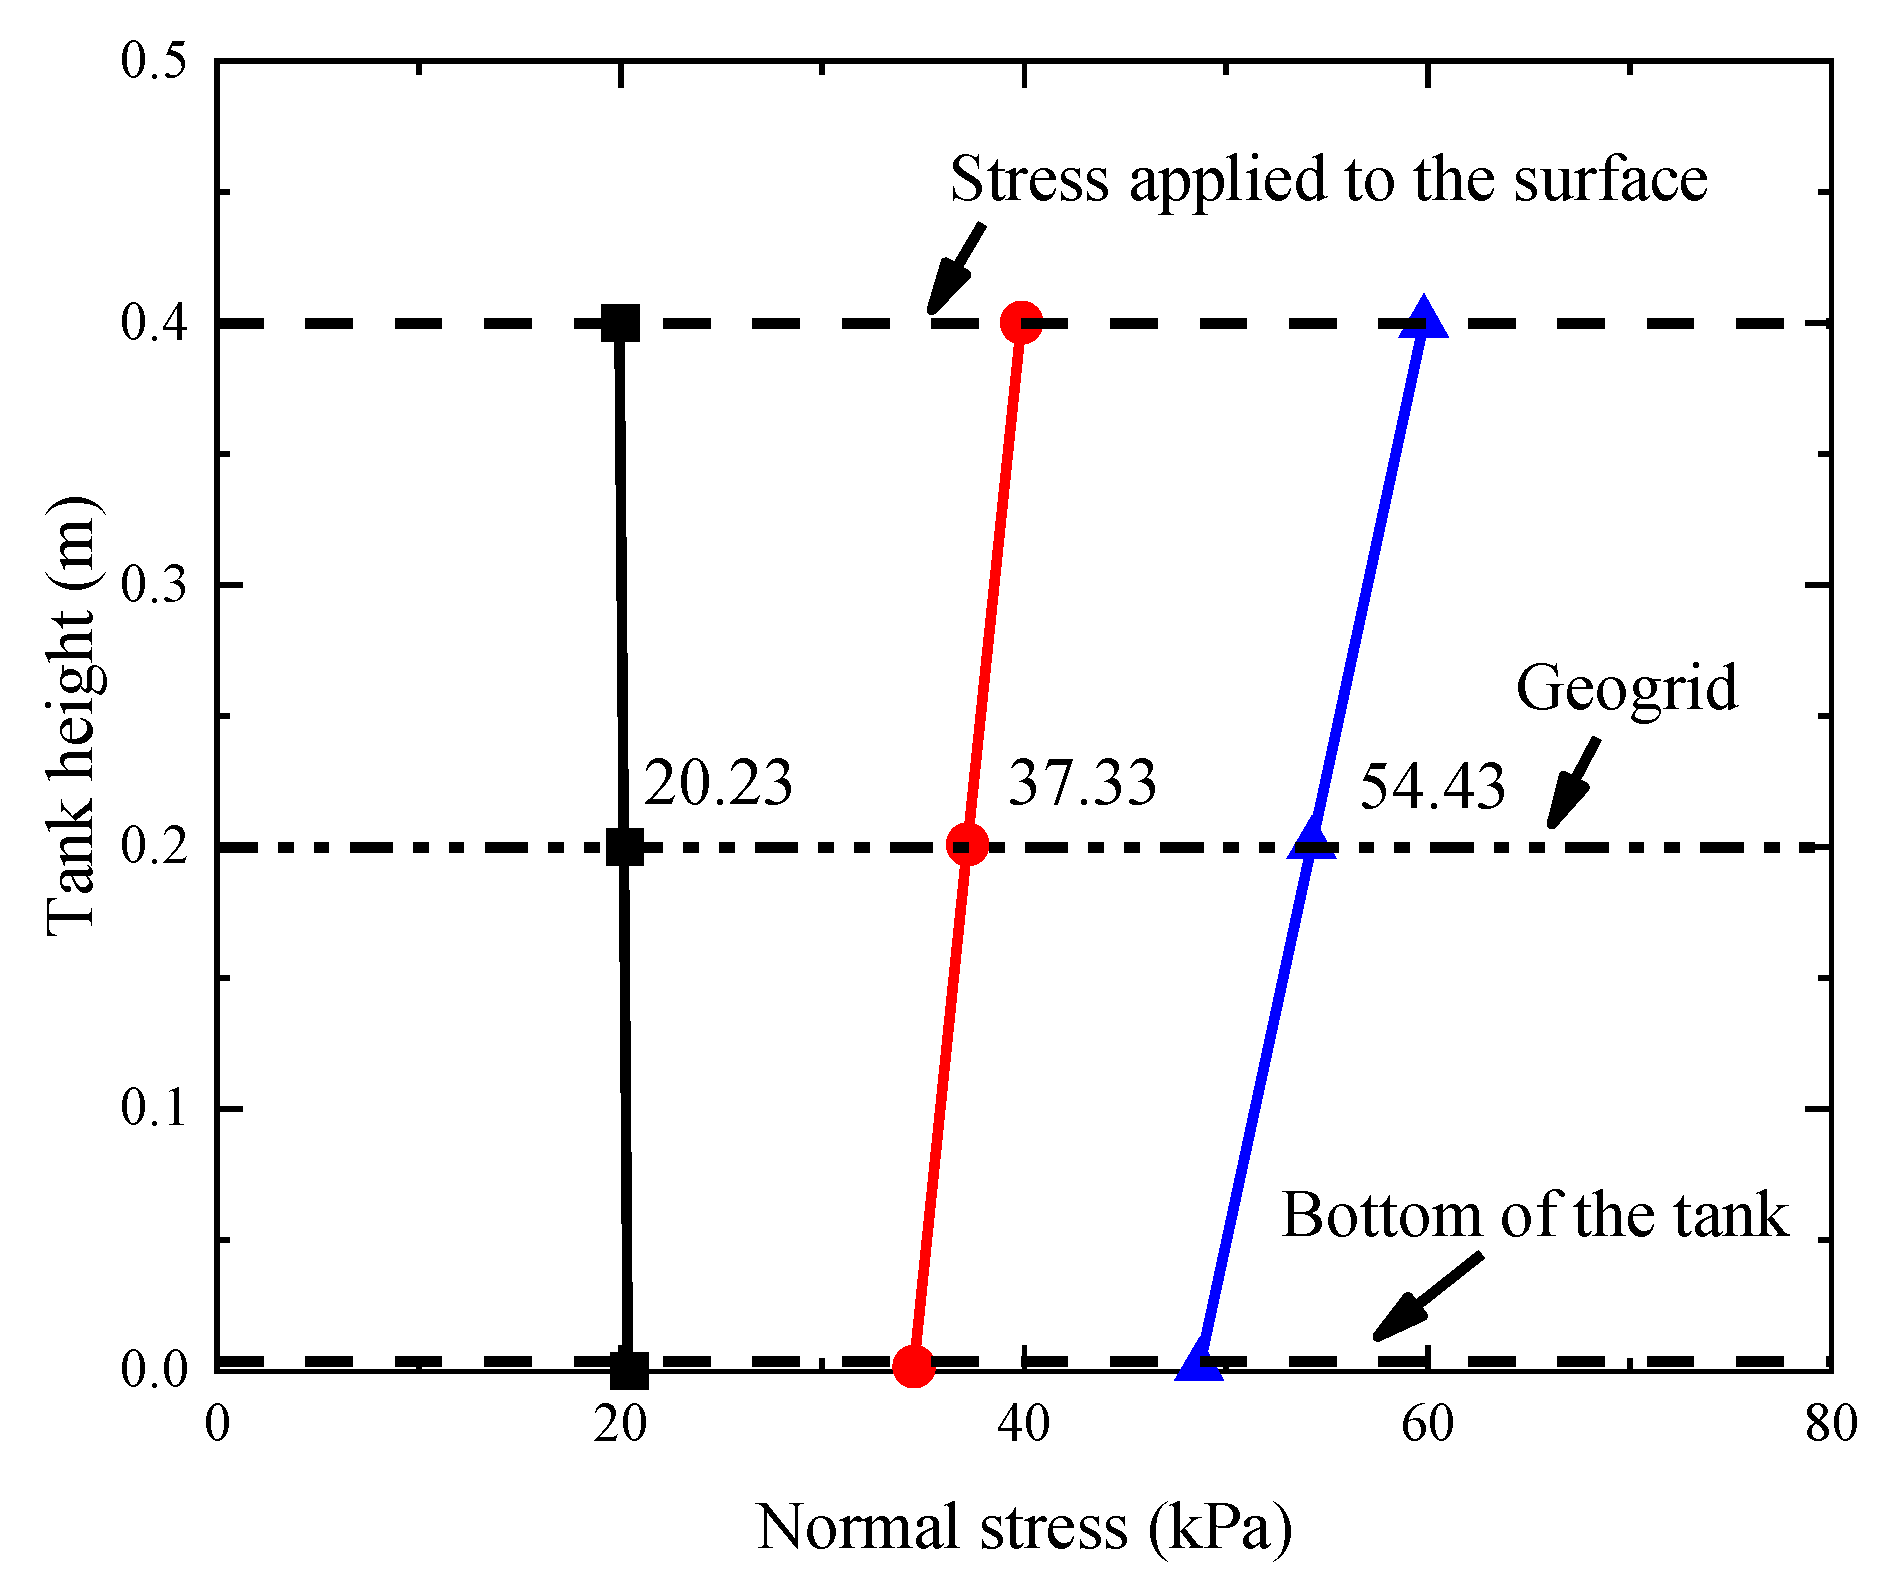
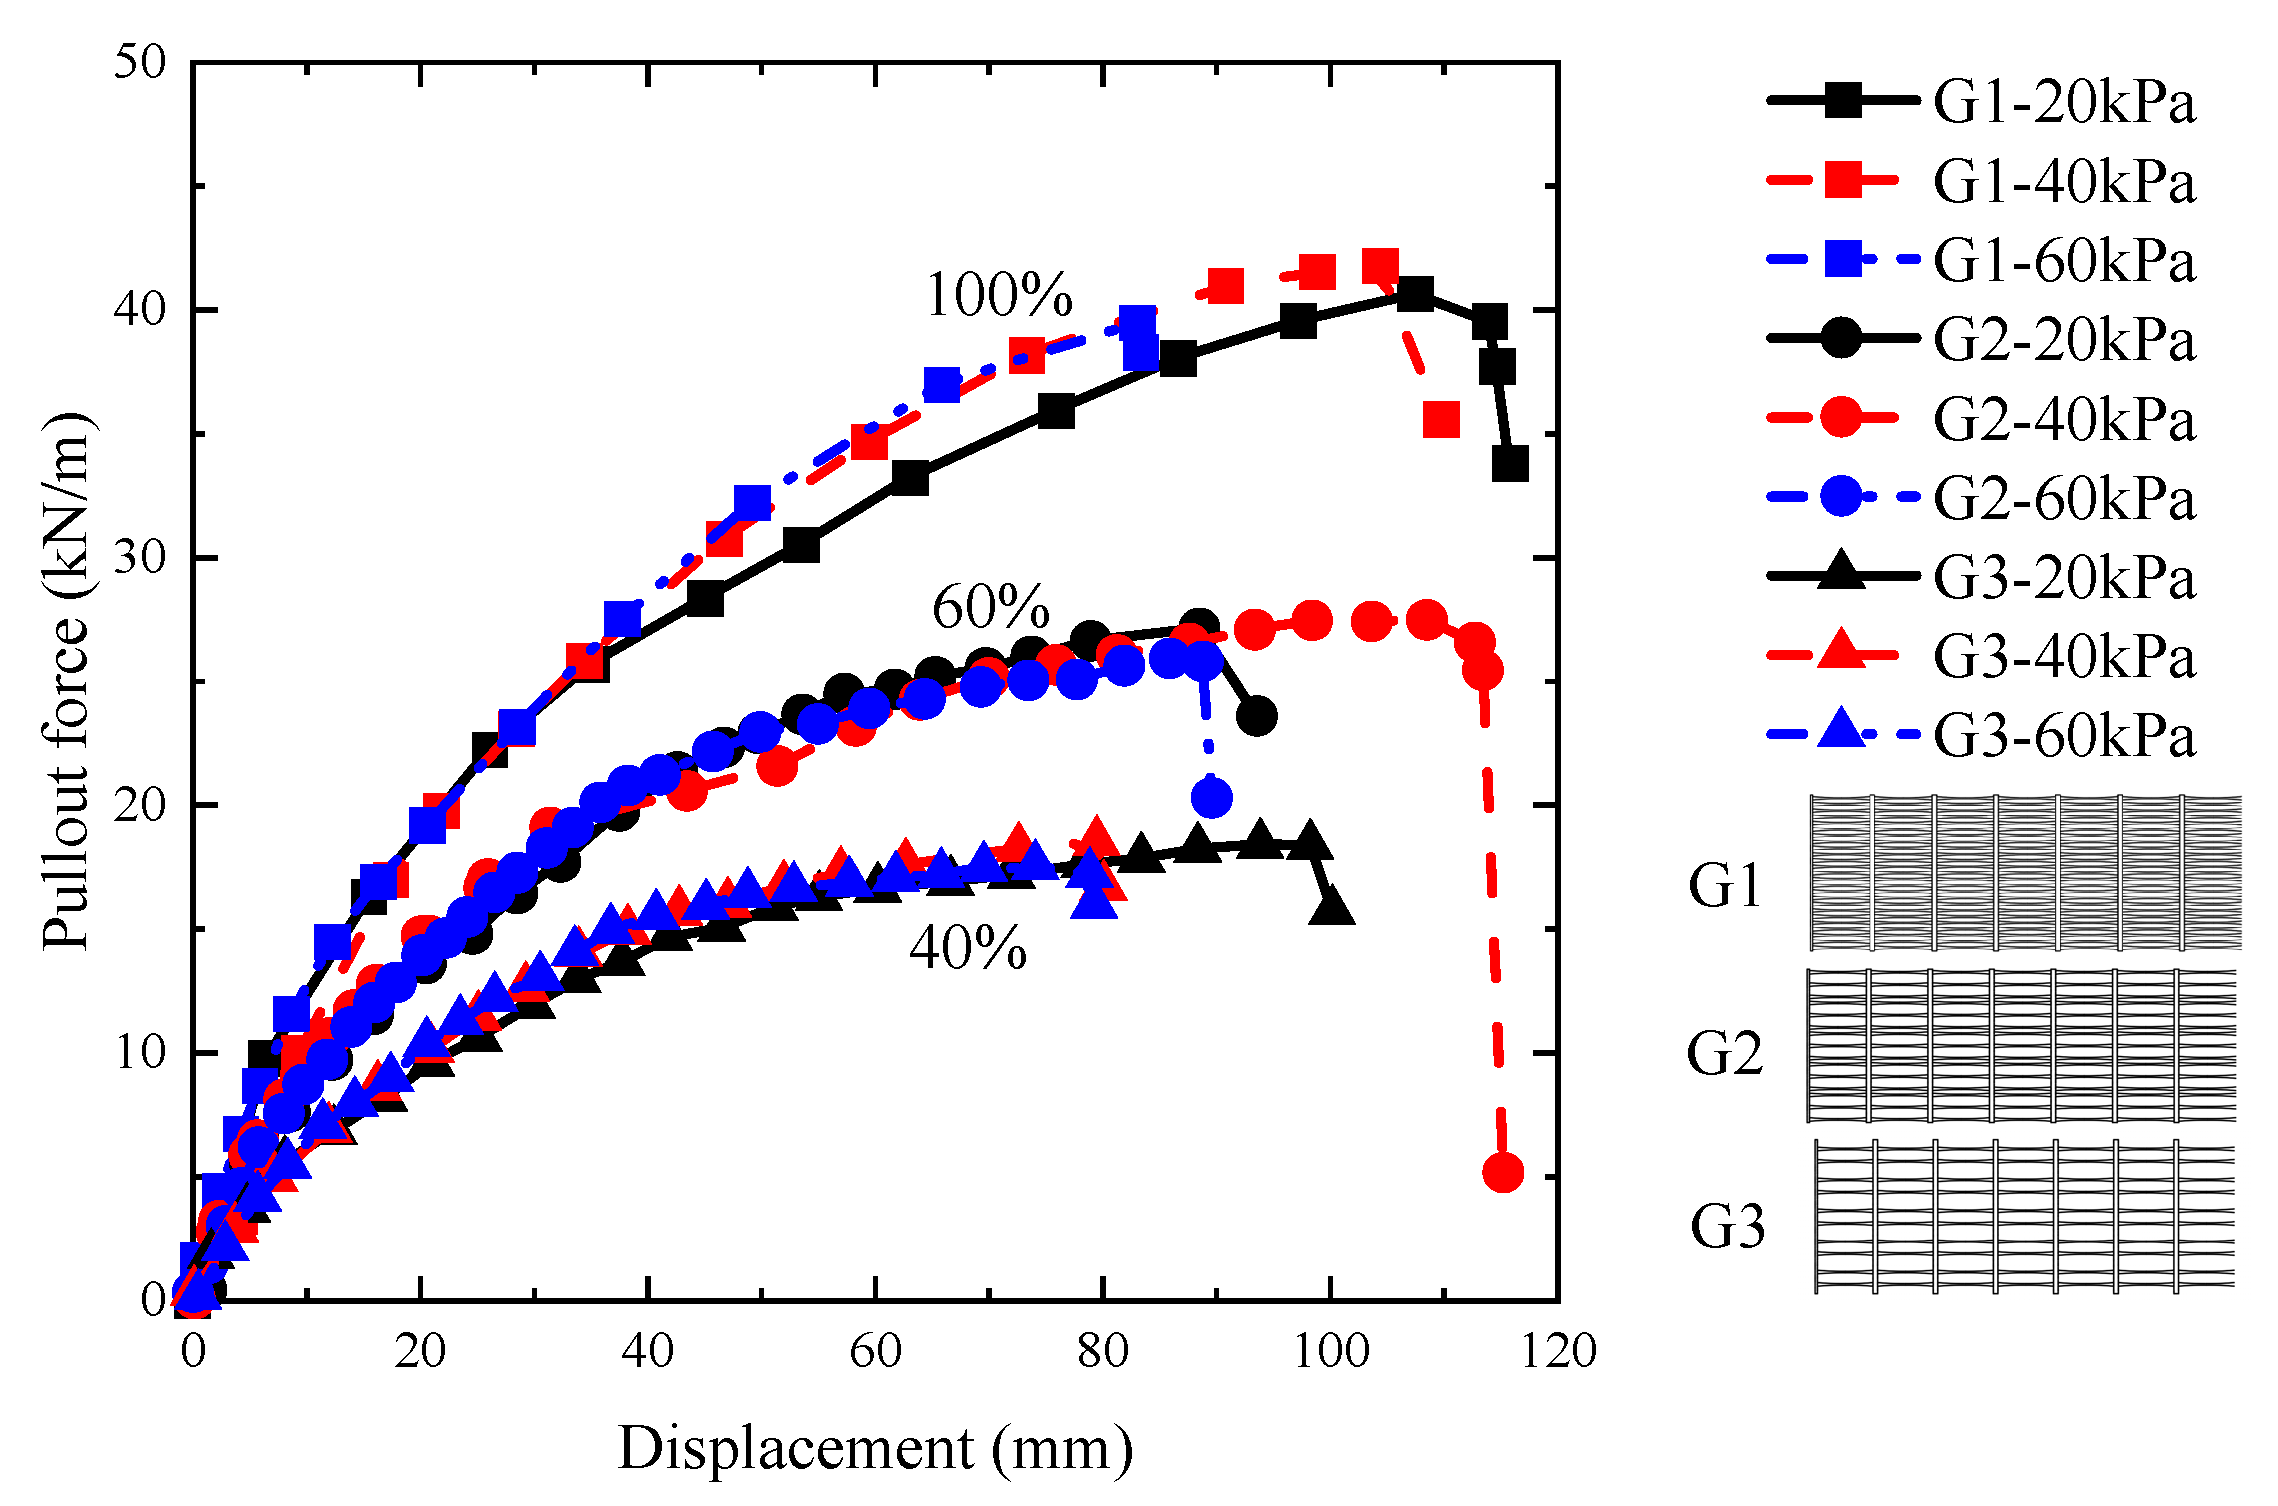
3.2.1. Effect of Normal Stress
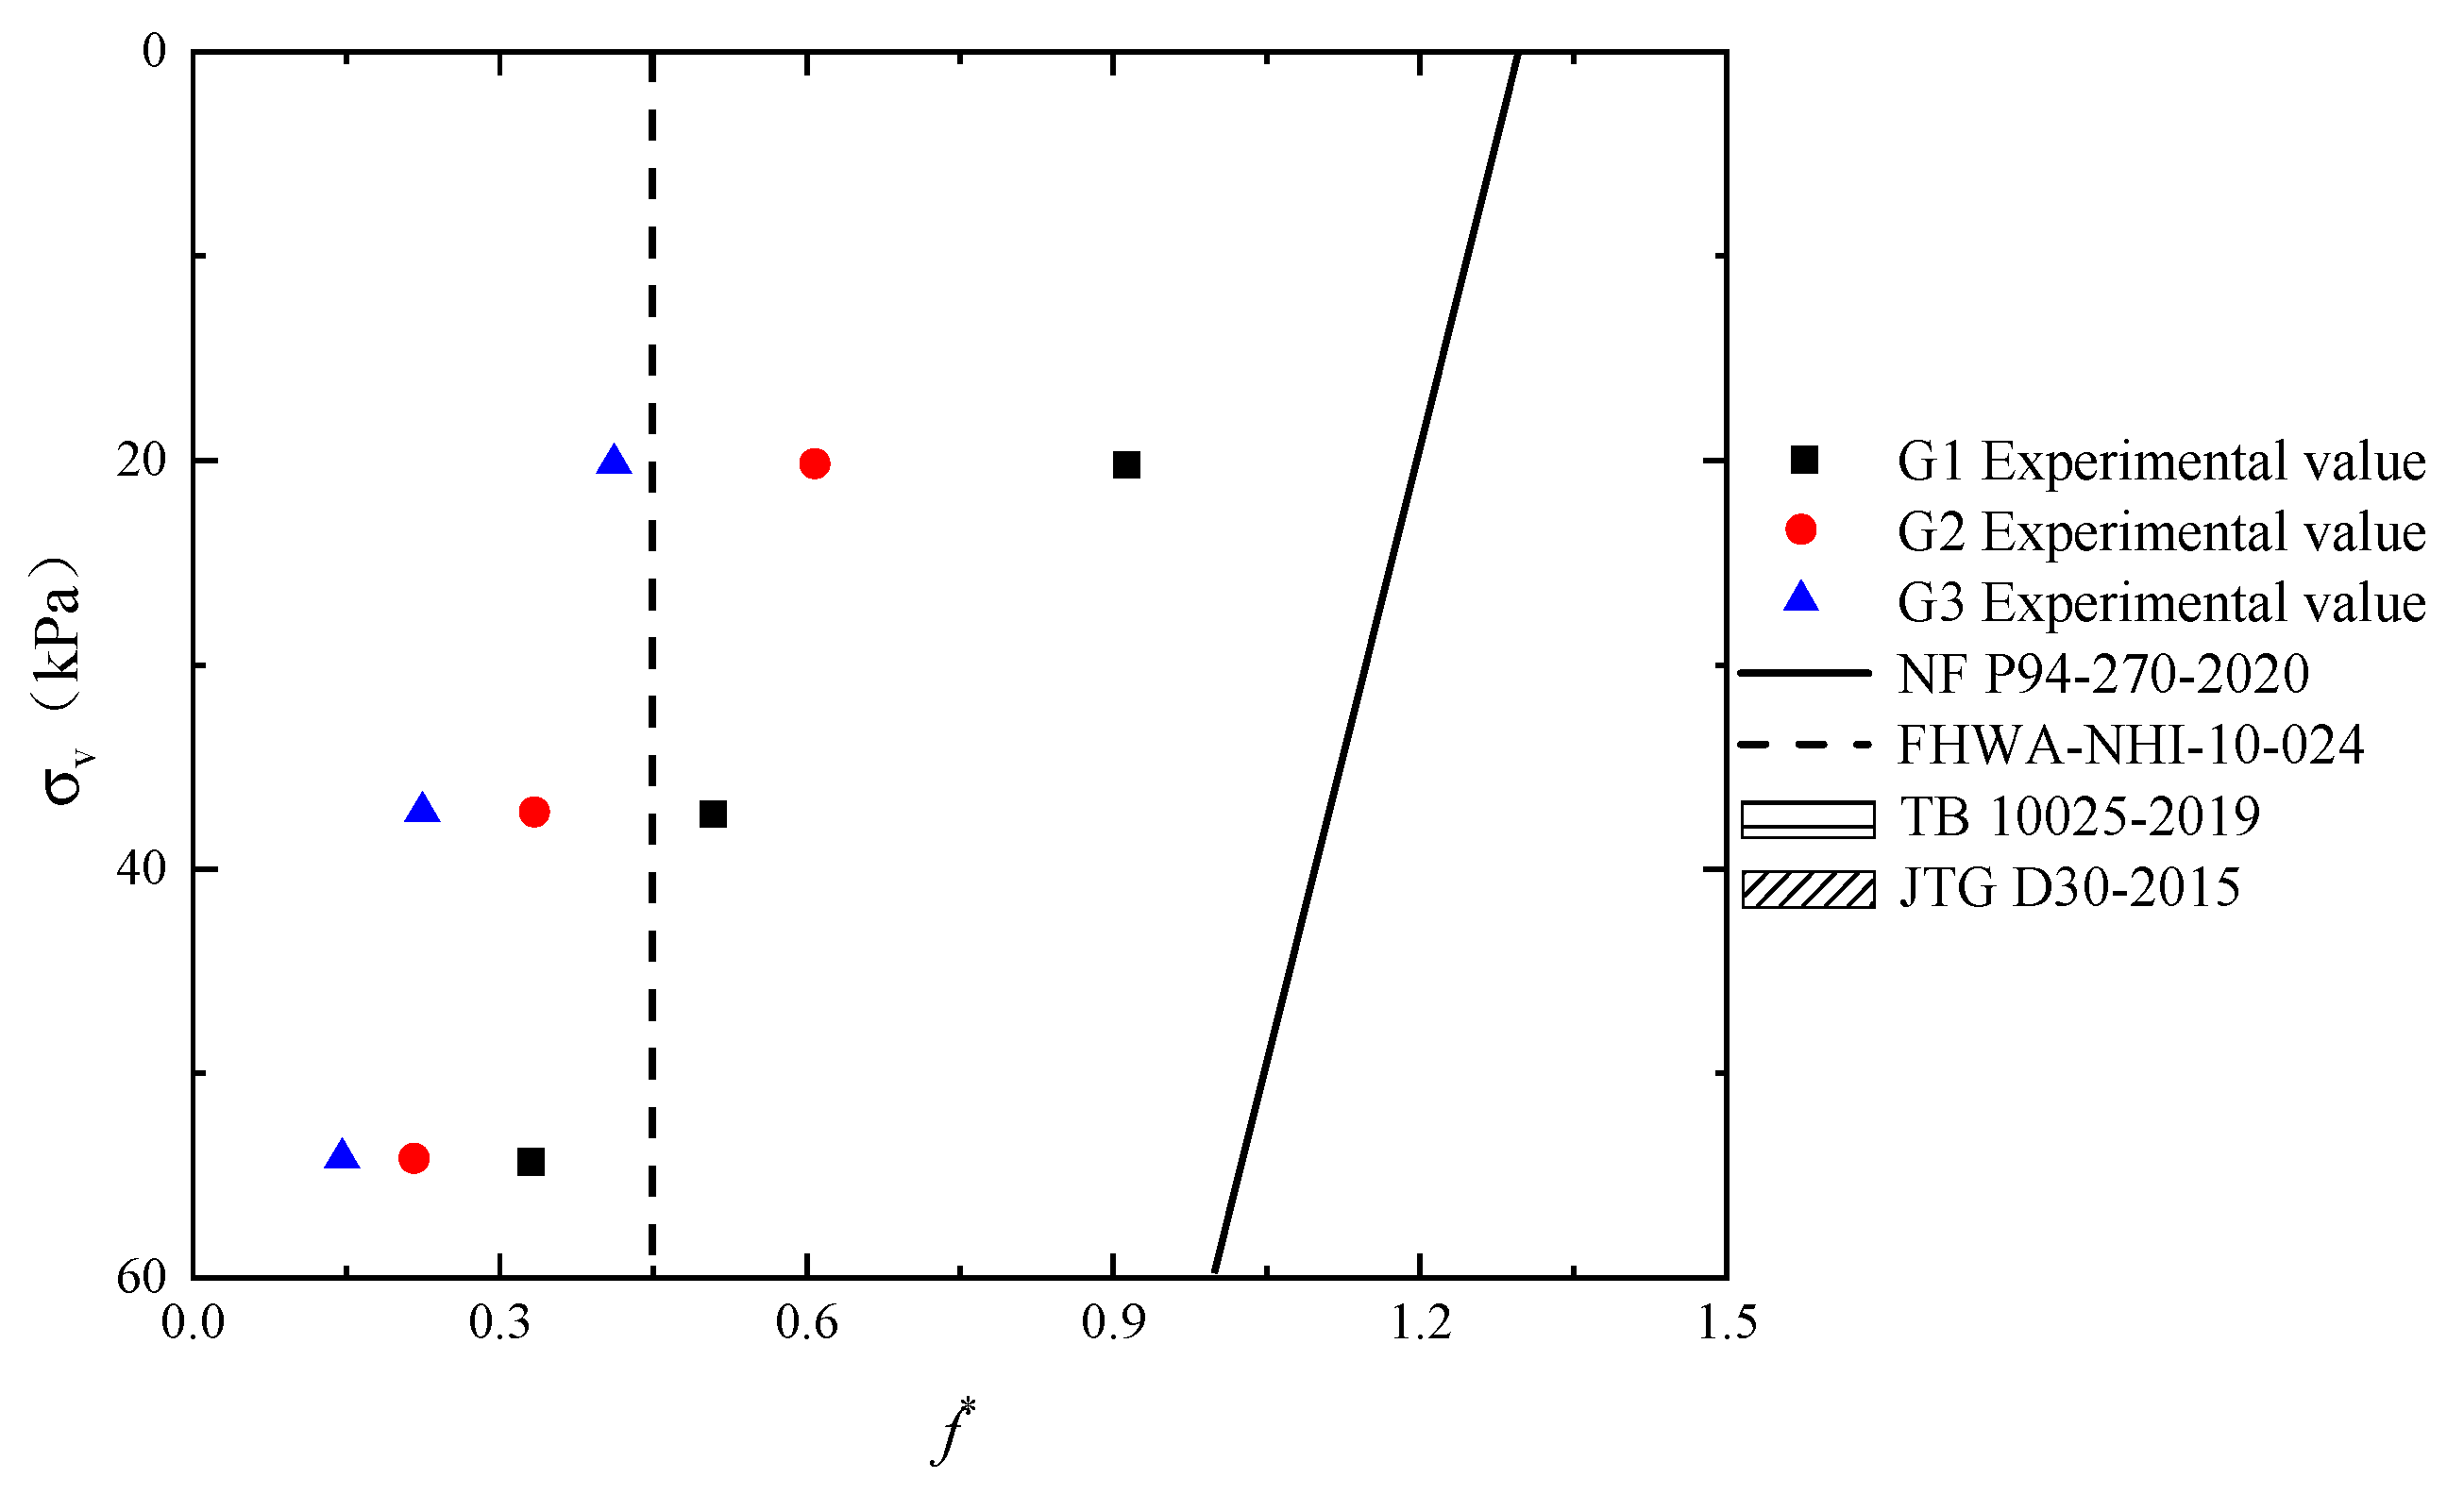
3.2.2. Apparent Friction Coefficient
4. Conclusions
Author Contributions
Funding
Institutional Review Board Statement
Informed Consent Statement
Data Availability Statement
Acknowledgments
Conflicts of Interest
Appendix A

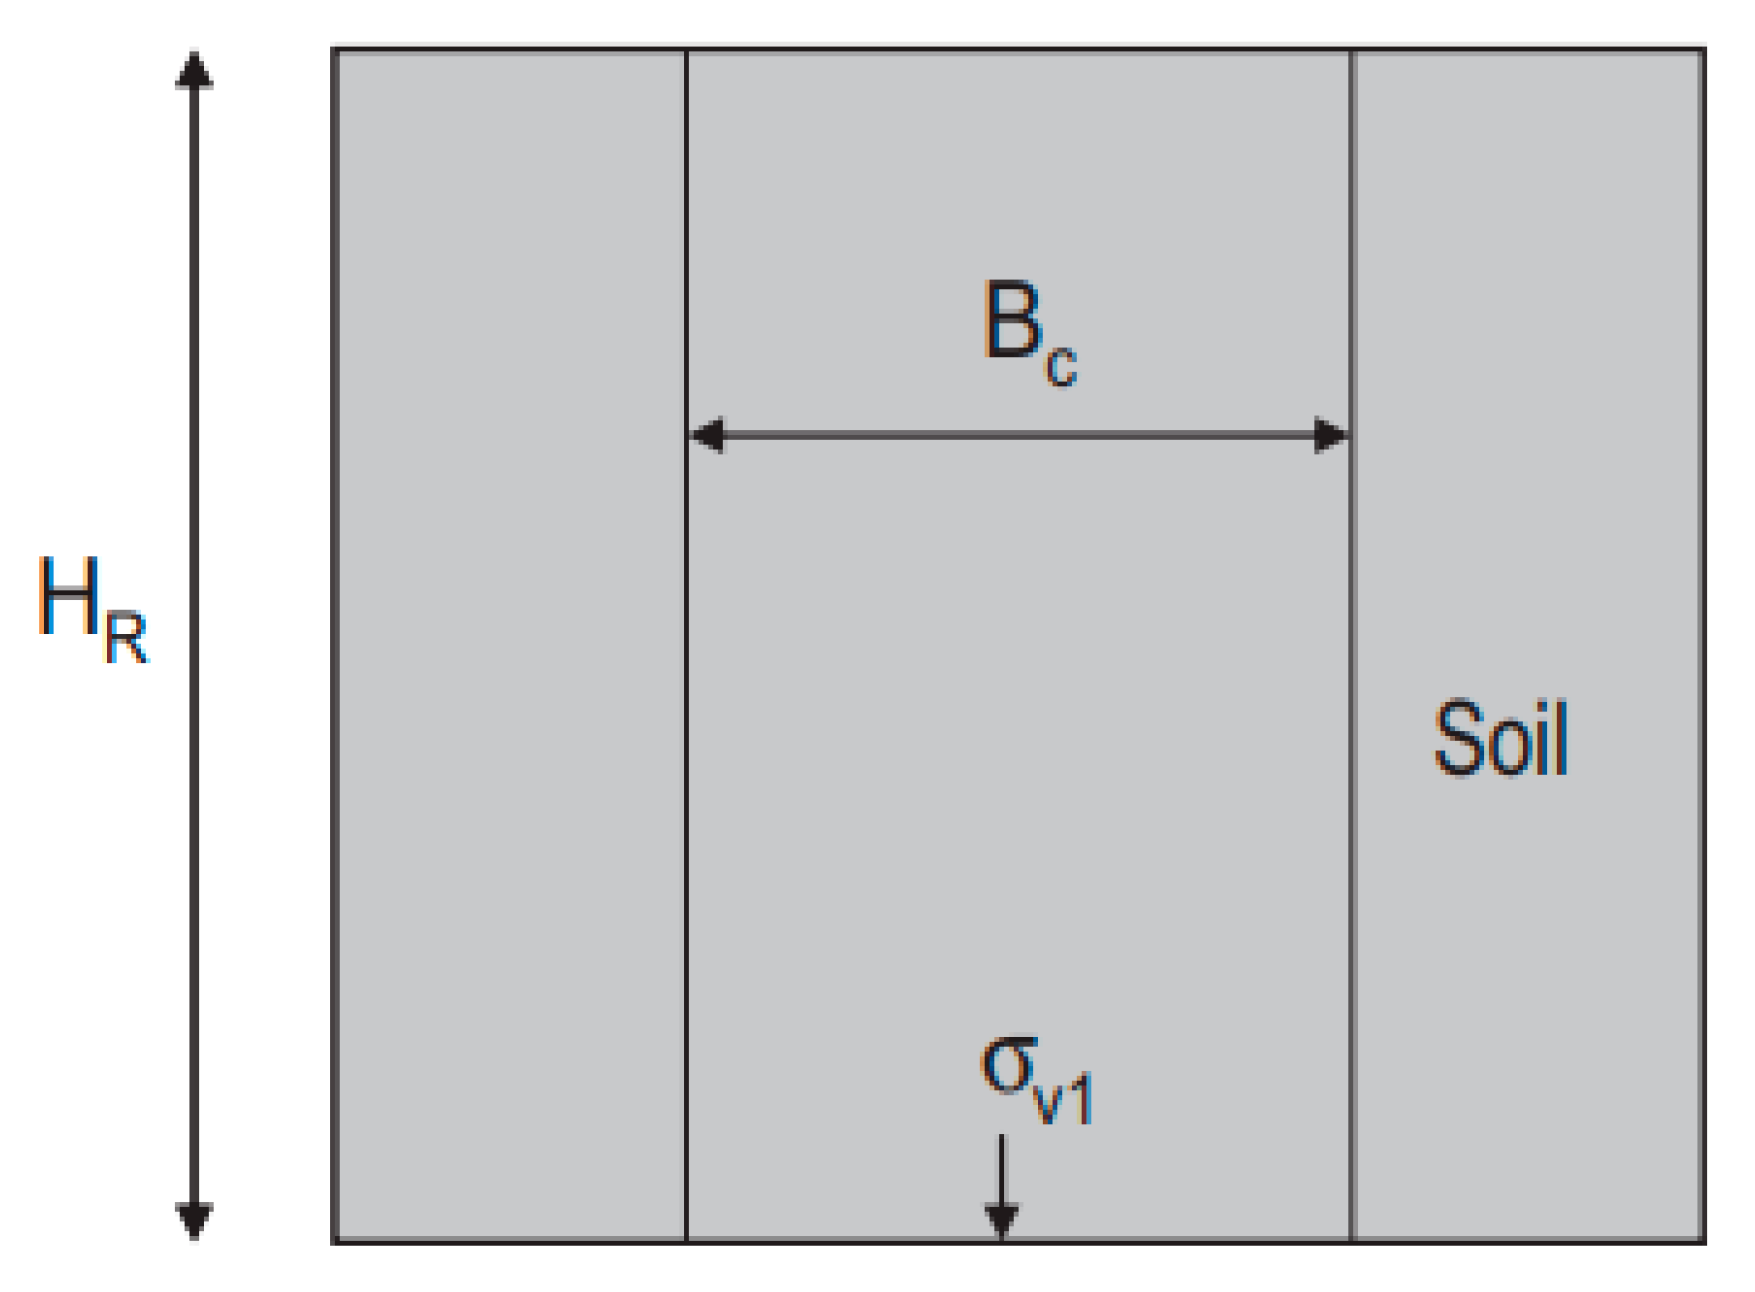
| Parameter | Definition | Figure |
|---|---|---|
| Ka | Coefficient of active earth pressure, in this case Ka = K0 | 0.34 |
| BC (m) | Width of soil column | 0.7 |
| HR (m) | Soil height | 0.4 |
| He (m) | Equivalent soil settlement height | 0.4 |
| σv (kPa) | Normal stress along soil column | - |
| σv1 (kPa) | Normal stress at the bottom of soil column | - |
| σ0 (kPa) | Load | 0 |
| φR (°) | Internal friction angle of soil | 41 |
References
- Current Situation Analysis of Geosynthetics Industry in China. Available online: https://mp.weixin.qq.com/s/YcJmMIBzE7-482k1tRUkYw (accessed on 26 January 2021).
- Yoo, C.; Kim, S.-B. Performance of a two-tier geosynthetic reinforced segmental retaining wall under a surcharge load: Full-scale load test and 3D finite element analysis. Geotext. Geomembr. 2008, 26, 460–472. [Google Scholar] [CrossRef]
- Leshchinsky, D.; Imamoglu, B.; Meehan, C.L. Exhumed geogrid-reinforced retaining wall. J. Geotech. Geoenviron. 2010, 136, 1311–1323. [Google Scholar] [CrossRef]
- Koerner, R.M.; Koerner, G.R. A data base, statistics and recommendations regarding 171 failed geosynthetic reinforced mechanically stabilized earth (MSE) walls. Geotext. Geomembr. 2013, 40, 20–27. [Google Scholar] [CrossRef]
- Abdesssemed, M.; Kenai, S.; Bali, A. Experimental and numerical analysis of the behavior of an airport pavement reinforced by geogrids. Constr. Build. Mater. 2015, 94, 547–554. [Google Scholar] [CrossRef]
- Li, S.; Cai, X.; Jing, L.; Xu, H.; Huang, X.; Zhu, C. Lateral displacement control of modular-block reinforced soil retaining walls under horizontal seismic loading. Soil Dyn. Earthq. Eng. 2021, 141, 106485. [Google Scholar] [CrossRef]
- Li, S.; Cai, X.; Jing, L.; Xu, H.; Huang, X.; Zhu, C. Reinforcement strain and potential failure surface of geogrid reinforced soil-retaining wall under horizontal seismic loading. Shock Vib. 2020, 2020, 8864256. [Google Scholar] [CrossRef]
- Cai, X.; Li, S.; Xu, H.; Jing, L.; Huang, X.; Zhu, C. Shaking table study on the seismic performance of geogrid reinforced soil retaining wall. Adv. Civ. Eng. 2021, 2021, 6668713. [Google Scholar] [CrossRef]
- Cai, X.; Li, S.; Huang, X. Shaking table tests on dynamic characteristics of two-stage reinforced soil-retaining wall. China J. Highw. Transp. 2018, 31, 200–207. [Google Scholar]
- Keller, G.R. Experiences with mechanically stabilized structures and native soil backfill. Transport. Res. Rec. 1995, 1474, 30–38. [Google Scholar]
- Lopes, M.L.; Ladeira, M. Influence of the confinement, soil density and displacement rate on soilegeogrid interaction. Geotext. Geomembr. 1996, 14, 543–554. [Google Scholar] [CrossRef]
- Yang, G.; Xu, C.; Zhang, M. Geosynthetics Reinforcement Soil Structure Application Guidance, 1st ed.; China Communications Press Co. Ltd.: China, Beijing, 2016; pp. 35–42. [Google Scholar]
- Palmeira, E.M. Soil-geosynthetic interaction: Modelling and analysis. Geotext. Geomembr. 2009, 27, 368–390. [Google Scholar] [CrossRef]
- Kokkalis, A.; Papacharisis, N. A simple laboratory method to estimate the in soil behaviour of geotextiles. Geotext. Geomembr. 1989, 8, 147–157. [Google Scholar] [CrossRef]
- Juran, I.; Christopher, B. Laboratory model study on geosynthetic reinforced soil retaining walls. J. Geotech. Eng. 1989, 115, 905–926. [Google Scholar] [CrossRef]
- Wu, J.T.H.; Tatsuoka, F. Discussion of “laboratory model study on geosynthetic reinforced soil retaining walls” by I. Juran and B. Christopher (July 1989, Vol. 115, No.7). J. Geotech. Eng. 1992, 118, 496–498. [Google Scholar] [CrossRef]
- McGown, A.; Yogarajah, I.; Andrawes, K.Z.; Saad, M.A. Strain behaviour of polymeric geogrids subjected to sustained and repeated loading in air and in soil. Geosynth. Int. 1995, 2, 341–355. [Google Scholar] [CrossRef]
- Mendes, M.J.A.; Palmeira, E.M.; Matheus, E. Some factors affecting the in-soil load strain behaviour of virgin and damaged nonwoven geotextiles. Geosynth. Int. 2007, 14, 39–50. [Google Scholar] [CrossRef]
- Yang, G.; Li, G.; Zhang, B. Experimental studies on interface friction characteristics of geogrids. Chin. J. Geotech. Eng. 2006, 28, 948–952. [Google Scholar]
- Tang, X.; Zheng, Y.; Wang, Y.; Feng, Y. Study on the reasonable size of geo-grid meshes. Rock Soil Mech. 2017, 38, 1583–1588. [Google Scholar]
- Teixeira, S.H.C.; Bueno, B.S.; Zornberg, J.G. Pullout resistance of individual longitudinal and transverse geogrid ribs. J. Geotech. Geoenviron. 2007, 133, 37–50. [Google Scholar] [CrossRef] [Green Version]
- Esfandiari, J.; Selamat, M.R. Laboratory investigation on the effect of transverse member on pull out capacity of metal strip reinforcement in sand. Geotext. Geomembr. 2012, 35, 41–49. [Google Scholar] [CrossRef]
- Cai, X.; Liu, W.; Shen, G.; Huang, X.; Xu, H.; Jin, B.; Zhang, L. A Test Equipment for Geosynthetics. Patent for Utility Models: Langfang China. 2020. Available online: https://www.patentstar.com.cn/Search/Detail?ANE=8CEA9GGD9CFA9GGD9DEA8ECA9DDC9HDG9CIG4BDA9AGECFHA (accessed on 21 June 2022).
- ASTM D6637; Standard Test Method for Determining Tensile Properties of Geogrids by the Single or Multi-rib Tensile Method. ASTM International: West Conshohocken, PA, USA, 2015.
- ASTM D6706-01; Standard Test Method for Measuring Geosynthetic Pullout Resistance in Soil. ASTM International: West Conshohocken, PA, USA, 2013.
- SL235; Specification for test and measurement of geosynthetics. China Water & Power Press: Beijing, China, 2012; pp. 24–26.
- Palmeira, E.M.; Milligan, G.W.E. Scale and other factors affecting the results of pull-out tests of grids buried in sand. Geotechnique 1989, 39, 511–524. [Google Scholar] [CrossRef]
- Balakrishnan, S.; Viswanadham, B.V.S. Evaluation of tensile load-strain characteristics of geogrids through in-soil tensile tests. Geotext. Geomembr. 2016, 45, 35–44. [Google Scholar] [CrossRef]
- Bao, C. Study on interface behavior of geosynthetics and soil. Chin. J. Rock Mech. Eng. 2006, 25, 1735–1744. [Google Scholar]
- Ziegler, M.; Timmers, V. A new approach to design geogrid reinforcement. In Proceedings of the 3rd European Geosynthetics Conference, Munich, Germany, 1–3 March 2004. [Google Scholar]
- Moraci, N.; Recalcati, P. Factors affecting the pullout behaviour of extruded geogrids embedded in a compacted granular soil. Geotext. Geomembr. 2006, 24, 220–242. [Google Scholar] [CrossRef]
- FHWA-NHI-10-024; Design and Construction of Mechanically Stabilized Earth Walls and Reinforced Soil Slopes-Volume I. U.S. Department of Transportation Federal Highway Administration: Washington, DC, USA, 2009.
- TB 10025; Code for Design of Retaining Structures of Railway Earthworks. China Raillway Publishing House Co., Ltd.: Beijing, China, 2019; pp. 46–52.
- JTG D30; Specifications for Design of Highway Subgrades. China Communications Press Co., Ltd.: Beijing, China, 2015; pp. 117–132.
- NF P94-270; Calculs Géotechnique Ouvrages de Soutènement Remblais Renforcés et Massifs en Sol Cloué. Dimensionnement. French, Editions AFNOR: Paris, France, 2020.
- Terzaghi, K. Theoretical Soil Mechanics; John Wiley & Sons: New York, NY, USA, 1943. [Google Scholar]
- Jenck, O.; Dias, D.; Kastner, R. Soft ground improvement by vertical rigid piles two-dimensional physical modeling and comparison with current design methods. Soils Found. 2005, 45, 15–30. [Google Scholar] [CrossRef] [Green Version]
- Lajevardi, S.H.; Dias, D.; Racinais, J. Analysis of soil-welded steel mesh reinforcement interface interaction by pull-out tests. Geotext. Geomembr. 2013, 40, 48–57. [Google Scholar] [CrossRef]
- Russell, D.; Pierpoint, N. An assessment of design methods for piled embankments. Ground Eng. 1997, 30, 39–44. [Google Scholar]


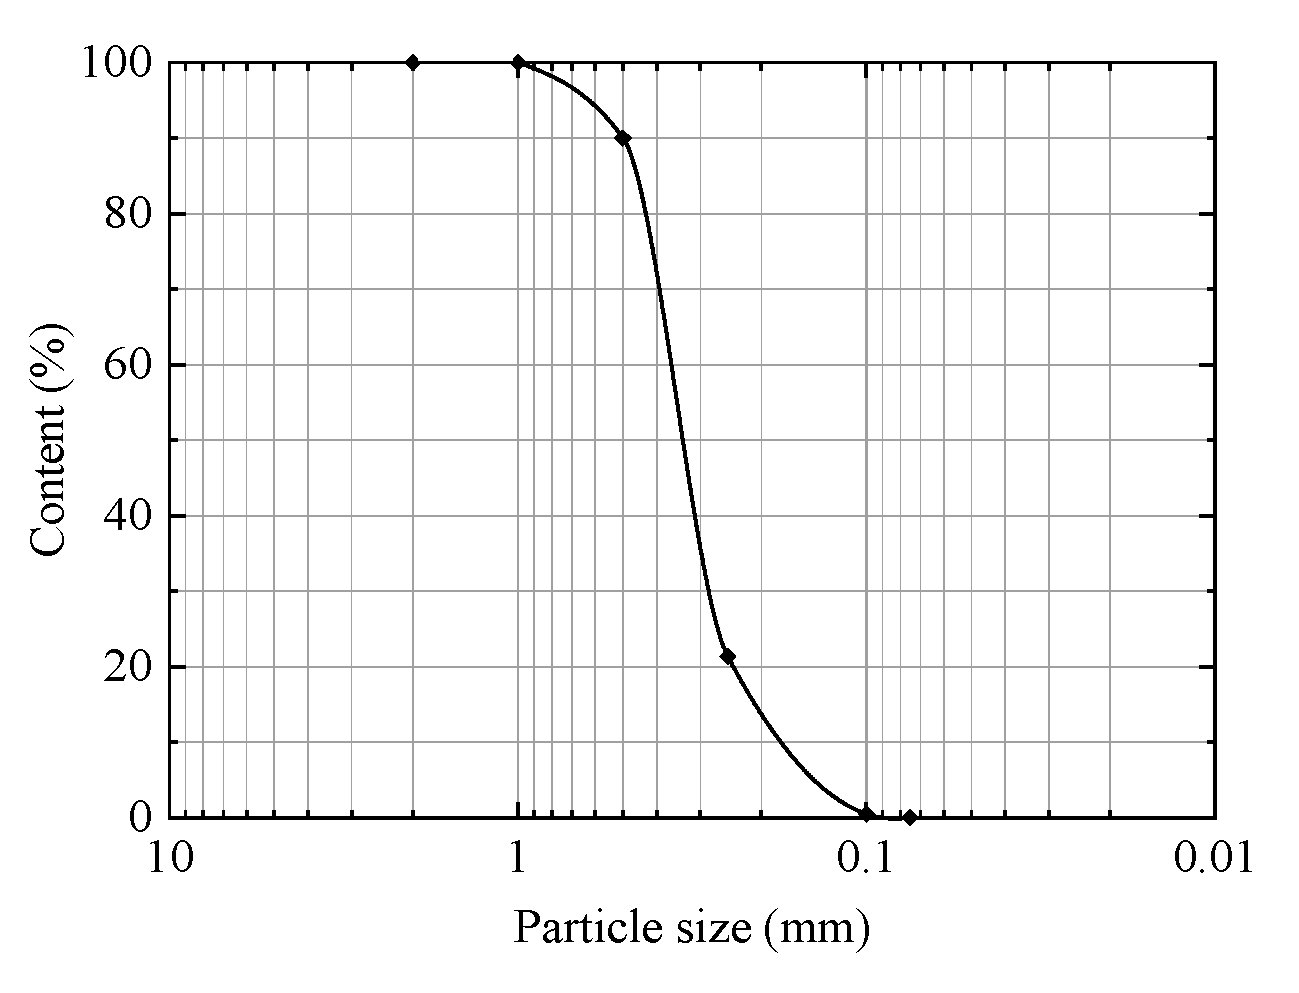


| Relative Compaction (%) | Density ρ (g·cm−3) | Specific Gravity Gs | Angle of Internal Friction φ (°) | Characteristic Particle Size (mm) | ||
|---|---|---|---|---|---|---|
| d10 | d30 | d60 | ||||
| 70 | 1.82 | 2.86 | 41 | 0.18 | 0.29 | 0.37 |
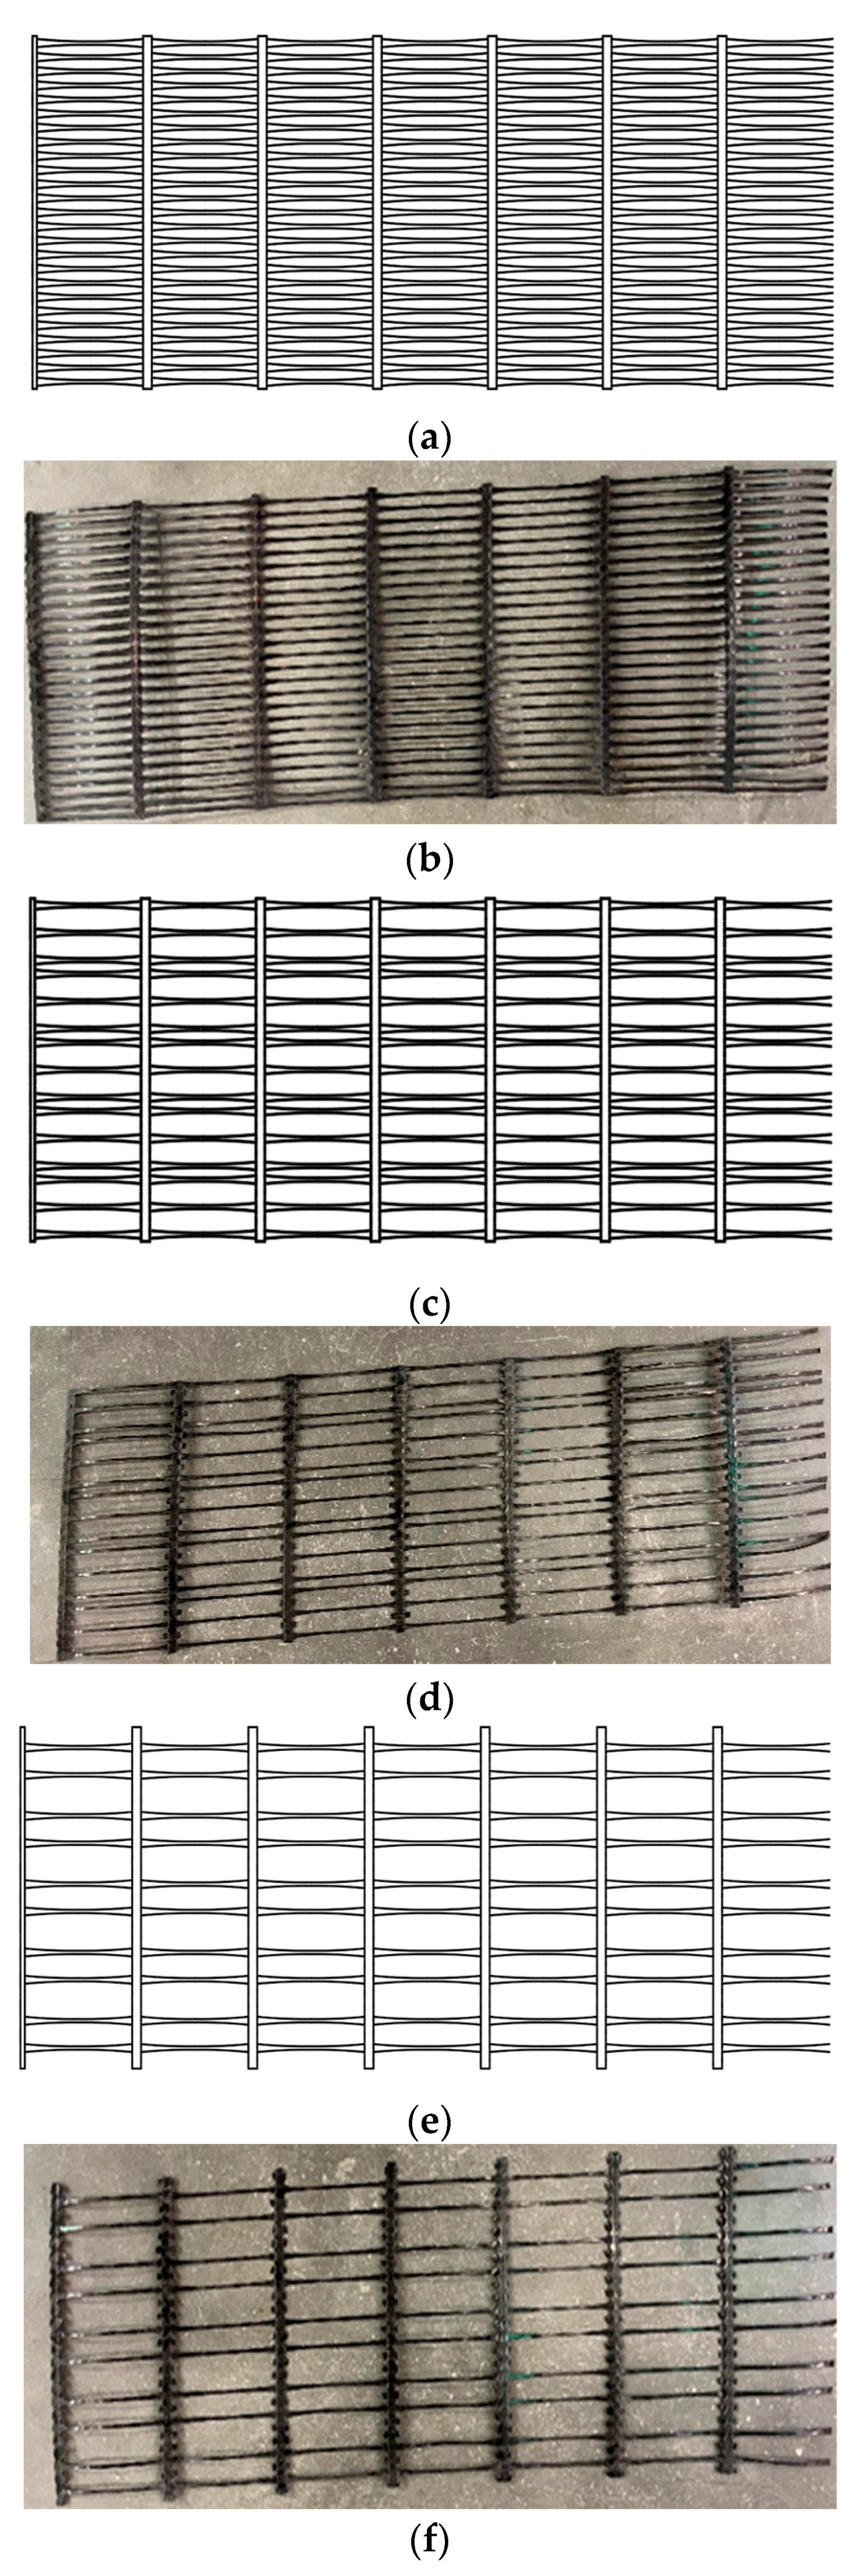
| Type | Thickness (mm) | Rib Spacing (mm) | Length of Tensile Unit (mm) | Raw Material |
|---|---|---|---|---|
| Uniaxial geogrid | 1 | 22.2 | 225 | Polyethylene |
| Test Number | Grid Type | Length (mm) | Width (mm) | Normal Stress (kPa) | Rate (mm/min) |
|---|---|---|---|---|---|
| TG1 | G1 | 1400 | 240 | 0 | 247 |
| TG2 | G1 | 1400 | 240 | 20 | 247 |
| TG3 | G1 | 1400 | 240 | 40 | 247 |
| TG4 | G1 | 1400 | 240 | 60 | 247 |
| TG5 | G1 | 1400 | 240 | 40 | 200 |
| TG6 | G1 | 1400 | 240 | 40 | 150 |
| TG7 | G1 | 1400 | 240 | 40 | 1 |
| Test Number | Grid Type | Length (mm) | Width (mm) | Normal Stress (kPa) | Rate (mm/min) |
|---|---|---|---|---|---|
| PG1 | G1 | 1400 | 550 | 20 | 1 |
| PG2 | G2 | 1400 | 550 | 20 | 1 |
| PG3 | G3 | 1400 | 550 | 20 | 1 |
| PG4 | G1 | 1400 | 550 | 40 | 1 |
| PG5 | G2 | 1400 | 550 | 40 | 1 |
| PG6 | G3 | 1400 | 550 | 40 | 1 |
| PG7 | G1 | 1400 | 550 | 60 | 1 |
| PG8 | G2 | 1400 | 550 | 60 | 1 |
| PG9 | G3 | 1400 | 550 | 60 | 1 |
| Test Number | σv (kPa) | J0.02 | J0.05 | Jpeak | δ0.02 | δ0.05 | δpeak |
|---|---|---|---|---|---|---|---|
| TG1 | 0 | 847.62 | 616.75 | 503.15 | - | - | - |
| TG2 | 20 | 1423.03 | 955.20 | 867.44 | 1.68 | 1.55 | 1.72 |
| TG3 | 40 | 1468.42 | 1041.92 | 955.00 | 1.73 | 1.69 | 1.90 |
| TG4 | 60 | 1465.51 | 1082.78 | 1024.64 | 1.73 | 1.76 | 2.04 |
| σv (kPa) | Pr(G1) (kN/m) | Pr(G2) (kN/m) | Pr(G3) (kN/m) | PrT (kN/m) | PrT/Pr(G1) (%) | PrL (kN/m) | PrL/Pr(G1) (%) |
|---|---|---|---|---|---|---|---|
| 20 | 37.70 | 27.11 | 18.36 | 7.77 | 20.61 | 29.93 | 79.39 |
| 40 | 41.77 | 27.45 | 18.46 | 4.14 | 9.91 | 37.63 | 90.09 |
| 60 | 39.46 | 25.89 | 17.48 | 3.91 | 9.91 | 35.55 | 90.09 |
Publisher’s Note: MDPI stays neutral with regard to jurisdictional claims in published maps and institutional affiliations. |
© 2022 by the authors. Licensee MDPI, Basel, Switzerland. This article is an open access article distributed under the terms and conditions of the Creative Commons Attribution (CC BY) license (https://creativecommons.org/licenses/by/4.0/).
Share and Cite
Cai, X.; Feng, J.; Li, S.; Xu, H.; Liu, W.; Huang, X. Study on Interface Interaction between Uniaxial Geogrid Reinforcement and Soil Based on Tensile and Pull-Out Tests. Sustainability 2022, 14, 10386. https://doi.org/10.3390/su141610386
Cai X, Feng J, Li S, Xu H, Liu W, Huang X. Study on Interface Interaction between Uniaxial Geogrid Reinforcement and Soil Based on Tensile and Pull-Out Tests. Sustainability. 2022; 14(16):10386. https://doi.org/10.3390/su141610386
Chicago/Turabian StyleCai, Xiaoguang, Jiayu Feng, Sihan Li, Honglu Xu, Weiwei Liu, and Xin Huang. 2022. "Study on Interface Interaction between Uniaxial Geogrid Reinforcement and Soil Based on Tensile and Pull-Out Tests" Sustainability 14, no. 16: 10386. https://doi.org/10.3390/su141610386
APA StyleCai, X., Feng, J., Li, S., Xu, H., Liu, W., & Huang, X. (2022). Study on Interface Interaction between Uniaxial Geogrid Reinforcement and Soil Based on Tensile and Pull-Out Tests. Sustainability, 14(16), 10386. https://doi.org/10.3390/su141610386