Communication

Phosphorus Management in Slovakia—A Case Study

Institute of Earth Resources, Faculty of Mining, Ecology, Process Control and Geotechnologies, Technical University of Košice, Letná 9, 042 00 Košice, Slovakia
*
Author to whom correspondence should be addressed.
Sustainability 2022, 14(16), 10374; https://doi.org/10.3390/su141610374
Submission received: 27 July 2022 / Revised: 15 August 2022 / Accepted: 16 August 2022 / Published: 20 August 2022

Abstract

:
Recently, phosphorus (P) has become a material that is the focus of many countries, including the EU, due to its scarcity. EU countries significantly depend on P export/import due to a lack of extraction and deposits. In this paper, an economic analysis of P management in Slovakia as a source for responsible and sustainable exploitation and reuse is presented based on available P sources, whether traditional (P rock mining), recovery and recycling (from surface water, un/treated wastewater, sewage sludge, sewage sludge ash) or alternative (from urine, manure, slaughter waste, steelmaking slag). The current state in Slovakia shows that there is no P rock mined, and no P is recovered or recycled from any resources. All the P is imported, mostly from other EU countries. But there are several possible P sources, except for mining, with estimated available sources of surface water (14,933 t per year), treated wastewater (285 t per year), sewage sludge (49,125 t per year), urine (433,806 t per year), manure (1,626,132 t per year), slaughter waste (456 t per year) and steelmaking slag (4214 t per year). The explicit identification of an effective P management strategy in Slovakia was done by a Strength-Weaknesses-Opportunities-Threats (SWOT) analysis, and the corresponding factors were identified and quantified. As there are no P deposits mined and no P recovery facilities from existing sources at present in Slovakia, there is a declining trend in cattle breeding and in the produced amount of manure and urine, absence of the P recovery from sewage sludge ash, the low estimated potential of available P compounds from sewage sludge, low estimated potential of available P compounds from steelmaking slags in connection with lack of governmental support, instability of steel production, reduction of manure production due to the reduction of cattle breeding, reduction of slaughter waste production due to the reduction of animal waste production, significant dependence on P import and the low number of potential P deposits are the main results of the SWOT analysis that suggests that the P management should be guided by the principles of a retreat strategy.

1. Introduction

Phosphorus (P) is considered a critical raw material in the EU economy [1] and is non-renewable [2]. P is important in industry (pharmaceuticals, automobiles, electronics, food, plastics, etc.) and agriculture (fertilizer, etc.) as a raw material and is also an important component in vaccines (also to prevent COVID-19) [2]. P in excess may cause water eutrophication [3], changes in species composition connected to algal bloom, degradation of aquatic environments and a negative economic effect on income from water-based vacations [4]. For the above reasons, it is necessary to transform toward sustainable phosphorus management not only in Slovakia but everywhere. A sustainable transformation must include actions (individual and/or collective), social structures and institutions [5]. That is why experts and data in the fields of not only raw materials (esp. phosphorus) but also mining, wastewater treatment, sewage sludge treatment, agriculture, steelmaking, economy and multiarea were asked for their opinion. These opinions were gathered and thoroughly analyzed.
The How to Stay Alive in Visegrád Group (also known as the Visegrád Four, or the European Quartet, the V4) is an extremely apt name not only for the Visegrad Funds project, but also for the reality of which Slovakia is a part of. Especially regarding phosphates, which are becoming scarce raw materials and therefore many countries are increasingly thinking about how to replace them [6,7]. The EU generally has a problem with raw materials and, in many cases, is highly dependent on imports [8,9,10]. This is also the case with phosphates [11]. The EU is dependent on their imports up to 88%, while the three main producers in the world with a total share of 65.32% are China, the USA and Morocco. The share of phosphates in the EU is only 0.49%, with the highest extraction in Finland [12]. These problems, along with dependence on many raw materials from all over the world, are the main reasons why society is trying to be circular and close the loop within many materials through a new approach, the circular economy [13,14].
In the context of a growing population and deepening climate change, which is causing significant changes in crop production in many areas, it can lead to a food production crisis in the long term. Without phosphates, which are intensively used as industrial or natural fertilizers, this crisis could reach global proportions. However, as has been the case with the history of raw materials, they have not been treated rationally and their reserves are, in many cases, almost depleted. This is also the case with phosphates, which are expected to have their mineral reserves completely depleted by 2040 [8]. Therefore, it is necessary today to look for new solutions, approaches or innovations, as it is necessary to obtain this resource in other ways for worldwide sustainability. Livestock or human excrement come into consideration as an alternative source. Many countries are already trying new methods of P extraction or, at least, identifying their own resources and preparing for the future effectively in the context of current geopolitical tensions affecting the EU’s raw material security. This is not the case in Slovakia either, where there is a phosphate deposit which is not mined. That is why the study is focused on other possibilities and sources of P, so that our future generations can ensure life in the context of sustainable development as it is known today.
P is one of the most important macrobiogenic elements. It participates in all biochemical transformations in living organisms and in natural waters. Its availability as a mineral is geographically restricted [15]. Based on the available data, there are no P deposits mined in Slovakia or the V4 countries at present. In Slovakia, there is one deposit; in Hungary, there are five sedimentary phosphate deposits, but there is no information on the available resources, and in Poland, there are phosphorite deposits that were mined in the past. In Czechia, there are no P deposits [1,16].
P compounds that pollute water mainly come from sewage and animal waste (e.g., slurry, feces and silage waste). An important inorganic source of water pollution by P compounds is agricultural land fertilized with industrial fertilizers [17]. Phosphates do not contribute in any way to the taste or smell of the water and therefore do not pose a major problem for surface water. However, high phosphate levels in wastewater can have a significant impact on the surrounding ecosystem. P also significantly contributes to eutrophication, which can be prevented by limiting the fertilization of agricultural land, treating wastewater, aerating water, etc. [18].
The scientific goal of the paper is the identification of the drivers and barriers to P management in Slovakia by an economic analysis—identification of possible P sources and an analysis of strengths, weaknesses, opportunities and threats (SWOT) of strategic decisions on future P management in Slovakia.

2. Materials and Methods

SWOT analysis was used for explicit identification of the effective strategy of P management in Slovakia. The SWOT analysis, as well as other multi-criteria methods, is typically used in strategic decision-making processes and for the support of business management, though it is also widely used in environmental management [19,20,21,22,23,24].
The result of the SWOT analysis points to effective strategies for the use of primary, secondary and tertiary alternatives for obtaining P in the territory of the Slovak Republic. For this reason, an extensive survey of P sources, processing of phosphate rock and the methods of P recovery and recycling literature are presented. All the gathered information and data were subjected to detailed analysis, synthesis and comparation. P export and import and animal and slaughter waste were summarized based on the data from the Statistical Office of the Slovak Republic. The data on P deposits and mining were obtained from the Central Mining Authority in Slovakia. The data on surface water and river sediments were collected from the State Geological Institute of Dionýz Štúr and the Slovak Hydrometeorological Institute. As an example, the Hornád river in the eastern part of Slovakia was selected because in a previous study [25] this river was studied in detail and a sustainable river basin management model was also introduced. The data for the Hornád river are only presented to show the trend of P content in the rivers in Slovakia. The State of the Environment Report of the Slovak Republic in 2010–2019 was the basic source of data for P content in sewage sludge and sewage sludge ash. The data on category 1 animal by-products and derived products and steelmaking slag were collected from the Internet.
These data were also discussed with experts in the particular fields and multiareas to get superior data on the available P sources in Slovakia and for the SWOT analysis of the P management in Slovakia.
The SWOT analysis was realized using the following steps [26,27]:
  • Factors identification.
  • Formation of matrix to compare the importance of factors.
  • Construction of evaluation vector by evaluating each factor.
  • Evaluation of the indicators:
    Si = ΠSij; j = 1, 2, ..., f,
    f–number of factors,
    Sij–single factor,
  • Comparation of the indicators
    Ri = (Si)1/f
The selection of factors was based on the results of the investigation in chapter 3.3. Current State in Slovakia, expert opinions, Slovak and foreign writings, policies, statistical databases, etc.
The SWOT analysis, including explicit quantification of weights according to the so-called Saaty’s matrix, accepts the interactions of comparable, clearly defined factors, while the generally valid condition of the weights sum equal to one was accepted. The dimensions of the matrix were directly determined by an interactive comparison of pre-explicitly defined factors of identical order with the values given in Table 1. A symmetrical matrix (admitting the equality of the same factors by plotting 1 to the diagonal) was designed to compare the factors [28].
The sum of counted Ri that quantifies the total value of particular weights αi, indicating the interactions of indicators, was calculated. Points for a particular criteria were allocated from the key rate <1, 5> (Table 2).

3. Results

Sources of P [30]:
  • traditionally obtained by mining phosphate rock,
  • recovery and recycling,
  • alternative.
The most commonly mined phosphate rock is apatite: Ca5(PO4)3X, (X = OH, F, Cl), e.g., fluorapatite (Ca5(PO4)3F), but the composition depends on the location. The prevailing source of P is sedimentary rock, which may contain pollutants that can be removed by precipitation, extraction or other methods. Much lower amounts of P can be found in igneous rocks that also contain fewer pollutants [30]. However, processing methods may significantly increase the P yield [31]. Seabed phosphate deposits were discovered in Namibia and Mexico [30].

3.1. Processing of Phosphate Rock

About 98% of phosphate rock is processed by wet method [32] and the final product is phosphoric acid (H3PO4) while the by-products are phosphogypsum and hydrogen fluoride. About 0.58 weight units of phosphoric acid are produced from one weight unit of phosphate rock. About five weight units of phosphogypsum waste are produced per one weight unit of phosphoric acid [33]. About 88% of phosphogypsum is landfilled, about 10% is disposed at sea, and only about 2% is used as a secondary raw material. The treatment of phosphogypsum waste requires specific conditions due to possible environmental pollution if improperly treated. Phosphogypsum can also be used as an alternative to natural gypsum after the removal of contaminants that may include rare earth elements [34].
The remaining 2% of phosphate rock is processed by the thermal method with a final product of elemental white phosphorus (P4) and the by-products of carbon monoxide, CaSiO3 slag and calcium fluoride [30]. About 0.184 weight units of phosphorus (P4) are produced from one unit of phosphate rock by this method. This process is highly energy-intensive [31].

3.2. P Recovery and Recycling

Possible sources for P recovery and recycling are [30,35]:
  • surface water;
  • untreated wastewater;
  • treated wastewater;
  • sewage sludge;
  • sewage sludge ash;
  • slaughter waste;
  • manure;
  • urine;
  • steelmaking slag.
For these sources, several methods can be used for P recovery [30,31,36,37,38,39,40,41,42,43,44,45]:
  • Chemical precipitation of wastewater, that is based on the addition of iron or aluminum chlorides or sulphates to wastewater resulting into insoluble phosphate salts removable by sedimentation; about 90% of P can be recovered from wastewater;
  • Enhanced biological removal from wastewater, that is based on removal of P by microorganisms from wastewater; more than 90% of P can be recovered from wastewater;
  • Struvite formation from wastewater by adding soluble magnesium chloride, increasing pH to 8–9 by sodium hydroxide, thus forming struvite crystals; 40% of wastewater can be treated this way with a 90% efficiency;
  • Calcium phosphate formation from wastewater by adding calcium hydroxide and increasing pH to 9 thus precipitating calcium phosphate;
  • Iron phosphate formation from wastewater in the form of vivianite [iron(II) phosphate] by anaerobic digestion under neutral pH, vivianite can be separated from sludgy magnetically;
  • Sewage sledge treatment at wastewater treatment plants, there is a number of methods for direct recovery, by wet-chemical or thermochemical treatment; about 90% of P can be recovered;
  • Sewage sludge ash, that is rich in P, about 9–13.1%, catches about 87% of P in influent wastewater, P can be recovered by wet-chemical or thermochemical treatment; about 30–40% of P can be recovered.
There are also different methods for P recovery like sorption, ion exchange, electrodialysis, reverse osmosis, nanofiltration, etc. from wastewater, but these methods are not P-selective and would only serve for an increase of the concentration and one of the above methods.
Other alternative P sources are [30,31,35,46,47,48,49]:
  • Animal-delivered waste streams—especially livestock manure that can be processed by anaerobic digestion, followed by thermal treatment and processed as biochar or ash, or it that can be dewatered, the final liquid can be precipitated for calcium phosphate or struvite; may contain a maximum of 30% P;
  • Category 1 animal by-products and derived products (meat and bone meal), when incinerated to valorize energy content and hygienize, it mostly comprises Ca5(PO4)3OH and Ca3(PO4)2, contains 15–19% of P;
  • Steelmaking slag, there is a number of methods for P recovery, e.g., capillary action separation, carbothermic reduction, magnetic separation, aqueous dissolution, reductive melting, etc.; it contains 0.3–1.7% of P.
Livestock manure is one of the recyclable P sources in Europe [35] and can be considered more localized than municipal wastewater [30]. Category I meat and bone meal is a by-product of animal rendering plants and is rich in nutrients. The iron ore, CaO, and coal used for making steel contain only about 0.05–0.06 wt% of P, but, since P is removed in the process of steelmaking due to its negative impact on steel quality, it is concentrated during the process in the slag [30,31].

3.3. Current State in Slovakia

Based on the literature survey, internet search and discussions with experts in the fields of mining, wastewater treatment, sewage sludge treatment, agriculture, steelmaking and economics, and also multiarea from not only the above mentioned but others as well, the following results were made.

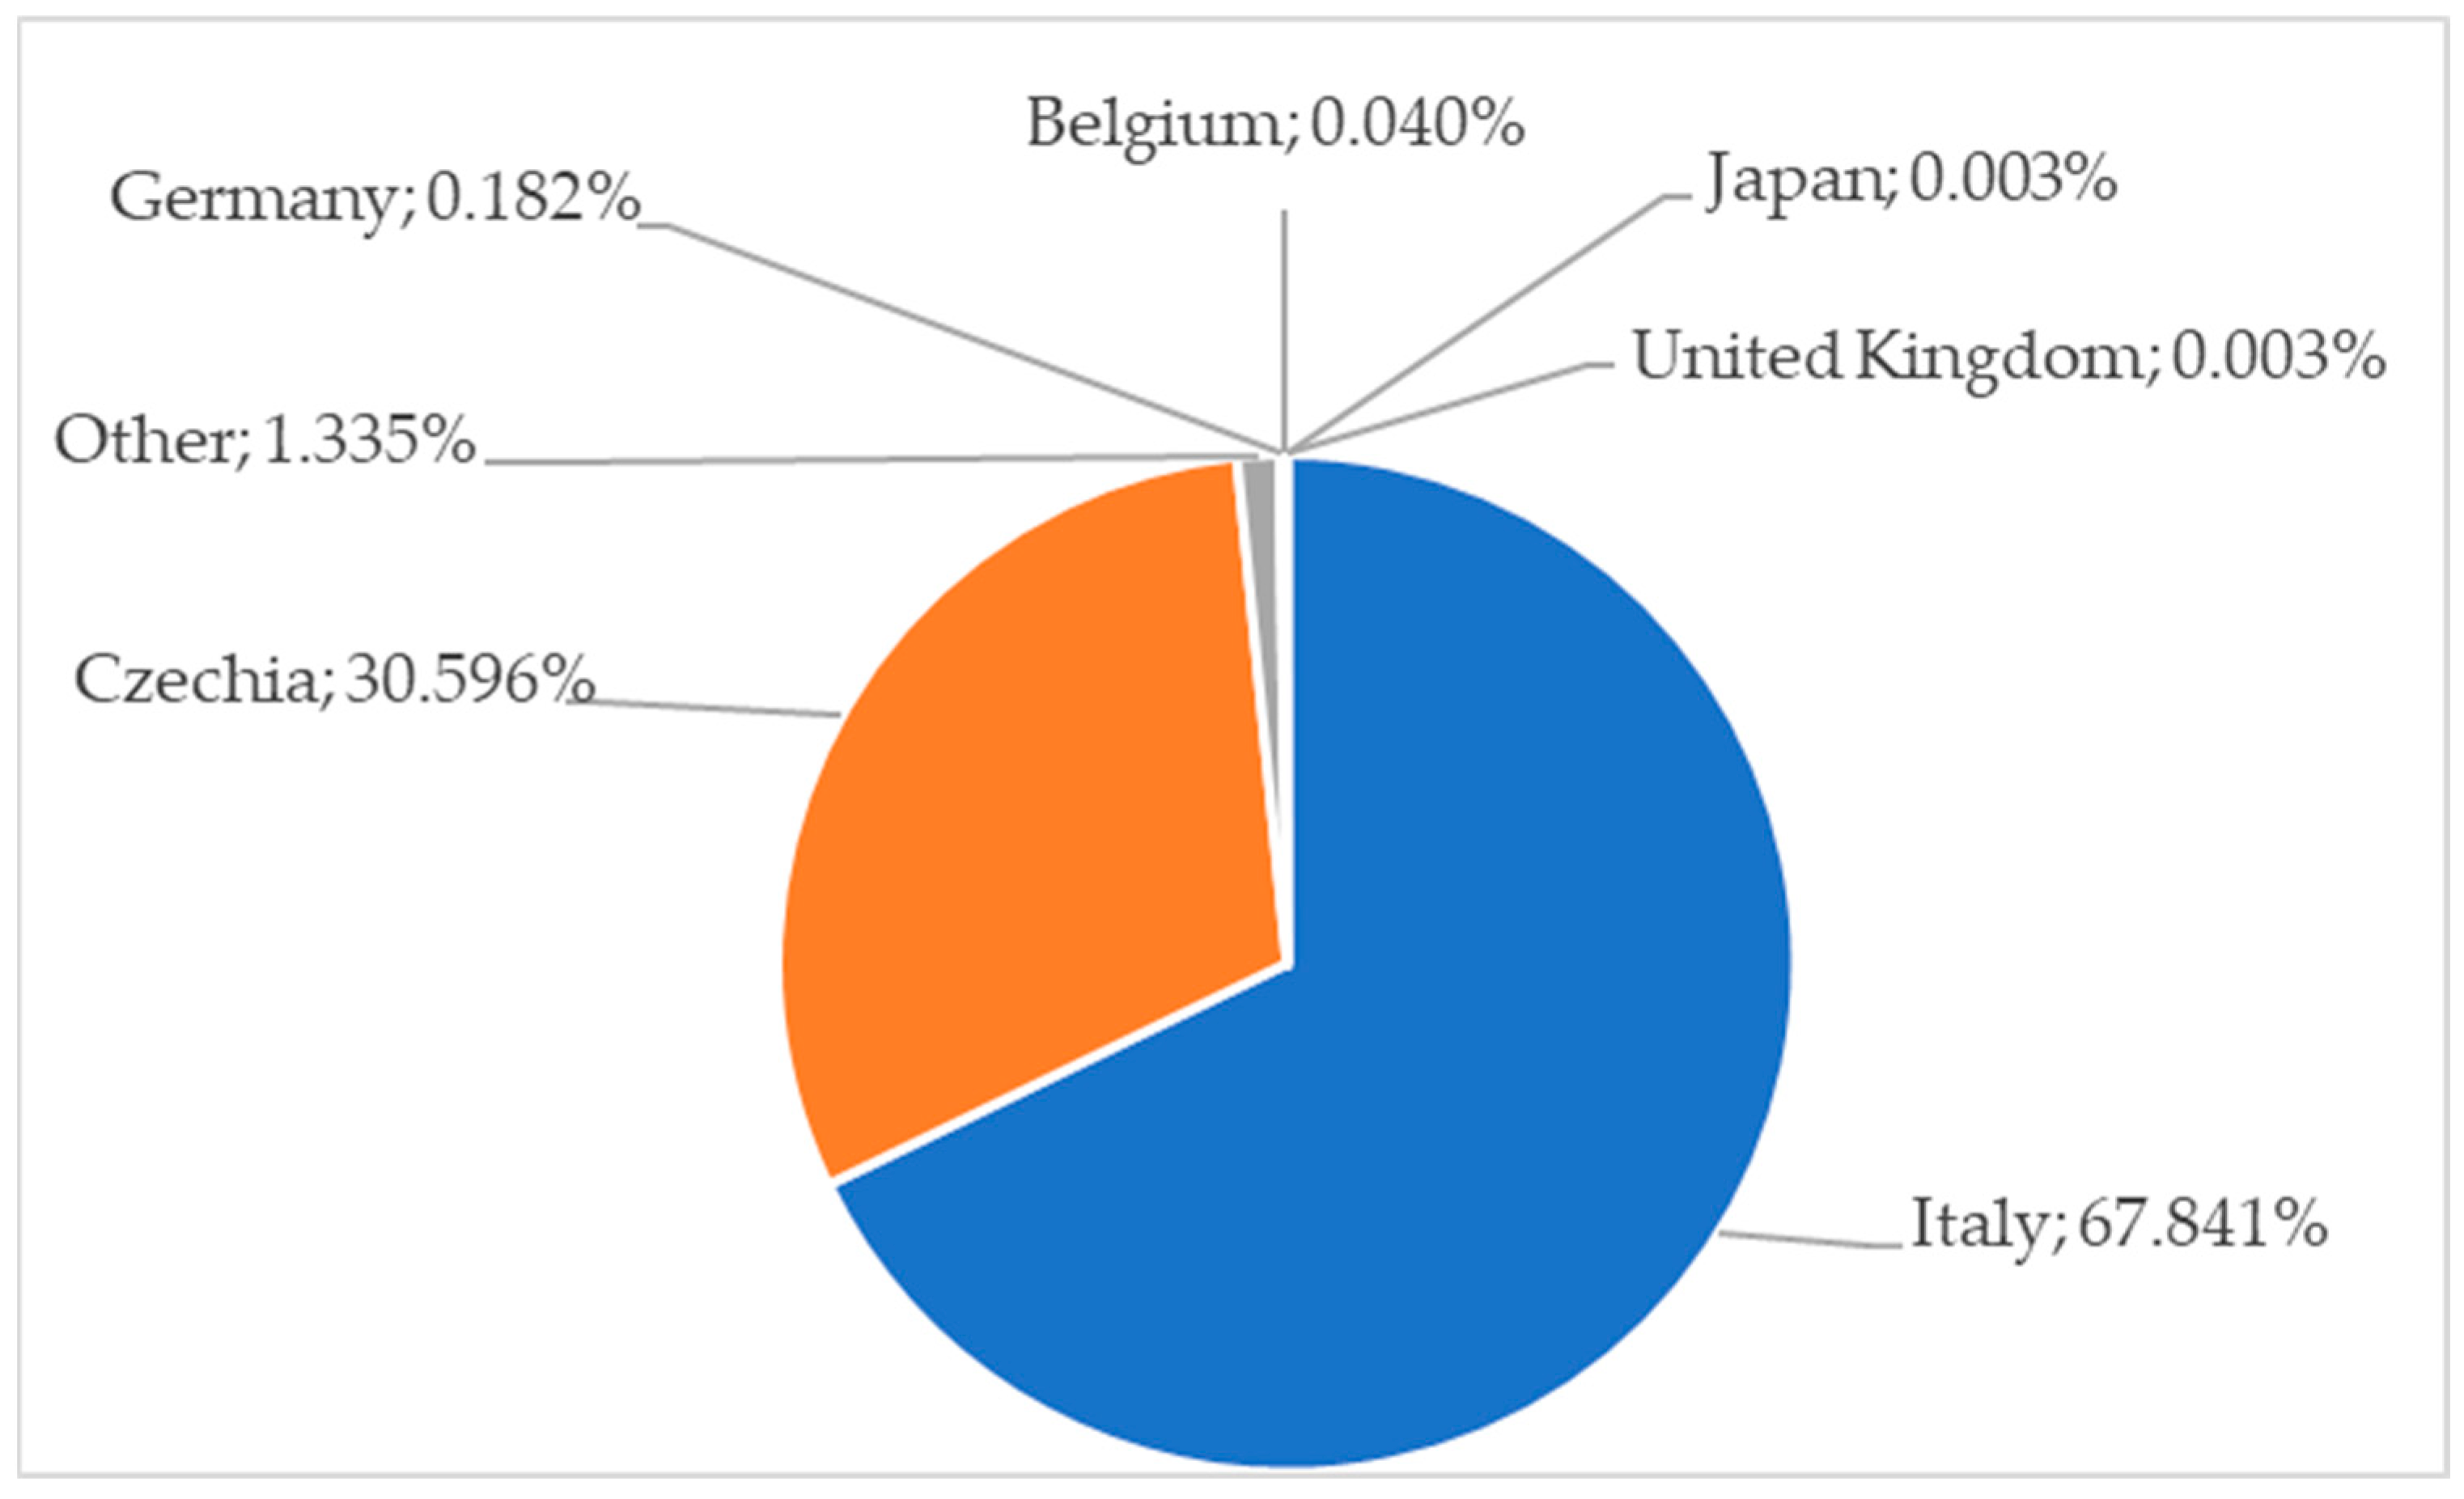
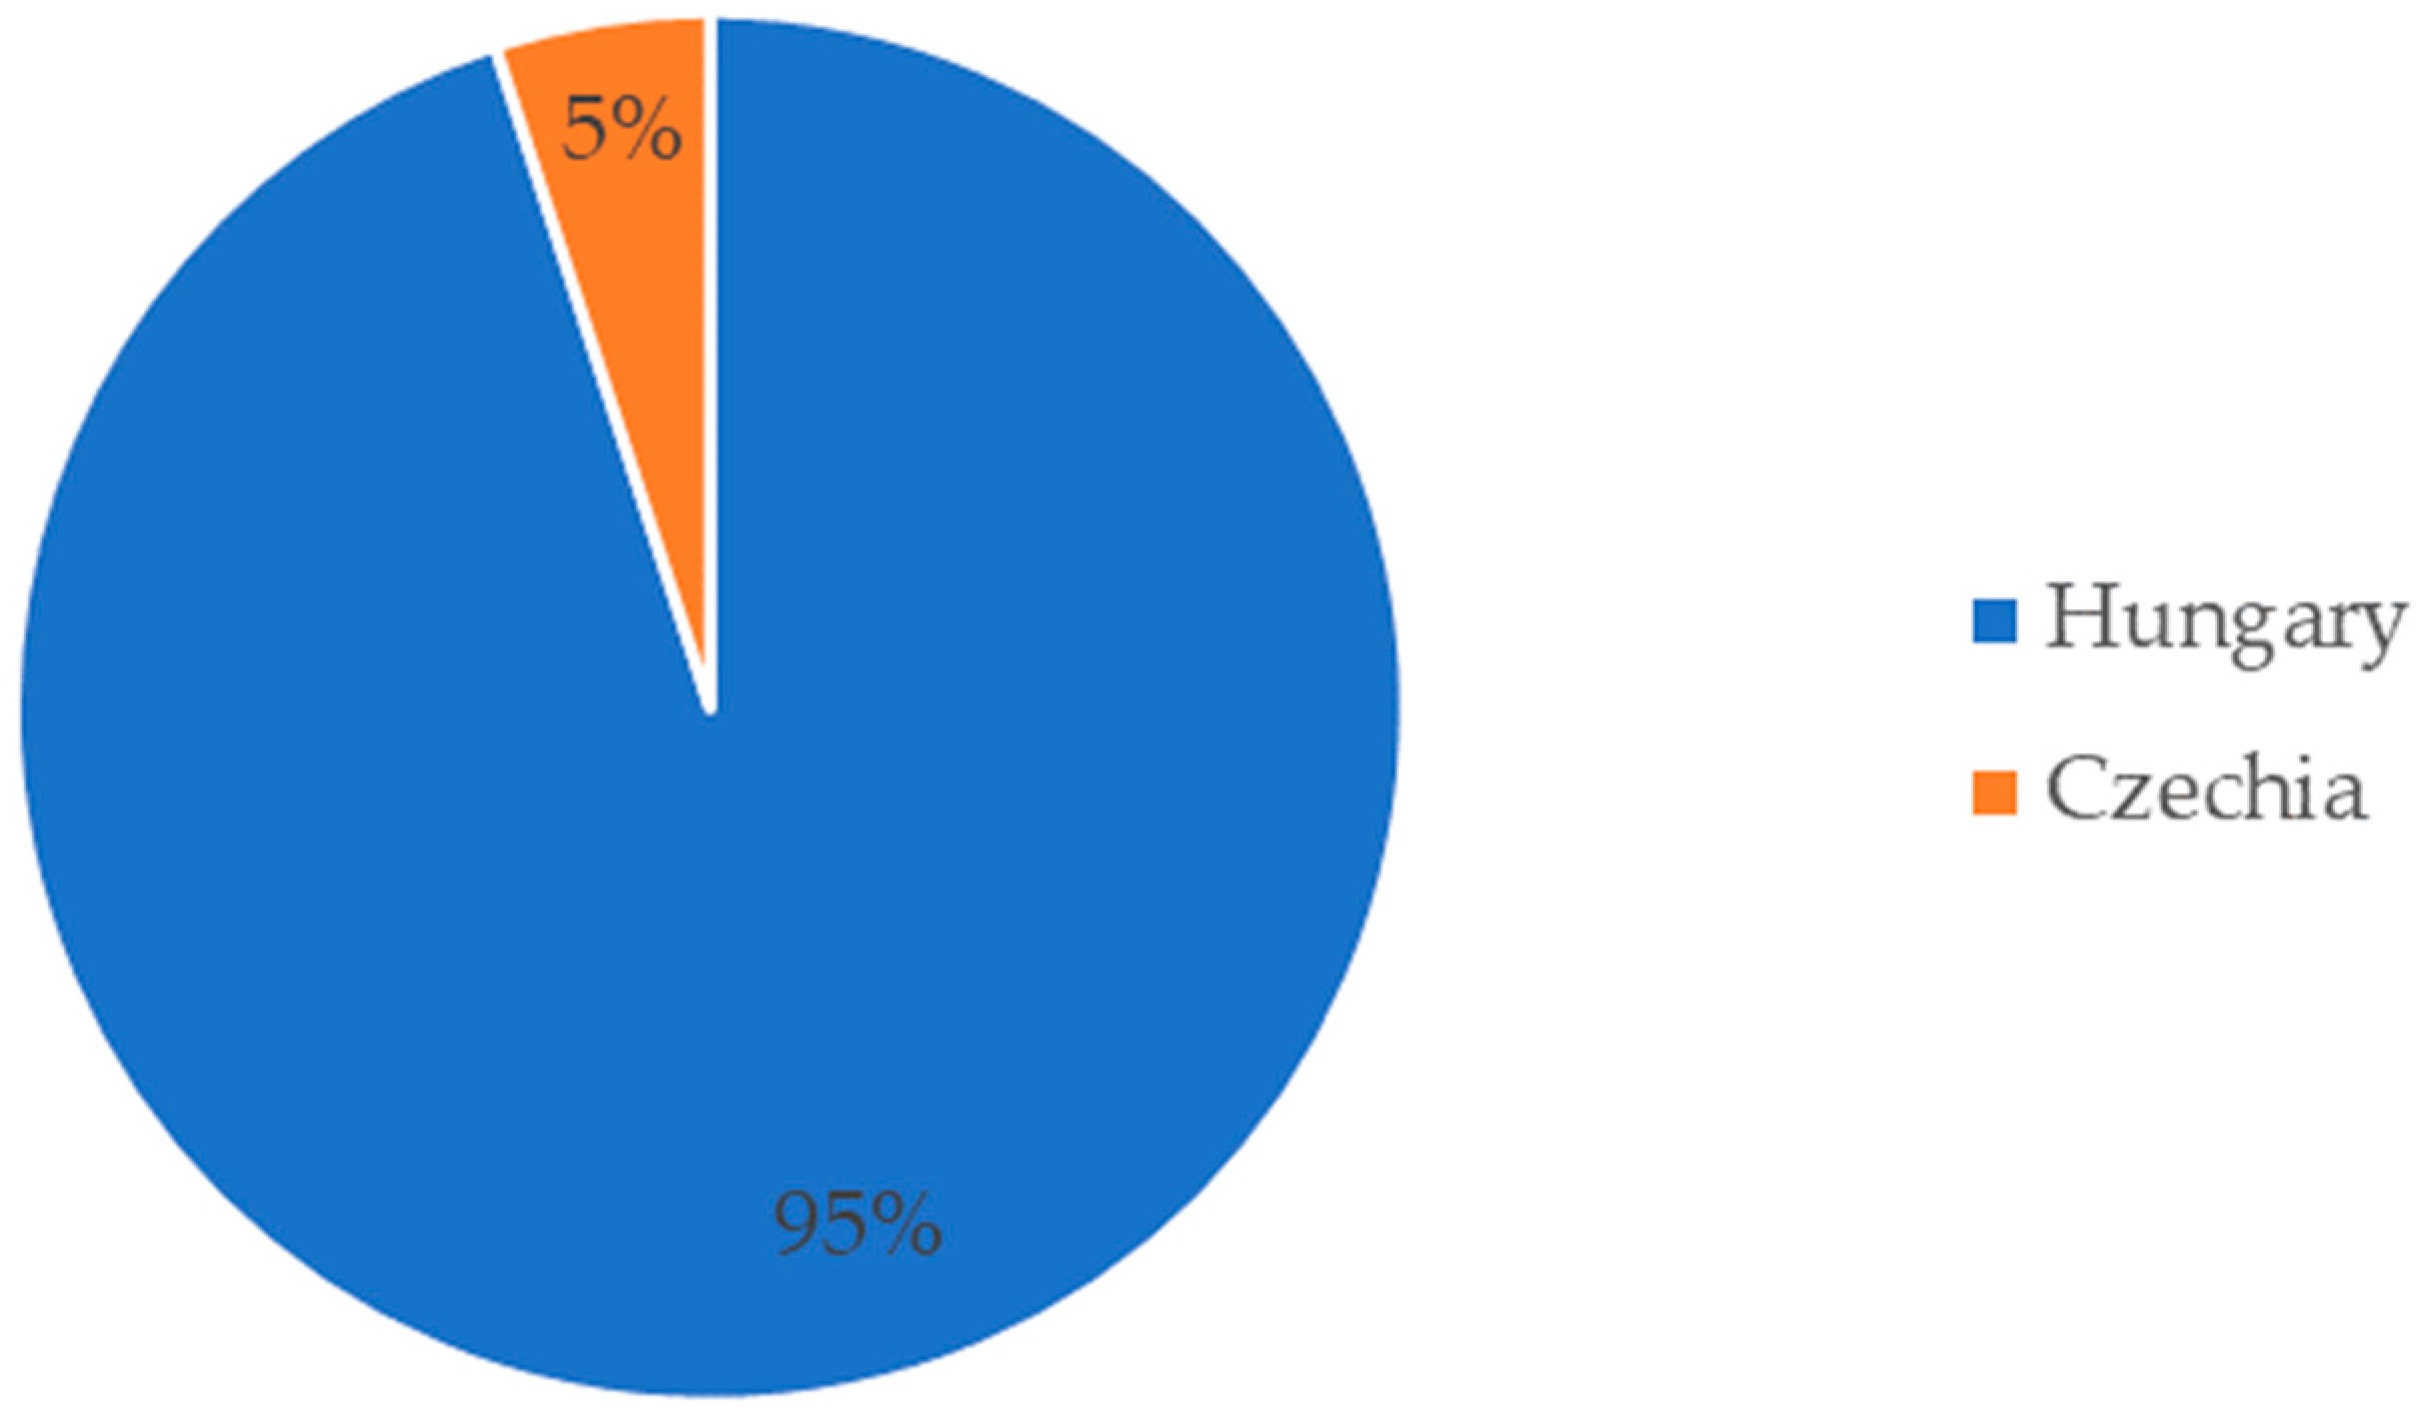
3.3.1. P Export and Import

The import of P to Slovakia during the last 10 years is presented in Table 3. The largest amount of the P was imported in 2013 and the lowest amount in 2019.
The most of P (Figure 1) was imported to Slovakia from Italy (68%) and Czechia (31%).
The P export from Slovakia to the world in the last 10 years is presented in Table 4. Export was only recorded in two years 2010 and 2013.
The P (Figure 2) was exported from Slovakia to Hungary (95%) and Czechia (5%).

3.3.2. Mining

There is no P raw material mined from a deposit at present and only one P deposit in Slovakia.
A deposit of xenotime (XPO4), a yellowish-brown mineral which occurs in some igneous rocks and consists of a phosphate of X = yttrium and other rare earth elements, is located near the municipality of Gočaltovo in the south-eastern part of Central Slovakia, in the eastern part of the Slovak Ore Mountains. The ore mineralization is accompanied by uranium mineralization. Monazite [(Ce,La,Nd,Th)PO4], a brown crystalline mineral consisting of a phosphate of cerium, lanthanum, other rare earth elements, and thorium, can also be found to a lesser extent. Another secondary utility component is apatite, a light green to purple mineral, composing calcium phosphate and minor fluorine, chlorine, and other elements, also known as fertilizer. Other minerals found in the deposit are uraninite, autunite, goyazite and plumbogummite, and the accompanying minerals are quartz, sericite, pyrite and goethite. Uraninite, which consists mainly of uranium dioxide and is radioactive, and pyrite, which consists of iron disulfide, are the main environmental pollutants. Due to technological prerequisites, these ores are difficult to process. The difficulties are caused mainly by the high compactness of the rock with a close connection of useful, ballast and harmful minerals as well as the presence of minerals with the same technological characteristics. Estimated stocks of xenotime are 7.8 kilotons (kts) with an average content of 0.2% of P and forecast mineral resources are 27.4 kts with an average content of 0.184% of P [51,52].

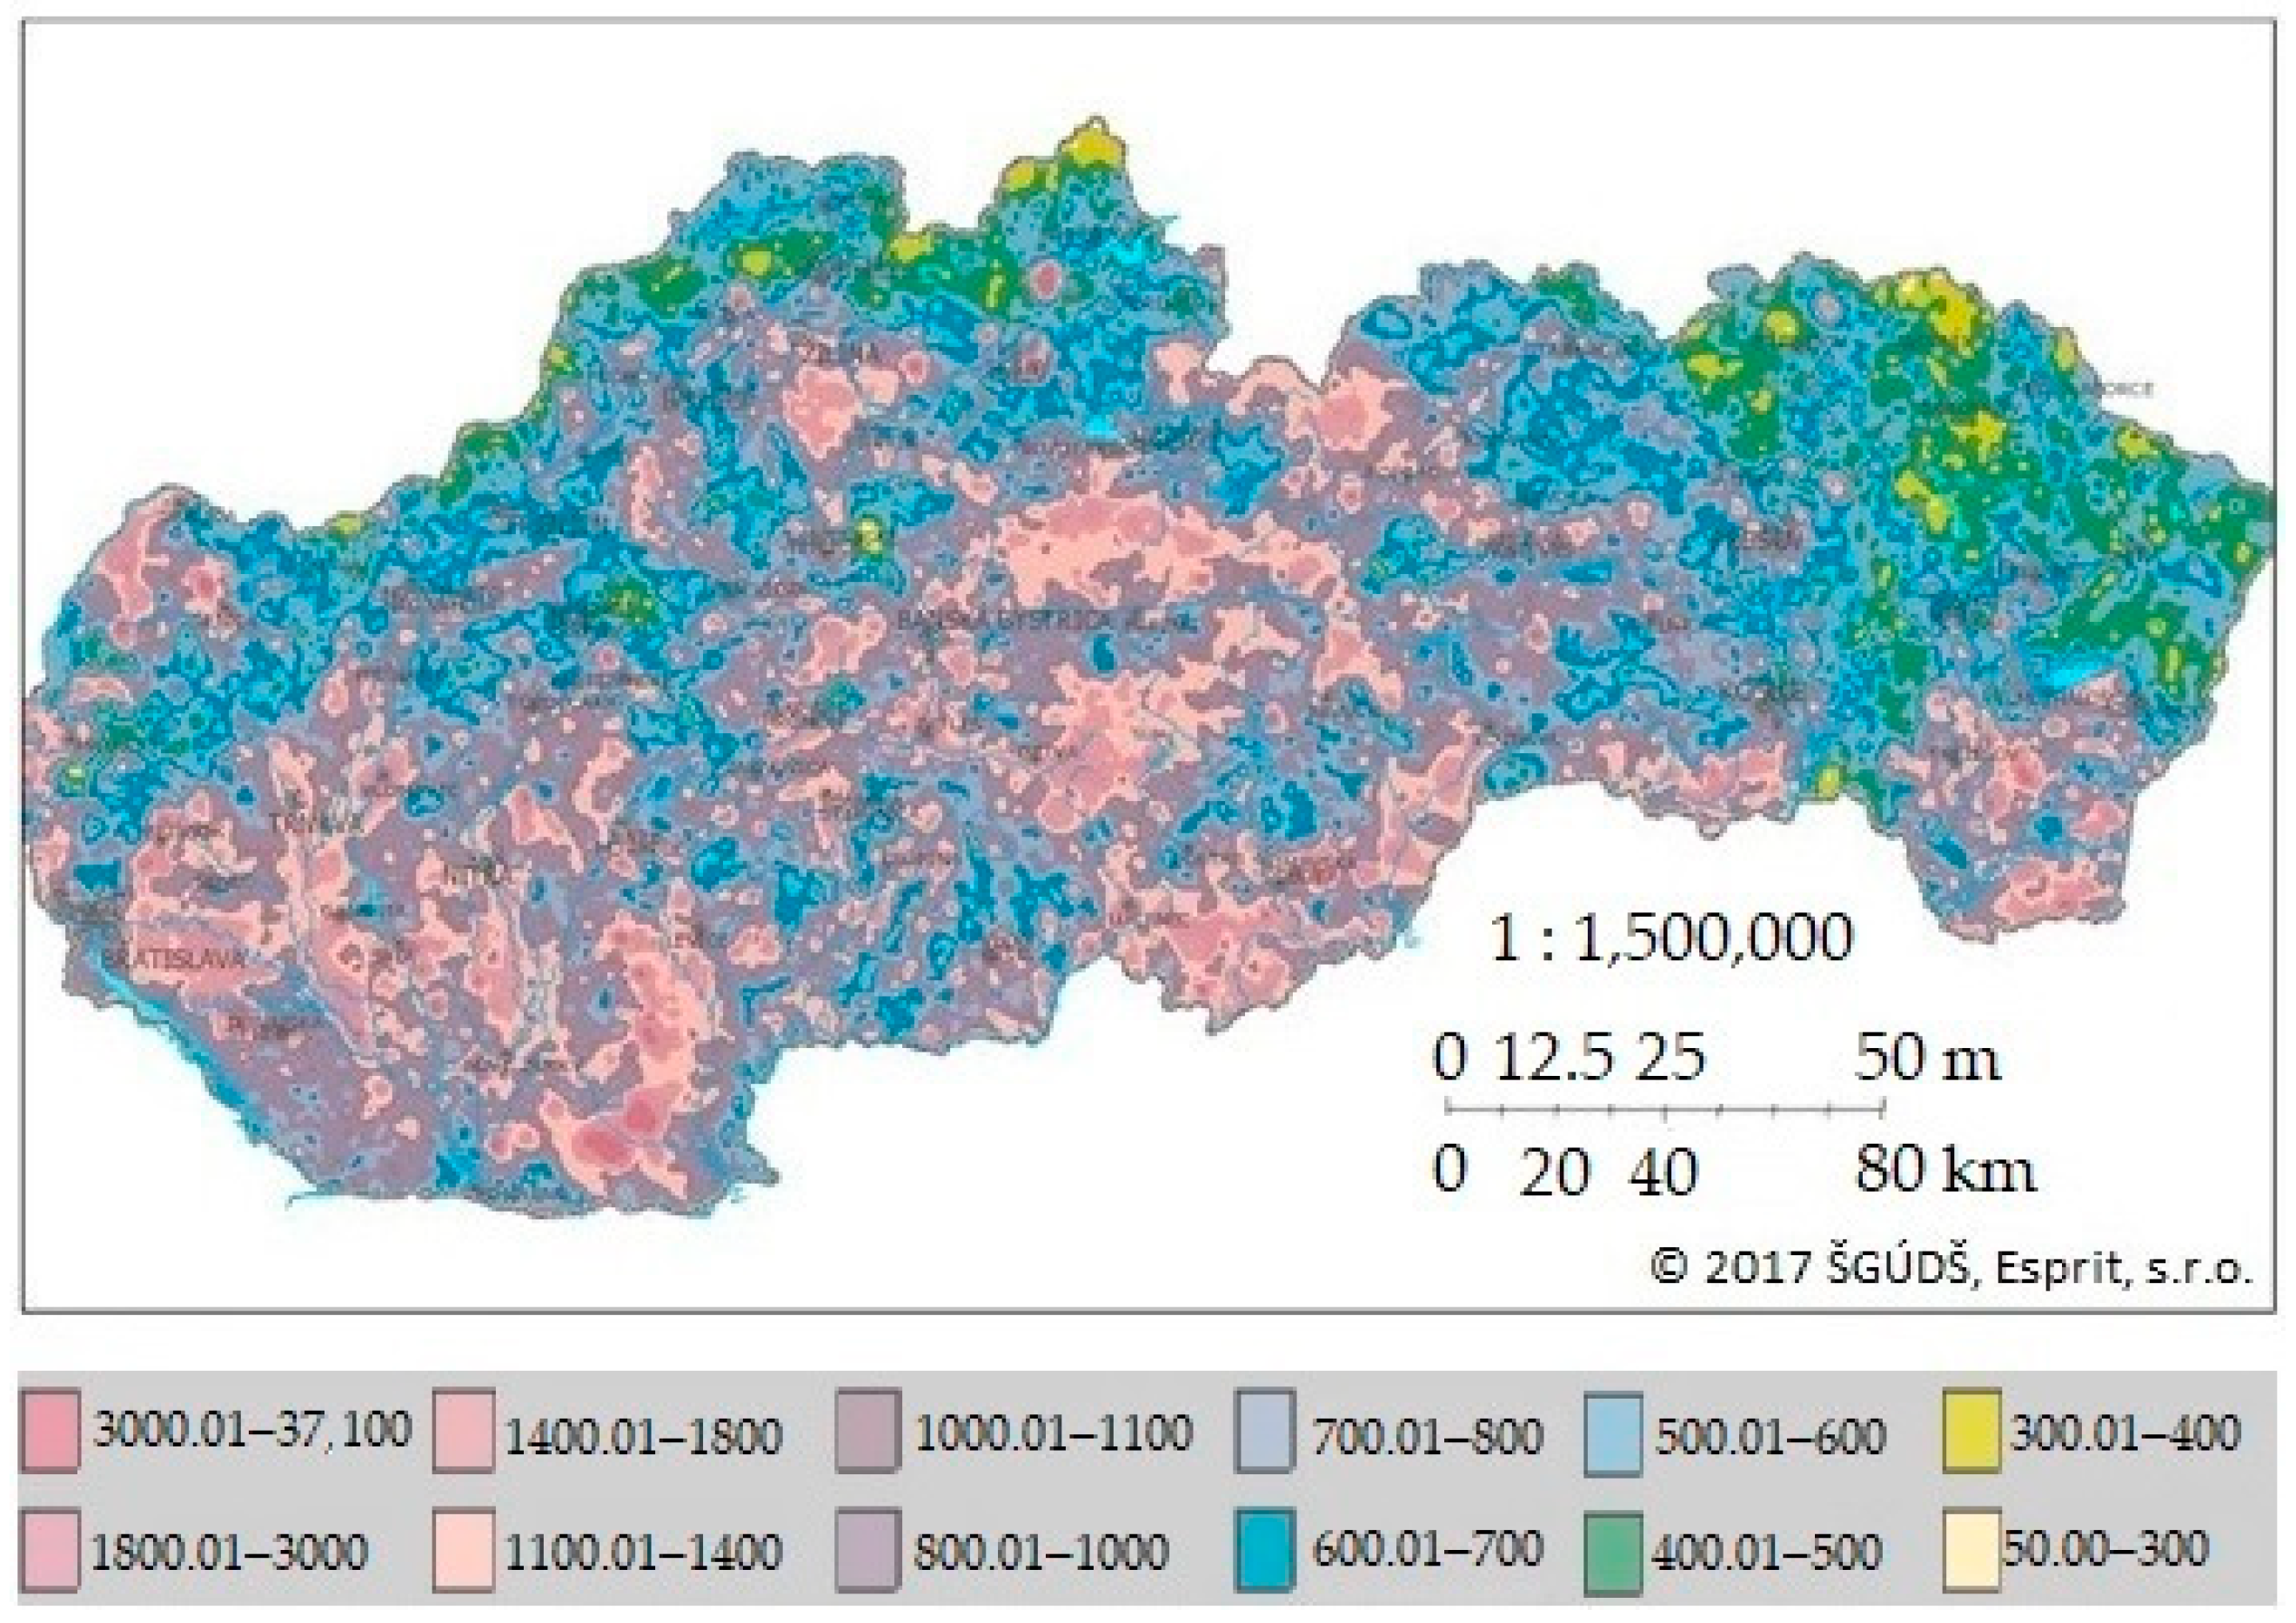
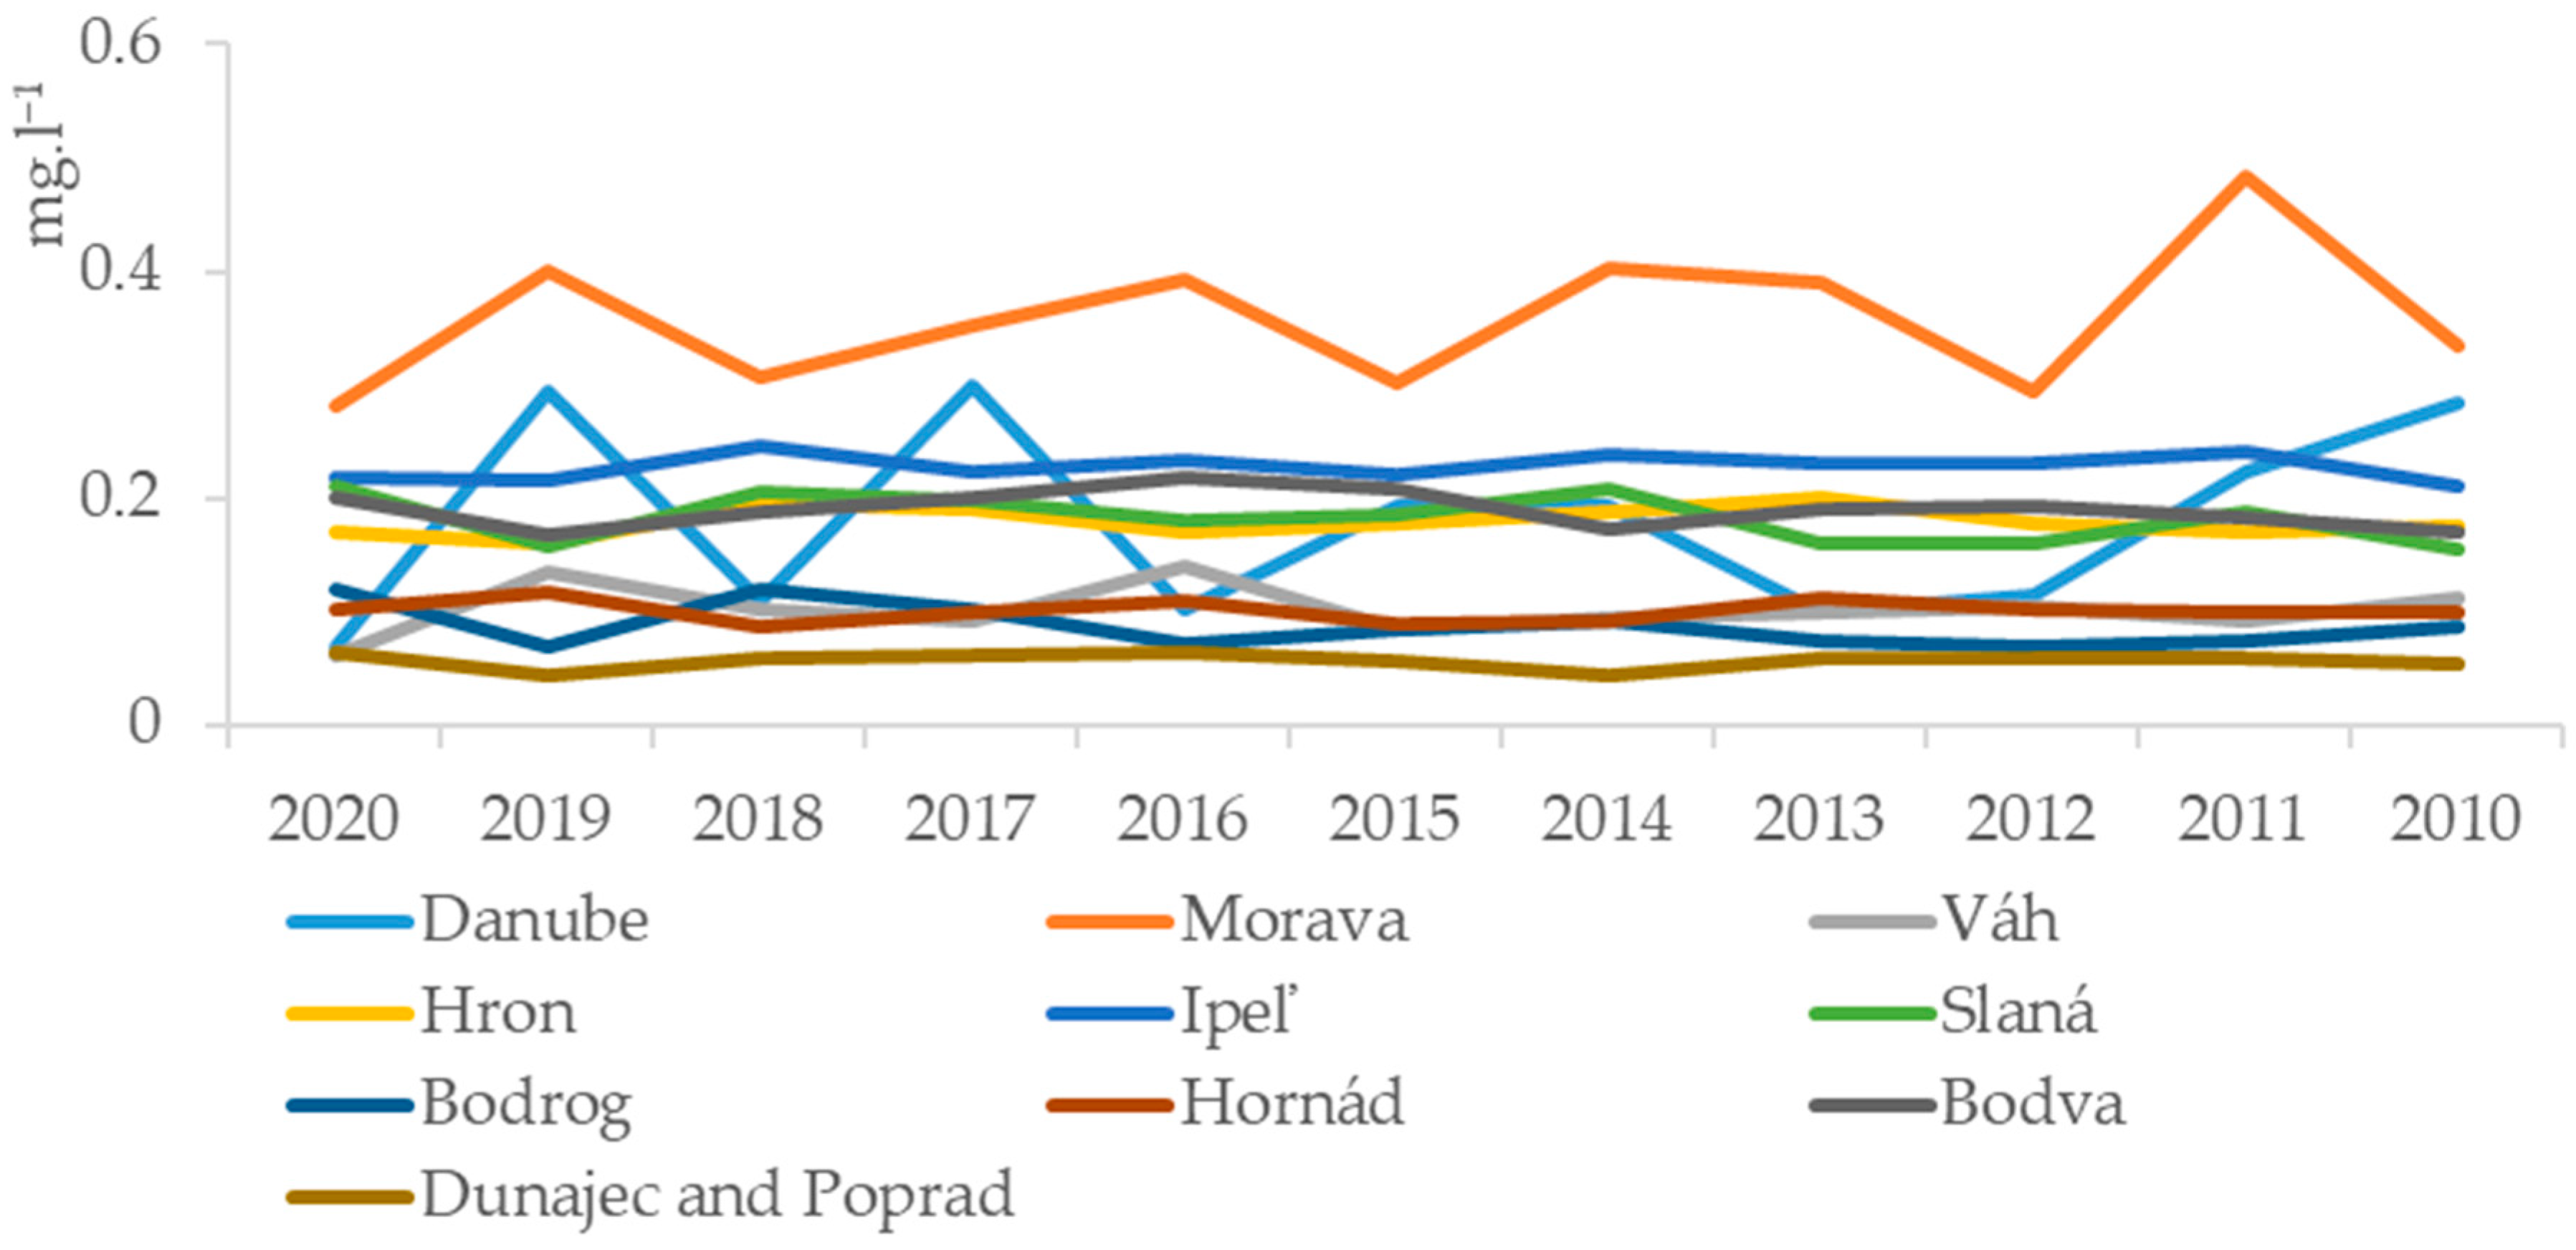
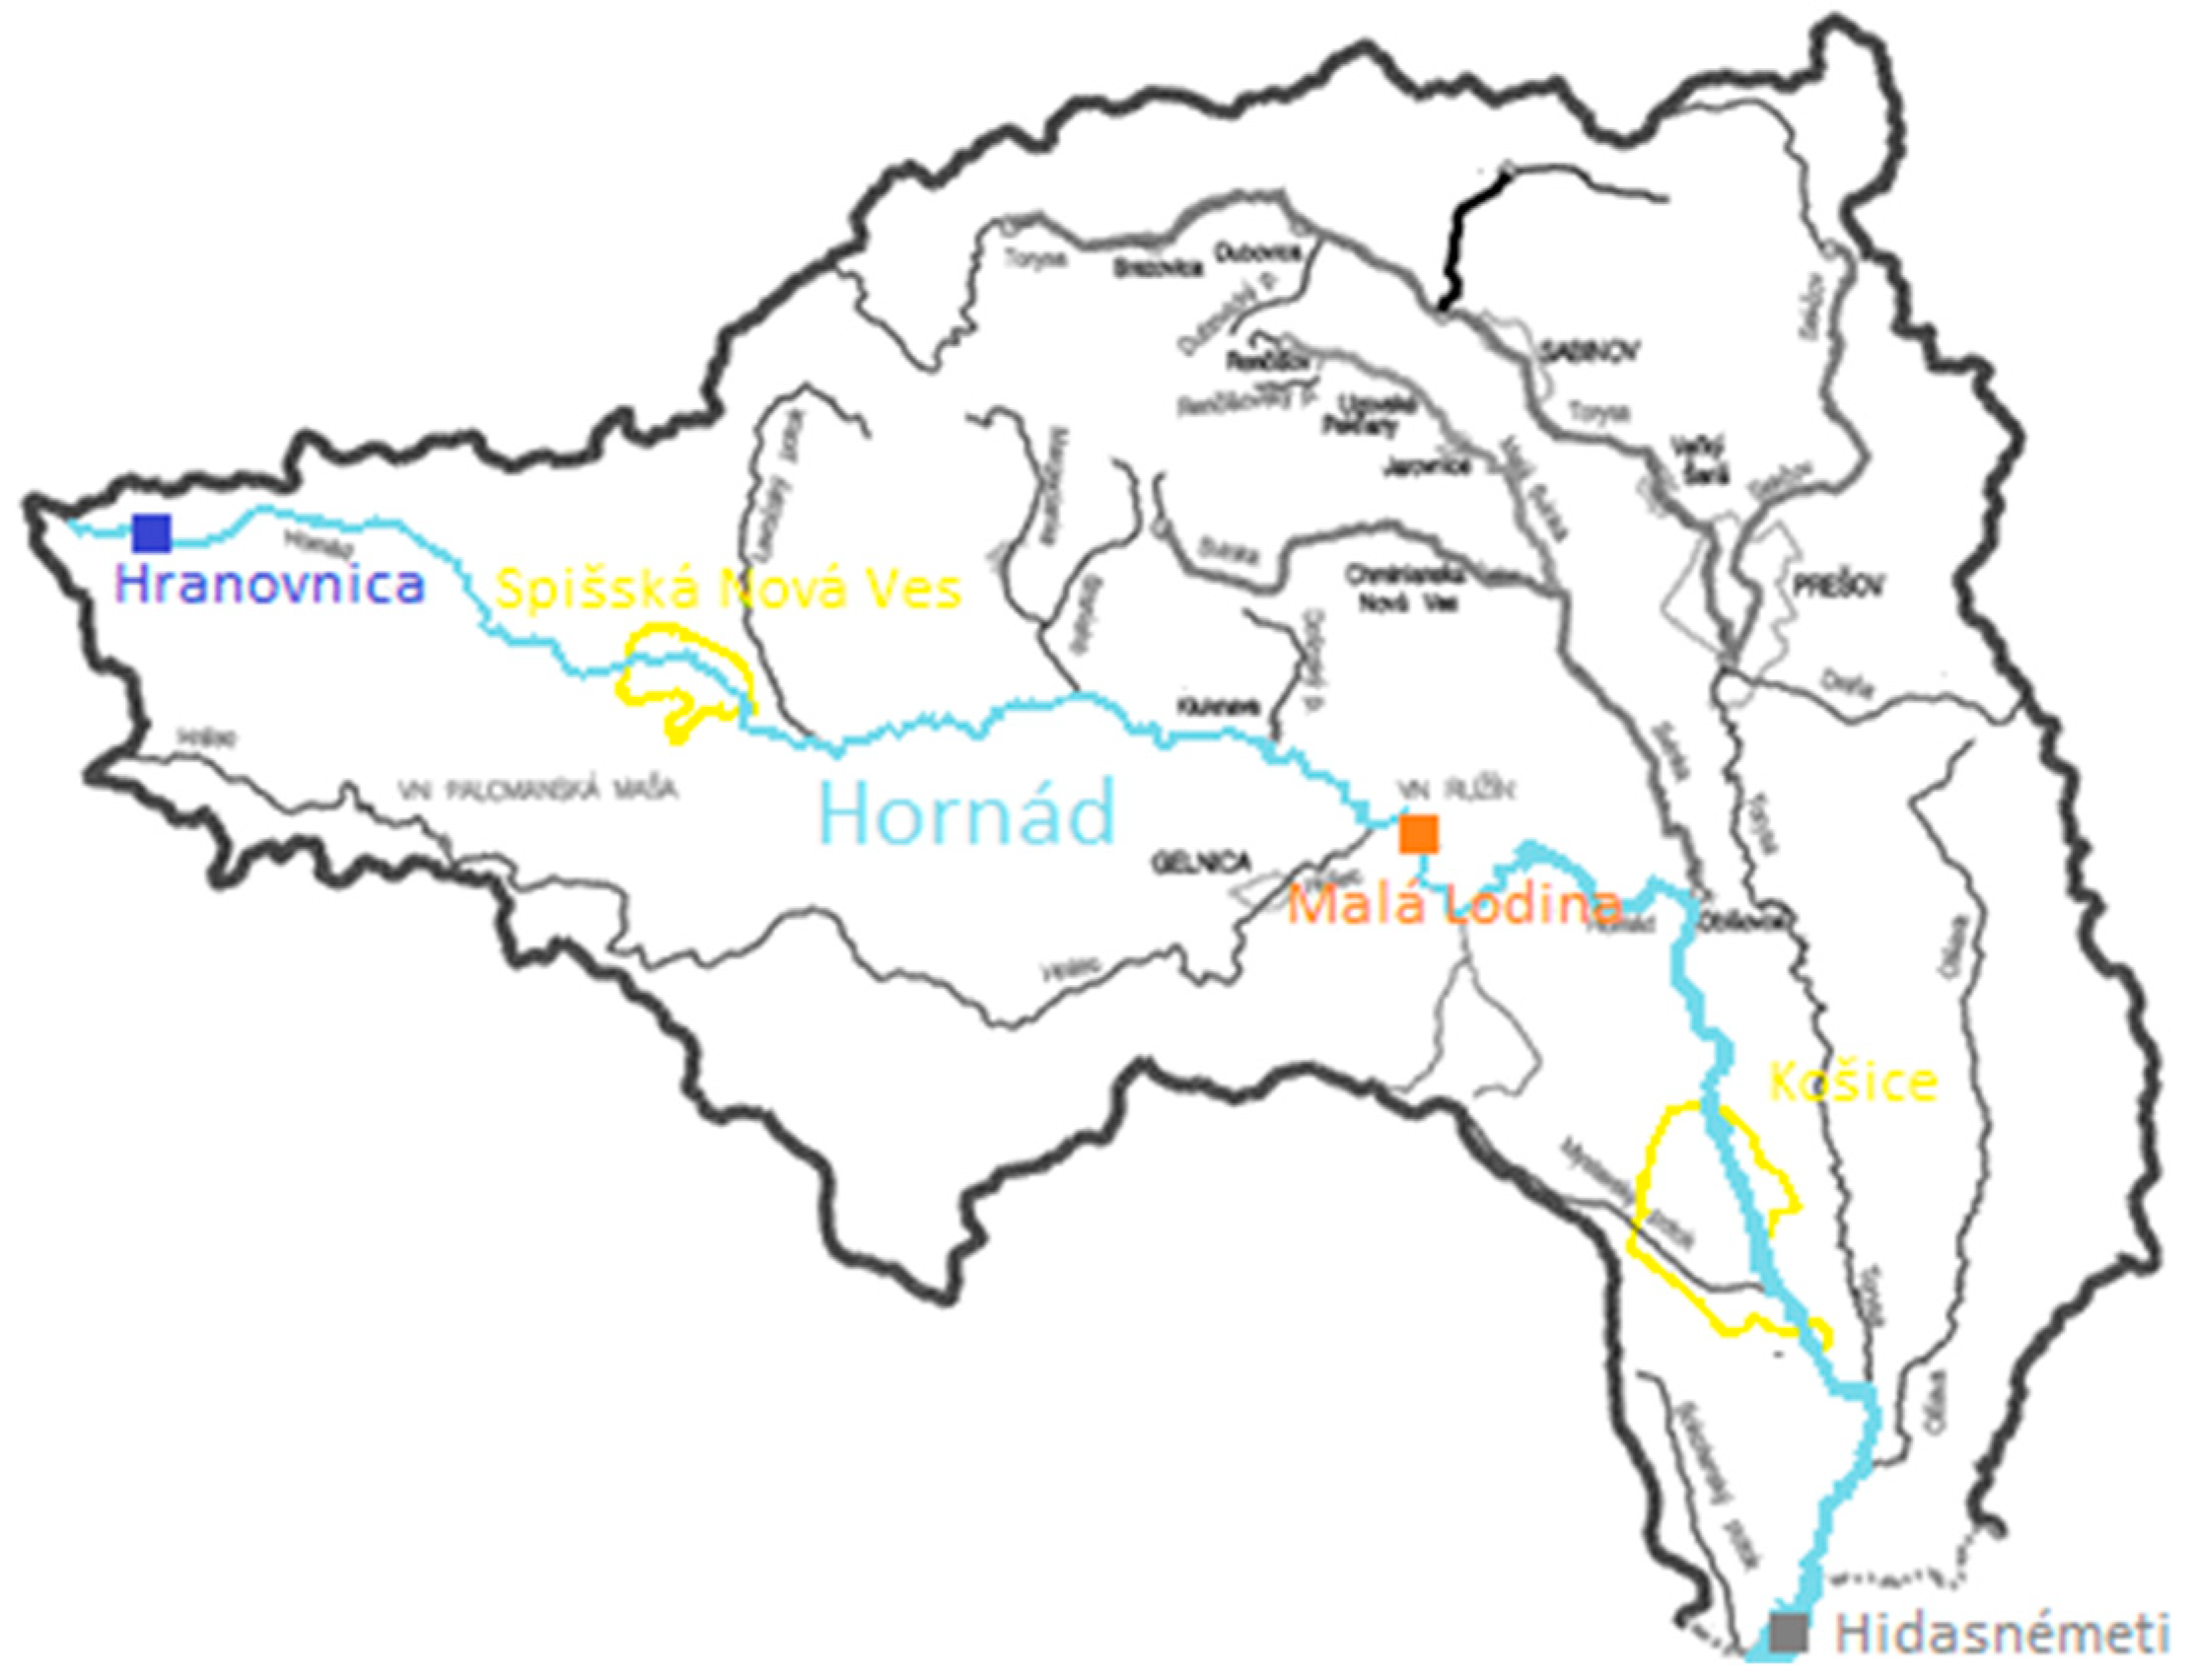
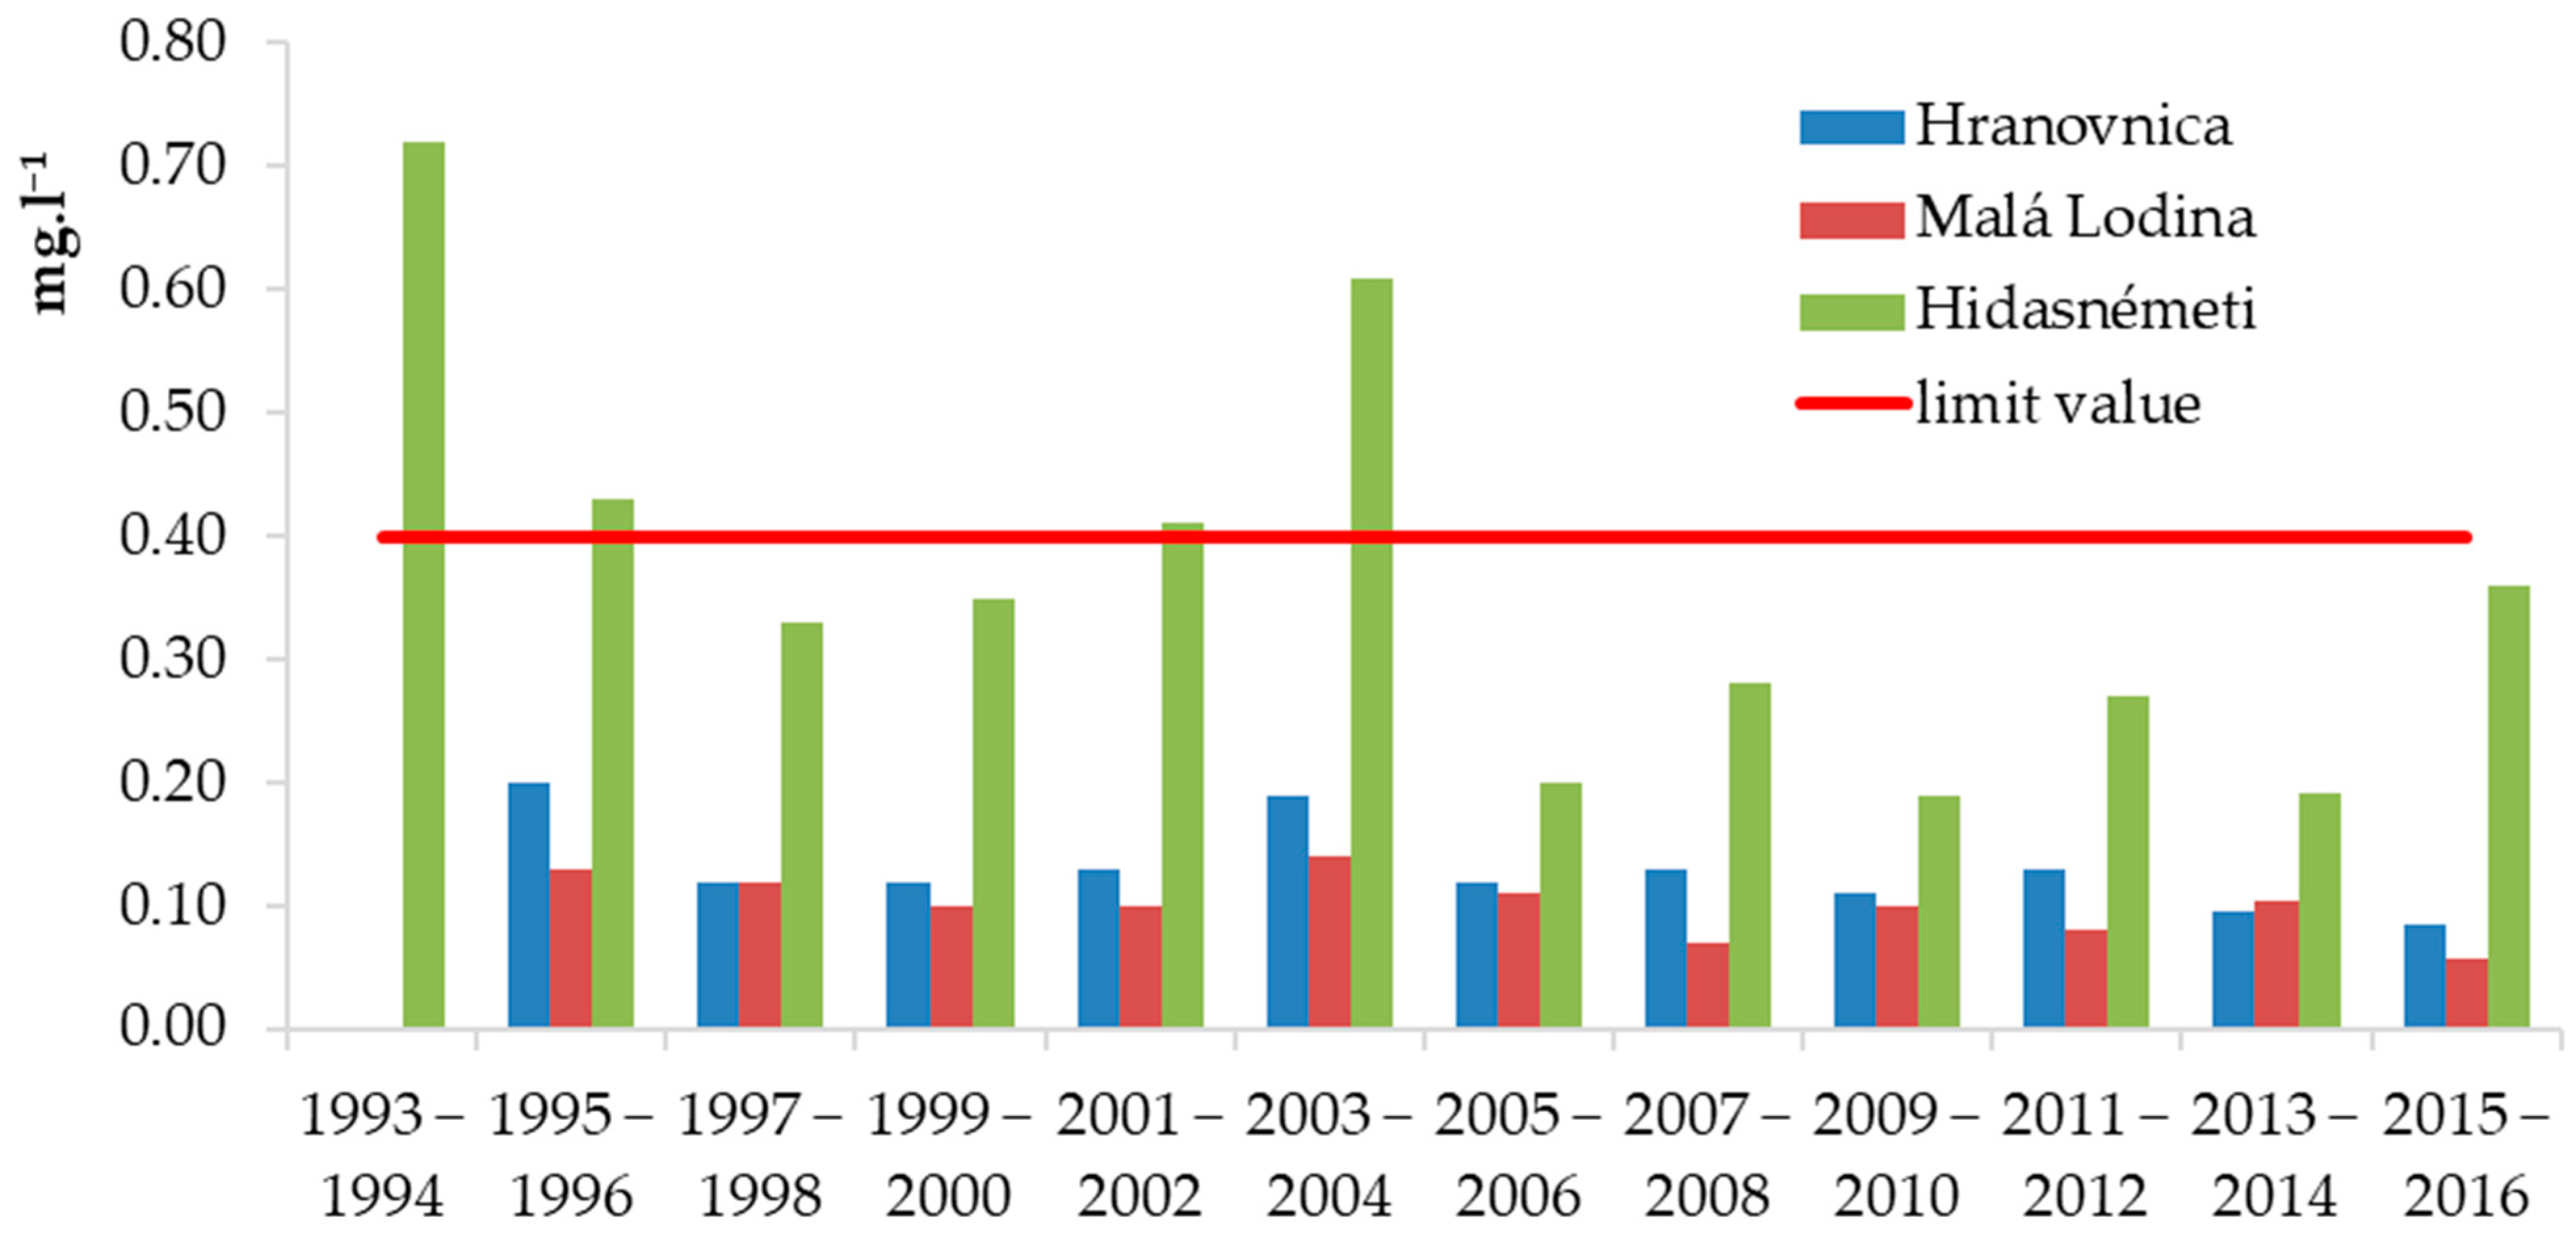
3.3.3. Surface Water and Sediments

There is quite a large amount of P in the rivers and river sediments of Slovakia. This may be caused by the excessive use of P-fertilizers and P-pesticides. The average P content in the stream sediments of Slovakia is 895.74 ± 786.11 mg·kg−1. The P distribution is very varied (Figure 3), and it may also be altered by human activities [53,54,55].
The average P content in the rivers of Slovakia is 0.006–5.49 mg·L−1 during the last 11 years (Figure 4).
The average annual flows for different periods in water meter stations are presented in Table 5. The values for the period of 1961–2000 were taken for calculations as the flows were in the range of 90–110% of these figures in recent years [56].
The basic monitoring of the Hornád River (Figure 5) was executed at an adequate number of sampling points to determine the quality of the water in the basin and selected as an example of a potential P source. Three sites were analyzed for water quality—at the beginning (Hranovnica), in the central part (Malá Lodina) and at the end (Hidasnémeti) of the river in Slovakia [58].
According to the results of the analysis (Figure 6), the limit value of the indicator total P (0.4 mg·L−1) was exceeded in 1995–1996 and 2001–2002 to a lesser extent and in 2003–2004 to a higher extent, and an extreme value was reached in 1993–1994. The maximum value was reached in 1993. The limit was only exceeded at the sampling site of Hidasnémeti. Considering the trend of P values in the future, a steady state within the limit or an infrequent limit surpass may be predicted [58].

3.3.4. Wastewater Production and Treatment

The measurement of phosphates in wastewater is very important for maintaining a healthy ecosystem and protecting animals. Many areas have strict phosphate discharge limits to protect the ecosystem into which such treated wastewater is released. In addition to protecting the ecosystem, failure to monitor and regulate phosphate levels can lead to infringements and consequent fines [55].
The amount of P released into watercourses, both treated in WWTPs and untreated, is presented in Figure 7. This trend of decline might be caused by the use of phosphate-free detergents, especially in households.

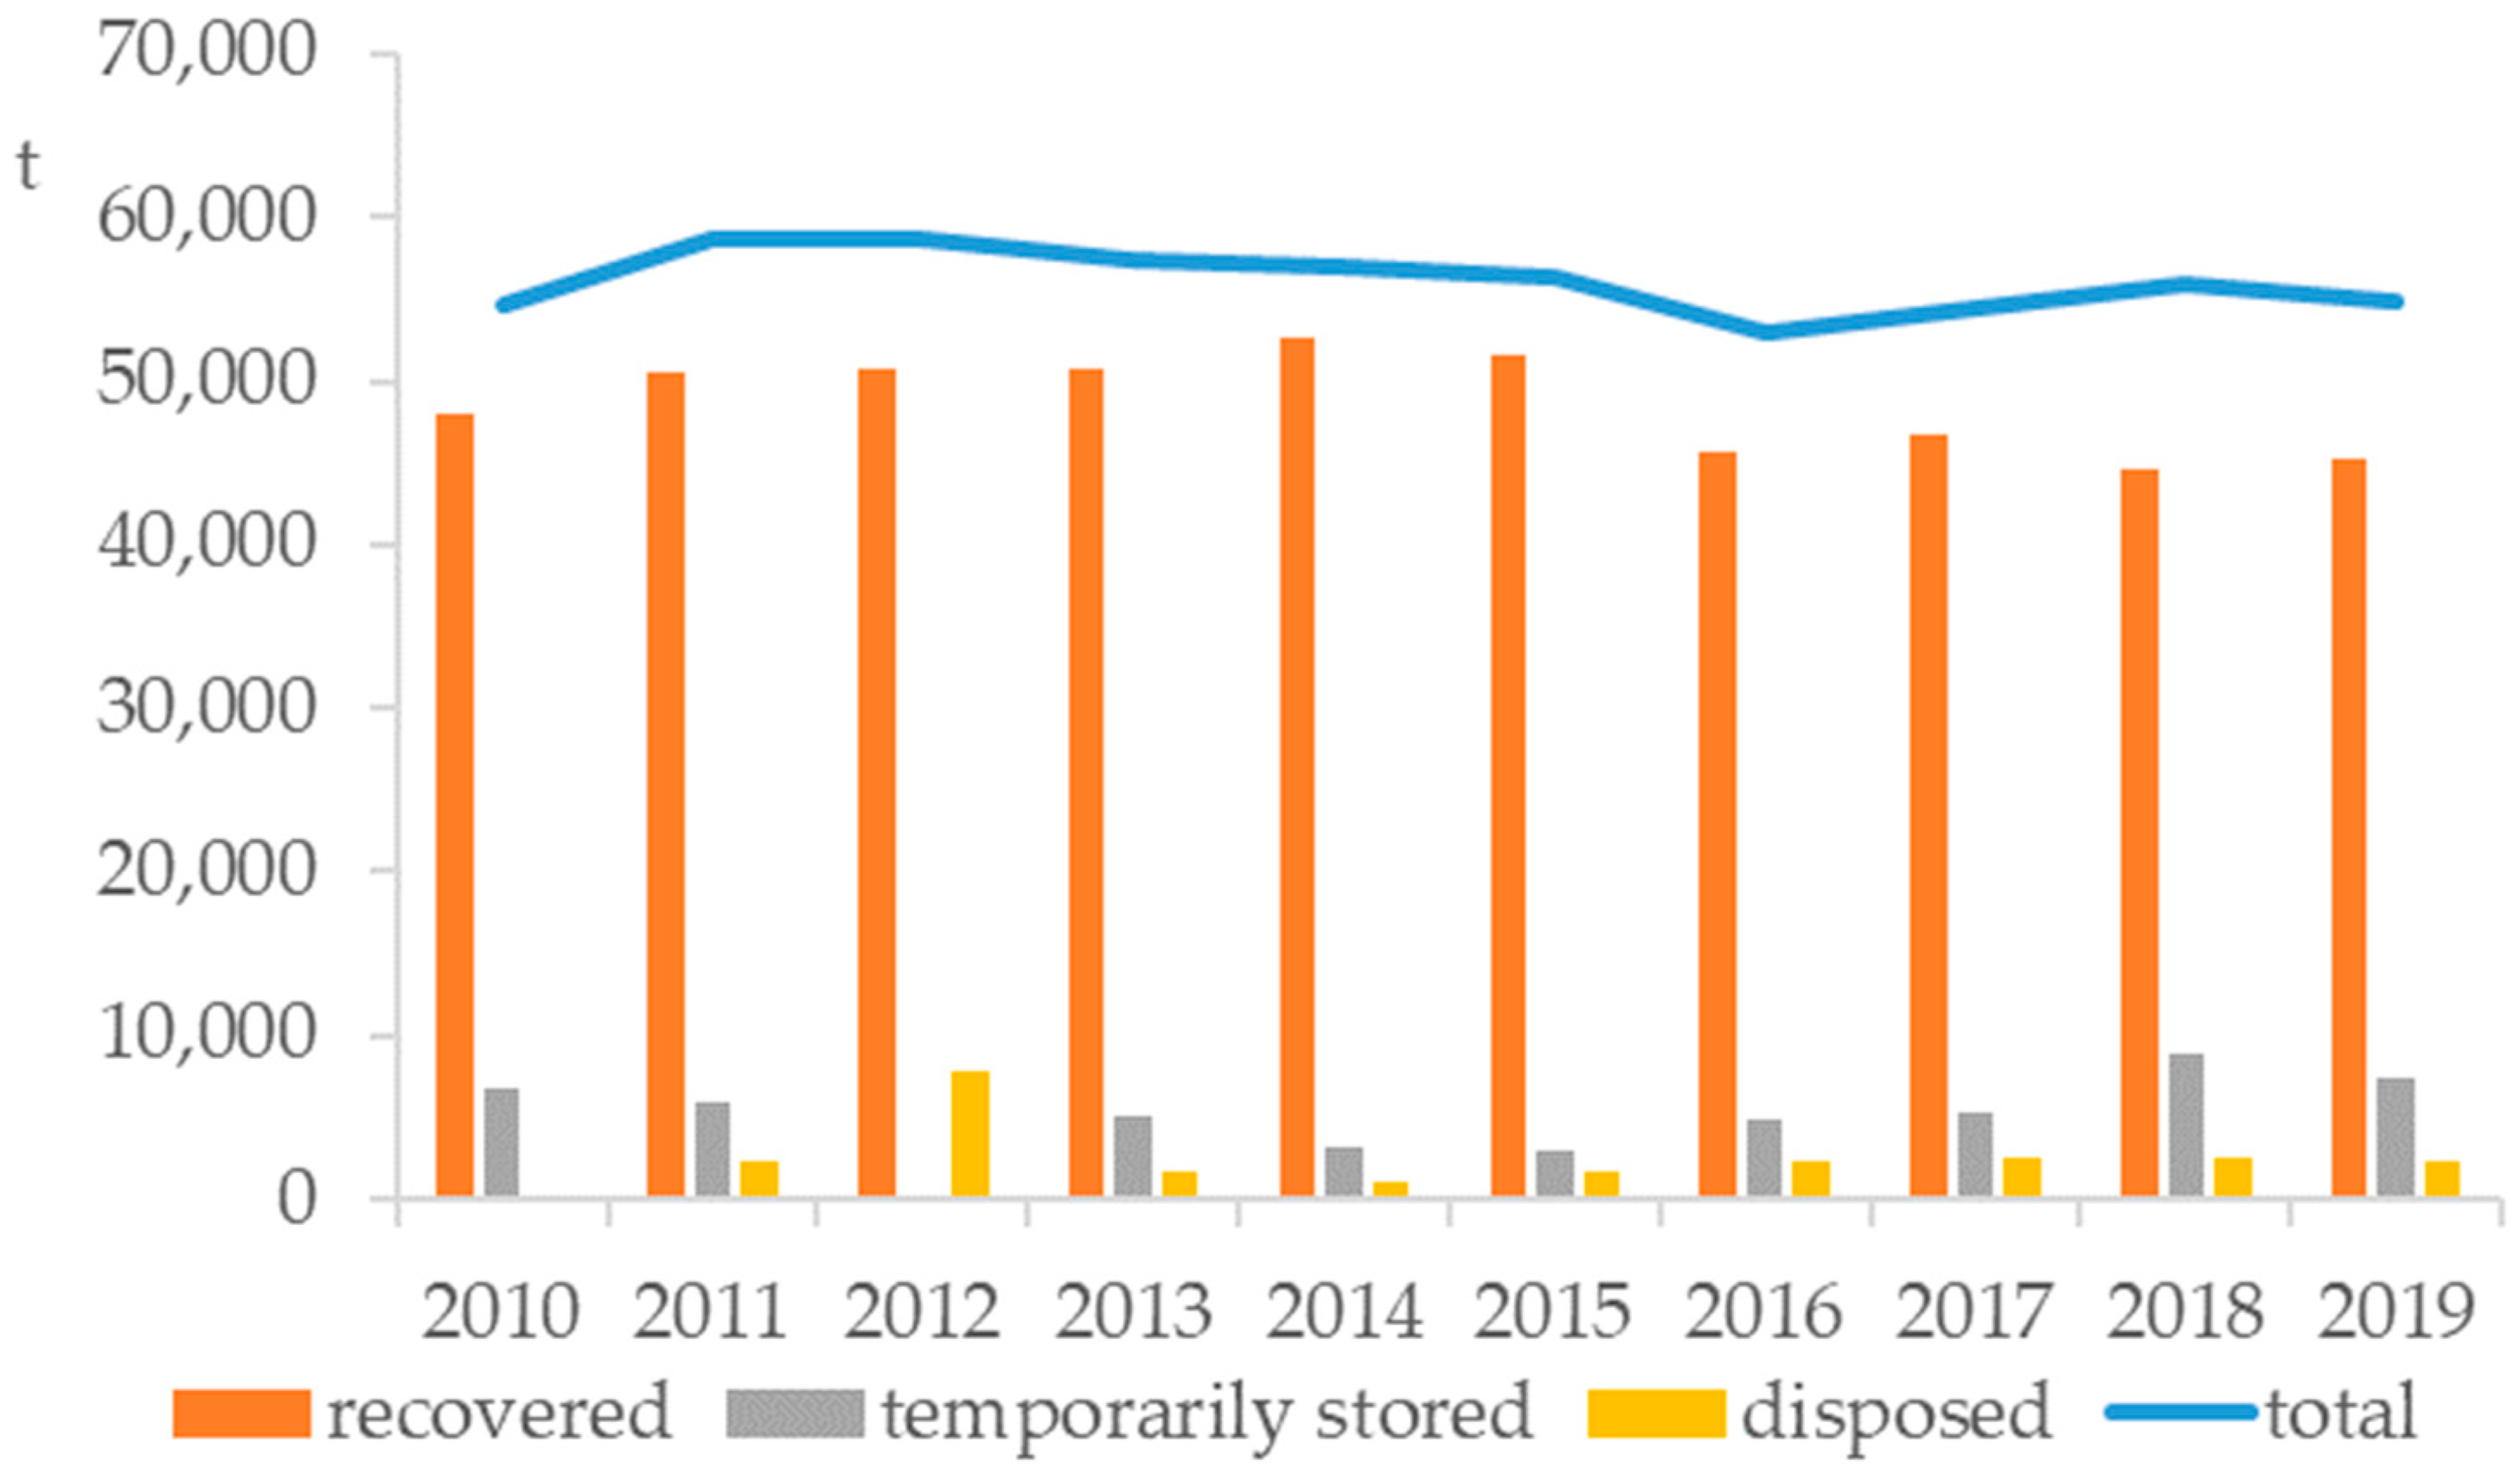
3.3.5. Sewage Sludge and Sewage Sludge Ash

Sewage sludge is a necessary by-product of the wastewater treatment process. In 2019, the total production of sludge from municipal WWTPs amounted to 54,832 t of sludge (dry matter), while 45,149 t (82.34%) of sludge was recovered (by application to agricultural land, composting, energy recovery or so), 2296 t (4.19%) was disposed (by landfilling or incineration) and 7387 t (13.47%) was temporarily stored [59]. The trend of sludge production in municipal WWTPs during the last 10 years is presented in Figure 8 and is stable with slight fluctuations. If the average total amount of produced sewage sludge in Slovakia during the last 10 years is considered, then the total available P content is about 49,125 t per year.
Currently, there is no sewage sludge incinerated in Slovakia. During the last ten years, only 68 t of sewage sludge was incinerated, specifically in 2016 [59].

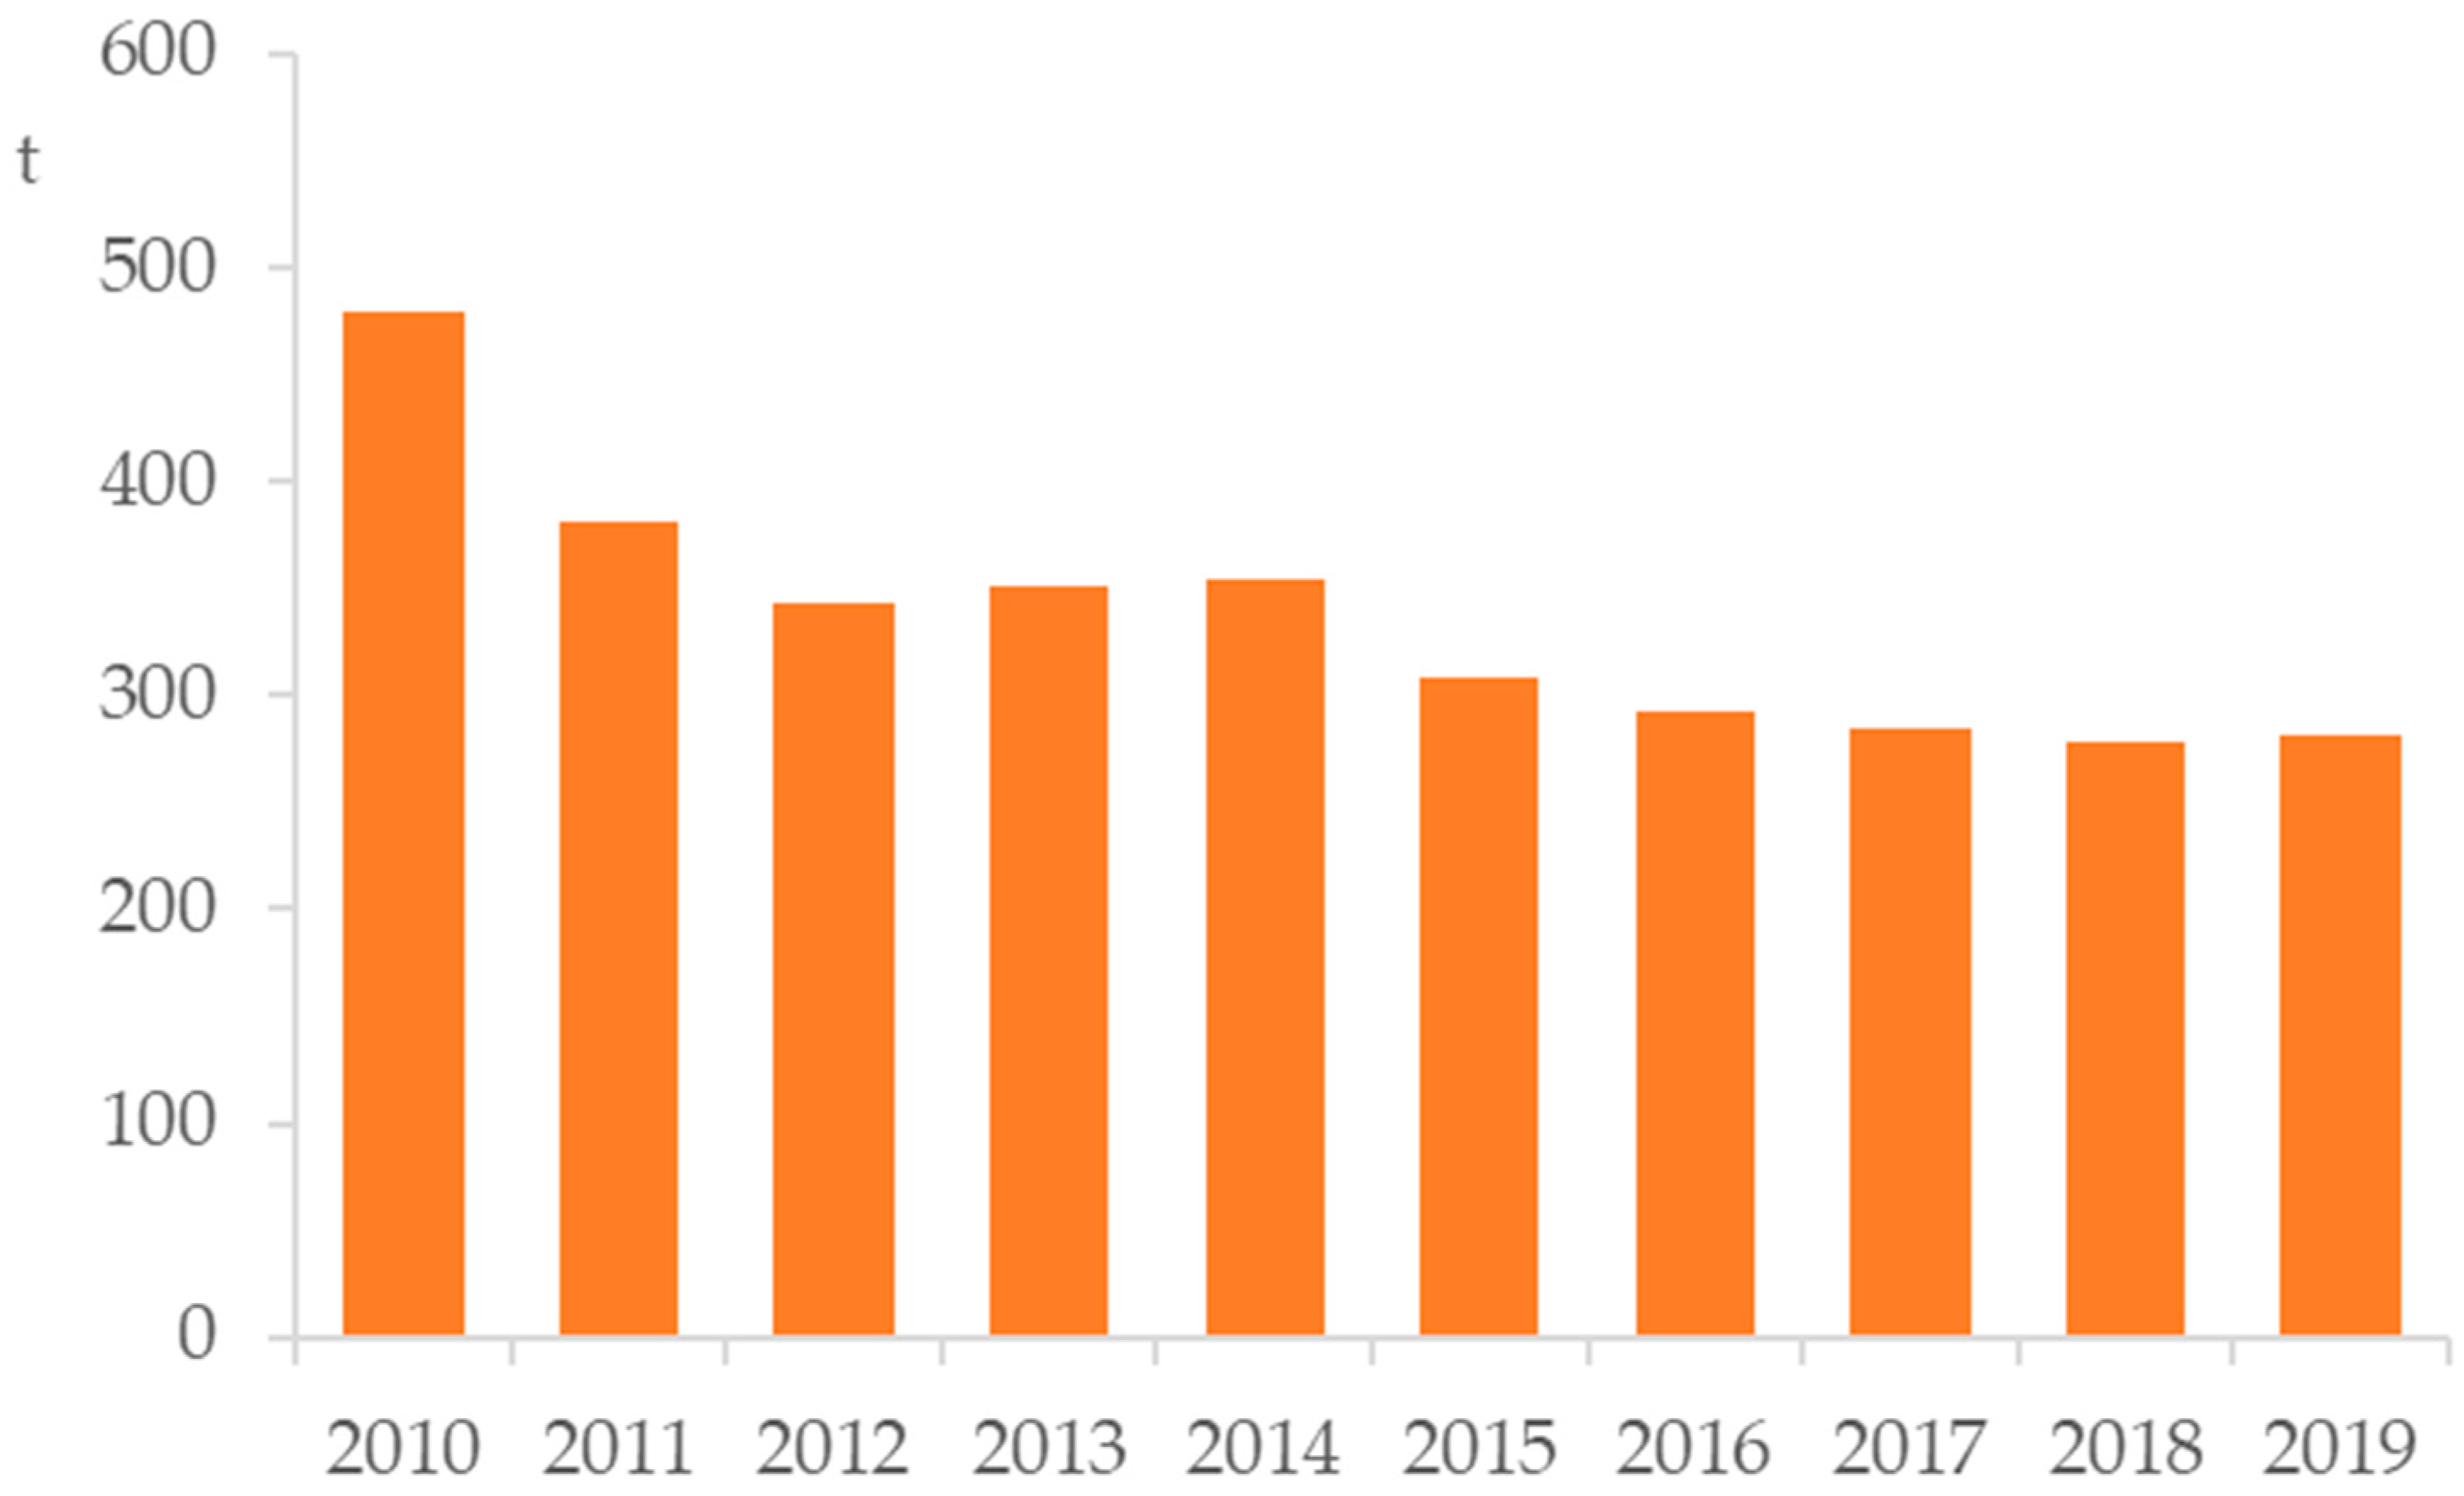
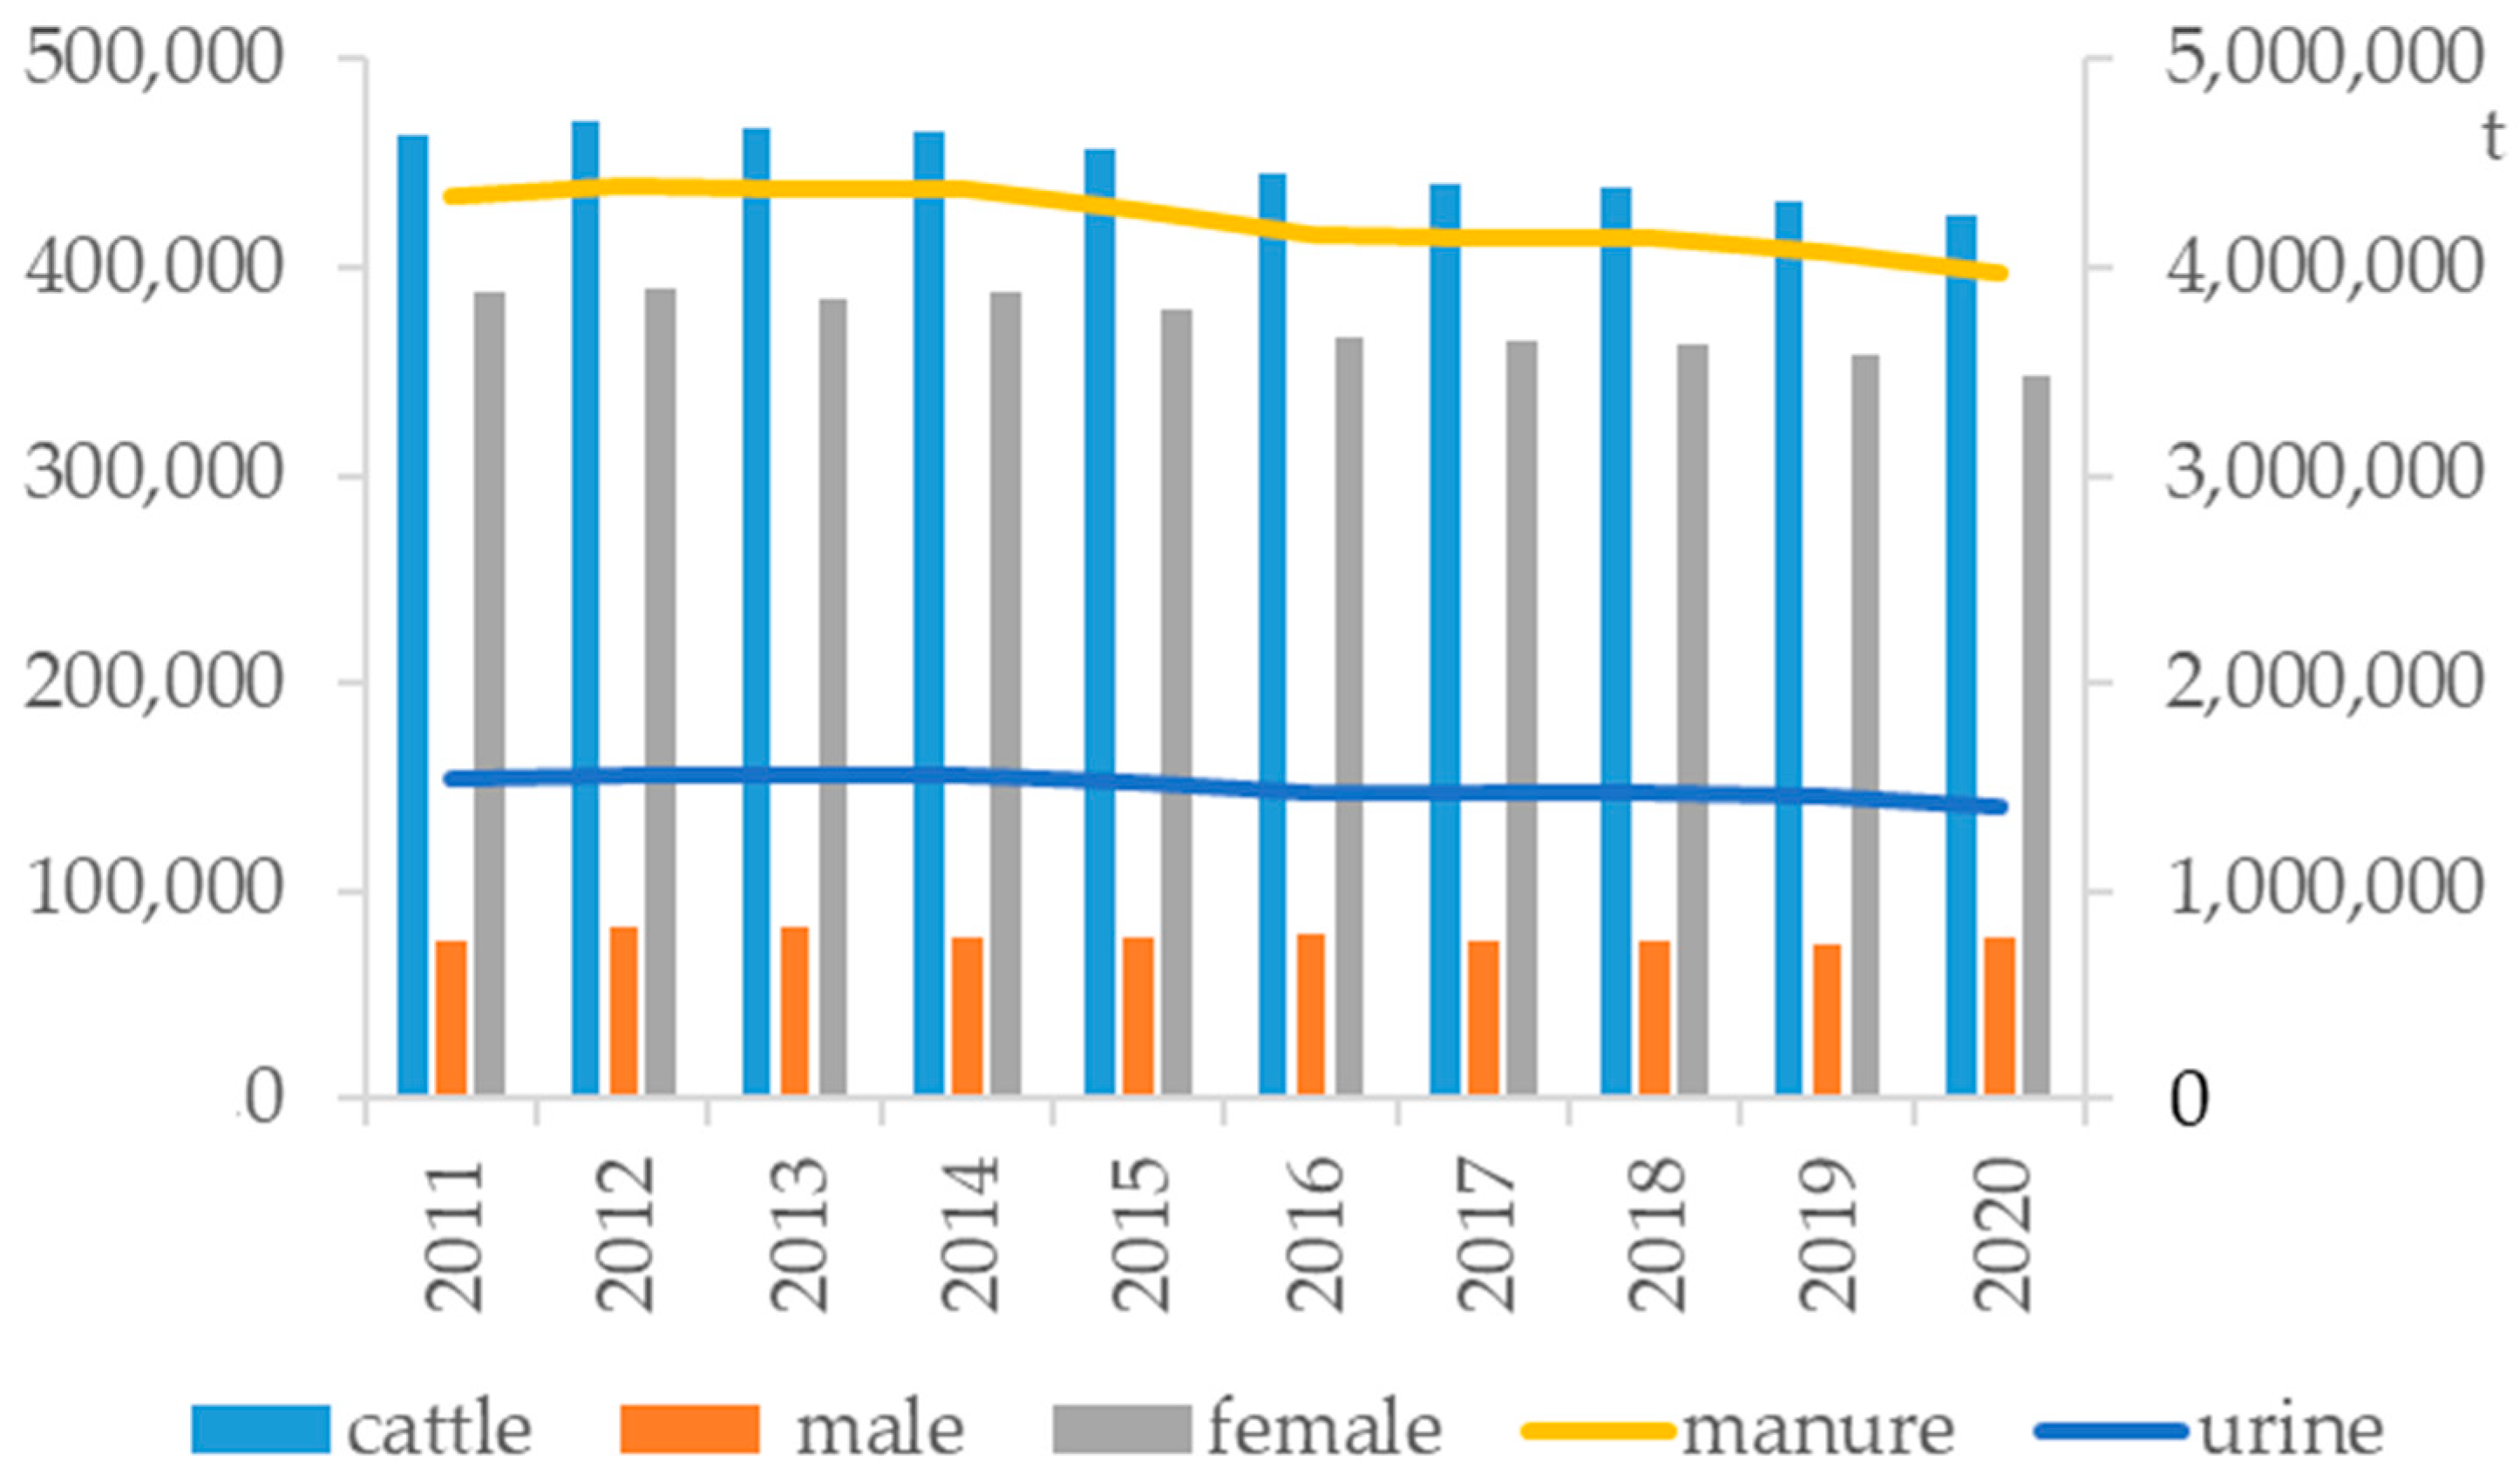
3.3.6. Animal and Slaughter Waste

In Slovakia, animal husbandry has been a tradition for many years. The number of cattle and the amount of manure and urine produced by the cattle are presented in Figure 9. The number of cattle was determined from statistical data [50] obtained from the results of the processing of annual reports submitted by reporting units registered in the commercial register, including privately farmed farmers with a reporting obligation and primary agricultural production. Data on other breeders not registered in the Farm Register are also included in the animal stocks. The amount of manure and urine was estimated using an online calculator provided by the Central Control and Testing Institute in Agriculture [60] under the conditions that the cattle were raised from the beginning of January until the end of December in stables and were grazed for 100 days for 8 h a day. The total number of cattle and the amount of manure produced have been decreasing for the last 10 years, while the amount of produced urine is stable. Due to this fact, if the average total amount of produced manure in Slovakia during the last 3 years is considered, then the total available P content is about 1,626,132 t per year.
Category 1 animal by-products and derived products (used for meat and bone meal production) pose an infection risk to humans, including specified risk materials and animals suspected or declared to be infected. This category also contains products contaminated by certain banned substances (hormones) or substances that are dangerous for the environment (dioxins and dioxin-like compounds). Further characteristics are defined by Regulation (EC) No 1069/2009 of the European Parliament and of the Council of 21 October 2009, laying down health rules with regard to animal by-products and derived products not intended for human consumption and repealing Regulation (EC) No 1774/2002 (Animal by-products Regulation). In Slovakia, there is only one category 1 animal by-product and derived product processing plant that produces category 1 meat and bone meal in the amount of about 200 t per month. It is incinerated in cement plants or added as a component to the pellets for heating [61]. If this amount is considered for P recovery, then the total available P content is about 456 t per year.

3.3.7. Steelmaking Slag

In Slovakia, there have been three steelworks operating during the last 10 years, U.S. Steel Košice Ltd., Železiarne Podbrezová JSC, and Slovenská oceliareň Maxa Aichera Ltd. The Slovenská oceliareň Maxa Aichera Ltd. terminated its operation about two years ago. There is no data available on the amount of steelmaking slag produced in Slovakia. Nevertheless, the data on the amount of produced steel are available, but only for 2020. There was 3,053,904.123 t of steel produced in Slovakia in 2020 [50]. 110–120 kg of steelmaking slag is produced per 1 t of steel [62], which means that approximately 335,929–366,468 t of steelmaking slag was produced. The estimated amount of P2O5 in steelmaking slag is 0.6–1.2% [63].

3.3.8. Available P Sources
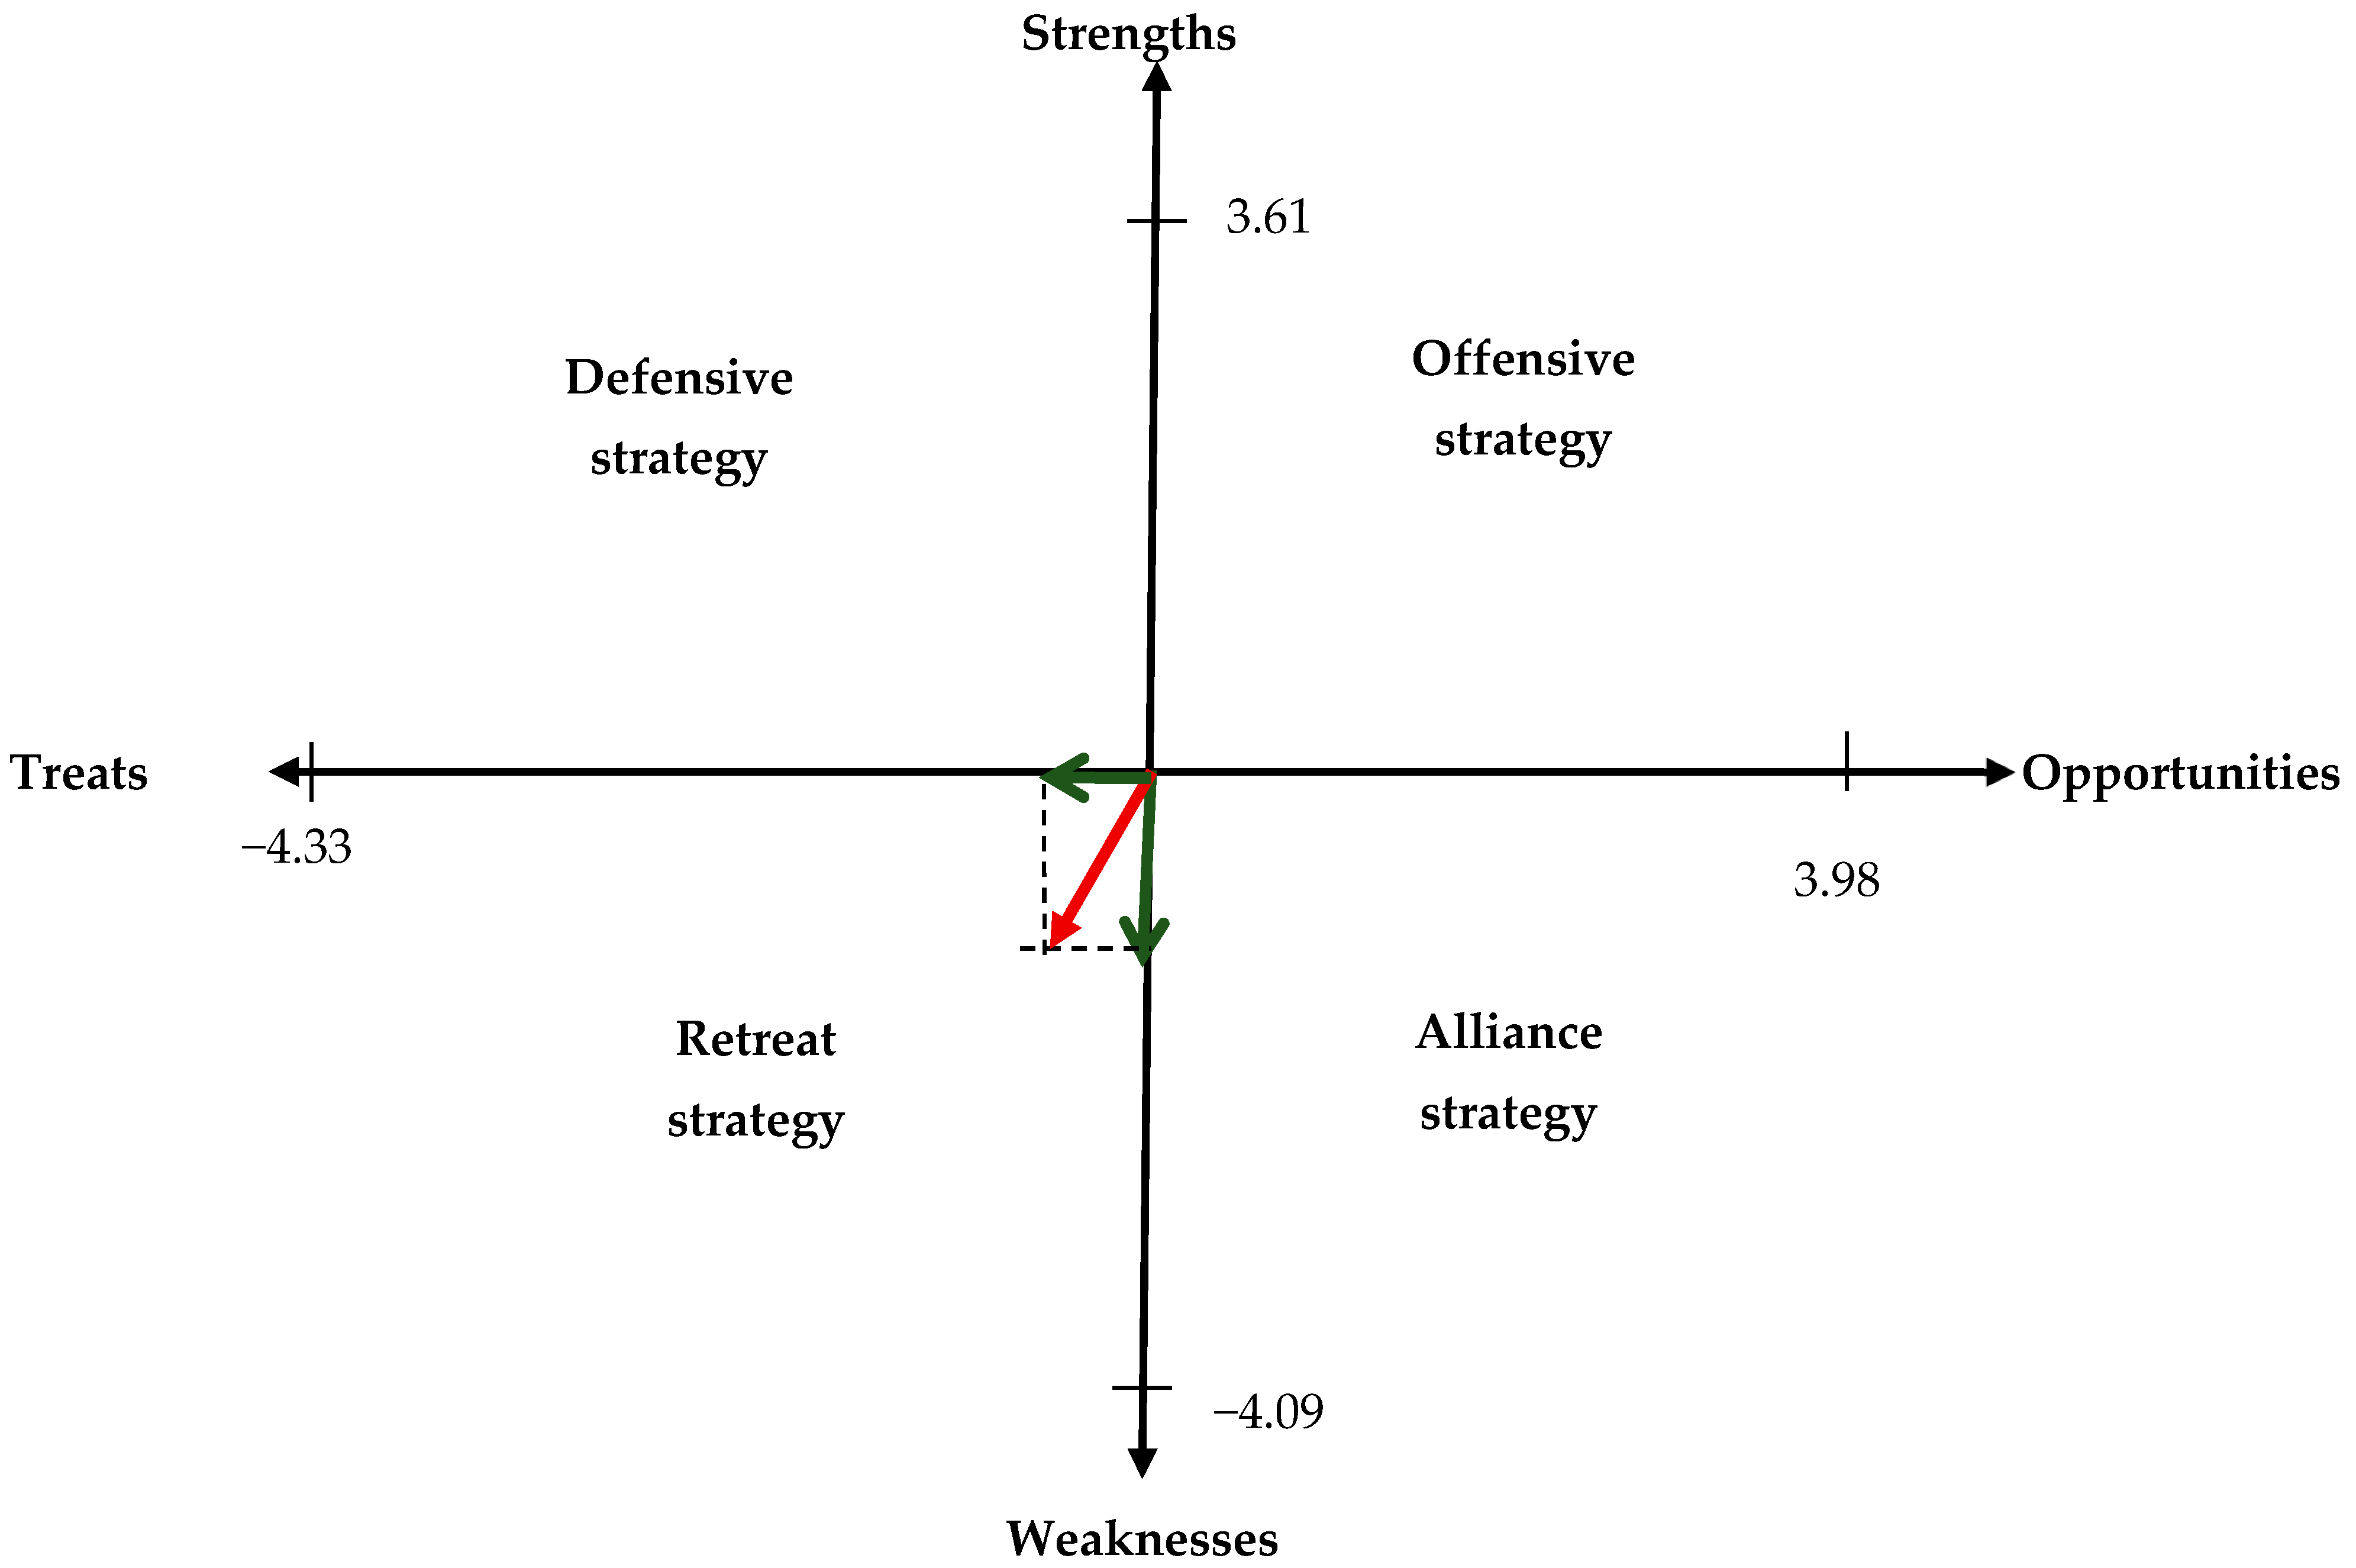
The estimated amounts of available sources of P and of available P compounds in Slovakia are presented in Table 6 based on the review in the Current State in Slovakia chapter. The amount of available P for recovery depends not only on the source of P but also on the method of recovery and fluctuation of the source and may vary. The commercially available P sources may be subject to availability, not free of charge and competing with other methods of utilization or recovery. The data presented in Table 6 are averages for each source and only represent an estimate and illustration of the possible amount of available P sources as well as a simplification for analysis carried out and discussed further.

3.4. SWOT Analysis

From the results of analyses on P sources in the conditions of the Slovak Republic presented above, it is necessary to clearly identify the P management strategy for the Slovak Republic. Since P management can be understood as a set of activities associated with its exploitation, processing, subsequent use and recovery in particular sectors of the economy, the factors of strengths were identified and quantified as follows:
S1—importers portfolio;
S2—favorable estimated potential of available P compounds from manure;
S3—production of steelmaking slag as a source of P;
S4—favorable estimated potential of available P compounds from urine;
S5—multiple sources for P recovery.
For the strengths identified above, the weights were quantified (Table 7).
The factors of weakness were identified and quantified as follows:
W1—the absence of P deposits;
W2—technological complexity of P recovery from sources;
W3—declining trend in cattle breeding and the amount of manure and urine;
W4—the absence of the P recovery from sewage sludge ash;
W5—low estimated potential of available P compounds from sewage sludge;
W6—low estimated potential of available P compounds from steelmaking slag.
For the weaknesses identified above, the weights were quantified (Table 8).
The factors of opportunities were identified and quantified as follows:
O1—the extraction of Gočaltovo P deposit;
O2—P recovery from manure;
O3—P recovery from urine;
O4—P recovery from river sediments;
O5—P recovery from surface water;
O6—P recovery from slaughter waste.
For the opportunities identified above, the weights were quantified (Table 9).
The factors of threats were identified and quantified as follows:
T1—lack of governmental support—lack of financial resources for obtaining P from recovery sources;
T2—instability of steel production;
T3—the reduction of manure production due to the reduction of cattle breeding;
T4—the reduction of slaughter waste production due to the reduction of animal waste production;
T5—significant dependence on P import;
T6—low number of potential P deposits.
For the threats identified above, the weights were quantified (Table 10).
Appropriate points were nominated to the factor of the partially analyzed areas of SWOT analysis and created the sum of partial products of weights and assigned points through defined vector boundaries of all assessed areas of SWOT analysis of P treatment in Slovak conditions (Table 11).

4. Discussion

The graphical representation of the SWOT analysis (Figure 10) shows that the P management in Slovakia should be guided by the principles of a retreat strategy, as weaknesses outweighed strengths and threats outweighed opportunities. In terms of this strategy, it follows that the P management in the Slovak Republic should eliminate the absence of mining of P deposits as well as the lack of facilities for obtaining P from recovery sources and thus cover the need for P in national sectors by imports.
The retreat strategy is based on threats and weaknesses, meaning external factors against which they must be defended but it is currently impossible, due to the weaknesses, to do that by changing in the future. By synthesizing the partial results, especially the SWOT analysis, it can be concluded that due to the absence of P deposits mined and of P recovery from existing sources at present, the low number of potential P deposits available for mining, the declining trend in cattle breeding and in the produced amount of manure and urine due to the reduction of cattle breeding, the absence of the P recovery from sewage sludge ash, the low estimated potential of available P compounds from sewage sludge, the low estimated potential of available P compounds from steelmaking slag in connection with lack of governmental support, the instability of steel production, the reduction of slaughter waste production due to the reduction of animal waste production and the significant dependence on P imports are the main factors that should guide the P management in Slovakia to keep responsible sources for the sustainable consumption and production of P compound products.
Slovakia depends on the import of P. This can be documented, except for in the above analysis, by lack of governmental support, lack of state policy, lack of initiatives, lack of investments, lack of major research projects, etc., concerning all the aspects of P management.
If Poland is considered, the situation concerning mining is similar to Slovakia. There are phosphorites in the north-eastern part of the Holy Cross Mts. [64]. In the past, phosphates were exploited but, currently, there are no deposits mined due to the economic aspects. [65]. All deposits were also removed from the national resources in 2006. The P raw materials are fully covered by imports, e.g., from Morocco, Algeria and Egypt [64]. Nevertheless, there is a high potential of P recovery from secondary sources such as wastewater and sewage sludge, animal manure, sewage sludge ash, meat and bone meal, industrial waste, plant waste and biomass [11]. In Poland, there are several major projects related to sustainable P management and recovery, such as Sustainable management of phosphorus in the Baltic region (InPhos) [66], Optimising bio-based fertilizers in agriculture–, providing a knowledge basis for new policies (LEX4BIO) [67], Market-ready technologies for P-recovery from municipal wastewater (PhosForce) [68], Towards Circular Economy in the wastewater sector: Knowledge transfer and identification of the recovery potential for phosphorus in Poland (CEPhosPOL) [69].

5. Conclusions

An analysis of the current situation of P management in Slovakia was conducted based on publications, manuals, legislative regulations, statistical databases, expert opinions and the identification of impacts. Based on these data, SWOT analysis was performed with exact quantification of all the identified factors. Based on the results of the analysis, it can be concluded that in Slovakia there is:
  • no P deposit mined;
  • a low number of potential P deposits;
  • no P recovered from available sources;
  • reduction of cattle breeding and manure and urine production;
  • a lack of governmental support;
  • instability in steel production;
  • significant dependence on P import.
This means that Slovakia depends on P importation as it has no P recovery facilities and, at this time, this situation cannot be changed due to the governmental attitudes towards P management. The result of the SWOT analysis of P management in Slovakia considering all the local aspects, suggests a retreat strategy with weaknesses outweighing strength and threats outweighing opportunities, thus indicating that it must be defended against external factors, which is not possible due to weaknesses.
There are also some research limitations. The SWOT analysis was used for decision-making with five strengths, six weaknesses, six opportunities and six threats factors that were identified in P management in Slovakia according to the methodological procedure with identification and quantification of their weights. The selection was made based on scientific and professional or internet-based literature sources and discussions with experts in all the appropriate and multiarea fields. Further investigation may consider other factors, different sources and use other methods. The analysis was based on the local situation in Slovakia, and for this reason, it cannot be generalized for any other region, but this might change in the future.

Author Contributions

Conceptualization, T.B., H.P. and Z.Š.; methodology, T.B., H.P., Z.Š. and L.B.; validation, T.B., H.P. and Z.Š.; formal analysis, T.B., H.P., Z.Š. and L.B.; investigation, T.B., H.P., Z.Š. and L.B.; resources, T.B., H.P. and Z.Š.; data curation, T.B., H.P. and Z.Š.; writing—original draft preparation, T.B., H.P. and Z.Š.; writing—review and editing, T.B., H.P. and Z.Š.; project administration, T.B., H.P. and Z.Š.; funding acquisition, L.B. All authors have read and agreed to the published version of the manuscript.

Funding

This research was funded by Vedecká grantová agentúra MŠVVaŠ SR a SAV, grants number VEGA 1/0797/20 and VEGA 1/0590/22.

Institutional Review Board Statement

Not applicable.

Informed Consent Statement

Not applicable.

Data Availability Statement

Not applicable.

Acknowledgments

Research conducted as the part of the project “How to stay alive in V4? Phosphorus Friends Club builds V4’s resilience” that is financed by Visegrad Fund, project no. 22110364 (2021–2023).

Conflicts of Interest

The authors declare no conflict of interest.

References

  1. Smol, M. The importance of sustainable phosphorus management in the circular economy (CE) model: The Polish case study. J. Mater. Cycles Waste Manag. 2019, 21, 227–238. [Google Scholar] [CrossRef] [Green Version]
  2. Yu, H.; Lu, X.; Miki, T.; Matsubae, K.; Sasaki, Y.; Nagasaka, T. Sustainable phosphorus supply by phosphorus recovery from steelmaking slag: A critical review. Resour. Conserv. Recycl. 2022, 180, 106203. [Google Scholar] [CrossRef]
  3. Jia, Y.; Zeng, W.; Fan, Z.; Meng, Q.; Liu, H.; Peng, Y. An effective titanium salt dosing strategy for phosphorus removal from wastewater: Synergistic enhancement of chemical and biological treatment. Sci. Total Environ. 2022, 842, 156960. [Google Scholar] [CrossRef] [PubMed]
  4. Theng, V.; Hashimoto, K.; Uk, S.; Tanaka, T.; Yoshioka, H.; Yoshimura, C. Hydrodynamics-based modeling of phosphorus balance and dynamics in a large tropical floodplain. Environ. Adv. 2022, 7, 100176. [Google Scholar] [CrossRef]
  5. Lyon, C.; Cordell, D.; Jacobs, B.; Martin-Ortega, J.; Marshall, R.; Camargo-Valero, M.A.; Sherry, E. Five pillars for stakeholder analyses in sustainability transformations: The global case of phosphorus. Environ. Sci. Policy 2020, 107, 80–89. [Google Scholar] [CrossRef]
  6. Scholz, R.W.; Wellmer, F.W. Endangering the integrity of science by misusing unvalidated models and untested assumptions as facts: General considerations and the mineral and phosphorus scarcity fallacy. Sustain. Sci. 2021, 16, 2069–2086. [Google Scholar] [CrossRef]
  7. Cordell, D.; Rosemarin, A.; Schröder, J.J.; Smit, A.L. Towards global phosphorus security: A systems framework for phosphorus recovery and reuse options. Chemosphere 2011, 84, 747–758. [Google Scholar] [CrossRef]
  8. Sadhukhan, J.; Christensen, M. An In-Depth Life Cycle Assessment (LCA) of Lithium-Ion Battery for Climate Impact Mitigation Strategies. Energies 2021, 14, 5555. [Google Scholar] [CrossRef]
  9. Gavurova, B.; Kovac, V.; Drabik, P.; Gomory, M. Exploration of Disparities in Environmental Activities of European Countries from Year 2006 to Year 2016. Acta Montan. Slovaca 2019, 24, 376–390. [Google Scholar]
  10. Krajčík, V. The readiness of Small and Medium-sized Enterprises (SMEs) for the digitalization of industry: Evidence from the Czech Republic. Acta Montan. Slovaca 2021, 26, 761–772. [Google Scholar]
  11. Smol, M.; Marcinek, P.; Duda, J.; Szołdrowska, D. Importance of Sustainable Mineral Resource Management in Implementing the Circular Economy (CE) Model and the European Green Deal Strategy. Resources 2020, 9, 55. [Google Scholar] [CrossRef]
  12. Reichl, C.; Schatz, M. World Mining Data 2020. Federal Ministry of Agriculture, Regions and Tourism: Vienna, Austria, 2020. [Google Scholar]
  13. Valenčíková, M.; Marišová, E. Implementation of circular economy principles affected by a market entity: Nitra study. In Zborník Vedeckých Prác II z Projektu VEGA 1/0705/19 „Zodpovednosť Vybraných Trhových Subjektov ako Významný Determinant Aplikácie Princípov Kruhovej Ekonomiky na Slovensku“; Ekonomická fakulta Univerzity Mateja Bela v Banskej Bystrici, Belianum: Banská Bystrica, Slovakia, 2021; ISBN 978-80-557-1920-7. [Google Scholar]
  14. Razminienė, K.; Vinogradova, I.; Tvaronavičienė, M. Clusters in Transition to Circular Economy: Evaluation of Relation. Acta Montan. Slovaca 2021, 26, 455–465. [Google Scholar]
  15. Alcántara-Plazola, J.J.; de la Barrera, E. Quantification of embedded phosphorus in Mexican agriculture. Sustain. Prod. Consum. 2021, 28, 824–828. [Google Scholar] [CrossRef]
  16. Lauri, L.S.; Brown, T.; Kalvig, P.; Sievers, H. Identification and Quantification of Primary CRM Resources in Europe. SCRREEN D3.1: Identification and Quantification of Primary CRM Resources in Europe. Available online: https://ec.europa.eu/research/participants/documents/downloadPublic?documentIds=080166e5b8f6231d&appId=PPGMS (accessed on 7 January 2022).
  17. Kroiss, H.; Rechberger, H.; Egle, L. Phosphorus in Water Quality and Waste Management. In Integrated Waste Management—Volume II; Kumar, S., Ed.; IntechOpen: London, UK, 2011. [Google Scholar]
  18. Khan, M.; Mohammad, F. Eutrophication: Challenges and Solutions. In Eutrophication: Causes, Consequences and Control; Ansari, A., Gill, S., Eds.; Springer: Dordrecht, Germany, 2014. [Google Scholar]
  19. Scolozzi, R.; Schirpke, U.; Morri, E.; D’Amato, D.; Santolini, R. Ecosystem services-based SWOT analysis of protected areas for conservation strategies. J. Environ. Manag. 2014, 146, 543–551. [Google Scholar] [CrossRef] [PubMed]
  20. Gavurova, B.; Kocisova, K.; Behun, M.; Tarhanicova, M. Environmental performance in OECD countries: A non-radial DEA approach. Acta Montan. Slovaca 2018, 23, 206–215. [Google Scholar]
  21. Rabe, M.; Streimikiene, D.; Wojciechowski, A.; Sochacka, M. Regional Energy Planning: Optimising Geothermal Energy Production Under Natural Conditions. Acta Montan. Slovaca 2021, 26, 784–795. [Google Scholar]
  22. Siwiec, D.; Pacana, A. Identifying the source of the problem by using implemented the FAHP method in the selected quality management techniques. Prod. Eng. Arch. 2020, 26, 5–10. [Google Scholar] [CrossRef]
  23. Siwiec, D.; Pacana, A. Model Supporting Development Decisions by Considering Qualitative–Environmental Aspects. Sustainability 2021, 13, 9067. [Google Scholar] [CrossRef]
  24. Ulewicz, R.; Siwiec, D.; Pacana, A.; Tutak, M.; Brodny, J. Multi-Criteria Method for the Selection of Renewable Energy Sources in the Polish Industrial Sector. Energies 2021, 14, 2386. [Google Scholar] [CrossRef]
  25. Bakalár, T.; Pavolová, H.; Tokarčík, A. Analysis and Model of River Basin Sustainable Management by SWOT and AHP Methods. Water 2021, 13, 2427. [Google Scholar] [CrossRef]
  26. Kurttila, M.; Pesonen, M.; Kangas, J.; Kajanus, M. Utilizing the analytic hierarchy process (AHP) in SWOT analysis—A hybrid method and its application to a forest-certification case. For. Policy Econ. 2000, 1, 41–52. [Google Scholar] [CrossRef]
  27. Bakalár, T.; Pavolová, H.; Hajduová, Z.; Lacko, R.; Kyšeľa, K. Metal recovery from municipal solid waste incineration fly ash as a tool of circular economy. J. Clean. Prod. 2021, 302, 126977. [Google Scholar] [CrossRef]
  28. White, T.H., Jr.; Barros, Y.d.M.; Develey, P.F.; Llerandi-Román, I.C.; Monsegur-Rivera, O.A.; Trujillo-Pinto, A.M. Improving reintroduction planning and implementation through quantitative SWOT analysis. J. Nat. Conserv. 2015, 28, 149–159. [Google Scholar] [CrossRef]
  29. Saaty, R.W. The analytic hierarchy process—What it is and how it is used. Math. Modell. 1987, 9, 161–176. [Google Scholar] [CrossRef] [Green Version]
  30. Jupp, A.R.; Beijer, S.; Narain, G.C.; Schipper, W.; Slootweg, J.C. Phosphorus recovery and recycling—Closing the loop. Chem. Soc. Rev. 2021, 50, 87–101. [Google Scholar] [CrossRef] [PubMed]
  31. Ohtake, H.; Tsuneda, S. Phosphorus Recovery and Recycling; Springer Nature Singapore Pte Ltd.: Singapore, 2018. [Google Scholar]
  32. Gantner, O.; Schipper, W.; Weigand, J.J. Spotlight 8: Technological use of phosphorus: The non-fertilizer, non-feed and non-detergent domain. In Sustainable Phosphorus Management; Scholz, R.W., Roy, A.H., Brand, F.S., Hellums, D.T., Ulrich, A.E., Eds.; Springer: Dordrecht, Holland, 2014; pp. 247–250. [Google Scholar]
  33. Tayibi, H.; Choura, M.; Lopez, F.A.; Alguacil, F.J.; Lopez-Delgado, A. Environmental impact and management of phosphogypsum. J. Environ. Manage. 2009, 90, 2377–2386. [Google Scholar] [CrossRef] [Green Version]
  34. Rychkov, V.N.; Kirillov, E.V.; Kirillov, S.V.; Semenishchev, V.S.; Bunkov, G.M.; Botalov, M.S.; Smyshlyaev, D.V.; Malyshev, A.S. Recovery of rare earth elements from phosphogypsum. J. Clean. Prod. 2018, 196, 674–681. [Google Scholar] [CrossRef]
  35. Van Dijk, K.C.; Lesschen, J.P.; Oenema, O. Phosphorus flows and balances of the European Union Member States. Sci. Total Environ. 2016, 542, 1078–1093. [Google Scholar] [CrossRef]
  36. Morse, G.; Brett, S.; Guy, J.; Lester, J. Review: Phosphorus removal and recovery technologies. Sci. Total Environ. 1998, 212, 69–81. [Google Scholar] [CrossRef]
  37. Liao, P.H.; Wong, W.T.; Lo, K.V. Release of phosphorus from sewage sludge using microwave technology. J. Environ. Eng. Sci. 2005, 4, 77–81. [Google Scholar] [CrossRef] [Green Version]
  38. Doyle, J.D.; Parsons, S.A. Struvite formation, control and recovery. Water Res. 2002, 36, 3925–3940. [Google Scholar] [CrossRef]
  39. Desmidt, E.; Ghyselbrecht, K.; Zhang, Y.; Pinoy, L.; Van der Bruggen, B.; Verstraete, W.; Rabaey, K.; Meesschaert, B. Global Phosphorus Scarcity and Full-Scale P-Recovery Techniques: A Review. Crit. Rev. Environ. Sci. Technol. 2014, 45, 336–384. [Google Scholar] [CrossRef]
  40. Wu, Y.; Luo, J.; Zhang, Q.; Aleem, M.; Fang, F.; Xue, Z.; Cao, J. Potentials and challenges of phosphorus recovery as vivianite from wastewater: A review. Chemosphere 2019, 226, 246–258. [Google Scholar] [CrossRef] [PubMed]
  41. Herzel, H.; Krüger, O.; Hermann, L.; Adam, C. Sewage sludge ash--A promising secondary phosphorus source for fertilizer production. Sci. Total Environ. 2016, 542, 1136–1143. [Google Scholar] [CrossRef] [PubMed]
  42. Egle, L.; Rechberger, H.; Krampe, J.; Zessner, M. Phosphorus recovery from municipal wastewater: An integrated comparative technological, environmental and economic assessment of P recovery technologies. Sci. Total Environ. 2016, 571, 522–542. [Google Scholar] [CrossRef] [Green Version]
  43. Krüger, O.; Grabner, A.; Adam, C. Complete Survey of German Sewage Sludge Ash. Environ. Sci. Technol. 2014, 48, 11811–11818. [Google Scholar] [CrossRef]
  44. Wang, Q.; Liao, Z.; Yao, D.; Yang, Z.; Wu, Y.; Tang, C. Phosphorus immobilization in water and sediment using iron-based materials: A review. Sci. Total Environ. 2021, 767, 144246. [Google Scholar] [CrossRef]
  45. Roy, S.; Guanglei, Q.; Zuniga-Montanez, R.; Williams, R.B.H.; Wuertz, S. Recent advances in understanding the ecophysiology of enhanced biological phosphorus removal. Curr. Opin. Biotechnol. 2021, 67, 166–174. [Google Scholar] [CrossRef]
  46. Withers, P.J.A.; van Dijk, K.C.; Neset, T.S.S.; Nesme, T.; Oenema, O.; Rubæk, G.H.; Schoumans, O.F.; Smit, B.; Pellerin, S. Stewardship to tackle global phosphorus inefficiency: The case of Europe. Ambio 2015, 44, 193–206. [Google Scholar] [CrossRef] [Green Version]
  47. Coutand, M.; Cyr, M.; Deydier, E.; Guilet, R.; Clastres, P. Characteristics of industrial and laboratory meat and bone meal ashes and their potential applications. J. Hazard. Mater. 2008, 150, 522–532. [Google Scholar] [CrossRef]
  48. Numviyimana, C.; Warchoł, J.; Ligas, B.; Chojnacka, K. Nutrients Recovery from Dairy Wastewater by Struvite Precipitation Combined with Ammonium Sorption on Clinoptilolite. Materials 2021, 14, 5822. [Google Scholar] [CrossRef] [PubMed]
  49. Cempa, M.; Olszewski, P.; Wierzchowski, K.; Kucharski, P.; Białecka, B. Ash from Poultry Manure Incineration as a Substitute for Phosphorus Fertiliser. Materials 2022, 15, 3023. [Google Scholar] [CrossRef] [PubMed]
  50. Statistical Office of the Slovak Republic: Phosphorus Export/Import, Livestock Inventory 2010–2019. Available online: http://datacube.statistics.sk (accessed on 10 January 2022).
  51. Petráš, M.; (Obvodný banský úrad Košice, District office of Central Mining Authority in Košice, Košice, Slovakia). Personal communication, 2022.
  52. Bartos, V.; Vochozka, M.; Janíková, J. Fair value in squeeze-out of large mining companies. Acta Montan. Slovaca 2021, 26, 712–731. [Google Scholar]
  53. Bodiš, D.; Rapant, S.; Khun, M.; Klukanová, A.; Lexa, J.; Mackových, D.; Marsina, K.; Pramuka, S.; Vozár, J. Geochemický Atlas Slovenskej Republiky, časť VI: Riečne Sediment/Geochemical Atlas of the Slovak Republic, Part VI: Stream Sediments; Štátny geologický ústav Dionýza Štúra: Bratislava, Slovakia, 2011. [Google Scholar]
  54. Matej-Łukowicz, K.; Wojciechowska, E.; Strycharz, J.; Szubska, M.; Kuliński, K.; Bełdowski, J.; Winogradow, A. Can Bottom Sediments Be a Prospective Fertilizing Material? A Chemical Composition Analysis for Potential Reuse in Agriculture. Materials 2021, 14, 7685. [Google Scholar] [CrossRef]
  55. SHMÚ. Monitoring of Surface Water Quality. Available online: https://www.shmu.sk/sk/?page=1&id=kvalita_povrchovych_vod (accessed on 12 January 2022).
  56. SHMÚ. Vodohospodárska Bilancia SR: Vodohospodárska Bilancia Množstva Povrchových vôd v Roku 2019/Water Management Balance of the Slovak Republic: Water Management Balance of Surface Water in 2019; Slovenský hydrometeorologický ústav: Bratislava, Slovakia, 2020. [Google Scholar]
  57. Šipikalová, H.; Škoda, P.; Demeterová, B.; Liová, S. Rok povodní 2010 a jeho miesto v hydrologických pozorovaniach na Slovensku / The year of floods 2010 and its place in hydrological observations in Slovakia. In Proceedings of the Manažment Povodí a Povodňových Rizík, Častá-Papiernička, Slovakia, 6–8 December 2011. [Google Scholar]
  58. Ľoch, B.; Bakalár, T.; Róth, B. Water quality assessment of River Hornád, Slovakia. Res. J. Min. 2017, 1, 72–79. [Google Scholar]
  59. State of the Environment Report of the Slovak Republic 2010–2019. Available online: https://www.enviroportal.sk/spravy/kat21 (accessed on 20 January 2022).
  60. Central Control and Testing Institute in Agriculture in Bratislava. Available online: https://www.uksup.sk/kalkulacky/skladovekapacity/index.php (accessed on 21 January 2022).
  61. VAS—Animal Rendering Plant. Available online: https://www.vas-ml.sk/sk/produkty/ (accessed on 18 January 2022).
  62. Legemza, J.; Miškufová, A.; Havlík, T. Environmental Technologies in the Iron and Steel Industry. Životné prostredie 2018, 52, 152–163. [Google Scholar]
  63. U.S. Steel. Demetalizovaná Oceliarenská Troska/Demetallized Steelmaking Slag. Available online: https://www.usske.sk/sk/produkty/vedlajsie-produkty/demetalizovana-oceliarenska-troska (accessed on 25 January 2022).
  64. Sapek, B. Akumulacja i uwalnianie fosforu w glebach—źródła, procesy. Woda-Środowisko-Obszary Wiejskie 2014, 14, 77–100. [Google Scholar]
  65. Burkowicz, A.; Galos, K.A.; Guzik, K.; Kamyk, J.; Kot-Niewiadomska, A.; Lewicka, E.; Smakowski, T.; Szlugaj, J. Minerals Yearbook of Poland 2013; Polish Geological Institute—National Research Institute: Warsaw, Poland, 2013.
  66. Sustainable Management of Phosphorus in the Baltic Region (InPhos). Available online: www.min-pan.krakow.pl/projekty/en/2019/07/17/english-zrownowazone-zarzadzanie-fosforem-w-regionie-baltyckim/ (accessed on 11 June 2022).
  67. Optimising Bio-Based Fertilisers in Agriculture—Providing a Knowledge Basis for New Policies (LEX4BIO). Available online: www.lex4bio.eu (accessed on 11 June 2022).
  68. Market Ready Technologies for P-Recovery from Municipal Wastewater (PhosForce). Available online: www.min-pan.krakow.pl/projekty/en/2019/07/17/technologia-odzysku-fosforu-ze-sciekow-komunalnych/ (accessed on 11 June 2022).
  69. Towards Circular Economy in Wastewater Sector: Knowledge Transfer and Identification of the Recovery Potential for Phosphorus in Poland (CEPhosPOL). Available online: www.min-pan.krakow.pl/projekty/en/2019/07/16/program-stypendialny-im-mieczyslawa-bekkera/ (accessed on 11 June 2022).
Figure 1. Import of P by countries [50].
Sustainability 14 10374 g001
Figure 2. Export of P by countries [50].
Sustainability 14 10374 g002
Figure 3. Map of P [mg·kg−1] distribution in river sediments. Publicly available from http://apl.geology.sk/atlasrs/ (accessed on 10 January 2022).
Sustainability 14 10374 g003
Figure 4. Progress of P content in sub-basins during last 11 years [55].
Sustainability 14 10374 g004
Figure 5. Graphical representation of Hornád River Basin.
Sustainability 14 10374 g005
Figure 6. The progress of P content in the Hornád River during 1993–2016 [55].
Sustainability 14 10374 g006
Figure 7. Trend of P released (treated and untreated) into watercourses in Slovakia [55].
Sustainability 14 10374 g007
Figure 8. Sludge produced in municipal WWTPs in Slovakia [59].
Sustainability 14 10374 g008
Figure 9. The amount of cattle in total, male, female and the amount of manure and urine produced by the cattle [50].
Sustainability 14 10374 g009
Figure 10. Graphical representation of the SWOT analysis.
Sustainability 14 10374 g010
Table 1. Evaluation of factors [28,29].
ValueExplanation
1Equivalence of the factors i and j
3Slight preference of factor i over j
5Strong preference of factor i over j
7High preference of factor i over j
9Absolute preference of factor i over j
Table 2. Allocation of points [28,29].
PointsCriteria
1fits significantly below average
2fits below average
3fits at an average
4fits above average
5fits significantly above average
Table 3. P import to Slovakia in 2010–2019 [50].
Year2010201120122013201420152016201720182019
Quantity [kg]17010023743,447.521229251353131213,91111
Trade value [1000USD]4.732.696.12294.446.3337.3318.319.1234.570.92
Table 4. P export to Slovakia in 2010–2019 [50].
Year2010201120122013201420152016201720182019
Quantity [kg]65,212.50003780000000
Trade value [1000USD]175.64000.05000000
Table 5. Average annual flows [m3.s−1] of watercourses in different periods [57].
RiverStation1961–20001961–20102001–20092001–2010
MoravaMoravský Ján10610699106
DunajBratislava2061206420742076
VáhŠaľa141142135144
NitraNitrianska Streda14.614.412.413.6
HronBrehy45.945.137.542
IpeľHoliša2.882.842.152.68
SlanáLenartovce13.813.61112.9
HornádŽdaňa28.429.228.332.6
BodvaNižný Medzev0.760.760.610.76
BodrogStreda nad Bodrogom111112111118
PopradChmelnica14.815.115.616.6
Table 6. Estimated amount of available P compounds in Slovakia (calculated by the authors based on data available from [50,55,56,57,59,60,61,62,63]).
SourceEstimated Amount of Source [t.year−1]Estimated Amount of Available P Compounds [t.year−1]
surface water-14,933
treated wastewater-285
sewage sludge54,58349,125
sewage sludge ash00
urine1,446,019433,806
manure4,065,3291,626,132
slaughter waste2400456
steelmaking slag3,053,9044214
Table 7. Quantification of strengths.
Factor/InteractionS1S2S3S4S5SiRiαi
S111/51/31/51/30.000.340.05
S251331/315.001.720.27
S331/311/51/50.040.530.08
S451/3311/31.671.110.17
S533531135.002.670.42
SUM 6.361.00
Table 8. Quantification of weaknesses.
Factor/InteractionW1W2W3W4W5W6SiRiαi
W11751/353175.002.370.33
W21/71335532.141.780.25
W31/51/315355.001.310.18
W431/31/511/71/50.010.420.06
W51/51/51/37130.280.810.11
W61/31/51/551/310.020.530.07
SUM 7.221.00
Table 9. Quantification of opportunities.
Factor/InteractionO1O2O3O4O5O6SiRiαi
O115579711025.004.720.52
O21/51353327.001.730.19
O31/51/313533.001.200.13
O41/71/51/311/31/30.000.320.03
O51/91/31/5311/30.010.440.05
O61/71/31/33310.140.720.08
SUM 9.131.00
Table 10. Quantification of threats.
Factor/InteractionT1T2T3T4T5T6SiRiαi
T11755756125.004.280.49
T21/711/51/51/31/50.000.270.03
T31/5511/31/51/30.020.530.06
T41/55311/31/30.330.830.10
T51/73531319.291.640.19
T61/55331/313.001.200.14
SUM 8.751.00
Table 11. P management SWOT analysis.
StrengthsWeightPointsSumWeaknessesWeightPointsSum
importers portfolio0.0550.27the absence of P deposits0.3351.64
favorable estimated potential of available P compounds from manure0.2730.81technological complexity of P recovery from sources0.2540.99
production of steelmaking slag as a source of Ps0.0840.33declining trends in cattle breeding and the amount of manure and urine0.1830.54
favorable estimated potential of available P compounds from urine0.1730.52the absence of the P recovery from sewage sludge ash0.0650.29
multiple sources for P recovery0.4241.68low estimated potential of available P compounds from sewage sludge0.1130.34
low estimated potential of available P compounds from steelmaking slag0.0740.29
SUM 3.61SUM 4.09
OpportunitiesWeightPointsSumThreatsWeightPointsSum
the extraction of Gočaltovo P deposit0.5252.58lack of governmental support0.4952.44
P recovery from manure0.1930.57instability of steel production0.0340.12
P recovery from urine0.1330.39the reduction of manure production due to the reduction of cattle breeding0.0630.18
P recovery from river sediments0.0330.10the reduction of slaughter waste production due to the reduction of animal waste production0.1030.29
P recovery from surface water0.0520.10significant dependence on P import0.1940.75
P recovery from slaughter waste0.0830.24low number of potential P deposits0.1440.55
SUM 3.98SUM 4.33
Publisher’s Note: MDPI stays neutral with regard to jurisdictional claims in published maps and institutional affiliations.

