Article

Pollution Characteristics and Risk Assessments of Mercury in Jiutai, a County Region Thriving on Coal Mining in Northeastern China

1
School of Environment, Northeast Normal University, Changchun 130117, China
2
State Environmental Protection Key Laboratory of Wetland Ecology and Vegetation Restoration, Changchun 130117, China
3
Institute of Ice and Snow Economy, Jilin International Studies University, Changchun 130117, China
4
School of English, Beijing Foreign Studies University, Beijing 100089, China
5
Comparative Literature and Cross-Culture Discipline, Institute of International Language and Culture, Jilin International Studies University, Changchun 130117, China
6
College of Foreign Languages, Yanbian University, Yanji 133002, China
*
Authors to whom correspondence should be addressed.
Y.X. and G.Z. are co-first authors of the article.
Sustainability 2022, 14(16), 10366; https://doi.org/10.3390/su141610366
Submission received: 6 July 2022 / Revised: 9 August 2022 / Accepted: 10 August 2022 / Published: 19 August 2022
(This article belongs to the Special Issue Environmental and Health Risk Assessment of Heavy Metal Pollution)

Abstract

:
Among human activities, coal mining and the combustion of fossil fuels are important sources of mercury in the environment. Research on mercury pollution in coal mining areas and surrounding cities, especially in densely populated areas, has always been at the forefront of this research field. In order to study the characteristics of environmental mercury pollution in small and medium-sized coal mining areas and surrounding towns in China, this study selected the main urban area of Jiutai District, a typical mining town in the Changchun City circle industrial base in northeast China, as the research object. In this study, the geo-accumulation index (Igeo) was used to study the soil mercury pollution degree in Jiutai District, the potential ecological risk index (Er) was used to evaluate the potential ecological risk of soil mercury in the study area, and the human exposure risk assessment model was used to evaluate the non-carcinogenic risk of soil mercury to the human body. The results showed that 32% of the soil samples in the study area had a higher mercury content than the regional soil background value of Jilin Province (0.04 mg·kg−1). According to the Igeo, 19% of the sample sites in the study area were polluted (index > 0). In general, the soil mercury pollution level in Jiutai District is low, and the polluted areas are mainly concentrated in the northeast of the study area. The Er of the soil mercury in the study area ranged from 7.2 to 522.0, with 32% of the sampling sites having a moderate or above potential ecological risk (Er > 40), and the potential ecological risk level of the soil mercury was higher in the northeast of the study area. The non-carcinogenic risk index (HQ) and total non-carcinogenic risk value (HI) of the soil mercury were all far less than 1, indicating that soil mercury pollution in the study area did not harm the health of local adults. The oral ingestion of soil mercury is the main form of human exposure to mercury.

1. Introduction

Mercury (Hg) is a global pollutant [1], with the characteristics of persistent pollution, concealment, easy migration, high bioenrichment, and high biotoxicity [2]. Mercury is unevenly distributed in the natural environment. Its distribution, transformation, and migration are closely related to the geological environment, soil parent rocks, vegetation, and human activities [3]. Coal mines and their surrounding environment frequently have high background mercury levels, and mercury concentrations in regional soil rise as coal mining output increases [4,5]. The average mercury content of Chinese coal is 0.20 mg·kg1 [6], and the average mercury content of the coal in northeast China is 0.158 mg·kg−1, both higher than the worldwide average (0.10 mg·kg−1) [7,8]. In the process of coal mining, large-scale excavation and stripping decompose the sulfide in coal when it meets groundwater or is exposed to air, resulting in a large amount of acidic mine wastewater with strong leachability. About 83.8 wt.% mercury is discharged from coal into the environment through acidic wastewater [9]. The accumulative amount of coal gangue is increasing significantly due to coal mining activities, becoming one of the largest industrial residues [10]. We found that Jilin Province produced 2349.3 million tons of standard coal in 2020, among which the output of coal gangue accounted for about 10–15% of the coal output [11]. Most of the coal gangue mined in Jiutai District in the early stages of the industry was stored in the open air, and now most of it is successively used in the production of coal gangue bricks. In the process of the spontaneous combustion and weathering of coal gangue, mercury can be continuously enriched in the surrounding soil. Research shows that the content of mercury in the soil around coal gangue after spontaneous combustion and weathering can reach 1.980 mg·kg−1, and the enrichment coefficient is up to 22 times higher than the concentration of mercury in the background soil [12,13]. After spontaneous combustion and leaching, the mercury in coal gangue particles is released into the surrounding environment; migrates, transforms, and accumulates in the ecosystem; and finally enters into the human body through various routes, affecting human health [14]. The soot, dust, and waste water generated during coal processing cause the mercury in the coal to enter the environment, and the combustion of coal-preparation byproducts may cause secondary emissions, resulting in regional environmental mercury pollution [15].
Towns that prospered from coal mining accumulated mercury in the soil as the coal was mined [5]. With the development of towns, the number and density of urban populations have gradually increased, and this has put urban populations at increased risk of exposure to mercury pollution [16] that directly or indirectly affects the local residents’ welfare, natural resources storage, economic development, cultural communication, tourism, etc. Such typical environmental pollution has always been a concern of Westerners of all walks of life. Taking London at the end of the 18th and beginning of the 19th centuries as an example, we can see that the coal pollution issue was of great concern, as made clear by environmentalists, ecologists, governors, administrators, and even literary figures such as the English romantic poets William Blake and William Wordsworth. The poet John Keats was particularly concerned by this issue, since members of his family developed tuberculosis due in large part to the frequent burning of coal.
Coal mines are usually characterized by a long mining cycle, a wide development range, and a strong environmental impact. In addition, a large number of coal-related industries gather around coal mining areas, which leads to more serious regional mercury pollution than in ordinary towns. Therefore, it is necessary to understand the current situation regarding the level of mercury accumulation in the soil environments of coal mining towns. According to previous research results, the soil mercury in coal mining towns mainly comes from coal mining and the coal industry [17]. However, with the comprehensive development of cities and towns, the sources of soil mercury pollution have increased, and it is believed to mainly originate from the following urban sources [18,19,20,21]:
  • Atmospheric mercury from fossil fuel combustion eventually returns to the soil through wet and dry deposition—e.g., coal-fired thermal power plants and coal-fired power for industrial mercury release, oil smelting, and automobile emissions.
  • The raw materials of non-ferrous metal smelting and the cement industry contain mercury, which is activated in the production process so that it migrates and transforms, causing mercury pollution to the air, water, and soil.
  • The production and use of items containing mercury such as fluorescent lamps, dental amalgams, thermometers, pressure gauges, and electronic products.
  • Emissions caused by waste treatment and incineration processes: various waste treatment facilities and landfills also produce mercury pollution.
Although much attention has been paid to the risk of heavy metal pollution in coal mining areas, less is currently known regarding the level and spatial distribution of soil mercury pollution in urban areas after coal mining in China [22,23]. This information is critical, considering the continuous exposure of urban residents to the accumulated mercury in urban soil [24]. Such exposure may take the form of oral ingestion, inhalation, or dermal contact. At present, Chinese researchers have investigated the mercury content levels in the soil of Huainan [25], Qianxi [26], and Lianyuan [27], as well as some of the counties in Shanxi Province [28] and other cities in China. On an international scale, the status of soil mercury accumulation in the Rohini OCP NK Area of India [17], Pszczyna County Poland [29], and Ostrava in the Czech Republic have [30] been examined. However, a comprehensive risk assessment of the mercury in the soils of coal mining cities at the county scale in China is still lacking [31]. Therefore, this study focuses on the mercury content level in urban soil and a risk assessment of mercury’s negative impact on urban residents’ health after the depletion of coal resources in coal mining cities.
The main objective of this study was to assess the risks of heavy metal mercury pollution in the soil of Jiutai District, a town in northeastern China that has prospered because of coal mining. It is believed that long-term coal mining causes soil mercury pollution, and, despite the adjustments to the energy structures that have contributed to the formation of mercury pollution, it will remain in the soil for a long period of time, possibly impacting human living environments [32]. Therefore, we chose to discuss the nature of such impacts in this study. Surface soil samples were collected in Jiutai District, and their heavy metal mercury and atmospheric mercury concentrations were determined. The ecological risks of the heavy metal mercury in the soil were assessed by calculating the geo-accumulation index (Igeo) [33] and the potential ecological risk index (Er) [34]. The associated health risks were then assessed by determining the levels of metal exposure through oral ingestion, inhalation, and dermal contact and then calculating the non-carcinogenic risk index (HQ) [35] and the total non-carcinogenic risk value (HI) [36]. The results of this study will contribute to a more comprehensive understanding of the risks arising from human exposure to heavy metal mercury in Chinese coal mining towns.

2. Materials and Methods

2.1. Study Area

The study area of Jiutai District is located in the northeast of China and the central part of Jilin Province. It is under the jurisdiction of Changchun, lying 47 km to the northeast of the main city of Changchun and located between E125°25′ and 126°30′ and N43°51′ and 44°32′. Jiutai District covers an area of 3375.27 km2, and its main urban area is 41 km2. As of 2021, Jiutai District had a permanent population of 570,000, with a population density of about 198 people/km2 [37,38]. Jiutai District has a mid-temperate continental monsoon climate, with an annual average temperature of 4.7 °C and annual average precipitation of 658.5 mm. The dominant wind direction in the city is southwest [19]. The green space coverage area of the whole district is 610.15 hm2, and the green coverage rate is 20.93% [39].
After the residents of Yingcheng discovered coal mines in 1868, Jiutai gradually developed from an ordinary town into a typical mining town, and it has now become one of the important mineral bases of coal resources in Jilin Province [40]. The coal mining industry has long supported the economic development of the city and affected its industrial layout. Jiutai District’s main urban area is the center of the administration, economy, culture, and transportation for the coal mining area. There are large coal processing enterprises, and the mining and extraction points are mainly distributed in the mining area and workers’ residential area. To develop the coal industry in the early years after its founding in China, there was a rapid rise in coal mining in Jiutai District, which became home to several key state-owned coal mines; this greatly promoted the development of Jiutai District as well as the formation of the industrial landscape. The city’s coal mines were rich in this early period, and Jiutai District could not only meet the demands of the industry in the local area, but could also supply a large amount of coal to Changchun and Jilin Province, taking up a decisive position in China’s coal mining industry. Then, with the exhaustion of the coal resources in Yingcheng, the main pillar industry in Jiutai District gradually changed from the coal industry to the manufacturing industry. According to the Jiutai District Mineral Resources Plan (2016–2020), Jiutai District still accounts for 78% of Changchun’s coal production capacity.
At present, Jiutai District is a sub-central city with good-quality living infrastructure. It is a comprehensive industrial city with leading industries such as food processing, building materials, machinery, chemicals, and coal. The northern part of Jiutai District belongs to the old city, with large residential areas and farmland protected by the state, mainly for commercial and residential functions. The southern part of the city belongs to the new urban area, which is dominated by residential buildings, commercial services, administrative offices, culture, and entertainment, with a small number of industrial and logistics parks. In the eastern part of the city, the former Yingcheng mining area has been optimized to form the present Jiutai industrial concentration area, but the problems of soil pollution and geological environment left over from the historical mines have not been completely solved. There are a few industrial parks and residential areas in the west.

2.2. Sampling and Analysis Processes

According to the spatial pattern of Jiutai District, the main urban area was selected as the research scope, since it includes both built-up areas and suburban areas. These are composed of the early development zones and new urban areas of Jiutai District, which comprehensively reflect the basic characteristics of the typical urban core area and peripheral expansion areas. A total of 100 sampling units (1 km × 1 km) were selected by the random grid distribution method. Sampling points were randomly distributed in different grids. Finally, the locations of sampling points were plotted according to the latitude and longitude of each sampling point. In this study, we collected data from 100 sample points, and the location of each sample point is depicted in Figure 1. Based on the urban regional planning of Jiutai District, and for the convenience of subsequent research on the relationship between wind direction and urban soil mercury concentration, taking the intersection of Xiqiao Park and Nanshan Park and Changtong Road as the center, the main urban area of Jiutai District was divided into four regions: southeast, northeast, southwest, and northwest.
On meteorologically typical days, each sample was collected using the five-point mixed sampling method. Five equal-volume samples were collected in the range of 5 m × 5 m and uniformly mixed into one sample. In addition, all of the samples were collected from the 0~10 cm surface soil layers, and any plants, dead branches, fallen leaves, rocks, sand grains, and so on were removed. The samples were sealed and stored in polyethylene bags, with each sample weighing approximately 500 g. For the soil samples obtained in areas without hardened sampling points, the dust removed within a certain area around the sampling points was taken as the test sample. Following the completion of the sample collection process, the samples were stored in a cool place until the analysis was completed.
The total atmospheric mercury content was monitored by a Zeeman LUMEX RA-915+ effect mercury analyzer. All of the sampling points were divided into two layers in the vertical direction of the air within a range of 0 cm and 100 cm, and an in-vehicle mercury meter (Zeeman LUMEX RA-915+) was used for the monitoring process according to the sample point sequence number. The instrument was self-calibrated before the measurements, and the data were obtained every 10 s. A total of 120 s–180 s were measured, and 12–18 monitoring data points were obtained at each sample point, with a data accuracy of 1 ng·m−3. Blank samples were taken from urban clean and open green space, and corresponding background values were measured as a reference. Air-dried soil samples of 50~200 mg were weighed out, and the total mercury content of the soil was determined in the one-way optical path sample pool of the LUMEX RA-915+ mercury meter combined with the UMA solid sample test unit. The air transport speed of the instrument was 4 L·min−1. The minimum detection limit of solid samples determined by the instrument was 0.5 ng·g−1. For each soil sample, 4–7 parallel determinations were carried out to eliminate abnormal data. In the experimental process, GBW07424 standard material of the soil composition in the Songnen Plain (GSS-10) was used to construct standard curves.

2.3. Ecological Risk Assessment Processes

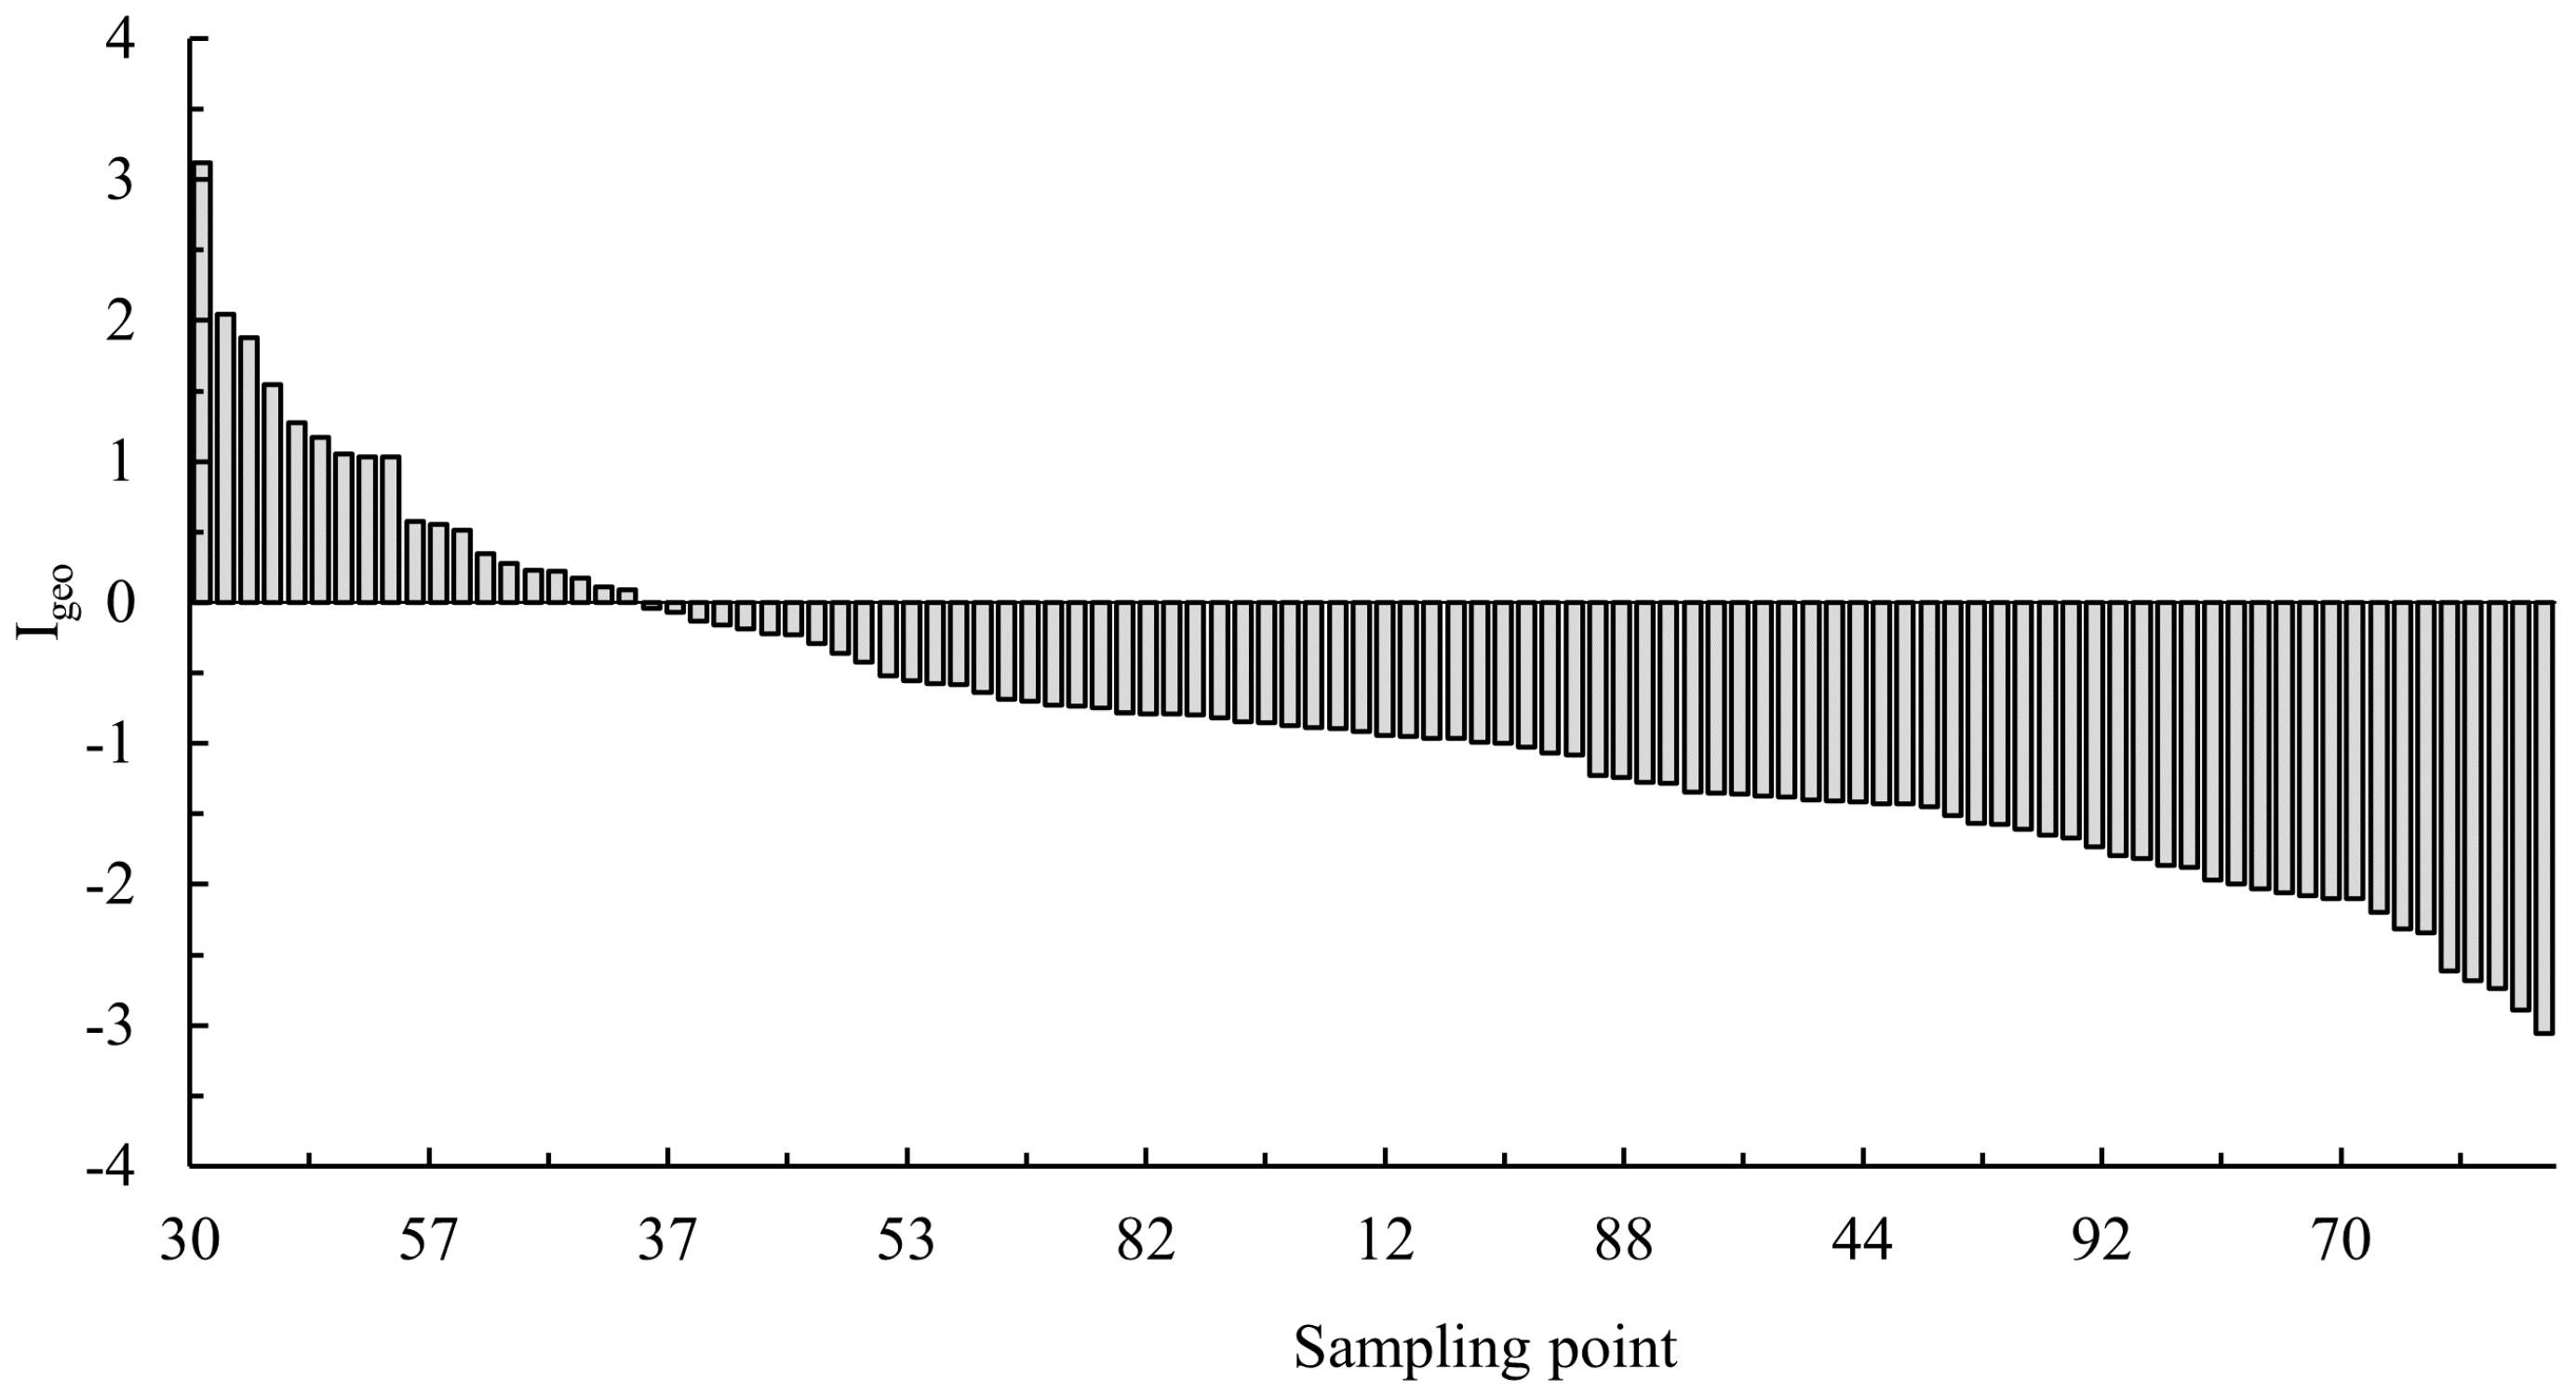
2.3.1. Geo-Accumulation Index (Igeo)

The Igeo is used to assess the contamination levels of a specific metal in soil by evaluating the metal enrichment above the baseline or background values. The Igeo was calculated according to Equation (1), as follows [41,42]:
I g e o = l o g 2 C i K × B i
where Igeo represents the geo-accumulation index; Ci is the measured concentration of mercury (mg·kg−1); K represents a modified index (typically 1.5) to account for variations in background values that may be due to differences in rock characteristics at different locations; and Bi denotes the municipal soil background value (0.040 mg·kg1). The classification of the Igeo is shown in Table 1.

2.3.2. Potential Ecological Risk Index (Er)

The Er was used to evaluate the potential degree of ecological harm posed by the mercury in the soil and atmosphere. The Er was calculated according to Equation (2), as follows [43,44]:
Er =   Tr · C i C 0
where Er is the potential ecological harm coefficient of the mercury; Tr represents the toxicity coefficient of the mercury, which was set at 40; Ci is the measured value of mercury content; and C0 is the background value of Hg, which was set at 0.040 mg·kg−1. The relationship between the potential ecological risk coefficient and hazard degree of Er was graded as shown in Table 2.

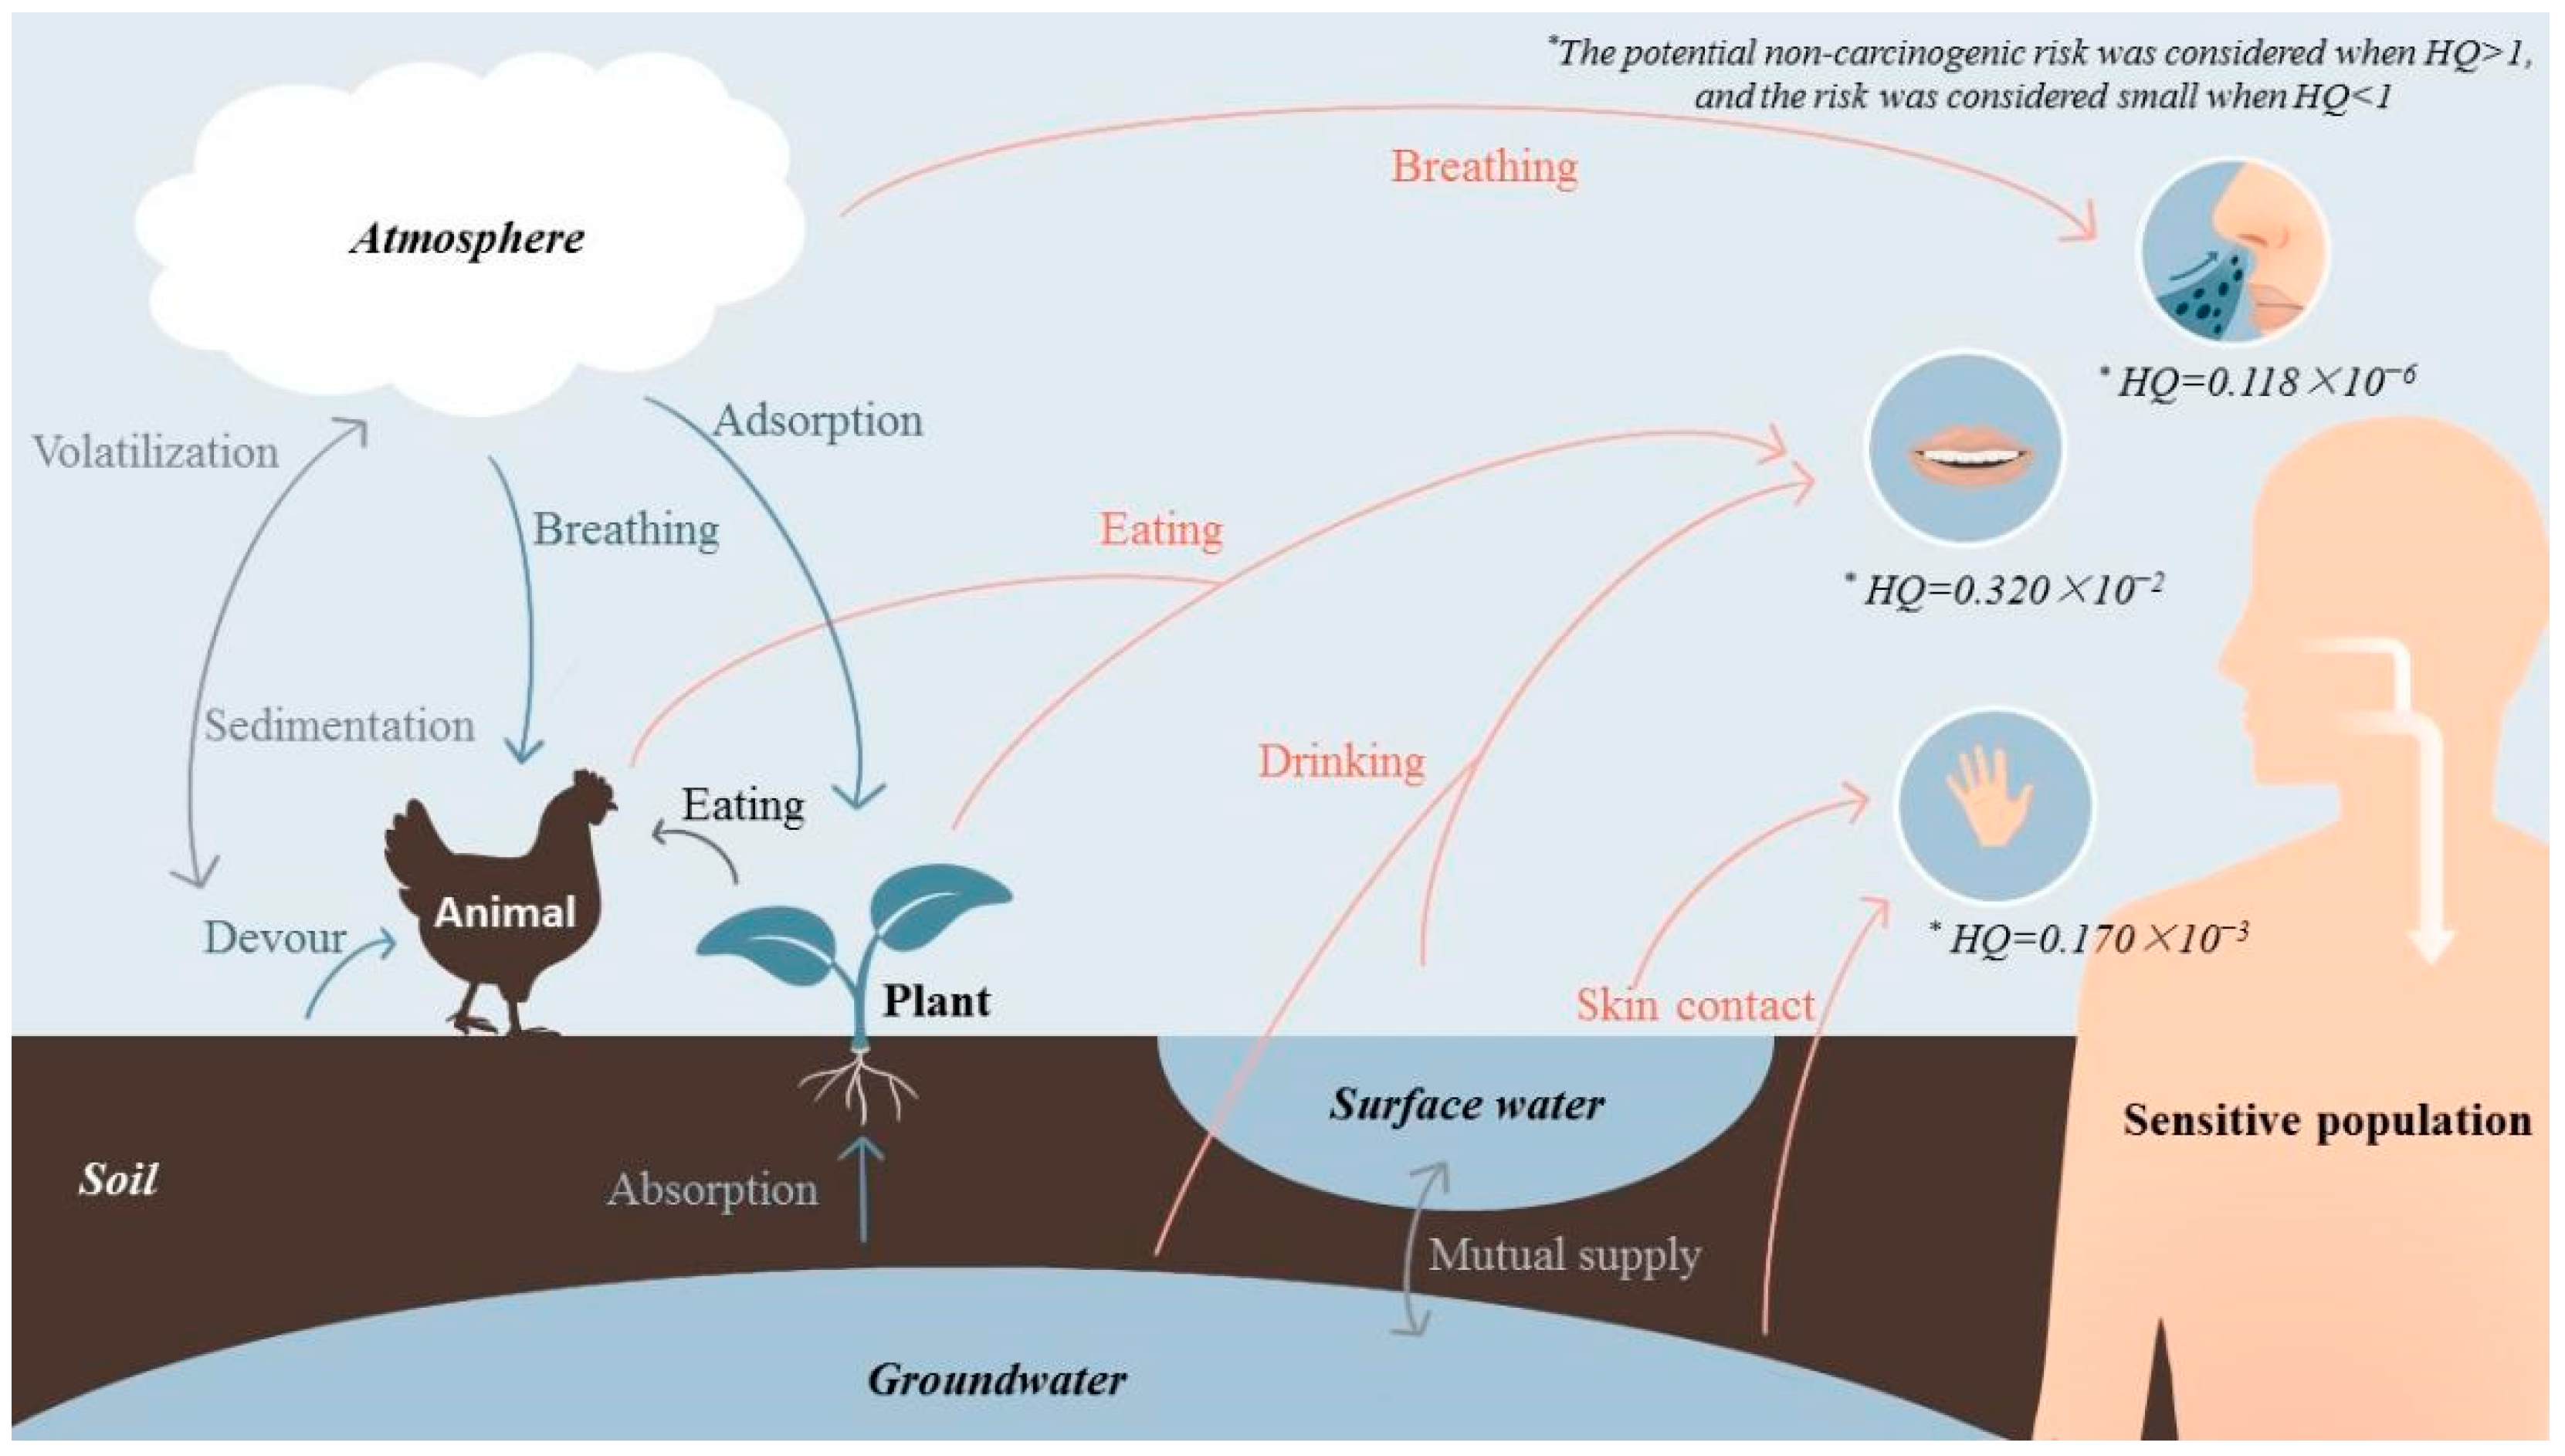
2.4. Health Risk Assessments

2.4.1. Exposure Assessments

This study referred to the environmental health risk assessment method recommended by the United States Environment Program (USEPA) for soil mercury health risk assessment [45]. Soil mercury mainly enters the human body through oral ingestion, inhalation, and dermal contact [46]. The human exposure risk assessment model was used to calculate the long-term daily exposure dose of non-carcinogenic risk for the above three exposure pathways. The formulas are as follows [47,48]:
A D I i n h = C × I R i n h × E F × E D B W × A T × P E F
A D I o r a l = C × I R o r a l × E F × E D B W × A T × 10 6
A D I d e r m a l = C × S A × S L × A B S × E F × E D B W × A T × 10 6
In Equations (3)–(5), ADIinh, ADIoral, and ADIdermal represent the average daily exposure dose (mg·(kg·d)−1) of inhalation, oral intake, and skin contact, respectively; C represents the measured concentration of mercury in soil (mg·kg−1); IRinh represents respiratory intake (m3·d−1), with a reference value of 20 m3·d−1; EF represents exposure frequency (d·a−1), with a reference value of 350 d·a−1; ED stands for exposure years (a), with a reference value of 25 a; BW represents body weight (kg), with a reference value of 55.9 kg; AT represents exposure period (d), with a reference value of 365 × ED (d); PEF stands for particulate matter emission factor (m3·kg−1), with a reference value of 1.32 × 10⁹ m3·kg−1; IRoral represents oral intake (mg·d−1), with a reference value of 114 mg·d−1; SA represents the exposed skin area (cm2·d−1), with a reference value of 5000 cm2·d−1; SL is skin adhesion (mg·(cm2)−1), with a reference value of 1 mg·(cm 2)−1; and ABS stands for skin absorption factor, with a reference value of 0.001.

2.4.2. Non-Carcinogenic Risk Assessments

Mercury is a non-carcinogenic heavy metal, so the non-carcinogenic risk index (HQ) was used to evaluate the non-carcinogenic risk. The non-carcinogenic risk index was calculated according to Equation (6), as follows [35]:
H Q = A D I i R f D i
where ADIi is the average daily exposure dose (mg·(kg·d)−1); RfDi is the reference dose (mg·(kg·d)−1); RfDdermal = 2.4 × 10⁻⁵ mg·(kg·d)−1; RfDoral = 3.0 × 10⁻⁴ mg·(kg·d)−1; and RfDinh = 1. 07 × 10−4 mg·(kg·d)−1.
The total non-carcinogenic risk value of mercury for the different pathways is indicated by HI [36]:
H I = i n H Q
When HI or HQ > 1, there is a potential non-carcinogenic risk, and when HI or HQ < 1, the risk is considered small and can be ignored [49,50].

3. Results

3.1. Mercury Concentrations in the Environment

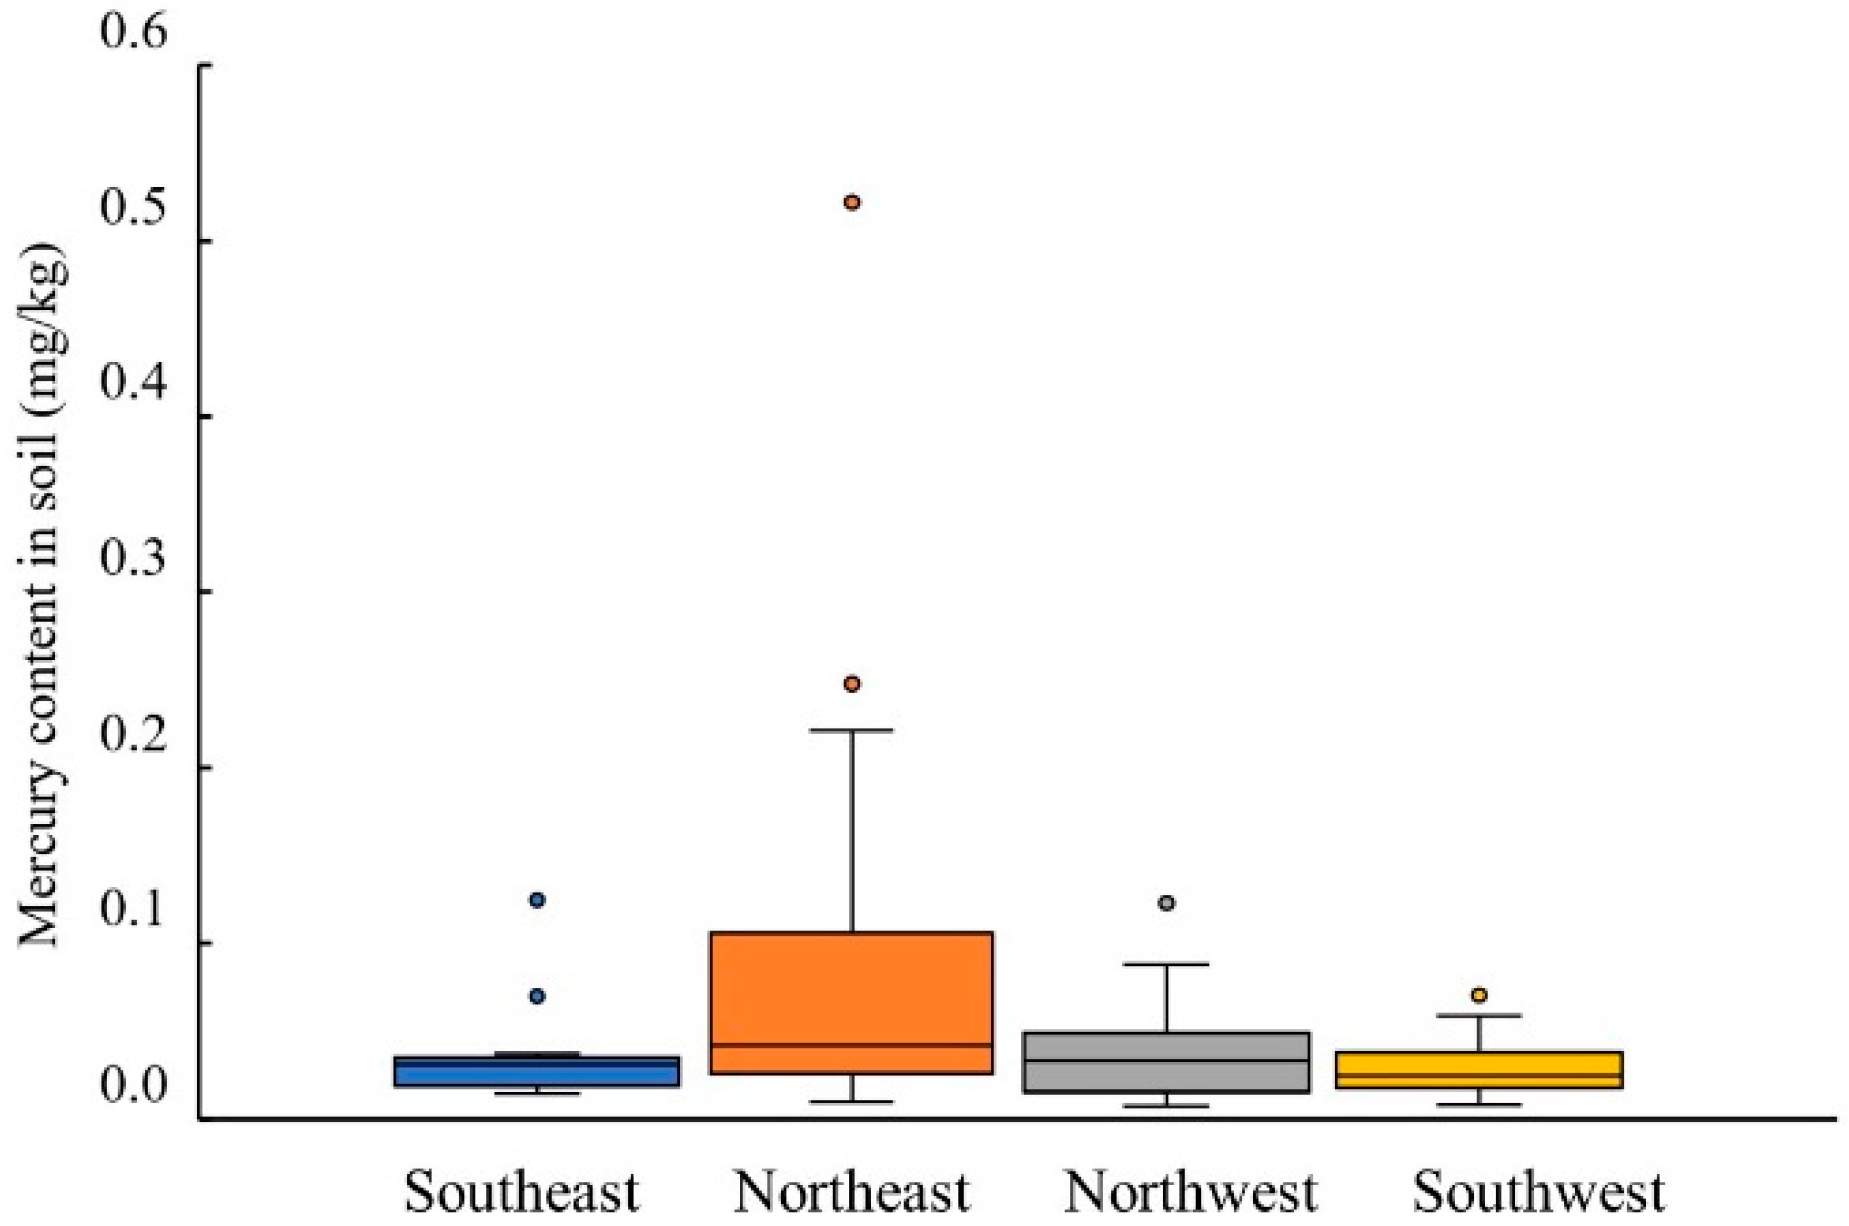
3.1.1. Mercury in Surface Soils

According to the statistics, the average mercury content in the soil samples measured in this study was 0.0484 ± 0.0633 mg·kg−1, and the concentration range was 0.00720~0.522 mg·kg−1. It can be seen that the mercury content in Jiutai District varied widely, and the mercury content levels in the four regions are shown in Table 3. Of the 100 samples, 32% presented soil mercury contents that exceeded the regional soil background value of Jilin Province (0.04 mg·kg−1), and the maximum level was 13.05 times higher than the background value. It can be seen that the soil in different regions of Jiutai District was polluted by mercury to different degrees.

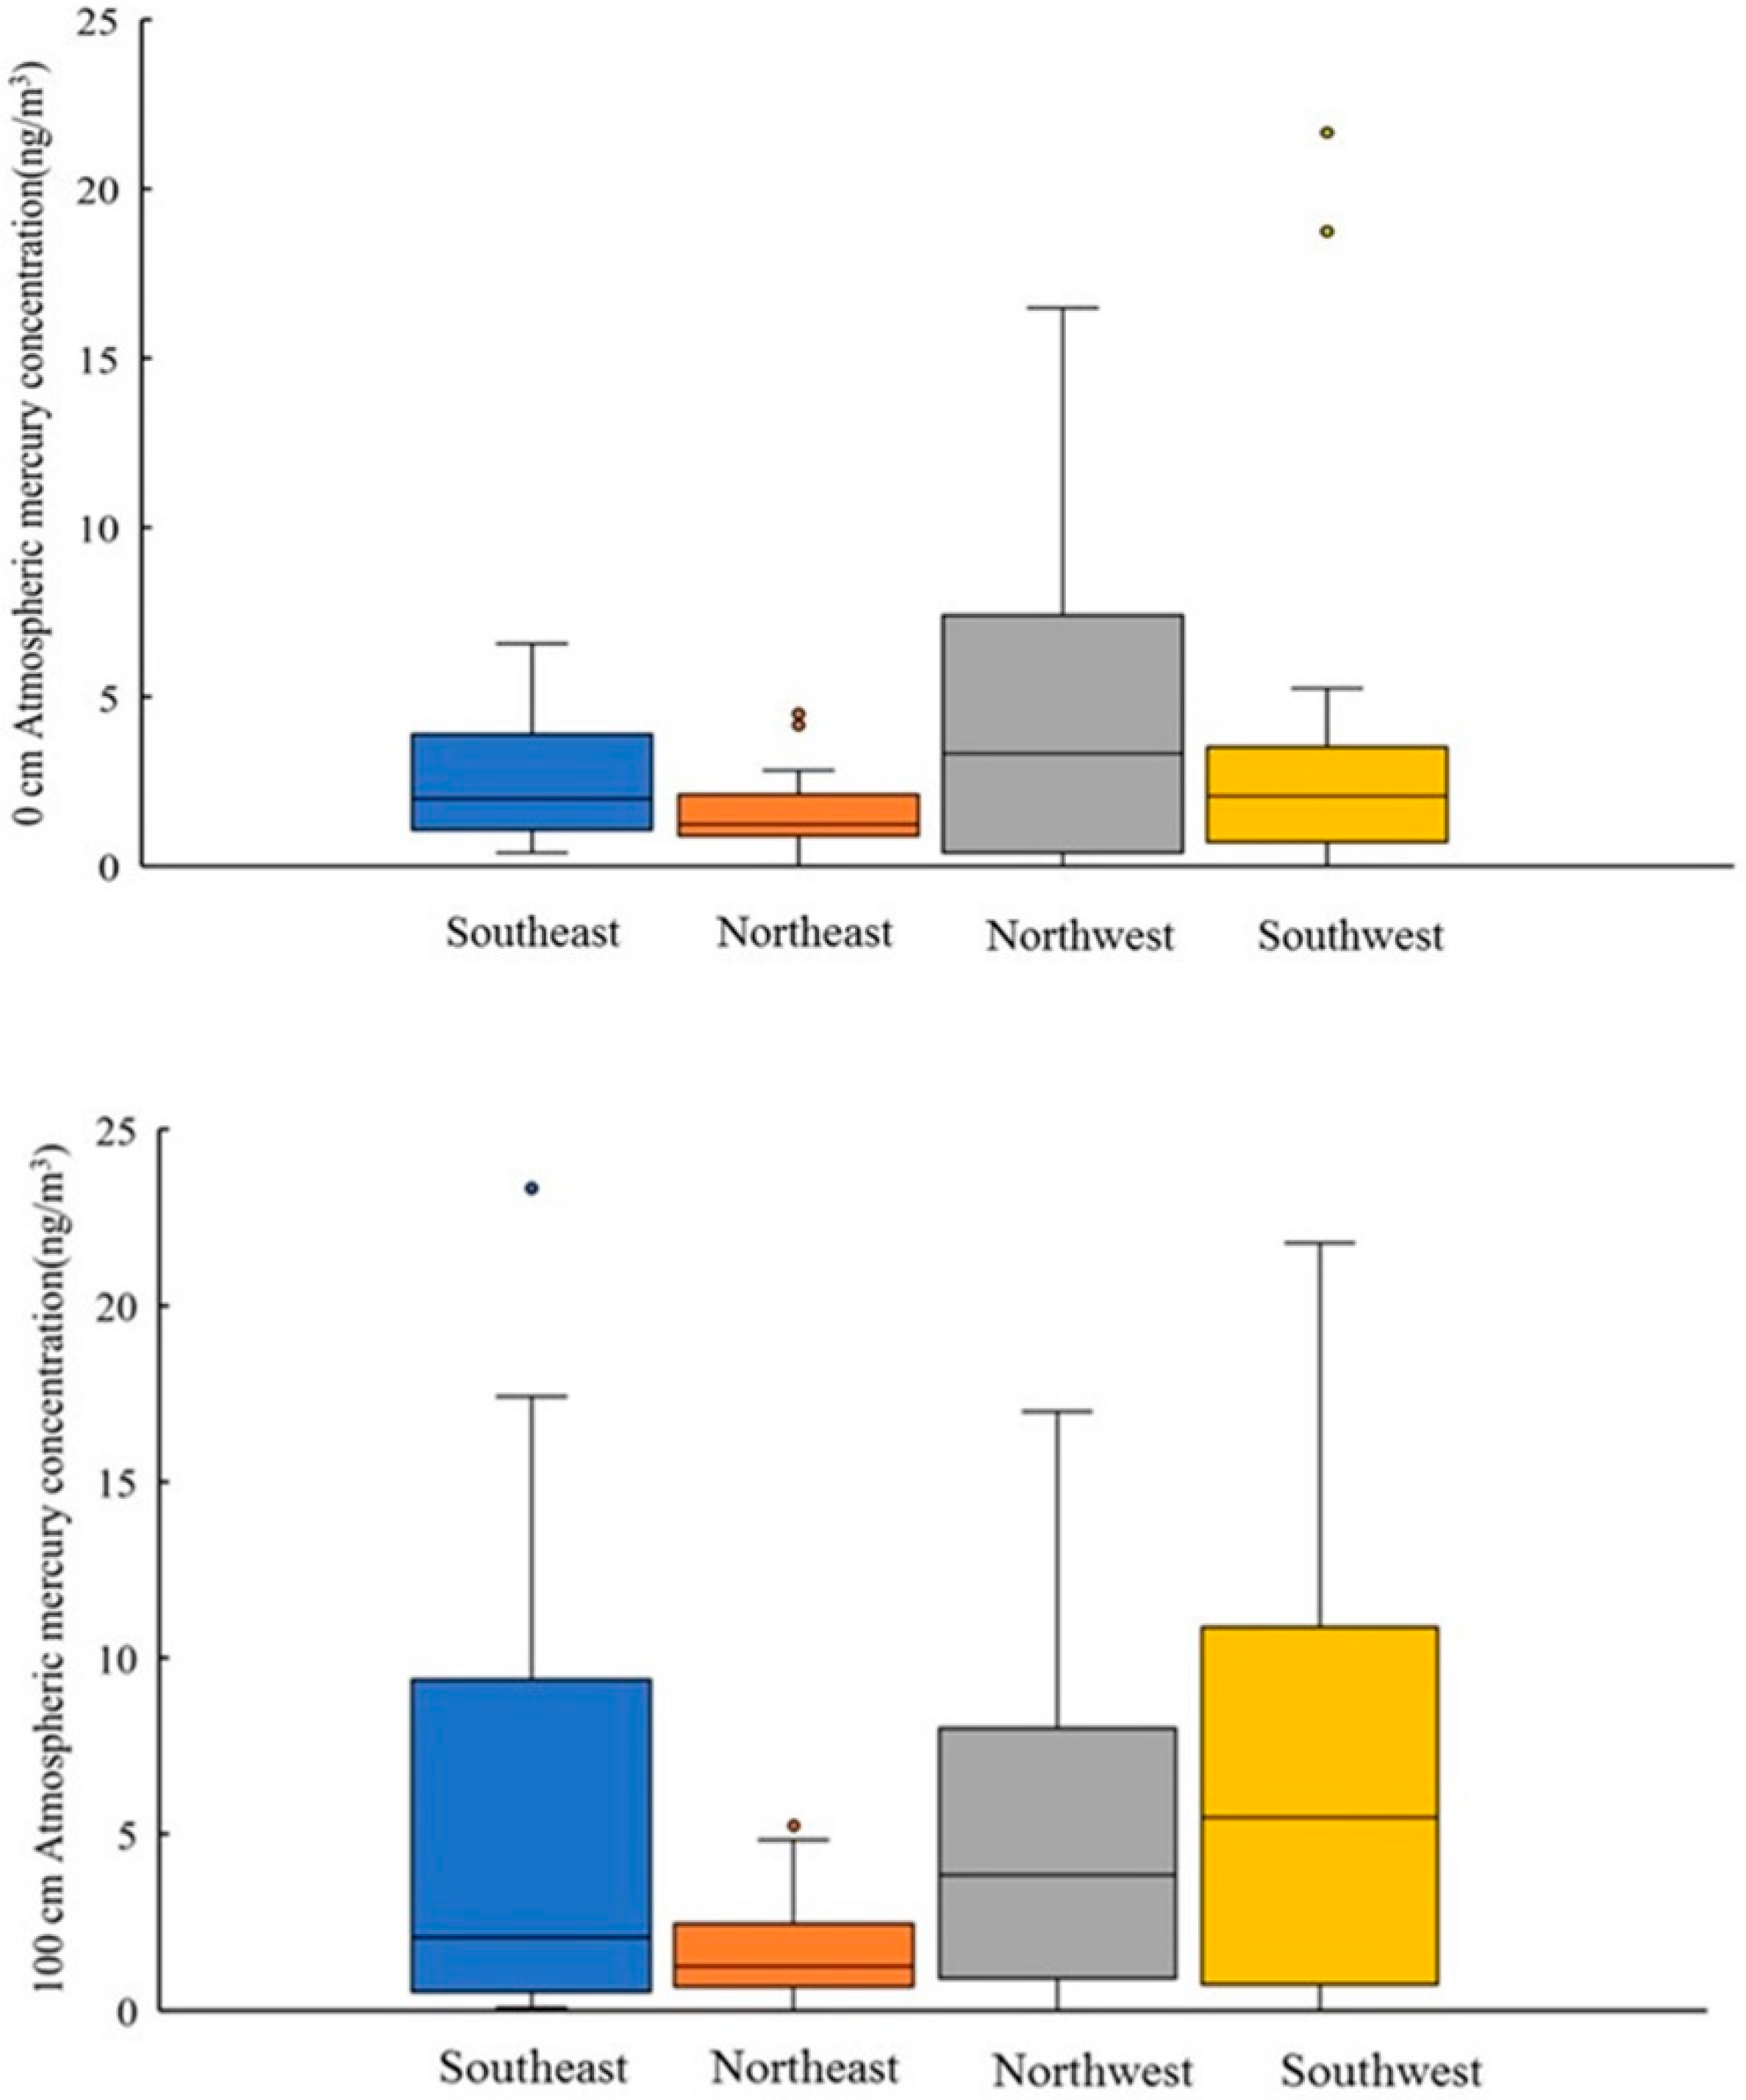
3.1.2. Atmospheric Mercury in Urban Areas

The atmospheric mercury concentration levels in the northeast, northwest, southeast, and southwest regions of Jiutai District of Changchun are shown in Figure 2. The mean atmospheric mercury contents at 0 cm and 100 cm were 3.2 ± 4.1 ng·m−3 and 4.5 ± 5.2 ng·m−3, respectively, and the concentrations ranged from 0 to 21.7 ng·m−3 and 0 to 23.3 ng·m−3, respectively. The atmospheric mercury content at 0 cm and 100 cm in blank samples was the same, with an average of 1.2 ± 1.5 ng·m−3. The results showed that 59% of the samples had a higher atmospheric mercury content at 0 cm than the blank control, and the highest mercury content was 18.1 times that of the blank control. Sixty percent of the samples had a higher atmospheric mercury content at 100 cm than the blank control, and the highest mercury content was 19.4 times that of the blank control. The atmospheric mercury content in the Jiutai District urban area varied widely. It can also be seen from Figure 2 that there were differences in the atmospheric mercury content between the different regions of the study area. The atmospheric mercury concentration at 0 cm in the northwest region was high, and that at 100 cm in the southwest region was also high.

3.2. Risk Assessment

3.2.1. Ecological Risk Assessment of Soil Mercury Pollution

Using the Igeo method as the evaluation standard, 19% of the sample sites were contaminated with mercury (index > 0). The pollution level of sample 30 was strong; that of sample 41 was medium-strong; that of samples 36, 23, 80, 22, 17, 76, and 79 was medium; that of samples 31, 57, 26, 84, 74, 96, 91, 40, 58, and 49 was slight-medium; and the other samples were judged to be non-polluted.
In general, the mercury pollution in Jiutai District was not high. According to the evaluation of the soil mercury accumulation index method, all the samples with moderate or above soil mercury pollution were concentrated in the areas near the industrial center of Jiutai District (the former Yingcheng mining area), Jiutai Railway Station, and on both sides of the main traffic circle of the city. The samples with mild soil mercury pollution were distributed near logistics parks, business centers, automobile markets, and driving schools and were mainly affected by mercury emission from traffic.
It was found that the Er of the soil mercury in the study area ranged from 7.2 to 522.0, and 32% of the samples presented medium or above potential ecological risk (Er > 40). Among these, some samples demonstrated an extremely strong potential ecological risk (Er up to 522 > 320). The possible reason for this was that the sample site was close to the industrial concentration area of Jiutai District (the former Yingcheng mining area), and early mining activities and current industrial activities have increased the soil mercury concentration, resulting in extremely strong and very strong potential ecological risk scores for the soil mercury in this area. In addition, 11% of the samples posed a strong potential ecological risk, 21% posed a medium potential ecological risk, and the rest posed a slight potential ecological risk. In general, this study found that the mercury pollution level of the soil in Jiutai District presented a slight potential ecological risk.

3.2.2. Health Risk Assessment of Soil Mercury

In terms of average HI, the regions of the town were ranked as follows: northeast (0.580 × 10⁻²) > northwest (0.260 × 10⁻²) > southeast (0.250 × 10⁻²) > southwest (0.200 × 10⁻²). The northeast region contains concentrated industrial parks, experienced frequent early coal mining activities, and is located downwind of the city, so the total health risk value is high. The Jiutai District’s new urban area is located in the southwest and is primarily made up of residential areas and low-pollution high-tech industrial parks. The environmental quality is high, the soil mercury pollution level is low, and it is located upwind of the city, so the total health risk value is low. Vehicle testing companies, driving schools, and the outer ring road of the city are distributed. In the northwest region. There is a large traffic flow and a large amount of automobile exhaust emissions, which have a significant impact on the soil mercury content, so the total health risk value is also high. In general, the total non-carcinogenic health risk value in Jiutai District was determined to be far less than 1. Currently, the urban soil mercury does not harm the health of local adults.
In this study, by referring to the environmental health risk assessment method recommended by the USEPA for soil mercury health risk assessment [45], we determined the non-carcinogenic risk posed by the three main soil mercury exposure pathways as follows: oral ingestion (average 0.320 × 10⁻²) > dermal contact (average 0.170 × 10⁻³) >> inhalation (average 0.118 × 10⁻⁶). Therefore, oral ingestion through food is the main route of soil mercury exposure, and the contribution of respiratory exposure is very small compared with exposure through ingestion.

4. Discussion

4.1. Mercury Distribution in Urban Environment

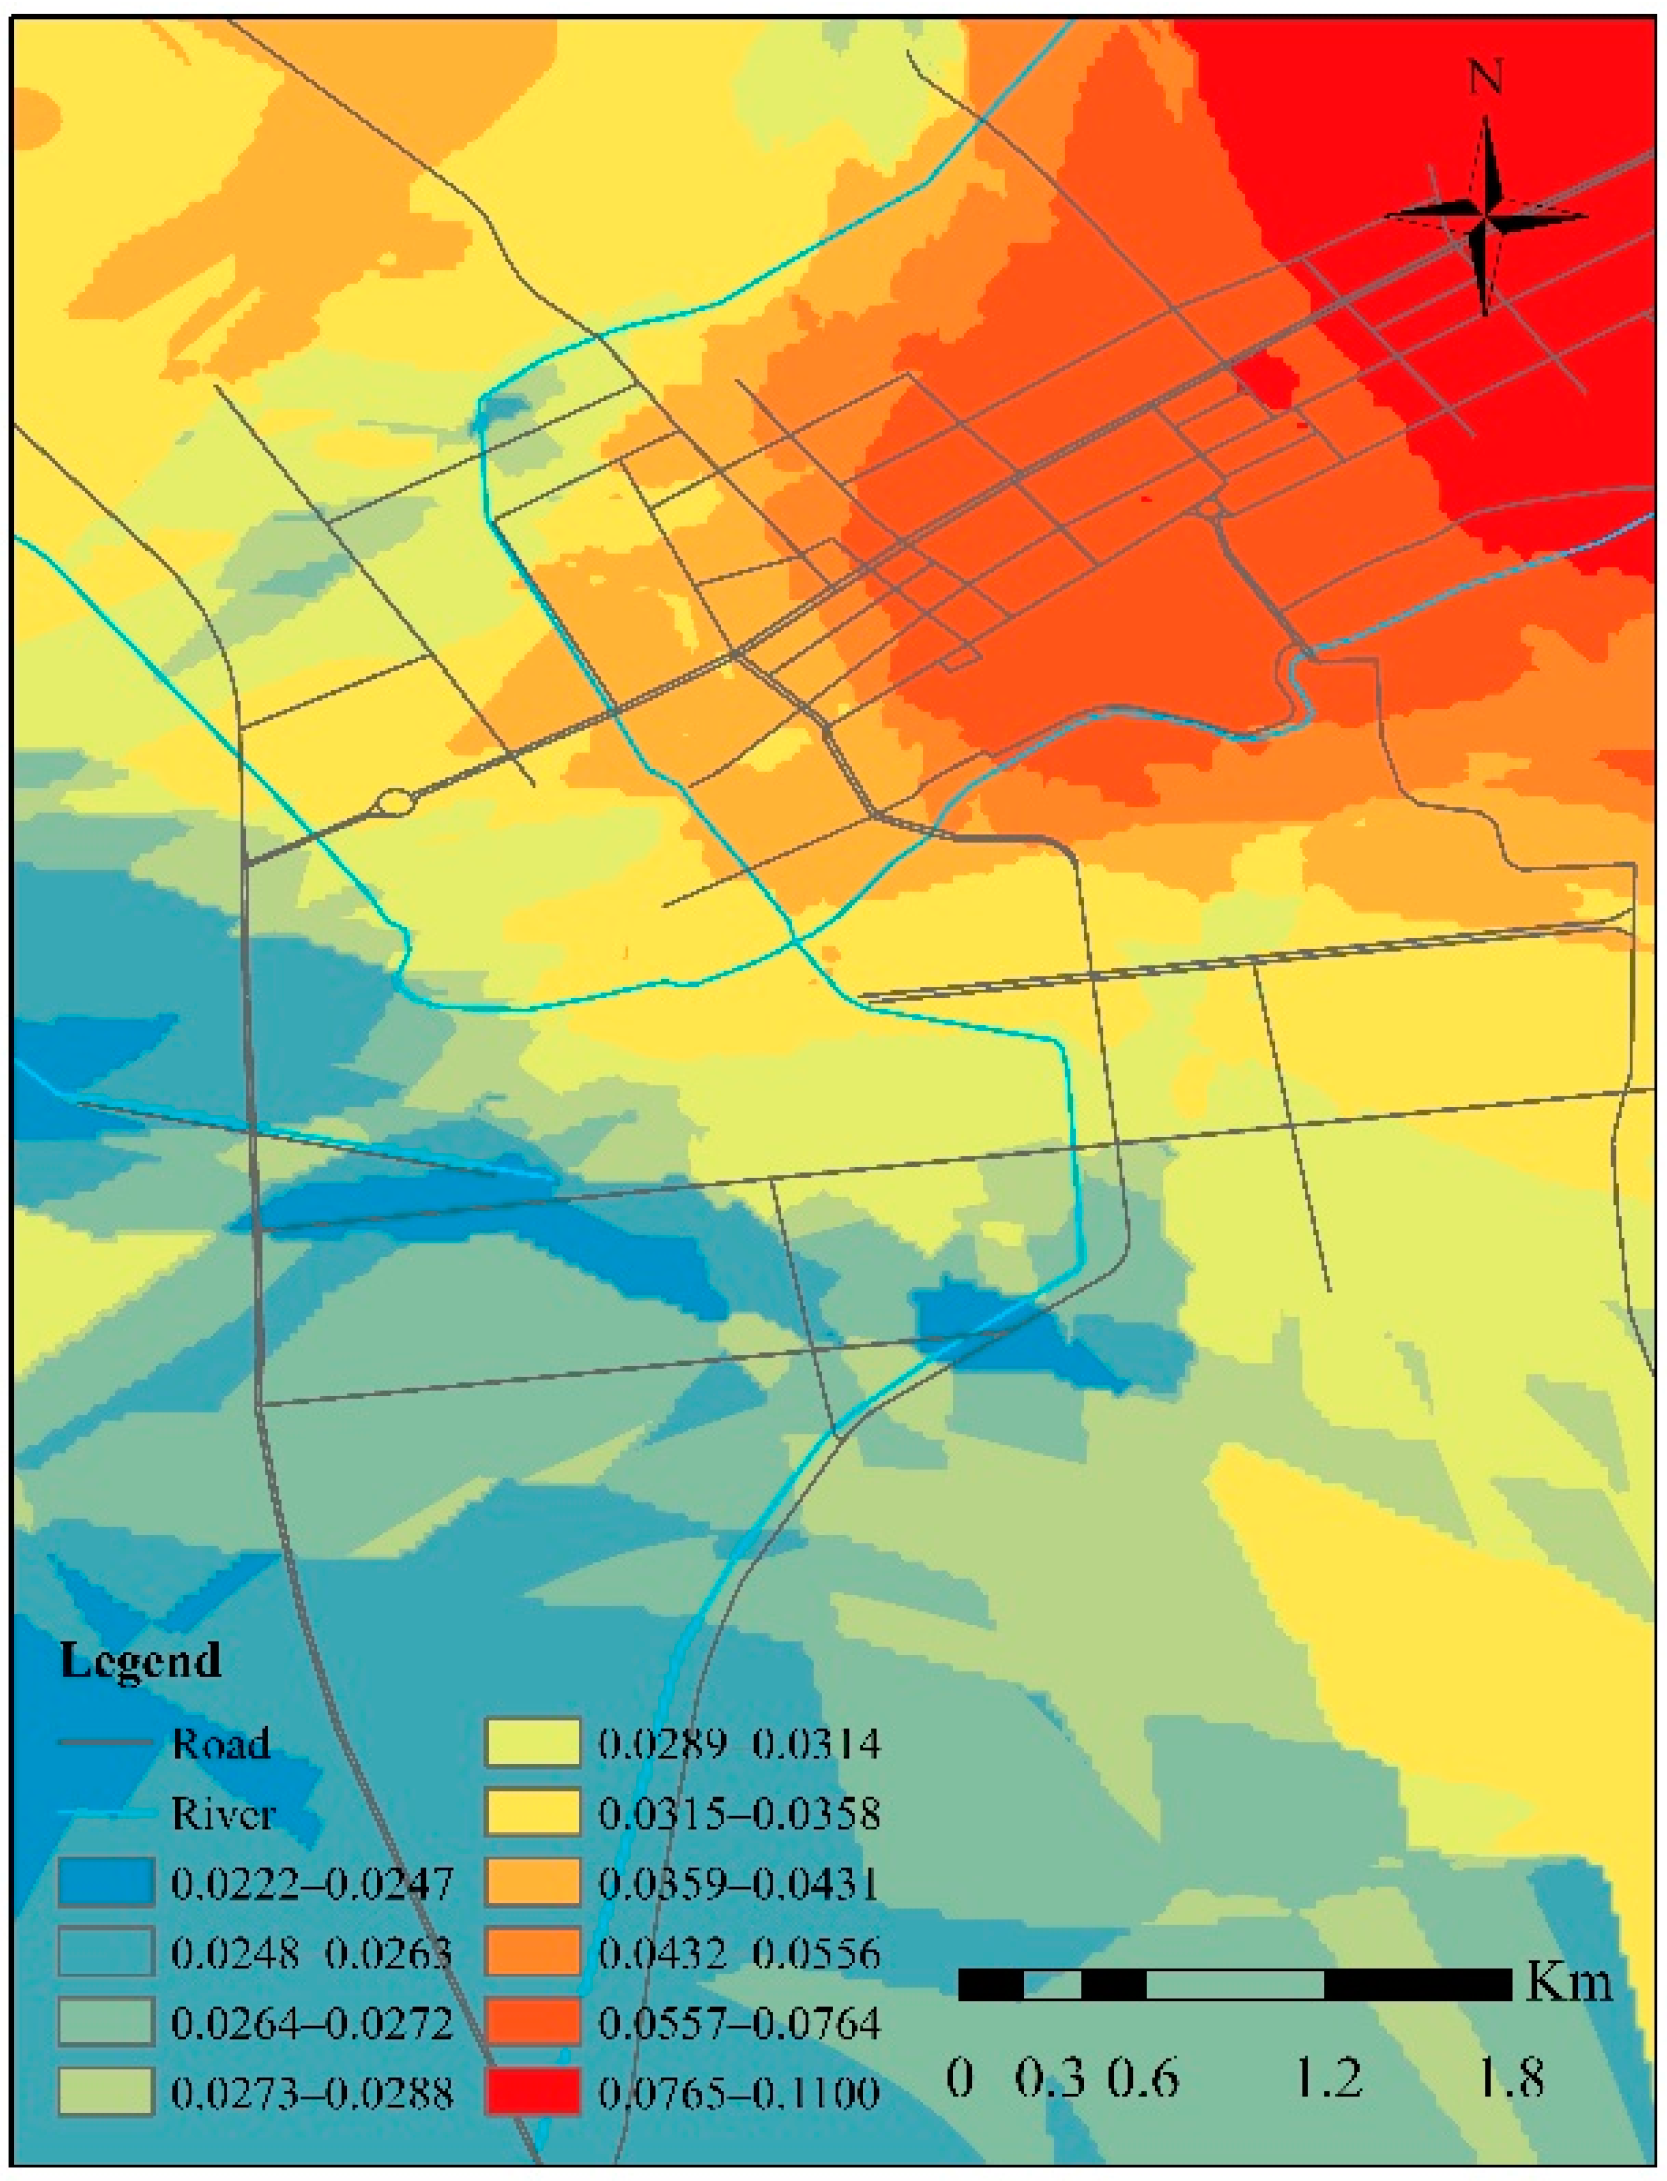
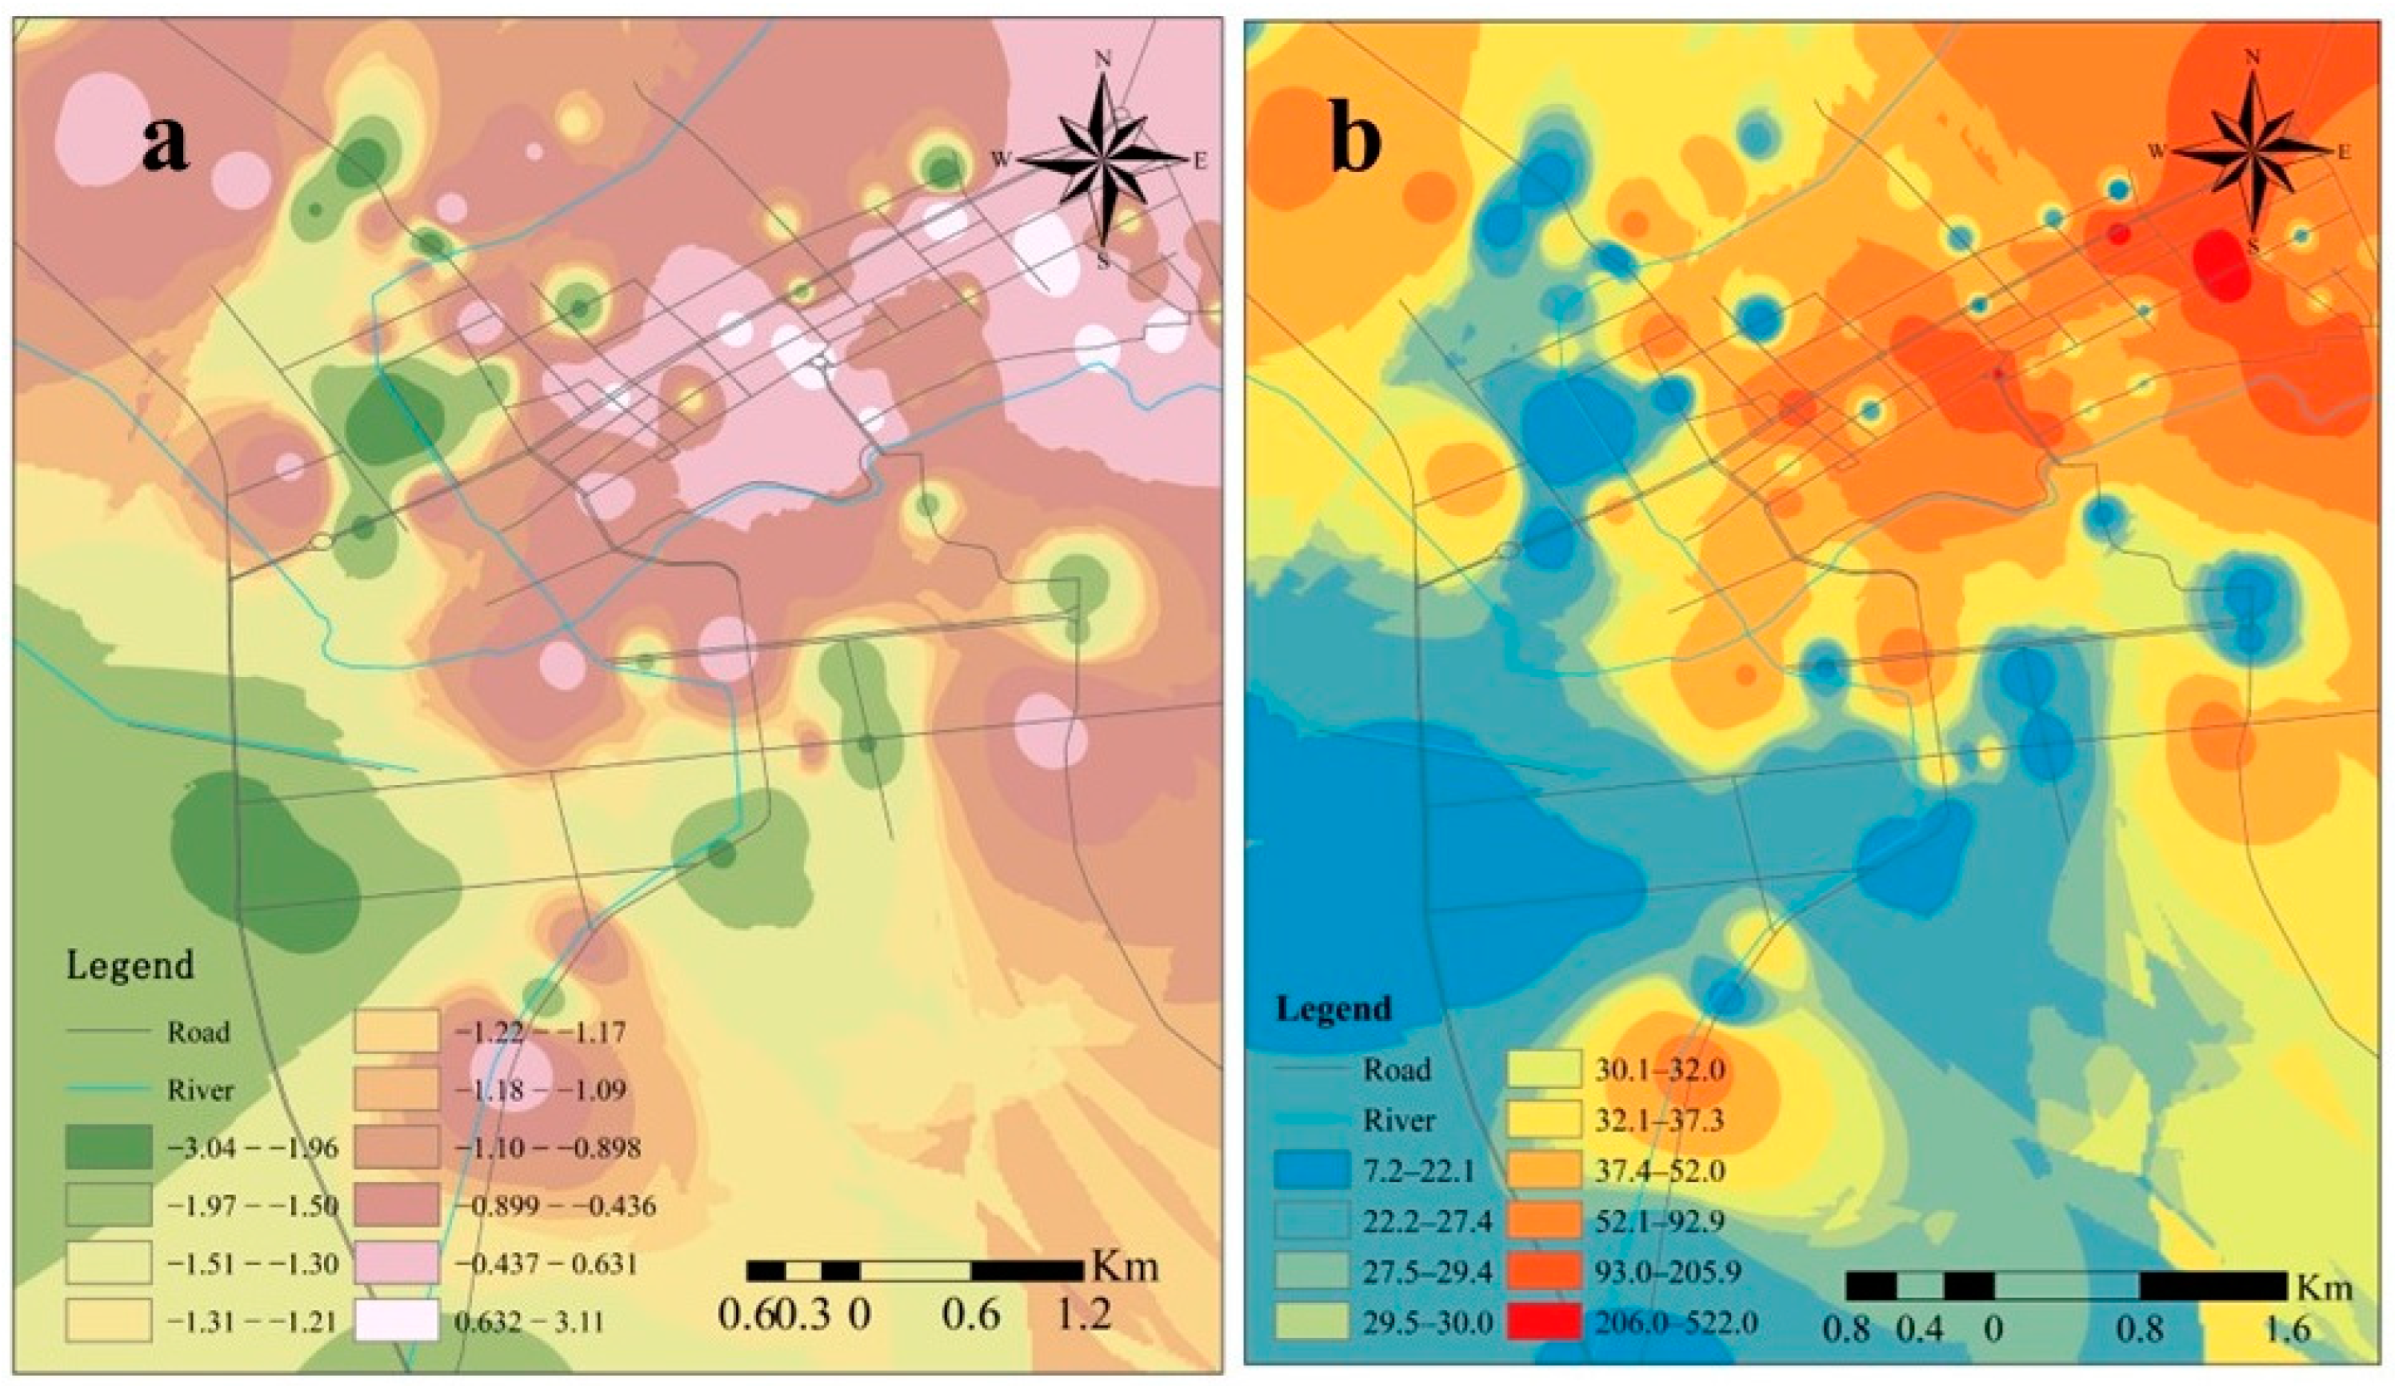
4.1.1. Spatial Distribution Characteristics of Soil Mercury Concentration

In order to intuitively display the spatial distribution characteristics of the soil mercury in the study area, we used ArcGIS 10.7 for geostatistical analysis. The Kriging interpolation method and the inverse distance weight method were used for the analysis, and the method with the best performance was selected to determine the research result. The spatial distribution map of the soil mercury content in the study area is shown in Figure 3. The spatial differences in the soil mercury content in the study area are obvious. The surface soil mercury content in the northeast of the study area is significantly higher than that in the southwest. The northeast of the research area is close to the industrial concentration area of Jiutai District (the former mining area of Yingcheng), and after long-term underground mining in the Yingcheng Coal Mine, a large area of coal mining subsidence and a coal gangue mountain was formed. It has been found that mercury is enriched in the soil by the weathering and leaching of coal gangue that has been piled up for a long time. Most of the mercury that enters the soil is bound by organic matter and remains there for a long time. Mercury accumulated in the soil can be slowly released into the surface water and other media over long periods, resulting in regional environmental mercury pollution [51,52]. In addition, this area now contains a concentration of Jiutai District industries, and the discharge of industrial mercury-containing wastes, coal combustion, and coal transportation have increased the accumulation of mercury in the surface soil. Due to the rapid urbanization in recent years, new urban areas in the south have also been developed. With the increase in the built-up area and the decrease in the population density in Jiutai District, the spatial distribution of soil mercury in the city has become more diffuse. A small number of soil mercury enrichment areas have also appeared in the new southern urban area, mainly distributed in large residential areas with high environmental quality and high-tech parks with low pollution and high output, and the soil mercury content is relatively low.
Higher mercury levels were also found in the commercial and northern residential regions of the study area. The commercial district has a large flow of people and vehicles, and the traffic contributes a lot to mercury emissions. In addition, the garbage output is large, and the total amount of mercury-containing waste is relatively large, so the mercury content in the surface soil is relatively high. Furthermore, Jiutai Railway Station is located in this area. The main cargo transportation categories of Jiutai Railway Station include grain, coal, fertilizer, small amounts of mineral materials, and building materials. Regional soil mercury arises from fly ash and coal dust deposited by coal and other minerals in the process of transportation. However, the northern residential area belongs to the old urban area, which used to contain many large and medium-sized heavy industries, such as thermal power plants and cement plants. Now, most of these enterprises have moved out, but the area still contains enterprises such as Jiutai Rongxiang Heating Supply and Xinhua Heating Supply. Studies have shown that the mercury content in the soil around coal-fired enterprises is much higher than the world average mercury concentration of 0.03 mg·kg−1. This is directly impacted by the mercury-containing flue gas emitted by enterprises, and the soil mercury concentration around coal-fired enterprises was found to decrease as the distance from the enterprise increased [27], which is consistent with the results of this study.
A comparison between the soil mercury content in Jiutai District and other typical mining towns worldwide is shown in Table 4. The six coal mines of Zaozhuang, Yuancang, Daihe, Gaoyang, Longfeng, and Yingcheng have all experienced the extensive exploitation of resources. Yingcheng, Yuancang, Daihe, and Longfeng are now closed due to resource exhaustion, whereas the Zaozhuang and Gaoyang mines are still in operation. Like the Gaoyang coal mine, the others are small and medium-sized coal mines. Rohini OCP NK Area in India, Pszczyna County Poland, and Ostrava in the Czech Republic are large and medium-sized coal mines. Through the comparison, it was found that the soil mercury content in the urban regions of the mining areas was higher than the local soil mercury background value, indicating that coal mining activities contribute to local soil mercury levels. By comparing the soil mercury content in the mining towns where the coal mine has ceased operations with that in the mining towns where the coal mine has been exploited, we found that the former did not present a lower level, indicating that early mining activities may have a long-term influence on the soil mercury content in mining towns. The background value of the soil mercury content in Jiutai District is higher than that in Zaozhuang, Huaibei, Xiaoyi, Fushun, and Pszczyna County, but the mean value of the soil mercury content is lower than that of these five cities. This indicates that Jiutai District is exposed to low exogenous mercury pollution, and it may be the case that coal mining activities had a small impact on the soil mercury content in the main urban area of Jiutai District.

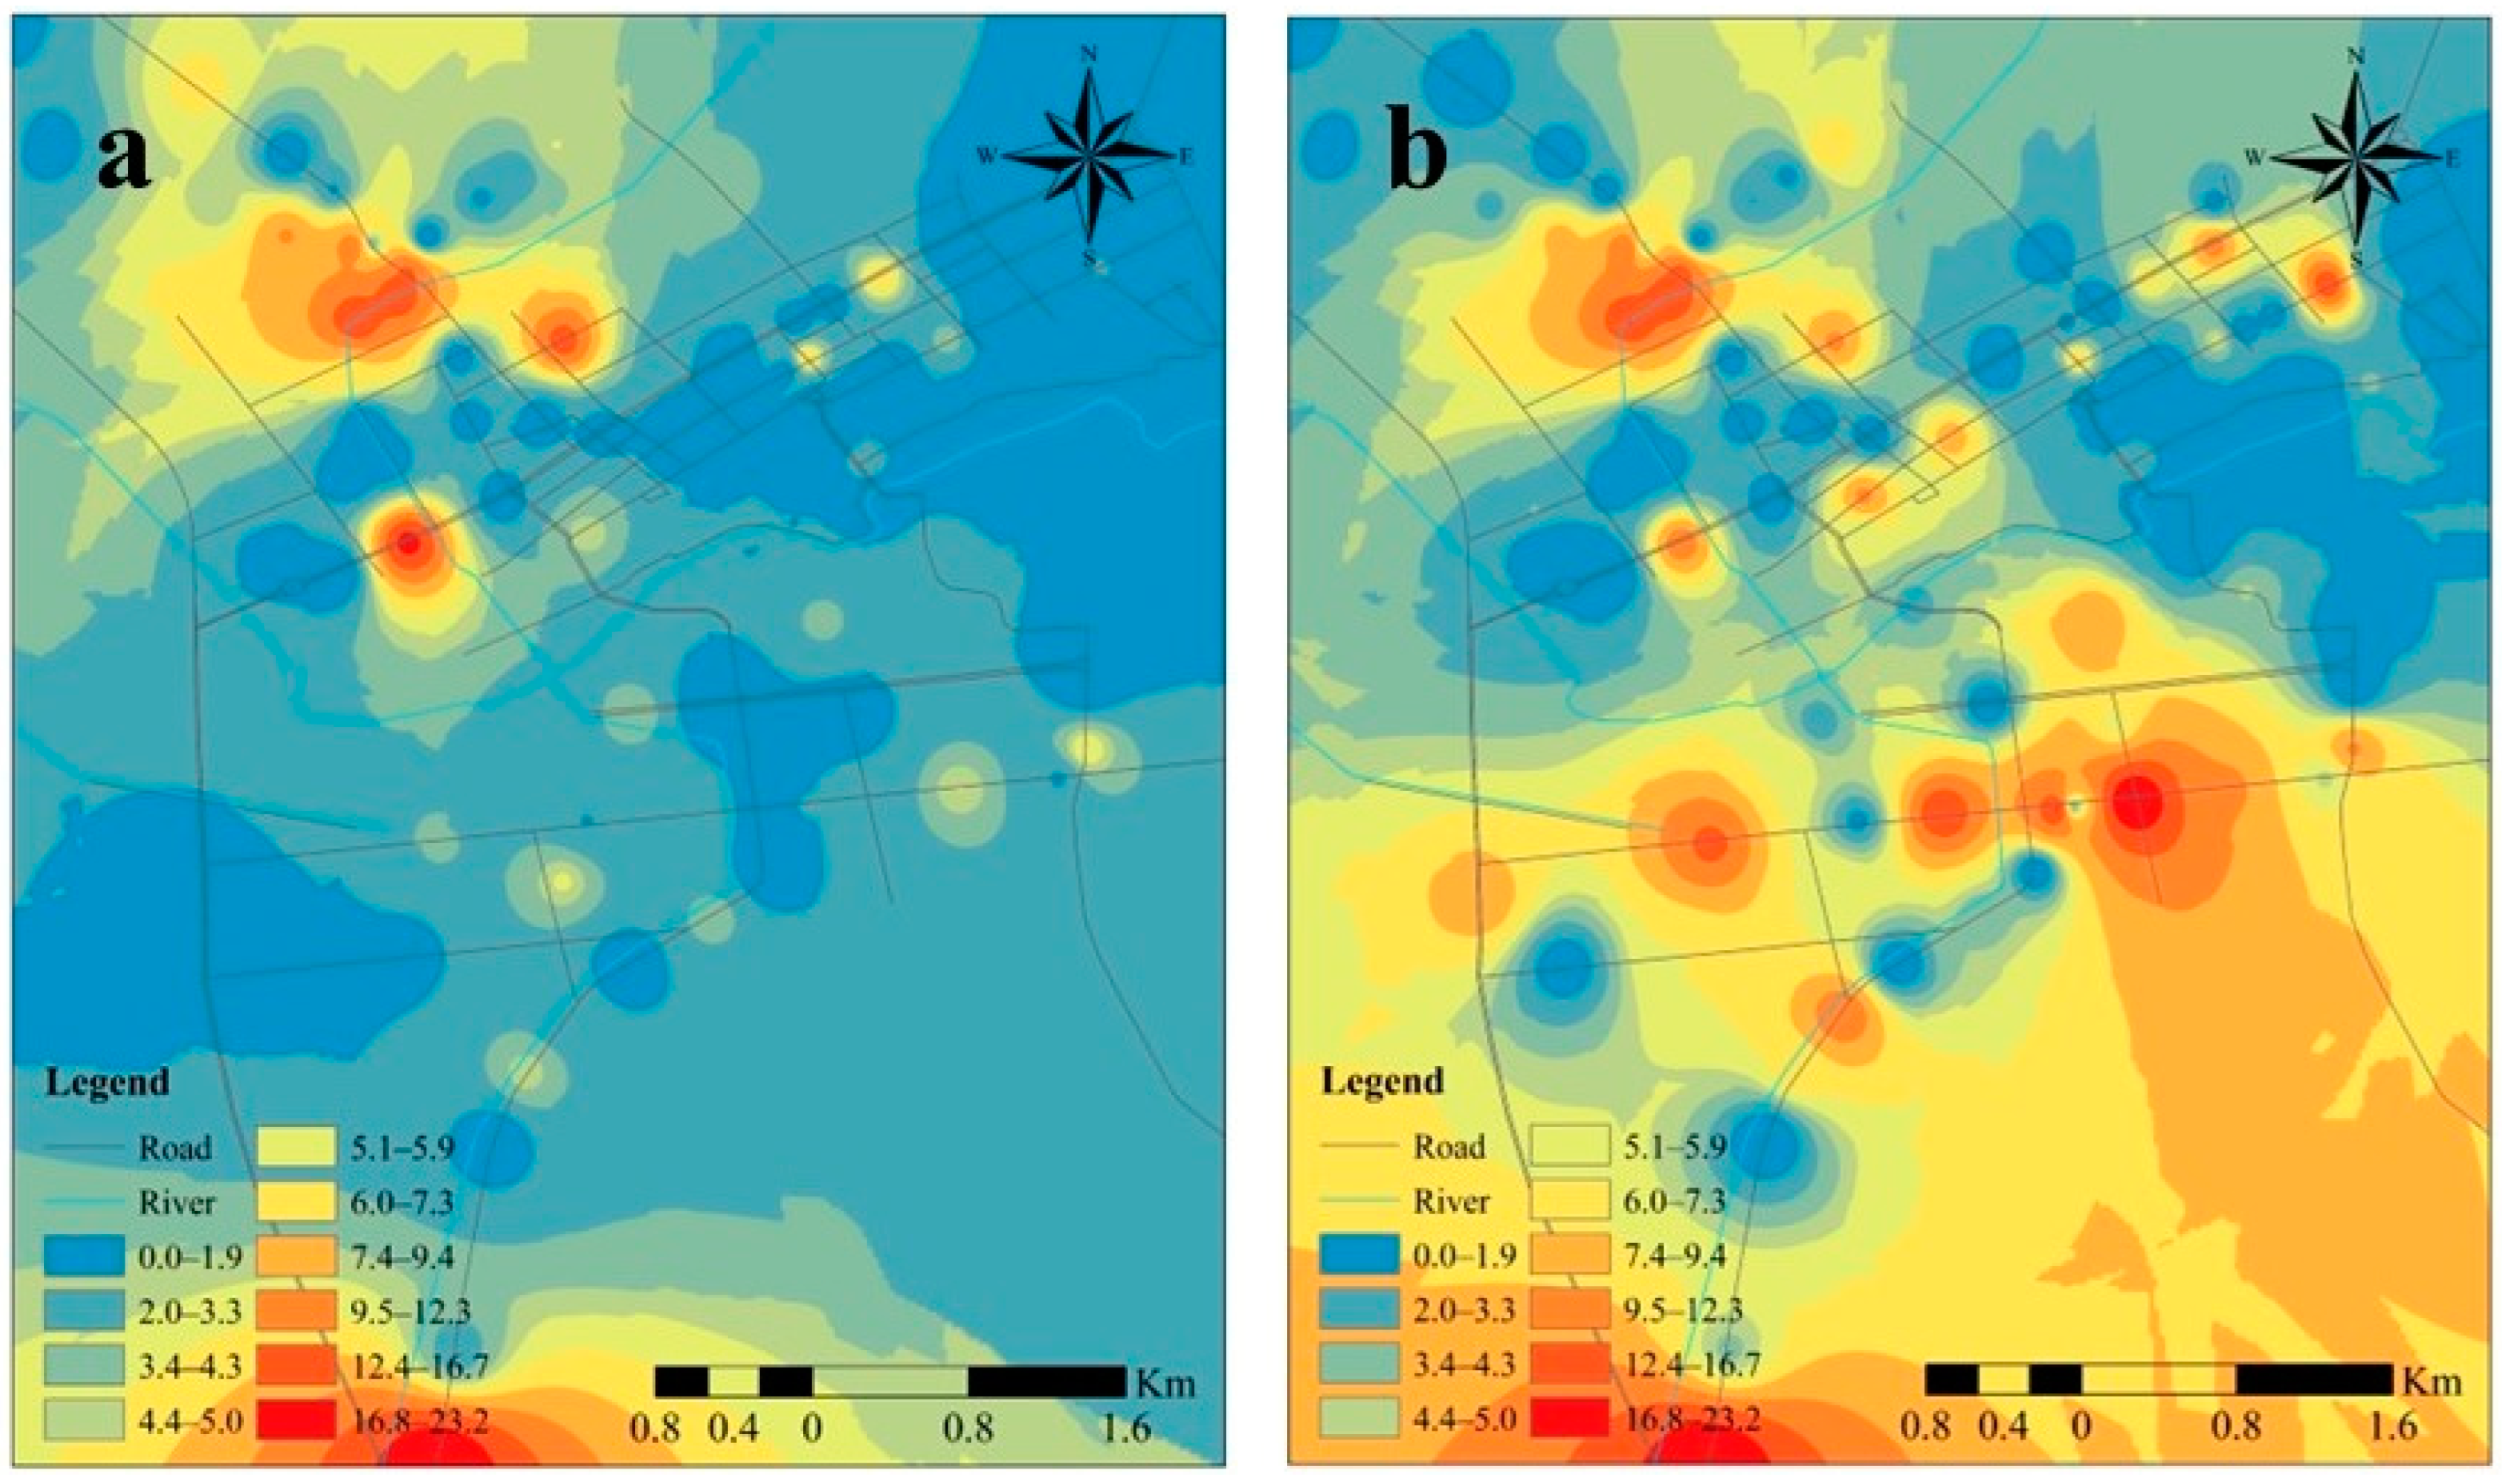
4.1.2. Spatial Distribution Characteristics of Atmospheric Mercury Concentration

The spatial distribution of the atmospheric mercury concentration at 0 cm and 100 cm in Jiutai District is shown in Figure 4. The Pearson correlation analysis of the mercury content in the atmosphere at 0 cm and 100 cm showed that there was a positive correlation between the two (R = 0.645), and the data showed that only 38% of the sampling points at 0 cm had a higher atmospheric mercury concentration than at 100 cm. The atmospheric mercury concentration at 100 cm was generally higher than that at 0 cm, which may have been caused by secondary dust [58]. As most sampling points were located around main traffic lines with large traffic flows, the secondary dust phenomena were more pronounced, resulting in a higher atmospheric mercury content at 100 cm than at ground level. In addition, the low level of atmospheric mercury at 0 cm may have been due to the adsorption of surface atmospheric mercury by vegetation and soil [59].
The areas with a high atmospheric mercury content at 0 cm were mainly located around heating enterprises, logistics parks, driving schools, and automobile markets. The waste gas and waste residue discharged from coal burning in heating enterprises contain different concentrations of mercury, which easily enters into the environmental medium. The areas with a high atmospheric mercury content at 100 cm were mainly located near logistics parks, commercial and residential areas, and main traffic lines and stations. The atmospheric mercury concentration level at 100 cm near logistics parks, commercial districts, and main traffic arteries and stations was relatively high, which was mainly due to heavy traffic flows. Studies have shown that traffic exhaust fumes are the main source of soil mercury on both sides of urban streets [60]. The main possible causes of high atmospheric mercury concentrations in residential areas are domestic waste and the use of mercury-containing products.

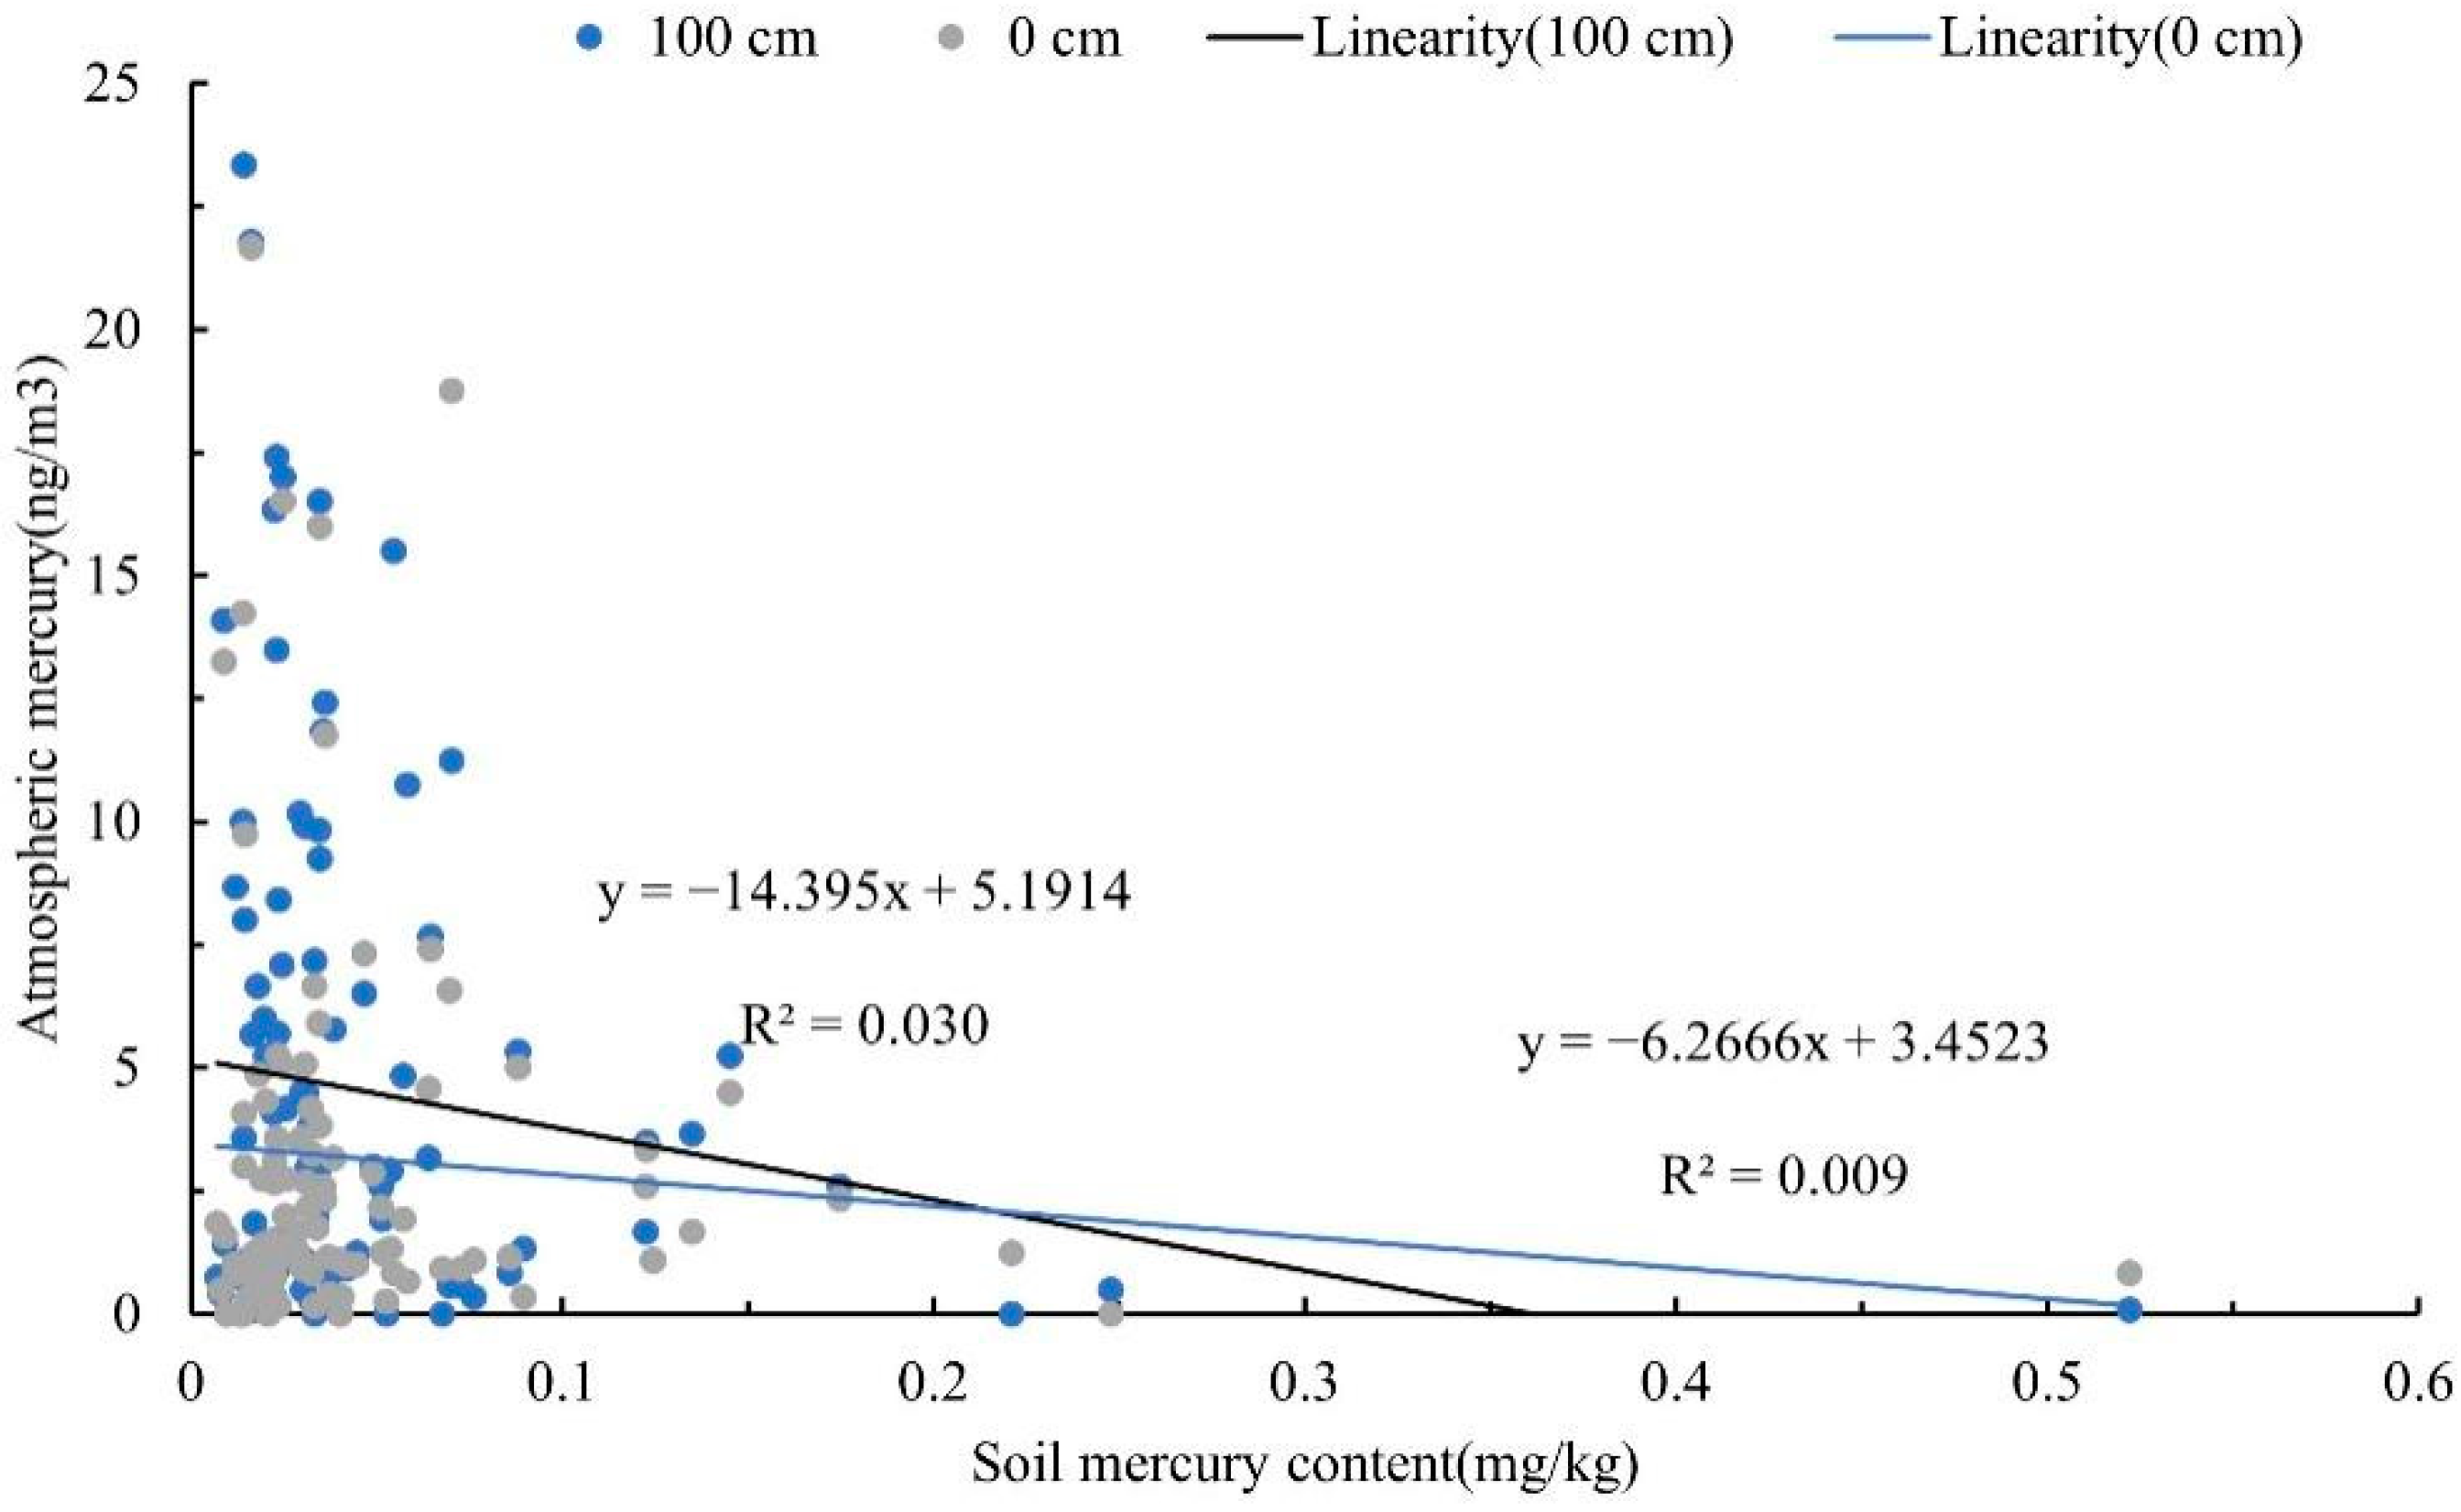
4.1.3. Relationship between Soil Mercury Concentration and Atmospheric Mercury Concentration

Through mapping the atmospheric mercury concentration at 0 cm and 100 cm and the soil mercury concentration on a scatter diagram, as shown in Figure 5, we found no significant linear correlation between the mercury concentration in the atmosphere and the soil mercury content. In this study, the soil mercury levels were less affected by atmospheric deposition. This may have been due to the fact that atmospheric mercury has a stronger ability to migrate over long distances. In addition, in this study, the monitoring was conducted on cloudy days with less solar radiation and a low oxidation level of gaseous elemental mercury, thus improving the migration capacity of atmospheric mercury [61].

4.1.4. Relationship between Soil Mercury Concentration and Wind Direction

A box diagram and variance analysis were used to analyze the influence of four wind directions (northeast, southeast, northwest, and southwest) on the soil mercury concentration in the main urban area of Jiutai District, as shown in Figure 6.
As can be seen from Figure 6, there were differences in soil mercury concentration between the different wind directions, with the highest mercury concentration in the northeast direction. The results of one-way ANOVA showed that there was a significant difference in soil mercury concentration between the northeast and southwest directions (p = 0.001 < 0.05). The soil mercury concentration in the northeast direction was significantly higher than that in southwest direction. The results of one-way ANOVA showed that there was no significant difference in soil mercury concentration between the northwest and southeast directions (p = 0.913 > 0.05), while for the west and east directions we found a significant difference in mercury concentration (p = 0.012 < 0.05). The soil mercury concentration in the eastern direction was significantly higher than that in the western direction. We also found that there was a significant difference in mercury concentration between the south direction and the north direction (p = 0.018 < 0.05). The soil mercury concentration in the northern region was significantly higher than that in the southern region.
Therefore, there is a direct relationship between soil mercury pollution and wind direction in Jiutai District. The sampling time of this study ranged from the end of October to the beginning of November. According to the urban industrial layout of Jiutai District, its heating enterprises are mainly distributed in the northeast section of the main urban area, and the pollutants generated by coal-fired heating in winter are mainly concentrated in this area. At this time, the prevailing southwesterly wind in Jiutai District led to the migration of mercury-containing air pollutants from the southwest to the northeast. Atmospheric mercury enters regional soils through snowfall and rainfall. The water-soluble Hg2+ that had accumulated on the soil surface directly or indirectly entered the soil through leaching [62], resulting in the soil mercury concentration on the downwind surface being significantly higher than that on the upwind surface.

4.1.5. Influence of Mining Area on Mercury Content in Urban Soil

As a coal mining town, Jiutai District is relatively concentrated in coal resources. Since large-scale mining began, many polluting enterprises, such as thermal power, coal burning, and coal washing, have developed around the coal industry and are clustered and distributed around the town, affecting the mercury content and spatial distribution in urban soil to a certain extent [27]. This study mainly considered the influence of Yingcheng Coal Mine in the northeast of Jiutai District’s main urban area. The results showed that the soil mercury was enriched in the coal mine and its surrounding area in the early stages of coal mining [63]. Based on the investigation of soil mercury pollution sources in Jiutai District, combined with the experimental analysis results of this study and soil mercury pollution studies in other coal mining towns, the sources and locations of soil mercury in the urban environment of a typical coal mining town were schematized, as shown in Figure 7. The piling of coal gangue, the transportation of coal, the processing of coal by-products, and the industrial activities of coal enterprises built on the edge of coal mines are the main sources of soil mercury in early-stage coal mining. Long-term coal mining led to the establishment of industrial structures in Jiutai District that are dominated by coal mining and processing and caused a spatial distribution pattern of mercury discharge enterprises such as concentrators, smelters, and coal-fired power plants interspersed among the urban areas. Urban soil mercury shows a spatial distribution characteristic of gradually decreasing pollution severity from the source center to the surrounding areas. As the coal resource was depleted, the Jiutai District’s major pillar industry also gradually shifted from the coal industry to processing and manufacturing products containing mercury, waste incineration, transportation, and industrial activities, which have become the main pollution sources of mercury in the soil. The soil mercury from the early mining activities of Yingcheng Coal Mine in Jiutai District has little influence on the present urban soil environment. In conclusion, through this study, it was found that there are few areas of soil mercury enrichment in Jiutai District’s main urban area, and the early coal mining activities in Yingcheng Coal Mine had little impact on the soil environment in the main urban area.

4.2. Risk Assessment of Soil Mercury Pollution in Jiutai District

4.2.1. Ecological Risk Assessments of the Soil Mercury Pollution

A descending chart of the Igeo is shown in Figure 8. The distribution of the soil mercury Igeo is shown in Figure 9.
Based on the results of the Igeo, only 19% of the sample sites in the study area were polluted (index > 0), and only one of the sample sites was heavily polluted. Eight percent of the sample sites were moderately polluted, ten percent of the sample sites were mildly polluted, and the rest of the sample sites were not polluted. In general, the evaluation of the soil mercury accumulation index in Jiutai District showed that the soil mercury pollution level was low and was mainly concentrated in certain areas. As shown in Figure 9a, the polluted areas were mainly concentrated in the northeast region of Jiutai District, which is consistent with the research results of the relationship between soil mercury concentration and wind direction. The northeast region is close to the Jiutai industrial concentration area, indicating that industrial activities caused obvious mercury pollution to the surrounding soil. Different degrees of mercury pollution also existed in the northern old city of Jiutai District, and the polluted areas were mainly concentrated in the commercial area, both sides of the main traffic lines, and around major traffic stations (such as Jiutai Railway Station and Jiutai Highway Passenger Station), indicating that the contribution of traffic to urban soil mercury pollution was significant.
The spatial distribution results of the potential ecological risk levels of soil mercury pollution in the study area are shown in Figure 9b. The Er of soil mercury ranged from 7.2 to 522.0, and its spatial distribution showed significant variation. Figure 9b shows that the northeast of the study area had the highest soil mercury overall. Based on the analysis of urban industrial distribution in Jiutai District, it can be seen that the early mining activities and current industrial activities in the northeast region are close to the industrial concentration area of Jiutai District (the former Yingcheng Coal Mining area), and these early mining activities and current industrial activities increased the soil mercury concentration. Therefore, the regional soil mercury potential ecological risk was high. Another section of the study area with a high potential risk of soil mercury was located near Jiutai Railway Station. This area is the main commercial traffic area of the city, and mercury emission from traffic has a great impact on soil mercury content. Furthermore, there is a large flow of people in this area, which poses a high potential ecological risk, so attention should be paid to timely mercury pollution control.

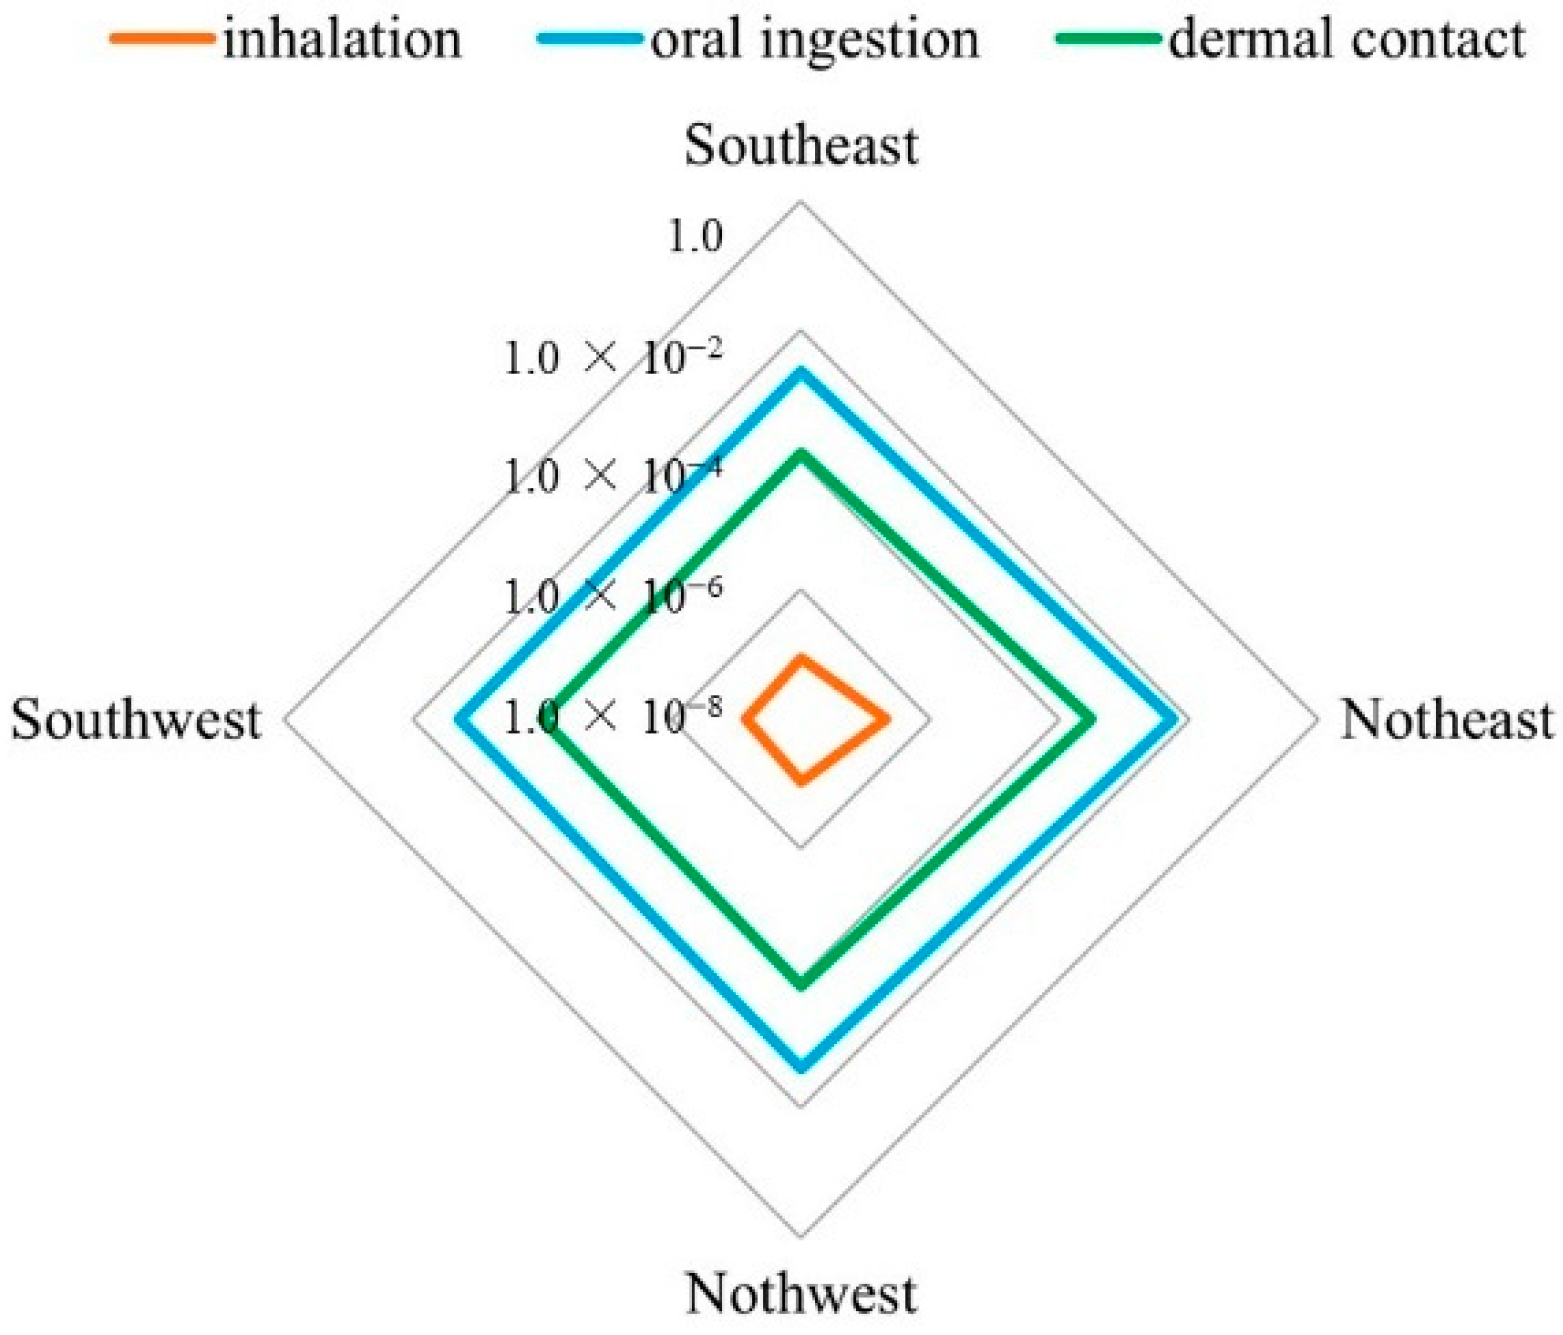
4.2.2. Assessment of the Potential Health Risks of Soil Mercury Contamination

In order to clarify the sources and paths of the soil mercury exposure risk to residents in coal mining towns, we drew a schematic diagram of human mercury exposure in coal mining towns by investigating the soil mercury exposure risk faced by the population in typical mining cities and combining this with the experimental results of our study, as shown in Figure 10. Generally, urban residents in typical mining areas are exposed to mercury by the inhalation of mercury-containing exhaust gases and dust from coal combustion, industrial activities, garbage incineration, and transportation; skin contact with mercury-containing soil, mercury-containing waste, and polluted water; and the consumption of vegetables, grains, meat, drinking water, etc.
In this study, a radar map of the non-carcinogenic risk levels in the southeast, southwest, northeast, and northwest regions of the study area was plotted for the three exposure pathways of oral ingestion, inhalation, and dermal contact, as shown in Figure 11.
It can be seen from Figure 11 that the levels of non-carcinogenic risk for the three exposure pathways were ranked as follows: oral ingestion > dermal contact >> inhalation, with the oral ingestion of soil mercury being the main exposure route. Related studies have also focused on the risks to human health posed by mercury exposure through air, water, and other media, including the consumption of animal or plant products [64]; in the latter case, exposure may occur due to the intake of vegetables, while the bioaccumulation effect in animals can also lead to a large amount of soil mercury exposure through the intake of animal products. In the north of Jiutai District, there are a large number of basic cultivated land areas protected by the state. The northeast area of Jiutai District is now an industrial concentration area. Long-term coal mining and industrial activities cause different levels of farmland soil mercury pollution, which means that the output of agricultural and sideline products in the region may pose a potential environmental health risk. Many studies have shown that the health risk of mercury in farmland soil near abandoned coal mines is high. For example, mercury in the farmland soil of the Xiaoyi industrial and mining area, a typical coal mining city, exceeded the local background value by more than three times, and mercury accumulation in its agricultural products was also found [56]. Vegetables in the vegetable fields of Panji Coal Mine in Huainan were found to be contaminated to varying degrees. Although studies have shown that local soil mercury poses a low non-carcinogenic risk to the human body through vegetable intake, the soil in mining areas is often contaminated by multiple heavy metals, thus posing higher health risks to humans [65]. In general, the health risks posed by the three routes of soil mercury exposure and the total health risks were far less than 1, showing that in the study area, soil mercury pollution does not harm the health of local adults. However, further work should be carried out to improve the environment, promote the construction of an urban ecological civilization, and manage the existing soil pollution in the town.

5. Conclusions

The average soil mercury concentration in the Jiutai District urban area was 0.0484 ± 0.0633 mg·kg−1, and the range was 0.00720~0.522 mg·kg−1. The mercury content of 32% of the soil samples exceeded the regional soil background value of Jilin Province (0.04 mg·kg−1). There was a significant positive correlation between the atmospheric mercury content at 0 cm and that at 100 cm (R = 0.645), and the atmospheric mercury concentration at 100 cm was generally higher than that at 0 cm. According to the Igeo, 19% of the sample sites in the study area were polluted (index > 0). In general, the soil mercury pollution level in Jiutai District was low, and the polluted areas were mainly concentrated in the northeast of Jiutai District’s main urban area. The Er of the soil mercury in the study area ranged from 7.2 to 522.0, and 32% of the sampling sites presented a moderate or above potential ecological risk (Er > 40). The potential ecological risk level of the soil mercury was higher in the northeast of the study area. In terms of non-carcinogenic risk, the three main soil mercury exposure pathways were ranked as follows: oral ingestion (average 0.320 × 10⁻²) > dermal contact (average 0.170 × 10⁻³) >> inhalation (average 0.118 × 10⁻⁶). The oral ingestion of soil is the main route of human mercury exposure. In addition, the health risk and total health risk values of the three types of soil mercury exposure were far less than 1, indicating that the soil mercury pollution in the study area poses no harm to the health of local adults.

Author Contributions

Conceptualization, Y.X. and G.Z.; methodology, Y.X., H.W., Z.Z. and Y.W.; software, Y.X. and H.W.; validation, Y.W.; formal analysis, Y.X. and Z.W.; data curation, J.G. and G.Z.; writing—original draft preparation, Y.X. and G.Z.; writing—review and editing, H.Y. and D.C.; visualization, H.Y.; supervision and project administration, G.Z. and D.C.; funding acquisition, G.Z. and D.C. All authors have read and agreed to the published version of the manuscript.

Funding

Dan Cui as Postdoc of Beijing Foreign Studies University, this research was funded by the Chinese National Natural Science Foundation (31230012, 31770520); the Key Social Development Project of Jilin Science and Technology Department, China (20190303068SF); and the Chinese Postdoctoral Science Foundation (2021M700496).

Institutional Review Board Statement

Not applicable.

Informed Consent Statement

Informed consent was obtained from all subjects involved in the study.

Data Availability Statement

The data presented in this study are available on request from the corresponding author.

Acknowledgments

We are grateful to the Key Laboratory of Vegetation Ecology of the Ministry of Education for their help and support.

Conflicts of Interest

The authors declare that they have no known competing financial interests or personal relationships that could have influenced the work reported in this paper.

References

  1. Driscoll, C.T.; Mason, R.; Chan, H.M.; Jacob, D.J.; Pirrone, N. Mercury as a Global Pollutant: Sources, Pathways, and Effects. Environ. Sci. Technol. 2013, 47, 4967–4983. [Google Scholar] [CrossRef] [PubMed]
  2. Wang, J.; Ma, L.Q.; Letcher, R.; Bradford, S.A.; Feng, X.; Rinklebe, J. Biogeochemical cycle of mercury and controlling technologies: Publications in critical reviews in environmental science & technology in the period of 2017–2021. Crit. Rev. Environ. Sci. Technol. 2022, 1–6. [Google Scholar] [CrossRef]
  3. Feng, X.; Chen, J.; Fu, X.; Hu, H.; Li, P.; Qiu, G.; Yan, H.; Yin, R.; Zhang, H.; Zhu, W. Progresses on Environmental Geochemistry of Mercury. Bull. Mineral. Petrol. Geochem. 2013, 32, 503–530. (In Chinese) [Google Scholar]
  4. Osipova, N.A.; Tkacheva, E.V.; Arbuzov, S.I.; Yazikov, E.G.; Matveenko, I.A. Mercury in Coals and Soils from Coal-Mining Regions. Solid Fuel Chem. 2019, 53, 411–417. [Google Scholar] [CrossRef]
  5. Wu, Q.; Wang, S.; Li, G.; Liang, S.; Lin, C.-J.; Wang, Y.; Cai, S.; Liu, K.; Hao, J. Temporal Trend and Spatial Distribution of Speciated Atmospheric Mercury Emissions in China During 1978–2014. Environ. Sci. Technol. 2016, 50, 13428–13435. [Google Scholar] [CrossRef] [PubMed]
  6. Tian, H.Z.; Lu, L.; Hao, J.M.; Gao, J.J.; Cheng, K.; Liu, K.Y.; Qiu, P.P.; Zhu, C.Y. A Review of Key Hazardous Trace Elements in Chinese Coals: Abundance, Occurrence, Behavior during Coal Combustion and Their Environmental Impacts. Energy Fuels 2013, 27, 601–614. [Google Scholar] [CrossRef]
  7. Yudovich, Y.E.; Ketris, M. Mercury in coal: A review: Part 1. Geochemistry. Int. J. Coal Geol. 2005, 62, 107–134. [Google Scholar] [CrossRef]
  8. Nriagu, J.O.; Pacyna, J.M. Quantitative assessment of worldwide contamination of air, water and soils by trace metals. Nature 1988, 333, 134–139. [Google Scholar] [CrossRef]
  9. Feng, X.; Hong, Y. Modes of occurrence of mercury in coals from Guizhou, People’s Republic of China. Fuel 1999, 78, 1181–1188. [Google Scholar] [CrossRef]
  10. Li, J.; Wang, J. Comprehensive utilization and environmental risks of coal gangue: A review. J. Clean. Prod. 2019, 239, 117946. [Google Scholar] [CrossRef]
  11. Jilin Provincial Bureau of Statistics. Jilin Statistical Yearbook; Changchun Audio and Video Electronic Publishing House: Changchun, China, 2021.
  12. Song, W.; He, T. Environmental effects of mercury in coal mine spoils in Panxian of Guizhou Province. Chin. J. Ecol. 2009, 28, 1589–1593. (In Chinese) [Google Scholar] [CrossRef]
  13. Wang, X.; Tang, Y.; Ma, T.; Chen, Y. Research progress onmigration and transformation behavior of hazardous mineral matter in coals during coal combustion. Coal Sci. Technol. 2021, 49, 207–219. (In Chinese) [Google Scholar]
  14. Miller, C.L.; Watson, D.B.; Lester, B.P.; Lowe, K.A.; Pierce, E.M.; Liang, L. Characterization of soils from an industrial complex contaminated with elemental mercury. Environ. Res. 2013, 125, 20–29. [Google Scholar] [CrossRef] [PubMed]
  15. Ouyang, D.; Liu, K.; Wu, Q.; Wang, S.; Tang, Y.; Li, Z.; Liu, T.; Han, L.; Cui, Y.; Li, G.; et al. Effect of the Coal Preparation Process on Mercury Flows and Emissions in Coal Combustion Systems. Environ. Sci. Technol. 2021, 55, 13687–13696. [Google Scholar] [CrossRef]
  16. Li, R.; Yuan, Y.; Li, C.; Sun, W.; Yang, M.; Wang, X. Environmental Health and Ecological Risk Assessment of Soil Heavy Metal Pollution in the Coastal Cities of Estuarine Bay—A Case Study of Hangzhou Bay, China. Toxics 2020, 8, 75. [Google Scholar] [CrossRef]
  17. Raj, D.; Kumar, A.; Maiti, S.K. Evaluation of toxic metal(loid)s concentration in soils around an open-cast coal mine (Eastern India). Environ. Earth Sci. 2019, 78, 645. [Google Scholar] [CrossRef]
  18. Zhang, L.; Wong, M.H. Environmental mercury contamination in China: Sources and impacts. Environ. Int. 2007, 33, 108–121. [Google Scholar] [CrossRef]
  19. Fang, F.; Wang, Q.; Li, J. Urban environmental mercury in Changchun, a metropolitan city in Northeastern China: Source, cycle, and fate. Sci. Total Environ. 2004, 330, 159–170. [Google Scholar] [CrossRef]
  20. Wang, Z.; Wang, L.; Xiao, T.; Yu, T.; Li, X.; Tang, Z.; Zhang, G. Pollution Characteristics and Risk Assessments of Mercury in the Soil of the Main Urban Regions in a Typical Chinese Industrial City: Changchun. Pol. J. Environ. Stud. 2021, 30, 3829–3841. [Google Scholar] [CrossRef]
  21. Rodrigues, S.; Pereira, M.; Duarte, A.; Ajmone-Marsan, F.; Davidson, C.; Grčman, H.; Hossack, I.; Hursthouse, A.; Ljung, K.; Martini, C.; et al. Mercury in urban soils: A comparison of local spatial variability in six European cities. Sci. Total Environ. 2006, 368, 926–936. [Google Scholar] [CrossRef]
  22. Fei, X.; Lou, Z.; Xiao, R.; Ren, Z.; Lv, X. Contamination assessment and source apportionment of heavy metals in agricultural soil through the synthesis of PMF and GeogDetector models. Sci. Total Environ. 2020, 747, 141293. [Google Scholar] [CrossRef] [PubMed]
  23. Bi, X.; Zhang, M.; Wu, Y.; Fu, Z.; Sun, G.; Shang, L.; Li, Z.; Wang, P. Distribution patterns and sources of heavy metals in soils from an industry undeveloped city in Southern China. Ecotoxicol. Environ. Saf. 2020, 205, 111115. [Google Scholar] [CrossRef] [PubMed]
  24. Khan, S.; Munir, S.; Sajjad, M.; Li, G. Urban park soil contamination by potentially harmful elements and human health risk in Peshawar City, Khyber Pakhtunkhwa, Pakistan. J. Geochem. Explor. 2016, 165, 102–110. [Google Scholar] [CrossRef]
  25. Liu, W.; Li, Y.; Li, J.; Tang, Z. Distribution and temporal trend of heavy metals in soils from typical areas in a coal-mining city. Environ. Pollut. Control. 2021, 43, 984–989. (In Chinese) [Google Scholar]
  26. Wu, X.; Huang, X.; Quan, W.; Hu, J.; Qin, F.; Tang, F. Chemical Forms and Risk Assessment of Heavy Metals in Soils and Selected Hypertolerant Plants around a Coal Mining Area in Western Guizhou Province. Bull. Soil Water Conserv. 2018, 38, 313–321. (In Chinese) [Google Scholar]
  27. Liang, J.; Feng, C.; Zeng, G.; Gao, X.; Zhong, M.; Li, X.; Li, X.; He, X.; Fang, Y. Spatial distribution and source identification of heavy metals in surface soils in a typical coal mine city, Lianyuan, China. Environ. Pollut. 2017, 225, 681–690. [Google Scholar] [CrossRef]
  28. Pan, L.; Ma, J.; Hu, Y.; Su, B.; Fang, G.; Wang, Y.; Wang, Z.; Wang, L.; Xiang, B. Assessments of levels, potential ecological risk, and human health risk of heavy metals in the soils from a typical county in Shanxi Province, China. Environ. Sci. Pollut. Res. 2016, 23, 19330–19340. [Google Scholar] [CrossRef]
  29. Loska, K.; Wiechuła, D.; Korus, I. Metal contamination of farming soils affected by industry. Environ. Int. 2004, 30, 159–165. [Google Scholar] [CrossRef]
  30. Doležalová Weissmannová, H.; Mihočová, S.; Chovanec, P.; Pavlovský, J. Potential ecological risk and human health risk assessment of heavy metal pollution in industrial affected soils by coal mining and metallurgy in Ostrava, Czech Republic. Int. J. Environ. Res. Public Health 2019, 16, 4495. [Google Scholar] [CrossRef] [Green Version]
  31. Yin, W.; Lu, Y.; Li, J.-H.; Chen, C.-X.; Zhang, C.; Dong, F. Distribution Characteristics and Pollution Assessment of Mercury in Urban Soils of Guangzhou. J. Soil Sci. 2009, 40, 1185–1188. (In Chinese) [Google Scholar]
  32. Yao, Y.; Fang, F.; Wu, J.; Zhu, Z.; Lin, Y.; Zhang, D.; Zhu, H. Concentrations and pollution assessment of mercury in surfaces dust at urban streets and elementary school campuses of Huainan City. Environ. Sci. Technol. 2017, 37, 844–852. (In Chinese) [Google Scholar]
  33. Christophoridis, C.; Evgenakis, E.; Bourliva, A.; Papadopoulou, L.; Fytianos, K. Concentration, fractionation, and ecological risk assessment of heavy metals and phosphorus in surface sediments from lakes in N. Greece. Environ. Geochem. Heal. 2020, 42, 2747–2769. [Google Scholar] [CrossRef] [PubMed]
  34. Liu, K.; Li, C.; Tang, S.; Shang, G.; Yu, F.; Li, Y. Heavy metal concentration, potential ecological risk assessment and enzyme activity in soils affected by a lead-zinc tailing spill in Guangxi, China. Chemosphere 2020, 251, 126415. [Google Scholar] [CrossRef] [PubMed]
  35. OSWER 9355; 4-24 Supplemental Guidance for Developing Soil Screening Levels for Superfund Sites. Environmental Protection Agency: Washington, DC, USA, 2001.
  36. US EPA. Risk-Based Concentration Table; Environmental Protection Agency: Philadelphia, PA, USA, 2000.
  37. Xu, J.; Zhang, B.; Wang, Z.; Guo, Y.; Song, K. Chromium Accumulation in Soils for Different Land Uses and Spatial Distribution of Chromium in Jiutai City of Jilin Province. J. Soil Water Conserv. 2006, 20, 36–39. (In Chinese) [Google Scholar]
  38. Xu, Z.; Liu, W.; Ding, R.; Wang, J. Perlite in Yingcheng Coal Mine, Jiutai: Characteristics, Formation and Reservoir Significance, Journal of Jilin University. Earth Sci. Ed. 2007, 37, 1139–1145. (In Chinese) [Google Scholar]
  39. Zhu, J.; Li, G.; You, B. Application of overlying strata damage theory in evaluation on foundation stability: Taking Yingcheng coal mine in Jiutai of Jilin as an example. World Geol. 2012, 31, 584–588. (In Chinese) [Google Scholar]
  40. Changchun Jiutai District Chorography Compilation Committee. Jiutai Yearbook; Fang Zhi Publishing House: Changchun, China, 2021. [Google Scholar]
  41. Sabouhi, M.; Ali-Taleshi, M.S.; Bourliva, A.; Nejadkoorki, F.; Squizzato, S. Insights into the anthropogenic load and occupational health risk of heavy metals in floor dust of selected workplaces in an industrial city of Iran. Sci. Total Environ. 2020, 744, 140762. [Google Scholar] [CrossRef]
  42. Meng, X.X.; Li, S.Z. Background Value of Soil Elements in Jilin Province; Science Press: Beijing, China, 1995; p. 64. (In Chinese) [Google Scholar]
  43. Maanan, M.; Saddik, M.; Maanan, M.; Chaibi, M.; Assobhei, O.; Zourarah, B. Environmental and ecological risk assessment of heavy metals in sediments of Nador lagoon, Morocco. Ecol. Indic. 2015, 48, 616–626. [Google Scholar] [CrossRef]
  44. Xu, Z.; Ni, S.; Tuo, X.; Zhang, C. Calculation of Heavy Metals’ Toxicity Coefficient in the Evaluation of Potential Ecological Risk Index. Environ. Sci. Technol. 2008, 31, 112–115. (In Chinese) [Google Scholar]
  45. Means, B. Risk-Assessment Guidance for Superfund Volume 1: Human Health Evaluation Manual (Part A); EPA-540/1-89/002; Environmental Protection Agency: Washington, DC, USA, 1989.
  46. Ying, L.; Shaogang, L.; Xiaoyang, C. Assessment of heavy metal pollution and human health risk in urban soils of a coal mining city in East China. Hum. Ecol. Risk Assess. Int. J. 2016, 22, 1359–1374. [Google Scholar] [CrossRef]
  47. Du, Y.; Gao, B.; Zhou, H.; Ju, X.; Hao, H.; Yin, S. Health Risk Assessment of Heavy Metals in Road Dusts in Urban Parks of Beijing, China. Procedia Environ. Sci. 2013, 18, 299–309. [Google Scholar] [CrossRef] [Green Version]
  48. Vilavert, L.; Nadal, M.; Schuhmacher, M.; Domingo, J.L. Concentrations of Metals in Soils in the Neighborhood of a Hazardous Waste Incinerator: Assessment of the Temporal Trends. Biol. Trace Element Res. 2012, 149, 435–442. [Google Scholar] [CrossRef] [PubMed]
  49. Hassett-Sipple, B.; Swartout, J.; Mahaffey, K.R.; Rice, G.E.; Schoeny, R. Mercury Study Report to Congress: Health Effects of Mercury and Mercury Com-Pounds; US EPA EPA-452/R-97-007; Environmental Protection Agency: Washington, DC, USA, 1997.
  50. US EPA. Supplemental Guidance for Developing Soil Screeninglevels for Superfund Sites; Offlice of Soild Waste and Emergency Response: Washington, DC, USA, 2001; pp. 4–24.
  51. Wang, S.; Luo, K.; Wang, X.; Sun, Y. Estimate of sulfur, arsenic, mercury, fluorine emissions due to spontaneous combustion of coal gangue: An important part of Chinese emission inventories. Environ. Pollut. 2016, 209, 107–113. [Google Scholar] [CrossRef] [PubMed]
  52. Liang, Y.; Liang, H.; Zhu, S. Mercury emission from spontaneously ignited coal gangue hill in Wuda coalfield, Inner Mongolia, China. Fuel 2016, 182, 525–530. [Google Scholar] [CrossRef]
  53. Wei, Q.; Chen, W.; Jin, L. Health risk assessment and source analysis of heavy metal elements in PM2.5 in Zaozhuang city. China Powder Sci. Technol. 2020, 26, 69–78. (In Chinese) [Google Scholar]
  54. Yang, Y.; Liu, S.; Yang, Y.; Li, L.; Liu, S.; Kang, Y.; Fei, X.; Gao, Y.; Gao, B. Heavy metals in peri-urban soil of Huangshi: Their distribution, risk assessment and source identification. Geophys. Geochem. Explor. 2021, 45, 1147–1156. (In Chinese) [Google Scholar]
  55. Zheng, L.; Liu, G.; Wang, L.; Chou, C.-L. Composition and quality of coals in the Huaibei Coalfield, Anhui, China. J. Geochem. Explor. 2008, 97, 59–68. [Google Scholar] [CrossRef]
  56. Tian, L. The status and evaluation of environment in the Xiaoyi city of Shanxi province. Shanxi Archit. 2011, 37, 179–180. (In Chinese) [Google Scholar]
  57. Xie, Y.; Tang, W. Investigation & Assessment for Heavy metal in Soil of Fushun Typical Areas. Environ. Sci. Manag. 2009, 34, 38–40+78. (In Chinese) [Google Scholar]
  58. Kim, K.-H.; Kim, M.-Y. The effects of anthropogenic sources on temporal distribution characteristics of total gaseous mercury in Korea. Atmos. Environ. 2000, 34, 3337–3347. [Google Scholar] [CrossRef]
  59. Leonard, T.L.; Taylor, G.E., Jr.; Gustin, M.S.; Fernandez, G.C. Mercury and plants in contaminated soils: 1. Uptake, partitioning, and emission to the atmosphere. Environ. Toxicol. Chem. 1998, 17, 2063–2071. [Google Scholar] [CrossRef]
  60. Lei, L.; Yu, D.; Chen, Y.; Song, W.; Liang, D.; Wang, Z. Spatial distribution and sources of heavy metals in soils of Jinghui Irrigated Area of Shaanxi, China. Trans. Chin. Soc. Agric. Eng. 2014, 30, 88–96. (In Chinese) [Google Scholar]
  61. Lin, C.-J.; Pehkonen, S. The chemistry of atmospheric mercury: A review. Atmos. Environ. 1999, 33, 2067–2079. [Google Scholar] [CrossRef]
  62. Manta, D.S.; Angelone, M.; Bellanca, A.; Neri, R.; Sprovieri, M. Heavy metals in urban soils: A case study from the city of Palermo (Sicily), Italy. Sci. Total Environ. 2002, 300, 229–243. [Google Scholar] [CrossRef] [PubMed]
  63. Li, K.; Gu, Y.; Li, M.; Zhao, L.; Ding, J.; Lun, Z.; Tian, W. Spatial analysis, source identification and risk assessment of heavy metals in a coal mining area in Henan, Central China. Int. Biodeterior. Biodegrad. 2018, 128, 148–154. [Google Scholar] [CrossRef]
  64. Xu, Y.; Lu, F.; Dong, L.; Yang, J.; Nai, C.; Liu, Y. Human health effects of heavy metals around an incineration plant through multi-media exposure. Acta Sci. Circumst. 2016, 36, 3464–3471. (In Chinese) [Google Scholar]
  65. Liu, X.; Zheng, L.; Chen, X.; Yang, T.; Chen, Y.; Cheng, H. Study on the heavy metal pollution characteristics of agricultural soiland their accumulation characteristics in wheat in Panji mining area, Huainan. Environ. Pollut. Prevention. 2019, 41, 959–964. (In Chinese) [Google Scholar]
Figure 1. Study area and sampling points.
Sustainability 14 10366 g001
Figure 2. Box chart of the mercury content levels in the four regions.
Sustainability 14 10366 g002
Figure 3. Spatial distribution of soil mercury concentration (mg·kg−1).
Sustainability 14 10366 g003
Figure 4. Distribution map of the atmospheric mercury content at: (a) 0 cm; (b) 100 cm.
Sustainability 14 10366 g004
Figure 5. Scatter plot of atmospheric mercury concentration and soil mercury concentration.
Sustainability 14 10366 g005
Figure 6. Box chart of the mercury content levels in the different wind directions.
Sustainability 14 10366 g006
Figure 7. Sources and locations of environmental elemental mercury in urban production and life in typical mining area.
Sustainability 14 10366 g007
Figure 8. Descending chart of the Igeo.
Sustainability 14 10366 g008
Figure 9. Characteristic distribution of soil mercury pollution: (a) distribution of the soil mercury Igeo in Jiutai District; (b) distribution of the soil mercury Er in Jiutai District.
Sustainability 14 10366 g009
Figure 10. Schematic diagram of human mercury exposure pathways.
Sustainability 14 10366 g010
Figure 11. Radar map of soil mercury non-carcinogenic risk levels for three exposure pathways.
Sustainability 14 10366 g011
Table 1. The classification of the Igeo.
Geo-Accumulation Index (Igeo)GradingDegree of Contamination
5 < Igeo ≤ 106Extremely strong
4 < Igeo ≤ 55Strong/extremely strong
3 < Igeo ≤ 44Strong
2 < Igeo ≤ 33Medium-strong
1 < Igeo ≤ 22Medium
0 < Igeo ≤ 11Slight/medium
Igeo ≤ 00Non-pollution
Table 2. Criteria for potential ecological risk analysis.
Er<4040–8080–160160–320>320
Potential Ecological Risk IndexSlightMediumStrongVery strongExtremely strong
Table 3. Soil mercury levels in different regions.
RegionNumber of Soil Samples (n)Average
(mg·kg−1)
Range (mg·kg−1)Standard Deviation
(mg·kg−1)
Coefficient of Variation
(%)
Southeast180.03580.0142–0.1250.02660.742
Northeast290.08370.00940–0.5220.1031.23
Southwest260.03770.00720–0.1230.02600.690
Northwest270.02890.00810–0.07040.01560.539
All Regions1000.04840.00720–0.5220.06331.30
Table 4. Soil mercury content in urban areas of different coal mining towns.
TownRange (mg·kg−1)Average
(mg·kg−1)
Background
(mg·kg−1)
Maximum Coal Yield (Mt·a−1)Operating TimeReference
Zaozhuang-0.0400.0101.921880–now[53]
Huangshi (Yuancang Coal Mine)0.012~1.8230.1370.0410.6001949–2014[54]
Huaibei (Daihe Coal Mine)0.008~0.1540.0670.0141.401965–2017[55]
Xiaoyi (Gaoyang Coal Mine)0.073~0.1000.0870.0256.001965–now[56]
Fushun (Longfeng Coal Mine)N.D~0.6460.1020.0371.021907–1999[57]
Jiutai District (Yingcheng Coal Mine)0.007~0.5220.0480.0401.971880–2001This study
Rohini OCP, NK Area, India-0.0900.0503.002007–now[17]
Pszczyna County, Poland0.020~0.4600.0700.0102.001792–now[29]
Ostrava, Czech Republic0.080~1.310-0.0709.001830–now[30]
Publisher’s Note: MDPI stays neutral with regard to jurisdictional claims in published maps and institutional affiliations.

