Article

Study on Influence Law of Key Factors of New Composite Slurry Spraying Technology

1
Xuzhou CUMT Backfill Technology Co., Ltd., Xuzhou 221008, China
2
Coal Mine of Jingyuan Coal Power Co., Ltd., Baiyin 730699, China
3
Honghui No. 1 Coal Mine of Jingyuan Coal Power Co., Ltd., Baiyin 730699, China
4
School of Mines, China University of Mining and Technology, Xuzhou 221116, China
*
Author to whom correspondence should be addressed.
Sustainability 2022, 14(16), 10297; https://doi.org/10.3390/su141610297
Submission received: 23 July 2022 / Revised: 10 August 2022 / Accepted: 17 August 2022 / Published: 18 August 2022
(This article belongs to the Special Issue Advanced Polymeric Materials for Sustainability and Innovations)

Abstract

:
In this paper, a new type of water pressure and air pressure composite slurry is proposed to ensure the safety of spraying. Firstly, the air tightness, bending resistance and viscosity of the spraying material were measured in the laboratory. Secondly, the two-fluid VOF model was used to analyze the influence laws of the spraying process, the spraying area formed on the wall, the thickness of the spraying layer and the pressure at the nozzle (or initial flow rate), the spraying distance, the spraying time, and the spraying direction. The research shows that (1) the new composite slurry spraying material made of clay:cement:additive:engineering fiber = 84:14:1.85:0.15 has suitable sealing and bending resistance and adhesion. (2) The smaller the spraying distance is, the larger the spraying area formed on the side wall in a short time, and the shape is regular, but the spraying area is relatively small. The spraying area increases with the increase in spraying distance, and the slurry thickness becomes thinner with the increase in spraying distance. (3) When the initial spraying speed is high, the shape of the spraying area is regular, the spraying thickness is large and the uniformity is suitable, but the shape and uniformity of the spraying area are related to the time when the slurry reaches the side wall. The longer the time when the slurry reaches the side wall, the greater the influence of gravity and surrounding fluid, and the more changes along the process. (4) When the spraying surface is at the top, the spraying process is significantly affected by gravity, and discontinuous spraying areas will be formed on the top surface. Especially when the initial spraying speed is low, the amount of slurry reaching the top surface fluctuates due to rebound and increases with the increase in the initial spraying speed.

1. Introduction

More than 90% of coal mines in China are facing the major threat of mine fire in the mining process. Among them, coal spontaneous combustion is the main disaster in the process of coal safety production, which usually occurs in the air leakage channel areas, such as goaf, open ditch, shutdown line, geological structure belt, etc. [1,2]. In addition, in many highly gassy mines, the development of coal pillar fractures will produce gas leakage channels between the roadway of the mining face and the adjacent goaf, which can easily cause the increase in gas concentration in the upper corner of the mining face or tunneling face, resulting in gas overrun, thus affecting the safety production of coal mines and increasing the difficulty of mine ventilation and gas prevention.
Leak-proof wind energy can effectively reduce the risk of coal spontaneous combustion. The existing methods of sealing and air leakage prevention include coating technology, reducing the pressure difference on both sides of the coal wall, and plugging the air leakage cracks with polyurethane foam and organic curing foam [3]. Spraying technology is widely used in air leakage prevention of coal mine roadways in China because of its small workload and high efficiency [3,4]. Spraying can reduce tunnel air leakage, prevent low-temperature oxidation of broken coal, and minimize coal spontaneous combustion in goaf and roadway caving area. Spraying coal pillars can prevent the development of coal wall cracks, weaken coal wall oxidation, and ensure regional safe mining. At present, the traditional methods of spraying to block air leakage in mines mainly include foaming resin spraying, concrete spraying, fly ash filling, etc. [4,5,6,7,8,9,10,11,12,13,14,15,16,17,18,19]. The foaming resins mainly include Rockwell and polyurethane, but their use process and operation process are cumbersome, and the purchase cost is high, so they are not suitable for large-area spraying operations. Concrete has good air leakage blocking ability and strong compression resistance, but the amount of dust produced in the spraying process is large, the rebound amount of paint is large, and the transportation cost of sand, cement, and other materials is high. The fly ash filling process often needs to arrange boreholes on the roadway side, so that the roadway has more cracks after filling, and the air leakage plugging effect is poor.
Therefore, in view of the shortcomings of traditional spraying technology and the characteristics of the short working period of the air inlet and return tunnels of Honghui No. 1 mine, the low support strength requirements, the fact that the mine is located in the loess hilly area, and the many clays around it, we propose a new type of composite spraying slurry with clay as the main base material, which uses water pressure and wind pressure to ensure the intrinsic safety, and we use numerical simulation to study the influence law of the key factors of this material.

2. Performance Analysis of New Composite Spraying Slurry

Clay is the main component of composite paste materials, which are used to improve the plastic strength of materials. Cement can improve the stone rate and compressive strength of composite paste materials. The functions of the additives are (1) to increase the suspension of the slurry and make the clay and cement particles easy to transport in the pipeline; (2) increase the viscosity of the slurry; (3) shorten the initial setting time of slurry; and (4) make the composite slurry material penetrate into the cracks and pores to a greater extent, block the pores, and improve the density and strength of the material. The purpose of adding a small amount of glass fiber is to prevent the slurry from solidifying, cracking, and deforming; to play the role of reinforcement, so that the slurry can be cemented and fused; and to enhance the wind insulation effect.
With clay as the main material, a small proportion of cement and engineering fiber is added to increase the toughness of the material. According to the performance requirements such as density, viscosity, water separation rate, and compressive strength, through an orthogonal test, downhole spraying test, and repeated comparison of wind insulation effect, the mass ratio of composite slurry material is finally determined as clay:cement:additive:engineering fiber = 84:14:1.85:0.15.
Compared with the traditional cement mortar spraying technology, the main material of the spraying material is changed from cement to clay, and the air tightness, bending resistance, and viscosity of the material are tested in combination with the air leakage blocking of the tunnel wall.
(1) Air tightness analysis of slurry materials.
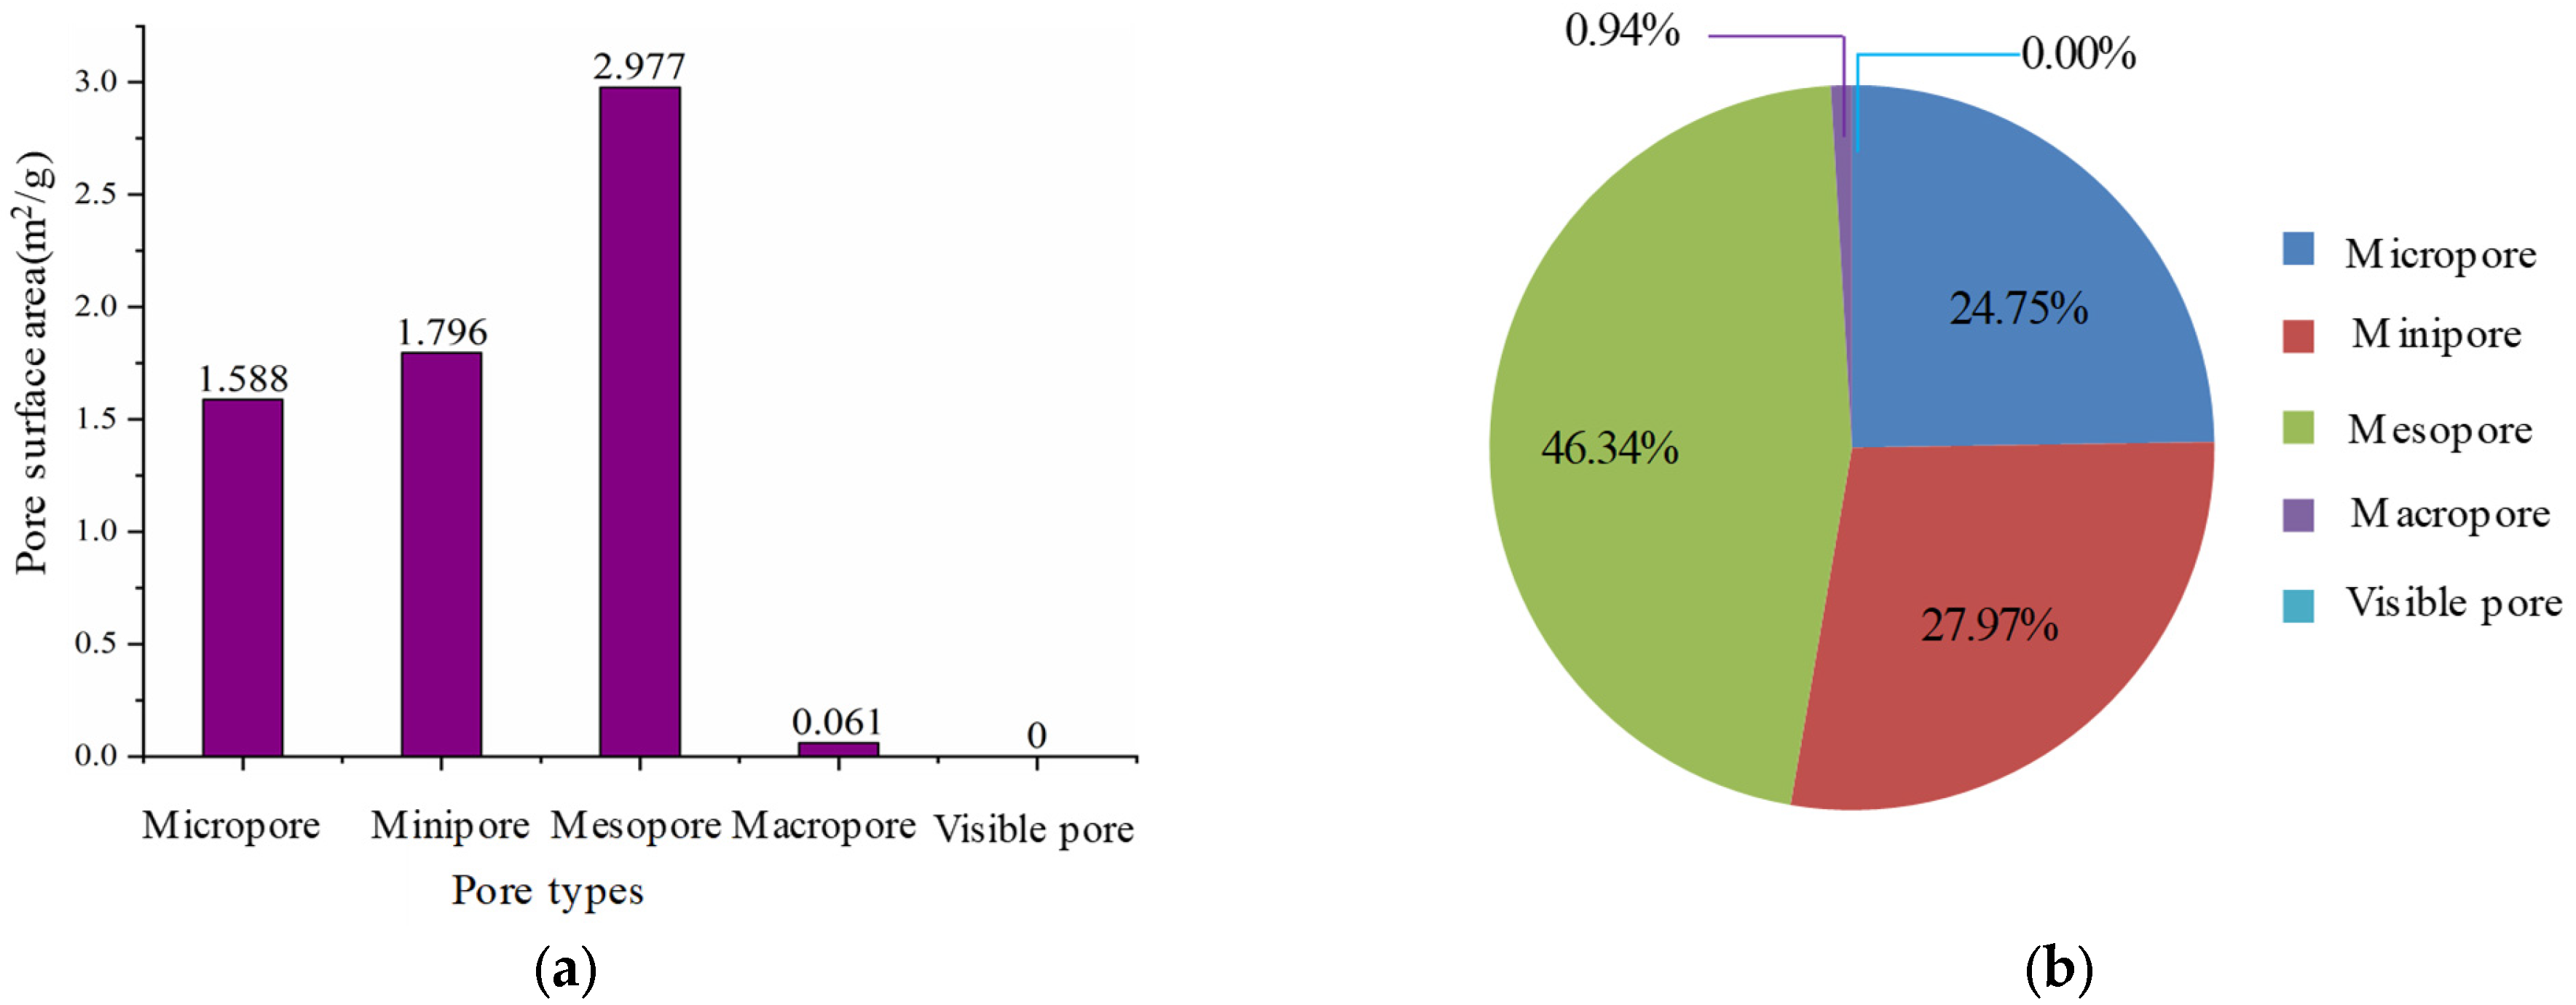
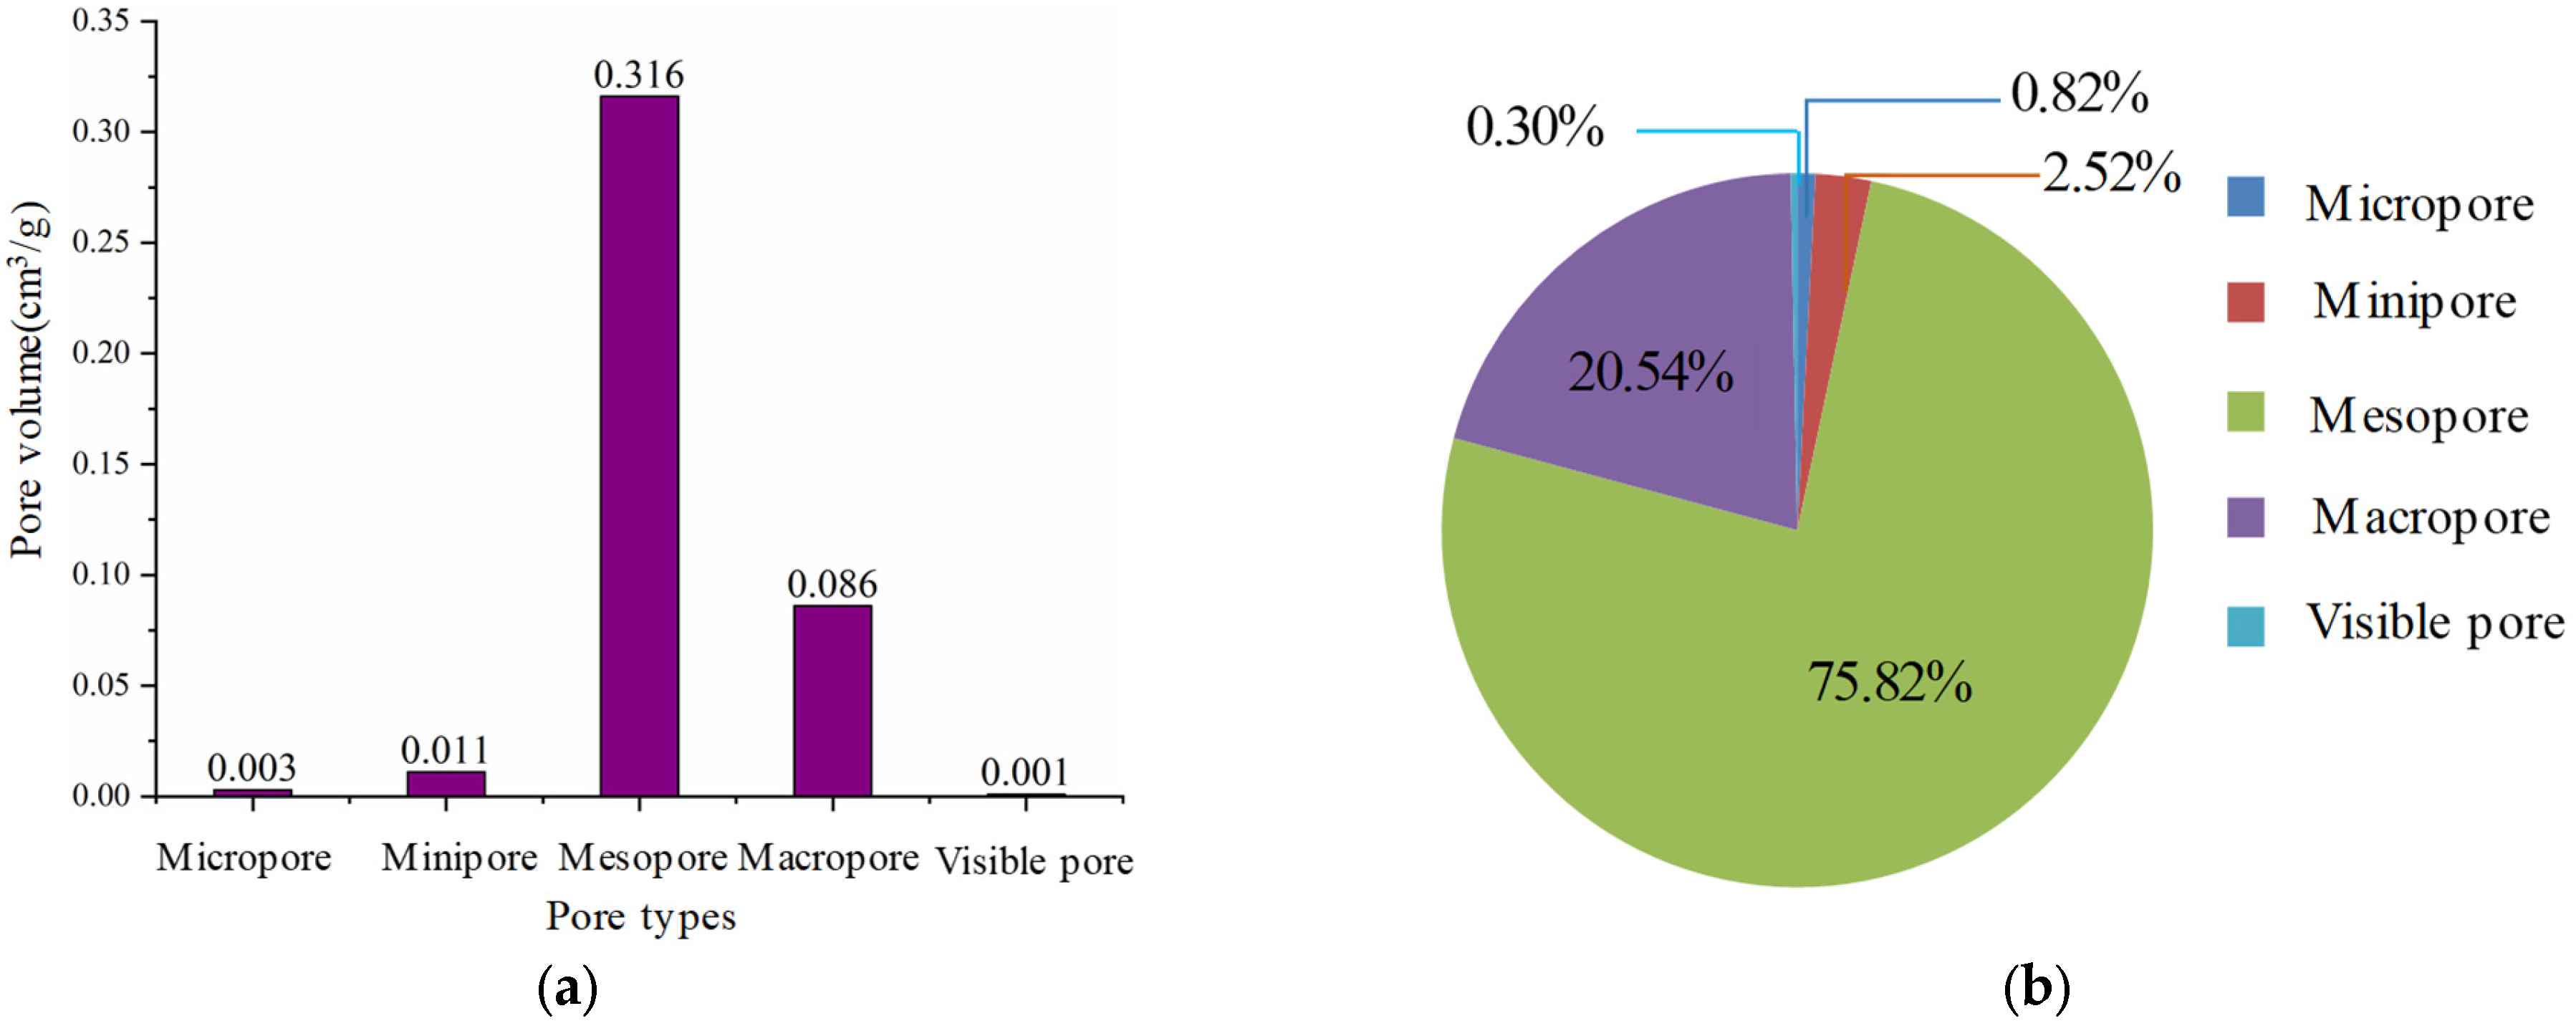
Through the analysis of experimental data, the distribution of pore surface area of different types of slurry materials is shown in Figure 1a,b and the distribution of pore volume of different types is shown in Figure 2a,b. The internal pore structure of the slurry material was analyzed by a mercury intrusion experiment, and the porosity of the slurry was 32.71%. The sum of the surface areas of micropores, pores, and mesopores accounts for 99.06% of the total surface area of pore structure, and the sum of their volumes accounts for 79.16% of the total pore volume.
Micro cracks are characterized by development and change, from micropore to mesopore (pore size ≤1.0 × 10⁻³ mm), and account for the majority of slurry materials, more than 80%. Coarse, large pores and cracks are not developed, and the actual proportion is relatively small.
It can be seen from the above conclusions that the selected slurry material has dense structure and good air tightness. The static pressure difference on both sides of the narrow coal pillar of the coal mine tunneling roadway is generally less than 500 pa, and the selected slurry material can basically block the airflow flow and prevent the gas emission from the adjacent goaf.
(2) Analysis of bending resistance of slurry.
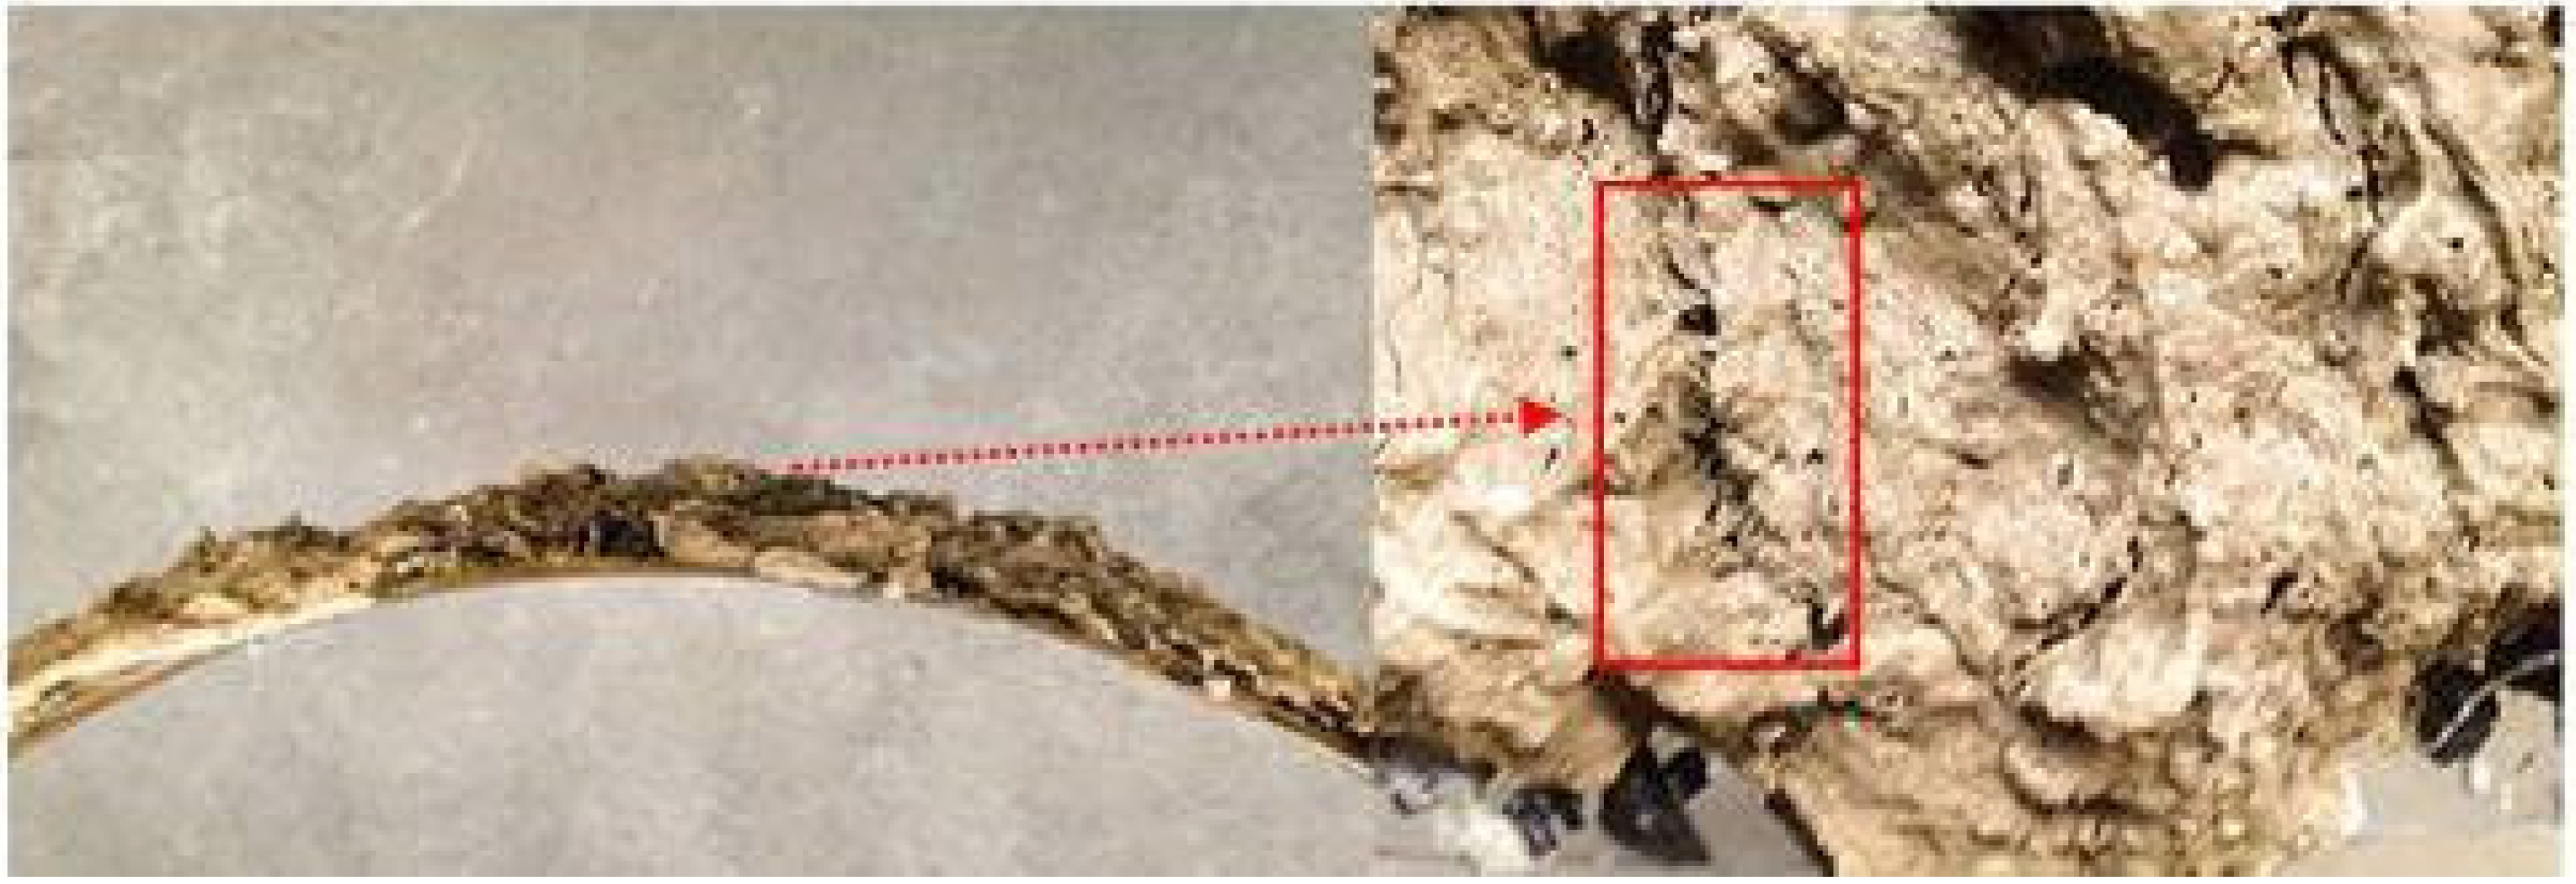
At 15 cm × on the 40 cm acrylic plate, use strong glue to stick the crushed coal with different particle sizes, and let it stand for one day to obtain an experimental wall similar to the roadway wall, as shown in Figure 3a. Spray the slurry material on the experimental wall of the obtained roadway and let it stand for 15 days, as shown in Figure 3b. Conduct a bending test on the sprayed material, as shown in Figure 4. When there are obvious cracks on the sprayed coating surface (as shown in Figure 5), stop the bending test. When there are obvious cracks, the arc length of the plate surface is 40 cm and the angle is 70°, and the bending radius r = 32.75 cm can be calculated. The curvature of the experimental plate isρ = 1/r = 0.0305 = 3.05%, the highest point of the arc is offset by 5.92 cm relative to that before bending, and the relative offset rate is ε = 5.92/40 = 14.81%.
It can be seen from the experimental results that after the deformation of the underground roadway, the local area will produce bending deformation. When the bending curvature reaches about 3.05%, or the ratio of the distance between the starting point of the local area relative to the initial wall surface of the roadway and the horizontal distance of the overall deformation area is close to 14.81%, the spraying material is obviously cracked, which may produce gas emission channels.
(3) Slurry viscosity analysis.
At room temperature, an MCR102 rheometer is used to measure the viscosity of the wetted slurry (after mixing with water in proportion).
Based on different proportions of water, the shear frequency is 60 s–1. Five groups are measured, three times for each group, and the average value is taken. See Table 1 for the measurement data. It can be seen from Table 1 that the viscosity of slurry materials decreases with the increase in the proportion of water.

3. Study on the Influence Law of Key Factors of Spraying Effect

3.1. Two-Fluid Model Selection

The slurry spraying process can be regarded as a typical two-phase flow process: both the composite slurry and the surrounding air are regarded as fluids. In this paper, the VOF model in the two-fluid Eulerian simulation scheme is used to simulate the whole process of slurry spraying. The focus of the VOF model is to deal with non-interpenetrating multiphase flow, which can accurately track the gas and liquid interface.

3.2. Physical Model Establishment

In view of the spraying effect of the slurry, in order to focus on the spraying process of the slurry, the local roadway is intercepted as the research object, with a length of 3 m, a width of 4 m, and a distance of 4 m from the vault to the ground. Combined with the actual situation, the following physical model is simplified: the roadway is full of air, and there is about 1.5 m/s air velocity on the cross section in the horizontal direction (along the X axis). The spray gun is vertical to the air flow direction, placed horizontally, a certain distance from the side wall of the roadway (2.0, 1.5, 1.0 and 0.5 m); the diameter of the spray gun is about 0.03 m, and the length is 0.5 m. The slurry is sprayed by the spray gun and flows rapidly to the side wall. After reaching the side wall, it spreads out on the side wall. The numerical calculation of the spray process studied in this chapter does not consider the heat transfer between air and slurry; that is, the related flow problems are studied under cold conditions. Figure 6a shows the simplified physical model diagram. The grid adopts a structured grid and carries out grid opposition verification, as shown in Figure 6b.

3.3. Calculation Conditions and Parameters

In order to improve the accuracy of simulation results as much as possible, a numerical simulation platform was established according to the conditions close to the actual working conditions. In order to focus on the characteristics of slurry spraying process, the following simplifications were made to the actual situation: (a) the slurry is a non-Newtonian fluid; (b) calculate the flow phenomenon under normal temperature and pressure, and the nearby gas is regarded as an incompressible continuous phase; (c) relevant heat transfer effects are not considered. Table 2 gives the basic numerical calculation conditions of this paper.

3.4. Simulation Research and Result Analysis of Spraying Process

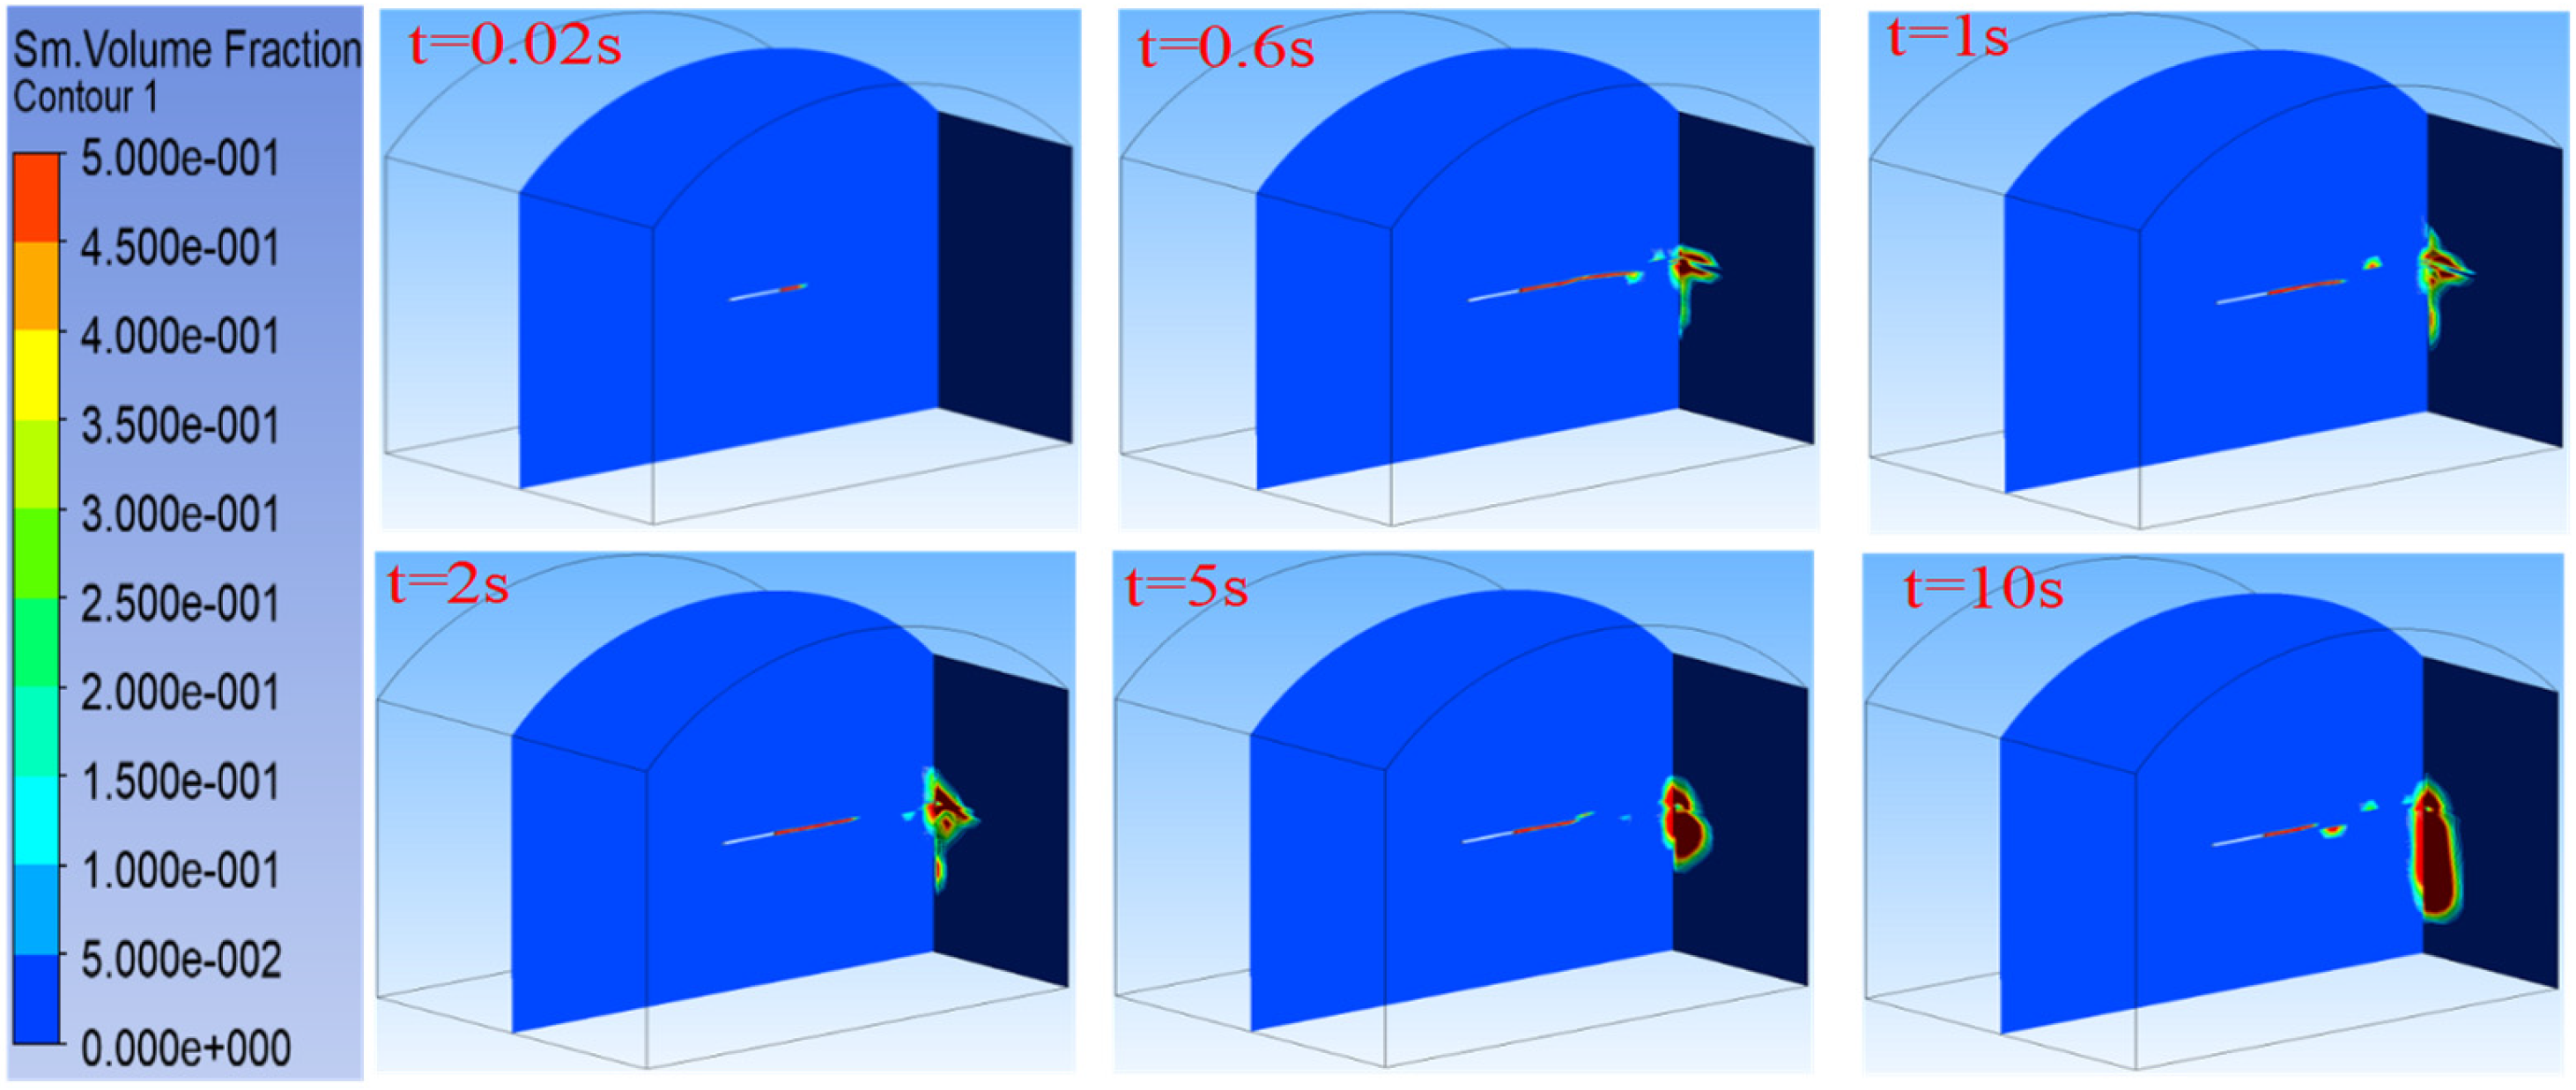
Figure 7 shows the details of the slurry spraying process. It can be seen from Figure 7 that the slurry is sprayed by the spray gun under pressure and directly sprayed to the side wall in the form of jet. In the process of flowing to the side wall, due to the obstruction of the surrounding air flow, the velocity of the front end of the jet gradually decreases, the jet surface gradually increases, and the spraying area slightly decreases under the action of gravity, see t = 0.6 s.
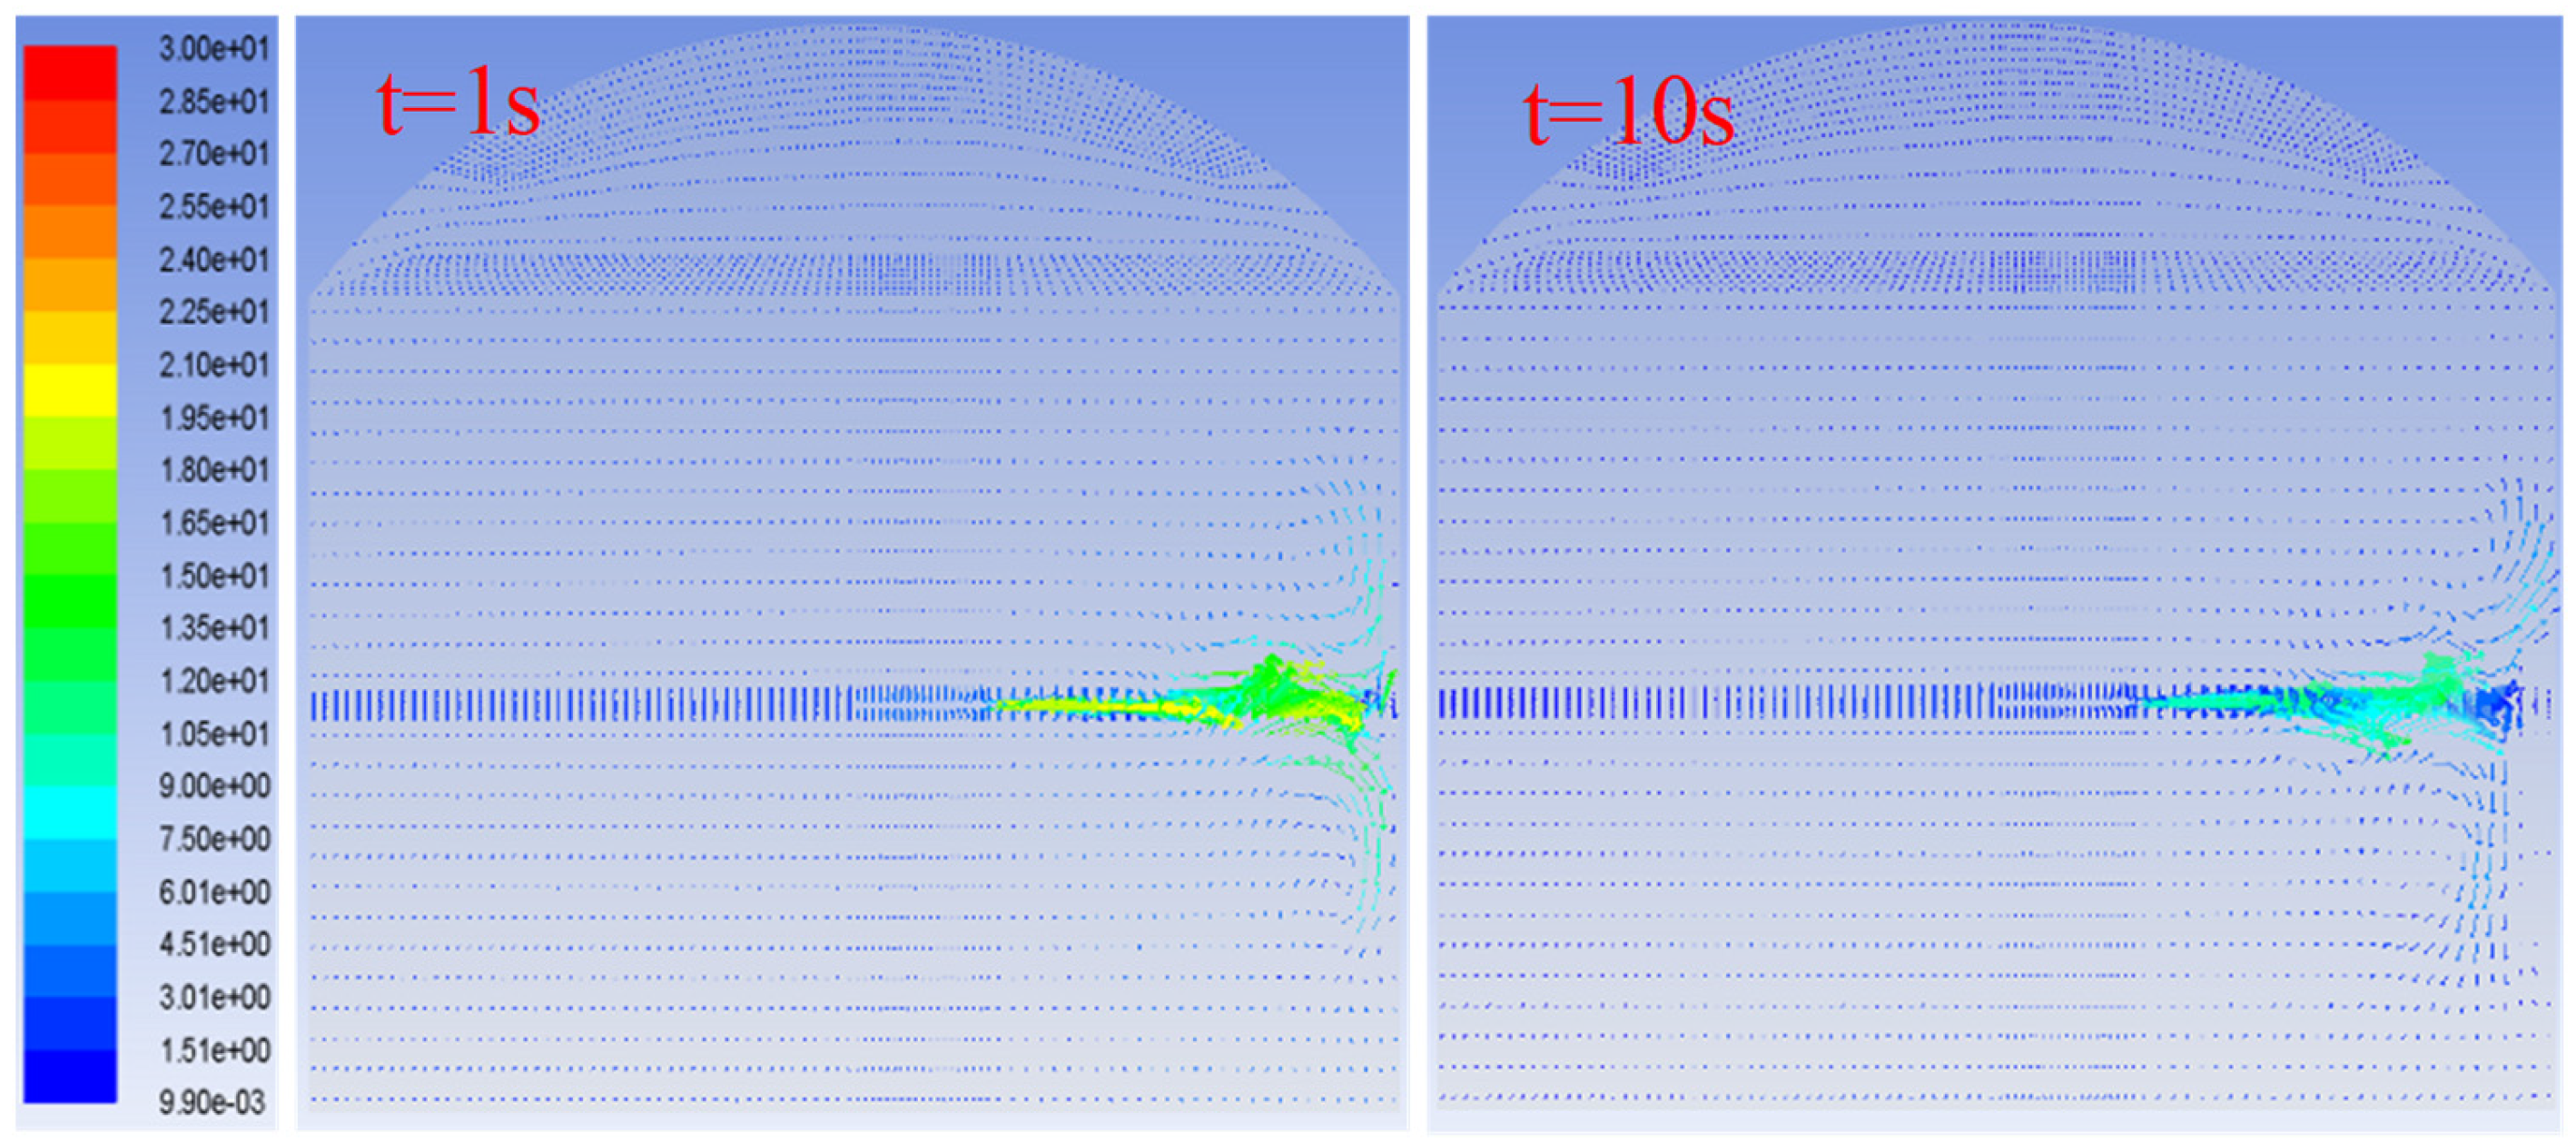
The front end of the jet gradually increases in the process of advancing, and while diffusing around, it also sucks the surrounding air flow, as shown in Figure 8, until it reaches the side wall and spreads out on the side wall. As the spraying process proceeds, more slurry reaches the side wall and spreads around the side wall, and the diffusion area gradually increases, as shown in Figure 7. In the process of spraying to the side wall, a small amount of slurry will escape from the mainstream, see t = 0.6 s, but under the action of inertia, it will also flow to the side wall and adhere to the side wall, forming a smaller spraying area, which is relatively independent of the spraying area formed by the mainstream on the side wall. Therefore, on the whole, the spraying surface formed on the side wall is not always uniform, see t = 2.0 s. However, with the progress of the spraying process, the slurry that subsequently reaches the side wall can make up for the discontinuity of the spraying area and form a relatively uniform spraying area, see t = 5.0 s. As time goes on, the slurry adhered to the wall will develop downward under the action of gravity, so that the spraying area will extend downward, see t = 10.0 s.
In addition, the spraying area on the side wall is not a regular circle. When the front end of the jet of the slurry contacts the side wall, each part of it has different momentum, so it has different initial velocities when diffusing on the side wall. Under the adhesion of the wall, the distance of the slurry dispersed in different directions is also different. Thus, diffusion regions of different specifications are formed on the side wall.
From the above analysis, it can be seen that the slurry spraying process and the spraying area formed on the wall are related to many factors, including the pressure at the nozzle (or the initial flow rate), the spraying distance, the spraying time, the spraying direction, and the characteristics of the slurry itself. We next analyze the influence on the spraying process and spraying area from several main factors.
(1) Influence of spraying distance.
Spraying distance is an important parameter in the actual spraying operation process, which is directly related to the spraying effect, spraying time, and efficiency. Later, taking a horizontal spraying as an example, the spraying process under different spraying distances and its influence on the spraying effect are studied. The distance between the horizontal nozzle outlet and the spraying wall is 0.5 m, 1.0 m, 1.5 m, and 2.0 m respectively.
(1) Spraying process.
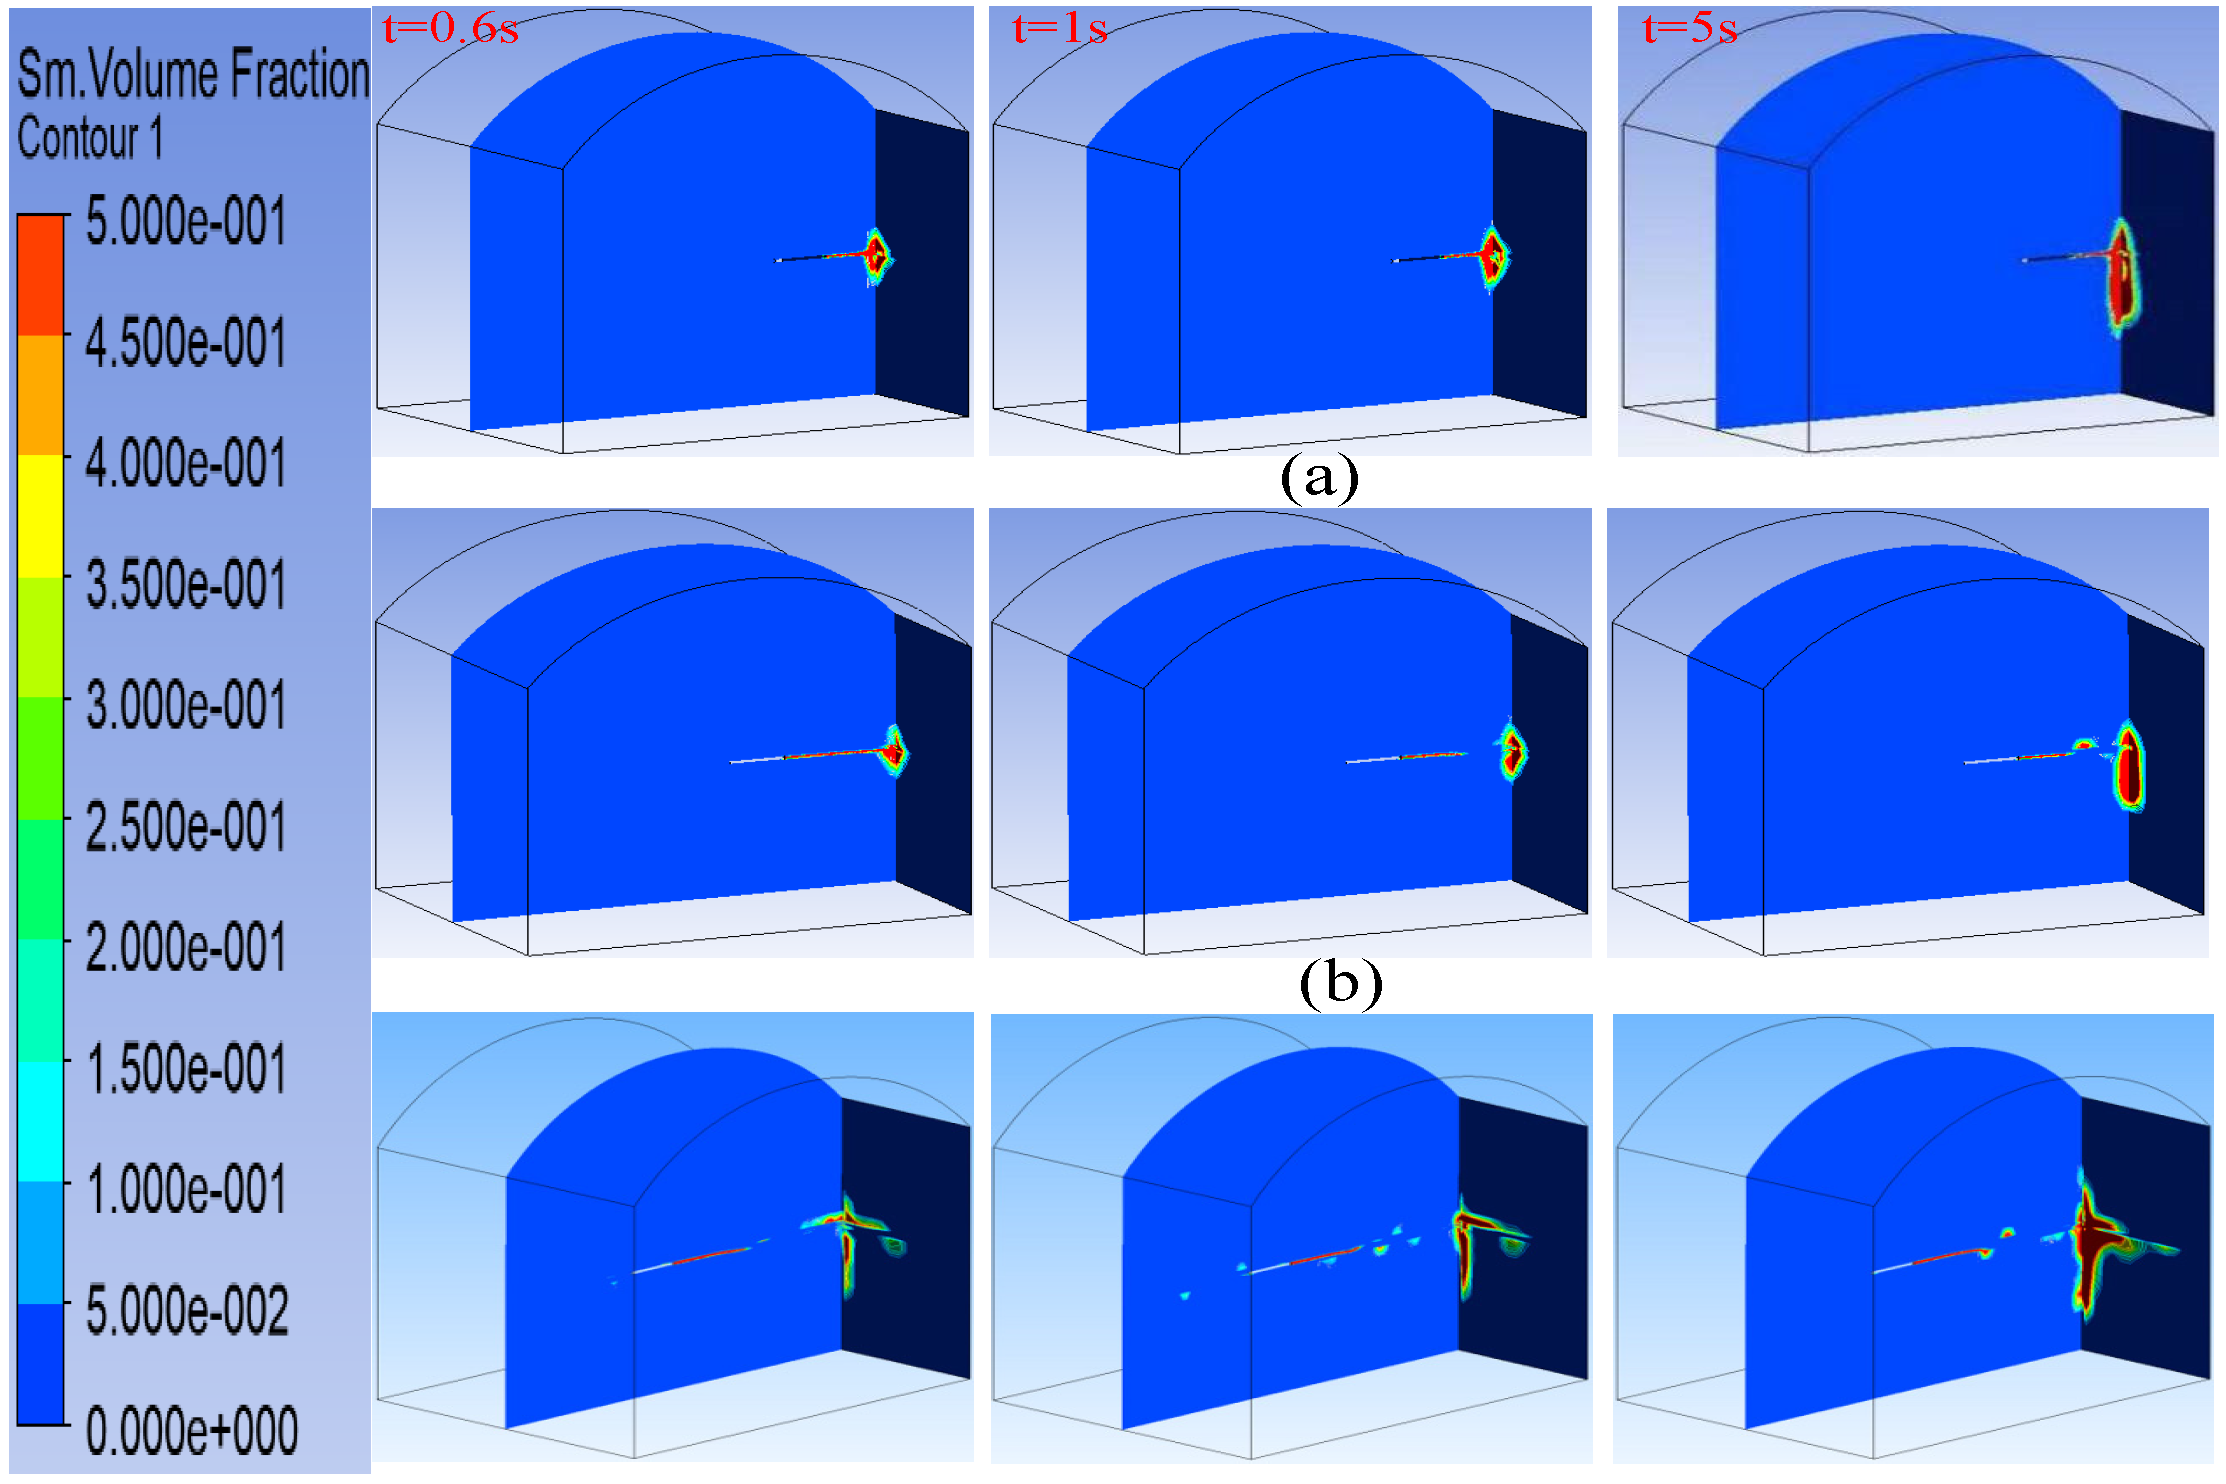
It can be seen from Figure 9 that the spraying distance has a direct impact on the spraying process, the spraying area formed by the slurry on the wall, and the spraying thickness. When the spraying distance is 0.5 m, because the nozzle is close to the spraying wall, the slurry can reach the spraying wall quickly and spread rapidly, and the spraying area is nearly round and relatively regular. In contrast, when the spraying distance is far, such as 2.0 m, it takes longer for the slurry to reach the spraying wall. In the process of spraying towards the wall, the slurry keeps developing and changing, such as the velocity attenuation and volume increase at the front end, the downward inclination caused by gravity, and part of the slurry departs from the mainstream. The larger the spraying distance is, the more the slurry changes before reaching the wall. Therefore, when the slurry reaches the spraying surface, the spraying area formed on the wall becomes more complex, as shown in Figure 9c. When the spraying distance is small, more slurry reaches the side wall in a short time, and the slurry thickness is relatively large. As it takes time for the slurry to solidify, the thicker slurry will flow slowly downward under the action of gravity, so that the spraying area will expand significantly downward.
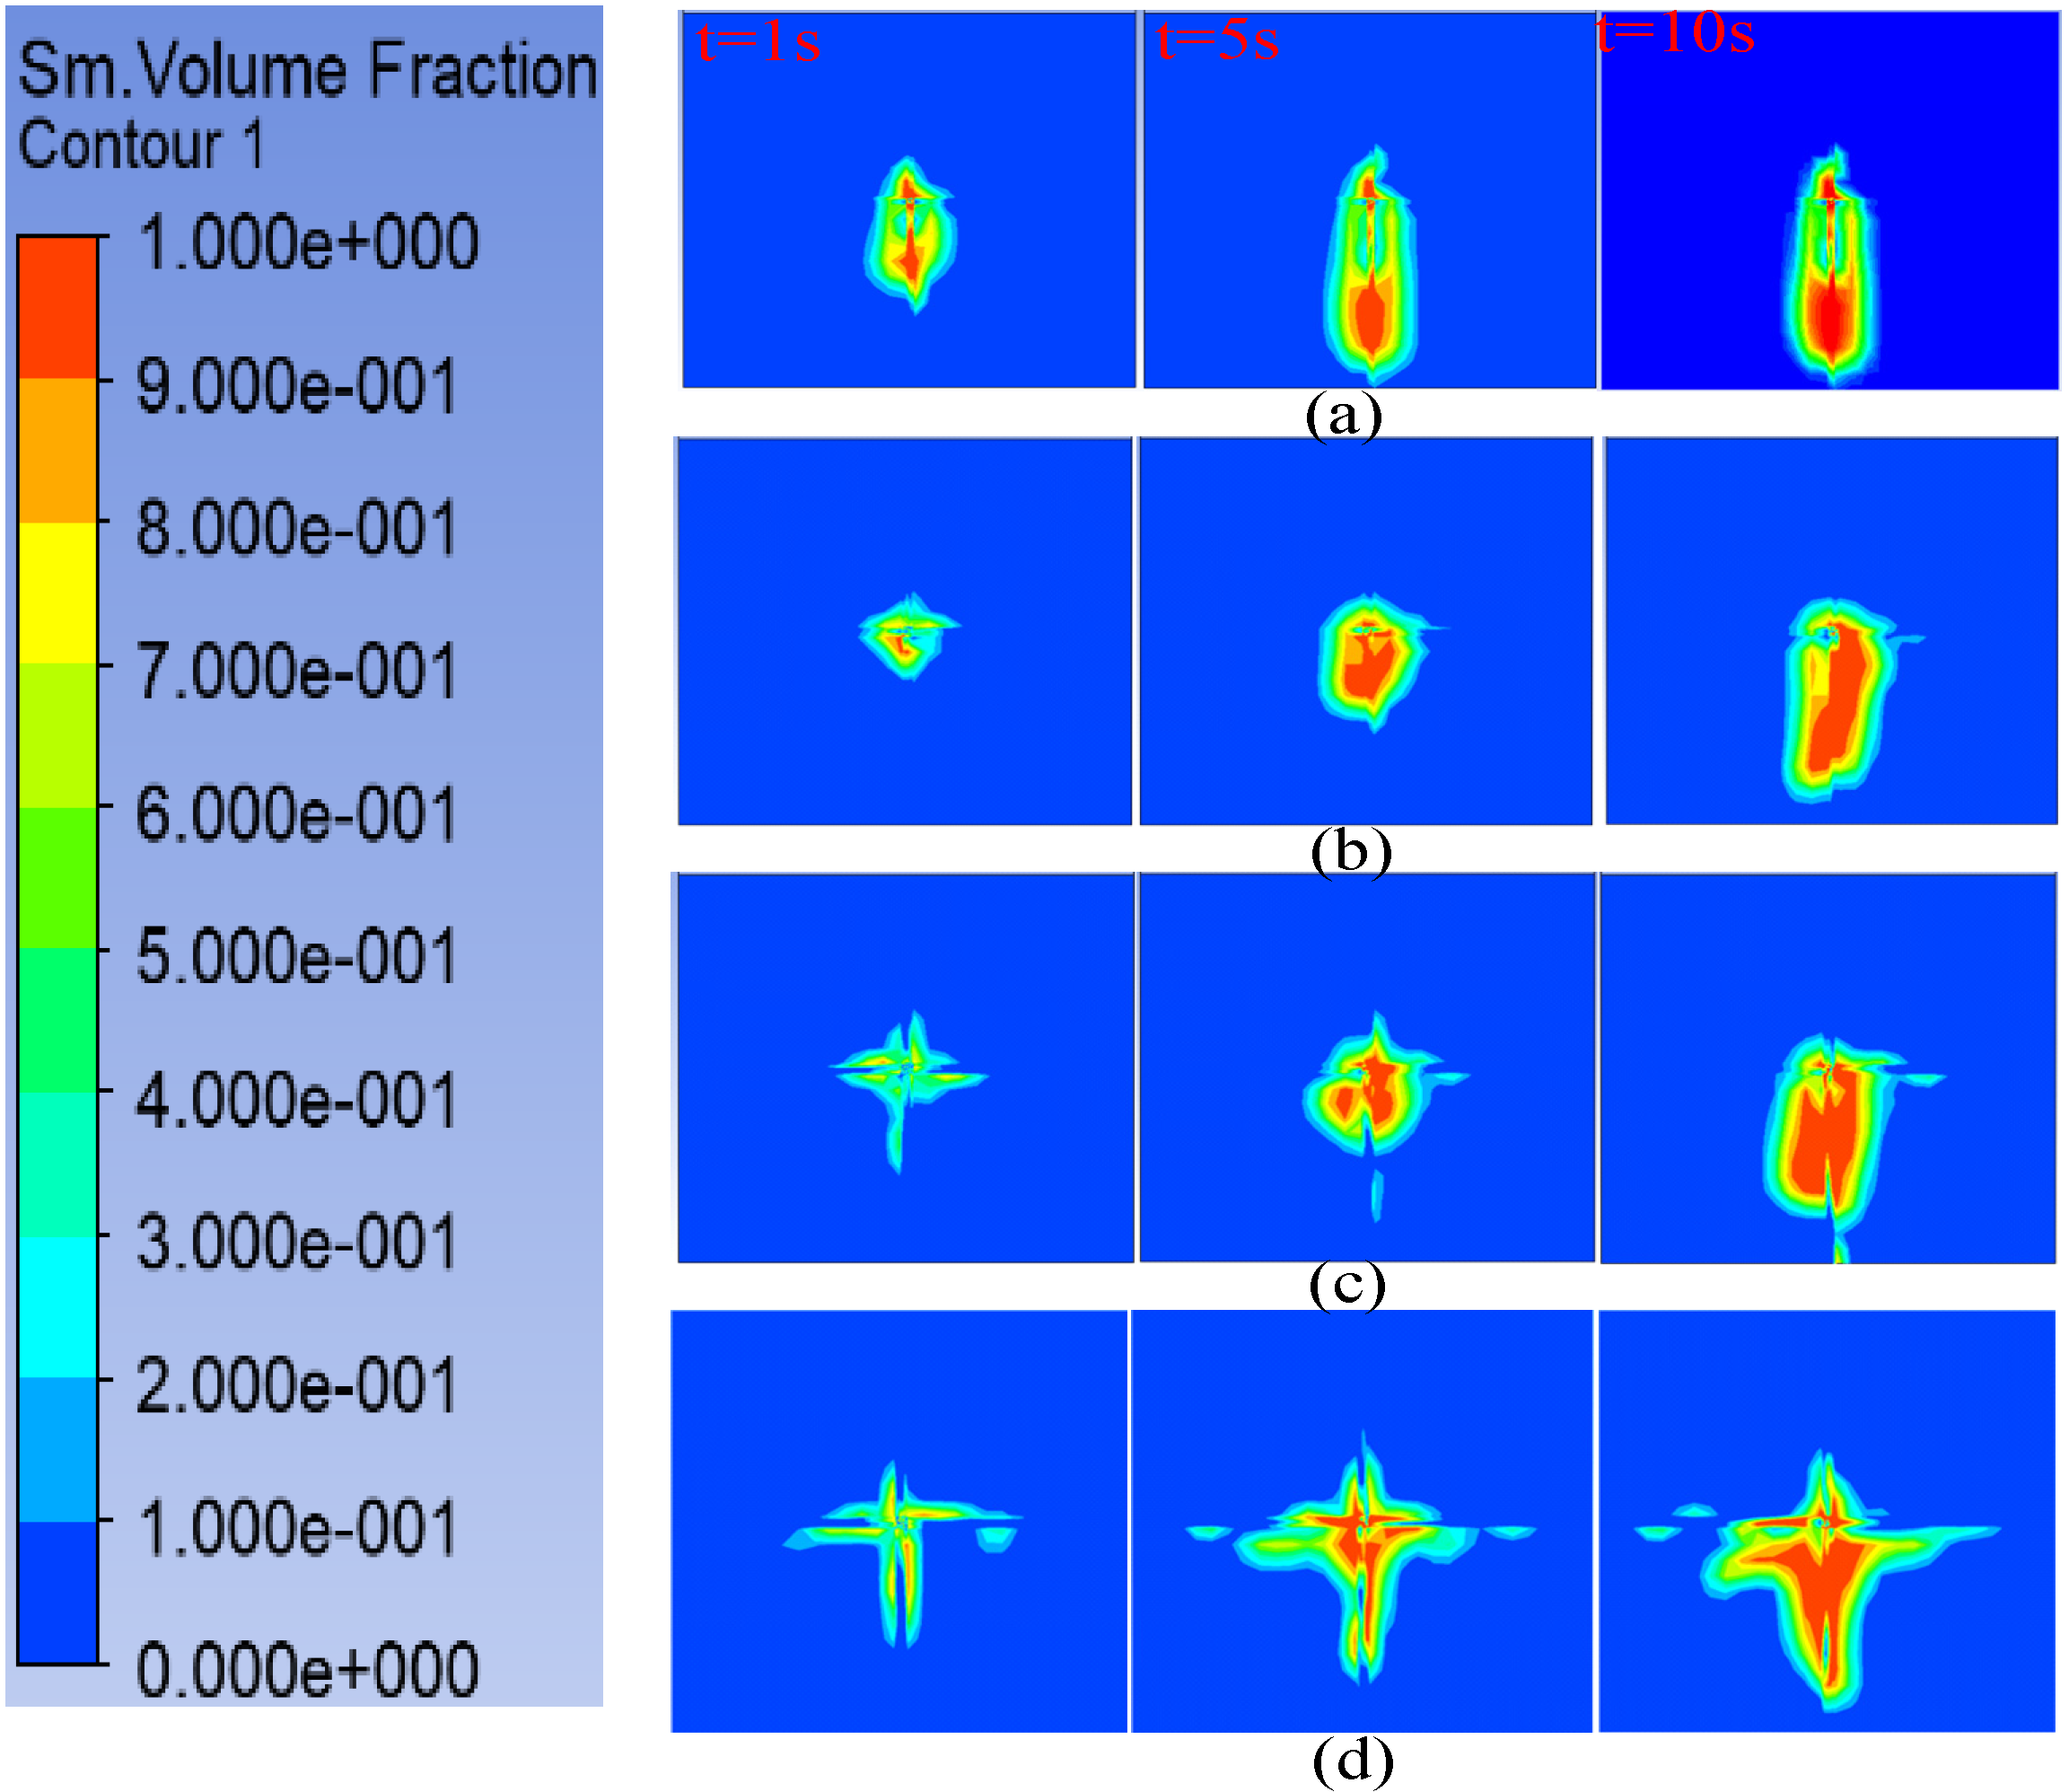
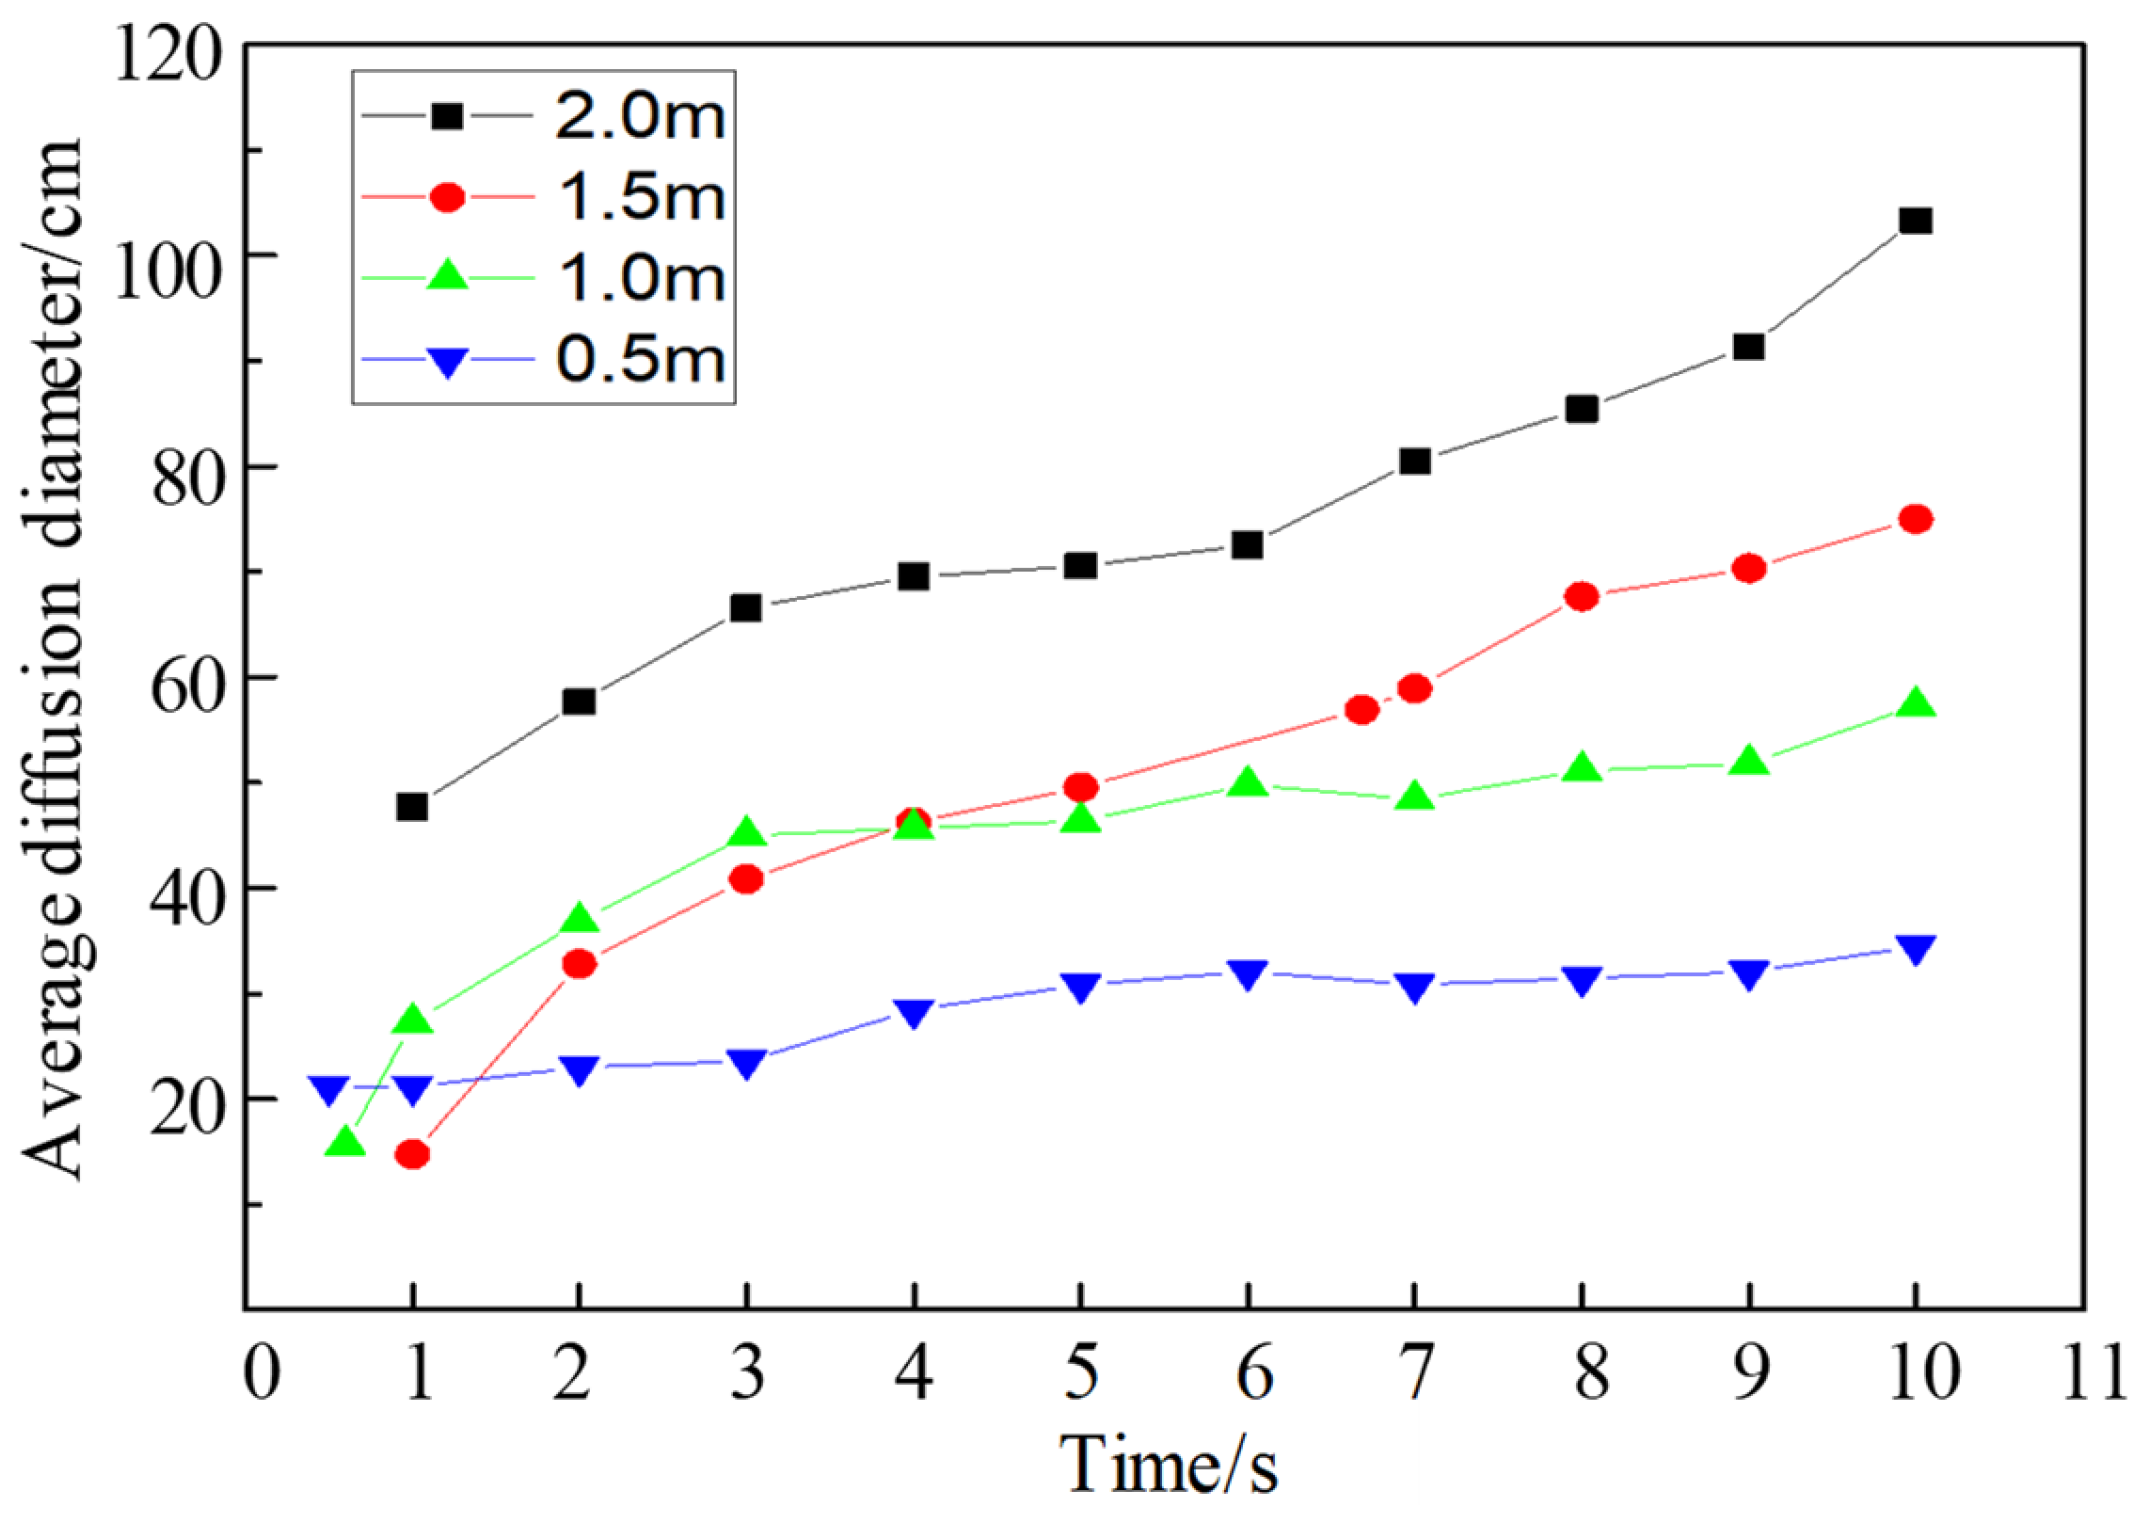
Taking the content product share of the spraying area as the limit, the average diameter of the spraying area under different spraying distances is counted, and the results are shown in Figure 10. It can be seen from the Figure that the smaller the spraying distance, the shorter the time for the slurry to reach the side wall, and thus the smaller the development of the jet section in a short time. With the progress of spraying, the slurry has not yet fully solidified, and the later, slurry accumulates on the front slurry surface. The slurry layer thickens and flows downward slowly under the action of gravity. The volume share gradient is large (Figure 10), and the area within its statistical range increases, but the growth is slow. In contrast, the longer the spraying distance is, the longer the slurry reaches the side wall, and the larger the development of the jet section, the larger the spraying area is formed on the side wall, and the coverage area is irregular and the volume share gradient is small (Figure 10); that is, the slurry layer is thin and uniform, and the area within its statistical range increases significantly.
The average diameter of the spraying area under different spraying distance con-ditions is counted with a content product share of the spraying area greater than or equal to 0.7. The results are shown in Figure 11. It can be seen from the figure that the smaller the spraying distance, the shorter the time for the slurry to reach the side wall and the smaller the development of the jet section in a short time. With the progress of spraying, the slurry has not yet fully solidified, and the later slurry accumulates on the front slurry surface. The slurry layer thickens and flows slowly downward under the action of gravity. The volume share gradient is large (Figure 12), and the area within the statistical range increases, but the growth is slow. In contrast, the longer the spraying distance, the longer the time for the slurry to reach the side wall, the larger the devel-opment of the jet section, and the larger the spraying area is formed on the side wall, and the coverage area is irregular and the volume share gradient is small (Figure 12); that is, the slurry layer is thin and uniform, and the area growth within the statistical range is obvious.
It can also be seen from Figure 11 that the spraying area increases with the increase in spraying time, and the increase is relatively rapid in the initial stage. In addition, after the spraying process is carried out for a period of time, the area will increase with the increase in distance. Comparing the spraying area under various spraying distance conditions, it can be found that the slurry is not uniform in the area covered by the slurry, and changes with the development of time and space. It can be seen from Figure 10 and Figure 11 that when t = 1.0 s, the smaller the spraying distance is, the larger the spraying area is. However, from the volume share of the phase diagram, it can also be seen that the volume share gradient of the spraying area is larger, that is, the uniformity of the spraying area is poor. The larger the spraying distance is, although the spraying area is irregular, the volume share gradient of the spraying area is smaller, so the uniformity of the spraying area is better. This is because when the spraying distance is large, the slurry reaching the side wall in a short time is less, and the slurry thickness is relatively small, so the effect of gravity is less, and the slurry distribution in the spraying area is more uniform. In the subsequent development and change process, the areas with more uniform spraying are mostly distributed in the lower position in front of the nozzle, especially in the case of small spraying distance. Therefore, it can be seen from the comprehensive spraying area and spraying uniformity that the spraying distance should not be too small or too large, and the spraying distance of 1.5 m is relatively good.
(2) Spraying thickness.
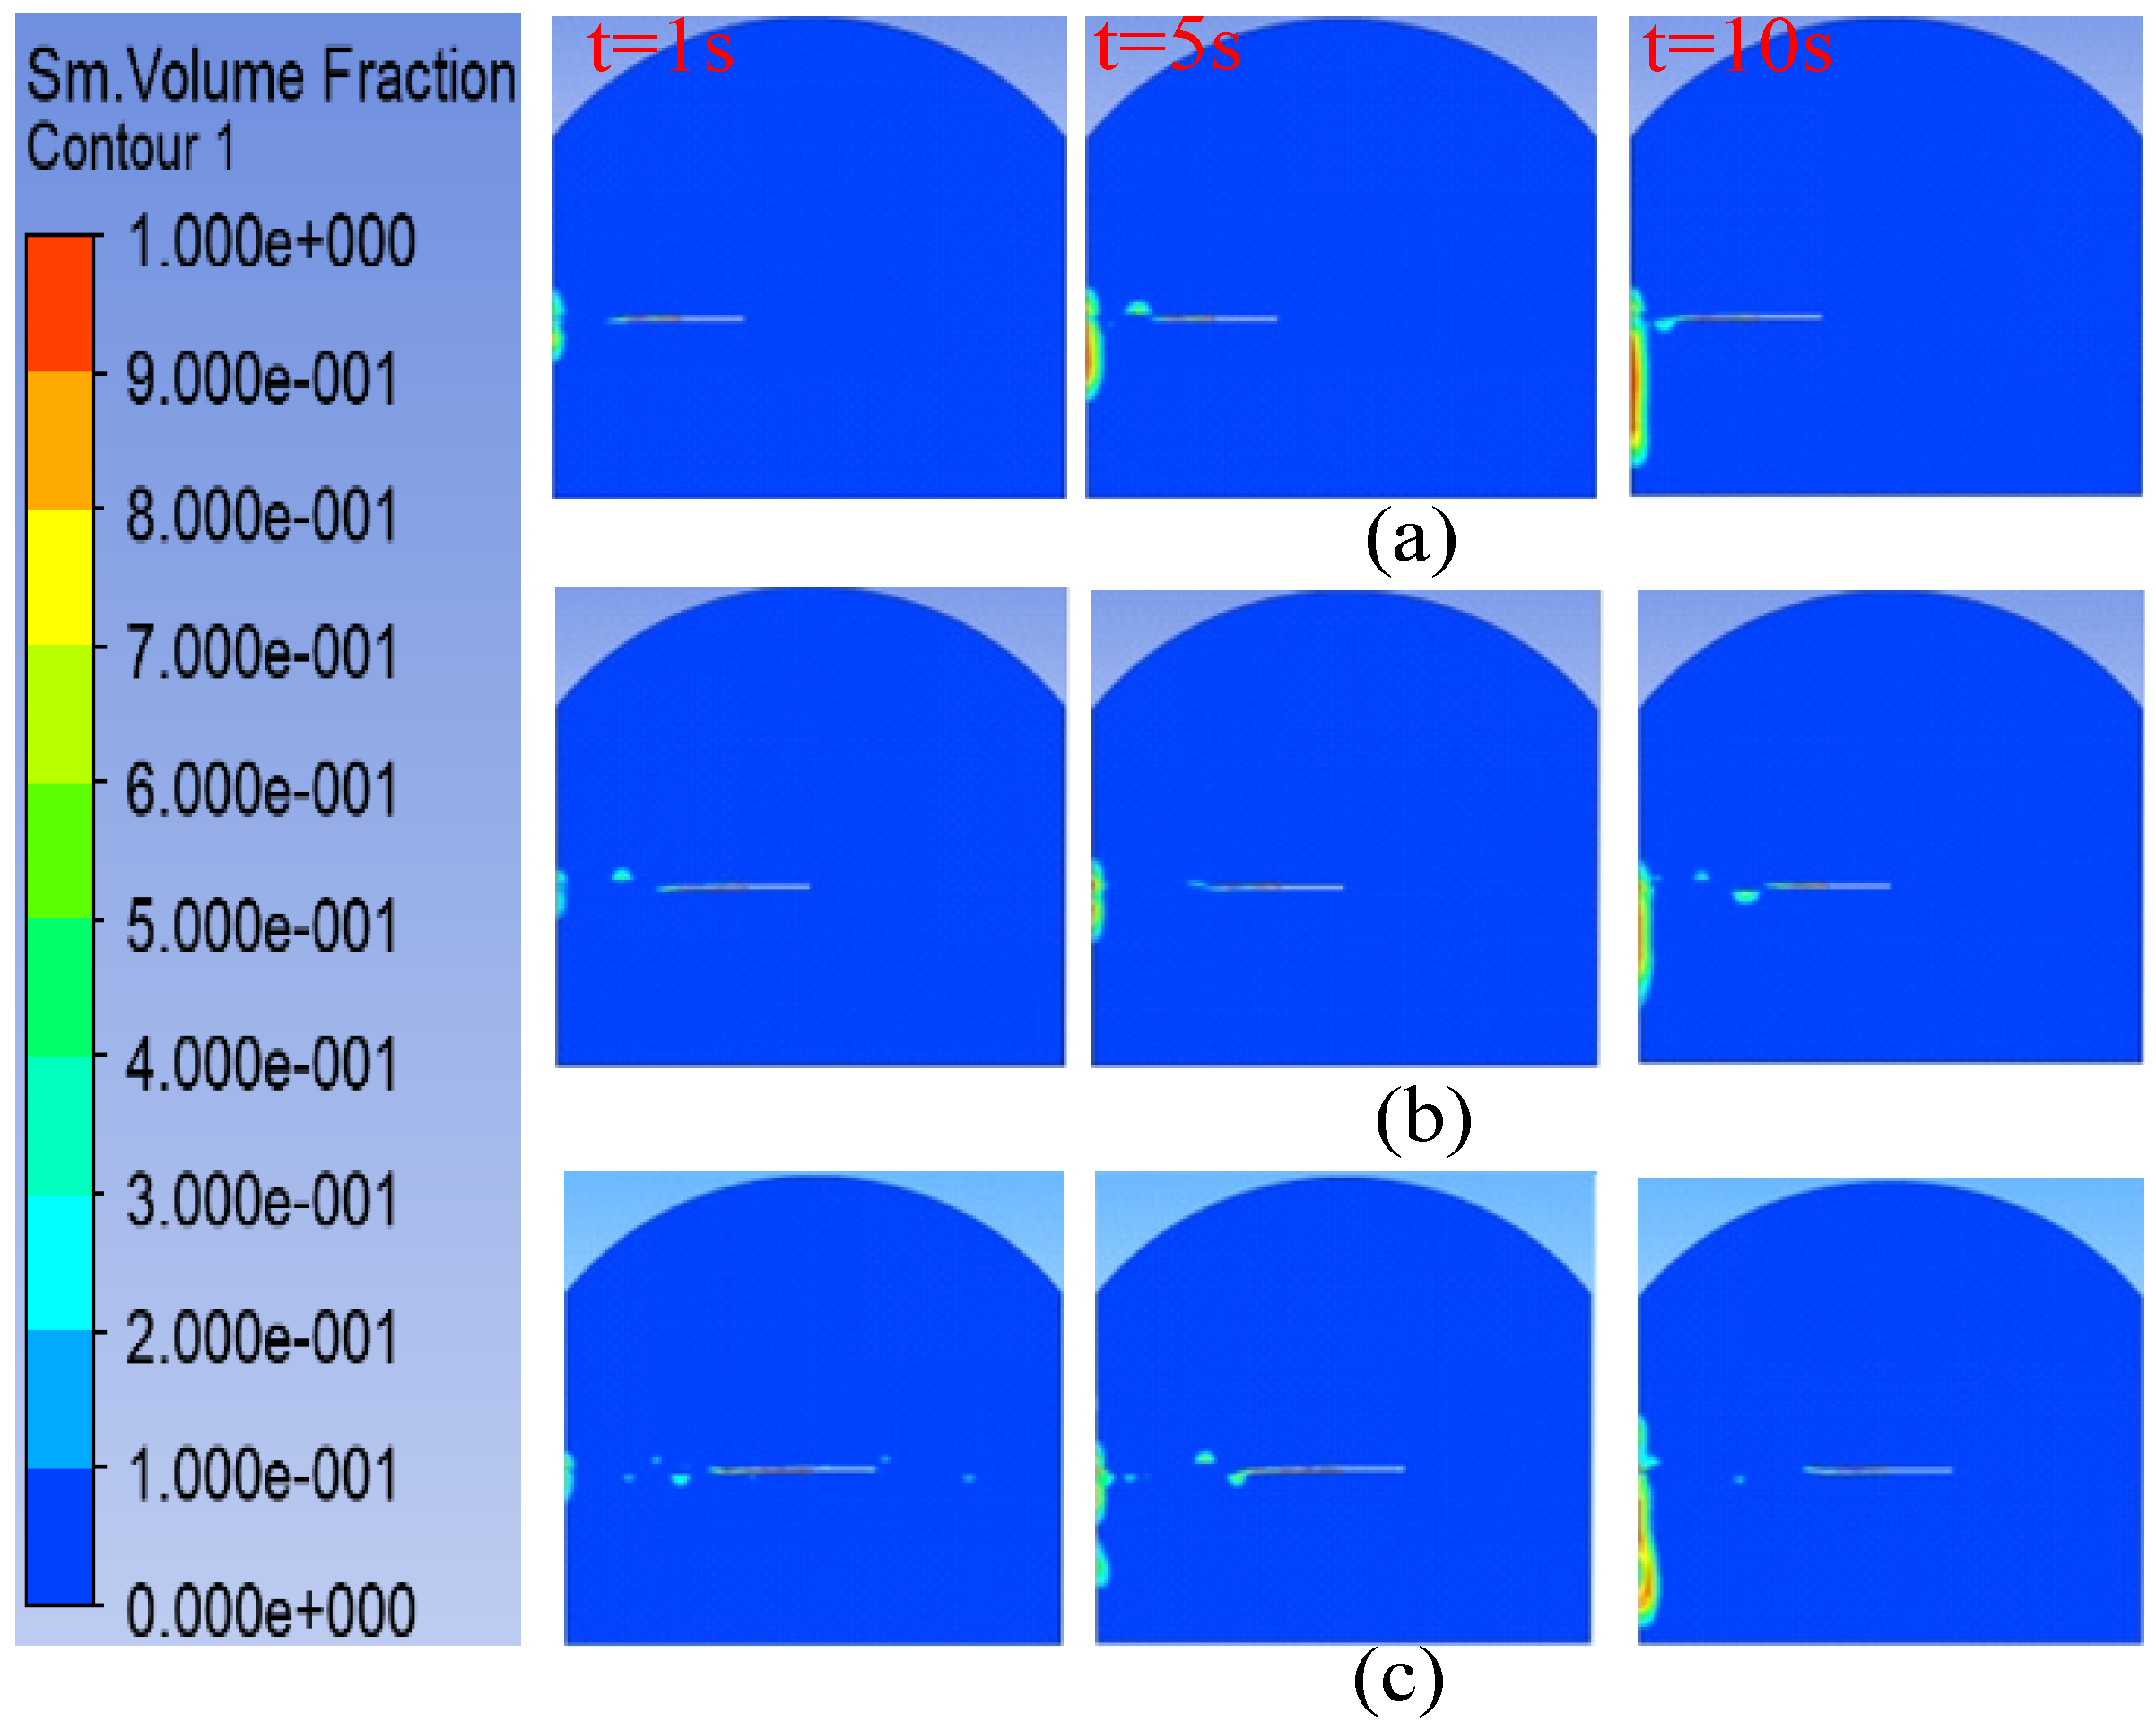
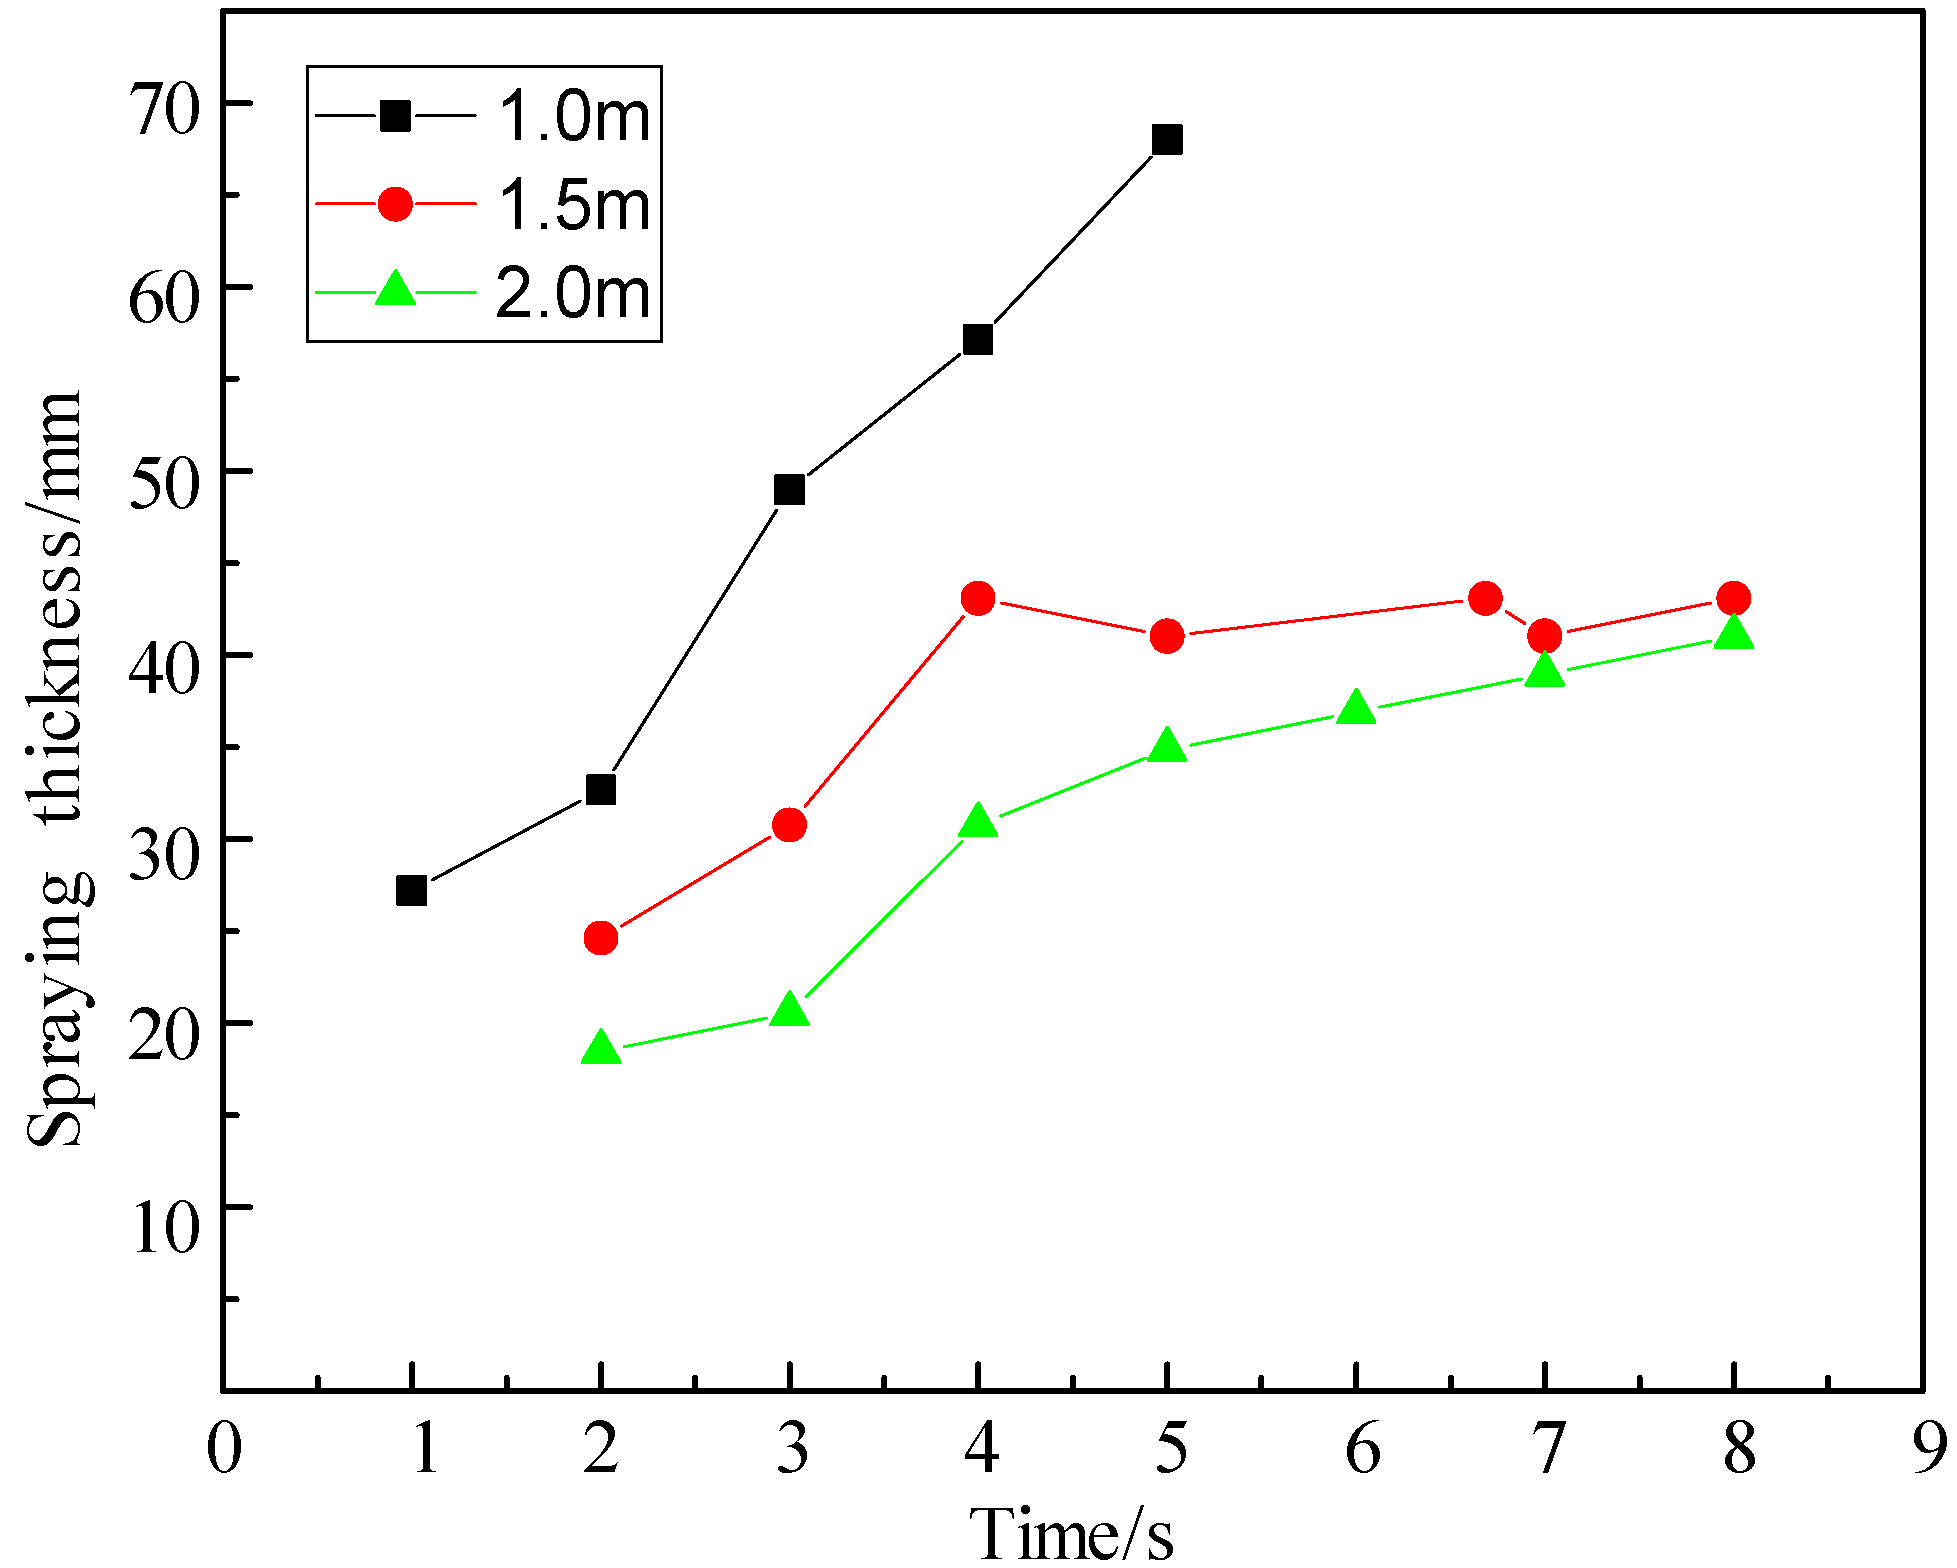
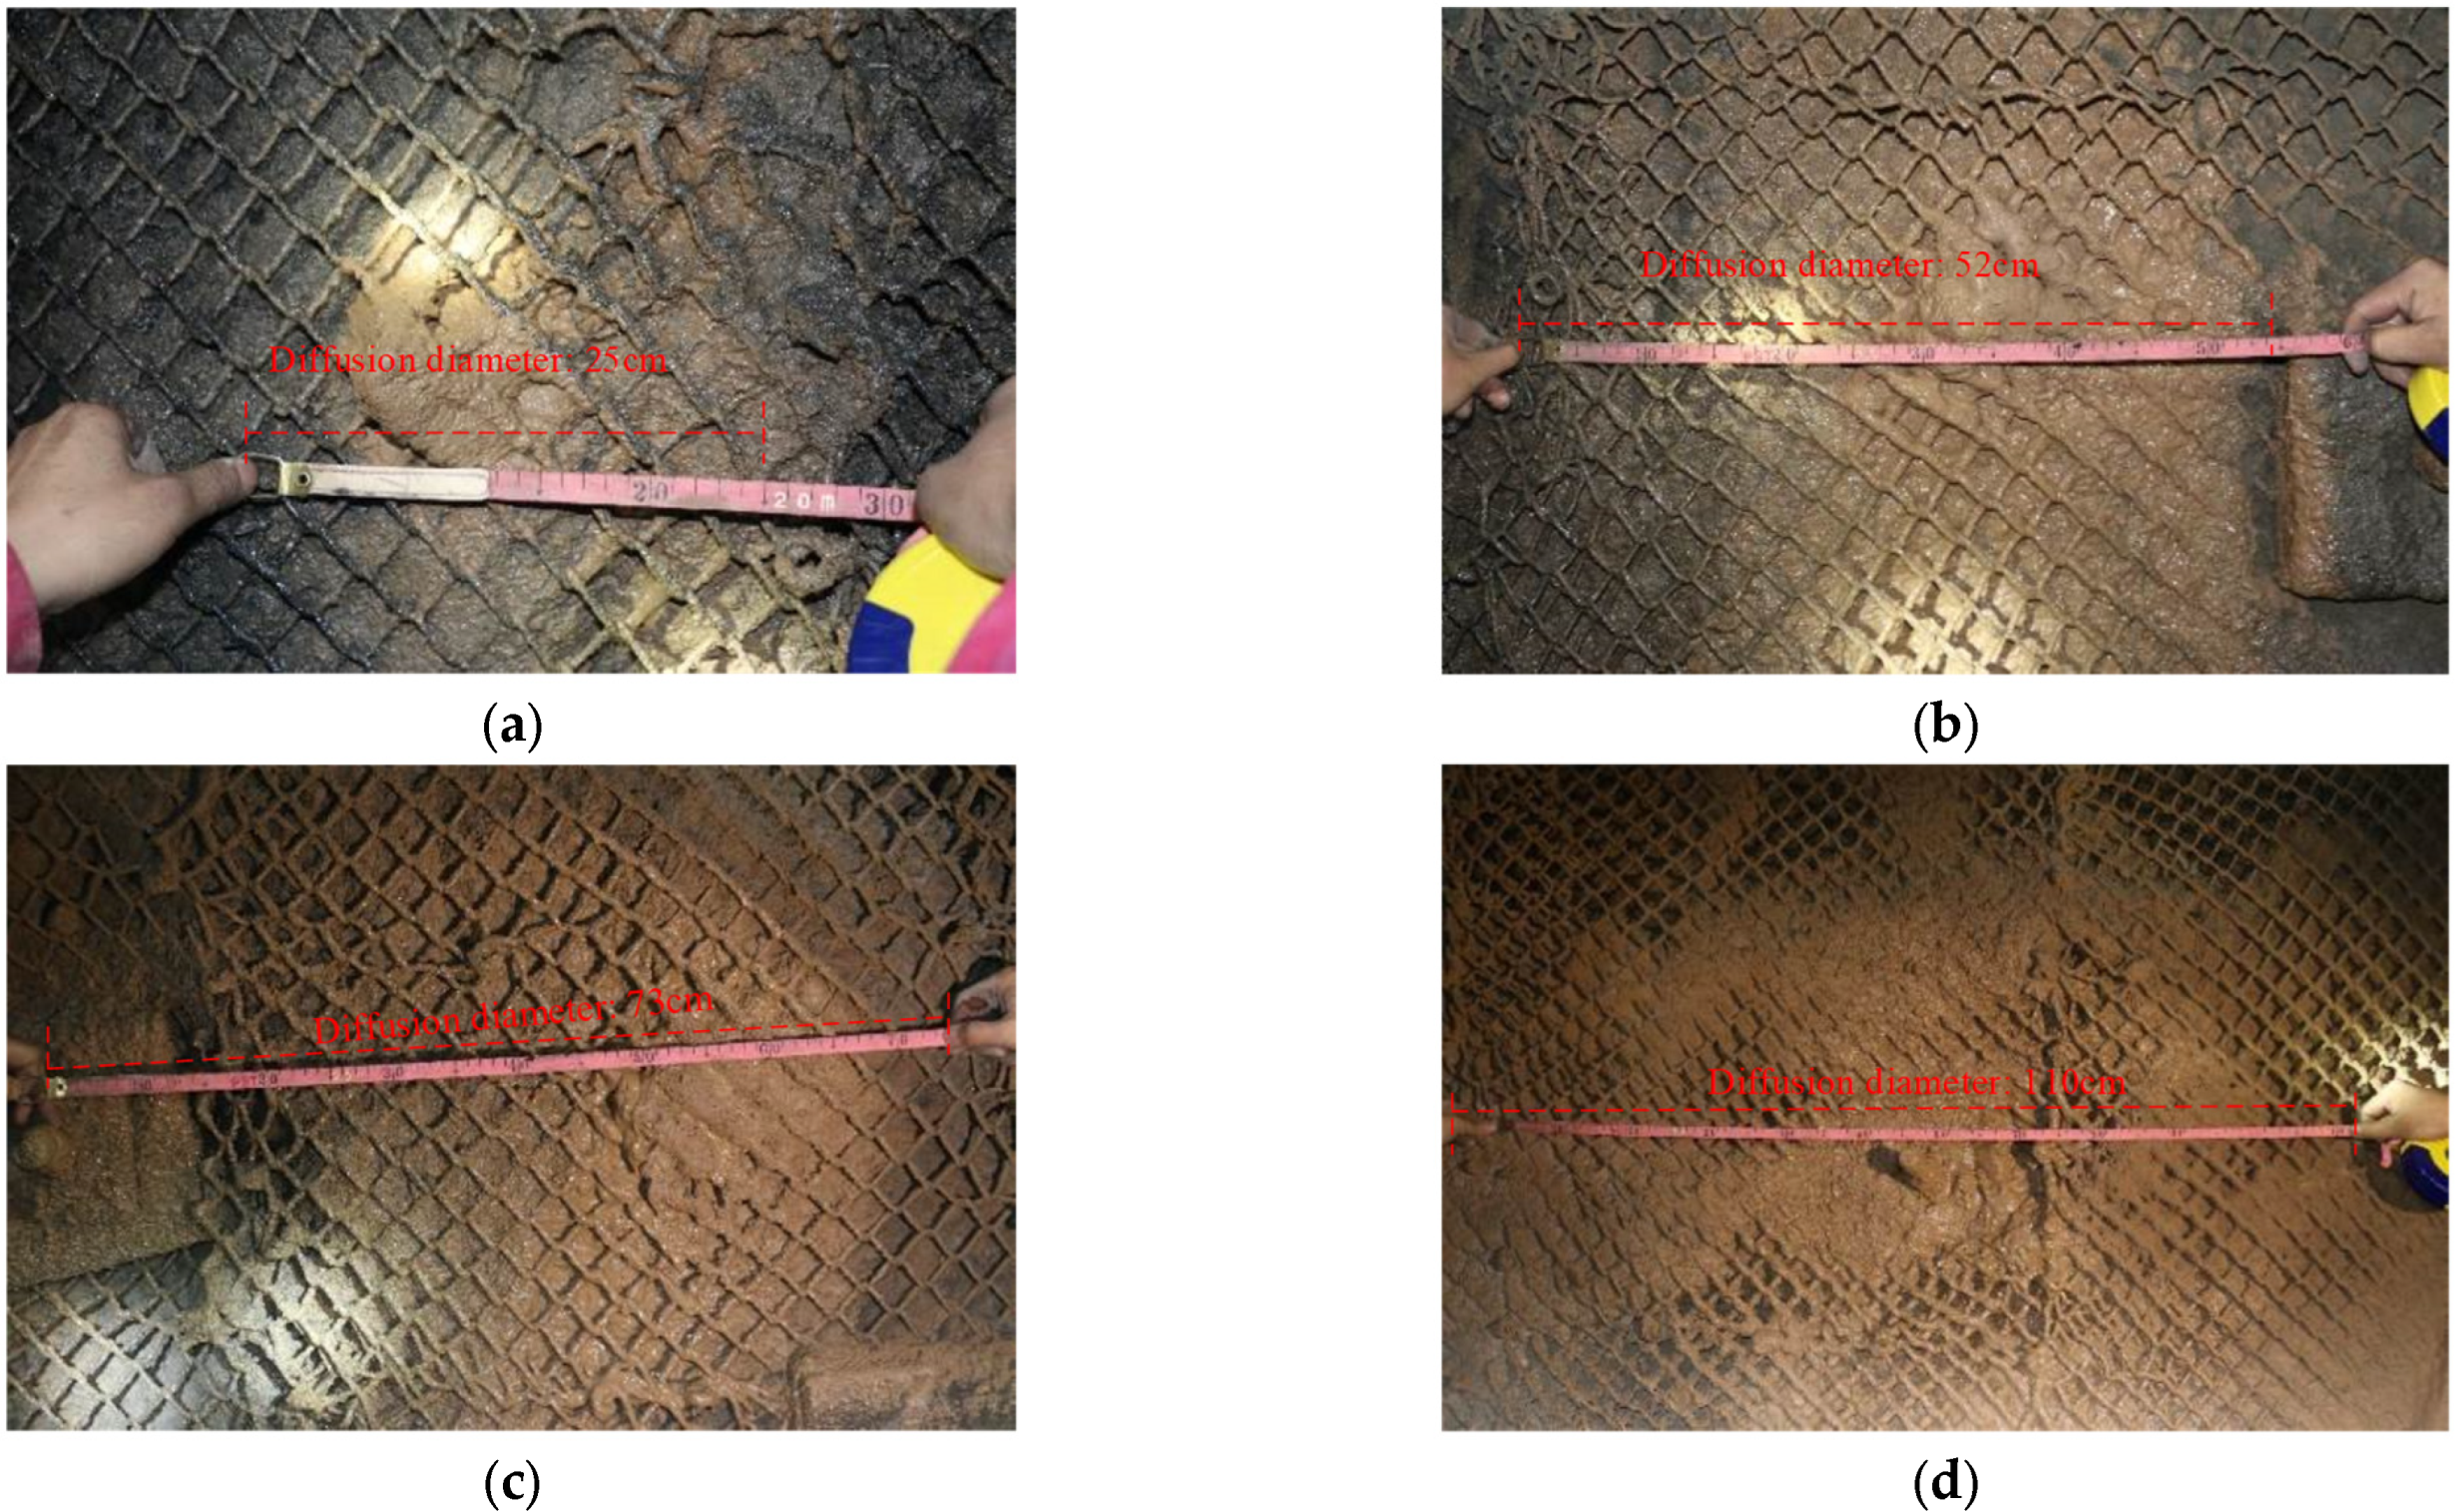
The coating thickness is related to the plugging effect. From the above analysis, it can be seen that the spraying distance is small, the spraying thickness is large, it is easy to move down under the influence of gravity, and the spraying thickness is too thin to meet the plugging requirements. The development process of spraying thickness is shown in Figure 13. The spraying thickness increases with the increase in spraying time, and the initial stage increases faster. When the spraying distance is 1.5 m and 2.0 m, the spraying thickness increases significantly faster, the subsequent increase speed is slow, and the fluctuation degree is small. The spraying thickness corresponding to these two working conditions is within the range of 20–40 mm, as shown in Figure 14, which is consistent with the spraying thickness of 2–4 cm obtained from the experiment. Therefore, the spraying distance of 1.5 m is appropriate.
(3) Experimental verification.
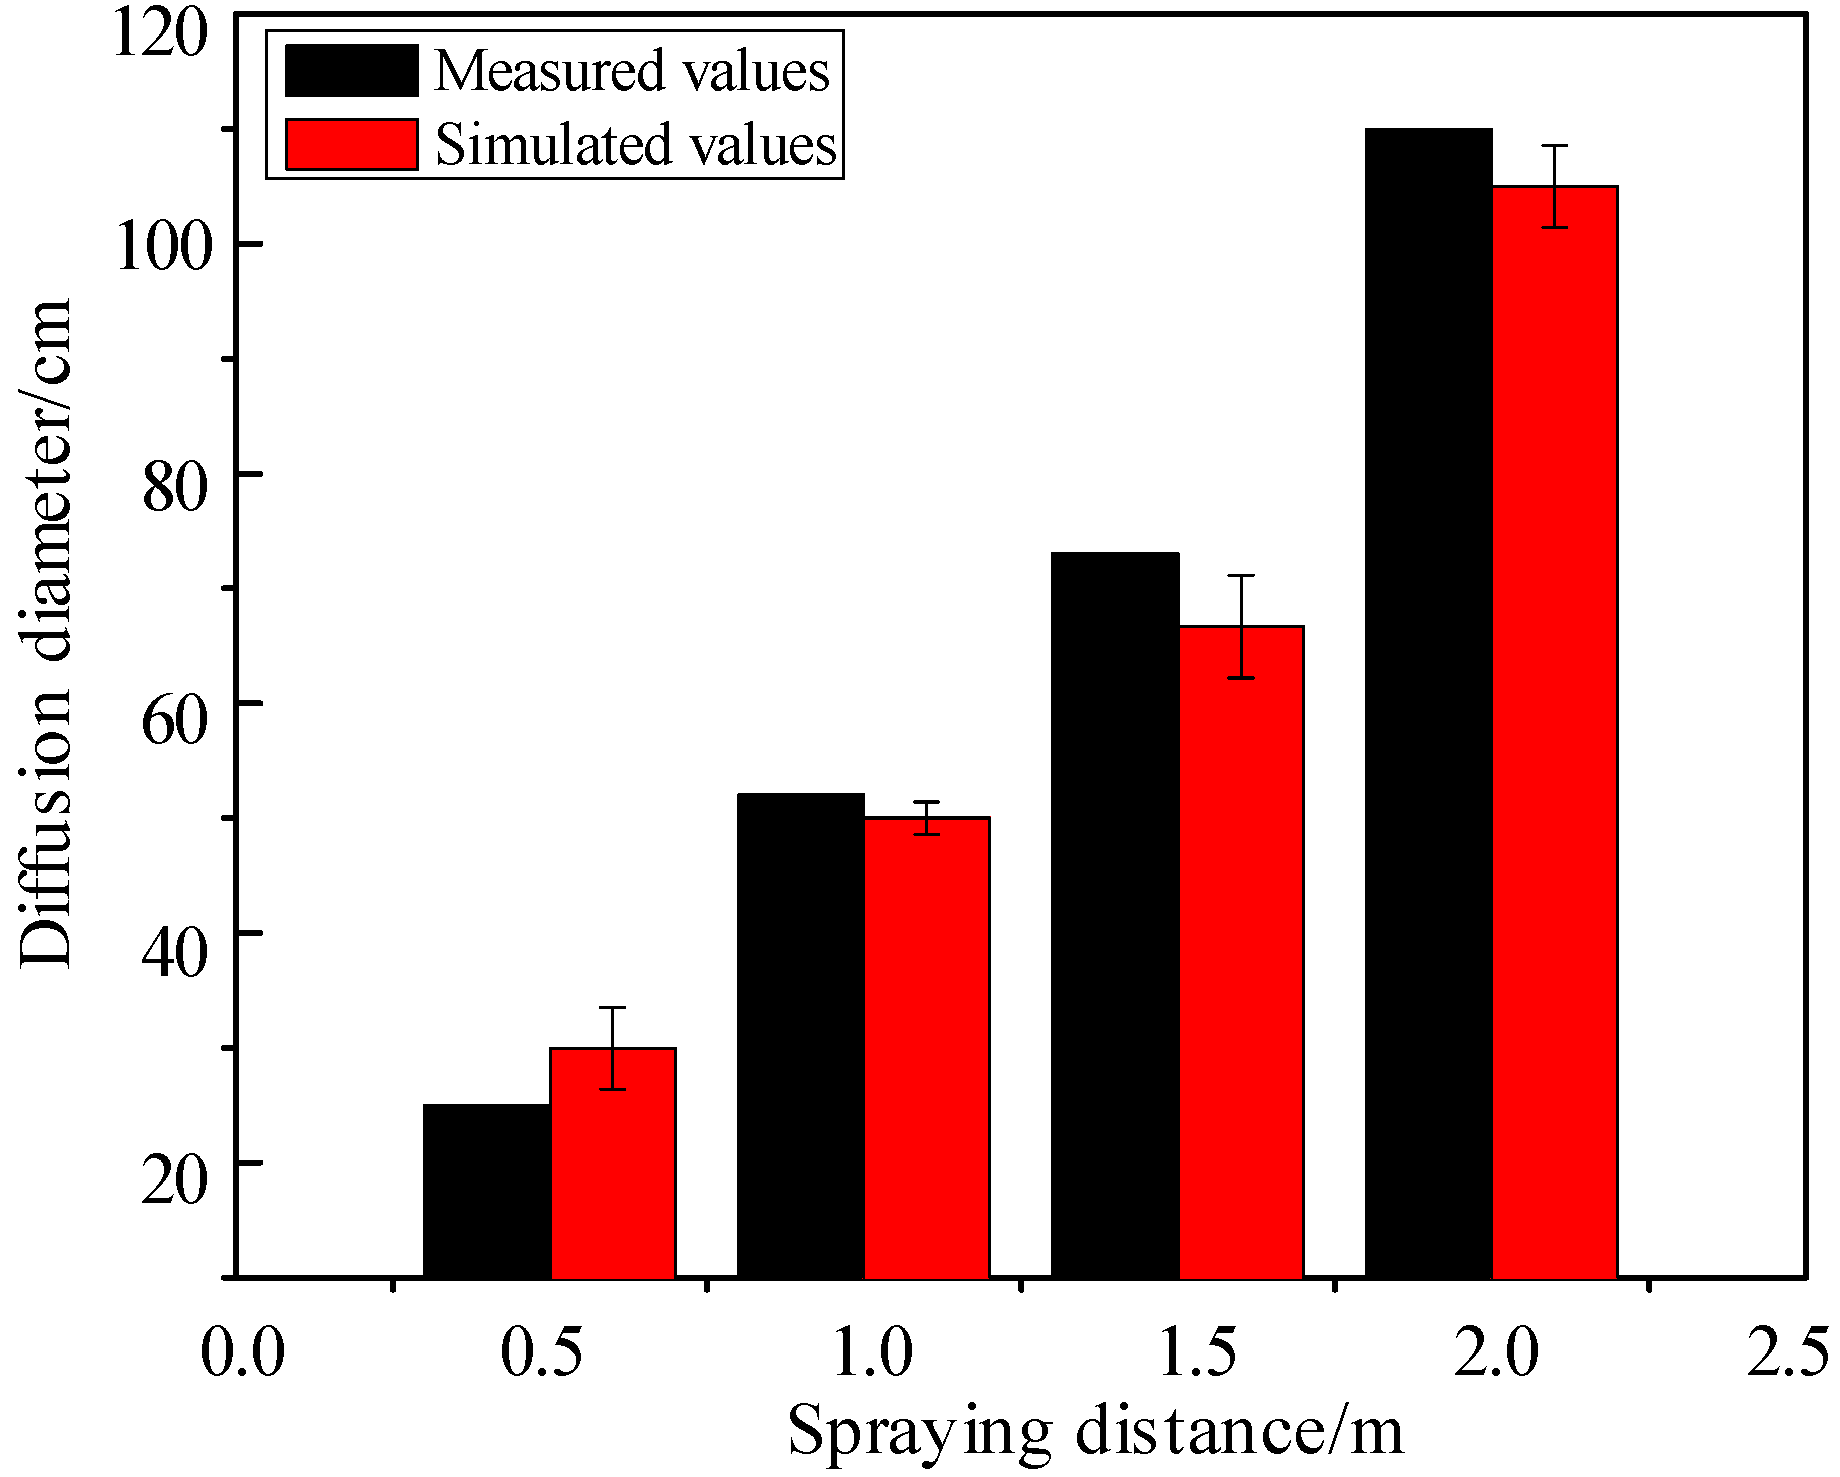
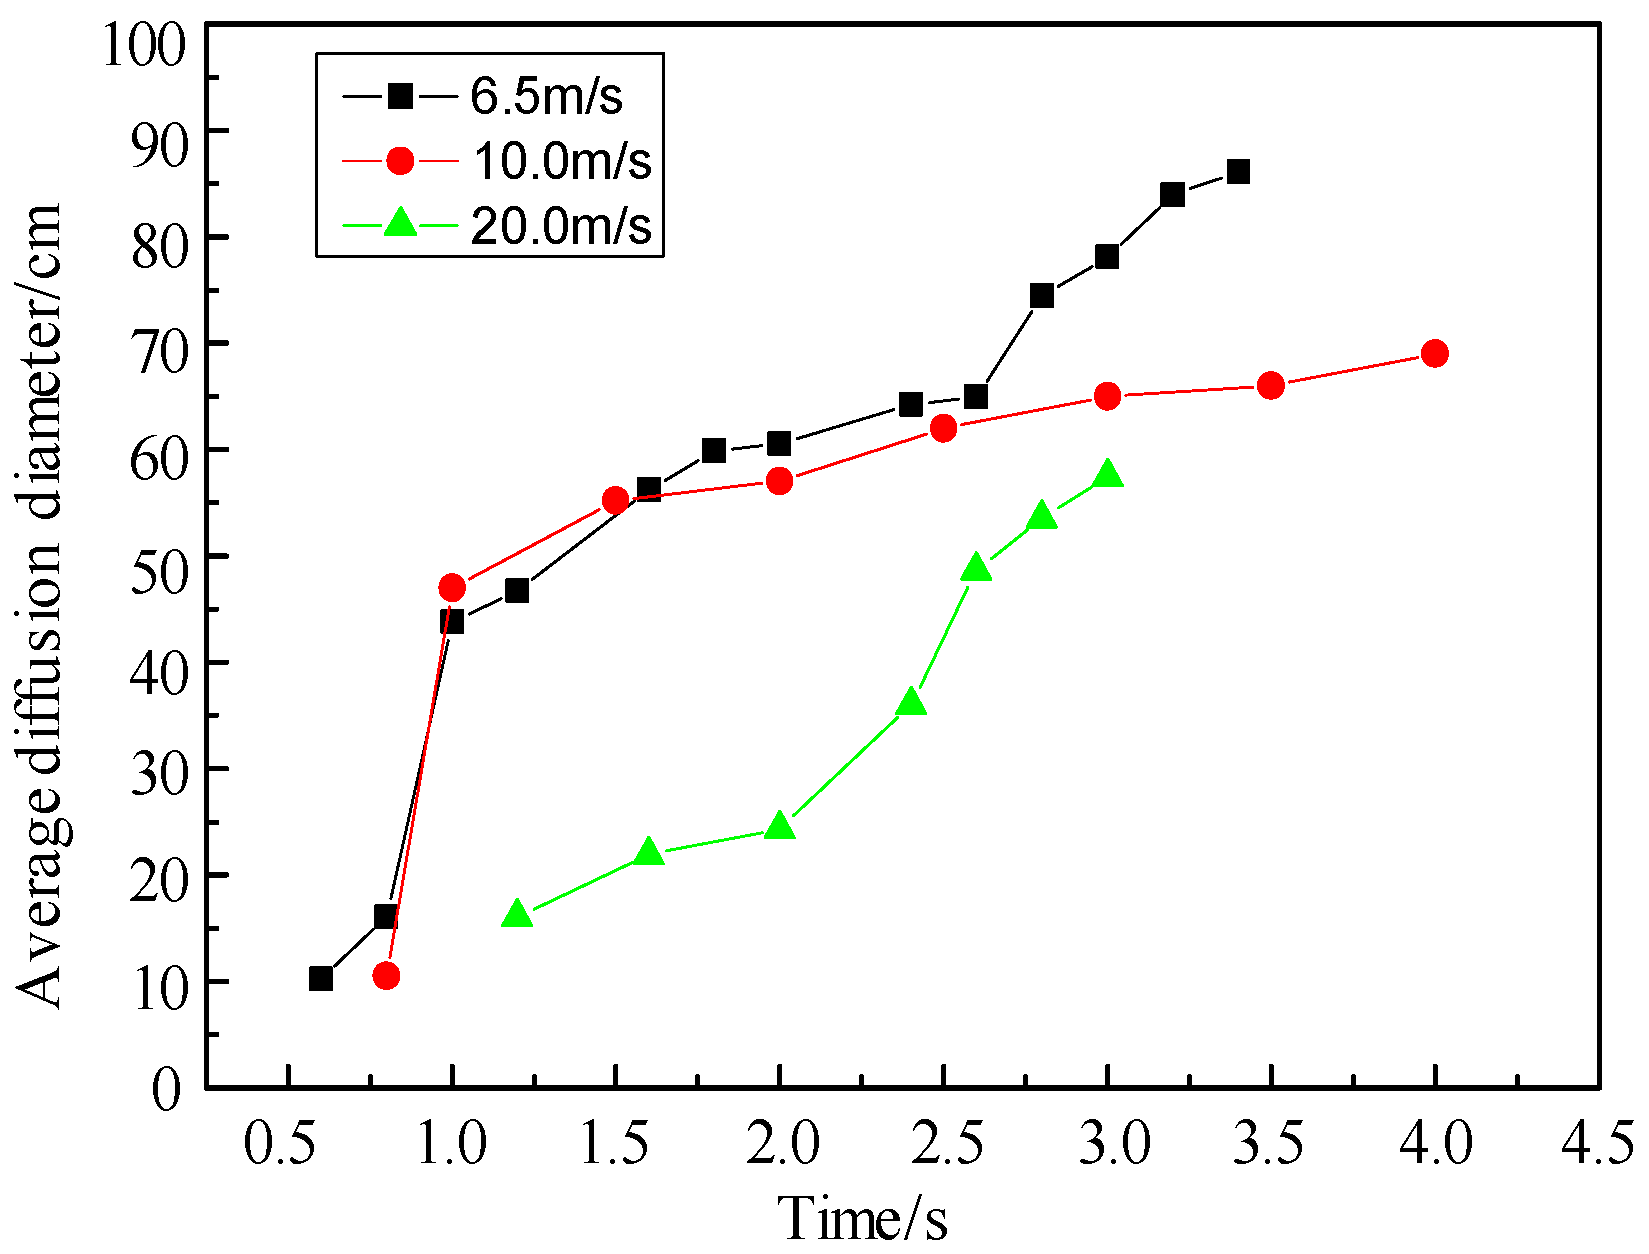
In order to verify the calculated simulation results of diffusion diameter under different spraying distances, we compare the experimental data with the simulation results, as shown in Figure 15. The field spraying effect is shown in Figure 16.
It can be seen from Figure 15 that the experimental data and simulation results are in agreement, and both reflect the linear positive correlation between diffusion diameter and spraying distance. Combined with Figure 10, Figure 14, Figure 15 and Figure 16 from the perspective of the size of the spraying area and the uniformity of the spraying thickness, the corresponding spraying area is relatively large when the spraying distance is 1.5 m, and the slurry distribution in the spraying area is the most uniform, so the working condition is relatively better.
(2) Influence of nozzle initial velocity.
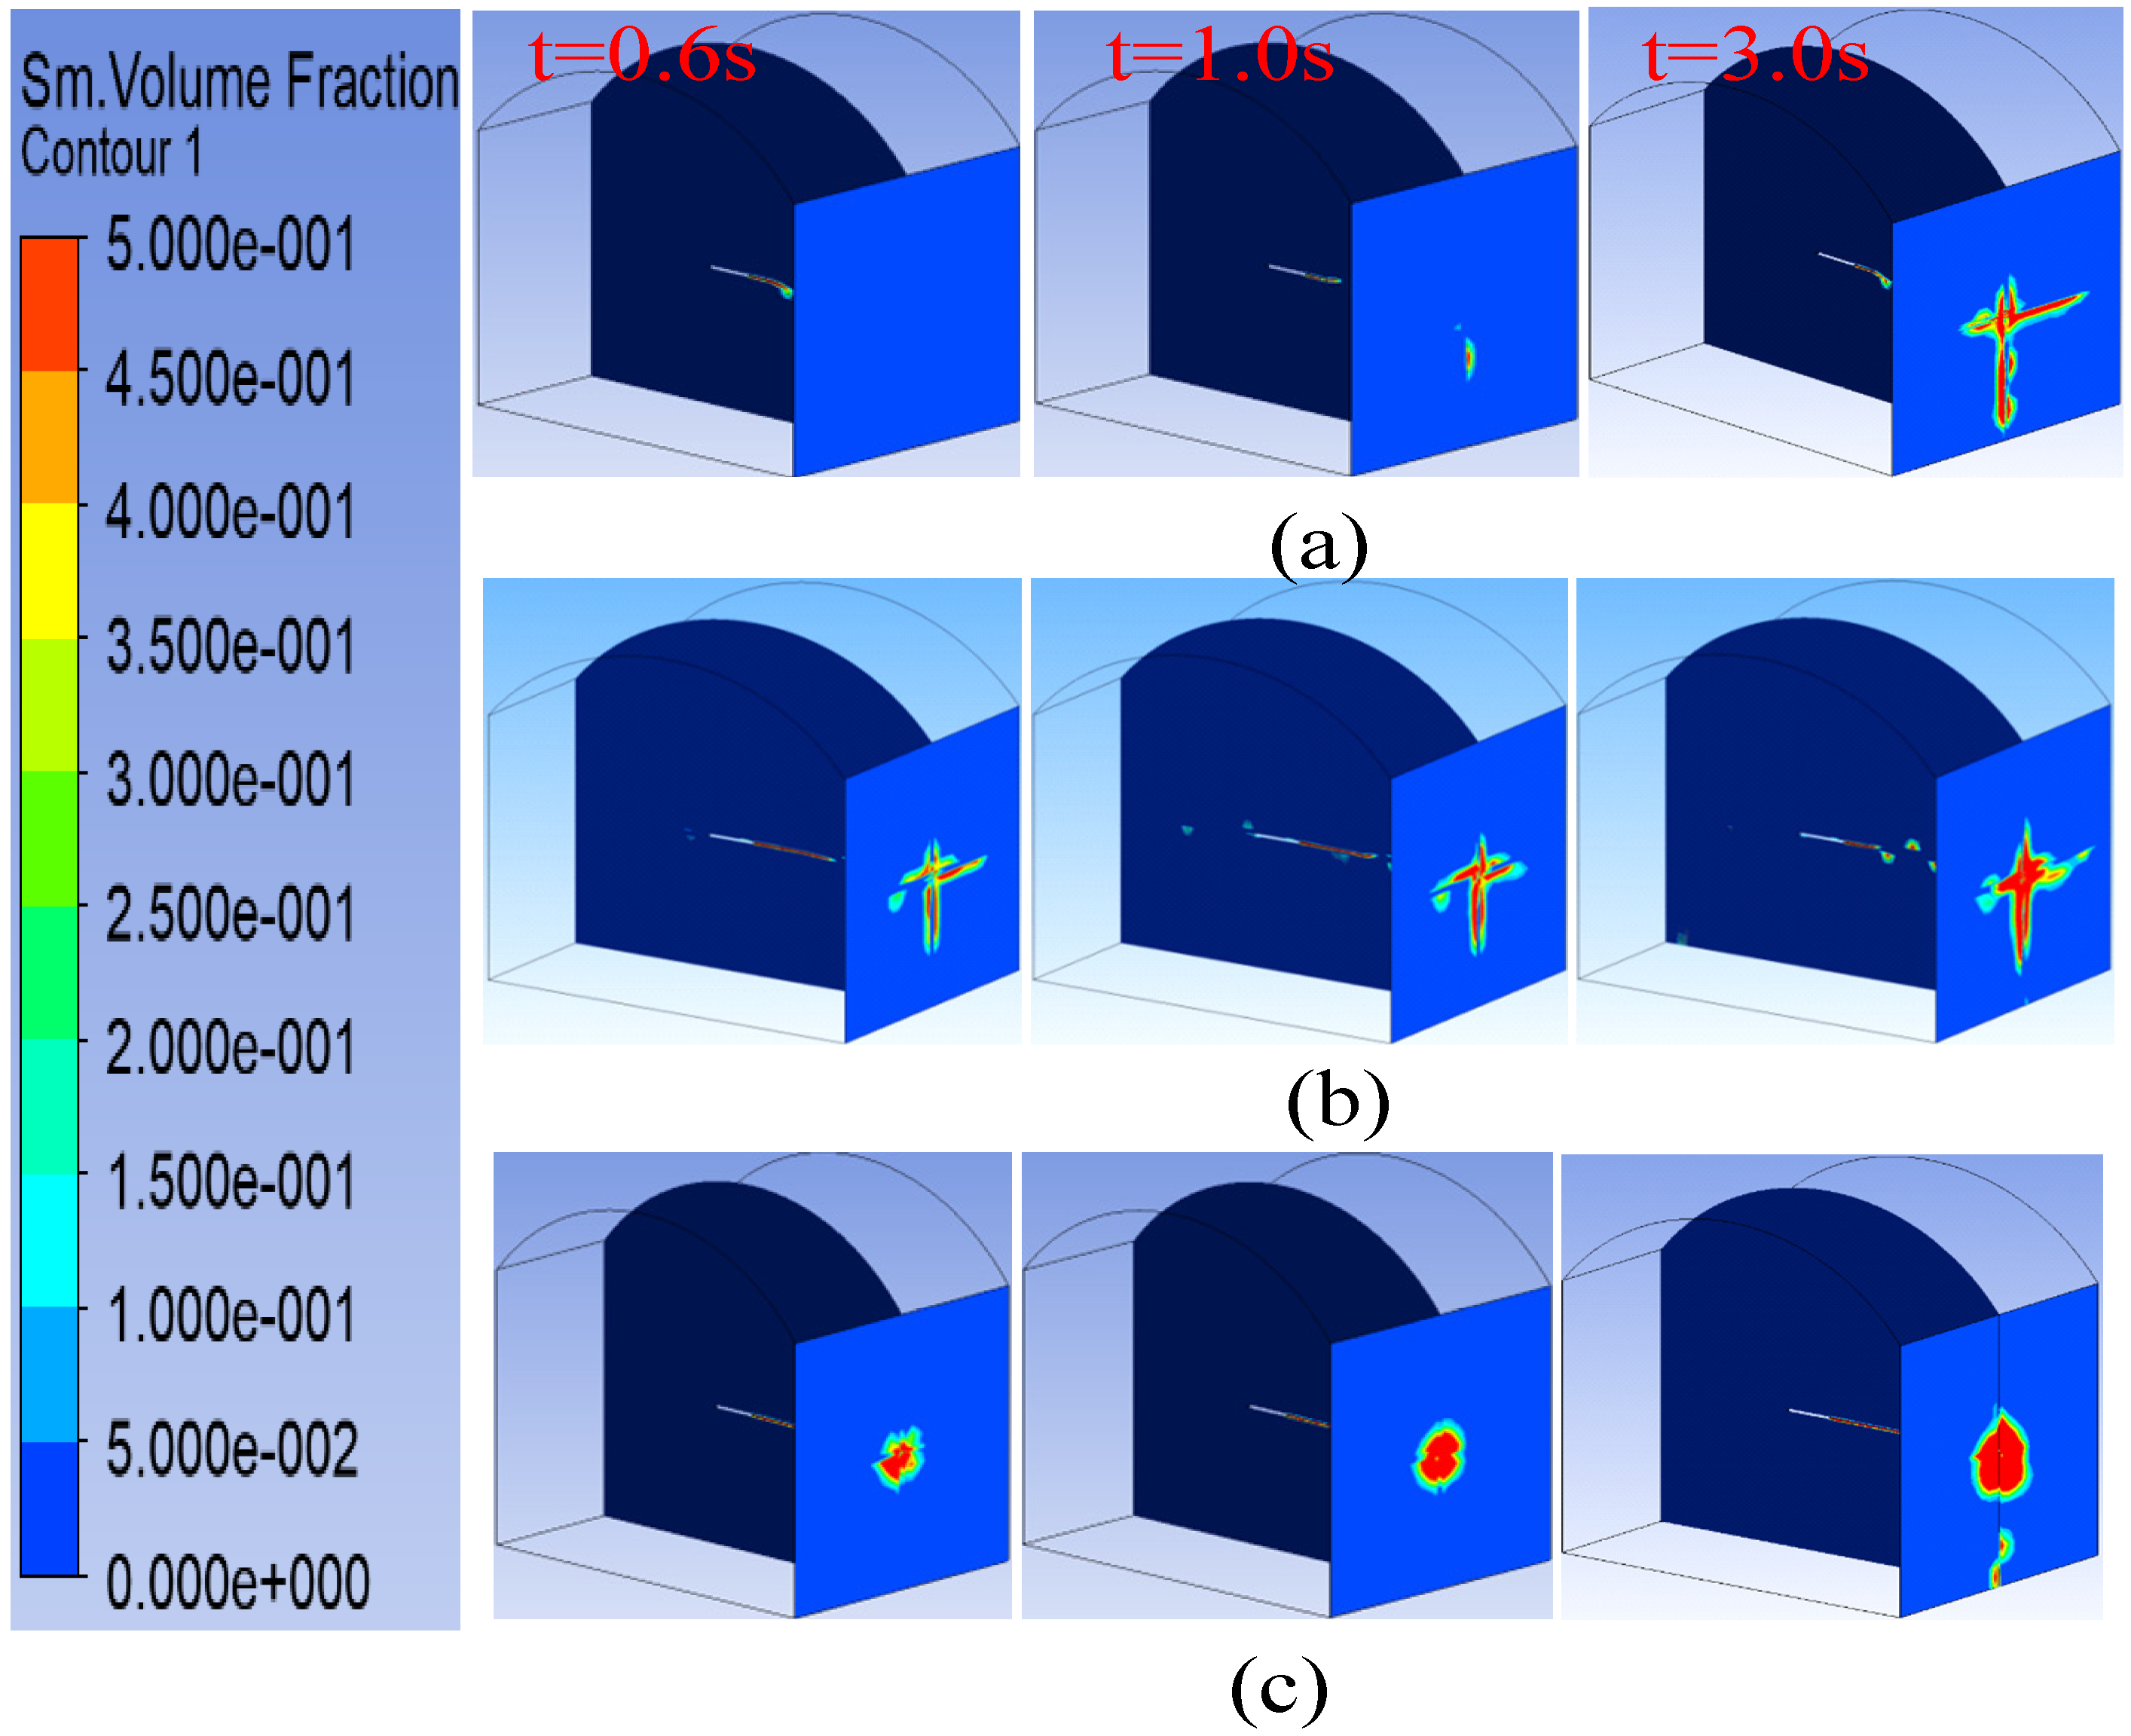
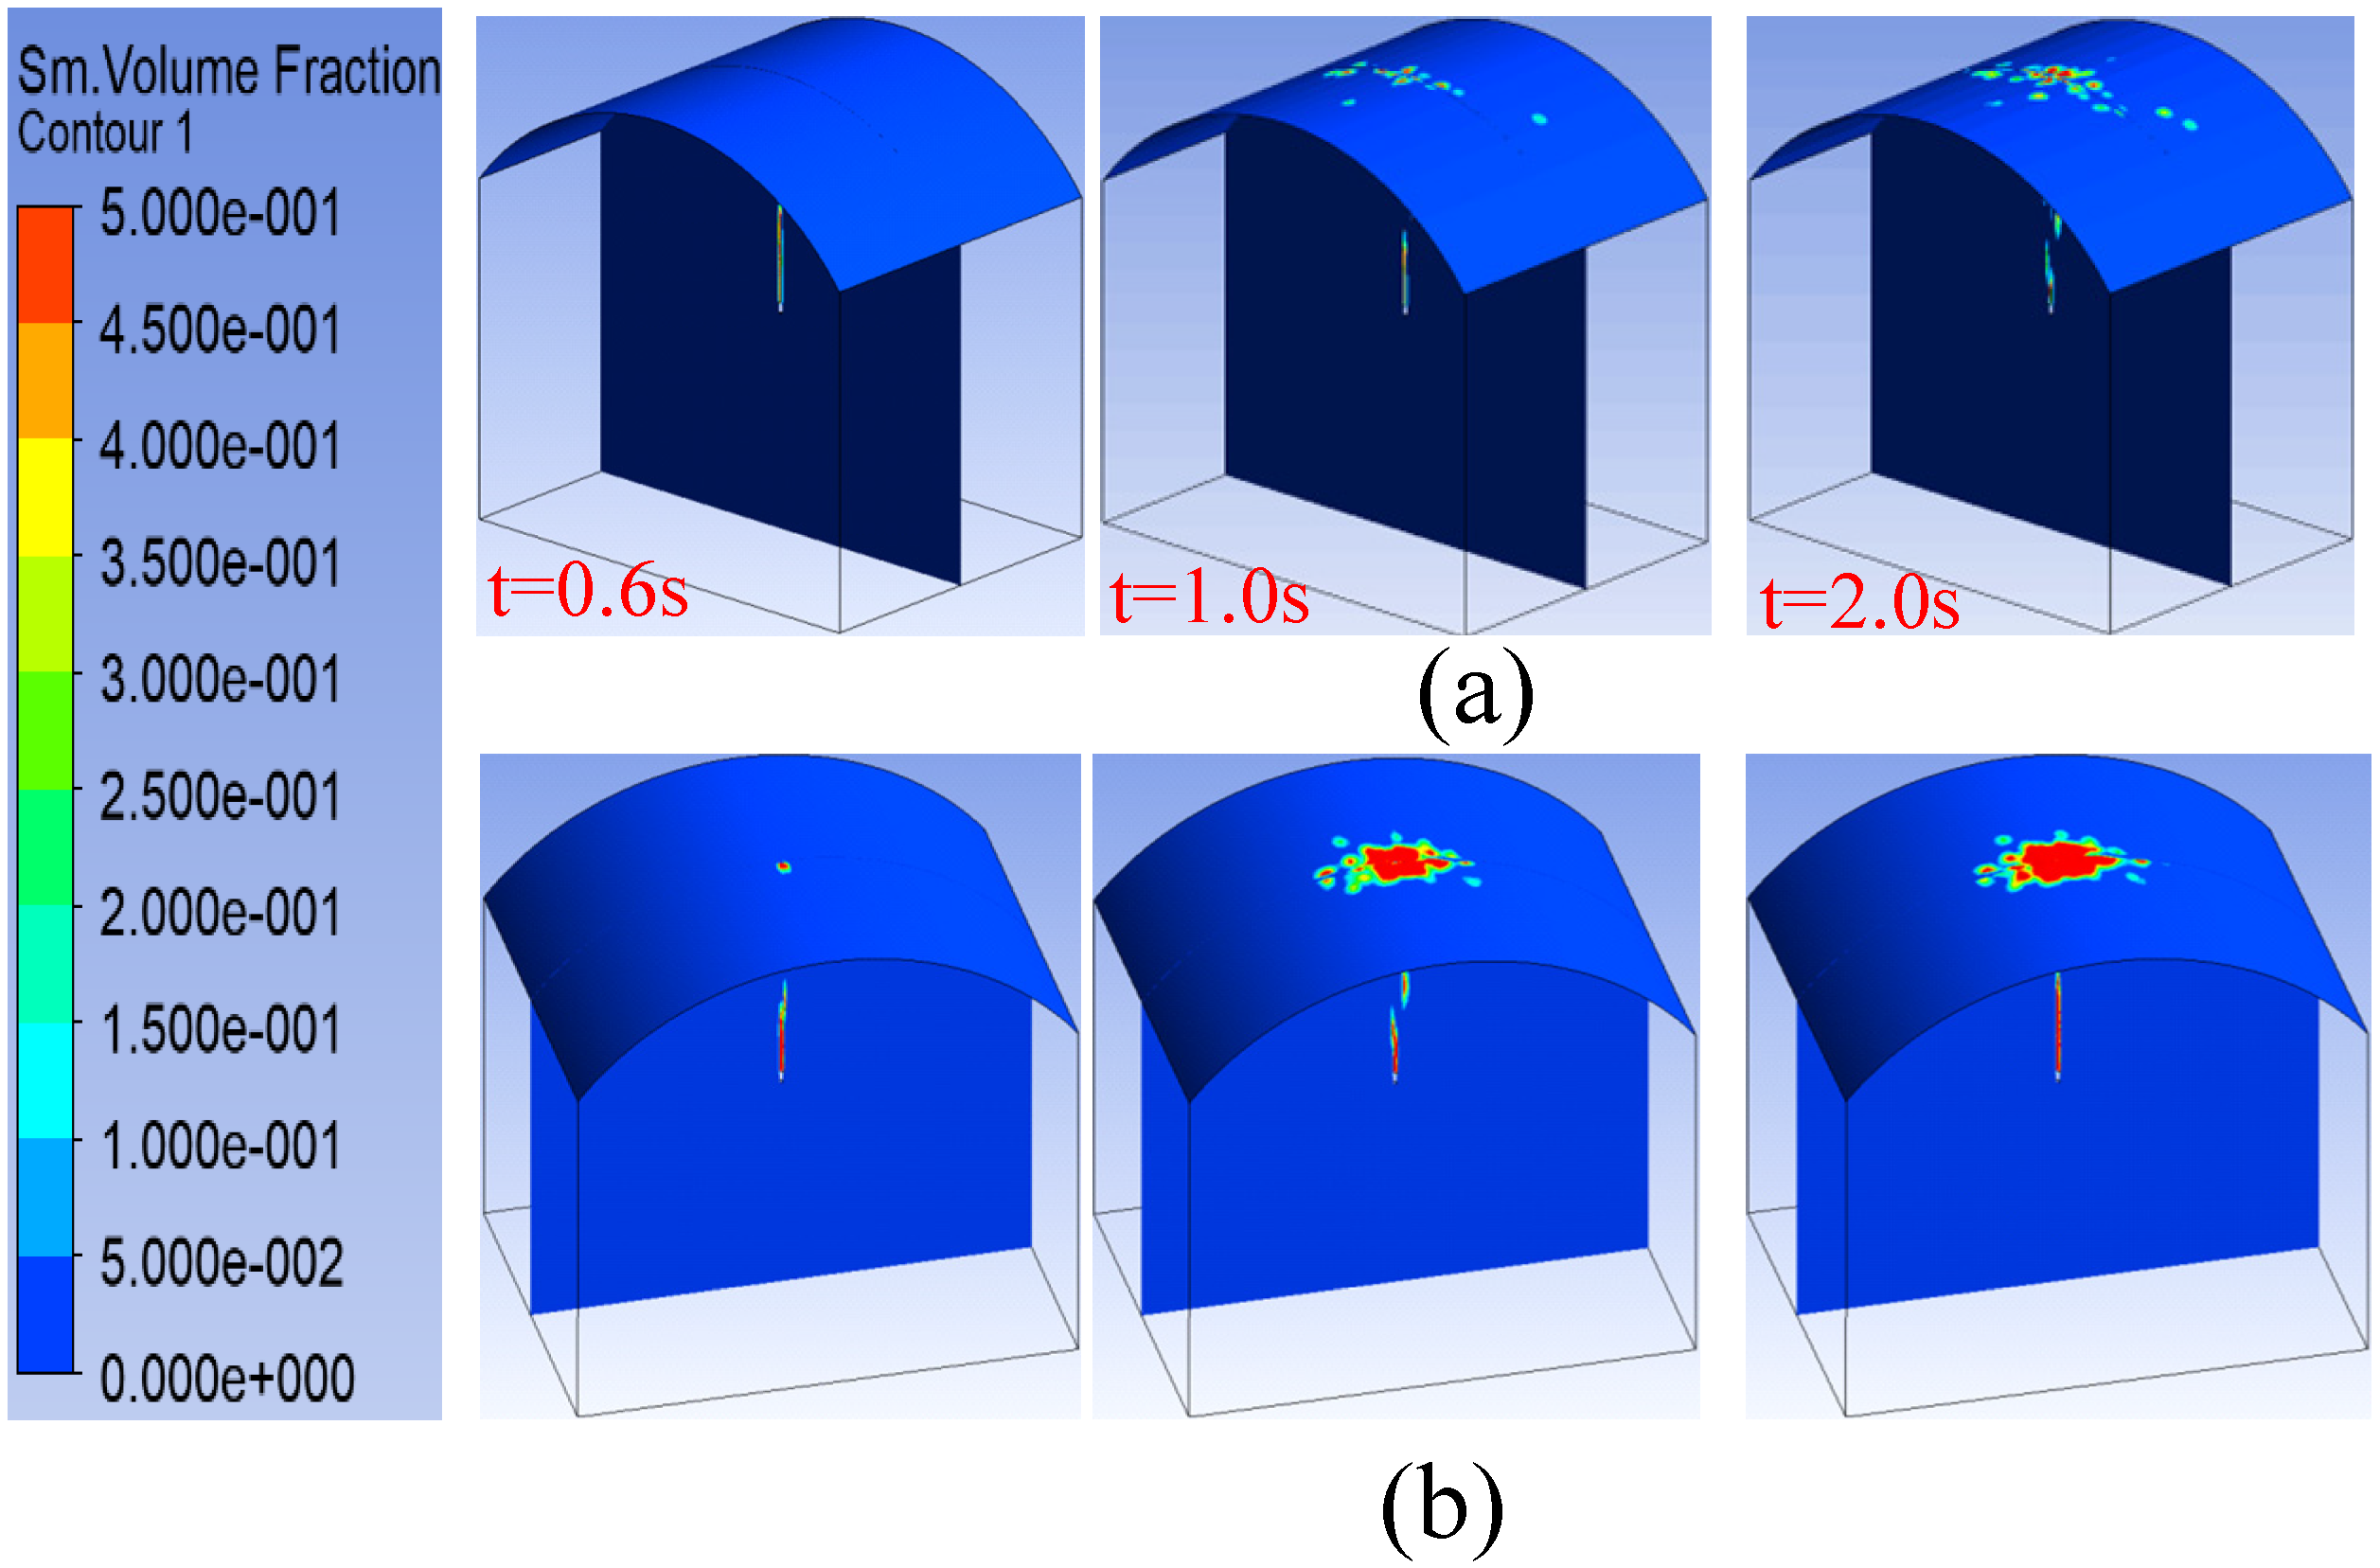
It takes a certain time for the slurry to solidify on the wall. The amount of slurry reaching the wall in a short time should not be too much or too thick. Therefore, the initial spraying speed should not be too large. Under the conditions of different initial speeds, the spray morphology and its thickness change most significantly in the first 3S, so only the simulation results in the first 3 s are shown in Figure 17. It can be seen from Figure 17 that irregular spraying areas are formed on the side wall due to the different diffusion capacities of each part of the front end of the jet under the action of different momentum. When the initial velocity is small, the spraying area on the wall is low, as shown in Figure 17a t = 1.0 s. When the initial speed is high, as the spraying continues, a relatively regular circular area is formed in front of the spray gun, and the slurry in front has not yet solidified. The subsequent slurry accumulates on the surface of the slurry in front, and the area within its statistical range will increase, but the growth rate is slow, and the spraying area formed on the side wall is more uniform, as shown in Figure 17c.
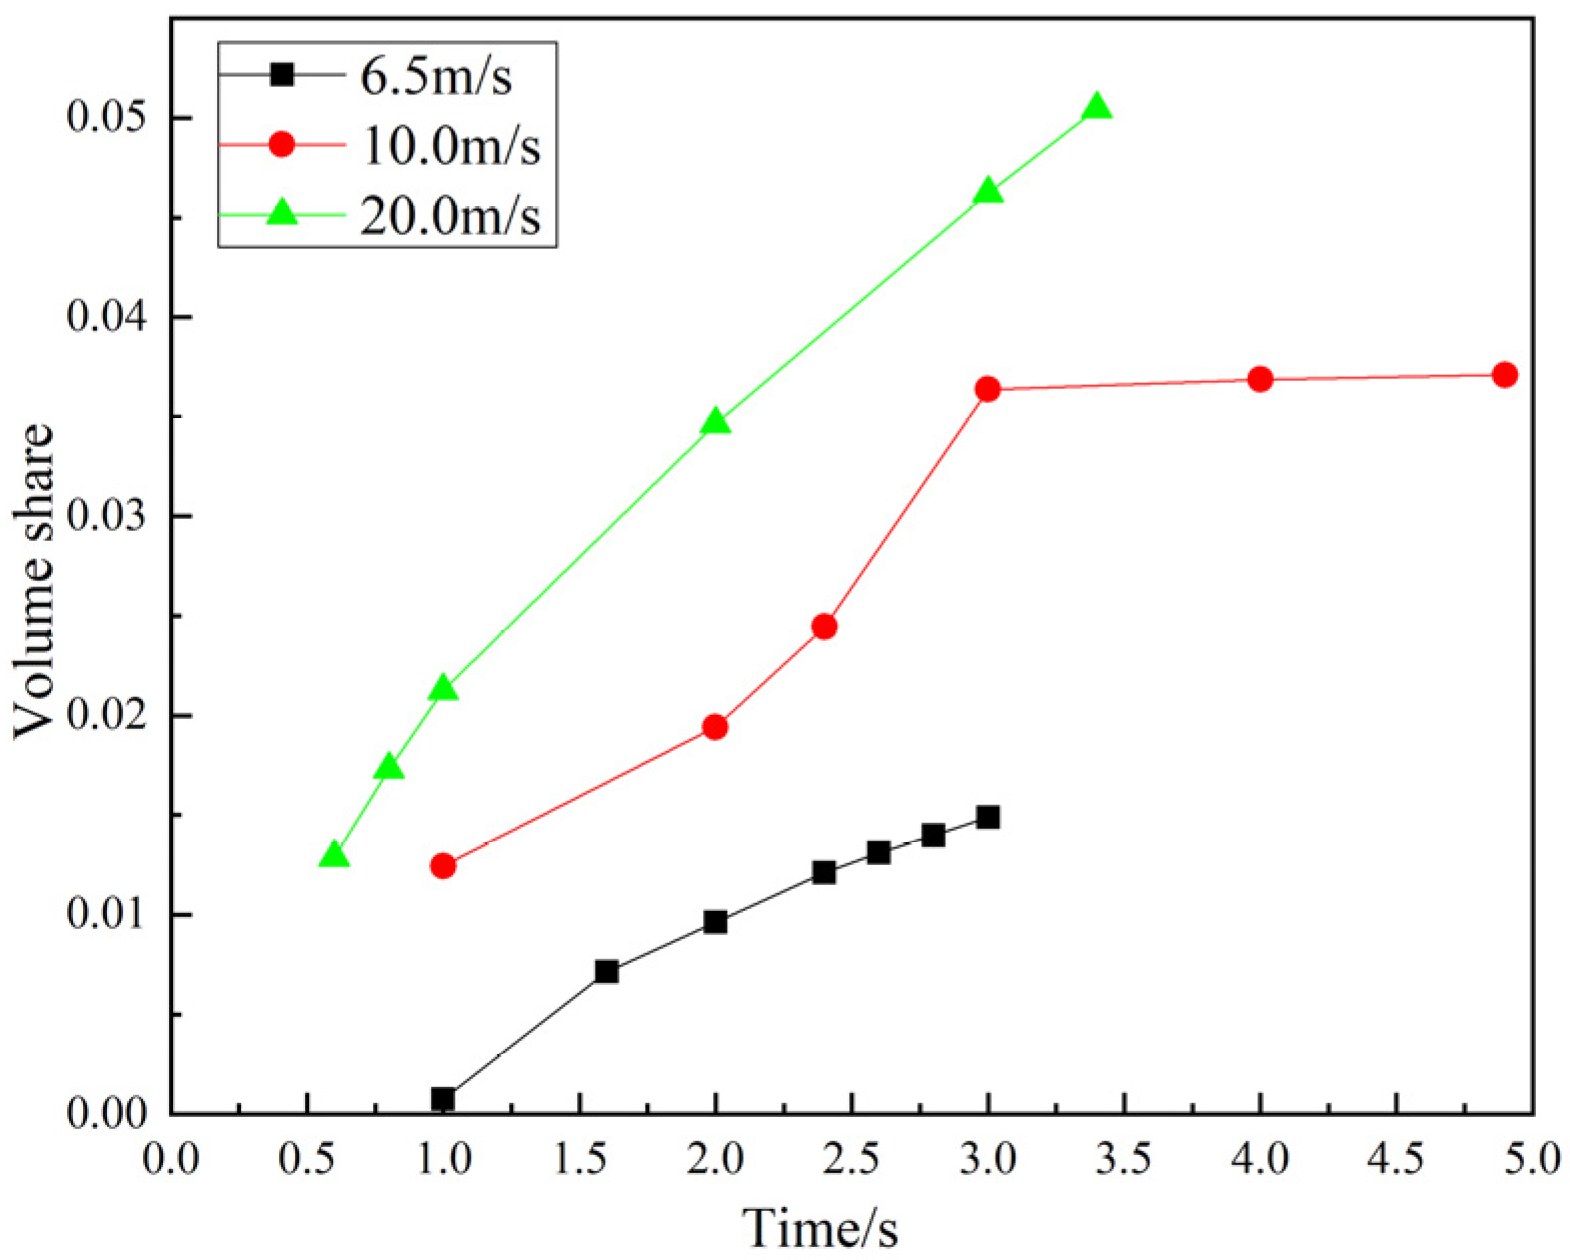
It can be seen from Figure 18 (1) that the amount of slurry reaching the spraying wall increases with the increase in spraying time, and gradually tends to a certain value, and (2) when the initial spraying speed is 20.0 m/s, the volume share of slurry on the wall is significantly larger than that when the initial spraying speed is 6.5 m/s. It can be seen that the larger the initial spraying speed is, the more the volume share is of the slurry reaching the wall in the same amount of time.
As shown in Figure 19, the spraying area decreases with the increase in the initial spraying speed within the calculation time period with the limit that the content product share of the spraying area is greater than or equal to 0.7. When the initial spraying speed is small, the slurry takes a relatively long time to reach the side wall, and the jet cross-section increases continuously in the process of spraying to the side wall, as shown in Figure 17a. On the whole, the shape and uniformity of the spraying area are essentially related to the time when the slurry reaches the side wall. The longer the slurry takes to reach the side wall, the greater the influence of gravity and surrounding fluids, and the more changes along the way—when it reaches the wall, the diffusion capacity of each part of the front end of the jet is also different, thus forming spraying areas with different characteristics.
To sum up, in order to reduce the changes of jet development along the way, it is necessary to shorten the time for the slurry to reach the wall, that is, to increase the outlet velocity of the slurry.
(3) Influence of spraying direction.
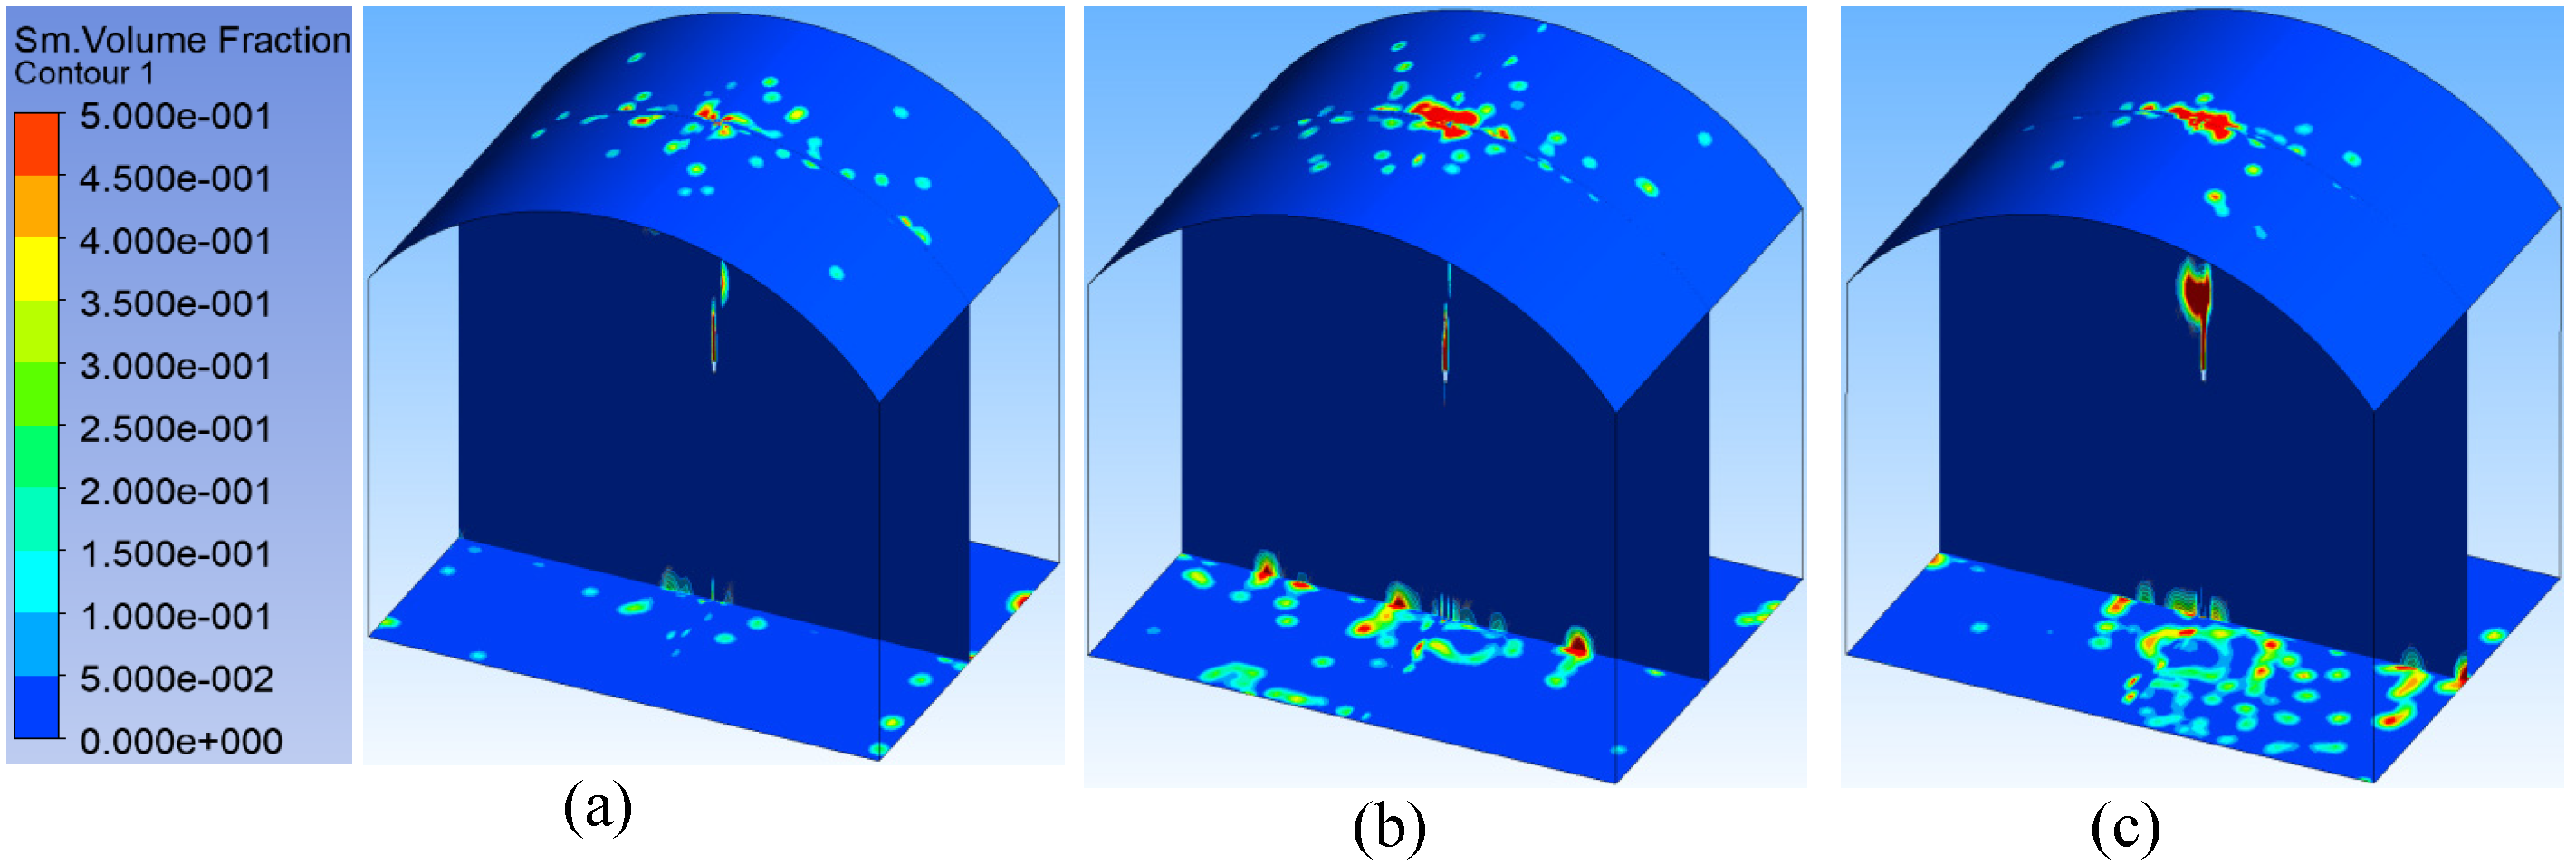
When the spraying surface is at the top, the spraying process is significantly affected by gravity. When the initial velocity is small, the slurry should not only overcome the lateral wind flow, but also overcome the gravity. The moving speed of the slurry gradually decreases. Along the way, most of the slurry deviates to the surrounding area under the influence of various factors such as the lateral wind flow. One part forms a discontinuous spraying area with the mainstream on the top surface, and the other part scatters to the ground under the action of gravity, which is the so-called rebound phenomenon, as shown in Figure 20a. When the initial velocity is large, the slurry can successfully overcome the influence of lateral wind flow and gravity, and finally form a spraying surface with good continuity in the central area on the top surface, as shown in Figure 20b.
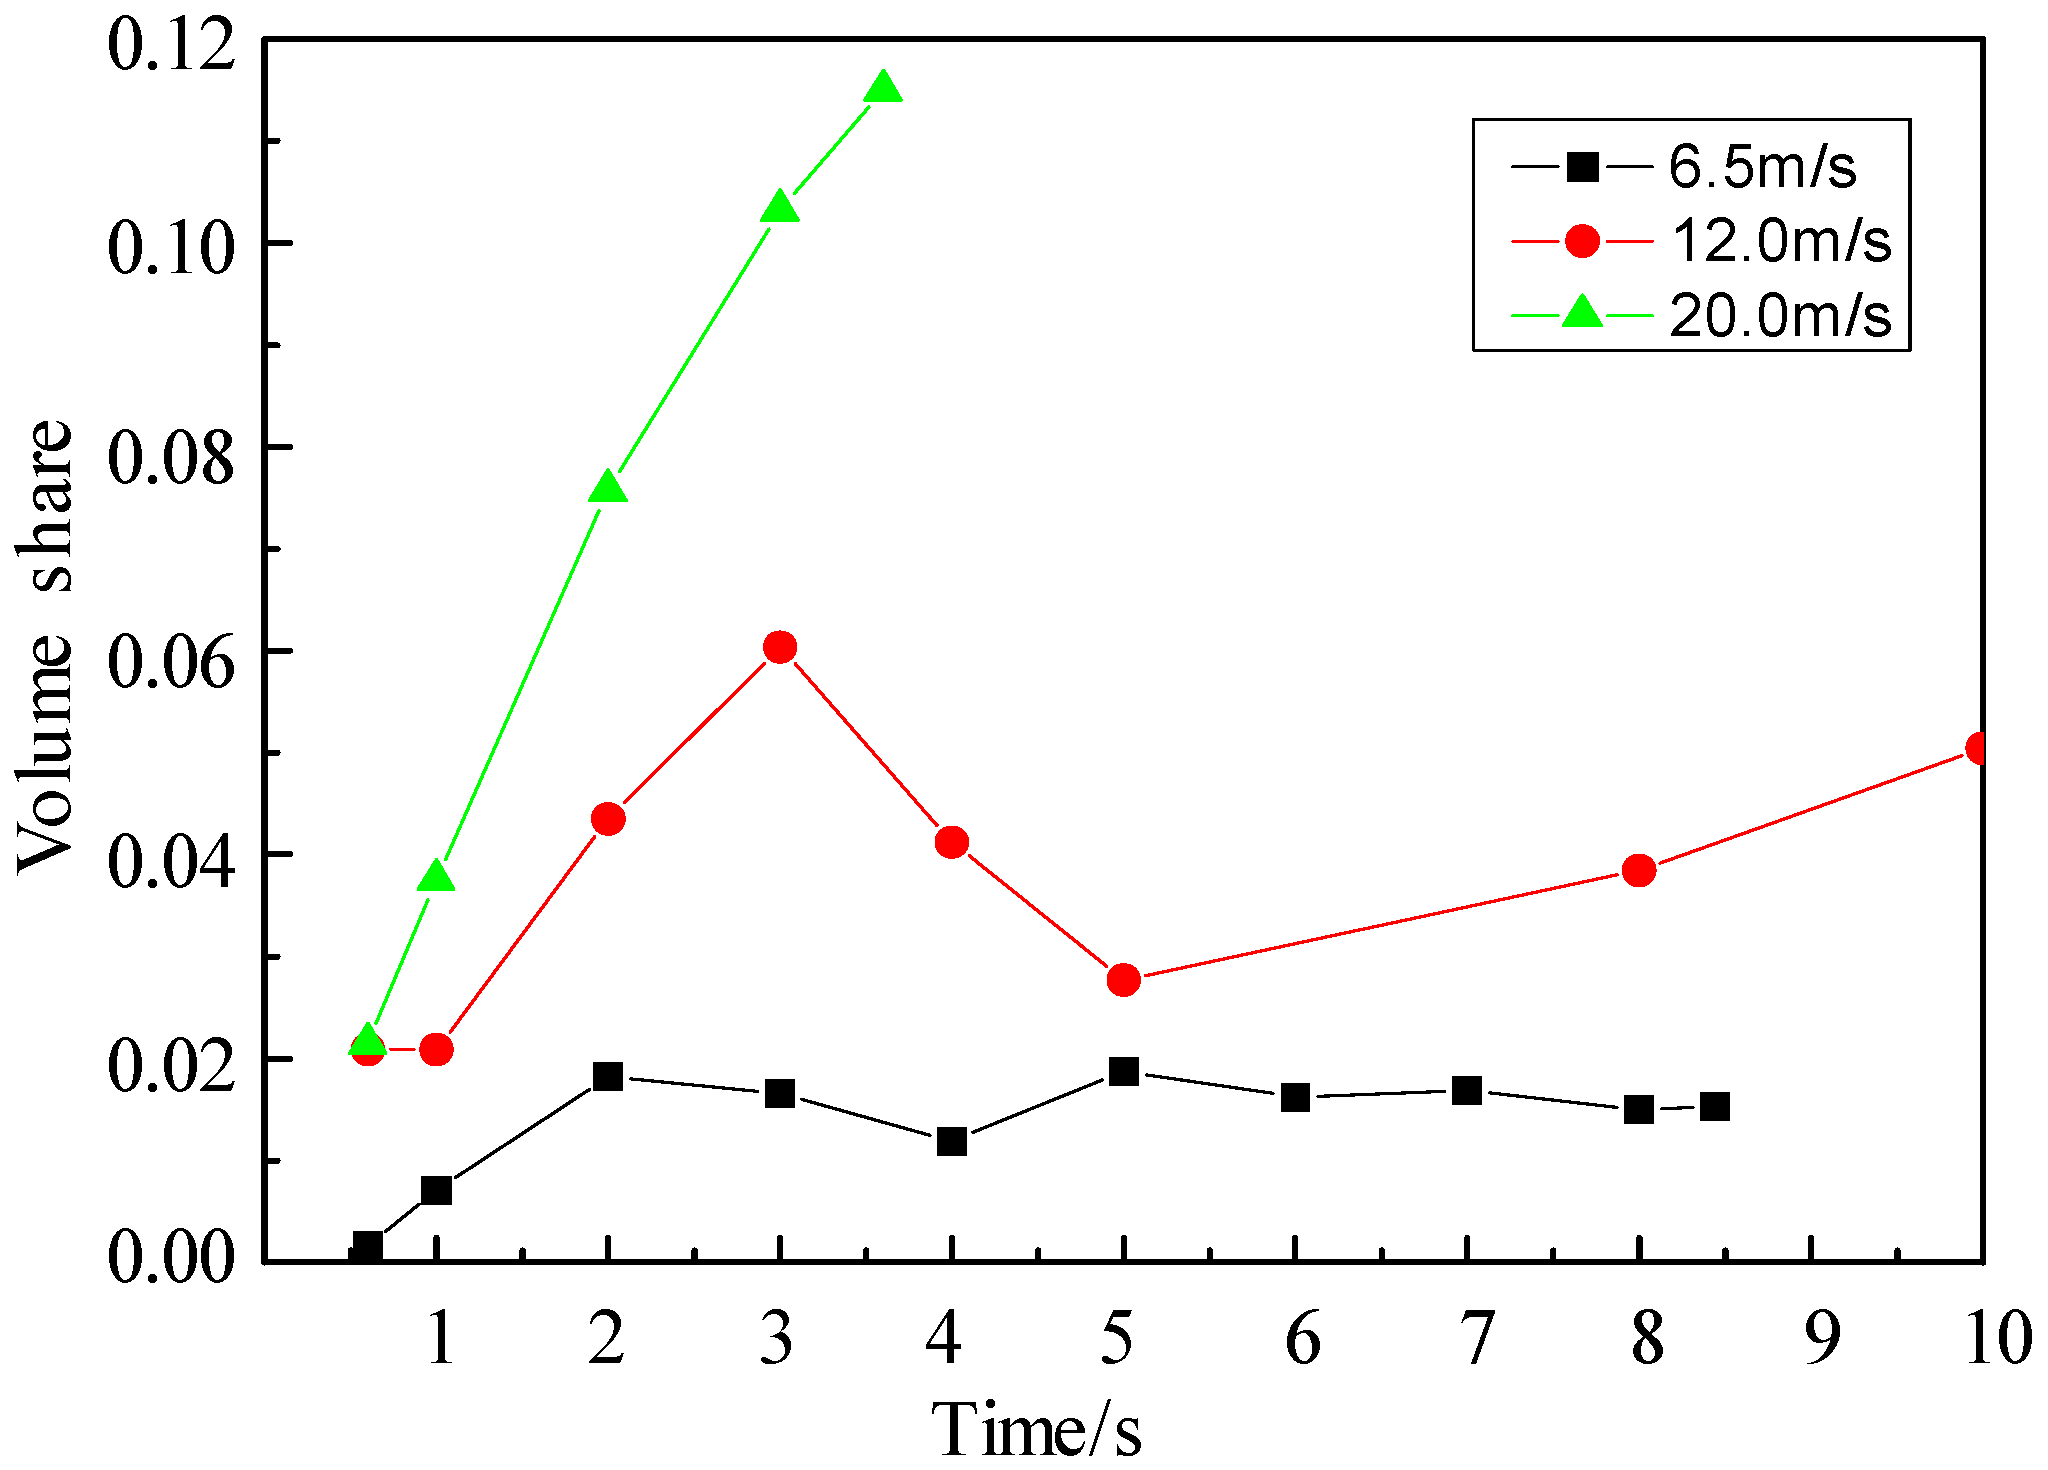
As shown in Figure 21, the amount of slurry reaching the spraying wall increases with the increase in spraying time, and then shows an unstable fluctuation trend. This fluctuation is mainly determined by the viscosity and solidification speed of the slurry. Some slurry will fall under the action of gravity and rebound, as shown in Figure 22.
To sum up, the larger the initial spraying speed is, the more the amount of slurry reaching the wall in the same amount of time, and the larger the continuous area formed on the wall, but the more the rebound amount is. When the initial velocity is small, only a small discontinuous spraying area is formed on the wall.
4. Conclusions

(1) The composite spraying slurry with clay as the main base material has good sealing performance, certain bending resistance, and good adhesion, and can be used in the spraying and air leakage blocking process of shafts and roadways. According to the performance requirements such as density, viscosity, water separation rate, and compressive strength, through an orthogonal test, downhole spraying test, and repeated comparison of wind insulation effect, the mass ratio of composite slurry material is finally determined as clay:cement:additive:engineering fiber = 84:14:1.85:0.15.
(2) The smaller the spraying distance is, the larger the spraying area formed on the side wall in a short time, with a regular shape, but the final spraying area is relatively small. The spraying area increases with the increase in spraying distance, and the simulation results are in agreement with the experimental results. It can also be seen from the volume share of the slurry in the spraying area on the wall that when the spraying distance is large, the slurry thickness is relatively thin. When the spraying distance is small, the spraying layer is obviously thicker and easily flows downward. According to the size of spraying area and spraying uniformity, the spraying distance of 1.5 m is suitable.
(3) When the initial spraying speed is large, the shape of the spraying area is regular, the spraying thickness is large, and the uniformity is adequate. According to the influence of spraying distance, the shape and uniformity of the spraying area are related to the time when the slurry reaches the side wall. The longer the slurry reaches the side wall, the greater the influence of gravity and surrounding fluid, and the more changes along the way, so as to form different spraying areas after reaching the wall. Considering the spraying thickness and uniformity, the initial spraying speed should not be too large.
(4) When the spraying surface is at the top, the spraying process is significantly affected by gravity, and discontinuous spraying areas will be formed on the top surface. Especially when the initial spraying speed is low, the amount of slurry reaching the top surface fluctuates due to rebound and increases with the increase in the initial spraying speed.

Author Contributions

Writing—original draft by J.G.; Data curation by J.G.; Formal analysis by J.G.; Methodology by J.G., S.S.; Project administration by S.S.; Conceptualization by S.S.; Resources by J.G., X.S., Z.Z., Z.S.; Investigation by X.S.; Supervision by X.S.; Visualization by Z.Z.; Validation by Z.S.; Writing—review and editing by B.Z.; Software by B.Z. All authors have read and agreed to the published version of the manuscript.

Funding

This research received no external funding.

Institutional Review Board Statement

Not applicable.

Informed Consent Statement

Not applicable.

Data Availability Statement

The Microsoft Excel Worksheet data used to support the findings of this study are available from the corresponding author ([email protected]) upon request.

Acknowledgments

The authors are grateful to Xuzhou CUMT Backfill Technology Co., Ltd., Honghui No. 1 Coal Mine of Jingyuan Coal Power Co., Ltd., and China University of Mining and Technology for support of this article.

Conflicts of Interest

The authors declare that they have no competing interest.

References

  1. Wang, D.M. Mine Fires; China University of Mining and Technology Press: Xuzhou, China, 2007. [Google Scholar]
  2. Xian, X.F.; Wang, H.T.; Jiang, D.Y.; Liu, B.X. The summarization of the investigation on coal mine fire prevention & fire extinguishing techniques in China. Eng. Sci. 2001, 12, 28–32. [Google Scholar]
  3. Zhou, F.B.; Shi, B.B.; Liu, Y.K.; Song, X.L.; Cheng, J.W.; Hu, S.Y. Coating material of air sealing in coal mine: Clay composite slurry (CCS). Appl. Clay Sci. 2013, 80–81, 299–304. [Google Scholar] [CrossRef]
  4. Yao, J.; Wang, X.; Tian, D.; Zhang, Q. Experimental study on the performance of phosphogypsum and fly ash cemented filler. Min. Res. Dev. 2006, 26, 44–48. [Google Scholar]
  5. Luo, Z.; Deng, J.; Yang, Y. Study on properties of hydrogel sealing filling material in underground disaster areas. J. China Univ. Min. Technol. 2007, 36, 748–751. [Google Scholar]
  6. Wang, S.; Wu, H. Application of new polymer grouting material Malisan in water plugging and shaft wall reinforcement of Wangfenggang No. 1 auxiliary shaft. Friends Chem. Ind. 2007, 1, 40–42. [Google Scholar]
  7. Li, A.; Long, W. Experimental study on light quick setting plugging material. Concrete 2003, 4, 33–34. [Google Scholar]
  8. Hu, C.; Yu, S.; Wang, H. Application of new polymeric materials in prevention and control of spontaneous combustion. Coal Mine Saf. 2003, 34, 35–36. [Google Scholar]
  9. Sun, G.; Liu, Y.; Feng, F.; Sun, H.; Bian, K.; Hu, K. Research progress of polyurethane foam. Mater. Guide 2006, 20, 29–36. [Google Scholar]
  10. Chen, J.; Wang, Z.; Fan, P.; Wang, X. Application of fly ash in underground filling of Xinqiao Pyrite Mine. Met. Mines 2001, 8, 36–38. [Google Scholar]
  11. He, B.; Zhang, Y.; Pan, X.; Zhang, W. Application of rockhew foam fire prevention new material in prevention and control of coal spontaneous combustion. Coal Eng. 2006, 8, 29–30. [Google Scholar]
  12. Wang, J. Study on material ratio and preparation technology of wet high strength shotcrete. Concrete 1994, 5, 27–28. [Google Scholar]
  13. Fan, W.; Geng, Y.; Han, J.; Wang, Y. Study on Parameter Optimization of high performance shotcrete. J. Coal 1999, 24, 481–484. [Google Scholar]
  14. Zhang, B.; Zhou, H.; Chang, Q.; Zhao, X.; Sun, Y. The Stability Analysis of Roadway near Faults under Complex High Stress. Adv. Civ. Eng. 2020, 2020, 8893842. [Google Scholar] [CrossRef]
  15. Han, J.; Wang, F.; Yu, C. Study on characteristics of new modified cement mortar spraying air leakage material. China Min. 2021, 30, 114–119. [Google Scholar]
  16. Zhao, W.; Dong, Q.; Bo, F.; Li, Z.; Wang, J.; Yang, C. Study on the characteristics of composite fire-fighting spray sealing materials. Coal Mine Saf. 2018, 49, 24–28. [Google Scholar]
  17. Li, H.; Xue, F.; Liu, J.; Song, H.; Cheng, F. Field test research on spraying materials for underground coal mine roadway. Energy Chem. Eng. 2015, 36, 73–76. [Google Scholar]
  18. Zhou, F.; Li, J.; Liu, Y.; Yang, L.; Yong, P. New composite slurry spraying materials and their wind insulation characteristics. Acta Coal Sin. 2010, 35, 1155–1159. [Google Scholar]
  19. Sun, B.; Guo, C.; Chen, Z.; Wang, X.; Wang, F. Experimental study on dynamic characteristics of non-aqueous reactive polymer spraying materials. J. Build. Mater. 2022, 1–12. Available online: https://kns.cnki.net/kcms/detail/31.1764.TU.20220726.1921.008.html (accessed on 22 July 2022).
Figure 1. Surface area distribution of different types of pores. (a) Surface area distribution. (b) Specific gravity of surface area.
Sustainability 14 10297 g001
Figure 2. Volume distribution of different types of pores. (a) Volume distribution. (b) Volume specific gravity.
Sustainability 14 10297 g002
Figure 3. Wall bending model of coal seam roadway. (a) Simulated wall. (b) Simulated spray coating.
Sustainability 14 10297 g003
Figure 4. Bending effect diagram of wall simulation experiment plate in coal seam roadway.
Sustainability 14 10297 g004
Figure 5. Calculation of plate curvature of roadway wall simulation experiment.
Sustainability 14 10297 g005
Figure 6. Local roadway structure. (a) Physical model. (b) Grid structure.
Sustainability 14 10297 g006
Figure 7. Spraying process (spraying distance 1.5 m).
Sustainability 14 10297 g007
Figure 8. Vector field of central section.
Sustainability 14 10297 g008
Figure 9. Spraying process under different spraying distances. (a) 0.5 m; (b) 1.0 m; (c) 2.0 m.
Sustainability 14 10297 g009
Figure 10. Variation in spray area under different spray distances. (a) 0.5 m; (b) 1.0 m; (c) 1.5 m; (d) 2.0 m.
Sustainability 14 10297 g010
Figure 11. Variation curve of spraying area under different spraying distances.
Sustainability 14 10297 g011
Figure 12. Variation in volume fraction under different spray distances.
Sustainability 14 10297 g012
Figure 13. The change chart of spraying thickness under different spraying distances. (a) 1.0 m; (b) 1.5 m; (c) 2.0 m.
Sustainability 14 10297 g013
Figure 14. Curve of spraying thickness with time.
Sustainability 14 10297 g014
Figure 15. Experimental and simulation comparison of diffusion diameter.
Sustainability 14 10297 g015
Figure 16. Field effect chart under different injection distance: (a) 0.5 m, (b) 1.0 m, (c) 1.5 m, (d) 2.0 m.
Sustainability 14 10297 g016
Figure 17. Variation in spray form on sidewall at different initial velocities. (a) 6.5 m/s; (b) 10 m/s; (c) 20 m/s.
Sustainability 14 10297 g017
Figure 18. Variation in volume fraction under at different initial velocities.
Sustainability 14 10297 g018
Figure 19. Variation curve of spraying area at different initial velocities.
Sustainability 14 10297 g019
Figure 20. Variation in spraying area on top surface under up spraying condition. (a) 6.5 m/s; (b) 20 m/s.
Sustainability 14 10297 g020
Figure 21. Variation in volume fraction under at different initial velocities.
Sustainability 14 10297 g021
Figure 22. Springback phenomenon under upshot condition. (a) 6.5 m/s; (b) 9 m/s; (c) 12 m/s.
Sustainability 14 10297 g022
Table 1. Viscosity measurement data.
NumberWater Material Mass RatioMeasured Value (MPa.s)Average Value
12:514.3214.12
14.11
13.93
23:512.1912.13
12.08
12.12
34:59.549.51
9.62
9.38
45:57.177.13
7.1
7.13
56:55.355.17
4.98
5.19
Table 2. Basic calculation parameters.
Calculation ParametersNumerical Value
Model length (m)3
Model height (to arch crown) (m)4
Model width (m)4
Nozzle diameter (m)0.03
Distance from wall (m)2/1.5/1.0/0.5
Side air intake (m/s)1.5
Slurry density (kg/m3)2700
Slurry modelHerschel–Bulkley
Air density (kg/m3)1.225
Air viscosity (kg/m−s)1.7894 × 10−5
Surface tension0.1
Ambient pressure P (Pa)101,325
Ambient temperature (T/K)300
Time step (S)2 × 10⁻⁵
Publisher’s Note: MDPI stays neutral with regard to jurisdictional claims in published maps and institutional affiliations.