Article

Identifying Popular Frogs and Attractive Frog Calls from YouTube Data

Department of Biological Science, Kongju National University, Gongju 32588, Korea
*
Author to whom correspondence should be addressed.
Sustainability 2022, 14(16), 10258; https://doi.org/10.3390/su141610258
Submission received: 2 June 2022 / Revised: 15 July 2022 / Accepted: 15 August 2022 / Published: 18 August 2022
(This article belongs to the Special Issue Biodiversity in Freshwater)

Abstract

:
Public interest in and preferences for certain species can sometimes provide an opportunity for conservation and management. Here, we attempted to identify ‘popular’ anurans from YouTube data. In addition, the attractiveness of anuran advertisement-calling sounds were analyzed using acoustic data. By searching YouTube with the search term ‘frog calling’, 250 videos were selected. Of these, 174 videos could be classified according to species; these videos aided in extracting clean calling sounds, free from the overlapping calls of other male frogs, as well as other sounds. To assess the interests and preferences of viewers for different species, the numbers of videos, view counts, ‘likes,’ and ‘dislikes’ were recorded. From the videos, the calls of 78 species belonging to 17 families were identified. Viewer interest was highest for the Hylidae and Ranidae species, which are often discoverable in the field. In addition, invasive frogs had large numbers of videos and large numbers of ‘likes.’ People tended to prefer frogs calling with lower dominant frequencies. However, there were few videos on endangered species, and these garnered relatively less interest than other species. To manage and conserve invasive or endangered frog species, there is a need to increase ecological understanding by adjusting species awareness and charisma.

1. Introduction

With the development of information-technology infrastructure and the Internet, it has become possible to easily acquire large amounts of digital data. Recently, approaches such as conservation culturomics and iEcology, with the purpose of studying natural ecosystems and human interactions with ecosystems using Internet-hosted data, have emerged in the field of ecology [1,2]. Conservation culturomics quantitatively analyzes digitized texts to understand human culture, public perceptions, interests, and preferences regarding species conservation and management [1,3,4,5,6]; iEcology studies a wide range of ecological phenomena using almost all types of data that exist on the Internet. This system of study can provide new ecological insights over wide spatiotemporal ecological ranges at a relatively low expense [2,5,7,8]. Digital data that can be used in ecology exist in various forms, including texts, images, videos, sounds, and online activities; however, most research to date has used visual information or digitized texts [2].
In ecological studies that use digital data, amphibians are one of the least studied biotaxa [2]. Amphibians are distributed worldwide in various ecosystems, from rainforests to deserts, and even in some polar regions; they inhabit almost every continent and form a part of human culture [9]. Amphibians with unique appearances attract widespread attention and have inspired or been used by people in various fields, including culture, art, food, ceremony, and medicine [9,10]. Invasive amphibian species that have been introduced into an ecosystem as a food source or as pets can cause serious disturbances to the ecosystem [11]. Additionally, some species or groups of amphibians are experiencing significant population decline during the largest extinction event in vertebrate history [12,13].
To systematically manage or conserve amphibian species, it is necessary to quantify peoples’ perceptions of amphibians and to identify preferences for specific species or habits to understand the interaction between human culture and amphibian species [10]. In particular, anurans make up most amphibian species and are a group with high species diversity [14]. In addition, they may have an auditory effect on humans, as many anuran species use acoustic signals during reproduction [15]. Frog advertisement calls can generate digital data from acoustic data.
YouTube, the largest global video platform, is provided by Google. With the exception of some countries, videos can be uploaded and viewed all over the world, and abundant data at various spatiotemporal scales have accumulated since 2005. In addition to audiovisual data from videos, YouTube also records online activity data, such as views, likes, and dislikes. These digital data can be used to study species traits and interactions with humans. For example, YouTube data are suitable for citizen science projects and are used in the field of ecology [16,17]. They are particularly well suited to the study of human interactions, as data from YouTube are not intentionally generated to study ecosystems [18,19]. Understanding the interactions between frogs and humans in ecosystems can help to plan the management and conservation of invasive and endangered species.
In this study, we collected video and acoustic data of frog advertisement calls from YouTube to identify the public interest in different frog species (Figure 1). The numbers of videos for frog species and families were identified, along with the view counts, likes, and dislikes. Using this data, we attempted to understand the degrees of interest in common, endangered, and invasive species. Additionally, we identified the relationship between the degree of interest and the calling patterns for each frog.

2. Materials and Methods

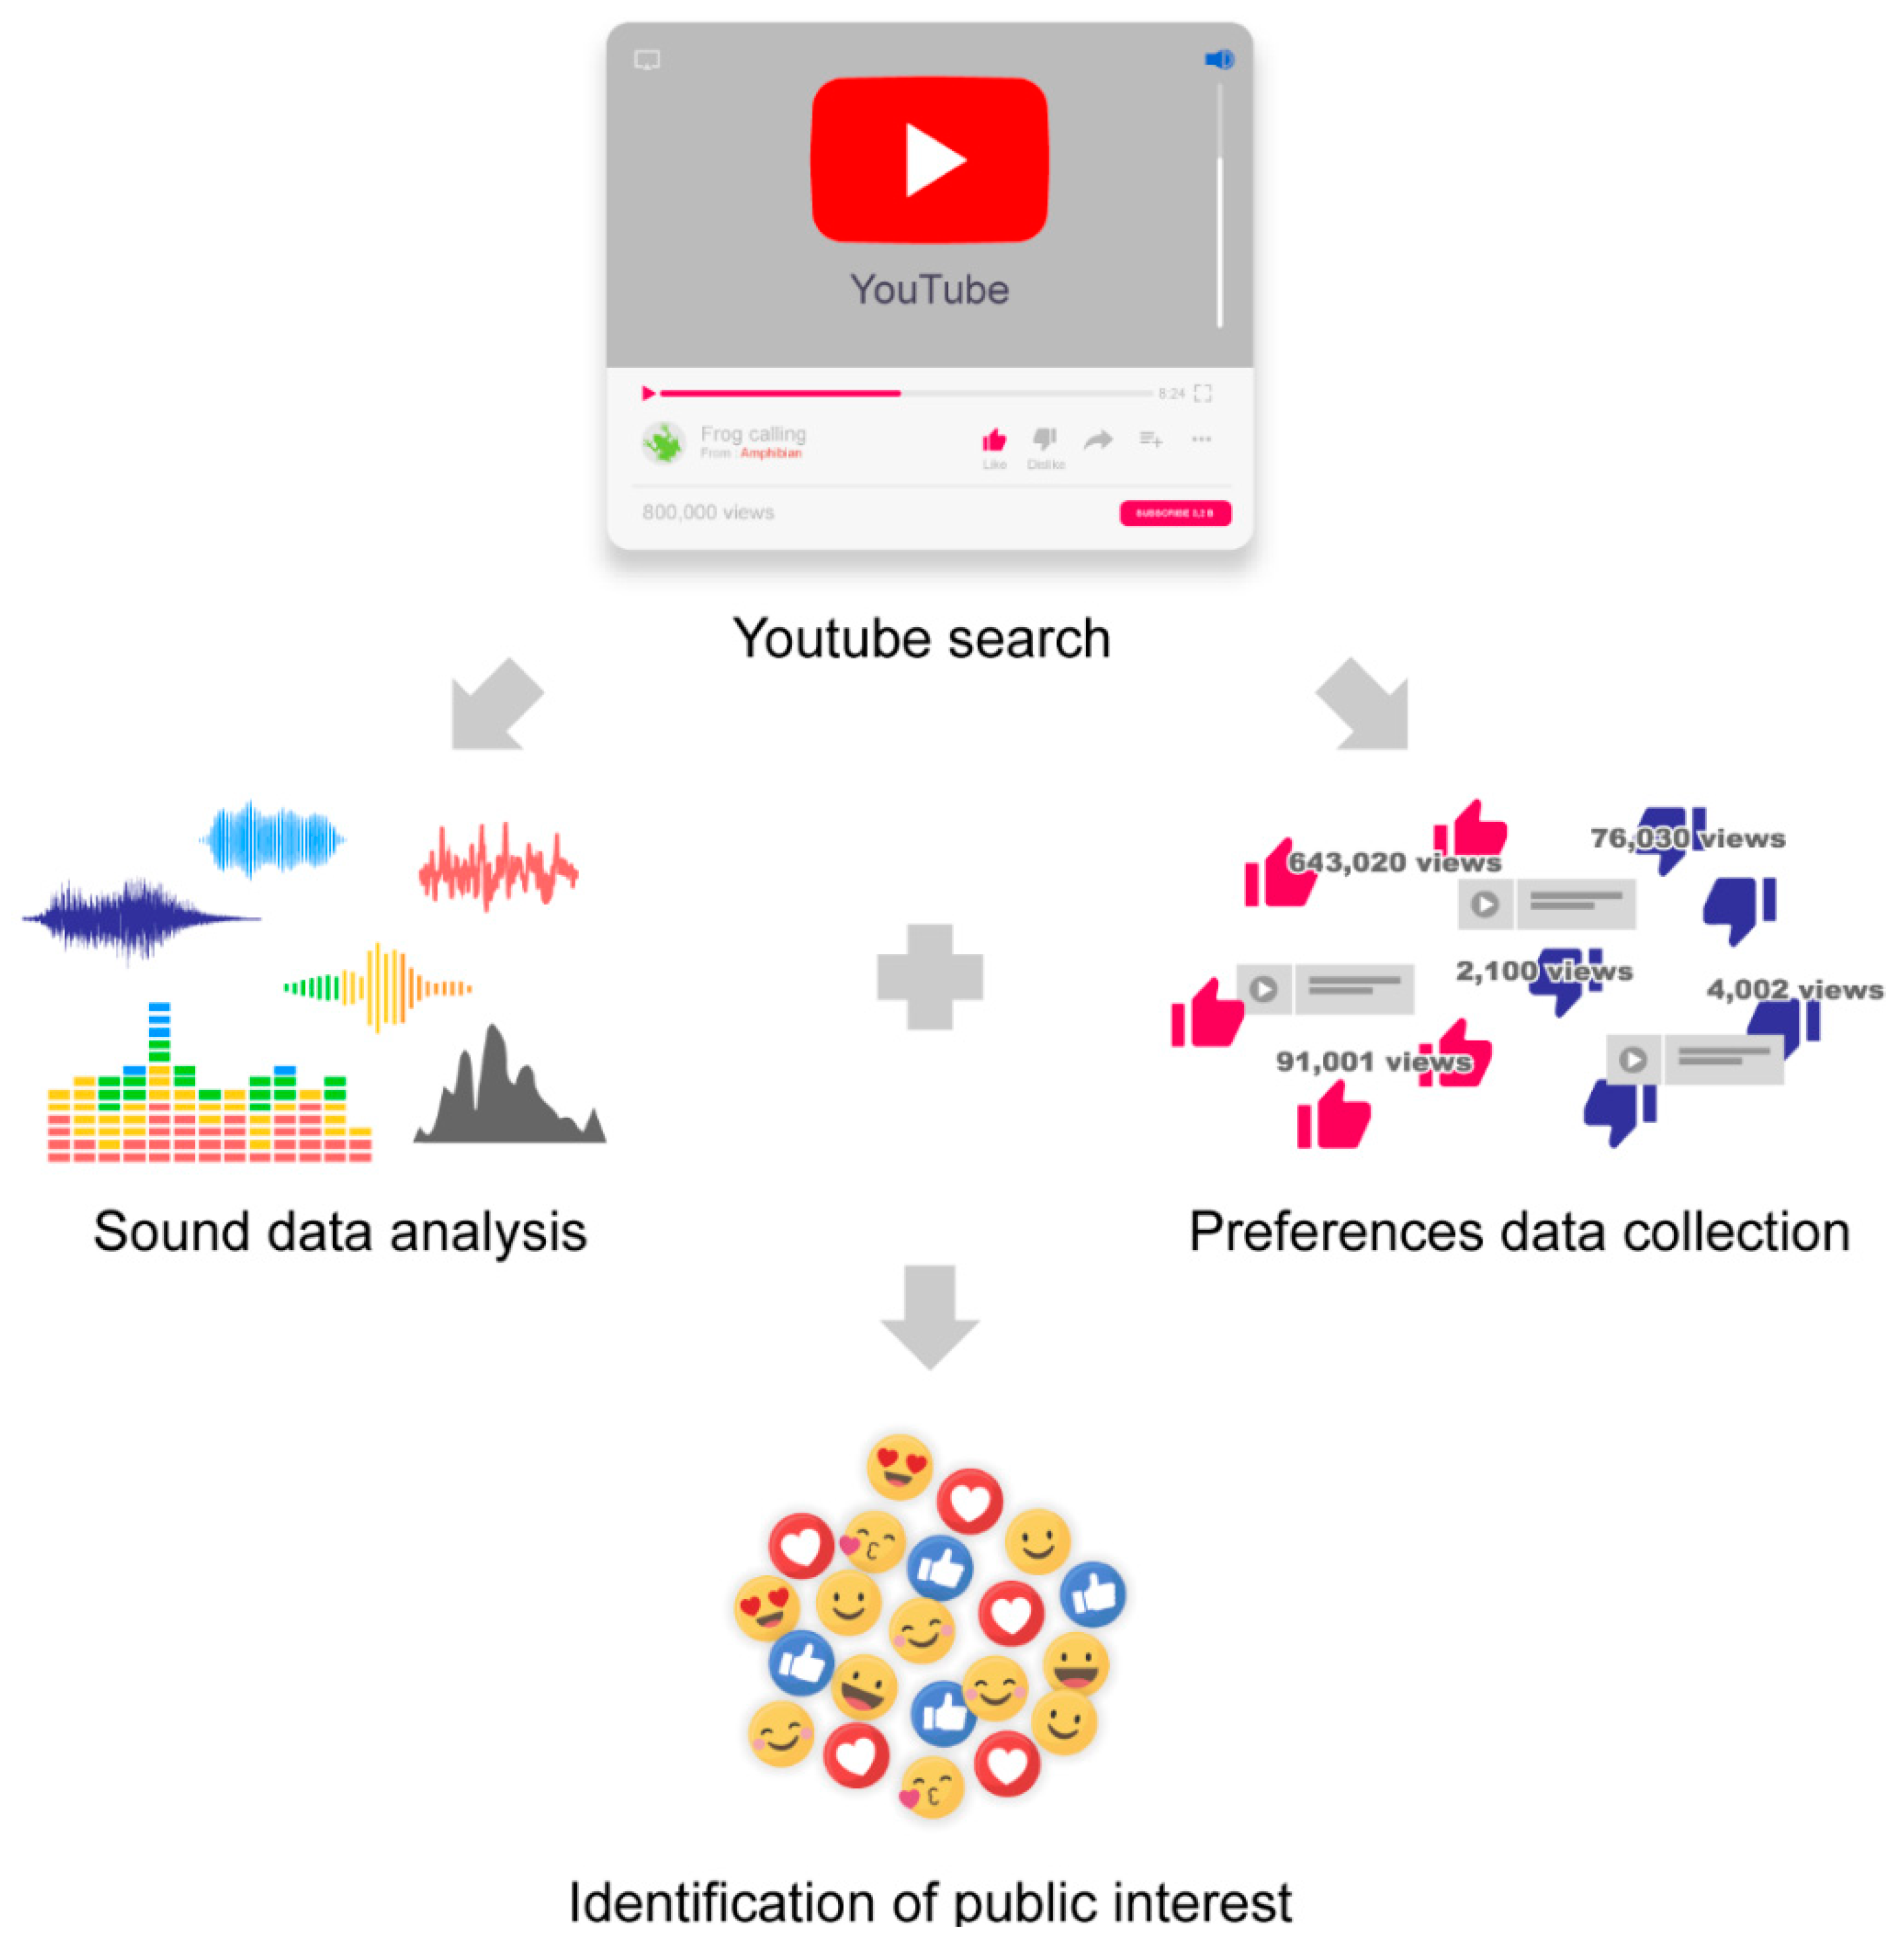
2.1. Data Collection

We collected YouTube video data by searching using the keyword ‘frog calling’. After collecting 250 videos, relevant video data were selected based on several conditions. Only data generated by amateurs were selected. Only video data that clearly contained the advertisement-calling sound of each individual were extracted. Videos that did not focus on an individual, or videos in which the object was not identified, were excluded from the analysis. Species were identified by finding the scientific name or common name in the title or description of the uploaded data, and the identified species was checked once more by comparing the morphology and advertisement-calling characteristics. Any species that was unclear was excluded from the analysis. Finally, the data from 174 videos were collected.
Each species was classified according to family, and the numbers of videos per species and per family were recorded. Species were then checked against the IUCN Red List categories of threatened species (which was confirmed using Amphibiaweb [20]), and against the 100 worst invasive alien species reported in the literature [11].
Upload-date, view-count, like, and dislike data were collected from the page where the video was uploaded. All of these values were collected on 16 February 2021. We judged that the like and dislike values represent the degree of interest, regardless of the upload period or view counts; as such, we used these data as extracted, without dividing by the upload period or expressing them as a percentage of the total. The degree of interest was organized by species and was used to determine the preferences for advertisement calling in frogs.

2.2. Sound Analysis

All video data were converted to an mp3 file for sound analysis. Raven Pro 1.6 software (Cornell Laboratory of Ornithology, Ithaca, NY, USA) was employed to analyze the patterns of advertisement calling in each video. The note duration (i.e., the length of the call note) and the dominant frequency were used for analysis. From 5 to 10 notes, at least, were analyzed in each video.
We analyzed the correlation between the advertisement-calling patterns and degrees of interest via multiple linear regressions; that is, the correlation between the note duration or dominant frequency and the view counts, likes, or dislikes. For regression analysis, a normal Q–Q plot and Shapiro–Wilk test were used to confirm the normality of the residuals. The independence of the residuals was confirmed through the Durbin–Watson test. A scale-location plot was used for the identification of the equal variance of the residuals. The results of the note duration did not fit the regression model (R2 = 0.013, F = 0.747, p = 0.525) and were excluded from the results. These statistical analyses were performed using Jeffrey’s Amazing Statistics Program software, version 0.14.1 [21]. All statistical values were considered significant at p < 0.05.

3. Results

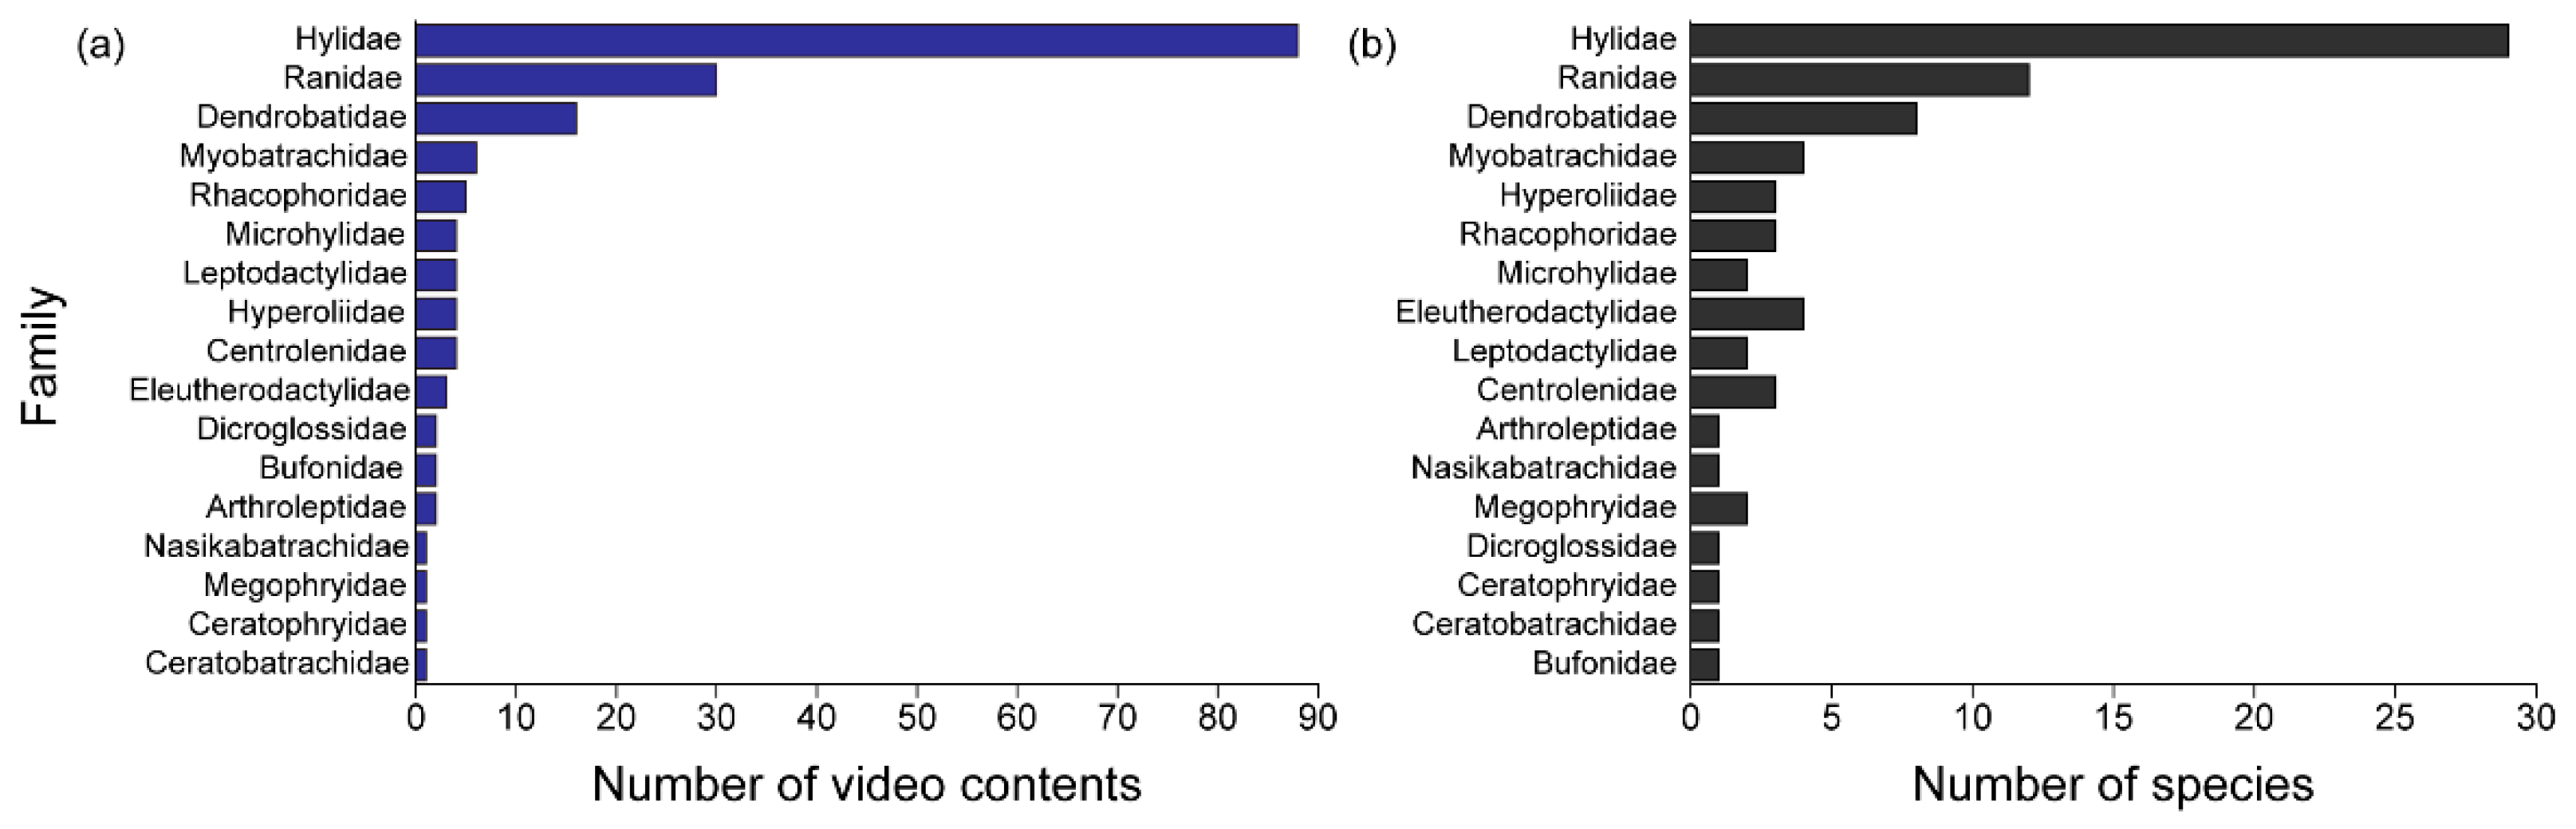
3.1. Anuran Families and Species in Video Data

Among the 174 videos, we identified 78 species belonging to 17 families (Figure 2a). Videos of Hylidae were the most abundant (50.57%, 88 videos), followed by Ranidae (17.24%, 30 videos), Dendrobatidae (9.20%, 16 videos), Myobatrachidae (3.45%, 4 videos), Rhacophoridae (2.87%, 5 videos), Centrolenidae (2.30%, 4 videos), Hyperoliidae (2.30%, 4 videos), Leptodactylidae (2.30%, 4 videos), Microhylidae (2.30%, 4 videos), Eleutherodactylidae (1.72%, 3 videos), Arthroleptidae (1.15%, 2 videos), Bufonidae (1.15%, 2 videos), Dicroglossidae (1.15%, 2 videos), Ceratobatrachidae (0.57%, 1 video), Ceratophryidae (0.57%, 1 video), Megophryidae (0.57%, 1 video), and Nasikabatrachidae (0.57%, 1 video).
The Hylidae family included the greatest number of species (29 species), followed by Ranidae (12 species) and Dendrobatidae (8 species). Other family groups had from one to four species (Figure 2b).

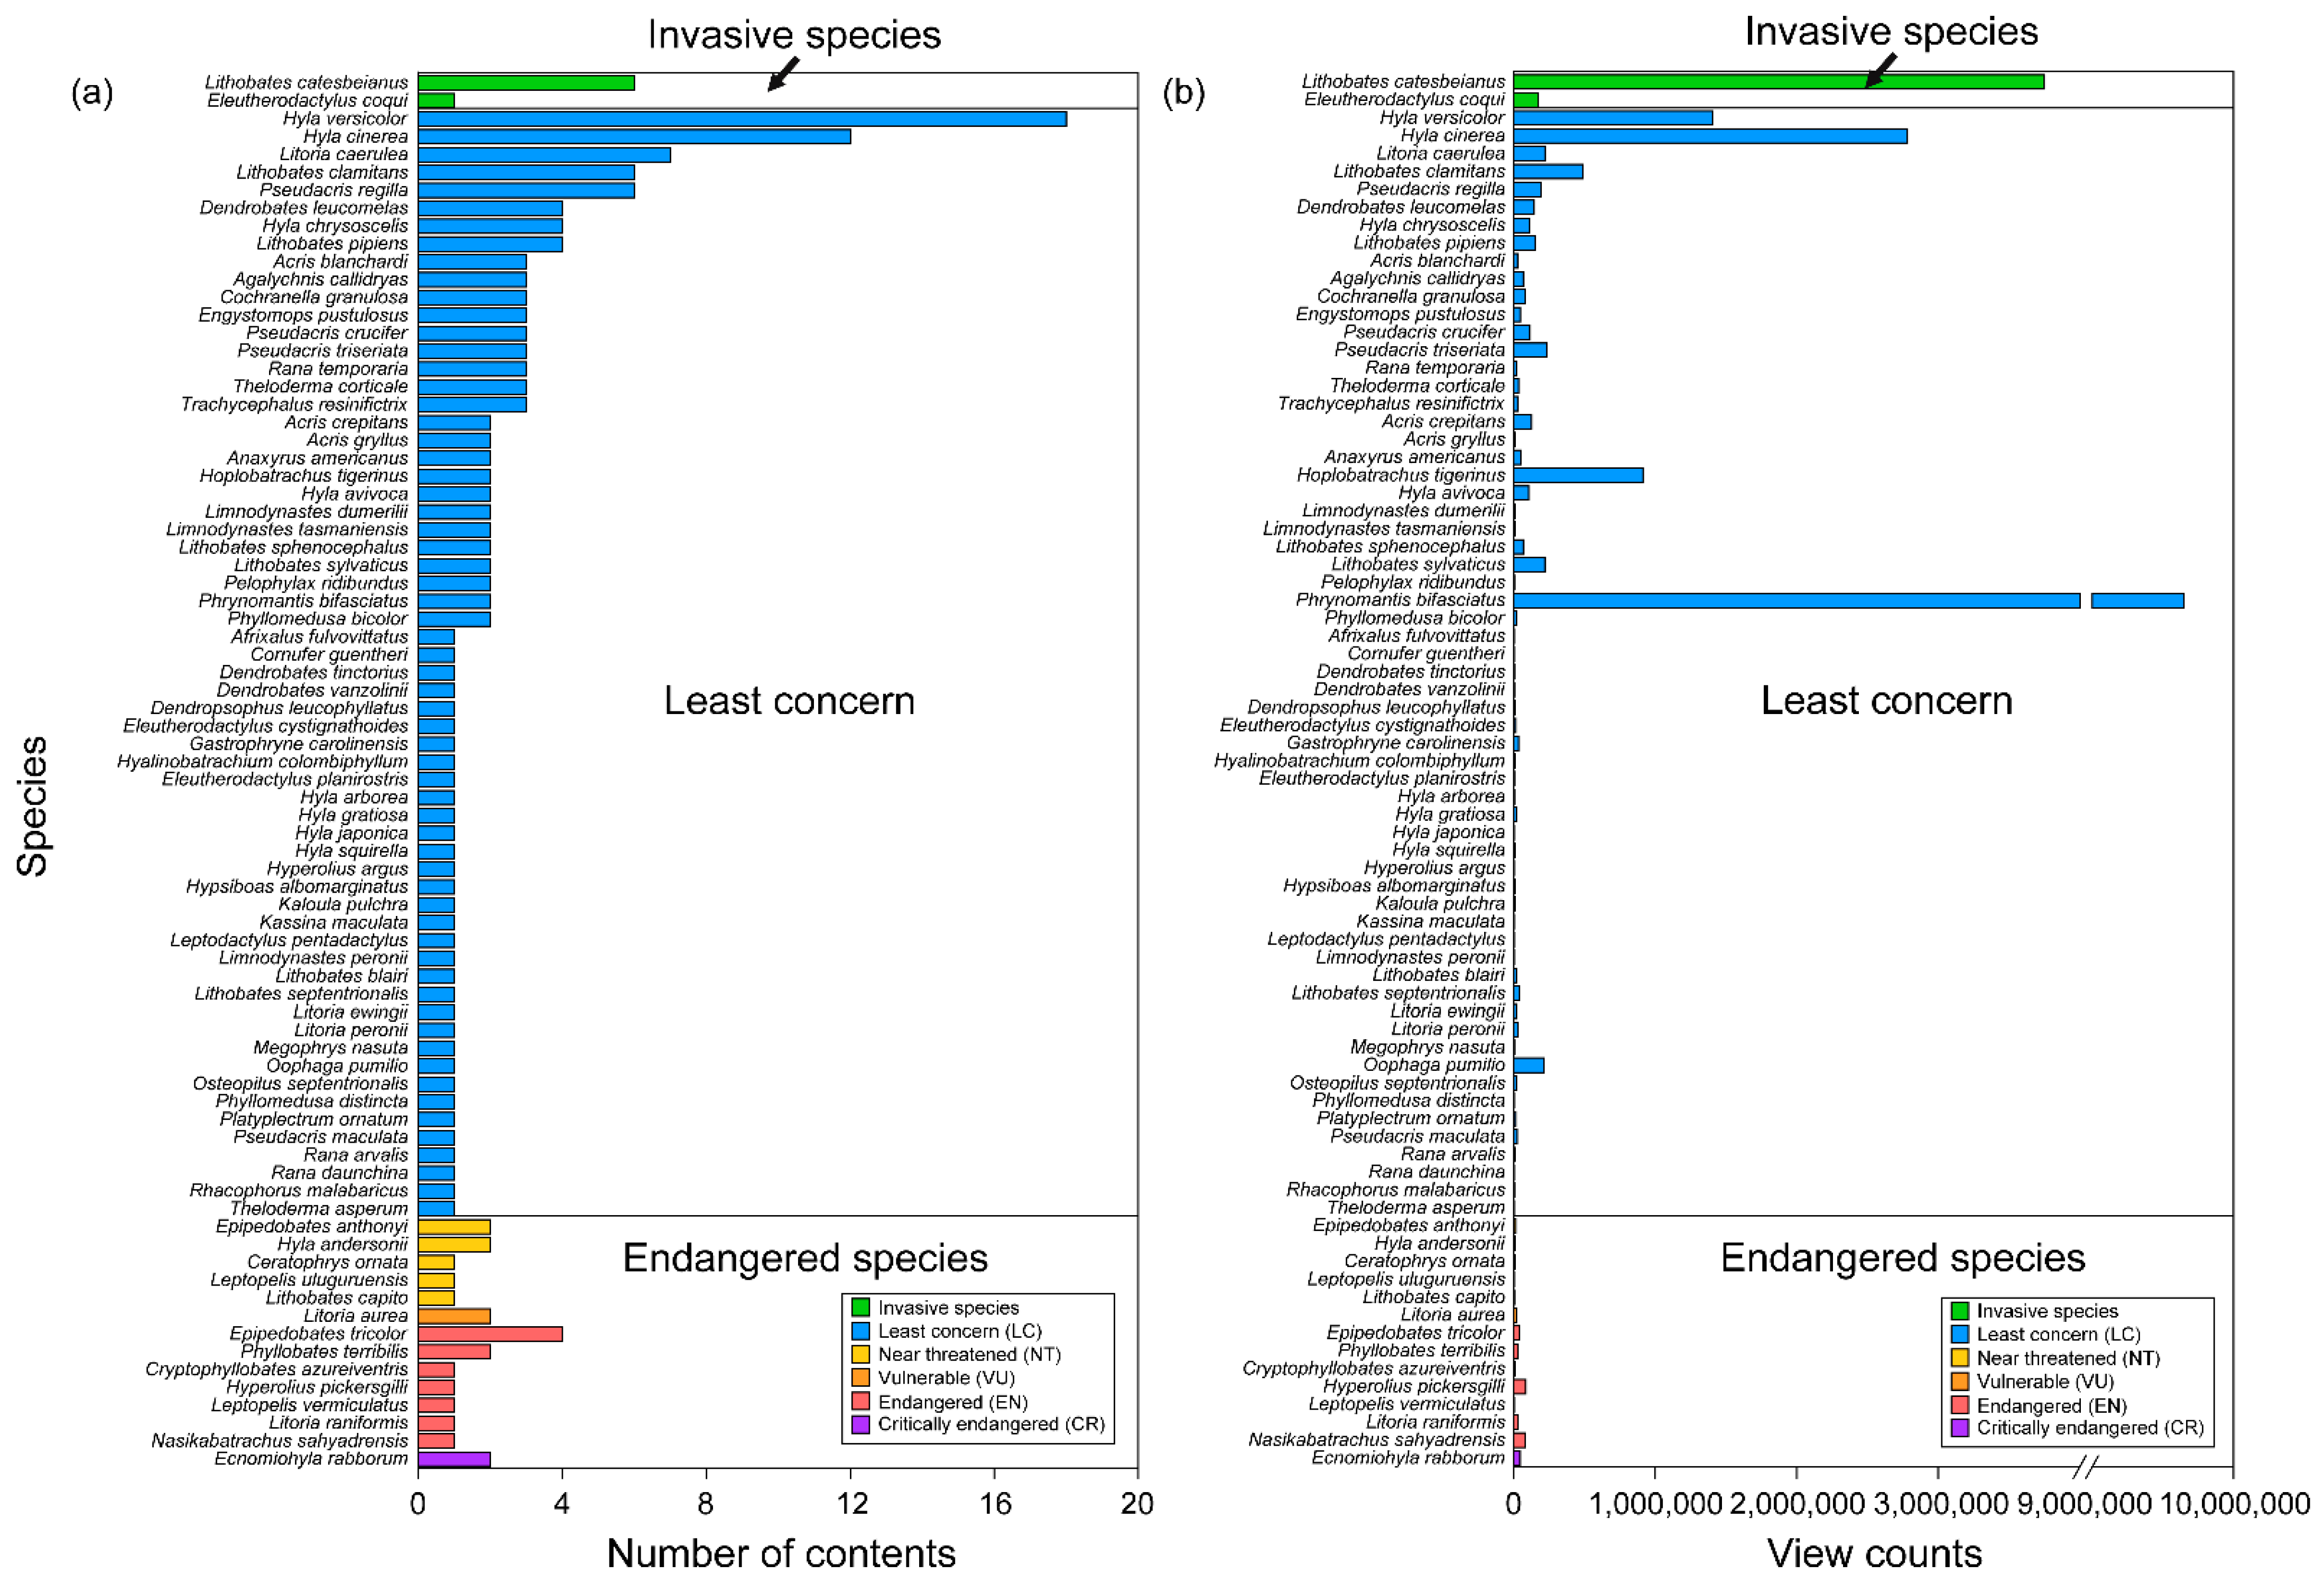
3.2. Number of Videos and Views According to Species

The average number of videos for invasive species was higher than the average number of videos per species overall (Table 1). Species corresponding to the ‘least concern’ level had a similar average number of videos to the average number of videos per species overall. Endangered species had a lower average number of videos than the overall average. View counts were higher for invasive species, and the species corresponding to the ‘least concern’ level had average view counts similar to the average for all species. The view counts were very low for endangered frogs.
The species with the most videos were commonly those that are widely distributed and easy to spot (Figure 3a), including the gray treefrog (Hyla versicolor; 18 videos), followed by the American green tree frog (H. cinerea; 12 videos), Pacific tree frog (Pseudacris regilla; 7 videos), and American bullfrog (Lithobates catesbeianus; 6 videos); the latter is one of the world’s worst invasive alien species and had the highest number of videos among the Ranidae family. In contrast, Common coqui (Eleutherodactylus coqui), another invasive species, had significantly fewer videos. Among the species with an IUCN endangered level of ‘near threatened’ or higher, the phantasmal poison frog (Epipedobates tricolor) had the highest number of videos (four videos). Among other endangered species, the numbers of videos were from one to two.
The banded rubber frog (Phrynomantis bifasciatus) overwhelmingly had the highest view counts (9,645,320 views) among the 78 species, despite having only one video (Figure 3b). Similarly, despite relatively small numbers of videos, the invasive gray treefrog (H. versicolor), American green tree frog (H. cinerea), and American bullfrog (L. catesbeianus) had very high view counts (1,407,734; 2,782,658; 3,752,116 views, respectively). In contrast, the view counts for the most endangered species were lower; among them, the Pickersgill’s reed frog (Hyperolius pickersgilli) had the highest view counts (82,875 views).

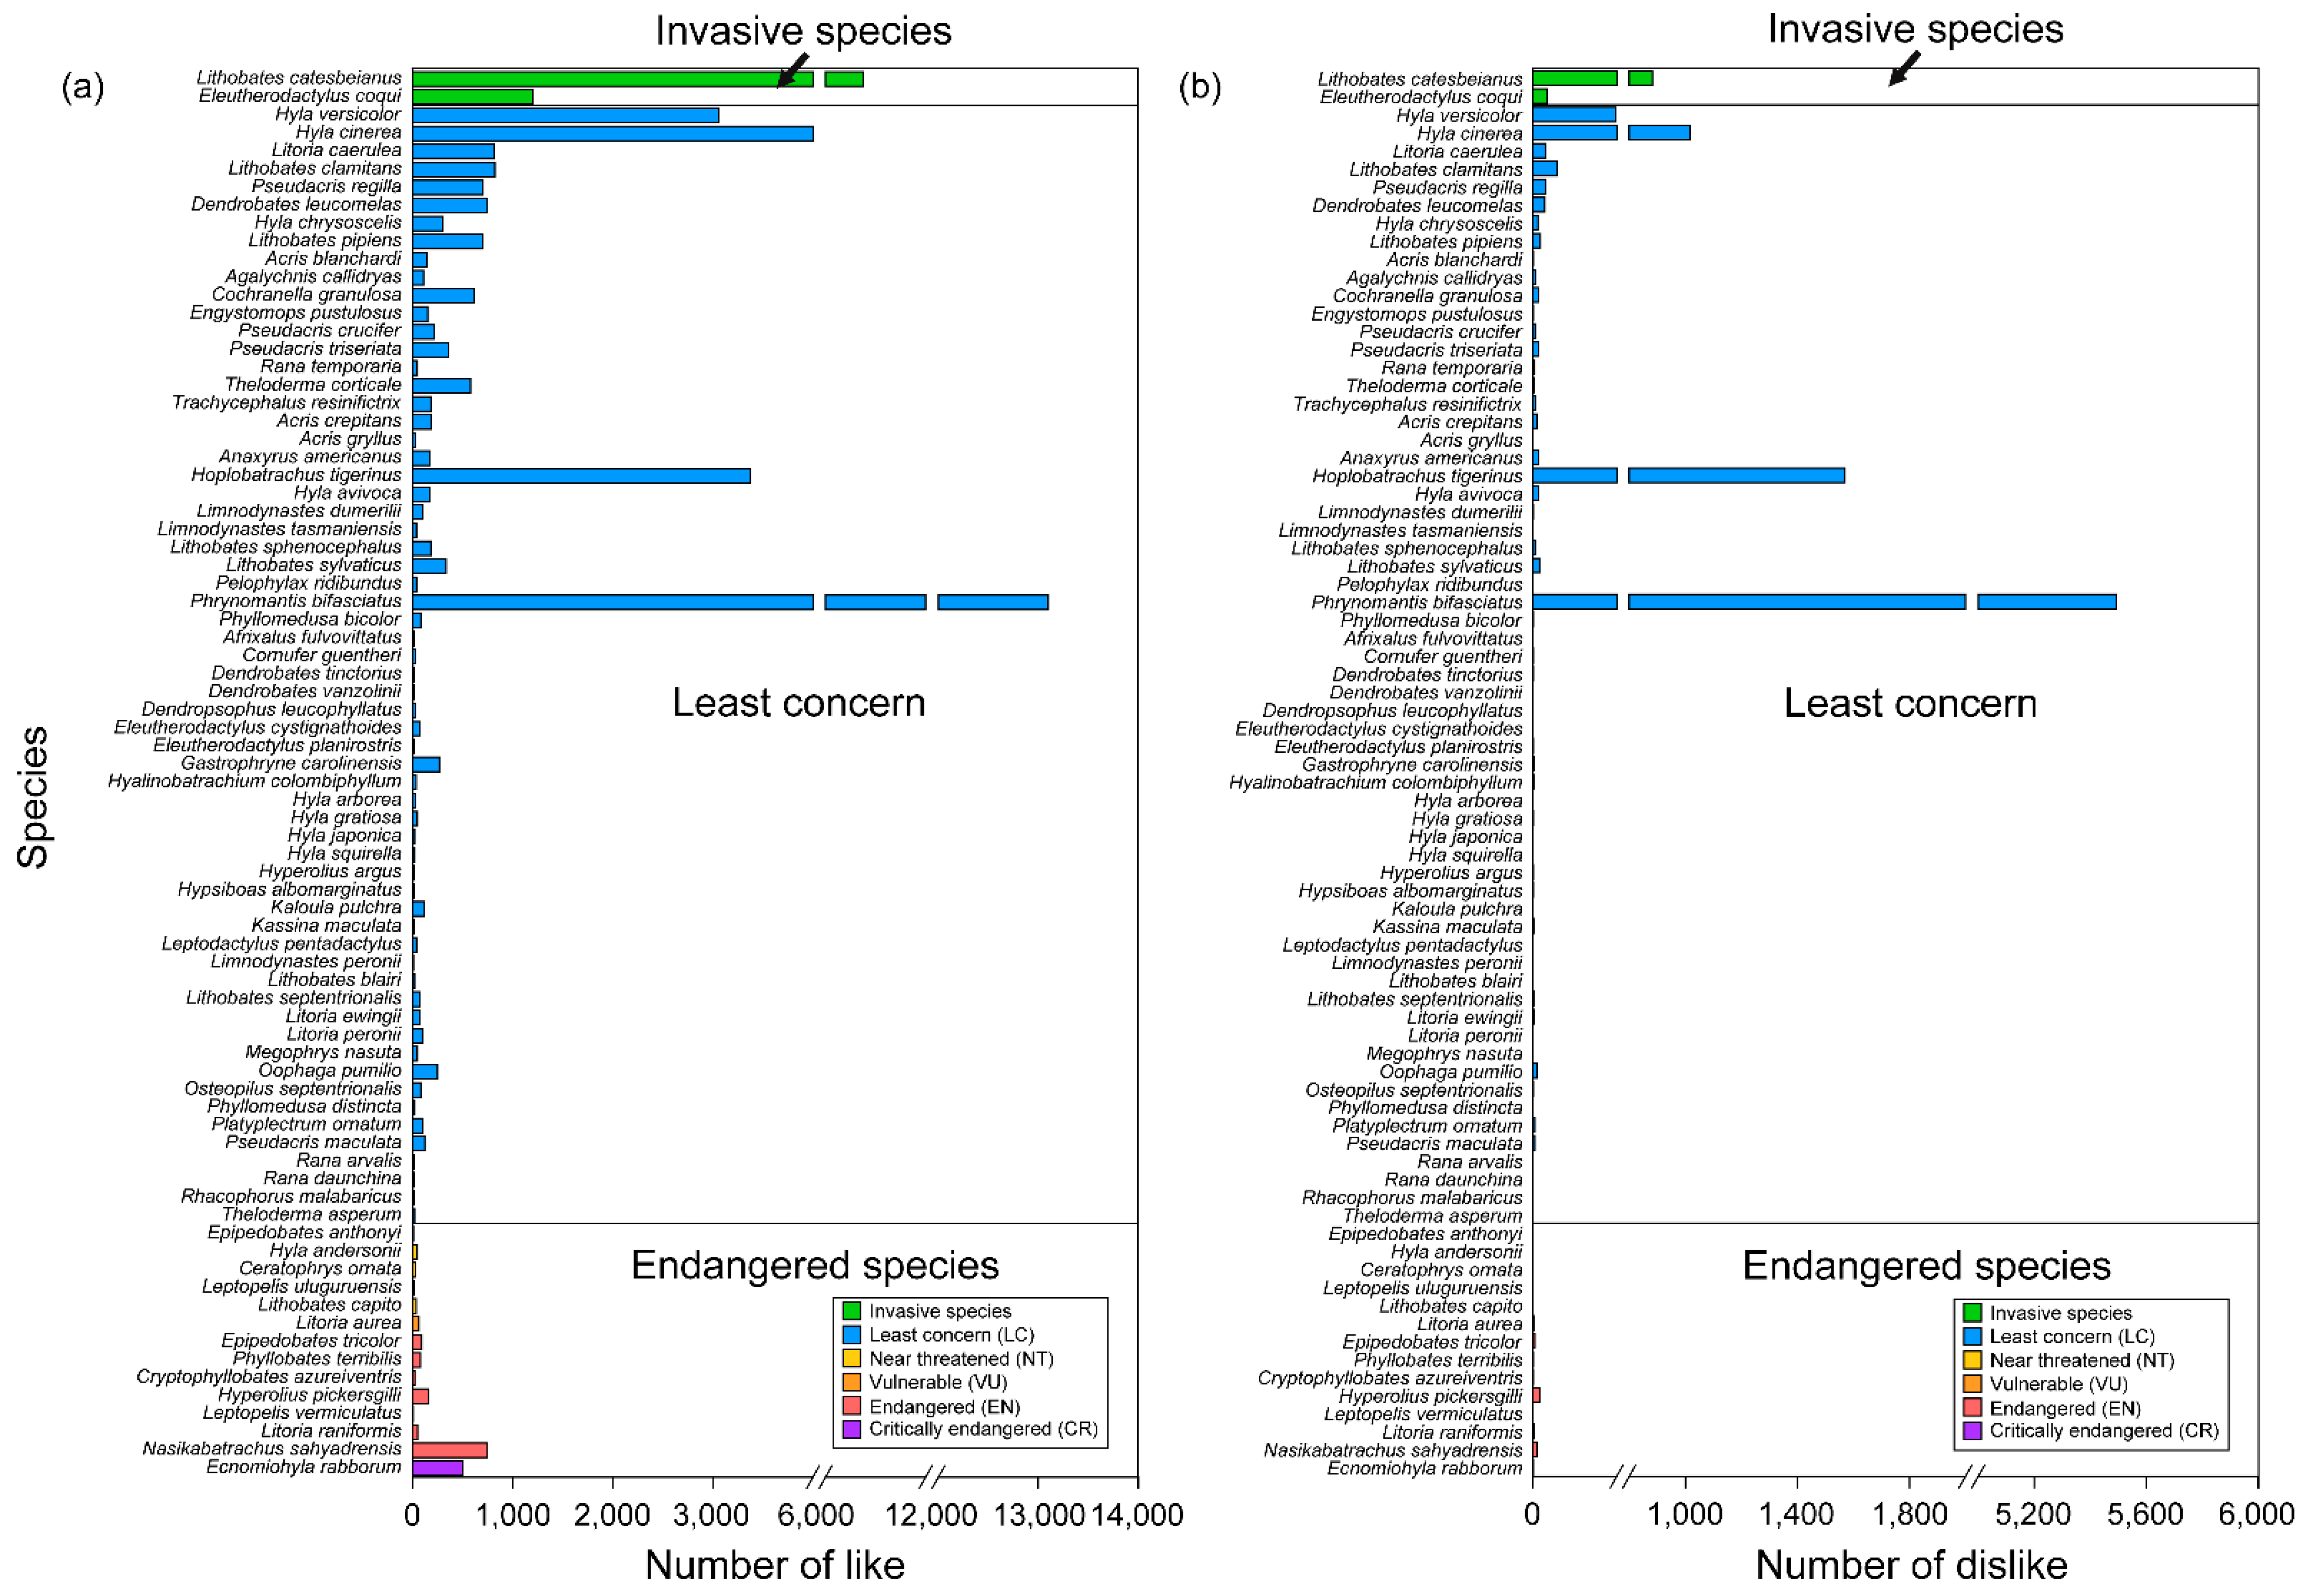
3.3. Likes and Dislikes According to Species

The average number of likes was highest for the invasive species and was similar to the overall average for species corresponding to the ‘least concern’ level (Table 2). The numbers of likes for endangered species were low. Invasive species had a high number of dislikes, and species corresponding to the ‘least concern’ level also had a slightly higher average number of dislikes than that of all species. Endangered frogs had a very low number of dislikes.
The number of likes was highest for the banded rubber frog (P. bifasciatus; 13,100 likes), followed by the American bullfrog (L. catesbeianus; 6376 likes) and American green tree frog (H. cinerea; 4032 likes) (Figure 4a). The gray treefrog (H. versicolor) and Indian bullfrog (Hoplobatrachus tigerinus) also had large numbers of likes (3057 and 3377, respectively). The purple frog (Nasikabatrachus sahyadrensis) had the greatest number of likes (741) among endangered species, followed by the Rabbs’ fringe-limbed treefrog (Ecnomiohyla rabborum; 505 likes). The relatively high numbers of likes for these two species were despite their relatively low view counts.
The banded rubber frog (P. bifasciatus) had the highest number of dislikes (5494; Figure 4b), followed by the Indian bullfrog (H. tigerinus; 1570 dislikes), American green tree frog (H. cinerea; 1016 dislikes), and American bullfrog (L. catesbeianus; 882 dislikes). Most endangered frogs did not have many dislikes.

3.4. Advertisement-Calling Characteristics

Multiple-linear-regression models showed the suitability (F = 2.707, p = 0.047) in the analysis of the dominant frequency (Table 3). View counts tended to increase (t = 1.857) as the dominant frequency increased, but this was not statistically significant (p = 0.065). The number of likes decreased (t = −2.351, p = 0.020) as the dominant frequency increased. The number of dislikes had no significant correlation with the dominant frequency (t = 1.049, p = 0.305).

4. Discussion

With the exception of the American bullfrog, the largest numbers of videos were for species that are commonly and easily observed in each country, rather than for species that are popular worldwide. Tree frogs include the most diverse species of anurans worldwide (1040 of 7462 species, or 13.93%, as of 13 March 2022) [14]; they are so common that they inhabit almost all continents and ecosystems [22]. The gray treefrog (H. chrysoscelis), American green tree frog (H. cinerea), and Pacific tree frog (P. regilla) are widely distributed within their native countries and are commonly observed throughout the year [20]. Additionally, because they are prolonged breeder species that reproduce over a long period of time (rather than explosive breeder species) [23], people are likely to observe their advertisement callings more easily and more frequently. In general, the view counts, likes, and dislikes showed similar patterns to that of the number of videos, suggesting that specific species traits with wide spatiotemporal ranges likely dominate the digital data. This theory should be tested in future work.
The exception to the above was the American bullfrog. This species is popular worldwide, and it had a relatively large number of videos, view counts, and likes from YouTube videos. This shows that ‘popularity’ or species charisma is also an important factor. The American bullfrog is one of the world’s 100 worst invasive species [11], and it is found as a food source in the markets of some countries [24], both of which raise its profile. Moreover, over the past two centuries, it has been introduced around the world [25], and it has a worldwide distribution [26]. Despite its negative image (e.g., the damage it causes to ecosystems), the numbers of likes and dislikes were both high. Although there is currently no exact definition of species charisma [27], it is sometimes regarded as a subjective perception and value of a species that is felt through body size, unique appearance, fear, and beauty [28,29,30,31]. In particular, invasive species are directly and indirectly linked with charisma. Species with high-charisma traits (e.g., cuteness, a beautiful color, and unique behavior) are often introduced to aquariums or pet markets, and as such, they spread as invasive species [30]. Charisma is sometimes established after being introduced by expressions and perceptions in indirect sources of information, such as the media or social networks [30]. To effectively manage invasive species, it is necessary to refrain from exaggerating expressions in the media to influence public perception.
In contrast, the number of videos of endangered frog species is very small. Although the numbers of likes are relatively high given the numbers of videos and view counts, public interest in endangered frog species appears to be low. These results may be due to the rarity of a species because of limited geographical distribution and/or the fact that they are of endangered status. Restrictions on approaches or observations may result in a lack of interest from people. Meanwhile, a previous study showed that the endangered status of a species did not attract the attention of people in a conservation program, but rather, the charisma of the species was a factor due to which the interest of people and activeness in participating in the program were high [32]. Another study showed that the combination of threat to a species and its charisma has positive effects on the willingness to pay for an endangered species [33]. However, our results show that a lack of charisma is not the only reason for the low interest in endangered species. Some endangered species are popular as pets and are traded in international markets [34]. High demand is based on traits such as a beautiful color or unique shape, rather than random selection [30,35]. Of the 14 endangered frog species analyzed in this study, 4 poisonous frogs fall under the CITES rating (Appendix II) and are traded as popular pets in some countries [36]. We suggest that the low numbers of videos and view counts of endangered species is likely because their potential charisma is not recognized. To encourage effective conservation efforts for endangered species, it is necessary to discover animals’ unique aspects, and to promote their images in an attractive and favorable manner; one such platform for this is YouTube.
Unlike the view counts and number of dislikes, which were not correlated with acoustic traits, lower-frequency frog calls were associated with a greater number of likes. In soundscapes, people tend to prefer natural sounds over artificial sounds [37,38], with most natural sounds having a positive effect on health or psychology [39,40]. In particular, some people have a higher preference for biological sounds [41]. Indeed, preferences for the sounds of animals, such as birds and insects, have been studied, and people have different preferences depending on the parameters and complexity of the sound [42,43]. Our results suggest that the acoustic traits of a frog can also impact peoples’ preferences. The quantification of social and environmental preferences for frog calling could help in urban wetland restoration or recreational planning. In particular, most frogs are found near wetlands because of their high dependence on water. Frog calling could be used to improve the culture service of urban wetlands, and preferences for the advertisement callings of frogs should be reflected in these management decisions.
To the best of our knowledge, few studies have used acoustic data to analyze species preferences. However, this study has some limitations. The numbers of videos, view counts, likes, and dislikes do not simply reflect the responses to acoustic data, as videos also provide visual information. We attempted to exclude visual information other than the external characteristics of the frogs by excluding videos that did not focus on the individuals. Nevertheless, we cannot completely exclude the impact of visual information in the view-count, like, and dislike data. In addition, we did not standardize the number of likes and dislikes based on the date on which the video was posted or the number of view counts. Guidance on how to quantitatively analyze species interests and preferences through data standardization may be needed in the future. Although we were able to understand some of the factors that determined the overall interest and preferences based on common species, invasive species, and endangered species, we did not find a common factor for the overwhelmingly high numbers of views or dislikes for some specific species, such as the banded rubber frog (P. bifasciatus) or Indian bullfrog (H. tigerinus). This may reflect the influence of visual information, the recognition of the species in each country, and/or the standardization of the data uploaded to YouTube. Finally, we did not analyze the data on all frog videos; instead, we only extracted videos of species with advertisement callings based on the keyword search of ‘frog calling’ to enable the use of acoustic data. Possibly because of this exclusion, fewer videos of several anuran families were collected. Even after testing and attempting to resolve this, there may have been an undetected issue with the sample size. Future research needs to draw results with more diverse keywords and larger sample sizes. However, the overall perceptions of invasive, common, and endangered species found in this study may not be significantly different from those of previous studies.
In future work, we plan to expand our analysis of peoples’ perceptions, interests, and preferences by adding various additional types of digital data, including digitized texts, expressions of emotions, and social-network activity.

5. Conclusions

The results of our study suggest that people preferentially create videos on species that are commonly encountered in comparison with those of rare and unique species. In the case of invasive species, it was expected that people would dislike them because of their ecological impact, but the numbers of likes were surprisingly high. These results may reflect the high charisma of these species. Interest in endangered species is low, but preference does appear to be high compared with the level of interest. To better conserve endangered anurans, we suggest that there is a need to maximize the attractiveness of endangered species by instilling awareness or charisma regarding the species. In particular, audiovisual information offers an important channel to identify and promote their attractiveness. Increased public interest will be beneficial to the species conservation and management of anurans.

Author Contributions

Conceptualization, Y.D. and J.-K.P.; methodology, J.-K.P. and W.-B.P.; software, D.Y; validation, Y.D.; formal analysis, J.-K.P. and W.-B.P.; investigation, J.-K.P. and W.-B.P.; resources, Y.D.; data curation, J.-K.P. and W.-B.P.; writing—original draft preparation, J.-K.P.; writing—review and editing, Y.D.; visualization, J.-K.P.; supervision, Y.D.; project administration, Y.D.; funding acquisition, Y.D. All authors have read and agreed to the published version of the manuscript.

Funding

This research was performed as Project No Open Innovation R&D (21-BW-001) and was supported by K-water and the National Research Foundation of Korea (NRF) (grant funded by the Korea government (MSIT) (No. 2022R1A2C1004240)).

Institutional Review Board Statement

Not applicable.

Informed Consent Statement

Not applicable.

Data Availability Statement

Not applicable.

Conflicts of Interest

The authors declare no conflict of interest.

References

  1. Ladle, R.J.; Correia, R.A.; Do, Y.; Joo, G.J.; Malhado, A.C.; Proulx, R.; Roberge, J.M.; Jepson, P. Conservation culturomics. Front. Ecol. Environ. 2016, 14, 269–275. [Google Scholar] [CrossRef]
  2. Jarić, I.; Correia, R.A.; Brook, B.W.; Buettel, J.C.; Courchamp, F.; Di Minin, E.; Firth, J.A.; Gaston, K.J.; Jepson, P.; Kalinkat, G. iEcology: Harnessing large online resources to generate ecological insights. Trends Ecol. Evol. 2020, 35, 630–639. [Google Scholar] [CrossRef]
  3. Do, Y. Valuating aesthetic benefits of cultural ecosystem services using conservation culturomics. Ecosyst. Serv. 2019, 36, 100894. [Google Scholar] [CrossRef]
  4. Troumbis, A.Y.; Iosifidis, S. A decade of Google Trends-based Conservation culturomics research: A critical evaluation of an evolving epistemology. Biol. Conserv. 2020, 248, 108647. [Google Scholar] [CrossRef]
  5. Jarić, I.; Roll, U.; Arlinghaus, R.; Belmaker, J.; Chen, Y.; China, V.; Douda, K.; Essl, F.; Jähnig, S.C.; Jeschke, J.M. Expanding conservation culturomics and iEcology from terrestrial to aquatic realms. PLoS Biol. 2020, 18, e3000935. [Google Scholar] [CrossRef]
  6. Correia, R.A.; Ladle, R.; Jarić, I.; Malhado, A.C.; Mittermeier, J.C.; Roll, U.; Soriano-Redondo, A.; Veríssimo, D.; Fink, C.; Hausmann, A. Digital data sources and methods for conservation culturomics. Conserv. Biol. 2021, 35, 398–411. [Google Scholar] [CrossRef]
  7. LaDeau, S.; Han, B.; Rosi-Marshall, E.; Weathers, K. The next decade of big data in ecosystem science. Ecosystems 2017, 20, 274–283. [Google Scholar] [CrossRef]
  8. Jarić, I.; Bellard, C.; Correia, R.; Courchamp, F.; Douda, K.; Essl, F.; Jeschke, J.; Kalinkat, G.; Kalous, L.; Lennox, R. Invasion culturomics and iEcology. Conserv. Biol. 2021, 35, 447–451. [Google Scholar] [CrossRef] [PubMed]
  9. Wake, D.B.; Koo, M.S. Amphibians. Curr. Biol. 2018, 28, R1237–R1241. [Google Scholar] [CrossRef]
  10. AmphibiaWeb. Amphibians and People. Available online: https://amphibiaweb.org/declines/people.html (accessed on 13 April 2022).
  11. Lowe, S.; Browne, M.; Boudjelas, S.; De Poorter, M. 100 of the World’s Worst Invasive Alien Species: A Selection from the Global Invasive Species Database; Invasive Species Specialist Group (ISSG, Species Survival Commission of the International Union for the Conservation of Nature): Auckland, New Zealand, 2000. [Google Scholar]
  12. Collins, J.P.; Storfer, A. Global amphibian declines: Sorting the hypotheses. Divers. Distrib. 2003, 9, 89–98. [Google Scholar] [CrossRef]
  13. Stuart, S.N.; Chanson, J.S.; Cox, N.A.; Young, B.E.; Rodrigues, A.S.; Fischman, D.L.; Waller, R.W. Status and trends of amphibian declines and extinctions worldwide. Science 2004, 306, 1783–1786. [Google Scholar] [CrossRef] [PubMed]
  14. AmphibiaWeb. Browse by Family. Available online: https://amphibiaweb.org/lists/index.shtml (accessed on 13 April 2022).
  15. Wells, K.D. Anuran Vocal Communication. In The Ecology and Behavior of Amphibians; Wells, K.D., Ed.; University of Chicago Press: Chicago, IL, USA, 2007; pp. 268–337. [Google Scholar]
  16. Dylewski, Ł.; Mikula, P.; Tryjanowski, P.; Morelli, F.; Yosef, R. Social media and scientific research are complementary—YouTube and shrikes as a case study. Sci. Nat. 2017, 104, 48. [Google Scholar] [CrossRef] [PubMed]
  17. Jagiello, Z.A.; Dyderski, M.K.; Dylewski, Ł. What can we learn about the behaviour of red and grey squirrels from YouTube? Ecol. Inform. 2019, 51, 52–60. [Google Scholar] [CrossRef]
  18. Hampton, S.E.; Strasser, C.A.; Tewksbury, J.J.; Gram, W.K.; Budden, A.E.; Batcheller, A.L.; Duke, C.S.; Porter, J.H. Big data and the future of ecology. Front. Ecol. Environ. 2013, 11, 156–162. [Google Scholar] [CrossRef]
  19. Michener, W.K.; Jones, M.B. Ecoinformatics: Supporting ecology as a data-intensive science. Trends Ecol. Evol. 2012, 27, 85–93. [Google Scholar] [CrossRef]
  20. AmphibiaWeb. AmphibiaWeb. Available online: https://amphibiaweb.org (accessed on 13 April 2022).
  21. JASP Team. JASP (Version 0.14.1) [Computer Software]. 2020. Available online: https://jasp-stats.org/ (accessed on 14 May 2022).
  22. AmphibiaWeb. Hylidae. Available online: https://amphibiaweb.org/lists/Hylidae.shtml (accessed on 13 April 2022).
  23. Conant, R.; Collins, J.T. A Field Guide to Reptiles & Amphibians: Eastern and Central North America; Houghton Mifflin Harcourt: Boston, MA, USA, 1998; Volume 12. [Google Scholar]
  24. Altherr, S.; Goyenechea, A.; Schubert, D.J. The International Trade in Frogs’ Legs and Its Ecological Impact; Pro Wildlife Munich (DE): München, Germany, 2011. [Google Scholar]
  25. Lever, C. Naturalized Amphibians and Reptiles of the World; Oxford University Press: New York, NY, USA, 2003. [Google Scholar]
  26. AmphibiaWeb. Rana Catesbeiana: Bullfrog. Available online: https://amphibiaweb.org/species/4999 (accessed on 13 April 2022).
  27. Albert, C.; Luque, G.M.; Courchamp, F. The twenty most charismatic species. PLoS ONE 2018, 13, e0199149. [Google Scholar] [CrossRef]
  28. Lorimer, J. Nonhuman charisma. Environ. Plan. D: Soc. Space 2007, 25, 911–932. [Google Scholar] [CrossRef]
  29. Crowley, S.L.; Hinchliffe, S.; McDonald, R.A. The parakeet protectors: Understanding opposition to introduced species management. J. Environ. Manag. 2019, 229, 120–132. [Google Scholar] [CrossRef]
  30. Jarić, I.; Courchamp, F.; Correia, R.A.; Crowley, S.L.; Essl, F.; Fischer, A.; González-Moreno, P.; Kalinkat, G.; Lambin, X.; Lenzner, B. The role of species charisma in biological invasions. Front. Ecol. Environ. 2020, 18, 345–353. [Google Scholar] [CrossRef]
  31. Beever, E.A.; Simberloff, D.; Crowley, S.L.; Al-Chokhachy, R.; Jackson, H.A.; Petersen, S.L. Social–ecological mismatches create conservation challenges in introduced species management. Front. Ecol. Environ. 2019, 17, 117–125. [Google Scholar] [CrossRef]
  32. Colléony, A.; Clayton, S.; Couvet, D.; Saint Jalme, M.; Prévot, A.-C. Human preferences for species conservation: Animal charisma trumps endangered status. Biol. Conserv. 2017, 206, 263–269. [Google Scholar] [CrossRef]
  33. Amuakwa-Mensah, F.; Bärenbold, R.; Riemer, O. Deriving a benefit transfer function for threatened and endangered species in interaction with their level of charisma. Environments 2018, 5, 31. [Google Scholar] [CrossRef]
  34. Reeve, R. Policing International Trade in Endangered Species: The CITES Treaty and Compliance; The Royal Institute of International Affairs and Earthscan Publications: London, UK, 2014. [Google Scholar]
  35. Chucholl, C.; Wendler, F. Positive selection of beautiful invaders: Long-term persistence and bio-invasion risk of freshwater crayfish in the pet trade. Biol. Invasions 2017, 19, 197–208. [Google Scholar] [CrossRef]
  36. EDMONDS, D. Poison Frogs Traded and Maintained by US Private Breeders. Herpetol. Rev. 2021, 52, 779–786. [Google Scholar]
  37. Yang, W.; Kang, J. Soundscape and sound preferences in urban squares: A case study in Sheffield. J. Urban Des. 2005, 10, 61–80. [Google Scholar] [CrossRef]
  38. Yu, L.; Kang, J. Factors influencing the sound preference in urban open spaces. Appl. Acoust. 2010, 71, 622–633. [Google Scholar] [CrossRef]
  39. Pijanowski, B.C.; Villanueva-Rivera, L.J.; Dumyahn, S.L.; Farina, A.; Krause, B.L.; Napoletano, B.M.; Gage, S.H.; Pieretti, N. Soundscape ecology: The science of sound in the landscape. BioScience 2011, 61, 203–216. [Google Scholar] [CrossRef]
  40. Zhang, Y.; Kang, J.; Kang, J. Effects of soundscape on the environmental restoration in urban natural environments. Noise Health 2017, 19, 65. [Google Scholar]
  41. Luo, H.; Deng, L.; Jiang, S.; Song, C.; Fu, E.; Ma, J.; Sun, L.; Huang, Z.; Jiang, M.; Zhu, C. Assessing the influence of individual factors on visual and auditory preference for rural landscape: The case of Chengdu, China. J. Environ. Plan. Manag. 2022, 65, 727–744. [Google Scholar] [CrossRef]
  42. Soeta, Y.; Kagawa, H. Subjective preferences for birdsong and insect song in equal sound pressure level. Appl. Sci. 2020, 10, 849. [Google Scholar] [CrossRef]
  43. Hedblom, M.; Heyman, E.; Antonsson, H.; Gunnarsson, B. Bird song diversity influences young people’s appreciation of urban landscapes. Urban For. Urban Green. 2014, 13, 469–474. [Google Scholar] [CrossRef]
Figure 1. The overall purpose of this study, in which we quantified the public perception of different frogs and frog sounds based on interest in YouTube video contents.
Sustainability 14 10258 g001
Figure 2. Number of videos (a) and number of species (b) among the 17 families identified in 174 videos.
Sustainability 14 10258 g002
Figure 3. Numbers of videos (a) and view counts (b) for the 78 species identified in data from 174 videos. Green boxes represent invasive species, blue boxes represent species corresponding to the ‘least concern’ level, yellow boxes represent species corresponding to the ‘near threatened’ level, orange boxes represent species corresponding to the vulnerable level, red boxes represent species corresponding to the endangered level, and purple boxes represent species corresponding to the critically endangered level.
Sustainability 14 10258 g003
Figure 4. Numbers of likes (a) and dislikes (b) for the 78 species identified in data from 174 videos. Green boxes represent invasive species, blue boxes represent species corresponding to the ‘least concern’ level, yellow boxes represent species corresponding to the ‘near threatened’ level, orange boxes represent species corresponding to the vulnerable level, red boxes represent species corresponding to the endangered level, and purple boxes represent species corresponding to the critically endangered level.
Sustainability 14 10258 g004
Table 1. Mean ± standard deviation (SD), median, interquartile range (IQR), and 95% percentile range for the numbers of videos and view counts for all 78 species, invasive species, species of least concern, and endangered species.
ContentsGroupnMean ± SDMedianIQRFrom 5% to 95%
Number of videos per speciesOverall782.231 ± 2.52711–2.251–6.05
Invasive23.5 ± 3.5363.51–61–6
Least concern622.339 ± 2.74611–31–6.85
Endangered141.571 ± 0.851611–21–4
View counts per speciesOverall78283,637 ± 1,206,23317,4884818–81,2882427–1,476,480
Invasive21,963,216 ± 2,529,8871,963,2161,74,315–3,752,116174,315–3,752,116
Least concern62287,705 ± 1,274,27517,4884648–106,4272423–1,333,585
Endangered1425,680 ± 27,11314,5345164–39,2523771–82,875
Table 2. Mean ± standard deviation (SD), median, interquartile range (IQR), and 95% percentile range for the numbers of likes and dislikes for all 78 species, invasive species, species corresponding to the ‘least concern’ level, and endangered species.
ContentsGroupnMean ± SDMedianIQRFrom 5% to 95%
Number of likes per speciesOverall78546.2 ± 173975.522.75–254.310.9–3410
Invasive23788 ± 366037881200–63761200–6376
Least concern62535.1 ± 178982.522–254.312.3–3329
Endangered14132.4 ± 216.549.520.5–107.36–741
Number of dislikes per speciesOverall78127.1 ± 74.4731–160–888.7
Invasive2467.5 ± 414.5467.553–88253–882
Least concern62143.8 ± 92.7131–16.750–908.1
Endangered144.786 ± 1.94820–6.50–25
Table 3. Relationships between the dominant frequency in frog calling and the view count, number of likes, and number of dislikes, determined using multiple-linear-regression analysis. The gray box represents a significant relationship (p < 0.05).
Predicted VariablePredictor VariableCoeff.Std. Err.BetatpR2F (p)Df 1, 2
Frequency (Hz)(Intercept)2052.27588.03 23.313<0.0010.0462.707 (0.047)3, 170
Views0.0015.918 × 1040.711.8570.065
Likes−0.9540.406−0.866−2.3510.020
Dislikes0.070.7290.0240.0960.924
Publisher’s Note: MDPI stays neutral with regard to jurisdictional claims in published maps and institutional affiliations.

