Article

Land Use Dynamics and Impact on Regional Climate Post-Tehri Dam in the Bhilangana Basin, Garhwal Himalaya

1
Department of Geography, Kirori Mal College, University of Delhi, Delhi 110007, India
2
Fellow DSPH, Institute of Eminence, University of Delhi, Delhi 110007, India
3
Department of Geography, Kamala Nehru College, University of Delhi, Delhi 110049, India
*
Author to whom correspondence should be addressed.
Sustainability 2022, 14(16), 10221; https://doi.org/10.3390/su141610221
Submission received: 14 July 2022 / Revised: 5 August 2022 / Accepted: 15 August 2022 / Published: 17 August 2022
(This article belongs to the Section Social Ecology and Sustainability)

Abstract

:
Land use and land cover (LULC) changes are a dynamic process determined by natural factors as well as the degree of human interaction in spatial and temporal perspectives. The present study focuses on analysing the LULC changes in the Bhilangana basin post-Tehri dam construction in the Garhwal Himalaya. Landsat series satellite images were used for three time periods to quantify spatial and temporal changes in the LULC using unsupervised classification techniques. The calculations of the areal coverage and change detection were carried out using the ArcGIS 10.3 software. The study finds that LULC changes were observed in the area surrounding the Tehri reservoir. The area under forest cover decreased by 54.71 km2, which is −5.7% of the geographical area, followed by agricultural land by 6.06 km2 (−0.4%) and scrubland and grass cover by 4.23 km2 (−0.28%) during the decade 2000 to 2010. Gradually, due to compensatory afforestation, forest cover increased by 5.65% in the period 2010–2020. A significant relationship with climatic variability is also established with LULC change in the region. The presence of a large water surface at a high altitude modified the albedo and air temperature and increased the atmospheric humidity and precipitation pattern. This study would be vital in understanding the climatic variability in the Himalayas and its impact on the community, environment and climate.

1. Introduction

Land use and land cover (LULC) changes have emerged as an important issue in the recent past as they significantly modify the energy exchange, in turn affecting climate and environment at a regional and global scale [1,2,3]. The broader impact of land use dynamics can be observed in the changes in the surface albedo, land degradation and loss of forest cover, which is a source of terrestrial carbon sinks and biological life [3]. The modification of natural landscapes, ecosystems and management practices through human activities can be defined as land-use change [4,5]. The LULC dynamics have a crucial impact on the environment, and it is an easily detectable indicator for the livelihood and sustainability of resources. The mountain ecosystems are more fragile across the world [6,7], particularly in the Garhwal Himalayan region of India due to large-scale development projects and human interference [8,9,10]. Therefore, a detailed and precise assessment of land use dynamics is essential to understand the effects on the environment and ecological systems [10].
The construction of big hydropower projects in mountainous regions induces large-scale LULC change [11,12,13,14]. Hydroelectric projects are considered renewable and clean energy, though they bring massive changes due to the submergence of upstream catchments [12,15]. Apart from that, rehabilitation and resettlement further aggravate the situation due to the clearing of forest cover for the construction of highways, towns and other infrastructure [16,17,18]. The loss of forest cover brings an integrated change in the region which is perceptible in the ecology, loss of biodiversity and agricultural pattern [19]. Globally, deforestation is associated with large infrastructure projects, agricultural and urban expansion [1,17,18,20].
The recent technological advancement in remote sensing-based earth observations coupled with Geographic Information Systems (GIS) has tremendously improved the capability to map land-use dynamics both at spatial and temporal scales. It immensely mends the delineations of different land-use elements such as agricultural land, settlements, scrubs and density of tree canopy to establish changes over a period of time [10,21,22,23,24]. Remote sensing data can be used for mapping, detection of change and quantitative analysis of land-use dynamics with GIS techniques [17]. The change in each parcel can be mapped precisely using suitable resolution satellite images with the help of processing software. The digital processing of changes is a widely accepted and applied method to map LULC changes [21,22,23,25,26,27,28]. The sequential transformation of the landscape is very crucial to understanding the environmental and ecological consequences in a region. It is noteworthy that these changes in land use are irreversible and have diverse impacts [1]. Change detection studies are very significant to understanding the process of change and quantitative analysis of its impact [6,7].
The changes in LULC significantly affect the surrounding environment. The transformation of the vegetative surface significantly changes the surface albedo rate [29,30], and in turn affects the regional climate [20,31]. The global temperature and the frequency of extreme events are significantly rising [32,33,34,35,36,37,38,39,40]. The evidence of rising surface temperature can be detected using remote sensing techniques and a correlation can be established with the LULC changes [3,27,37]. The vegetation and water surface have a cooling effect in comparison to built-up and barren land [41]. Hence, the LULC can be used to understand the local and regional climatic and environmental changes in the fragile environment. The LULC-induced changes trigger numerous kinds of natural hazards in the mountain regions, such as floods [42] and landslides [43,44].
A large-scale LULC change has been observed in the Garhwal Himalaya, particularly after the completion of the Tehri Hydro Power Project. The Tehri dam, a 260.5 m high earth and rock fill dam has been operational since 2006 (www.thdc.co.in; accessed on 4 July 2022), constructed on the confluence of the Bhagirathi and Bhilangana Rivers. This dam has created a large reservoir that submerges the valleys and spurs, which were traditionally occupied for agricultural activity, settlement and forest cover. Submergence has enforced the LULC changes in the basin on a large scale, primarily due to submergence and subsequently with the rehabilitation and resettlement. The land use dynamics significantly influence the surface heat fluxes and other environmental processes. The IPCC has reported that the average temperature in the Himalayas has increased with the incidences of extreme events [35,38]. In contrast to this, it is also reported that vegetation health and density have significantly improved in the basin, as indicated by the normalized difference vegetation index [24]. Therefore, the objectives of this study are to investigate land use and land cover changes in the area before and post-Tehri dam construction and their impact on regional climate.

2. Study Area

The present study covers the area of the Bhilangana River Basin, which is an important tributary of the Bhagirathi River. The study area includes the Ghansali and Pratapnagar sub-divisions of Tehri Garhwal District, Uttarakhand (Figure 1). Physiographically, it covers the area of both the Lesser and Great Himalayan ranges. The basin is characterised by high mountain peaks, deep gorges and broad valleys and spurs. The geographical area of the basin is 1484.2 km2. The elevation range varies from 625 m at the confluence of Bhagirathi and Bhilangana Rivers to Kirti Stambh’s 6902 m peak. The upper part of the basin is covered with dense forest and is named the Bhilangana range.
The climate of the basin ranges from sub-tropical in the lower area to cold temperate at higher altitudes. The long-term climatic records show that January is the coldest month and June is the warmest in the region (Indian Meteorological Department, 2020). Rainfall in the area is received throughout the year, though the highest rainfall (83%) is received during the summer monsoon season. The annual rainfall is highly variable in the area; it has been recorded as 262.3 mm as the lowest in 2008 and 2829.2 mm as the highest in 1957. The average annual rainfall is 1028.5 mm at Tehri station [45].
The Tehri dam was constructed at the confluence of the Bhagirathi and Bhilangana Rivers. The dam’s full reservoir level (FRL) is 830.2 m and the maximum drawdown level (MDL) is 740 m (amsl). Annually, it fluctuated between FRL and MDL. The gross storage of the reservoir is 3540 million cubic meters (MCM) and submerges 45 km of the Bhagirathi valley up to Dharasu and ~27 km of the Bhagirathi valley up to Ghansali. The reservoir area at FRL is 42 km2 (www.thdc.co.in; accessed on 4 July 2022). It submerges the area of both the basin at its Maximum Flood Level (MFL), which is 835 m. Annually, the reservoir water level fluctuates between MDL and FRL, which creates a repeated wetting and drying-up of the slopes and strata. This has significantly affected the slope instability in the reservoir rim area [46].
The dam has submerged 1235 hectares of land in the basin, which accounts for ~42% agricultural land and ~51% of forest cover (Survey of India Topographical Sheets). The compensatory land allotted on the upper slopes for housing and agriculture, and infrastructure development, has created a new zone of instability in the area [47]. The presence of a huge water body at a high altitude may have a critical influence on the climate and environment of the region.

3. Materials and Methods

In order to analyse the LULC changes in the basin before and post-Tehri dam, three-time period Landsat multispectral satellite images of 2000, 2010 and 2020 were used. The Landsat 7 Enhanced Thematic Mapper Plus (ETM+) satellite image of Path 146 Row 039 dated 25-Nov-2000 with scene ID LE71460392000330SGS00 was used to prepare the land use map of the pre-Tehri dam. Landsat ETM+ has a spatial resolution of 15 m of the panchromatic band and 30 m of multispectral bands. Landsat 5 Thematic Mapper (TM) images dated 28 October 2010 were used for the post-dam land use and land cover change analysis. TM has only a multispectral band with a spatial resolution of 30 m. The LULC map of 2020 was prepared using Landsat 8 Operational Land Imager (OLI) images dated 8 November 2020. The Landsat 8 OLI has both panchromatic and multispectral bands. The details of the data used and its description are presented in Supplementary Table S1. To establish a relationship between land use and land cover changes, climatic data and population dynamics of the basin are also analysed. We have used Gridded Population of the World (GPW), v4 of the years 2000 and 2010 to check the rehabilitation and changes in the human footprint in the area [48].

3.1. Processing of Satellite Images

The pre-processing of satellite images is essential for the accurate classification of change detections. The Landsat images were stacked and processed using the ERDAS Imagine 14 software. The Landsat 5 and 7 levels 1 data were processed and rescaled to top of atmosphere (TOA) reflectance and/or radiance using radiometric rescaling coefficients provided in the metadata file and Landsat User Manual. The equation is given below [49]:

3.1.1. Conversion to TOA Radiance

Landsat Level-1 data can be converted to TOA spectral radiance using the radiance rescaling factors in the MTL file (Landsat 8 Data Users Handbook):
Lλ = MLQcal + AL

3.1.2. Conversion to TOA Reflectance

Reflective band DN’s can be converted to TOA reflectance using the rescaling coefficients in the MTL file:
ρλ′ = MρQcal + Aρ
TOA reflectance with a correction for the sun angle is then:
ρλ = ρλ′cos(θSZ) = ρλ′sin(θSE)

3.2. Land Use/Cover Change Detection

The processed bands of satellite images were merged using the layer stack command in the ERDAS Imagine 2014 software. The band combination used for LULC of Landsat ETM+ was colour infrared 4,3,2 and pseudo colour 5,4,3 for vegetation enhancement. The combination for Landsat 5 TM includes 4,3,2 colour infrared; and Landsat 8 OLI bands 5,4,3 colour infrared and 6,5,4, for pseudo colour was used. The satellite data were clipped using the basin boundary and spectral signatures of different physical elements were collected and correlated with any changes in the images. These spectral signatures were used for the pixel clustering and recoding of the classes.
The land-use classification was performed using an unsupervised classification method in the ERDAS Imagine 2014 software. The unsupervised classification method was used with ISO data clustering and 125 classes, colour scheme option infrared/pseudo colour bands, and processing option maximum iterations of 10 to achieve better accuracy. The spectral signatures were used to identify the physical features and differences within, using the colour code. We have classified the nine categories of land use and cover in the basin; river lakes and reservoirs are included in one category; all types of built-up area as settlement; cultivated land and current fallow land as agriculture; barren land, scrubs grasses, dense forest, sparse forest, exposed rocky surfaces near the ridge and summit surfaces; and snow cover and glaciers. Further, these were grouped and recorded to complete the classification of a particular land use/cover. This process was repeated multiple times to achieve classification accuracy in each category of land use.
Post classification, the raster layers were converted to shapefiles using the Raster to shapefile option in the Erdas Imagine 2014 software. The LULC result was further analysed using ArcGIS 10.3 software to calculate the spatial area under each category and establish change detection in the area and categories. The overlay techniques were employed to detect the changes, and the area was calculated.

3.3. Validation of Land Use

The LULC classified data was validated with known spectral signatures of all the classes with 500 random stratified points. These included Garmin eTrex Hcx Legend global positioning system (GPS) points and known locations collected from the high-resolution Google Earth images. The raster accuracy assessment method was used in the ERDAS Imagine 2014 software. The comparison of classification results was obtained for each dataset statistically using the error matrix. In addition to this, a kappa confusion matrix was developed for each category of land use to compare the classified datasets and establish a relationship.

3.4. NDVI Analysis

Normalized Difference Vegetation Index (NDVI) was calculated for the years 2000 and 2010 to observe the change in the vegetation health and density. We have used the formula given by USGS (https://www.usgs.gov/landsat-missions/landsat-normalized-difference-vegetation-index (accessed on 5 June 2022)):
NDVI = (NIR-R)/(NIR + R)
The bands used for NDVI:
Landsat 5 and 7, NDVI = (Band 4–Band 3)/(Band 4 + Band 3)

3.5. Climatic Variability

The analysis of regional climatic variability and environmental changes was analysed using the gridded long-term satellite data. In this study, temperature, precipitation, specific humidity, and evaporation data were downloaded from the National Aeronautics and Space Administration (NASA) Giovanni portal (https://giovanni.gsfc.nasa.gov/giovanni/ accessed on 23 May 2022) [50]. The bounding box of the datasets is 78.45° E to 78.65° E longitude and 30.30° N to 30.45° N latitude. The details of the climatic datasets are given in Supplementary Table S1.

4. Results

4.1. Land Use Dynamics

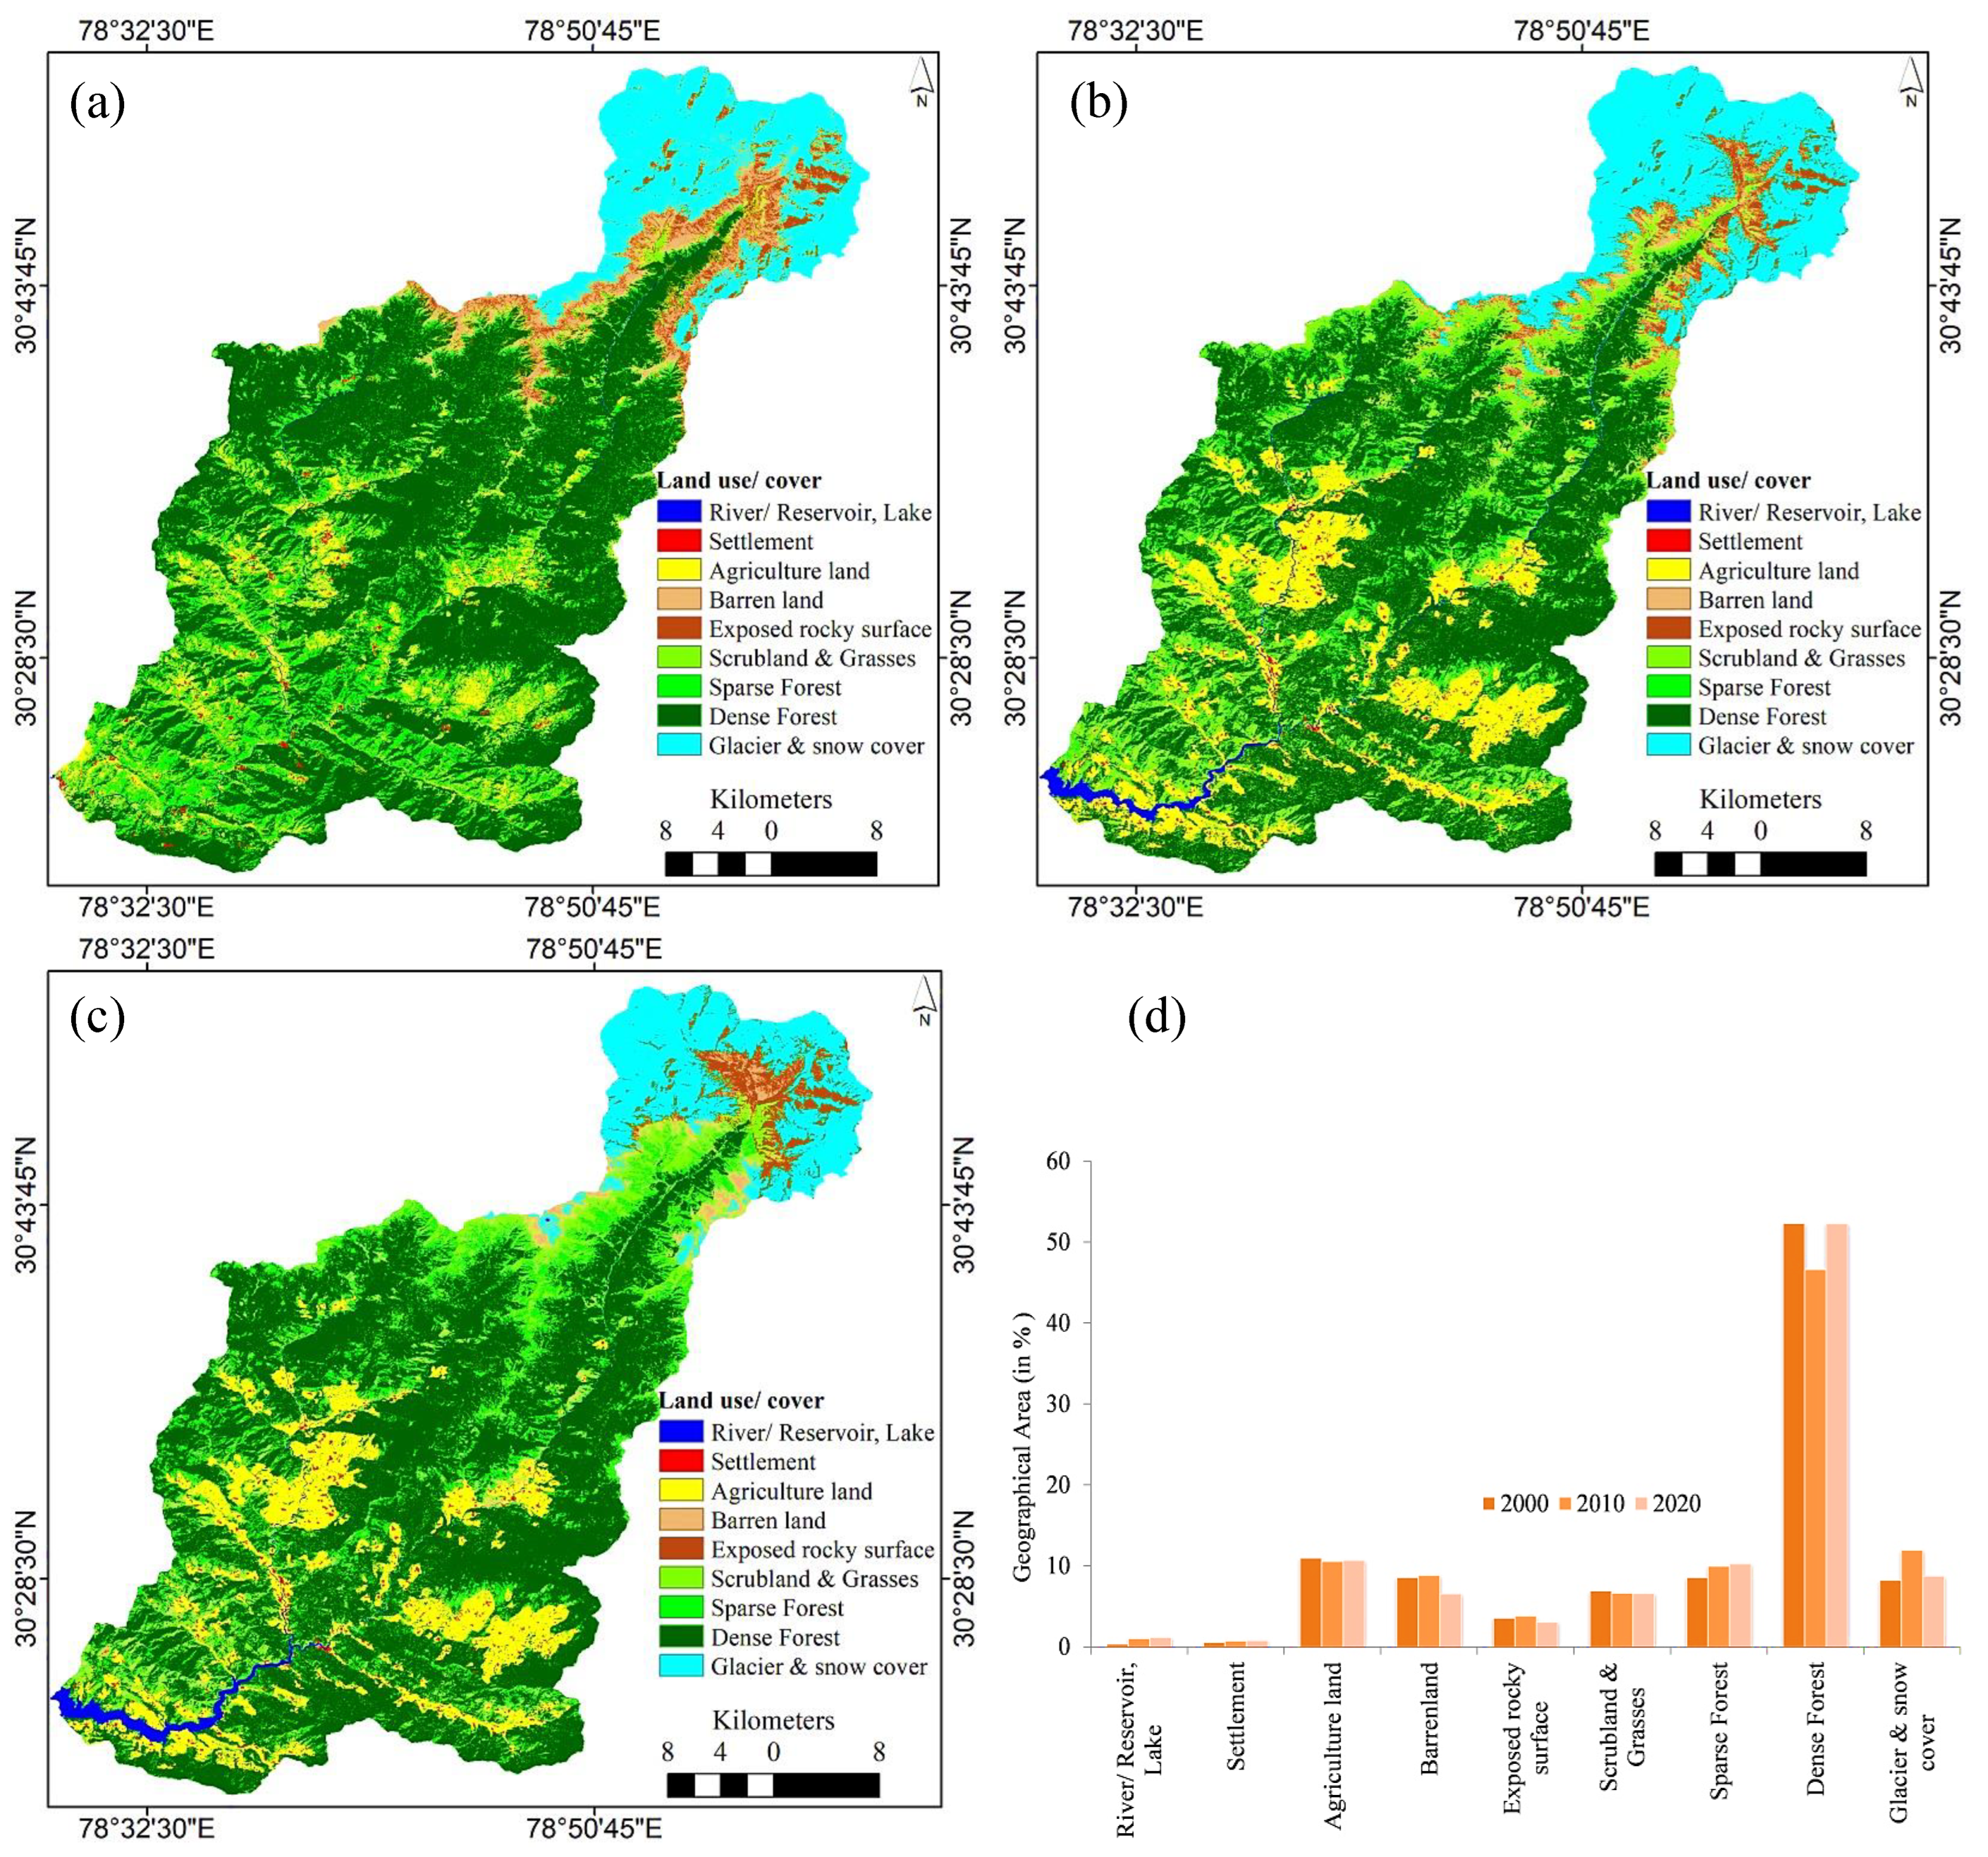
Land use and land cover analysis provides a clue of geo-environmental processes and their impacts on regional climate, ecology and communities. The LULC analysis of the basin for the years 2000, 2010 and 2020 was carried out to understand the dimensions of changes post-Tehri dam construction using the Landsat satellite images (Figure 2). The dam was completed in 2005, and after that, impoundment began. The reservoir attained its full reservoir level (FRL) post-2009. Figure 2a shows the LULC map of the Bhilangana basin based on the Landsat 7 ETM+ multispectral satellite images. Figure 2b shows the land use map for 2010; and Figure 2c for 2020. It was observed that major changes occurred in the decade from 2000 to 2010 (Table 1). Most of the area of agricultural land was impounded in Tehri reservoir, which occupies the broad river valley, terraces and spurs. The area of the reservoir is 1235 hectares, out of which 42% area was agricultural land and 52% was forest cover. The area under agricultural land was 10.95% of the total geographical area during the period 2000 that decreased to 10.55%, a decrease of only 0.43%, post-Tehri reservoir. Further, it increased by 0.12% from 2010 to 2020.
The area under the dense forest cover was 52.31% during the year 2000, which decreased to 46.61% in 2010. It was noted after the detailed spatial analysis that after the rehabilitation and resettlement of the population affected due to the reservoir submergence, agriculture and settlement land were allotted to them on the upper reaches. Hence, a gradual decrease in scrubland, grassland and barren land was observed in the basin.
The forest cover was classified under two categories viz. dense and sparse forest—primarily based on the tree canopy. The area under the forest cover decreased ~5.7% from 2000 to 2010, but it is reported to be substantially increased to the previous proportions of 52.26% of the total area during the years from 2010 to 2020. This change in the forest cover shows that compensatory afforestation programs and increased rainfall are possible reasons. Despite the fact that a large area impounded in the reservoir, the geographic area under the dense forest cover was regained after 2010. The comparative analysis of spectral signatures reveals that tree canopy/surface vegetation cover has shown increased density during the study period.
The other category that has shown an incessant increase in the area is lakes and reservoirs, which was 0.33% during 2000, increased to 1.03% in the year 2010 and was 1.14% in the year 2020. It was increased by 0.81% during the study period. The built-up area also gradually increased from 0.55% to 0.77% from the year 2000 to 2010. It was measured at 0.78% in the year 2020. The area under the scrubland and grassland gradually decreased. It was 6.92% in the year 2000 and decreased to 6.64% in the year 2010 and 6.57% in 2020. A comparative analysis of areal change is presented in Figure 2d. The data analysed over the last two decades reveals that the largest changes were observed under the area covered by the water body, as expected due to the reservoir. It is 16.8 km2, which accounts for 1.14% of the geographical area of the basin. It increased by 0.81% in the study period. The second-largest gain was noticed under the sparse forest category; it increased by 1.67%, followed by settlement (0.23%). The area under the barren land category decreased by −2%, followed by scrubland and grasses (−0.35%), agricultural land (−0.28%), and dense forest (−0.05).

4.2. Climatic Variability

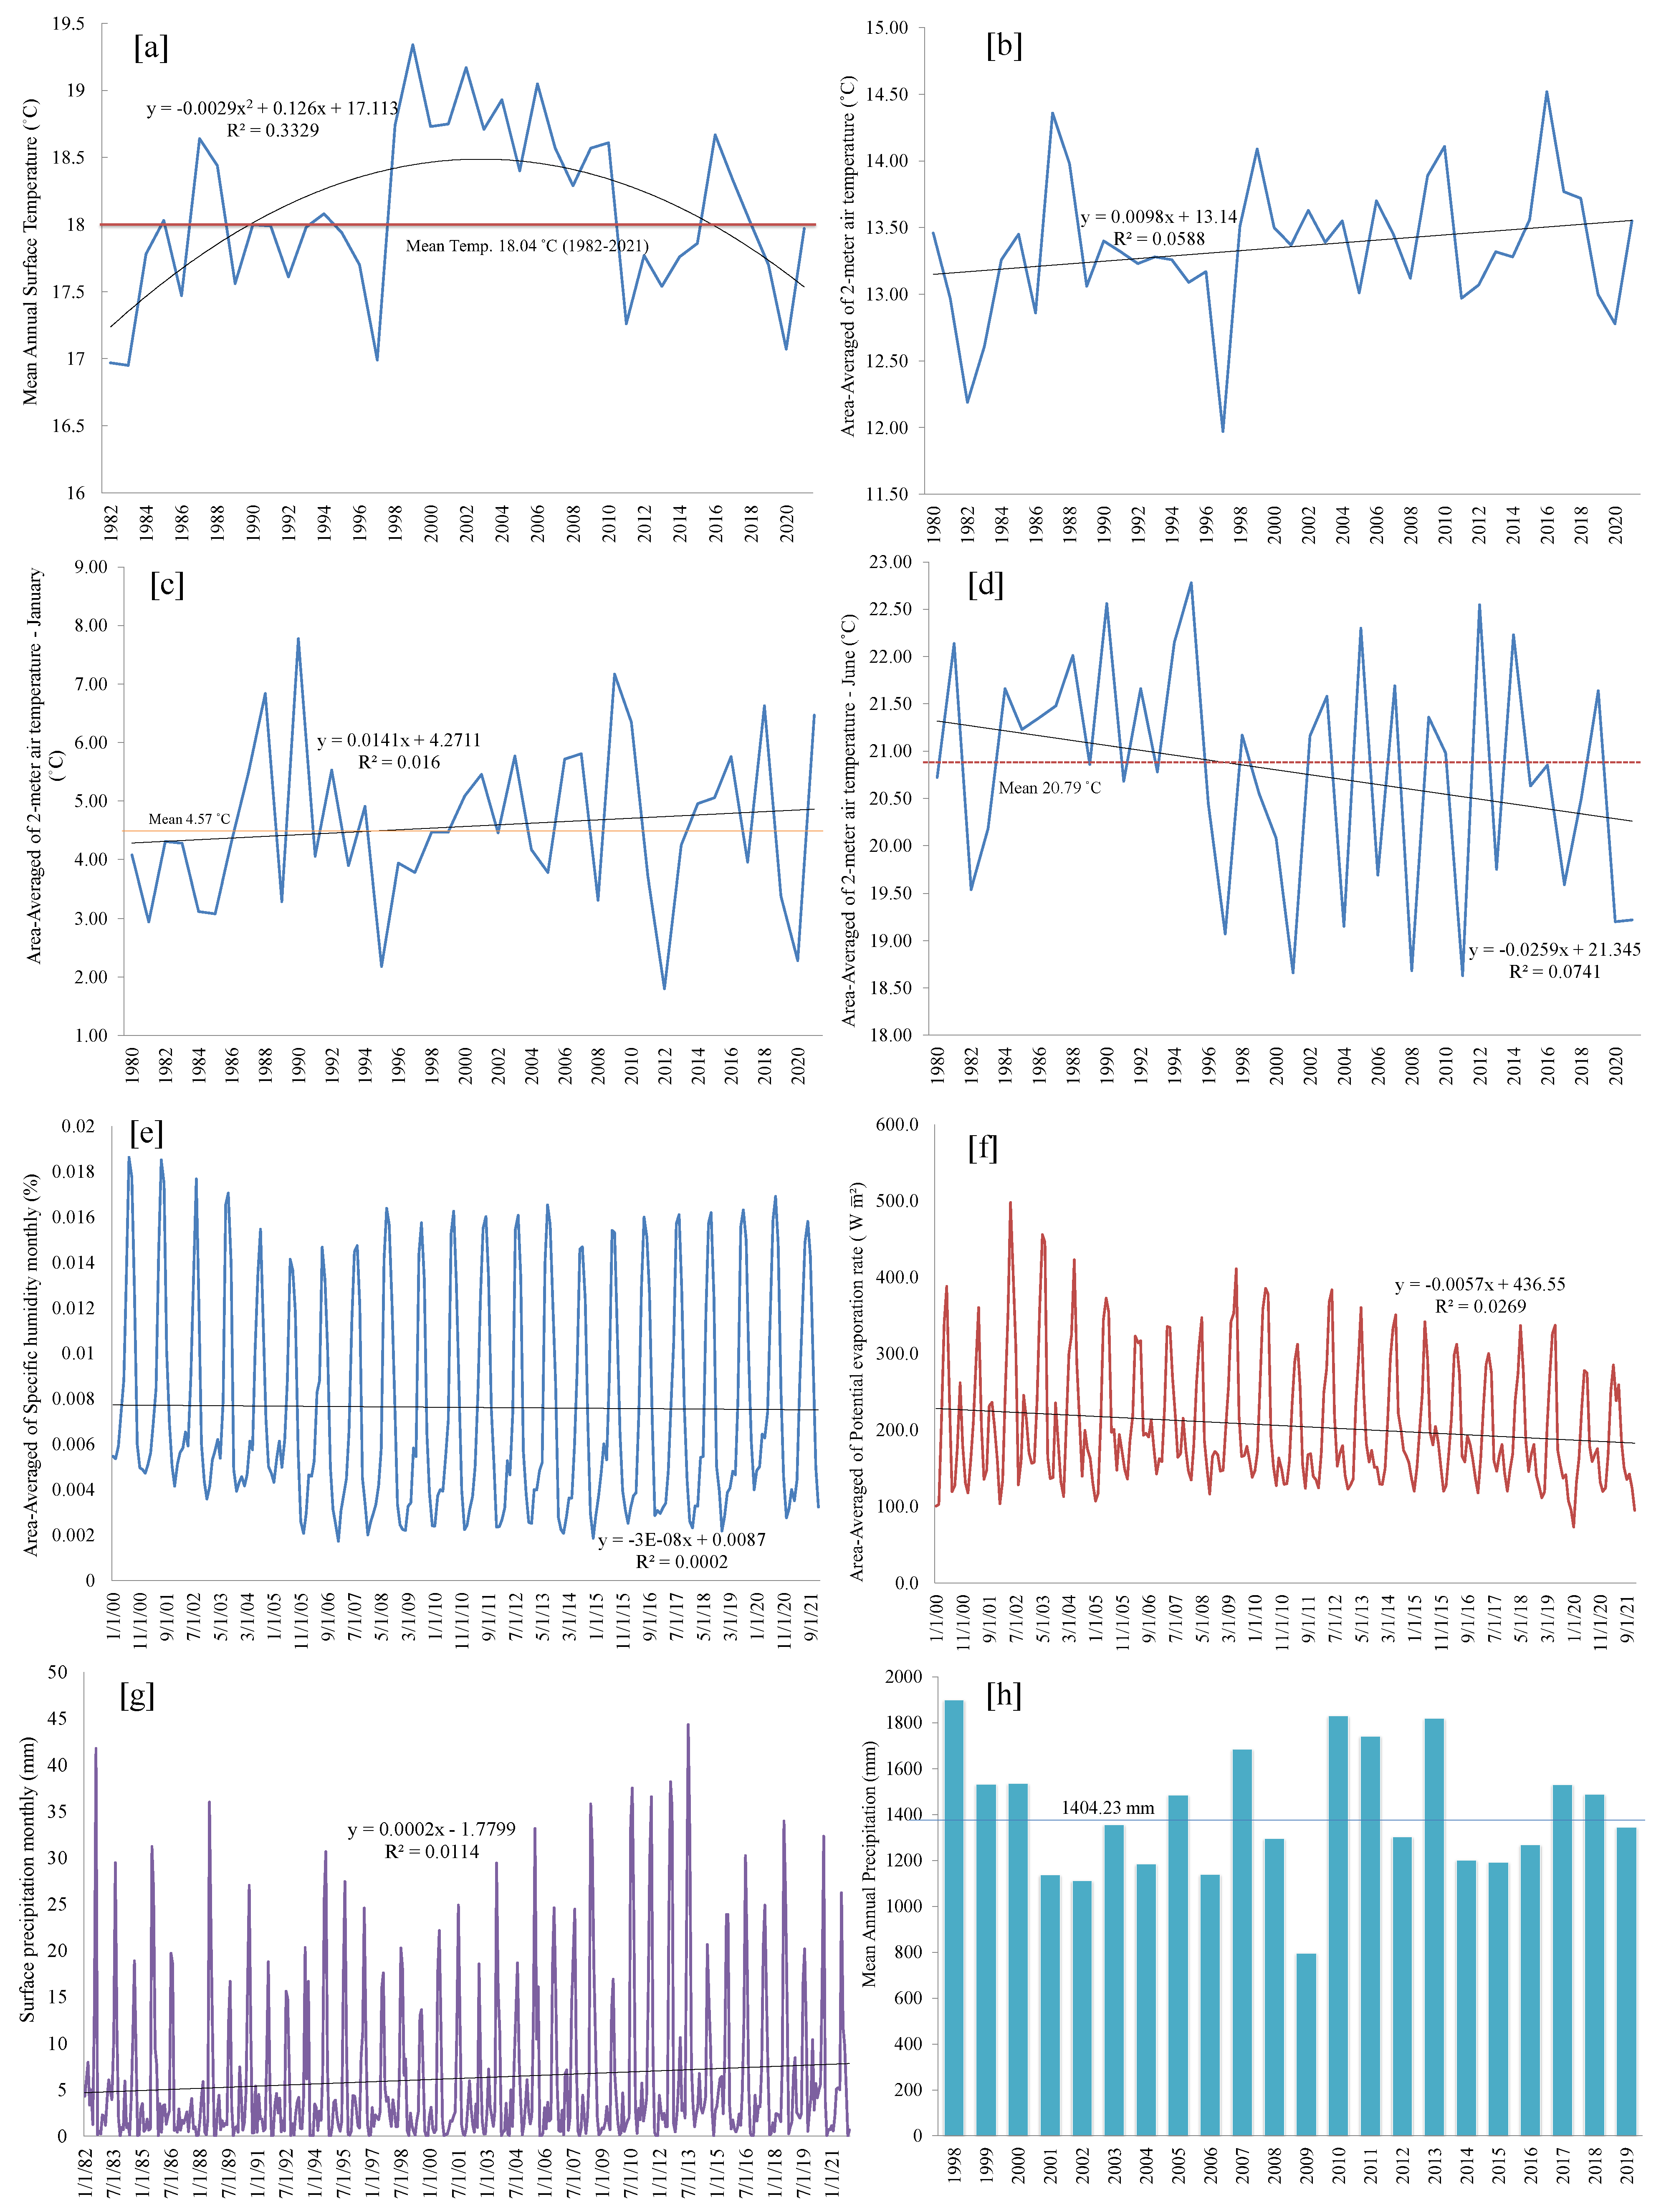
Satellite-based monitoring of climatic variables was analysed to understand the impact of land use dynamics on the environment and regional climate. The increase in water surface impacts the mean air temperature, humidity, rate of evapotranspiration and precipitation pattern. The monthly mean surface temperature was analysed using the FLDAS Model data of resolution 0.5 × 0.625 deg. surrounding the reservoir. The data was converted to the annual mean to assess the inclination of change in the temperature (Figure 3a). The mean annual surface temperature of the area is 18.04 °C for the period 1982–2020. However, it was noticed that it is showing a slightly declining trend during the period 2010 to 2021 (17.87 °C). However, the detailed analysis of the area-averaged annual mean 2-m air temperature from 1982–2021 using the MERA-2 data tells a different story (Figure 3b). The mean temperature is calculated to be 13.35 °C, which is showing a slightly rising trend. However, statistically, it is insignificant (R2 = 0.05). The heat map of minimum and maximum temperature was plotted to understand the variability using TRMM data, suggesting inconsistency in pattern and high fluctuations (Figure 4).
Further analysis of minimum and maximum temperature variations that are observed in the months of January and June was carried out to understand the variability. Data for the month of January reveals that the mean monthly temperature for the period 1982–2021 is 4.57 °C and it shows a rising trend after 2001 to 4.77 °C (Figure 3c). Notwithstanding, data from June shows a decreasing trend, and it is quite pronounced after 2001 (Figure 3d). The mean temperature of June is estimated at 20.79 °C as the warmest month showing a decline after 2001, and it was 20.48 °C during 2001–2021. However, the decrease was very slight 0.31 °C.
The area-averaged of specific humidity analysed using the GLDAS Model for the period 1982–2021 shows a slightly increasing trend (Figure 3e). However, the result was statistically insignificant. Consequently, the monthly potential evapotranspiration rate is also analysed using the GLDAS Model (Wmˉ²) of the area showing a decreasing trend (Figure 3f).
The monthly surface precipitation was analysed in the study area using the MERA-2 Model as rainfall received mm/day for the period 1982–2021. The data reveals that monthly precipitation has been showing an incessant increasing trend after 2001 (Figure 3g). However, the result was statistically insignificant (R2 is 0.011). Similarly, the area-averaged precipitation rate daily was assessed using the TRMM data for 1998–2019 (Figure 3h). The average annual precipitation estimated using the data is found to be 1404.25 mm (Figure 3g). Though, it was noted that from 2007–2019 the mean annual precipitation is 1475.5 mm, except for the year 2009, which was a meagre monsoon year. It is remarkable to note that the dam attained the FRL post-2007.

5. Discussion

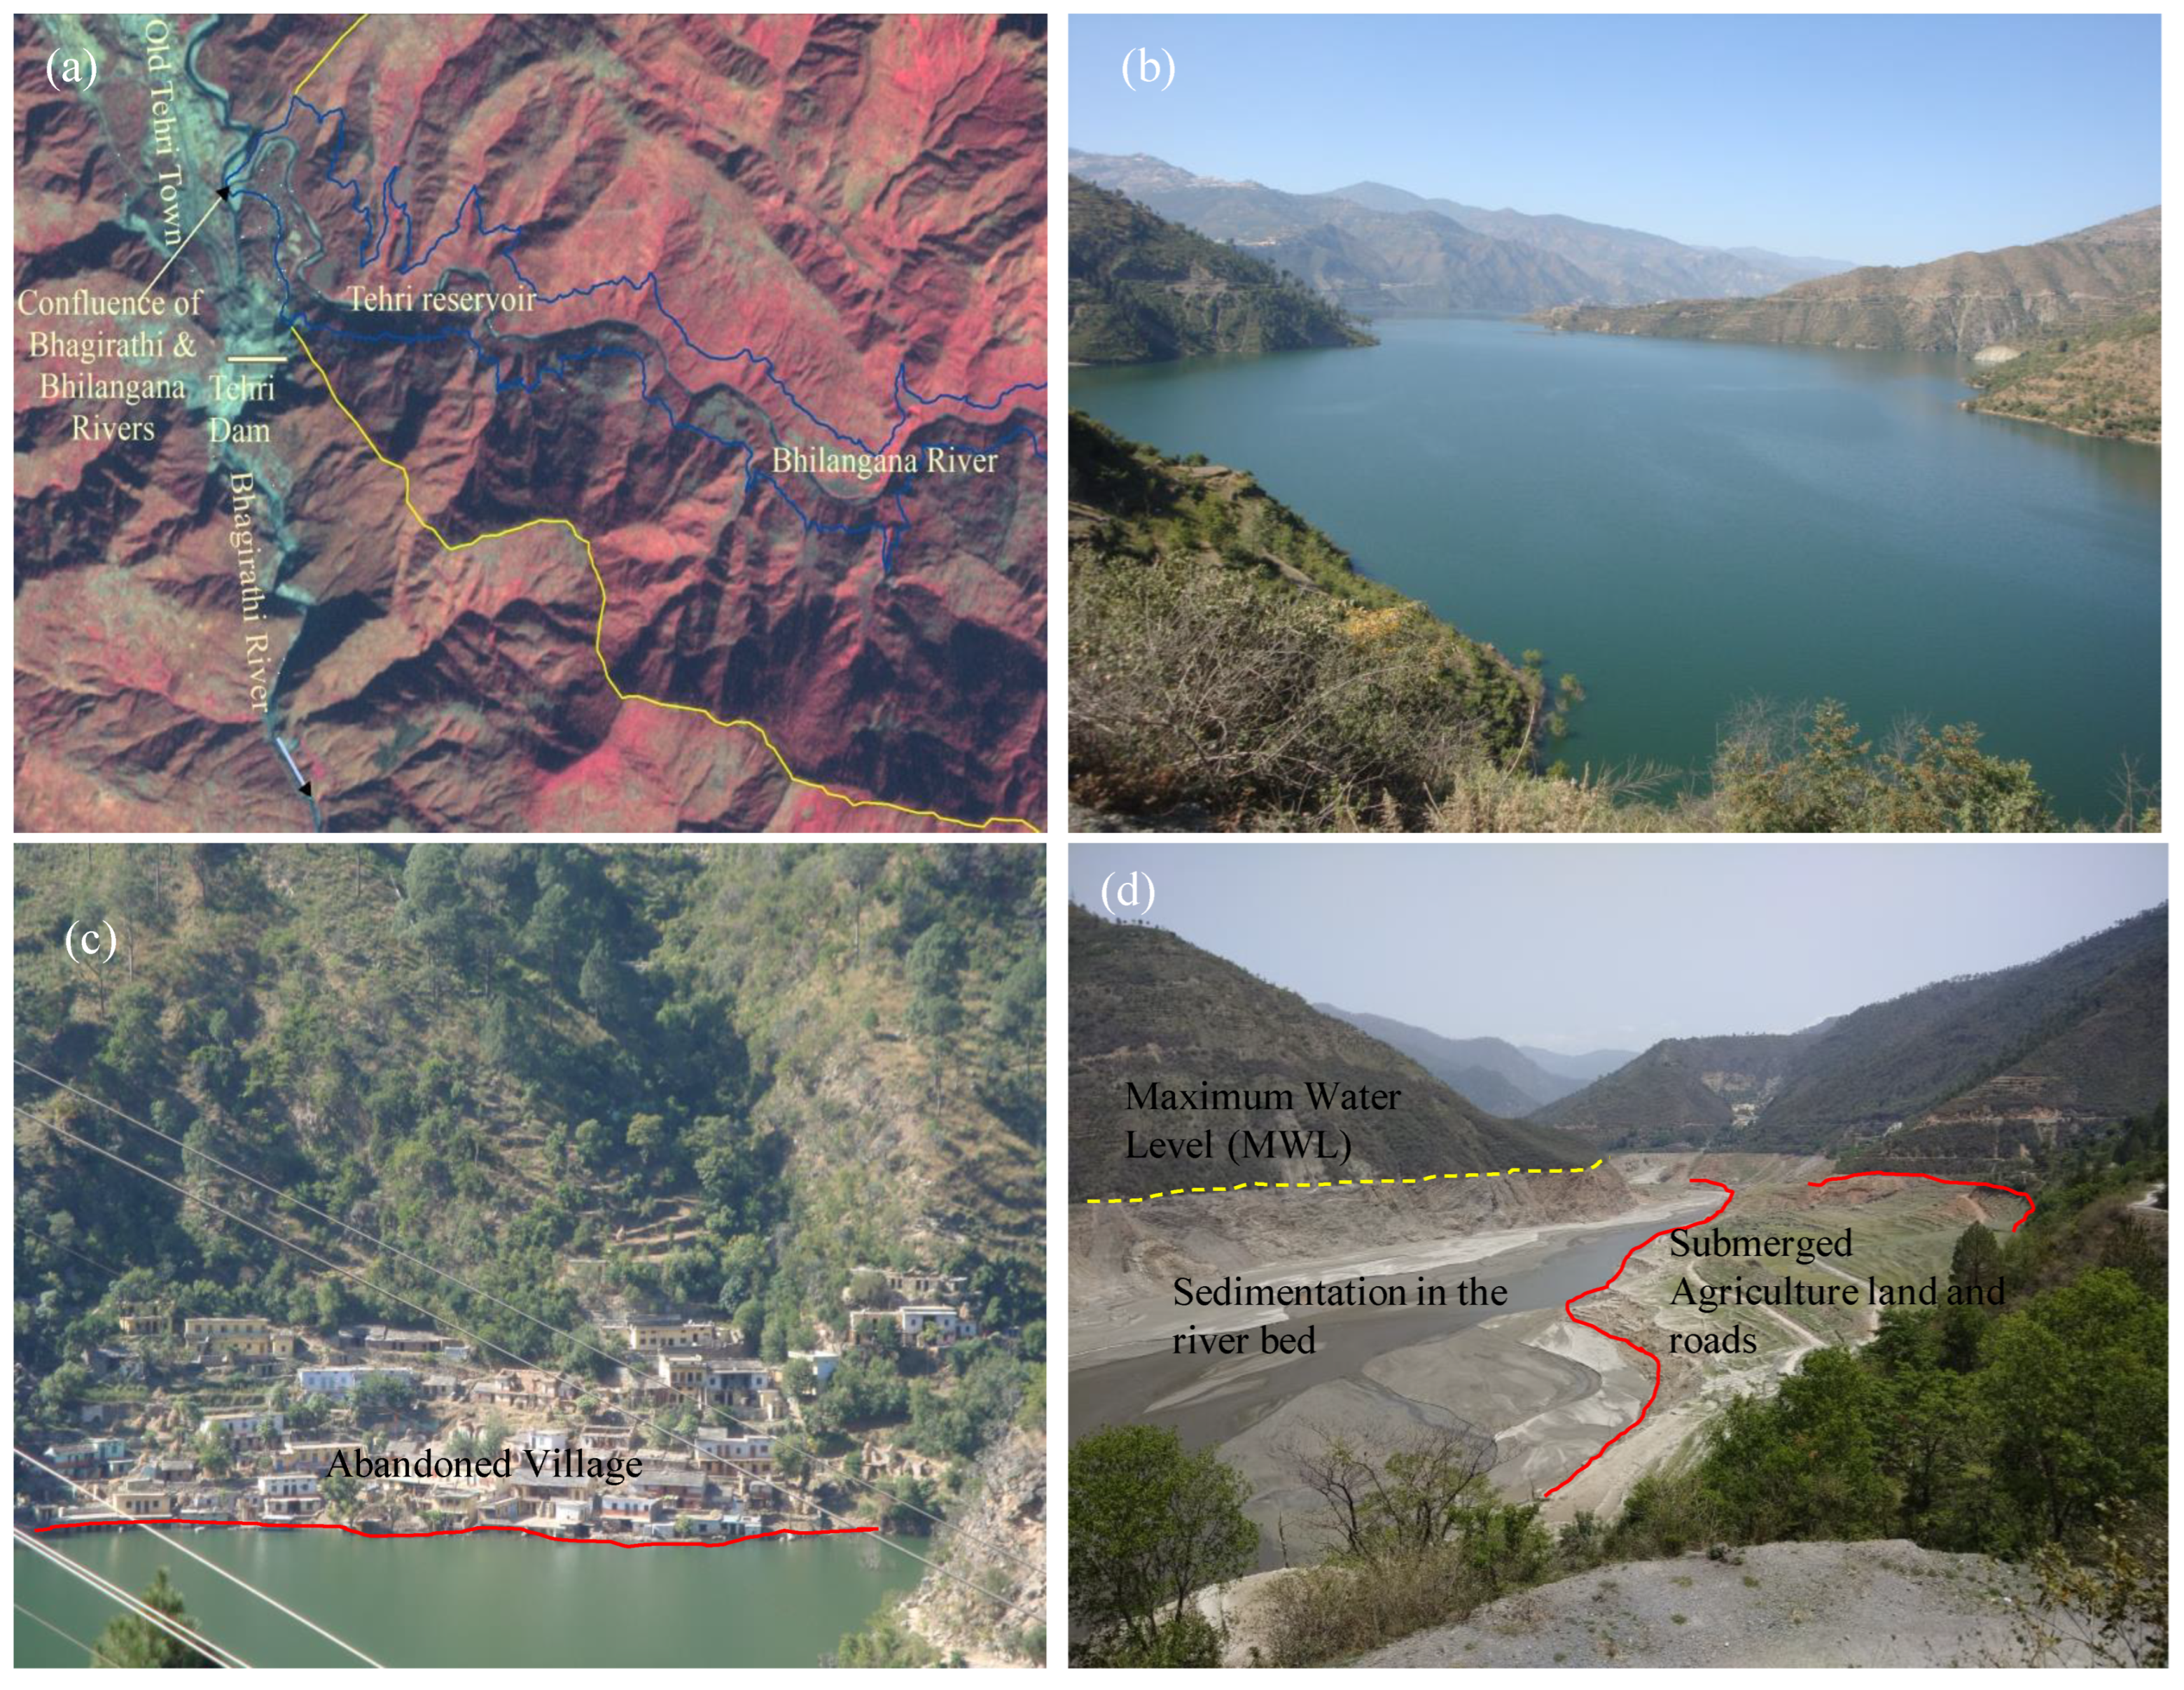
Land use is a dynamic phenomenon, continuously changing according to the intensity of human interaction. The long-term changes are often gradual and do not have a profound impact on human beings, livelihood and the environment. The abrupt change in the region was observed due to the construction of the Tehri dam a mega project that brought massive change to the LULC, and, in turn, affected the community, environment and natural calamities. The remote sensing images proved a vital source of data to analyse the changes that occurred in a region. Figure 5a shows the confluence of the Bhagirathi and Bhilangana rivers on a Landsat 7 ETM+ multispectral satellite image. The impact of the Tehri dam was very prolific on LULC changes in the area as the broad valleys of the river submerged [14,21,51]. It has inundated a large area of built-up agricultural land and forest land (Figure 5b). Many villages were rehabilitated and resettled in other areas or shifted to higher altitudes (Figure 5c).
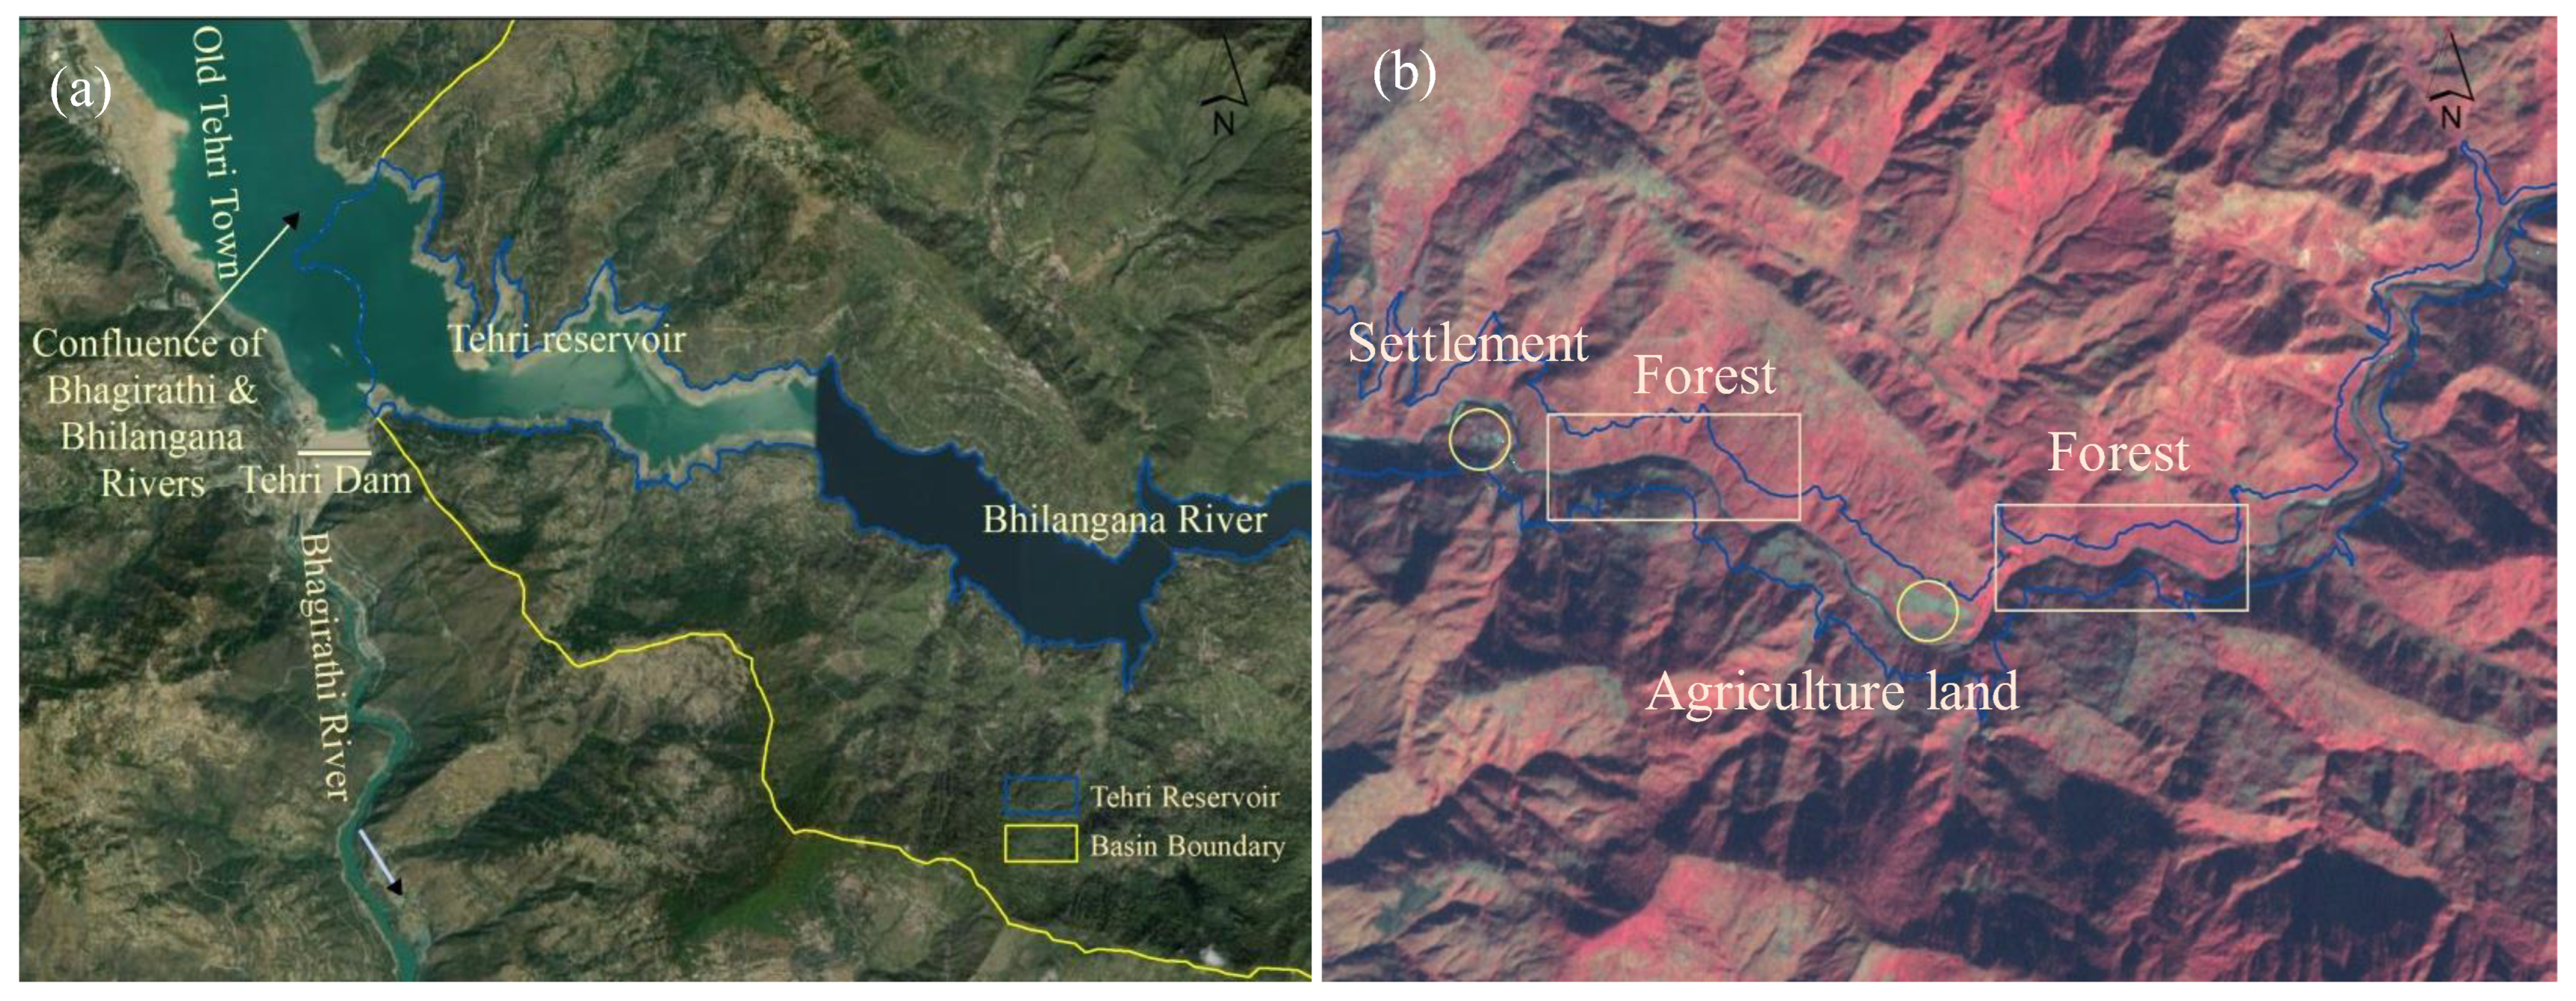
The reservoir water level annually fluctuates between FRL and MDDL. Hence, traces of submerged land can be seen before the monsoon season, witnessing the lowest water level of the reservoir. Figure 5d is a picture of the first week of June 2019 and shows the traces of maximum water level on the side slope, silted river bed and terrace of agriculture land. The reservoir inundated area is delineated on the Google Earth images (Figure 6a) and it was overlaid on the Landsat ETM+ multispectral satellite image of 25 November 2000 (Figure 6b). The settlement area, agriculture land and forest cover are marked on the image, which was immersed under the reservoir.
The satellite images of the three-time period were carefully analysed to detect the changes. The resolution and band combination is critical in detecting each class of LULC and establishing the temporal relationships [25,27]. The land-use dynamics are critical to identify the changes in a region [27]. The band combinations of images were changed according to the spectral characteristics of the features. Infrared is the most suitable band to identify vegetation pixels in Landsat 7 ETM+. It is obvious that the reflectance of vegetation is higher in the red and infrared bands and least for the water pixels. Similarly, the false colour composite can be used to detect the vegetation, barren land and snow cover area. Similarly, the Landsat 8 OLI band combinations for vegetation extractions near-infrared, and short-wave infrared were used. Pixel-by-pixel analysis was made to omit classification errors, which will affect land use dynamics and change detection.
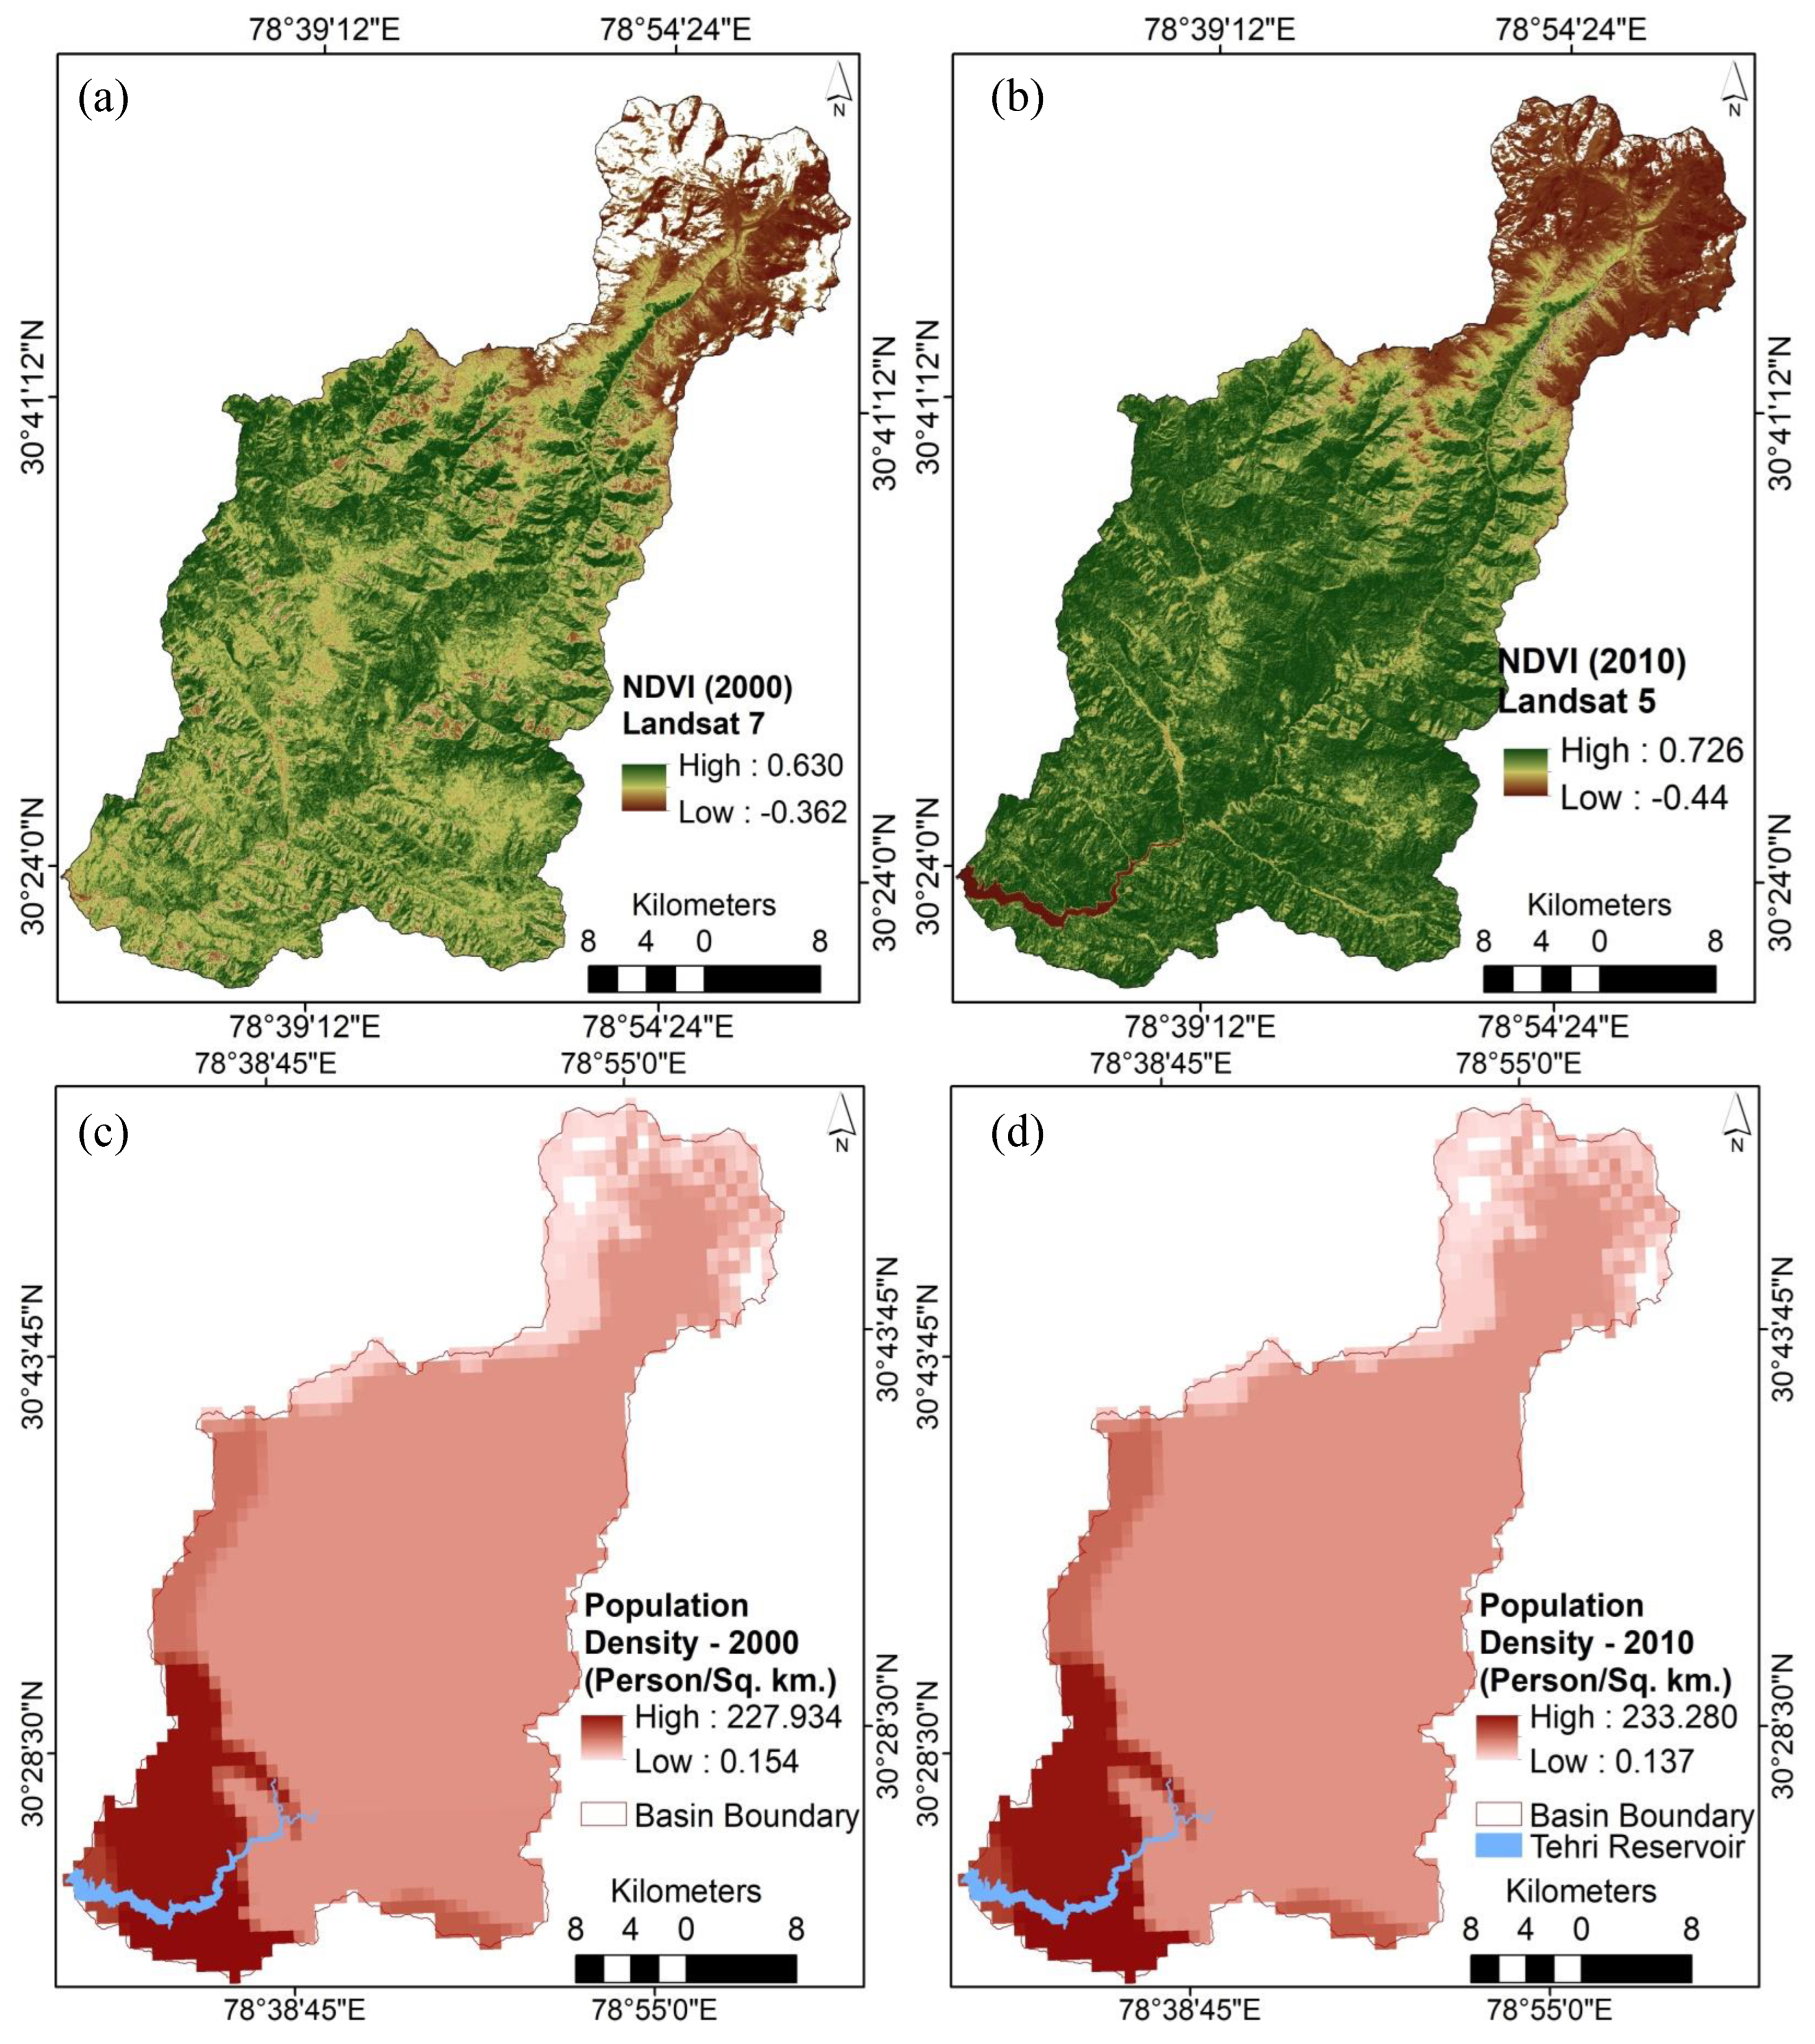
The LULC analyses of 2000 and 2010 reveal that agricultural land and dense forest cover, and built-up area decreased after the construction of the reservoir [7,8,13,27]. The change in these areas was reported due to the inundation of broad valleys and spurs. The dense forest land decreased substantially. However, the area decreased during 2000–2010 under the forest cover reported a gain in the decade 2010–2020. Further, to validate the classification results showing the increase in the dense forest cover area, NDVI analysis was performed on the satellite images of 2000 (Figure 7a) and 2010 (Figure 7b). The result suggests that NDVI values have significantly increased in the sparse forest area [24].
The density of forest cover increased along the Tehri reservoir due to the availability of moisture, increased rainfall and compensatory afforestation. There are many government schemes in the state promoting afforestation, such as Van Panchayat, social forestry and agroforestry [28]. Similarly, the settlement area gradually increased as many villages were resettled over the higher slope in the scrubland and barren land. Hence, the area under the scrubland and barren land categories decreased over the study period. Global population density data suggests that the population density of the area gradually increased from 2000 (Figure 7c) to 2020 (Figure 7d). This reveals that most villagers settled in the upper reaches of the basin.
The LULC change in the region greatly affects people’s lives and livelihoods [21,28]. It has also significantly affected agriculture patterns in the basin [14]. Apart from the direct impacts, the indirect impact is also very crucial. It has affected biotic life [22], biomass and carbon balance [52], water quality and hydrology [10]. The annual fluctuations of the water level of the reservoir have created new zones of slope instability and the incidence of landslides along the reservoir rim has also increased [43,53,54]. The land use dynamics increased the risk of natural hazards in the region. The incidence of flash floods and multi-hazards have increased in the region [42].
The present growing concern has forced us to analyse the new dimensions of climatic extremities. LULC changes have a significant impact on the environment and regional climate [1,28,29,30,55,56]. The change of surface characteristics leads to dynamics in the heat flux, albedo and evapotranspiration. The large-scale change in land use has added to the rising temperature [29,38]. However, it is a complex process, and many variables play crucial roles [57,58]. The increase in average temperature may lead to an increase in atmospheric humidity and precipitation pattern [35]. The vegetation covers have a diverse impact on surface radiation to carbon concentration, and it was established that the rise in temperature of the region corresponds to the CO2 level [3].
The reservoir, a large water surface in the region, significantly affected the climatic variables. The water molecule absorbs incoming heat and the maximum temperature during the summer season was moderated. Subsequently, during the winter season, the minimum temperature increased. Similarly, the specific humidity increased around the reservoir and evapotranspiration decreased.

6. Conclusions

Land use dynamics of the study area post-construction of the Tehri dam were analysed using remote sensing images. The analysis revealed that a large area under the agriculture, settlement and forest cover was submerged in the reservoir. Hence, the area under these categories decreased in the period from 2000 to 2010. Gradually, the scrubland and barren land on the upper slopes converted to agricultural land due to rehabilitation and resettlement, and forest cover under the afforestation programme. The barren land in the basin decreased by 2.02% of the total geographical area followed by scrubland and grasses (−0.35%) and agricultural land (−0.28%) during the period from 2000 to 2020. The area under the water body was increased by 0.81%, followed by sparse forest (1.67%), and settlement (0.23%). The driving force of the land use conversion was the reservoir. The secondary impact of the reservoir was that rehabilitation and resettlement converted large patches of the non-forest area into agricultural land and forest cover. The land-use change has also significantly affected the regional climate and biotic environment. The minimum and maximum temperature values were moderated surrounding the reservoir and increased precipitation was observed during the years 2010–2020. Hence, this study is significant to understanding the land-use dynamics and their impact on climatic variability in the high altitude regions for policy implications and environmental management.

Supplementary Materials

The following supporting information can be downloaded at: https://www.mdpi.com/article/10.3390/su141610221/s1, Table S1: Data used in the present study.

Author Contributions

Conceptualization, S.M.P. and A.; methodology, V.K.P.; software, S.M.P., K.M.; validation, K.S., K.N. and M.B.A.; formal analysis, J.R.; investigation, V.K.P.; resources, S.M.P., A. data curation, A.K.; writing—original draft preparation, V.K.P.; writing—review and editing, A.; visualization, A.K. All authors have read and agreed to the published version of the manuscript.

Funding

This research received no external funding.

Institutional Review Board Statement

Not applicable.

Informed Consent Statement

Not applicable.

Data Availability Statement

Not applicable.

Acknowledgments

We dedicate this research to our beloved colleague, Late Arun Kumar Tripathi, for his valuable contribution and immense support in steering the present research work. Unfortunately, we lost him just before submitting the paper. The authors also acknowledge USGS and Google Earth for using satellite images; Goddard Earth Sciences Data and Information Services Center (GES DISC) for using the climatic data; Socioeconomic Data and Applications Center (SEDAC); and NASA’s Earth Observing System Data and Information System (EOSDIS), for access to gridded population data.

Conflicts of Interest

The authors declare no conflict of interest.

References

  1. Lambin, E.F.; Geist, H.J.; Lepers, E. Dynamics of land-use and land-cover change in tropical regions. Annu. Rev. Environ. Resour. 2003, 28, 205–241. [Google Scholar] [CrossRef]
  2. Habel, M.; Mechkin, K.; Podgorska, K.; Saunes, M.; Babiński, Z.; Chalov, S.; Absalon, D.; Podgórski, Z.; Obolewski, K. Dam and reservoir removal projects: A mix of social-ecological trends and cost-cutting attitudes. Sci. Rep. 2020, 10, 19210. [Google Scholar] [CrossRef]
  3. Bonan, G.B. Forests and Climate Change: Forcings, Feedbacks, and the Climate Benefits of Forests. Science 2008, 320, 1444–1449. [Google Scholar] [CrossRef] [PubMed]
  4. Tuan, N.T. Urbanization and land use change: A study in Vietnam. Environ. Socio Econ. Stud. 2022, 10, 19–29. [Google Scholar] [CrossRef]
  5. Sobala, M. Landscape effects of conflicts in space management. A historical approach based on the Silesian and Zywiec Beskids (West Carpathians, Poland). Environ. Socio Econ. Stud. 2016, 4, 51–60. [Google Scholar] [CrossRef]
  6. Bajracharya, B.; Uddin, K.; Chettri, N.; Shrestha, B.; Siddiqui, S.A. Understanding land cover change using a harmonized classification system in the Himalaya. Mt. Res. Dev. 2010, 30, 143–156. [Google Scholar] [CrossRef]
  7. Batar, A.K.; Watanabe, T.; Kumar, A. Assessment of land-use/land-cover change and forest fragmentation in the Garhwal Himalayan region of India. Environments 2017, 4, 34. [Google Scholar] [CrossRef]
  8. Kala, R.; Bhavsar, D.; Roy, A.; Rawat, L. Land use/land cover dynamics study and prediction in Garhwal region of Western Himalaya. In Proceedings of the 38th Asian Conference Remote Sensing Space Applications: Touching Human Lives ACRS, New Delhi, India, 23–27 October 2017. [Google Scholar]
  9. Kuniyal, J.C.; Jamwal, A.; Kanwar, N.; Chand, B.; Kumar, K.; Dhyani, P.P. Vulnerability assessment of the Satluj catchment for sustainable development of hydroelectric projects in the northwestern Himalaya. J. Mt. Sci. 2019, 16, 2714–2738. [Google Scholar] [CrossRef]
  10. Mondal, P.P.; Zhang, Y. Research Progress on changes in land use and land cover in the Western Himalayas (India) and effects on ecosystem services. Sustainability 2018, 10, 4504. [Google Scholar] [CrossRef]
  11. Asher, M.; Bhandari, P. Mitigation or Myth? Impacts of Hydropower Development and Compensatory Afforestation on forest ecosystems in the high Himalayas. Land Use Policy 2021, 100, 105041. [Google Scholar] [CrossRef]
  12. Fearnside, P.M. Reservoir (Brazil’ S Tucuruí Dam) and the Energy Policy Implications. Water Air Soil Pollut. 2002, 133, 69–96. [Google Scholar] [CrossRef]
  13. Sati, S.P.; Sharma, S.; Sundriyal, Y.P.; Rawat, D.; Riyal, M. Geo-environmental consequences of obstructing the Bhagirathi River, Uttarakhand Himalaya, India. Geomat. Nat. Hazards Risk 2020, 11, 887–905. [Google Scholar] [CrossRef]
  14. Singh, M.S.; Upreti, P. Reservoir induced impact on Agricultural patterns and Livelihood practices: A case study of Pratapnagar block in Tehri dam rim area. Int. J. Sci. Res. Publ. 2015, 5, 1–8. [Google Scholar]
  15. Velastegui-Montoya, A.; de Lima, A.; Herrera-Matamoros, V. What Is the Socioeconomic Impact of the Tucuruí Dam on Its Surrounding Municipalities? Sustainability 2022, 14, 1630. [Google Scholar] [CrossRef]
  16. Velastegui-Montoya, A.; de Lima, A.; Adami, M. Multitemporal Analysis of Deforestation in Response to the Construction of the Tucuruí Dam. ISPRS Int. J. Geo Inf. 2020, 9, 583. [Google Scholar] [CrossRef]
  17. Llerena-Montoya, S.; Velastegui-Montoya, A.; Zhirzhan-Azanza, B.; Herrera-Matamoros, V.; Adami, M.; de Lima, A.; Moscoso-Silva, F.; Encalada, L. Multitemporal Analysis of Land Use and Land Cover within an Oil Block in the Ecuadorian Amazon. ISPRS Int. J. Geo Inf. 2021, 10, 191. [Google Scholar] [CrossRef]
  18. Xu, X.; Xie, Y.; Qi, K.; Luo, Z.; Wang, X. Detecting the response of bird communities and biodiversity to habitat loss and fragmentation due to urbanization. Sci. Total Environ. 2018, 624, 1561–1576. [Google Scholar] [CrossRef]
  19. Hietala-Koivu, R.; Lankoski, J.; Tarmi, S. Loss of biodiversity and its social cost in an agricultural landscape. Agric. Ecosyst. Environ. 2004, 103, 75–83. [Google Scholar] [CrossRef]
  20. Macedo, M.N.; DeFries, R.S.; Morton, D.C.; Stickler, C.M.; Galford, G.L.; Shimabukuro, Y.E. Decoupling of deforestation and soy production in the southern Amazon during the late 2000s. Proc. Natl. Acad. Sci. USA 2012, 109, 1341–1346. [Google Scholar] [CrossRef]
  21. Rautela, P.; Mitigation, D.; Centre, M. GIS and remote sensing-based study of the reservoir-induced land-use/land- cover changes in the catchment of Tehri dam in Garhwal Himalaya, GIS and remote sensing-based study of the reservoir-induced land-use/land-cover changes in the catchment of Te. Curr. Sci. 2017, 83, 308–311. [Google Scholar]
  22. Rathore, P.; Roy, A.; Karnatak, H. Predicting the future of species assemblages under climate and land use land cover changes in Himalaya: A geospatial modelling approach. Clim. Chang. Ecol. 2022, 3, 100048. [Google Scholar] [CrossRef]
  23. Rasool, R.; Fayaz, A.; ul Shafiq, M.; Singh, H.; Ahmed, P. Land use land cover change in Kashmir Himalaya: Linking remote sensing with an indicator based DPSIR approach. Ecol. Indic. 2021, 125, 107447. [Google Scholar] [CrossRef]
  24. Das, P. 20 years MODIS-NDVI monitoring suggests that vegetation has increased significantly around Tehri Dam reservoir, Uttarakhand, India. Remote Sens. Appl. Soc. Environ. 2021, 24, 100610. [Google Scholar] [CrossRef]
  25. Chughtai, A.H.; Abbasi, H.; Karas, I.R. A review on change detection method and accuracy assessment for land use land cover. Remote Sens. Appl. Soc. Environ. 2021, 22, 100482. [Google Scholar] [CrossRef]
  26. Dorji, T.; Odeh, I.O.A.; Field, D.J.; Baillie, I.C. Digital soil mapping of soil organic carbon stocks under different land use and land cover types in montane ecosystems, Eastern Himalayas. For. Ecol. Manag. 2014, 318, 91–102. [Google Scholar] [CrossRef]
  27. Hassan, Z.; Shabbir, R.; Ahmad, S.S.; Malik, A.H.; Aziz, N.; Butt, A.; Erum, S. Dynamics of land use and land cover change (LULCC) using geospatial techniques: A case study of Islamabad Pakistan. SpringerPlus 2016, 5, 1–11. [Google Scholar] [CrossRef]
  28. Tiwari, P. Land use changes in Himalaya and their impacts on environment, society and economy: A study of the Lake Region in Kumaon Himalaya, India. Adv. Atmos. Sci. 2008, 25, 1029–1042. [Google Scholar] [CrossRef]
  29. Camacho, C.; Pérez-Barahona, A. Land use dynamics and the environment. J. Econ. Dyn. Control 2015, 52, 96–118. [Google Scholar] [CrossRef]
  30. Ullah, S.; Ahmad, K.; Sajjad, R.U.; Abbasi, A.M.; Nazeer, A.; Tahir, A.A. Analysis and simulation of land cover changes and their impacts on land surface temperature in a lower Himalayan region. J. Environ. Manag. 2019, 245, 348–357. [Google Scholar] [CrossRef]
  31. Hussain, S.; Lu, L.; Mubeen, M.; Nasim, W.; Karuppannan, S.; Fahad, S.; Tariq, A.; Mousa, B.G.; Mumtaz, F.; Aslam, M. Spatiotemporal Variation in Land Use Land Cover in the Response to Local Climate Change Using Multispectral Remote Sensing Data. Land 2022, 11, 595. [Google Scholar] [CrossRef]
  32. Rohini, P.; Rajeevan, M.; Srivastava, A.K. On the Variability and Increasing Trends of Heat Waves over India. Sci. Rep. 2016, 6, 1–9. [Google Scholar] [CrossRef]
  33. Mishra, V.; Mukherjee, S.; Kumar, R.; Stone, D.A. Heat wave exposure in India in current, 1.5 °C, and 2.0 °C worlds. Environ. Res. Lett. 2017, 12, 124012. [Google Scholar] [CrossRef]
  34. Lal, P.; Shekhar, A.; Kumar, A. Quantifying Temperature and Precipitation Change Caused by Land Cover Change: A Case Study of India Using the WRF Model. Front. Environ. Sci. 2021, 9, 766328. [Google Scholar] [CrossRef]
  35. IPCC. Climate Change 2022–Impacts, Adaptation and Vulnerability; IPCC: Geneva, Switzerland, 2022; Volume 37, Available online: https://www.ipcc.ch/report/ar6/wg2/ (accessed on 15 May 2022).
  36. Hussain, S.; Mubeen, M.; Ahmad, A.; Majeed, H.; Qaisrani, S.A.; Hammad, H.M.; Amjad, M.; Ahmad, I.; Fahad, S.; Ahmad, N.; et al. Assessment of land use/land cover changes and its effect on land surface temperature using remote sensing techniques in Southern Punjab, Pakistan. Environ. Sci. Pollut. Res. 2022, 1–17. [Google Scholar] [CrossRef]
  37. Hussain, S.; Karuppannan, S. Land use/land cover changes and their impact on land surface temperature using remote sensing technique in district Khanewal, Punjab Pakistan. Geol. Ecol. Landsc. 2021, 1–13. [Google Scholar] [CrossRef]
  38. ul Hassan, W.; Nayak, M.A.; Lyngwa, R.V. Recent changes in heatwaves and maximum temperatures over a complex terrain in the Himalayas. Sci. Total Environ. 2021, 794, 148706. [Google Scholar] [CrossRef] [PubMed]
  39. Chapman, S.C.; Watkins, N.W.; Stainforth, D.A. Warming Trends in Summer Heatwaves. Geophys. Res. Lett. 2019, 46, 1634–1640. [Google Scholar] [CrossRef]
  40. Ahmad, S.; Jia, H.; Chen, Z.; Li, Q.; Yin, D.; Israr, M.; Hayat, W.; Bilal, H.; Ahmed, R.; Ashraf, A. Effects of climate and land use changes on stream flow of Chitral river basin of northern highland Hindu-Kush region of Pakistan. J. Hydro Environ. Res. 2021, 38, 53–62. [Google Scholar] [CrossRef]
  41. Port, U.; Claussen, M.; Brovkin, V. Radiative forcing and feedback by forests in warm climates—A sensitivity study. Earth Syst. Dyn. 2016, 7, 535–547. [Google Scholar] [CrossRef]
  42. Pal, S.C.; Chowdhuri, I.; Das, B.; Chakrabortty, R.; Roy, P.; Saha, A.; Shit, M. Threats of climate change and land use patterns enhance the susceptibility of future floods in India. J. Environ. Manage. 2022, 305, 114317. [Google Scholar] [CrossRef]
  43. Pandey, V.K.; Tripathi, A.K.; Sharma, K.K. Implications of landslide inventory in susceptibility modeling along a Himalayan highway corridor, India. Phys. Geogr. 2022, 43, 440–462. [Google Scholar] [CrossRef]
  44. Kumar, R.; Anbalagan, R. Landslide susceptibility zonation of Tehri reservoir rim region using binary logistic regression model. Curr. Sci. 2015, 108, 1662–1672. [Google Scholar]
  45. IMD. Climate of Tehri Garhwal; Meteorological Centre, Dehra Dun, India Meteorological Department, Ministry of Earth Sciences, Government of India: New Delhi, India, 2012.
  46. Kumar, R.; Anbalagan, R. Landslide susceptibility mapping of the Tehri reservoir rim area using the weights of evidence method. J. Earth Syst. Sci. 2019, 128, 153. [Google Scholar] [CrossRef]
  47. Pandey, V.K. Predictive landslide susceptibility assessment using the weight-of-evidence method in north-central Garhwal Himalaya, India. Phys. Geogr. 2015, 36, 510–536. [Google Scholar] [CrossRef]
  48. NASA. Gridded Population of the World, Version 4.11 (GPWv4): Population Count, Revision 11; Center for International Earth Science Information Network—CIESIN—Columbia University; NASA Socioeconomic Data and Applications Center (SEDAC): Palisades, NY, USA, 2018. [CrossRef]
  49. USGS. Landsat 8 Data Users Handbook. 2019. Available online: https://www.usgs.gov/media/files/landsat-8-data-users-handbook (accessed on 25 June 2022).
  50. Beaudoing, H.; MRodell, N. GLDAS Noah Land Surface Model L4 Monthly 0.25 × 0.25 Degree V2.1; Goddard Earth Sciences Data and Information Services Center (GES DISC): Greenbelt, MD, USA, 2020. [Google Scholar] [CrossRef]
  51. Sharma, E.; Bhuchar, S.; Xing, M.; Kothyari, B.P. Land use change and its impact on hydro-ecological linkages in Himalayan watersheds. Trop. Ecol. 2007, 48, 151–161. [Google Scholar]
  52. Yadav, R.P.; Gupta, B.; Bhutia, P.L.; Bisht, J.K.; Pattanayak, A. Biomass and carbon budgeting of land use types along elevation gradient in Central Himalayas. J. Clean. Prod. 2019, 211, 1284–1298. [Google Scholar] [CrossRef]
  53. Kumar, R.; Anbalagan, R. Landslide susceptibility zonation in part of Tehri reservoir region using frequency ratio, fuzzy logic and GIS. J. Earth Syst. Sci. 2015, 124, 431–448. [Google Scholar] [CrossRef]
  54. Ritse, V.; Basumatary, H.; Kulnu, A.S.; Dutta, G.; Phukan, M.M.; Hazarika, N. Monitoring land use land cover changes in the Eastern Himalayan landscape of Nagaland, Northeast India. Environ. Monit. Assess. 2020, 192, 1–17. [Google Scholar] [CrossRef]
  55. Zhang, H.; Li, H.; Chen, Z. Analysis of land use dynamic change and its impact on the water environment in Yunnan plateau lake area—A case study of the Dianchi Lake drainage area. Procedia Environ. Sci. 2011, 10, 2709–2717. [Google Scholar] [CrossRef]
  56. Majeed, M.; Tariq, A.; Anwar, M.M.; Khan, A.M.; Arshad, F.; Mumtaz, F.; Farhan, M.; Zhang, L.; Zafar, A.; Aziz, M.; et al. Monitoring of Land Use–Land Cover Change and Potential Causal Factors of Climate Change in Jhelum District, Punjab, Pakistan, through GIS and Multi-Temporal Satellite Data. Land 2021, 10, 1026. [Google Scholar] [CrossRef]
  57. Perz, S.G.; Qiu, Y.; Xia, Y.; Southworth, J.; Sun, J.; Marsik, M.; Rocha, K.; Passos, V.; Rojas, D.; Alarcón, G.; et al. Trans-boundary infrastructure and land cover change: Highway paving and community-level deforestation in a tri-national frontier in the Amazon. Land Use Policy 2013, 34, 27–41. [Google Scholar] [CrossRef]
  58. Sur, U.; Singh, P. Assessment of Landscape Change of Lesser Himalayan Road Corridor of Uttarakhand, India. J. Landsc. Ecol. 2020, 13, 1–22. [Google Scholar] [CrossRef]
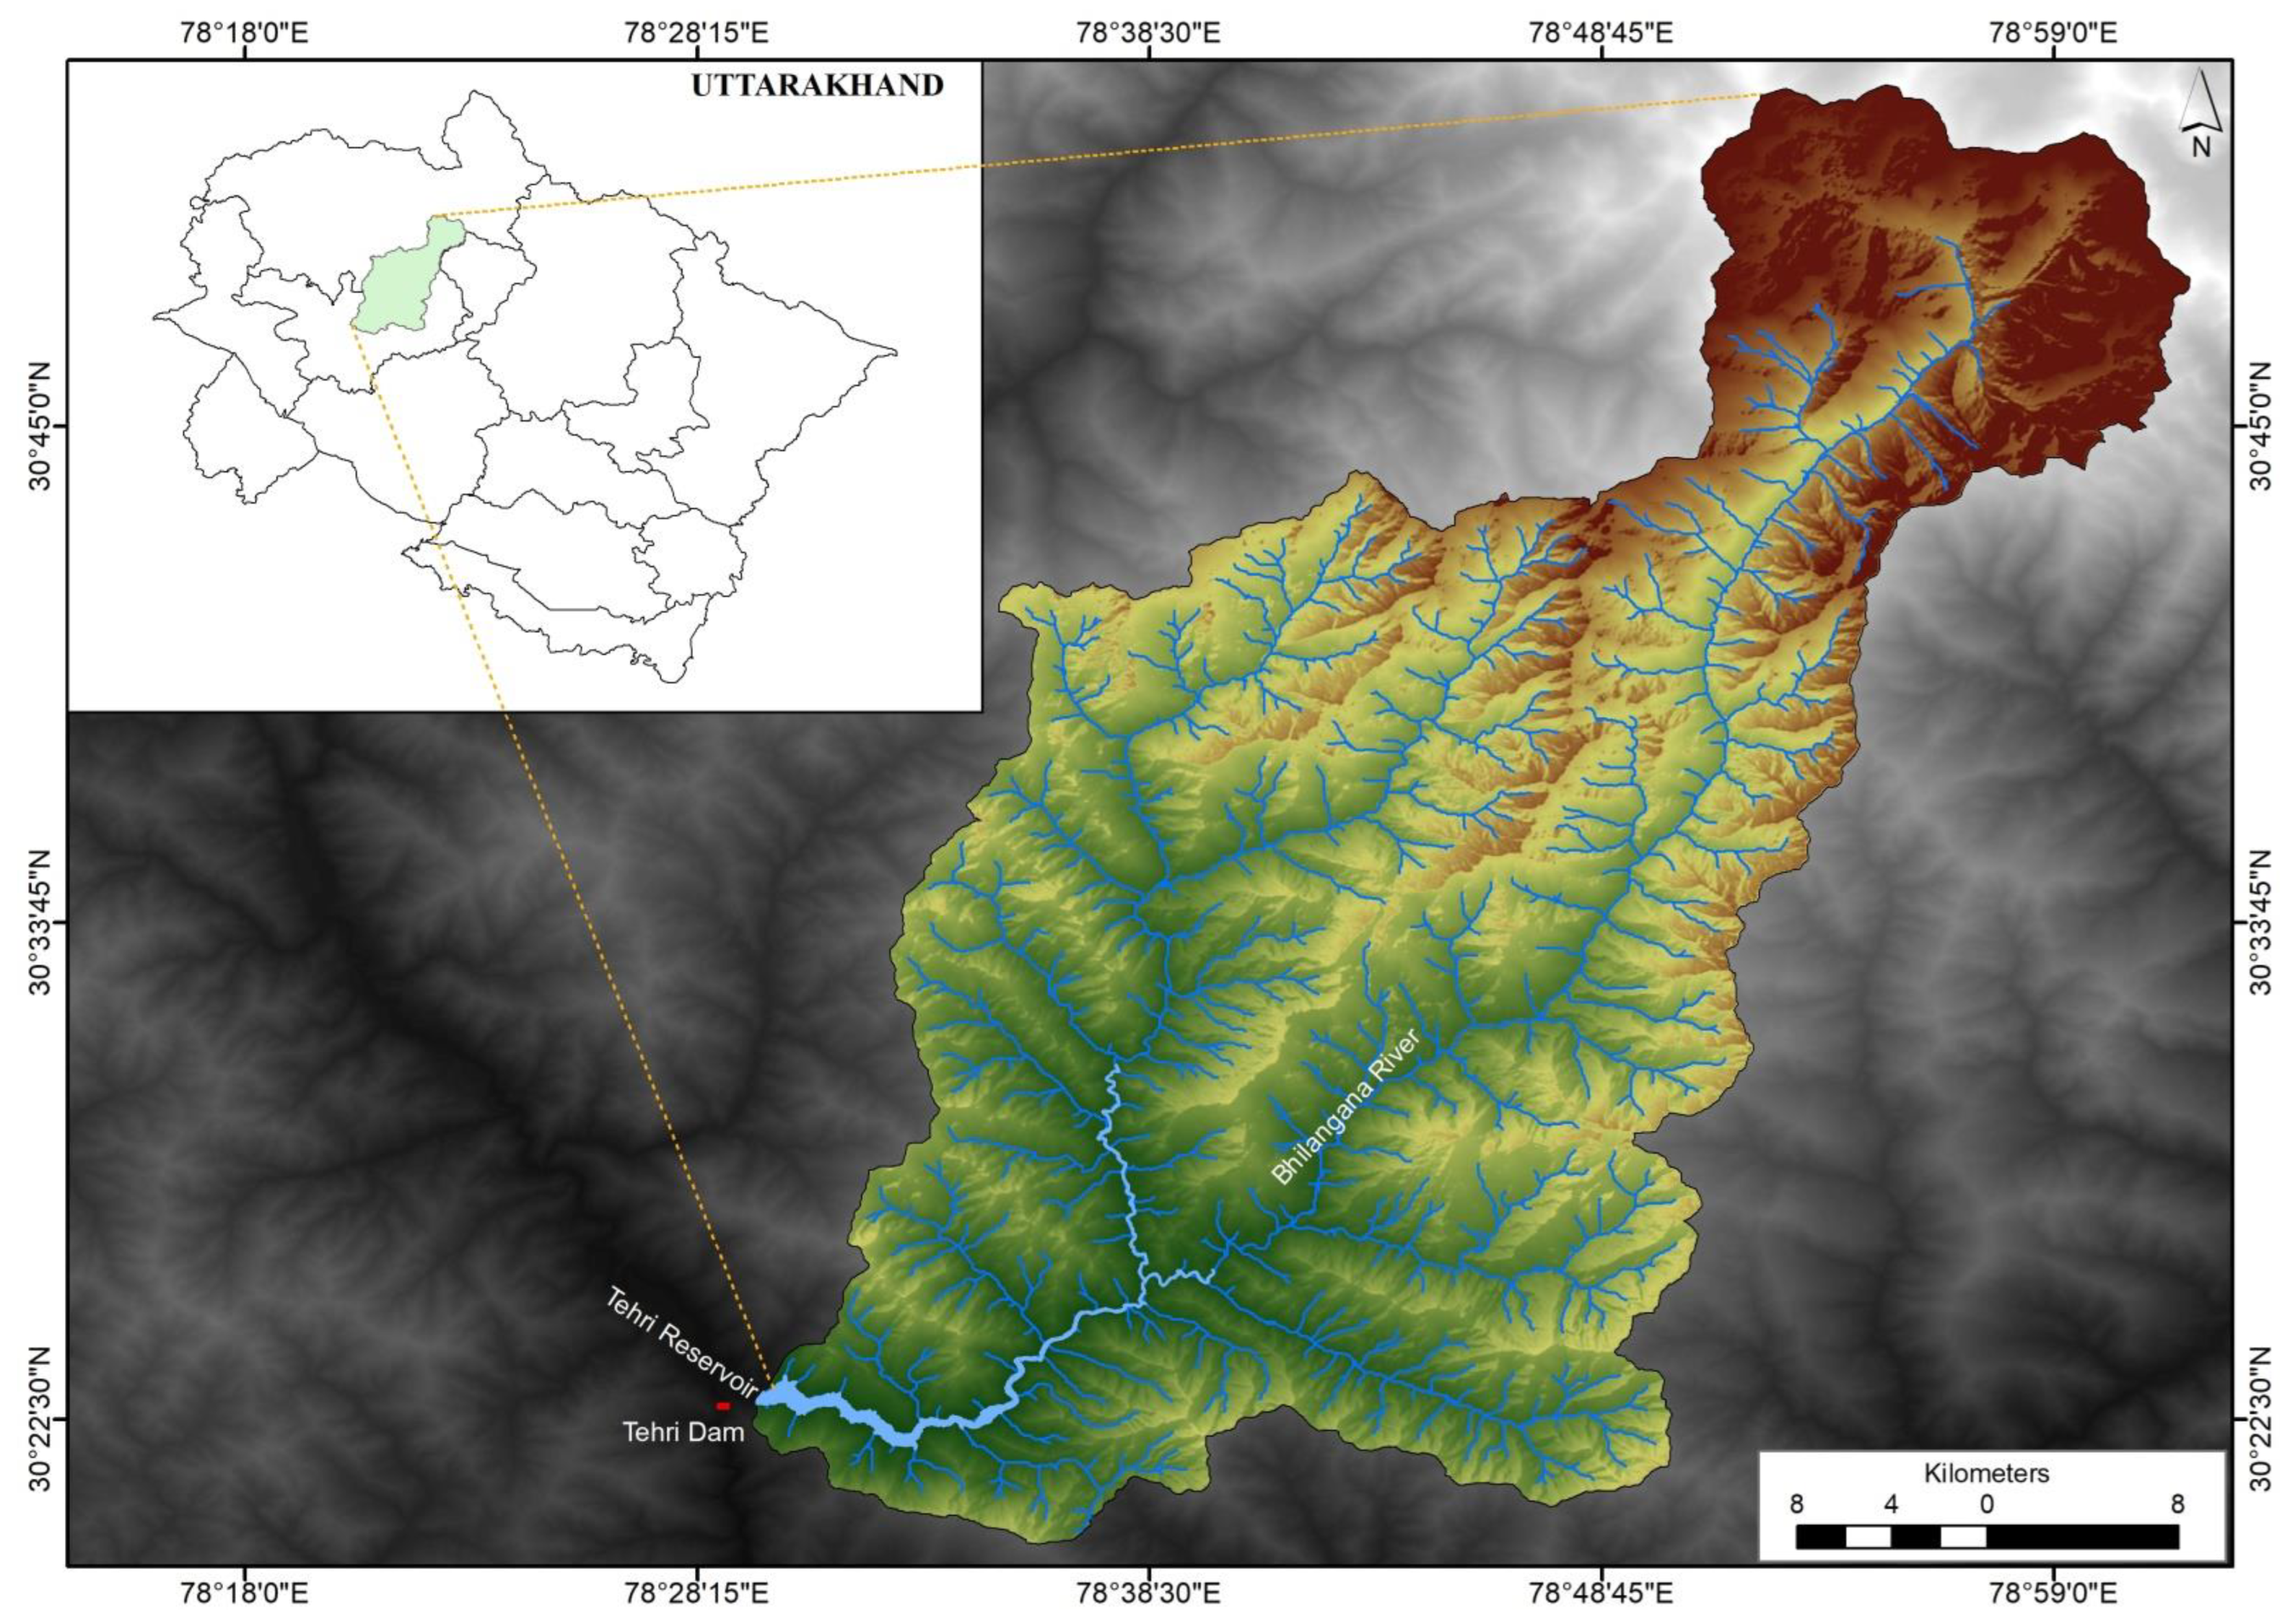
Figure 1. Location map of the Bhilangana basin, Tehri Garhwal District, Uttarakhand (India).
Sustainability 14 10221 g001
Figure 2. Land use and land cover map of the basin; (a) LULC, 2000 based on the Landsat 7 ETM+; (b) LULC, 2010 based on the Landsat 5 TM; (c) LULC, 2020 based on the Landsat 8 OLI; and (d) changes in the LULC over the study period (2000–2020).
Sustainability 14 10221 g002
Figure 3. Satellite monitoring of Climatic variability in the study area; (a) Area−Averaged of Annual mean surface radiative temperature 1982–2021 (0.1 deg., FLDAS_NOAH01_C_GL_M_001); (b) Area−Averaged of Annual mean 2−m air temperature 1982–2021 (0.5 × 0.625 deg., MERRA-2); (c) Area-Averaged of 2−m air temperature−January (°C) 1982–2021 (0.5 × 0.625 deg., MERRA−2); (d) Area-Averaged of 2-m air temperature−June (°C) 1982–2021 (0.5 × 0.625 deg., MERRA−2); (e) Area−Averaged of Specific humidity (Atmospheric Moisture in %), 0.25 deg. (GLDAS Model); (f) Area−Averaged of Potential evaporation rate in Wm-2 (0.25 deg., GLDAS Model); (g) Area−Averaged of Monthly Total surface precipitation in mm (0.5 × 0.625 deg., MERRA-2); and (h) Area−Averaged of Annual Precipitation in mm (0.25 deg., TRMM_3B42).
Sustainability 14 10221 g003
Figure 4. Mean monthly minimum and maximum Surface air temperature for the area (data boundary over the Tehri reservoir 78.625 E, 30.375 N, 78.625 E, 30.375 N TRMM_3B42).
Sustainability 14 10221 g004
Figure 5. Land use and land cover dynamics after dam construction; (a) confluence of the Bhagirathi and Bhilangana Rivers, Landsat ETM + Satellite image (25 November 2000); (b) picture of the reservoir and submerging the area in the Bhilangana valley; (c) abandoned village along the reservoir; and (d) submerged agriculture land and roads visible due to the falling water level of the reservoir during the 1 June 2018.
Sustainability 14 10221 g005
Figure 6. (a) inundation of LULC in the study area; (b) delineated settlement, agriculture land and forest cover on the satellite images.
Sustainability 14 10221 g006
Figure 7. Vegetation cover and human imprint analysis; (a) NDVI image of 2000; (b) NDVI of 2010; (c) gridded population density map of 2000 (Gridded Population of the World (GPW), v4; Socioeconomic Data and Applications Center (SEDAC), A Data Center in NASA’s Earth Observing System Data and Information System (EOSDIS)); and (d) gridded population density map of 2010 (EOSDIS).
Sustainability 14 10221 g007
Table 1. Land use/cover changes in the study area from 2000 to 2020.
Category200020102020
Area (km²)% of AreaArea (km²)% of AreaArea (km²)% of Area
River/Reservoir, Lake4.860.3315.361.0316.861.14
Settlement8.110.5510.580.7111.570.78
Agriculture land162.5810.95156.5210.55158.4610.67
Barren land127.368.58130.638.8097.386.56
Exposed rocky surface52.803.5656.063.7845.363.06
Scrubland & Grasses102.786.9298.556.6497.596.57
Sparse Forest127.328.58147.619.95152.2310.25
Dense Forest776.4252.31691.7146.61775.8552.26
Glacier & snow cover121.978.22177.1311.93129.418.72
Total1484.20100.001484.16100.001484.72100.00
Publisher’s Note: MDPI stays neutral with regard to jurisdictional claims in published maps and institutional affiliations.