Article

Circular Economy in the Context of Food Losses and Waste

by
Agnieszka Dudziak
1,
Monika Stoma
1,* and
Arkadiusz J. Derkacz
2
1
Department of Power Engineering and Transportation, Faculty of Production Engineering, University of Life Sciences in Lublin, 20-612 Lublin, Poland
2
Faculty of Social Sciences, Calisia University, 62-800 Kalisz, Poland
*
Author to whom correspondence should be addressed.
Sustainability 2022, 14(16), 10116; https://doi.org/10.3390/su141610116
Submission received: 6 July 2022 / Revised: 5 August 2022 / Accepted: 11 August 2022 / Published: 15 August 2022

Abstract

:
Although consumption is one of the most important elements of any economy, including those that are developing, excessive consumerism is becoming increasingly common today, often resulting in the phenomenon of food waste. Food waste is a multi-aspect issue. It is a topical problem of varying nature and intensity, particularly for the environment, the economy, and society. In this context, efforts were made to emphasize the importance of the idea of a circular economy, due to the fact that the positive effects of its implementation and correct application may be the minimization of the problem of food waste, which can be seen from an economic, social, or environmental point of view. To obtain this goal, consumer research was conducted among the inhabitants of Eastern Poland. Their principal task was to define social attitudes and explain a problem known as household food waste. The results were subjected to the cluster analysis method and correspondence analysis, and the corresponding calculations and figures made it possible to draw conclusions from the research. Consumers seem to be aware of the dilemma of excessive food discarding in their households. They also recognize their active role in preventing this socio-economic problem. Despite the concerns expressed by consumers, food waste is still very high. This may most likely be because of a declarative approach rather than to the actual attitudes of respondents.

1. Introduction

Over-throwing of food is a serious problem which poses serious difficulties for the entire economy and for ethical, environmental, and social aspects. It is an interdisciplinary phenomenon and is increasingly considered and analyzed by various stakeholders: decision makers at local, national, and European levels, international organizations, NGOs, and scientists from various fields, as well as society [1,2,3]. It has also been recognized as one of the most important issues of sustainable development at the global level [4].
Considering the economic aspect, food waste means money losses, both for individual units and national economies [5]. Regarding ethical issues, it must be stressed that food waste is a moral and ethical problem. This is because numerous people in the world are chronically hungry. When considering the ecological environment, however, it should be noted that food waste results in a large amount of greenhouse gases. In addition, global food production consumes large amounts of fertilizers and limited resources (e.g., water, soil, and labor). This, in turn, contributes to climate change [6].
The dependence of the circular economy on food waste seems to be a simple explanation. Waste, on the one hand, is a troublesome problem, and, on the other hand, an inevitable problem. However, dealing with it is the need of the present times, especially now, when the unstable economic and political situation of many countries and its impact on the economic and environmental systems of the world clearly show that the problem is enormous and should be dealt with in various aspects. Food that is potentially analyzed in the context of waste is at different stages; it should certainly be segregated into food that is wasted and could still be consumed, and food that cannot be used for consumption. Then, appropriate instruments should be used, giving the opportunity to treat it as a resource, which, in turn, should be treated as a raw material. There are already solutions in the world that enable the production of energy from waste (e.g., in Sweden) also from the agri-food sector. Hence, combining the waste management scheme with energy production in such a way that individual countries have practically no problems with either environmental or energy prices could be a very sensible solution adequate to the contemporary political and economic situation.
Therefore, it seems that, due to the growing scale of this phenomenon, the conception of a circular economy is of particular importance [7,8,9,10,11]. The growing importance of this phenomenon, as well as the growing concerns of the public, producers, and governments about food safety and the multiple environmental effects, such as resource scarcity, ground erosion, deforestation, water and air pollution, and greenhouse gas emissions, are, therefore, also important. This is often related to food production itself, storage, transport, and waste management [12].
The assumption of the contemporary circular economy is that produce, supplies, and raw goods should stand in the economy as long as available. However, the volume of waste must be stored to a minimum. An important phenomenon in the circular economy seems to be the increasing consumption of various resources used in the processing and the growing energy demand of various sectors of the economy [13,14].
Just like currently in the lifestyle of the modern consumer, the concepts of zero waste or less waste are becoming more and more important, so, with production companies, more and more attention is paid to the phenomenon of waste. If we want to live in accord with the rules of sustainable improvement, there is no other option than to think about reusing resources that may seem useless.
The idea of a circular economy considers all stages of the product life cycle [15], appearing from its conception, through manufacture, consumption, and waste compilation, to its management. So, we are discussing an escape from a linear economy based on the doctrine of “take–produce–use–dispose” [16,17,18], in which waste is often treated as the last stage of the life cycle. In a circular economy, it is essential that rubbish, if it is made, is treated as secondary raw materials [11,19,20].
In this paper, an attempt was made to draw attention to the importance of the concept based on eliminating the problem of waste. The focus is on the food market, but the problem is much deeper and more complex. The enormous global overproduction applies to all markets, but, above all, it should start in the minds of consumers and users of products, which should consequently also change the approach of producers. Therefore, research was carried out among the inhabitants of Eastern Poland, attempting to identify their attitudes and declarations towards the issue of wasting food in households, taking into account two grouping variables that may be important in this matter—namely: gender and place of residence.
It seems, however, that despite the local extension of the sample and its preliminary nature, the contribution of the study is significant because, first, there is very little research on this region of Europe in the context of food waste, referring simultaneously to urban and rural households, in correlation with the gender of the inhabitants and their declarations of wasting or not wasting food. In addition, the obtained research results may constitute an important starting point for further considerations, especially in the context of discrepancies between the declared and actual attitudes and behaviors of respondents in relation to the level of awareness of Polish consumers in terms of food waste, on the one hand, and, on the other, to the actual level of food waste in Poland.

2. Literature Review

2.1. The Essence and Assumptions of the Circular Economy Concept

The circular economy (CE) approach is trending both among scholars and practitioners [20]. It is regarded as an operationalization for corporations to achieve the often-discussed conception of sustainable improvement [21,22]. Unusual approaches that are also supposed to operationalize sustainable development for corporations are the green economy and green growth approaches [23,24], whereas the CE thought is claimed to be the one with the most traction at this time [25]. An approach with so much suction is employed by various shareholders.
Based on the groundbreaking work of Leontief (1991), for a long time, attempts have been made to develop a new business model in accordance with the logic of circular flows, which led to the creation of the original circular economy (CE) concept. Also known as “near-material economy”, “life-cycle economy”, or “closed-loop economy”, the CE concept is an alternative to an open and linear business model, which is replaced by a closed material flow loop creating feedback cycles: resources–products–resources. The CE concept involves the recovery of waste and allows materials to be reused in two types of streams:
(1)
Biological streams in which nontoxic materials are cascaded and then returned to the biosphere for the restoration of natural capital;
(2)
Technical streams where the materials used are returned to the economic system, either through repair and restoration, or—ultimately—recycled [26].
The increasing acceptance of the CE approach results from the weakening condition of the natural environment and from the need to search for production and consumption structures that are less dependent on depleting natural sources.
The circular economy is self-regulating in nature [27]. It means an economy in which the flow of materials, energy, and environmental degradation is minimized, without restricting economic development or technical and social progress [28]. The Ellen MacArthur Foundation defines four basic principles of the circular economy concept [29]:
(1)
Optimizing the use of resources and energy throughout their life cycle;
(2)
Maintenance of products, ingredients, and materials in the long term, assuming the highest possible level of their utility and value;
(3)
Passing materials through the system as many times as possible due to their cascading use in a variety of applications;
(4)
Use of clean materials to improve the quality of their reuse.
The implementation of the circular economy approach is based on the so-called 3R principle (reduce, recycle, and reuse). “Reduce” means that, at a given level of production, it is possible to reduce resource inputs and, at the same time, increase production efficiency [30].
“Reduce” relates to three aspects, i.e., it presupposes: (1) reduction of raw materials and energy inputs; (2) reducing the amount of products produced that most people do not need; and (3) reducing the demand while maintaining the current quality of life [31].
“Recycle” means that waste can be transformed for further use [30]. “Reuse”, in turn, means that recycled materials can become inputs in subsequent production processes [30]. Reuse also relates to three aspects: (1) includes multifunctional goods; (2) includes waste as raw materials in the production process; and (3) assumes—as far as possible—the substitution of renewable and nonrenewable resources [31].
Several circularity strategies exist to reduce the consumption of natural resources and materials, and minimize the production of waste. They can be ordered for priority according to their levels of circularity (Table 1). Smarter product manufacturing and use, for example, by product sharing, are generally preferred over extending the lifetime of products, due to the product being used for the same product function or more users being served by one product (strategy with high circularity). Lifetime extension is the next option and is followed by recycling of materials through recovery. Incineration from which energy is recovered has the lowest priority in a circular economy, because it means the materials are no longer available to be applied in other products (low-circularity strategy). As a rule of thumb, more circularity equals more environmental benefits.
The doctrine of the popular linear economy model, i.e., take–make–dispose, is unable to deal with the supply and demand balance in consumption of natural resources. This inequality is affecting the globe’s sustainability and affecting the environmental and socio-economic conditions [32]. Some of the related factors of linear economy have proved that it is unsuitable and resulted in a recent major change, i.e., CE.
The CE concept was popularized in China in the 1990s in the perspective of economic growth and natural resource limitations [33]. Early studies on CE state that upgrading of producing systems was focused and there was no explicit realization of social situations in sustainable improvement. It was suspected that sustainable development reaches the demand of the present without arbitrating the potential of future generations to meet their own needs. It is still unclear how CE will meet social dimension and will justify the three pillars of sustainability: economic, environment, and social. These three important pillars are missing from the network of sustainable supply chain and need rigorous attention in the CE [34]. The main aim of the CE is to gain hold on material recycling and to balance economic and environmental growth [35].
Nowadays, the manufacturing industry is undergoing transformation from linear to circular economy. In this direction, Industry 4.0 is considered as key innovative technology.

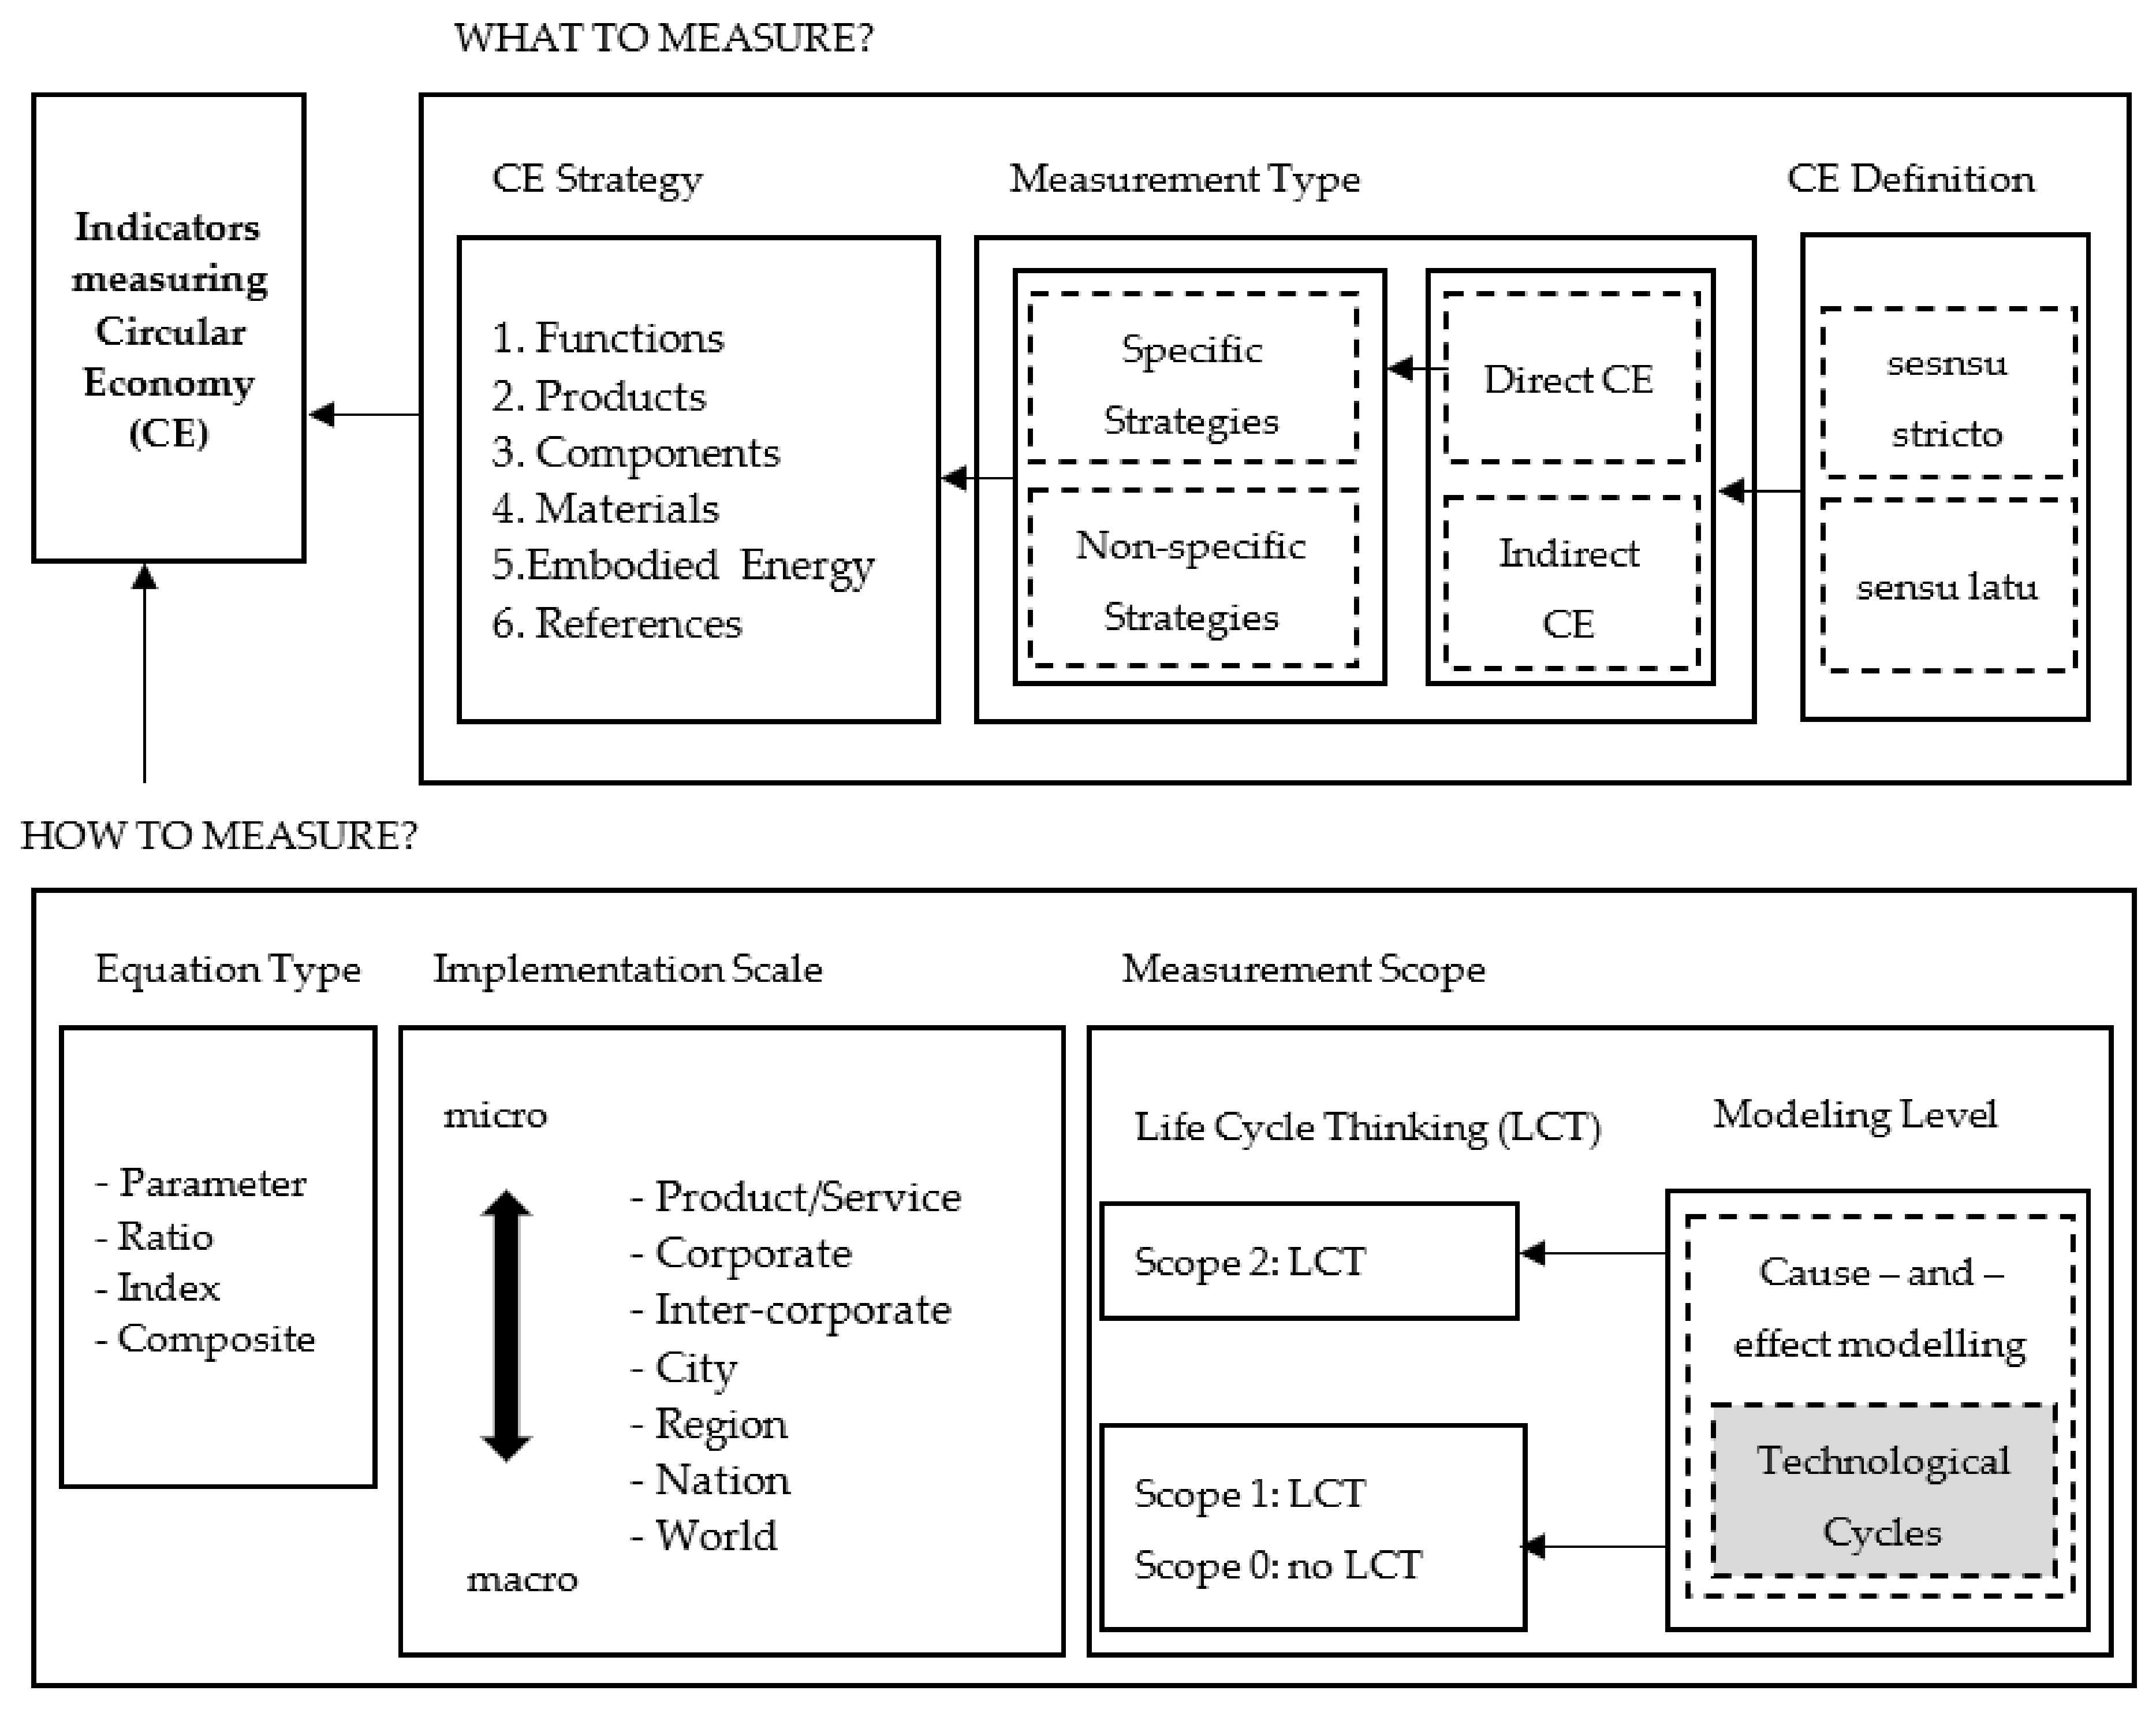
2.2. Circular Economy Indicators
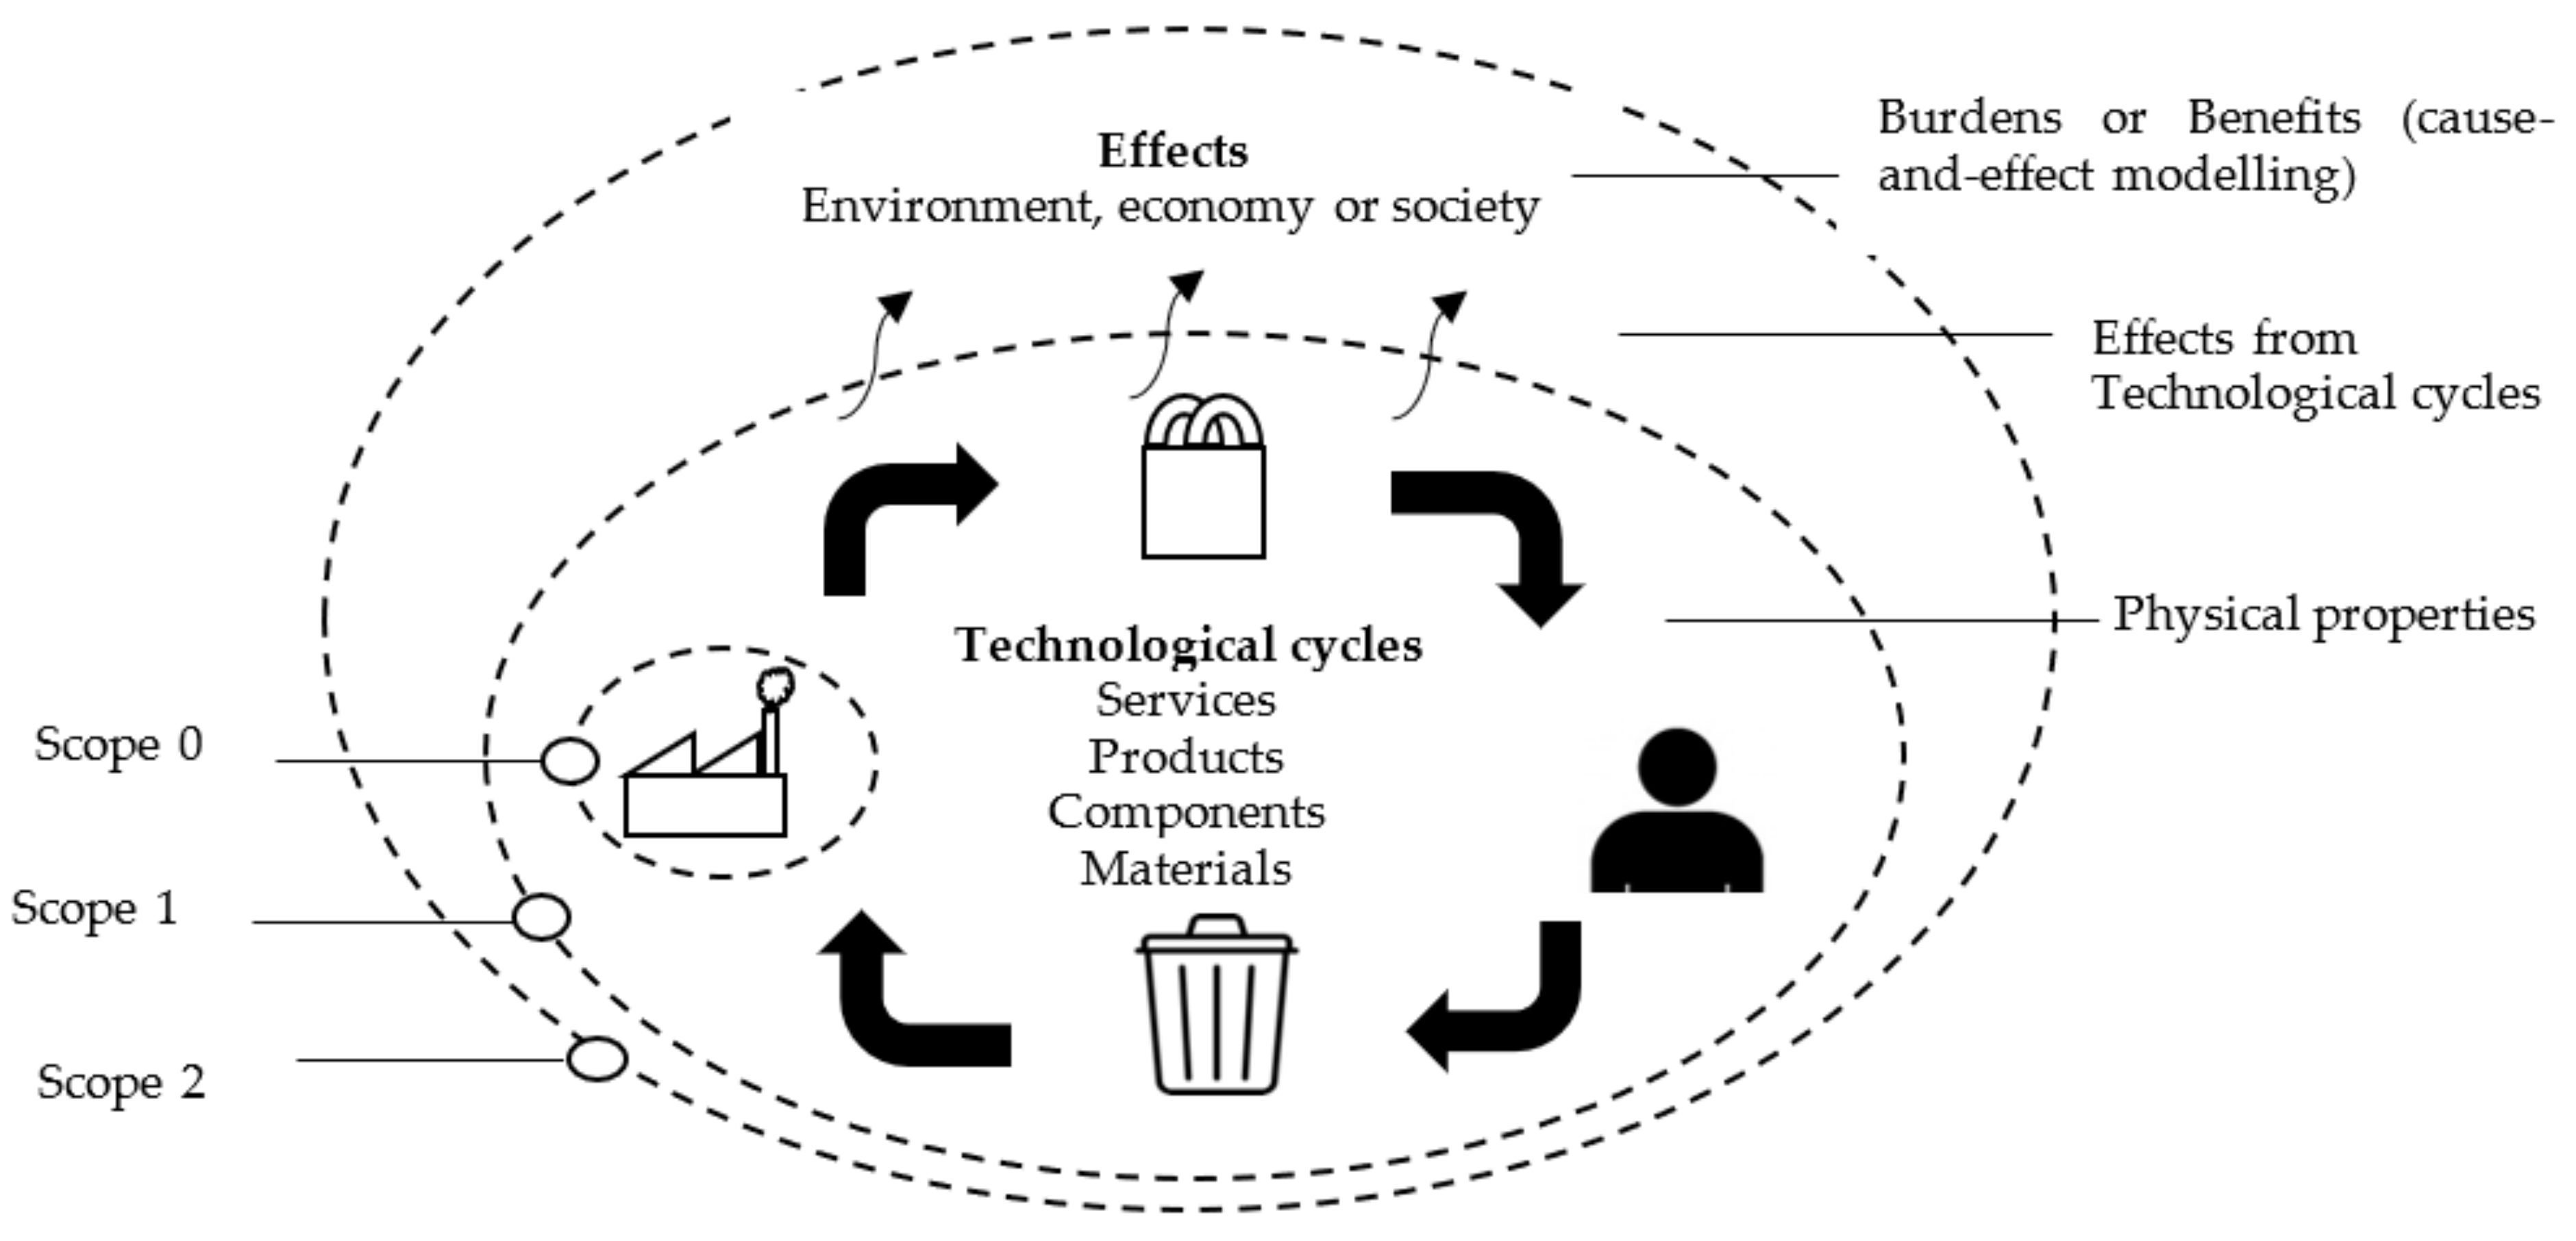
Many devices and indexes are convenient to measure the effects of CE on the conversion to the circular environment and economy [36,37]. It is recommended to formulate a concept, which should at least include focusing on cradle-to-grave consumption of resources and materials, including food products, as a complementary indicator for the circular economy; cradle-to-grave monitoring of energy consumption as a proxy for other environmental factors illustrating impacts along the product chain; and tracking energy consumption in the closed-loop process itself.
Indicators measuring CE can be classified into three measurement scopes considering their LCT approach and modeling level (technological cycles and their cause-and-effect chain)—Figure 1 and Figure 2:
(a)
Scope 0: the indicators measure physical properties from the technological cycles without LCT approach, e.g., recycling rate [38].
(b)
Scope 1: the indicators measure physical properties from the technological cycles with full or partial LCT approach, e.g., the indicator reusability/recyclability/recoverability (RRR) in terms of mass includes the potential rate to reuse (products and components), recycle (materials), and recover (energy) [39].
(c)
Scope 2: the indicators measure the effects (burdens/benefits) from technological cycles regarding environmental, economic, and/or social concerns in a cause-and-effect chain modeling, e.g., RRR benefit rate (RRR in terms of environmental effects) [40].
Figure 1. Proposed classification for the three measurement scopes from CE indicators. Resource: [41].
Sustainability 14 10116 g001
Figure 2. Classification framework for CE indicators. Resource: [41].
Sustainability 14 10116 g002

2.3. The Problem of Wasting Food

Food waste is a multifaceted, complex, global problem that produces serious social, economic, and ecological consequences. This is not a problem for which one simple solution is possible. Nevertheless, ways to prevent food waste should be sought in various sectors—public, nongovernmental, and market [42].
Food waste and the production of food waste now occur at all stages of the food supply chain, from production to distribution and final consumption [43,44]; however, in relation to developed countries, households, which have been identified as key players in the generation of food waste, undoubtedly have the largest share in this phenomenon [1,45,46]. Nearly 90 million tons of food are lost each year in the EU alone, and households are responsible for 53% of all food waste [47]. This also applies to Poland, where nearly 5 million tons of food waste is sent to the bin, of which we are responsible for 3 million tons in our homes. As consumers, we often buy and store too much, and do not plan meals and purchases. The Institute of Environmental Protection—National Research Institute reports that, in Poland, every second throughout the year, nearly 153 kg of food are thrown into the trash in the entire food chain, i.e., from producers, through distribution and gastronomy, to consumers. We are responsible for 92 kg of this amount, which, for example, for bread, gives as many as 184 loaves [48]. This may, among other factors, result from socio-economic development, because, as proved by Parfitt et al. [49]—with an increase in disposable income and, consequently, a change in lifestyle—the amount of household waste is constantly growing.
The research results clearly show how important our responsibility at home is on a daily basis, and, hence, the awareness that we can reduce food waste with little effort. As adults, we must take care to limit the disposal of food ourselves for the benefit of ourselves but, most of all, for our children and future generations, to leave the planet in a state no worse than the present one [50,51,52,53]. Household food waste is produced in three certain stages—during shopping, storage, and serving. This means that food can be bought and never prepared, prepared and never served, or served and never eaten [54].
An important issue in preventing food waste is the so-called sustainable consumption. Głowacki et al., making an initial delimitation of circular economy areas as part of sustainable consumption, adopted the following assumptions [55]: (1) the focus of sustainable consumption is the consumer (Latin—consumens)—a person who purchases goods for his own use; otherwise—a link at the end of the economic chain (the final recipient of goods and services; and, (2) taking into account the specificity of the project, which is to ultimately develop a system of measurement indicators related to circular economy, significant from the perspective of the Polish economy, the areas identified in the Roadmap project were taken into account as a basis.
Taking the above into account, the following areas of sustainable consumption were proposed for further analysis: 1. prevention of municipal waste generation, 2. responsible consumption of food—reducing food waste, 3. education in the field of circular economy, 4. shared economy in terms of mobility, and 5. energy based on renewable energy sources (RES) [55].
As part of a partnership between the United Nations and other international organizations, the first global standard for measuring food loss and waste was created—The Food Loss & Waste Protocol. This standard enables a broad spectrum of stakeholders, countries, corporations, and other institutions to measure and inform food waste data in a reliable, efficient, and consistent manner, thus enabling waste reduction efforts (FLW Protocol) [56].
In conclusion, it can be concluded that, in recent years, many organizations in developed countries have also made efforts to raise the awareness of various stakeholders and social groups about sustainable production and consumption, and, above all, to effectively manage surplus food and to properly address the economic, environmental, and social effects of food waste. A certain framework for food and waste surplus has also been developed, establishing a hierarchy of preferred categories of solutions: prevention first (reducing surplus at source), then recovery (reuse for human consumption), and, finally, recycling (animal feeding, energy production, or compost), which is in line with the idea of a circular economy [12]. Much of the food waste has the potential to be reused in an industrial symbiosis and is a source of valuable compounds that can be used, for example, in the pharmaceutical industry [44] but can also be used, for example, as a composter.

3. Materials and Methods

3.1. Study Design—The Choice of the Research Method and Study Area

As already mentioned, food losses both around the world and in Poland are increasing. Therefore, every year, there is an increasing amount of food waste generated from various sources [57,58,59]. Huge amounts of this type of raw material are already wasted in the household, through irrational food management by consumers, as well as purchasing food products too often, too much, and not always in a thoughtful and controlled manner.
Hence, in 2021, research was conducted in a group of 384 respondents from Eastern Poland; their aim was to illustrate the phenomenon of food waste and, above all, to identify and assess the attitudes and declarations of individual consumers in this area. A qualitative approach was used for the analysis—tests were carried out using the diagnostic survey method. The overall ambition of qualitative analysis is to gather large and mixed knowledge, from various viewpoints, relating to the topics/matters covered by the research. Hence, the choice of the method used in this study was dictated by the fact that it allows information to be obtained about both subjective and objective states of the respondents. The use of a questionnaire as a research tool also allows for appropriate processing of the obtained data [60,61,62].
According to Hanssen et al. [63] estimates of the amount of food wasted vary from country to country, but also between different regions of the country. As added by Garcia-Garcia et al. [64], differences in estimates of food waste may result from different definitions and methodologies used by researchers. In addition, despite numerous national studies, conducted mainly in developed countries and regions of Europe and North America, some regions are somewhat omitted in the literature on food waste and management, mainly countries and regions of Southern and Eastern Europe [65,66,67]. As Florkowski et al. adds [67], data on food waste in households are usually specific to a specific area. In addition, national large-scale research may be costly or ignore differences in food waste due to the location of households, including rural and urban environments, or regional differences and related consumption choices.
Therefore, the region of Eastern Poland was selected for the study, with an emphasis on the Lubelskie Voivodeship, because this region is one of the 20 poorest regions of the EU [68]. It seems that this may be important in the context of wasting food, because the inhabitants of the region of Eastern Poland have a relatively lower income than the inhabitants of, e.g., Central or Western Poland, which may result, on the one hand, in cost-effective expenses, including food purchases, and, on the other hand, a higher share of food expenditure in relation to other types of products or services. Ultimately, this may result in greater care for the consumed food, and, consequently, throwing it away in smaller amounts.

3.2. Survey Questionnaire as a Research Tool

A structured questionnaire, distributed only via the Internet, was used as a research tool. The survey was anonymous and the respondents were informed about its assumptions and purpose, and voluntarily decided to complete it.
The questionnaire used in the author’s own research consisted of two parts—the metric and the substantive part. The metric part of the questionnaire made it possible to obtain basic information about the respondents in order to make their socio-demographic characteristics later. The grouping variables were the respondent’s descriptive features, such as gender, age, and place of residence. On the other hand, the second part of the substantive questionnaire made it possible to provide information on the research problems posed. It contained closed-ended, single- or multiple-choice questions. In some questions, it was still possible to include your own answer if none of the suggested variants fully reflected the attitudes, behavior, or feelings of the respondents. The respondents were asked mainly about whether they waste food, how often they do so, and, above all, what are the main reasons why they do so.

3.3. Research Sample

It was thought that the probe sample would be at least 350 units—inhabitants of Eastern Poland. One of the nonrandom methods of selecting the research sample was used—purposeful sampling. The benchmark of proposed choice was the realization by the participants of the research of the criteria defining the categories of grouping variables included in the metric part of the survey questionnaire. The purpose of this approach of choosing the research sample was to make a sample close to the representative sample [69].
In the research sample, the distribution of respondents by gender was basically the same, because there were 194 women (50.5%) and 190 men (49.5%). The largest group of respondents in terms of age was 19–25 years old—168 people, which constitutes 43.8% of all respondents; the remaining groups were relatively similar in number: under 18—58 people (15.1%), 41–65 years old—56 people (14.6%), people aged 26–40 years—70 respondents (18.2%), and over 65—32 people (they accounted for 8.3% of the survey respondents).
In the case of the last metric variable, i.e., the place of residence, the greatest number was people living in rural areas—112 respondents (29.1%), people living in cities with up to 100,000 inhabitants—94 people (24.5%), people living in cities of 100,000 to 300,000 inhabitants—104 people (27.1%), while people living in the largest cities—those with more than 300,000 inhabitants—accounted for 19.3% of all respondents (74 people).

3.4. Data Analysis

Due to the fact that a qualitative approach was used to conduct the research, it was necessary to use appropriate methods so that the results of the qualitative analysis would allow for a reliable and unambiguous interpretation of phenomena and giving meaning to the responses of the study participants [70,71]. For this purpose, two main methods of statistical data analysis were used—cluster analysis and correspondence analysis.
In order to distinguish groups of respondents who showed similar behaviors in relation to the consumption of food, in the first step of the assumed research procedure, a cluster analysis was carried out for this purpose. It is a series of multidimensional statistical collection methods, including data segmentation, to extract homogeneous objects from the population studied. A complete dataset is divided into data groups. This aims to obtain clusters that comprise similar elements but that differ from the elements of other groups [72,73,74].
Then, due to the nature of the research variables (qualitative variables), the correspondence analysis method was used; it was carried out in relation to three selected variables, i.e., gender, places of living, and food waste declaration.
Correspondence analysis involves the description and exploration of bidirectional and multidirectional arrays. It uses indicators that characterize the relationship between columns and rows. These results provide the information needed to analyze the structure of the qualitative variables in the table [75,76,77]. The result is a two-dimensional quota table where the frequency in the quota table has been pre-normalized. This allows you to calculate the relative frequencies in all fields (cells) of Table 2. One method of presenting the goals of a typical analysis is to show the relative frequencies as distances between individual rows or columns in a space with a few dimensions. In this analysis, inertia is defined as the quotient of the Pearson chi-square statistic calculated from a bidirectional table to an integer (in this example, the total is 384). The total inertia is a measure of the profile scattering around the respective average profiles. It should be added that the dimensions are set in such a way as to maximize the distances between the points representing the rows or columns. Successive dimensions (independent or orthogonal to each other) always explain smaller parts of the general square chi (i.e., also inertia).
In correspondence analysis, the term inertia is used analogously to the concept of moment of inertia in applied mathematics, which is defined as the mass integral multi-plied by the square of the distance from the center of gravity (or to the notion of variance in statistics).
The analysis of statistics and charts resulting from the correspondence analysis al-lows for intuitive inference about the relationships between the categories of variables.
Data analyses were carried out on the basis of the statistical processing software Statistica 13.3 (Set Plus, version 5.0.96, license for University of Life Sciences in Lublin) and Excel 2013 (Microsoft Office Professional Plus 2013, license for University of Life Sciences in Lublin).
Table 2 presents basic information on research, methods, and tools, as well as sample selection criteria, which were implemented for the purposes of this publication.

4. Results and Discussion

4.1. Preliminary Research Results as a Background for Further Analyses

In the initial phase of the analyses, efforts were made to summarize the obtained results in a consistent and unambiguous manner, so as to provide a background for more advanced statistical analyses.
The conducted research shows that more women than men deal with household purchases. With regard to the variable grouping “age”, it can be stated that the vast majority of respondents aged over 65 write down what they want to buy. On the other hand, among young people, aged 19–25, there is a certain discrepancy—some of them write down a shopping list and the rest do it sometimes or not at all. These differences may result from the fact that some of the respondents from this group have their own families or are orderly people, and the rest lead a busy lifestyle and do not have time to write down what they really need. The latter behaviors are responsible for the fact that these people buy more than they should and, consequently, are forced to throw away unused products many times. In turn, respondents aged 26–40 and 41–65 mostly answered that they made a list before going shopping; this is due to the fact that these age groups are usually responsible for running a household and supporting a family.
For the vast majority of the population living in the countryside, food ends up in the basket sporadically. In second place in this respect are respondents from cities with 100–300 thousand residents, which may be the result of increased awareness and rational shopping among consumers. It is very satisfying that only a few respondents throw away food every day. It is also worth emphasizing that a dozen or so people declared that they never throw away food.
According to the respondents’ answers, leftovers from meals as well as fruit and vegetables most often go to the trash; the latter are classified as perishable food and quickly putrefy if not stored properly, and eating spoiled fruit and vegetables is harmful to the human body. Bread was ranked second in terms of the amount of food thrown away in households. Among the respondents, fish and their products are discarded the least; this may be the result of high prices and good-quality fish. Few people replied that they throw pasta and groats into the trash because it is a durable food and does not deteriorate as quickly as other products.
Similar conclusions were also reached by Jungowska et al. [78], where the obtained results indicated that meat products and dairy products, as well as vegetables and fruit, were characterized by the highest frequency of wastage. Also, research by Jörissen et al. [66], conducted among German and Italian households, confirmed that the most wasted products are vegetables, fruit, and bread. Fanelli [79] came to slightly different conclusions, according to which bread (21%), pasta (18%), fresh fruit (14%), vegetables (11.5%), and milk (10%) were the products that were wasted the most (74.5%). However, it seems that the presence of pasta in this comparison may result from the cultural specificity of Italy.

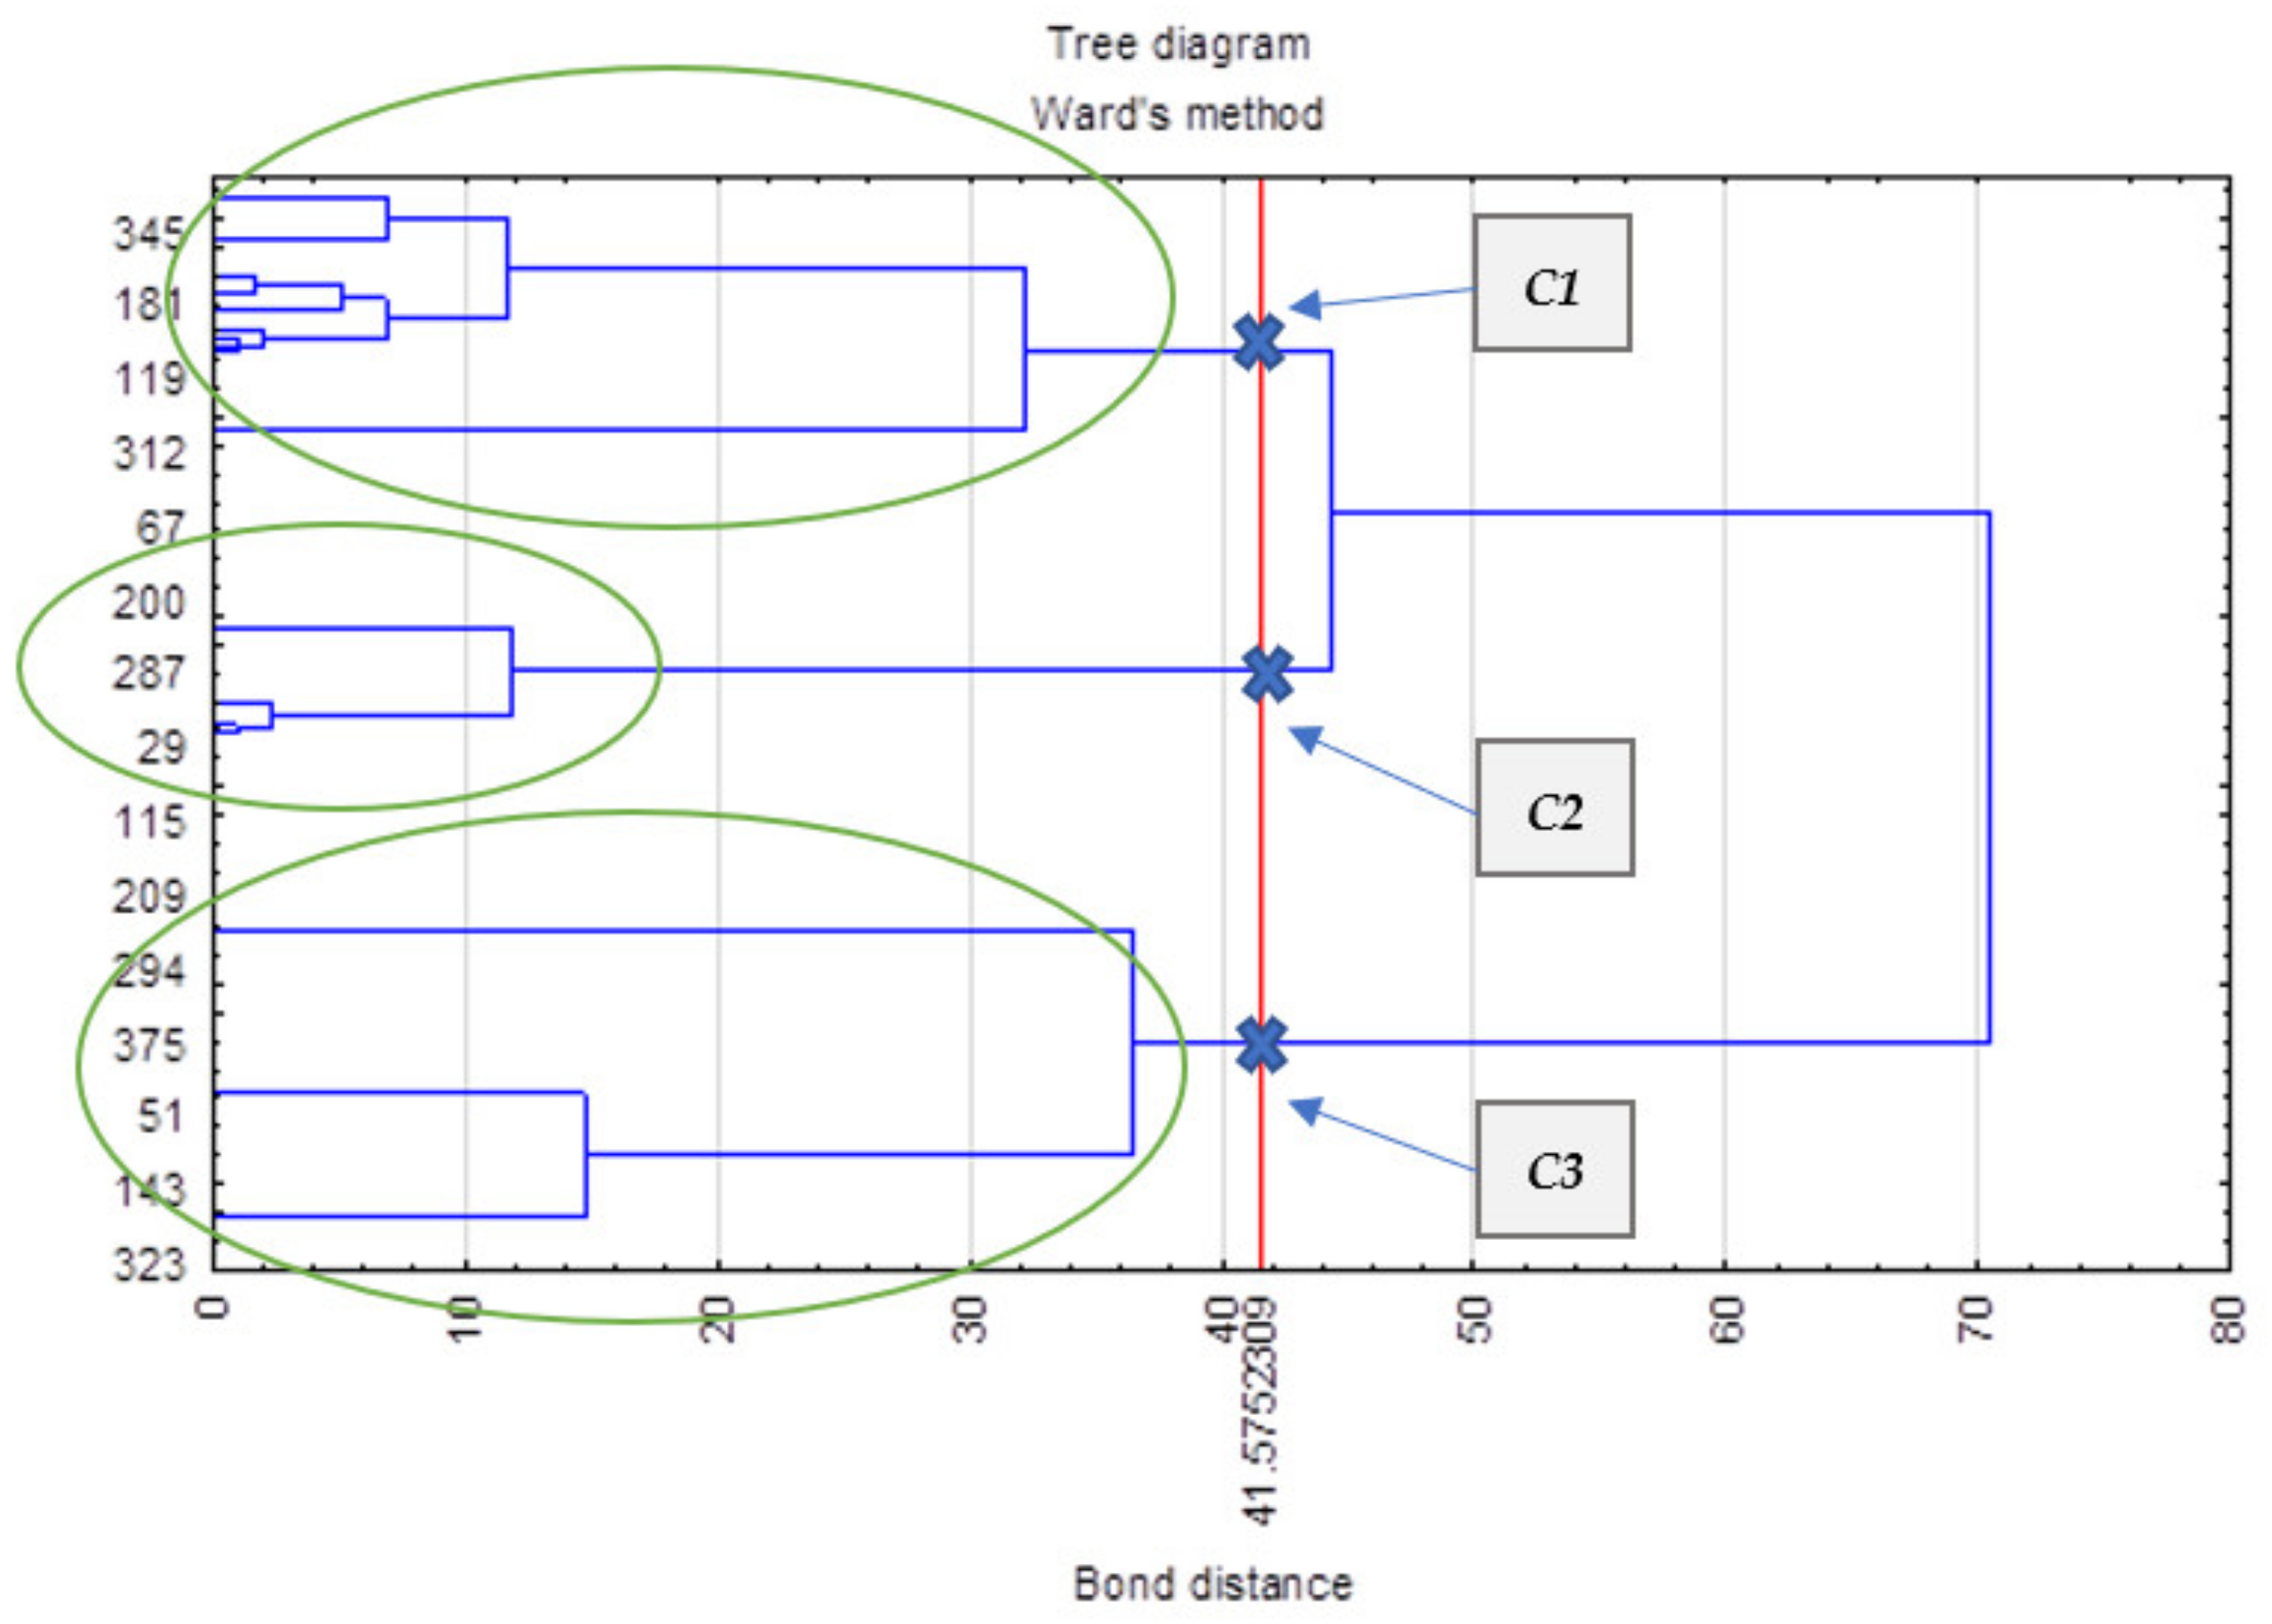
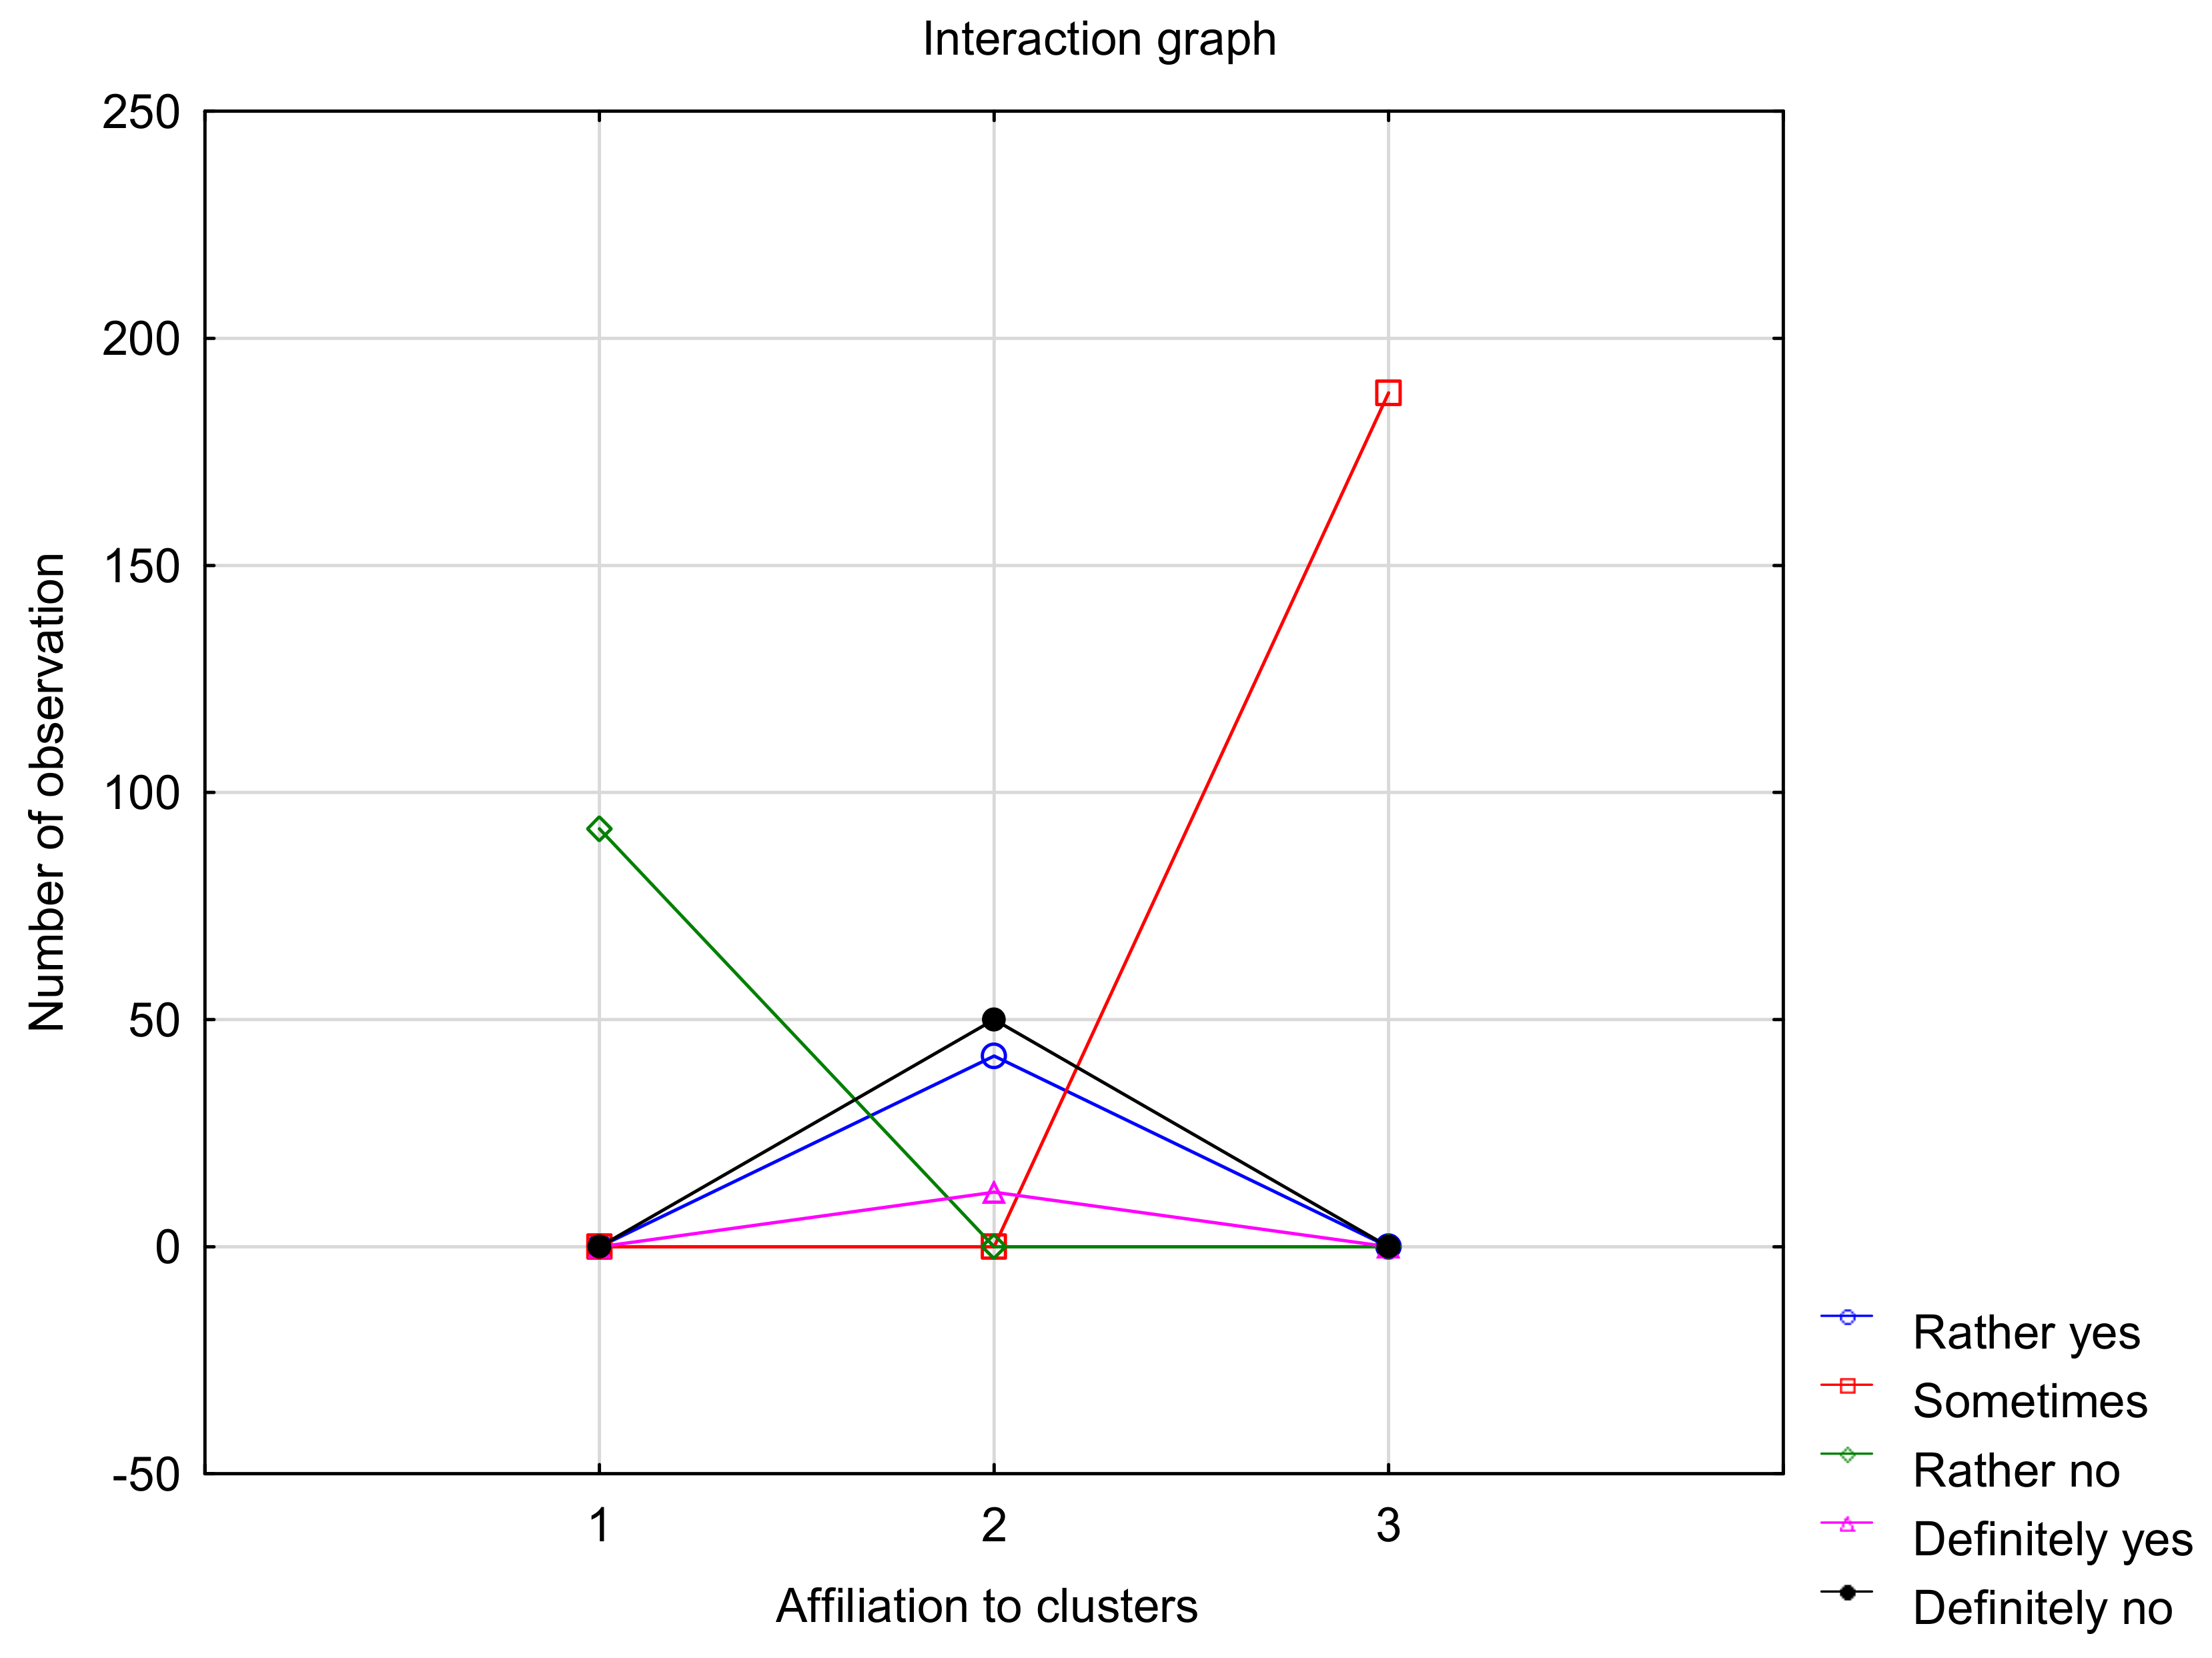
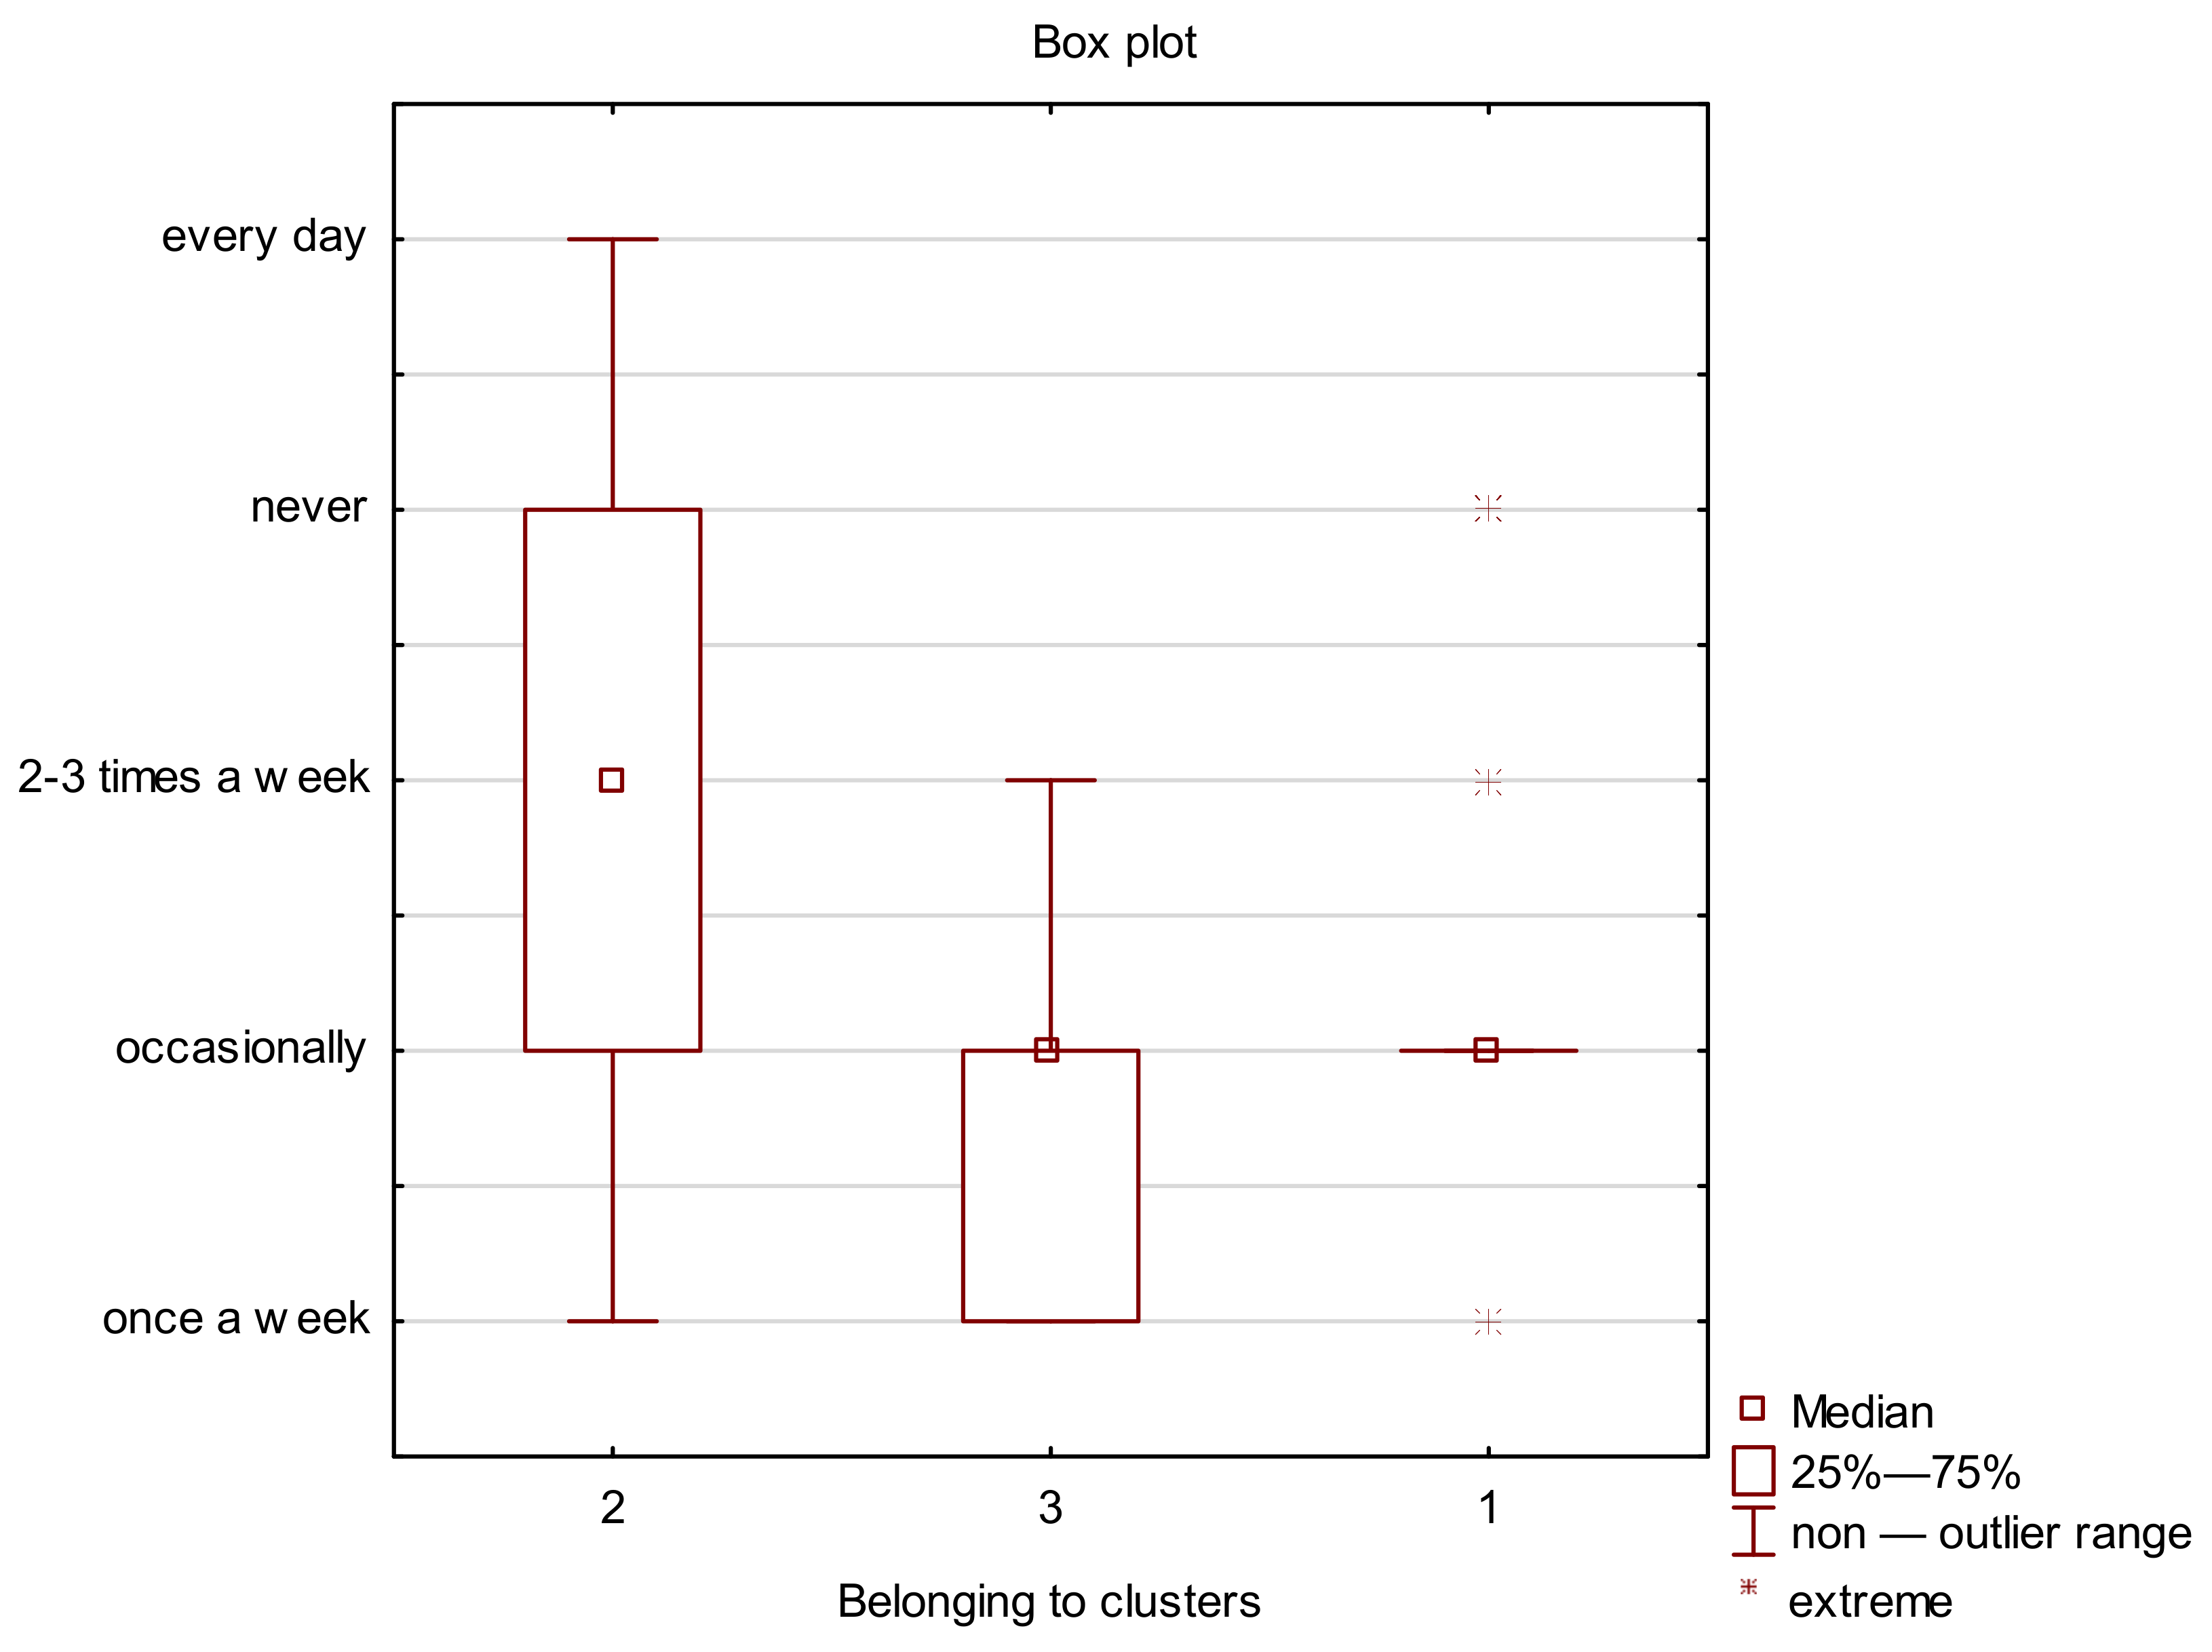
4.2. Cluster Analysis in Relation to Consumer Declarations of Throwing or Not Throwing Food Away

In accordance with the assumed research procedure, the next stage of research was to conduct a cluster analysis. Object-oriented grouping in the presented cluster analysis is based on data mining, thanks to which it is possible to divide the (multidimensional) dataset into groups in such a way that the elements in the same group are like each other, and as different as possible from the other elements’ groups. Due to its similarity to a tree, this representation is called a dendrogram.
Therefore, in Figure 3, using the hierarchical method of cluster analysis (Ward’s method [74,80]), the entire sequence of combining these clusters in the form of a dendrogram is presented in a graphical manner.
In the dendrogram presented in Figure 3, three clusters have been specified, where elements were grouped into relatively homogeneous classes, making it easier to distinguish their basic features—similar within a given class. The base of grouping was the similarity between the items—indicated by the similarity function (metric). We obtain groups of data by truncating the dendrogram at any level; in the case of the dendrogram shown in Figure 3, the cut-off was made when it was possible to distinguish three characteristic clusters (cut-off points are marked with symbols: C1, C2, and C3). In the case of these clusters, the distances are relatively the largest, which means that these groups of respondents differ from each other in the answers given.
Table 3 presents the statistics of significance tests and chi2 parameters referring to membership in clusters in the context of food thrown away by consumers.
As can be seen from the data presented in Table 3, there is a high correlation according to the test results obtained between the respondents who were classified into particular clusters and in relation to the answers given by the respondents about throwing away food.
On the basis of the analyses, an interaction chart was then created that shows the similarity in the opinions and behaviors of respondents between groups (in this case, clusters), representing specific attitudes of respondents in the field of food waste (Figure 4).
On the basis of the conducted analysis and the distinguished three groups of clusters, it can be seen that, in the first group, the most numerous group of people was those who declared that they do not throw food away. The second group consists of people who definitely do not waste food and people who rather do it; here, the number of responses was similar, although the responses are significantly different from each other. The third group of respondents are people whose number of responses is significantly higher than the others, and these are people who sporadically admit that they throw away food.
The personal beliefs of consumers, their attitudes, and declarations are extremely important in the analysis of the issue of food waste—as research by other authors has shown—household care for proper food management and its use in accordance with the principles of the circular economy is a predictor of its reduction [81] and can increase the desire to avoid wastage in the household [82,83]. However, there is a literature gap. Implementation of these intentions into practice has not been estimated. In food waste, there is most likely a significant gap between consumer attitudes and behavior. They can deal with a similar relationship in environmental issues [84].
Table 4 shows the significance of the relationship between the distribution of the frequency of responses in one variable with respect to the other variable, while Figure 5 shows the distribution of responses for each of the three clusters identified in the statistical analysis performed above with respect to the frequency of food throwing out by respondents.
Analyzing the obtained statistics of significance tests and Chi2 parameters, presented in Table 4, it can be concluded that there is a high correlation according to the test results obtained between the respondents who were qualified for particular focus and in relation to the answers given by the respondents about the frequency of throwing food away.
When analyzing Figure 5, it can be concluded that cluster 1 indicates that the respondents declare throwing away food only sometimes. In the case of cluster no. 1, due to outlier values, it is difficult, however, to clearly define this group of respondents.
The second cluster refers to the responses of respondents that, most often, food is thrown away by them 2–3 times a week, but there are also other responses indicating even greater consumer awareness and even less wasting of food products (occasionally and never).
Cluster no. 3 is mainly respondents who admit that the frequency of throwing food away is sporadic or that they do so no more than once a week, which, again, shows positive declarations and attitudes of consumers towards the studied phenomenon.
The obtained results apply to both women and men. This is consistent with the results of the 2019 research by Bilska and her team [45]. They concluded that there was no correlation between the frequency of product throw away and gender. Therefore, it can be assumed that both women and men—if necessary—decide to “throw away” food in their households.

4.3. Analysis of the Impact of Selected Variables Grouping “Gender” and “Place of Residence” on the Attitudes and Declarations of Respondents in the Aspect of Food Waste

In order to deepen the analyses, in accordance with the next stage of the assumed research procedure, a correspondence analysis was then carried out to check whether the selected grouping variables—gender and place of residence—affect the attitudes and declarations of the respondents. The qualitative variables that were intended for analysis were nominally scaled. Table 5 presents basic information on eigenvalue and inertia.
According to the information presented in Table 5, it can be concluded that, with one dimension, 60.78% of inertia can be explained, which means that the relative frequencies that can be reproduced from one-dimensional information can reproduce 60.78% of the total value of the chi-square statistic (and, thus, also inertia) for this divisional table; two dimensions allow the explanation of as much as 89.62%, which means that, with two dimensions, it is possible to recreate almost 90% of inertia, i.e., 90% of the total value of the chi-square statistic. It is known from the literature that, if the total inertia exceeds 75%, we can consider the two-dimensional space as a good representation of the initial data. It should be added that the connection of inertia with the value of the chi-square test shows that there is a high chance of a significant relationship between the rows and columns of the multi-way table.
Figure 6 shows the results obtained from the analysis of the correspondence between the respondents’ sex and place of residence and their declarations of not wasting food. The grouping variables used in the analysis (gender and place of residence) are often used in consumer research. Also, in terms of the socio-demographic characteristics of the respondents, they capture factors identified in previous studies as related to food waste.
Four groups of respondents can be distinguished, with a clear structure of indicators (Figure 3); the first group (A1) consists of men living in smaller cities and towns (up to 100,000 inhabitants and 100–300,000 inhabitants), who admit that that they rather waste food. The second group (A2) were women living in rural areas and large cities (over 300,000 inhabitants), who declare that they do not throw away food. The third (A3) is made up of men living in rural areas who definitely waste food, while the fourth is composed of the most average women living in medium-sized cities (from 100,000 to 300,000 inhabitants) and men from large urban agglomerations—cities with more than 300,000 inhabitants—who admitted that they sometimes suffer from food waste (A4).
The obtained results seem to be correct and may reflect regularities in the general population. Women are rather perceived in society as individuals who care more about the proper management of purchasing, preparation, and consumption of food products. This is especially true of women living in large urban agglomerations, which are better educated and are characterized by a higher level of consumer, economic, and environmental awareness. The same may be true of women living in rural areas. On the one hand, it may be due to the fact that they are equally educated and aware people, working in large cities but living on its outskirts or in the villages. On the other hand, however, it should not be forgotten that people living in rural areas often live off the natural economy, which results in their increased respect for food and care for the best use of all products, without having to throw them away—by trying to, with the circular economy concept, ensure their best possible reuse. Mattar and his team also concluded that rural households are a lesser contributor to food waste [85].
In turn, men seem to have a slightly different approach to the issue of managing the purchase and consumption of food products, without paying much attention to it. The place of their residence does not matter, as all men, to a greater or lesser extent, admit that they waste food. This may be due to, inter alia, their ignorance (whether conscious or unconscious) of the principles of proper planning of purchases, meals, food storage conditions, etc., which is consistent with the results obtained by Bravi and team [6], who showed that improper food economy in the household is positively correlated with the frequency of wasting food in the household and with research by other authors [86,87], who concluded that cooking in excessive amounts and improper storage of food also contributes to the phenomenon of throwing food away.
The situation may also result from the fact that women plan shopping and meals more often than men, drawing up shopping lists, which is also confirmed by the results of research obtained by Bilska and her team [45].
Research by Secondi et al. [88] confirmed the strong relationship between the amount of food thrown away in households and the gender of the respondents, who concluded that women seem to be more aware of food waste than men and, consequently, women’s behavior contributes less to food waste than men’s behavior. Other authors [89], Refs. [90,91] also concluded that women produce less food waste and Fonseca [80] showed that men are likely to waste more food than women. In turn, Qian et al. [4] found that women have a higher awareness and ability to detect and cope with eating problems. Also, studies conducted in Eastern Poland by Florkowski et al. [67] showed that males generate more leftovers than females, maybe because of the fact that they usually tend to eat larger amounts of food.
Gender, thus, appears to be the most basic sociodemographic variable that potentially influences the intention to reduce food waste. However, another grouping variable, the place of residence, also seems to be important. Various studies confirm that this variable may have an impact on consumer behavior in terms of food waste [45]. Secondi et al. [88], Hanssen et al. [63], and Mattar et al. [85] found that people living in small or medium-sized towns or in big cities are more likely to waste more food than people living in rural areas. Also, research carried out by Cecere et al. [89] shows that people living in urban areas generate more food waste. It is not fully correlated with the results of our own research; however, the obtained results may be determined by many different situational factors.
Other quantitative studies (based on EU data) show that there is no differentiation between urban and rural households in terms of food waste [92]. It should be emphasized that the place of residence may, however, determine attitudes. These will influence various food waste behaviors [93,94].

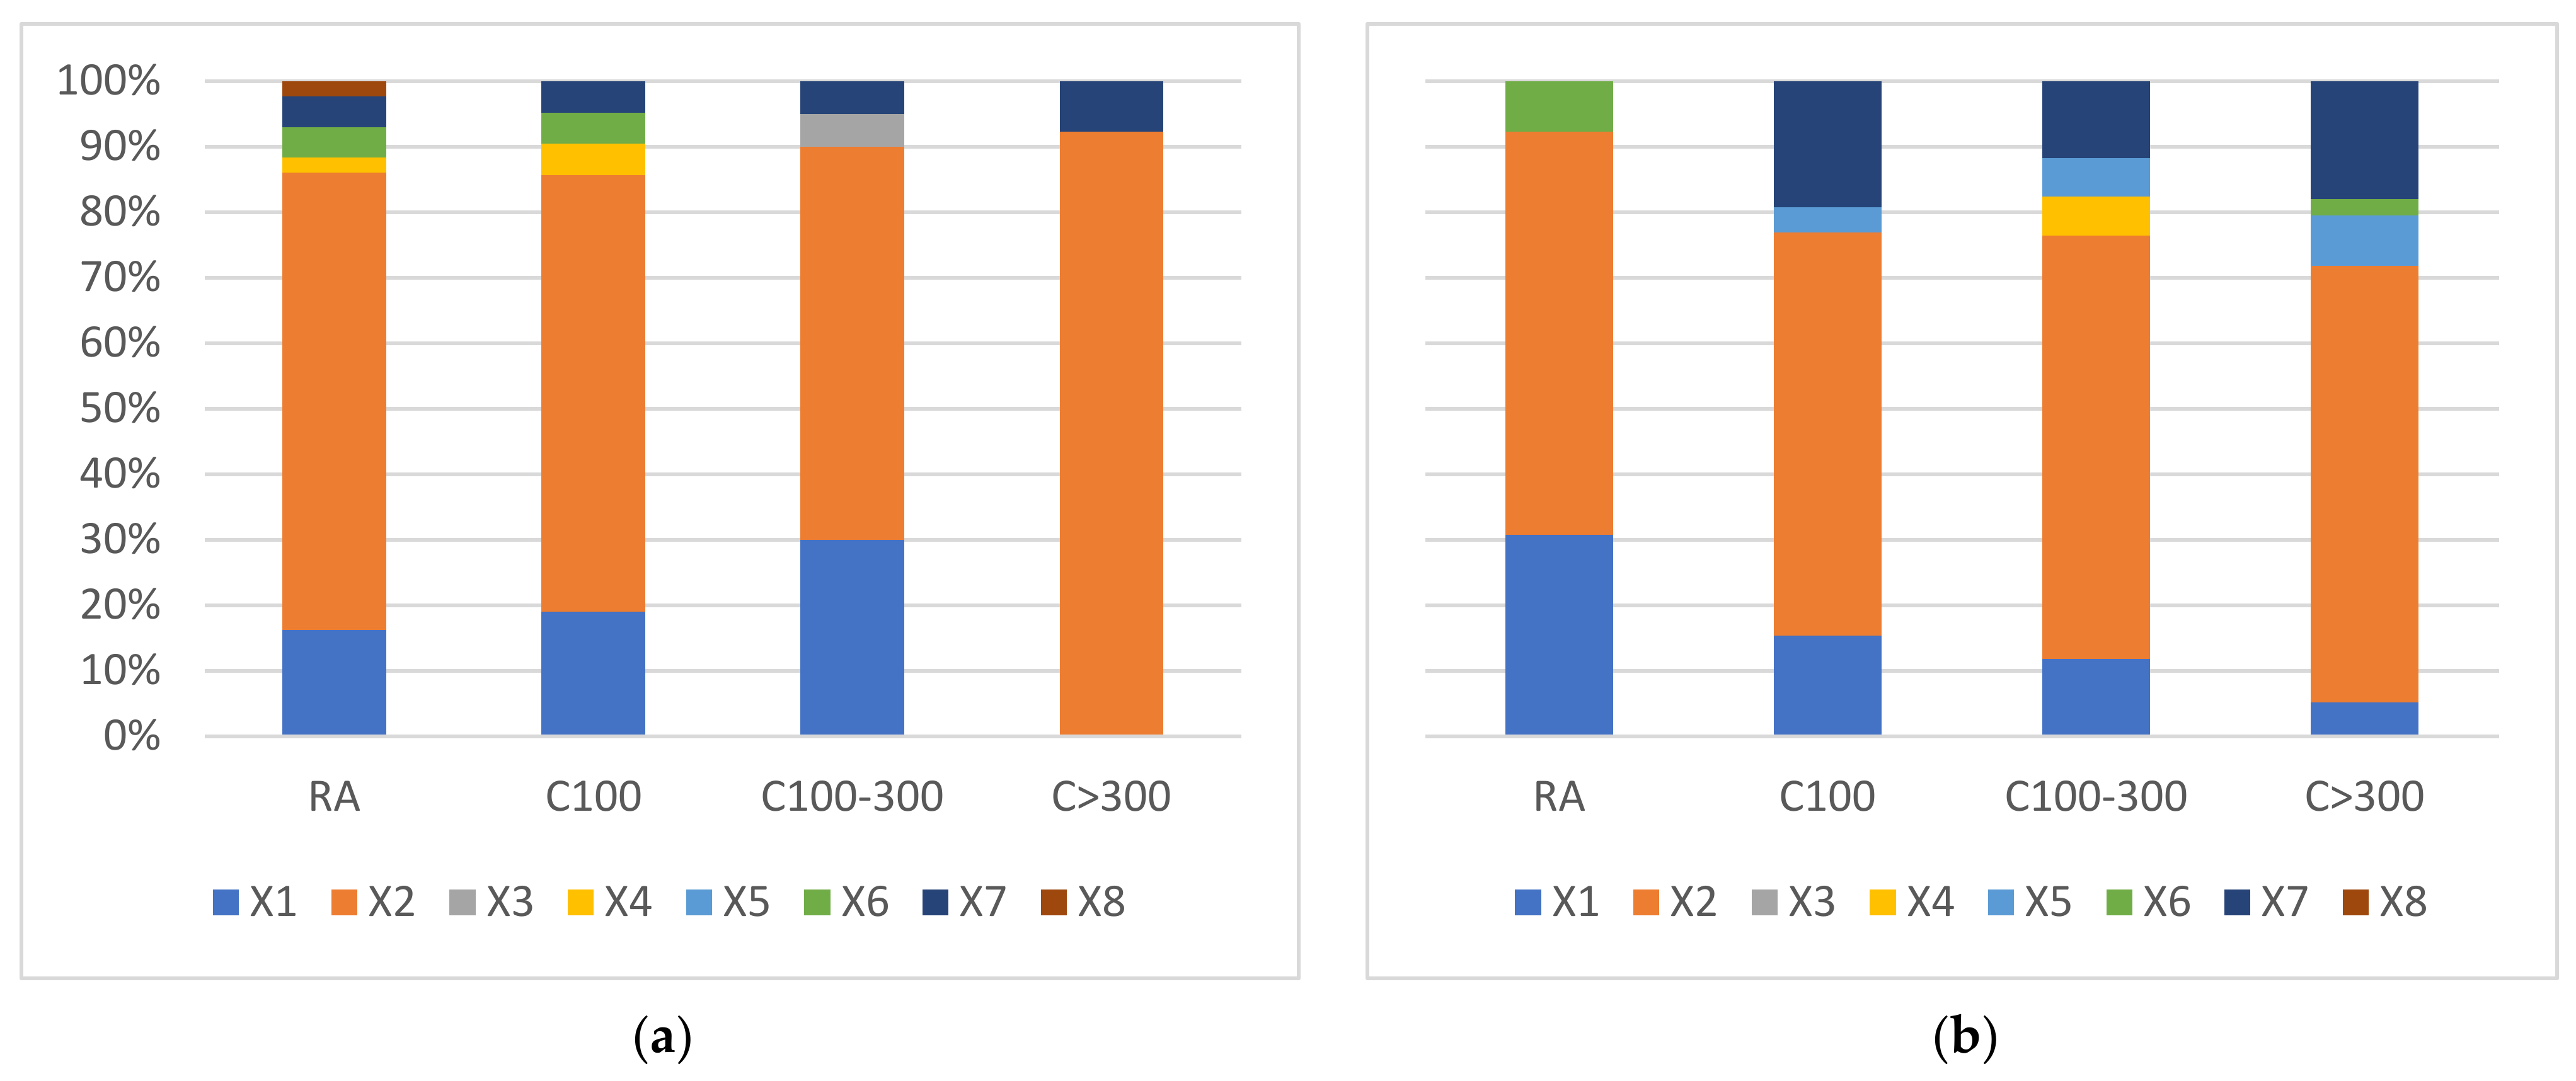
4.4. Analysis of the Causes of Food Waste in Terms of Gender and Place of Residence

In the conducted research, the causes of food wastage were also analyzed in the opinion of the respondents, first in relation to the entire research sample, and then in terms of the previously analyzed grouping variables, i.e., gender and place of residence, because, as in the research conducted by Bilska et al. [45], missing the expiry date—as one of the main causes of food waste—depends mainly on the place of residence.
The vast majority of respondents (67%) replied that the main reason for throwing food away in their households is the process of food spoilage. Another factor of such behavior is the expiry of the use-by date. Only a few responded that the immediate reason for throwing away food is too much of the food purchased.
Similar results were obtained by Richter and Bokelmann [95], who stated that the most common reasons for discarding were that the food has become moldy or spoiled, and that the best-before date has expired. According to research carried out by the Federation of Polish Food Banks, the most frequently mentioned reasons for wasting food were the lack of an expiry date on the product packaging (29%), excessive shopping (20%), too large portions of meals (15%), poor quality of food products (15%), inadequate storage of articles (13%), lack of ideas for the use of ingredients (5%), and not using a shopping list (1%) [78]. This is also confirmed by the results obtained by Bilska et al. [45]; they stated that the vast majority of respondents throw away food due to deterioration (65.2%) and exceeding the expiry date (42%).
In turn, the results of an in-depth analysis of the causes of food waste in the surveyed households are shown in Figure 7.
The analysis shows that the main reason for wasting food, in all groups, both in terms of gender and place of residence, is that the food has broken down (mold is visible and rancid smell)—X2; this trend is especially visible among women living in large cities (over 300,000 inhabitants). In addition, a common answer was that the date for consumption has passed (X1); especially in the responses of women living in medium-sized cities and men living in rural areas, this situation is clearly visible.
Similar conclusions were reached by Macková et al. [96]; according to them, the main reasons for wasting food for this type of people are the expiry of the terms “use by” or “best before”, loss of food quality, spoilage during storage, bad appearance, and bad taste; each of these facts is a reason to throw away food.
Summarizing all the analyses carried out, it can be stated that the obtained results seem to be promising; they indicate relatively positive attitudes of Polish consumers. Consumers seem to be increasingly aware of the problems associated with food waste and also see their active role in preventing them [97]. However, despite consumer concerns, food waste remains very high. It should probably be taken into account here, i.e., the fact that it may refer to the declared and not actual attitudes of the respondents. Hence, the research carried out by the authors may constitute a starting point for further, in-depth research in this area, relating, inter alia, to determinants of the phenomenon of food waste in households or indication of factors or behaviors (such as planning purchases, planning meals, managing food stocks, and knowledge of the rules of storing food products), which may allow avoiding excessive purchases caused by, e.g., promotional campaigns and, consequently, reduce the phenomenon of excessive waste of food and food products. It is also consistent with the postulations of other researchers [83,85,97,98,99].

5. Conclusions

Food waste is a complex and multidimensional issue as it does not reflect individual consumer behavior and cannot be attributed to individual variables; rather, it is the result of many overlapping factors and determinants, such as daily eating and purchasing practices, as well as the way a household plans, manages, prepares, consumes, and stores food [84,86,97,100]. It also requires a stronger integration of different disciplinary perspectives [1], as well as a broad approach to analysis taking into account several factors at the same time [6]. Various studies can be found in the literature indicating, for example, the fact that food consumption management is of key importance in reducing food waste; households with better food consumption management generate less food waste [101]. Hence, the identification of attitudes, motives, and determinants of consumer behavior in the area of food waste generation will allow a better understanding of household practices, and, consequently, will enable the development of strategies to prevent food waste [1].
Therefore, in order to present the essence of the phenomenon of food waste and the production of food waste by one of the links in the food chain, which are individual households, research, analysis, and considerations were carried out, which allowed the following conclusions to be drawn:
  • The respondents declare that food is thrown away rarely or very rarely, which may indicate positive attitudes of consumers towards the studied phenomenon. The obtained results refer to both women and men.
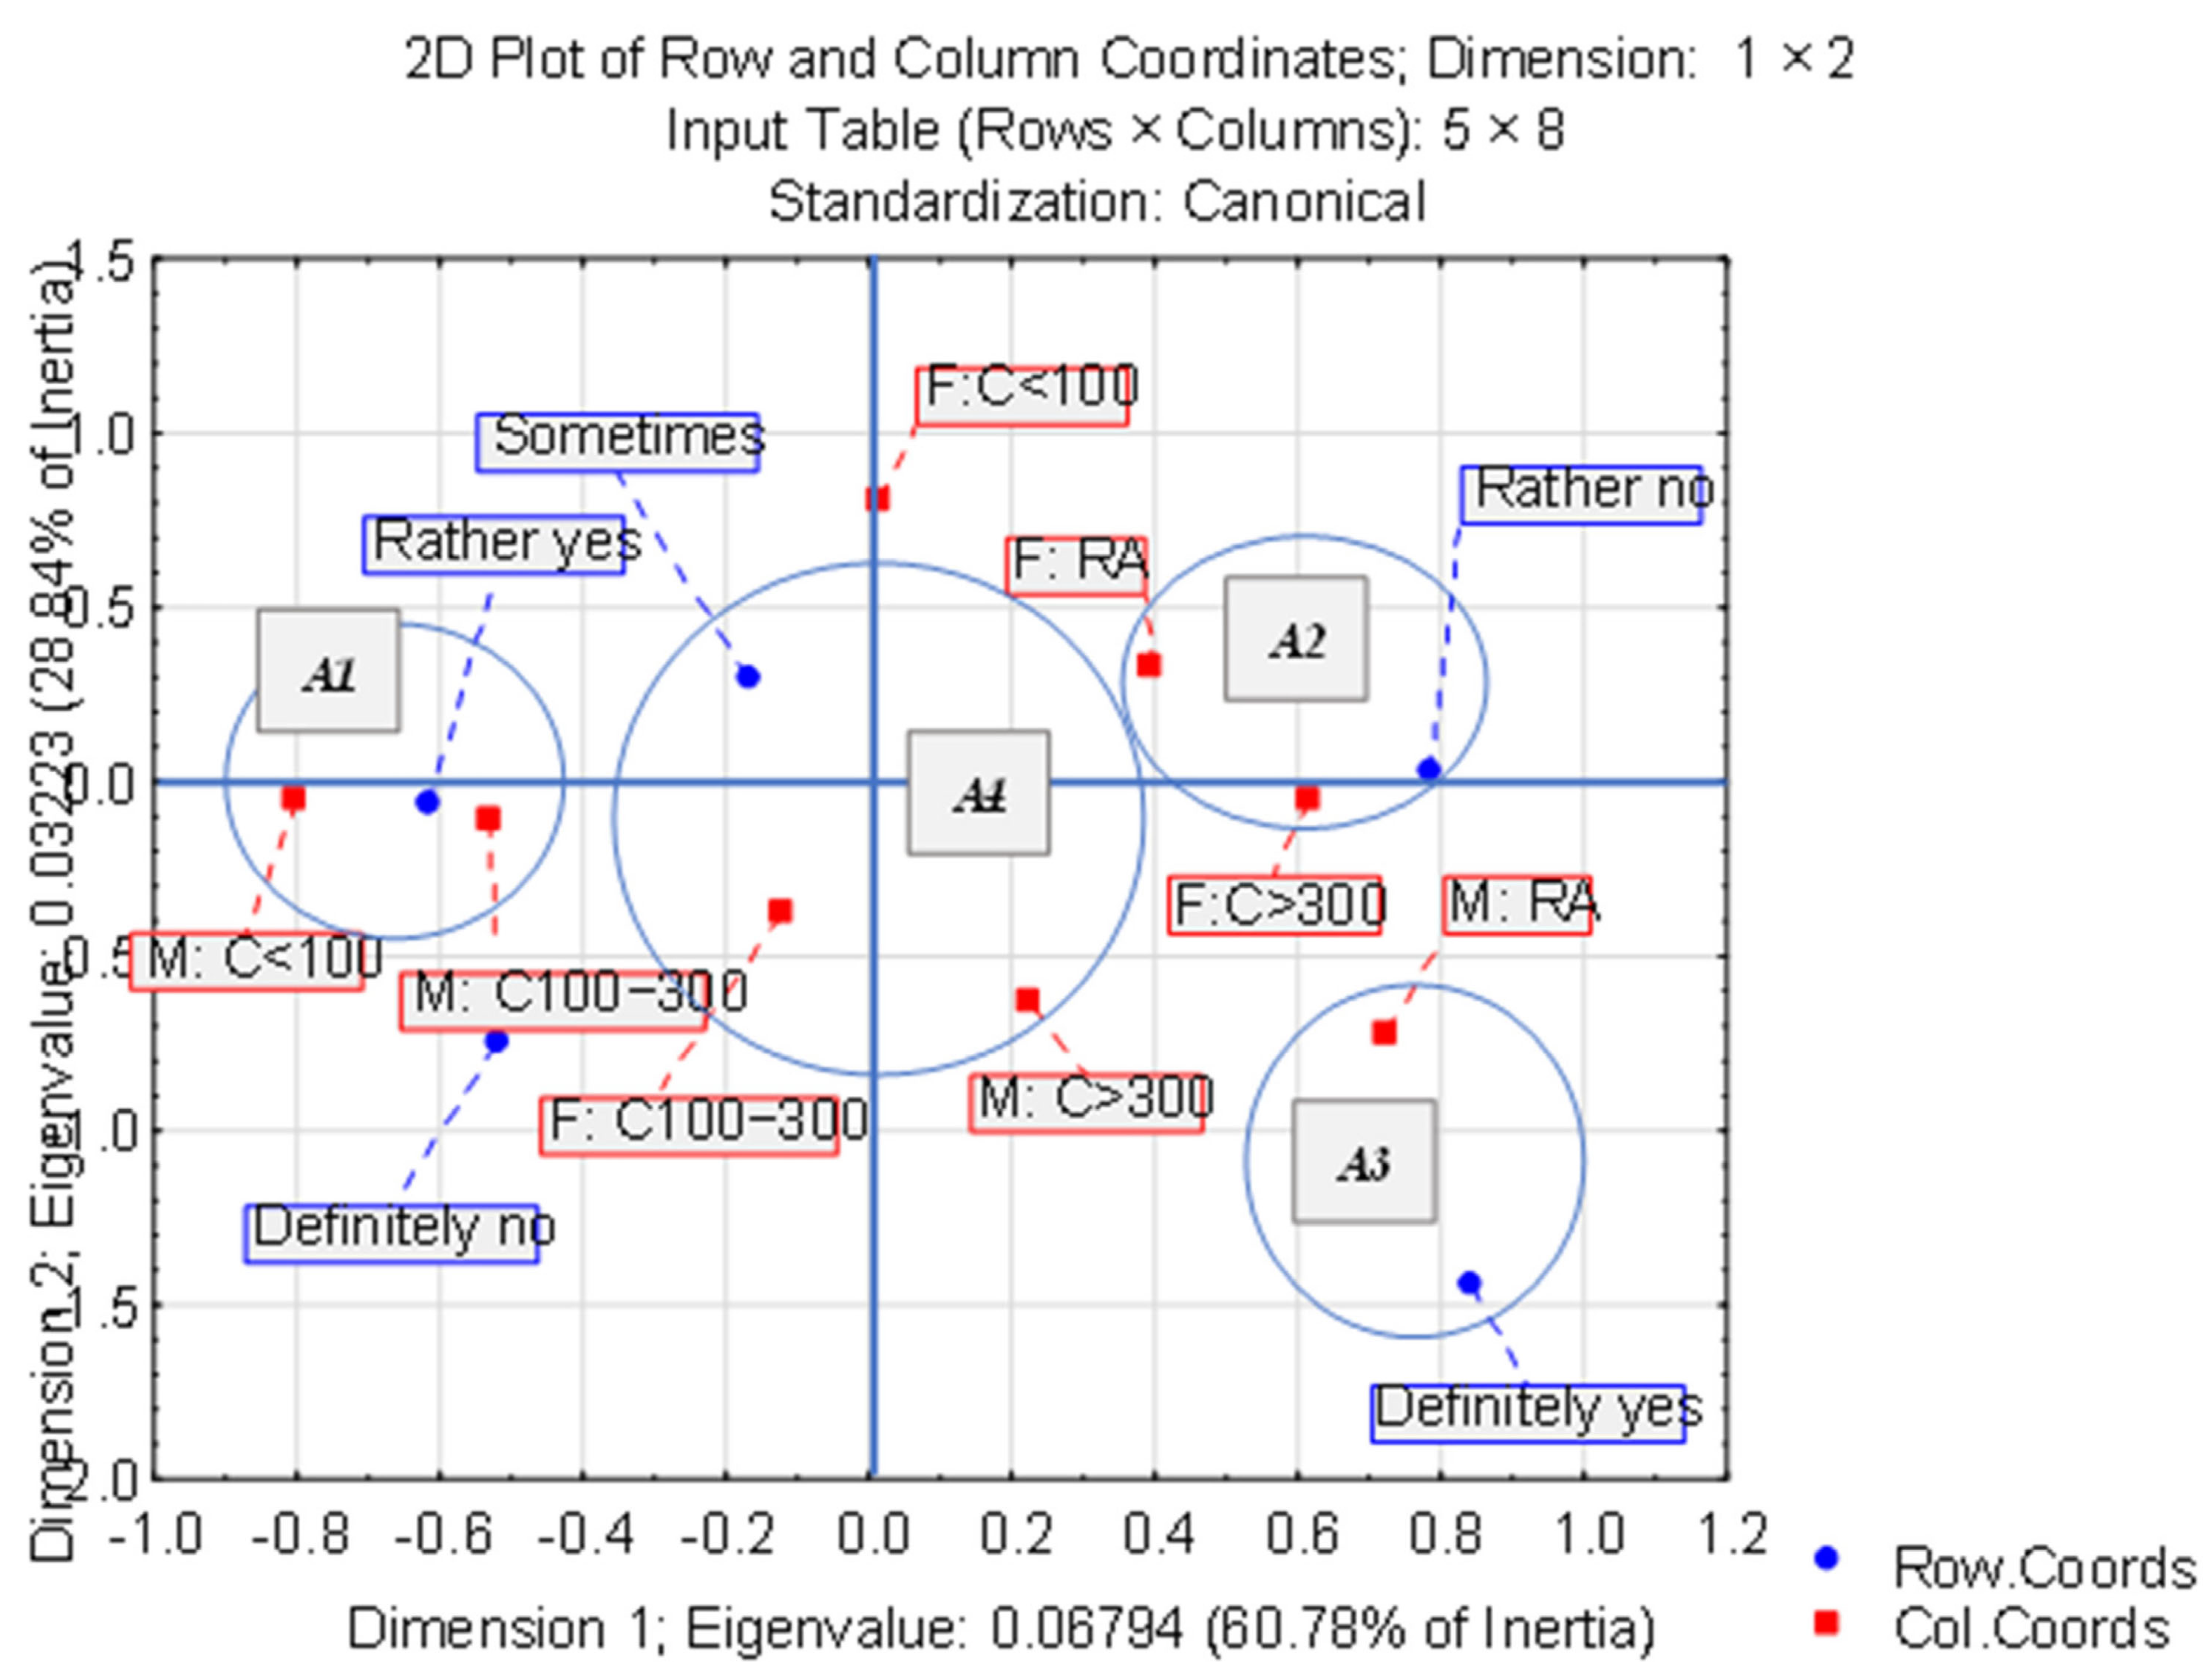
  • The analysis of the correspondence made it possible to distinguish four groups of respondents, with a clear structure of indicators: (A1)—men living in smaller cities and towns, who admit that they rather waste food; (A2)—women living in rural areas and large cities, who declare that they do not throw away food; (A3)—men living in rural areas, who definitely waste food; and (A4)—women living in medium-sized cities and men from large urban agglomerations who admitted that they sometimes suffer from food waste.
  • Gender seems to be the primary sociodemographic variable that potentially influences the intention to reduce food waste—women tend to try not to waste food and care about the proper management of purchases and the consumption of food products; men, on the other hand, more or less admit that they are wasting food.
  • Place of residence is another grouping variable that seems to be also important—it can determine attitudes and, thus, influence various behaviors related to wasting food.
  • The main reason why food is wasted among the respondents is that the food has broken (mold is visible and rancid smell), but a common reason is also the fact that the best-before date has expired; it was noticed especially by women living in smaller cities (100–300 thousand inhabitants) and men living in rural areas.
  • The obtained results indicate relatively positive attitudes and a relatively high level of awareness of Polish consumers in the aspect of food waste. Nevertheless, the level of food waste in Poland is still very high. The resulting discrepancy may result from the difference between the declared and actual attitudes and behaviors of the respondents.
Hence, further, in-depth research concerning, first of all, the identification of the factors determining the level of food waste in households seems extremely important, because proper understanding of them will, consequently, allow for the development and implementation of effective educational programs aimed at consumers, which will then allow them to increase their awareness in the area of food and food product waste.

Author Contributions

Conceptualization, A.D., M.S. and A.J.D.; methodology, A.D. and M.S.; validation, A.D., M.S. and A.J.D.; formal analysis, A.D., M.S. and A.J.D.; investigation, A.D. and M.S.; resources, A.D. and M.S.; data curation, A.J.D.; writing—original draft preparation, A.D., M.S. and A.J.D.; writing—review and editing, A.D., M.S. and A.J.D.; visualization, A.D. and A.J.D.; project administration, M.S. and A.J.D.; supervision, A.J.D. All authors have read and agreed to the published version of the manuscript.

Funding

This research received no external funding.

Institutional Review Board Statement

Not applicable.

Informed Consent Statement

Not applicable.

Data Availability Statement

Not applicable.

Conflicts of Interest

The authors declare no conflict of interest.

References

  1. Schanes, K.; Dobernig, K.; Gözet, B. Food Waste Matters-A Systematic Review of Household Food Waste Practices and Their Policy Implications. J. Clean. Prod. 2018, 182, 978–991. [Google Scholar] [CrossRef]
  2. Edjabou, M.E.; Petersen, C.; Scheutz, C.; Astrup, T.F. Food Waste from Danish Households: Generation and Composition. Waste Manag. 2016, 52, 256–268. [Google Scholar] [CrossRef] [PubMed]
  3. Roodhuyzen, D.M.; Luning, P.A.; Fogliano, V.; Steenbekkers, L.P.A. Putting Together the Puzzle of Consumer Food Waste: Towards an Integral Perspective. Trends Food Sci. Technol. 2017, 68, 37–50. [Google Scholar] [CrossRef]
  4. Qian, K.; Javadi, F.; Hiramatsu, M. Influence of the COVID-19 Pandemic on Household Food Waste Behavior in Japan. Sustainability 2020, 12, 9942. [Google Scholar] [CrossRef]
  5. Ponis, S.T.; Papanikolaou, P.-A.; Katimertzoglou, P.; Ntalla, A.C.; Xenos, K.I. Household Food Waste in Greece: A Questionnaire Survey. J. Clean. Prod. 2017, 149, 1268–1277. [Google Scholar] [CrossRef]
  6. Bravi, L.; Francioni, B.; Murmura, F.; Savelli, E. Factors Affecting Household Food Waste among Young Consumers and Actions to Prevent It. A Comparison among UK, Spain and Italy. Resour. Conserv. Recycl. 2020, 153, 104586. [Google Scholar] [CrossRef]
  7. Blomsma, F.; Tennant, M.; Ozaki, R. Making Sense of Circular Economy: Understanding the Progression from Idea to Action. Bus. Strategy Environ. 2022, 1–26. [Google Scholar] [CrossRef]
  8. Demestichas, K.; Daskalakis, E. Information and Communication Technology Solutions for the Circular Economy. Sustainability 2020, 12, 7272. [Google Scholar] [CrossRef]
  9. Barbaritano, M.; Bravi, L.; Savelli, E. Sustainability and Quality Management in the Italian Luxury Furniture Sector: A Circular Economy Perspective. Sustainability 2019, 11, 3089. [Google Scholar] [CrossRef]
  10. Schroeder, P.; Anggraeni, K.; Weber, U. The Relevance of Circular Economy Practices to the Sustainable Development Goals. J. Ind. Ecol. 2019, 23, 77–95. [Google Scholar] [CrossRef]
  11. Ingrao, C.; Arcidiacono, C.; Siracusa, V.; Niero, M.; Traverso, M. Life Cycle Sustainability Analysis of Resource Recovery from Waste Management Systems in a Circular Economy Perspective Key Findings from This Special Issue. Resources 2021, 10, 32. [Google Scholar] [CrossRef]
  12. Mourad, M. Recycling, Recovering and Preventing “Food Waste”: Competing Solutions for Food Systems Sustainability in the United States and France. J. Clean. Prod. 2016, 126, 461–477. [Google Scholar] [CrossRef]
  13. Małek, A.; Caban, J.; Wojciechowski, Ł. Charging Electric Cars as a Way to Increase the Use of Energy Produced from RES. Open Eng. 2020, 10, 98–104. [Google Scholar] [CrossRef]
  14. Kilikevičienė, K.; Matijošius, J.; Kilikevičius, A.; Jurevičius, M.; Makarskas, V.; Caban, J.; Marczuk, A. Research of the Energy Losses of Photovoltaic (Pv) Modules after Hail Simulation Using a Newly-Created Testbed. Energies 2019, 12, 4537. [Google Scholar] [CrossRef]
  15. Piasecka, I.; Bałdowska-Witos, P.; Piotrowska, K.; Tomporowski, A. Eco-Energetical Life Cycle Assessment of Materials and Components of Photovoltaic Power Plant. Energies 2020, 13, 1385. [Google Scholar] [CrossRef]
  16. Adamowicz, M. Agricultural Development Processes in the Context of Globalization Challenges and New Approaches to the Concept of Sustainable Development. Zagadnienia Ekon. Rolnej Problems Agric. Econ. 2021, 366. [Google Scholar] [CrossRef]
  17. Elisha, O.D. Moving beyond Take-Make-Dispose to Take-Make-Use for Sustainable Economy. Int. J. Sci. Res. Educ. 2020, 13, 497–516. [Google Scholar]
  18. Andrews, D. The Circular Economy, Design Thinking and Education for Sustainability. Local Econ. 2015, 30, 305–315. [Google Scholar] [CrossRef]
  19. Corona, B.; Shen, L.; Reike, D.; Carreón, J.R.; Worrell, E. Towards Sustainable Development through the Circular Economy—A Review and Critical Assessment on Current Circularity Metrics. Resour. Conserv. Recycl. 2019, 151, 104498. [Google Scholar] [CrossRef]
  20. Kirchherr, J.; Reike, D.; Hekkert, M. Conceptualizing the Circular Economy: An Analysis of 114 Definitions. Resour. Conserv. Recycl. 2017, 127, 221–232. [Google Scholar] [CrossRef]
  21. Ghisellini, P.; Cialani, C.; Ulgiati, S. A Review on Circular Economy: The Expected Transition to a Balanced Interplay of Environmental and Economic Systems. J. Clean. Prod. 2016, 114, 11–32. [Google Scholar] [CrossRef]
  22. Murray, A.; Skene, K.; Haynes, K. The Circular Economy: An Interdisciplinary Exploration of the Concept and Application in a Global Context. J. Bus. Ethics 2017, 140, 369–380. [Google Scholar] [CrossRef]
  23. OECD. OECD Farm Management Practices to Foster Green Growth; OECD: Paris, France, 2016. [Google Scholar]
  24. Programme des Nations Unies pour l’environnement. Towards a Green Economy: Pathways to Sustainable Development and Poverty Eradication; United Nations Environment Programme: Nairobi, Kenya, 2011; ISBN 92-807-3143-2. [Google Scholar]
  25. Ellen, M.; McKinsey & Company. Towards the Circular Economy: Accelerating the Scale-up across Global Supply Chains. In Proceedings of the World Economic Forum, Davos-Klosters, Switzerland, 22–25 January 2014; Volume 3, pp. 1–64. [Google Scholar]
  26. Szczygielski, T. Minerały Antropogeniczne z Energetyki a Gospodarka o Obiegu Zamkniętym. Mater. Bud. 2015, 34–36. [Google Scholar] [CrossRef]
  27. MacArthur, E. Towards the Circular Economy, Economic and Business Rationale for an Accelerated Transition; Ellen MacArthur Foundation: Cowes, UK, 2013; Volume 2013, pp. 21–34. [Google Scholar]
  28. Lieder, M.; Rashid, A. Towards Circular Economy Implementation: A Comprehensive Review in Context of Manufacturing Industry. J. Clean. Prod. 2016, 115, 36–51. [Google Scholar] [CrossRef]
  29. MacArthur, E. Towards the Circular Economy: Opportunities for the Consumer Goods Sector; Ellen MacArthur Foundation: Cowes, UK, 2013. [Google Scholar]
  30. Liu, J.Y.-S. Circular Economy and Environmental Efficiency–the Case of Traditional Hakka Living System. Procedia Soc. Behav. Sci. 2012, 57, 255–260. [Google Scholar] [CrossRef]
  31. Xuan, L.; Baotong, D.; Hua, Y. The Research Based on the 3-R Principle of Agro-Circular Economy Model-the Erhai Lake Basin as an Example. Energy Procedia 2011, 5, 1399–1404. [Google Scholar] [CrossRef]
  32. Elliot, S. Transdisciplinary Perspectives on Environmental Sustainability: A Resource Base and Framework for IT-Enabled Business Transformation. Mis Q. 2011, 197–236. [Google Scholar] [CrossRef]
  33. Su, B.; Heshmati, A.; Geng, Y.; Yu, X. A Review of the Circular Economy in China: Moving from Rhetoric to Implementation. J. Clean. Prod. 2013, 42, 215–227. [Google Scholar] [CrossRef]
  34. Gray, R.; Kouhy, R.; Lavers, S. Corporate Social and Environmental Reporting: A Review of the Literature and a Longitudinal Study of UK Disclosure. Account. Audit. Account. J. 1995, 8, 47–77. [Google Scholar] [CrossRef]
  35. Winans, K.; Kendall, A.; Deng, H. The History and Current Applications of the Circular Economy Concept. Renew. Sustain. Energy Rev. 2017, 68, 825–833. [Google Scholar] [CrossRef]
  36. Potting, J.; Hekkert, M.; Worrell, E.; Hanemaaijer, A. Circular Economy: Measuring Innovation in the Product Chain; PBL Publishers: Gloucester, UK, 2017. [Google Scholar]
  37. Potting, J.; Hekkert, M.; Worrell, E.; Hanemaaijer, A. Circulaire Economie: Innovatie Meten in de Keten; Planbureau Voor De Leefomgeving: Den Haag, The Netherlands, 2016. [Google Scholar]
  38. Graedel, T.E.; Allwood, J.; Birat, J.; Buchert, M.; Hagelüken, C.; Reck, B.K.; Sibley, S.F.; Sonnemann, G. What Do We Know about Metal Recycling Rates? J. Ind. Ecol. 2011, 15, 355–366. [Google Scholar] [CrossRef]
  39. Ardente, F.; Mathieux, F. Identification and Assessment of Product’s Measures to Improve Resource Efficiency: The Case-Study of an Energy Using Product. J. Clean. Prod. 2014, 83, 126–141. [Google Scholar] [CrossRef]
  40. Huysman, S.; Debaveye, S.; Schaubroeck, T.; De Meester, S.; Ardente, F.; Mathieux, F.; Dewulf, J. The Recyclability Benefit Rate of Closed-Loop and Open-Loop Systems: A Case Study on Plastic Recycling in Flanders. Resour. Conserv. Recycl. 2015, 101, 53–60. [Google Scholar] [CrossRef]
  41. Moraga, G.; Huysveld, S.; Mathieux, F.; Blengini, G.A.; Alaerts, L.; Van Acker, K.; De Meester, S.; Dewulf, J. Circular Economy Indicators: What Do They Measure? Resour. Conserv. Recycl. 2019, 146, 452–461. [Google Scholar] [CrossRef] [PubMed]
  42. Hajdas, M. Innowacje Marketingowe a Problem Marnowania Żywności. Handel Wewnętrzny 2018, 178–188. [Google Scholar]
  43. Mirabella, N.; Castellani, V.; Sala, S. Current Options for the Valorization of Food Manufacturing Waste: A Review. J. Clean. Prod. 2014, 65, 28–41. [Google Scholar] [CrossRef]
  44. Muriana, C. A Focus on the State of the Art of Food Waste/Losses Issue and Suggestions for Future Researches. Waste Manag. 2017, 68, 557–570. [Google Scholar] [CrossRef]
  45. Bilska, B.; Tomaszewska, M.; Kołożyn-Krajewska, D. Analysis of the Behaviors of Polish Consumers in Relation to Food Waste. Sustainability 2019, 12, 304. [Google Scholar] [CrossRef]
  46. Aschemann-Witzel, J. Waste Not, Want Not, Emit Less. Science 2016, 352, 408–409. [Google Scholar] [CrossRef]
  47. Ilakovac, B.; Voca, N.; Pezo, L.; Cerjak, M. Quantification and Determination of Household Food Waste and Its Relation to Sociodemographic Characteristics in Croatia. Waste Manag. 2020, 102, 231–240. [Google Scholar] [CrossRef]
  48. Project Entitled “Development of a Food Waste Monitoring System and an Effective Program of Rationalizing Food Losses and Reducing Food Waste” (PROM in Short). Available online: Https://www.Projektprom.Pl/ (accessed on 27 June 2022).
  49. Parfitt, J.; Barthel, M.; Macnaughton, S. Food Waste within Food Supply Chains: Quantification and Potential for Change to 2050. Philos. Trans. R. Soc. B Biol. Sci. 2010, 365, 3065–3081. [Google Scholar] [CrossRef] [PubMed]
  50. Bednarczuk, A.; Śleszyński, J. Marnotrawstwo Żywności w Polsce. Probl. World Agric. Rol. Świat. 2019, 19, 19–30. [Google Scholar] [CrossRef]
  51. Lymbery, P.; Oakeshott, I. Farmagedon: Rzeczywisty Koszt Taniego Mięsa; Wydawnictwo Kobiece: Białystok, Poland, 2020; ISBN 83-66654-32-X. [Google Scholar]
  52. Marszałek, A. Czy Możliwe Jest Przezwyciężenie Problemu Marnotrawstwa Żywności? Nierówności Społeczne Wzrost Gospod. 2018, 474–485. [Google Scholar] [CrossRef]
  53. Michalczyk, J.; Michalczyk, W. Problem Marnotrawstwa i Strat Wobec Zachowania Bezpieczeństwa Żywnościowego w Ujęciu Międzynarodowym. Pr. Nauk. Uniw. Ekon. We Wrocławiu 2019, 63, 50–69. [Google Scholar] [CrossRef]
  54. Wansink, B. Household Food Waste Solutions for Behavioral Economists and Marketers. J. Food Prod. Mark. 2018, 24, 500–521. [Google Scholar] [CrossRef]
  55. Głowacki, J.; Kopyciński, P.; Malinowski, M. Identyfikacja i Delimitacja Obszarów Gospodarki w Obiegu Zamkniętym W Ramach „Zrównoważonej Konsumpcji”. 2019. Available online: https://www.researchgate.net/profile/Mateusz-Malinowski-6/publication/338459652_Identyfikacja_i_delimitacja_obszarow_gospodarki_o_obiegu_zamknietym_w_ramach_zrownowazonej_konsumpcji/links/5e1662ea92851c8364bd3645/Identyfikacja-i-delimitacja-obszarow-gospodarki-o-obiegu-zamknietym-w-ramach-zrownowazonej-konsumpcji.pdf (accessed on 27 June 2022).
  56. Vilariño, M.V.; Franco, C.; Quarrington, C. Food Loss and Waste Reduction as an Integral Part of a Circular Economy. Front. Environ. Sci. 2017, 5, 21. [Google Scholar] [CrossRef]
  57. Xue, L.; Liu, G.; Parfitt, J.; Liu, X.; Van Herpen, E.; Stenmarck, Å.; O’Connor, C.; Östergren, K.; Cheng, S. Missing Food, Missing Data? A Critical Review of Global Food Losses and Food Waste Data. Environ. Sci. Technol. 2017, 51, 6618–6633. [Google Scholar] [CrossRef]
  58. Scherhaufer, S.; Moates, G.; Hartikainen, H.; Waldron, K.; Obersteiner, G. Environmental Impacts of Food Waste in Europe. Waste Manag. 2018, 77, 98–113. [Google Scholar] [CrossRef]
  59. Canali, M.; Amani, P.; Aramyan, L.; Gheoldus, M.; Moates, G.; Östergren, K.; Silvennoinen, K.; Waldron, K.; Vittuari, M. Food Waste Drivers in Europe, from Identification to Possible Interventions. Sustainability 2016, 9, 37. [Google Scholar] [CrossRef]
  60. Davies, M.B.; Hughes, N. Doing a Successful Research Project: Using Qualitative or Quantitative Methods; Bloomsbury Publishing: London, UK, 2014. [Google Scholar]
  61. Merriam, S.B.; Tisdell, E.J. Qualitative Research: A Guide to Design and Implementation; John Wiley & Sons: Hoboken, NJ, USA, 2015. [Google Scholar]
  62. Li, T.; Zhou, D.; Razzaq, A.; Wang, Q. Rethinking the Role of Grain Banks in China’s Agriculture. Agriculture 2021, 11, 49. [Google Scholar] [CrossRef]
  63. Hanssen, O.J.; Syversen, F.; Stø, E. Edible Food Waste from Norwegian Households—Detailed Food Waste Composition Analysis among Households in Two Different Regions in Norway. Resour. Conserv. Recycl. 2016, 109, 146–154. [Google Scholar] [CrossRef]
  64. Garcia-Garcia, G.; Woolley, E.; Rahimifard, S. A Framework for a More Efficient Approach to Food Waste Management. Int. J. Food Eng. 2015, 1, 65–72. [Google Scholar] [CrossRef]
  65. Bräutigam, K.-R.; Jörissen, J.; Priefer, C. The Extent of Food Waste Generation across EU-27: Different Calculation Methods and the Reliability of Their Results. Waste Manag. Res. 2014, 32, 683–694. [Google Scholar] [CrossRef] [PubMed]
  66. Jörissen, J.; Priefer, C.; Bräutigam, K.-R. Food Waste Generation at Household Level: Results of a Survey among Employees of Two European Research Centers in Italy and Germany. Sustainability 2015, 7, 2695–2715. [Google Scholar] [CrossRef]
  67. Florkowski, W.J.; Us, A.; Klepacka, A.M. Food Waste in Rural Households Support for Local Biogas Production in Lubelskie Voivodship (Poland). Resour. Conserv. Recycl. 2018, 136, 46–52. [Google Scholar] [CrossRef]
  68. Rosner, A.; Stanny, M. Monitoring Rozwoju Obszarów Wiejskich. Etap I. Przestrzenne Zróżnicowanie Rozwoju Spo\leczno-Gospodarczego Obszarów Wiejskich w 2010 Roku 2014. Available online: https://www.irwirpan.waw.pl/dir_upload/site/files/Lukasz/MROW_2014_cz._I.pdf (accessed on 27 June 2022).
  69. Patton, M.Q. Qualitative Evaluation and Research Methods; SAGE Publications, Inc.: Thousand Oaks, CA, USA, 1990. [Google Scholar]
  70. Ponelis, S.R. Using Interpretive Qualitative Case Studies for Exploratory Research in Doctoral Studies: A Case of Information Systems Research in Small and Medium Enterprises. Int. J. Dr. Stud. 2015, 10, 535. [Google Scholar] [CrossRef]
  71. Creswell, J.W.; Creswell, J.D. Research Design: Qualitative, Quantitative, and Mixed Methods Approaches; Sage Publications: Thousand Oaks, CA, USA, 2017. [Google Scholar]
  72. Gatnar, E.; Walesiak, M. Metody Statystycznej Analizy Wielowymiarowej w Badaniach Marketingowych; Wydawnictwo Akademii Ekonomicznej, Im. Oskara Langego: Wroclaw, Poland, 2004. [Google Scholar]
  73. Aggarwal, C.C.; Reddy, C.K. Data Clustering. Algorithms and Applications; Chapman & Hall/CRC Data Mining and Knowledge Discovery Series; Routledge: Oxfordshire, UK, 2014. [Google Scholar]
  74. Landau, S.; Leese, M.; Stahl, D.; Everitt, B.S. Cluster Analysis; John Wiley & Sons: Hoboken, NJ, USA, 2011. [Google Scholar]
  75. Andersen, E.B. The Statistical Analysis of Categorical Data; Springer Science & Business Media: Berlin/Heidelberg, Germany, 2012; ISBN 3-642-97225-X. [Google Scholar]
  76. Andersen, E.B. Introduction to the Statistical Analysis of Categorical Data; Springer Science & Business Media: Berlin/Heidelberg, Germany, 1997; ISBN 3-540-62399-X. [Google Scholar]
  77. Greenacre, M.; Blasius, J. Multiple Correspondence Analysis and Related Methods; Chapman and Hall/CRC: Boca Raton, FL, USA, 2006; ISBN 0-429-14196-3. [Google Scholar]
  78. Jungowska, J.; Kulczyński, B.; Sidor, A.; Gramza-Micha\lowska, A. Assessment of Factors Affecting the Amount of Food Waste in Households Run by Polish Women Aware of Well-Being. Sustainability 2021, 13, 976. [Google Scholar] [CrossRef]
  79. Fanelli, R.M. Using Causal Maps to Analyse the Major Root Causes of Household Food Waste: Results of a Survey among People from Central and Southern Italy. Sustainability 2019, 11, 1183. [Google Scholar] [CrossRef]
  80. Ward, J.H., Jr. Hierarchical Grouping to Optimize an Objective Function. J. Am. Stat. Assoc. 1963, 58, 236–244. [Google Scholar] [CrossRef]
  81. Principato, L.; Secondi, L.; Pratesi, C.A. Reducing Food Waste: An Investigation on the Behaviour of Italian Youths. Br. Food J. 2015, 117, 731–748. [Google Scholar] [CrossRef]
  82. Visschers, V.H.; Wickli, N.; Siegrist, M. Sorting out Food Waste Behaviour: A Survey on the Motivators and Barriers of Self-Reported Amounts of Food Waste in Households. J. Environ. Psychol. 2016, 45, 66–78. [Google Scholar] [CrossRef]
  83. Stancu, V.; Haugaard, P.; Lähteenmäki, L. Determinants of Consumer Food Waste Behaviour: Two Routes to Food Waste. Appetite 2016, 96, 7–17. [Google Scholar] [CrossRef]
  84. Vargas-Lopez, A.; Cicatiello, C.; Principato, L.; Secondi, L. Consumer Expenditure, Elasticity and Value of Food Waste: A Quadratic Almost Ideal Demand System for Evaluating Changes in Mexico during COVID-19. Socioecon. Plann. Sci. 2021, 82, 101065. [Google Scholar] [CrossRef]
  85. Mattar, L.; Abiad, M.G.; Chalak, A.; Diab, M.; Hassan, H. Attitudes and Behaviors Shaping Household Food Waste Generation: Lessons from Lebanon. J. Clean. Prod. 2018, 198, 1219–1223. [Google Scholar] [CrossRef]
  86. Quested, T.E.; Marsh, E.; Stunell, D.; Parry, A.D. Spaghetti Soup: The Complex World of Food Waste Behaviours. Resour. Conserv. Recycl. 2013, 79, 43–51. [Google Scholar] [CrossRef]
  87. Farr-Wharton, G.; Foth, M.; Choi, J.H.-J. Identifying Factors That Promote Consumer Behaviours Causing Expired Domestic Food Waste. J. Consum. Behav. 2014, 13, 393–402. [Google Scholar] [CrossRef]
  88. Secondi, L.; Principato, L.; Laureti, T. Household Food Waste Behaviour in EU-27 Countries: A Multilevel Analysis. Food Policy 2015, 56, 25–40. [Google Scholar] [CrossRef]
  89. Cecere, G.; Mancinelli, S.; Mazzanti, M. Waste Prevention and Social Preferences: The Role of Intrinsic and Extrinsic Motivations. Ecol. Econ. 2014, 107, 163–176. [Google Scholar] [CrossRef]
  90. Jribi, S.; Ben Ismail, H.; Doggui, D.; Debbabi, H. COVID-19 Virus Outbreak Lockdown: What Impacts on Household Food Wastage? Environ. Dev. Sustain. 2020, 22, 3939–3955. [Google Scholar] [CrossRef]
  91. Grasso, A.C.; Olthof, M.R.; Boevé, A.J.; van Dooren, C.; Lähteenmäki, L.; Brouwer, I.A. Socio-Demographic Predictors of Food Waste Behavior in Denmark and Spain. Sustainability 2019, 11, 3244. [Google Scholar] [CrossRef]
  92. Grainger, M.J.; Aramyan, L.; Logatcheva, K.; Piras, S.; Righi, S.; Setti, M.; Vittuari, M.; Stewart, G.B. The Use of Systems Models to Identify Food Waste Drivers. Glob. Food Secur. 2018, 16, 1–8. [Google Scholar] [CrossRef]
  93. Marcysiak, T.; Prus, P. Life Strategies of Rural Inhabitants of Unfixed Economic Function. In Proceedings of the Proceedings of the 26th International Scientific Conference Agrarian Perspectives XXVI “Competitiveness of European Agriculture and Food Sectors, Prague, Czech Republic, 13–15 September 2017; pp. 212–218. [Google Scholar]
  94. Marek-Andrzejewska, E.M.; Wielicka-Regulska, A. Targeting Youths’ Intentions to Avoid Food Waste: Segmenting for Better Policymaking. Agriculture 2021, 11, 284. [Google Scholar] [CrossRef]
  95. Richter, B.; Bokelmann, W. Explorative Study about the Analysis of Storing, Purchasing and Wasting Food by Using Household Diaries. Resour. Conserv. Recycl. 2017, 125, 181–187. [Google Scholar] [CrossRef]
  96. Macková, M.; Hazuchová, N.; Stávková, J. Czech Consumers’ Attitudes to Food Waste. Agric. Econ. 2019, 65, 314–321. [Google Scholar] [CrossRef]
  97. Romani, S.; Grappi, S.; Bagozzi, R.P.; Barone, A.M. Domestic Food Practices: A Study of Food Management Behaviors and the Role of Food Preparation Planning in Reducing Waste. Appetite 2018, 121, 215–227. [Google Scholar] [CrossRef]
  98. Stefan, V.; van Herpen, E.; Tudoran, A.A.; Lähteenmäki, L. Avoiding Food Waste by Romanian Consumers: The Importance of Planning and Shopping Routines. Food Qual. Prefer. 2013, 28, 375–381. [Google Scholar] [CrossRef]
  99. Davenport, M.L.; Qi, D.; Roe, B.E. Food-Related Routines, Product Characteristics, and Household Food Waste in the United States: A Refrigerator-Based Pilot Study. Resour. Conserv. Recycl. 2019, 150, 104440. [Google Scholar] [CrossRef]
  100. Porpino, G.; Parente, J.; Wansink, B. Food Waste Paradox: Antecedents of Food Disposal in Low Income Households. Int. J. Consum. Stud. 2015, 39, 619–629. [Google Scholar] [CrossRef]
  101. Fami, H.S.; Aramyan, L.H.; Sijtsema, S.J.; Alambaigi, A. Determinants of Household Food Waste Behavior in Tehran City: A Structural Model. Resour. Conserv. Recycl. 2019, 143, 154–166. [Google Scholar] [CrossRef]
Figure 3. Dendrogram of hierarchical cluster analysis using the Ward’s method.
Sustainability 14 10116 g003
Figure 4. Food throwing event interaction graph in relation to cluster membership.
Sustainability 14 10116 g004
Figure 5. Box plot belonging to clusters in the context of the frequency of throwing food away by consumers.
Sustainability 14 10116 g005
Figure 6. Correspondence analysis results between three groups of characteristics—gender, places of living, and food waste declaration. Where: F—female; M—male, RA—rural area, C < 100—city to 100.000 residents, C 100–300—100.000–300.000 residents, C > 300—city with more than 300.000 residents.
Sustainability 14 10116 g006
Figure 7. Reasons for food wastage in the opinion of respondents due to gender and place of residence: (a) female; (b) male, where: RA—rural area, C < 100—city to 100.000 residents, C 100–300—100.000–300.000 residents, C > 300—city with more than 300.000 residents, and variables: X1—the use-by date has passed, X2—the product has broken down (mold visible and rancid smell), X3—I do not like it, X4—the use-by date is approaching, X5—products are on the date “but they don’t look nice”, X6—too much has been bought, X7—I do not throw out, X8—I feed domestic animals.
Sustainability 14 10116 g007
Table 1. Circularity strategies within the production chain, in order of priority.
Circular
Economy
Sustainability 14 10116 i001
Linear
Economy
Smarter product use and
manufacture
Increasing Circularity
R0RefuseMake product redundant by abandoning its function or by offering the same function with a radically different product
R1RethinkMake product use more intensive (e.g., by sharing product)
R2ReduceIncrease efficiency in product manufacture or use by consuming fewer natural resources and materials
Extend lifespan of product and its partsR3ReuseReuse by another consumer of discarded product which is still in good condition and fulfils its original function
R4RepairRepair and maintenance of defective product so it can be used with its original function
R5RefurbishRestore an old product and bring it up to date
R6RemanufactureUse parts of discarded product in a new product with the same function
R7RepurposeUse discarded product or its parts in a new product with a different function
Useful application of materialsR8RecycleProcess materials to obtain the same (high grade) or lower (low grade) quality
R9RecoverIncineration of material with energy recovery
Resource: [36].
Table 2. Food consumer research in Eastern Poland—basic characteristics.
DescriptionCharacteristic
Research objectives
-
collecting research material enabling the segmentation of food consumers due to certain determinants determining their behavior in the use of food
-
identification of food consumers’ attitudes towards the market situation and presentation of the translation of these attitudes into market habits
Research objectindividual food consumers
Type of researchqualitative research
Research method and techniqueonline survey
Research toolsproprietary survey questionnaire posted on the Google platform
Selection of units for researchnonrandom, targeted
Sample selection criteriaindividual food consumers, a group differentiated by sex, age, and place of residence
Sample size384 people
Spatial scopeEastern Poland
Time rangeJanuary–June 2021
Table 3. Statistics belonging to clusters in the context of food being thrown out by consumers.
Statisticsχ2dfp
Chi2 Pearson768.0000df = 8p = 0.0000
Chi2 NW803.1489df = 8p = 0.0000
Table 4. Statistics belonging to clusters in the context of the frequency of throwing food away by consumers.
Statisticsχ2dfp
Chi2 Pearson148.5032df = 8p = 0.0000
Chi2 NW172.5425df = 8p = 0.0000
Table 5. Information resources factors.
Number
of Dimensions
Eigenvalues and Inertia, Total Inertia = 0.11177, χ2 = 4435.0, df = 28, p = 0.00000
Singular ValueEigenvaluesPercentage of InertiaCumulative Percentageχ2
10.2606440.06793560.7795360.77952695.542
20.1795310.03223228.8364589.61601278.882
30.1048320.0109909.8321099.4481436.049
40.0248380.0006170.55192100.000024.477
Publisher’s Note: MDPI stays neutral with regard to jurisdictional claims in published maps and institutional affiliations.

