Article

Diurnal Impact of Below-Cloud Evaporation on Isotope Compositions of Precipitation on the Southern Slope of the Altai Mountains, Central Asia

1
College of Geography and Environmental Science, Northwest Normal University, Lanzhou 730070, China
2
Key Laboratory of Resource Environment and Sustainable Development of Oasis of Gansu Province, Lanzhou 730070, China
3
School of History Culture and Tourism, Longnan Teachers College, Longnan 742500, China
4
School of Geography and Environment, Jiangxi Normal University, Nanchang 330022, China
*
Author to whom correspondence should be addressed.
Sustainability 2022, 14(16), 10013; https://doi.org/10.3390/su141610013
Submission received: 27 July 2022 / Revised: 9 August 2022 / Accepted: 11 August 2022 / Published: 12 August 2022
(This article belongs to the Section Air, Climate Change and Sustainability)

Abstract

:
Precipitation is an important natural resource relating to regional sustainability in arid central Asia, and the stable oxygen and hydrogen isotopes provide useful tracers to understand precipitation processes. In this study, we collected the hourly meteorological data at several stations on the southern slope of the Altai Mountains in arid central Asia, from March 2017 to June 2022, and examined the diurnal impact of below-cloud evaporation on stable isotope compositions of precipitation. During nighttime, the changes in isotope compositions below cloud base are generally weak. The enhanced impact of below-cloud evaporation can be found after around 15:00, and the impact is relatively strong in the afternoon, especially from 18:00 to 22:00. Summer and spring usually have a larger impact of below-cloud evaporation than autumn, and the winter precipitation is generally not influenced by below-cloud evaporation. On an annual basis, the differences in evaporation-led isotope changes between daytime and nighttime are 1.1‰ for stable oxygen isotope compositions, 4.0‰ for stable hydrogen isotope compositions and 4.7‰ for deuterium excess. The period from 2:00 to 10:00 shows relatively low sensitivity to relative humidity, and from 14:00 to 22:00 the impacts are sensitive. Considering the fluctuations of precipitation isotope compositions, the impact of below-cloud evaporation does not greatly modify the seasonal environmental signals.

1. Introduction

The stable oxygen and hydrogen isotopes are widely used as physical tracers in the hydrosphere [1,2,3]. The isotope compositions in rain and snow are usually sensitive to the regional and/or local environments, which can be applied to interpret environmental information on various spatial and temporal scales [4,5,6]. At the initial stage of precipitation isotope studies in the mid-20th century, the rainfall and snowfall were usually collected on a monthly basis, and the monthly variations of isotopes provide a reference to understand the meteorological and geographical effects controlling stable isotopes [7,8]. As a number of sampling networks were established, most recent studies analyzed the precipitation isotopes on a daily or event-based scale [9,10,11]. In addition, more frequent sampling on an hourly or sub-hourly scale has also aroused increasing attention, which provides an effective perspective to examine the atmospheric processes at a higher temporal resolution [12,13].
Some studies focused on the difference in precipitation isotopes during daytime and nighttime, and the below-cloud evaporation is considered one of the main factors causing the diurnal difference [14,15]. The falling raindrops under cloud base usually experience evaporation to some degree, which may increase the isotope ratio (usually expressed as a delta notation) of oxygen and hydrogen in the remaining raindrops [16,17,18]. A hot and/or arid background generally corresponds to a strong impact of below-cloud evaporation on raindrop isotope compositions [19,20,21,22]. Usually, air temperature and humidity on the Earth’s surface present a diurnal cycle of 24 h. The maximum air temperature occurs after local noon, and the minimum occurs before sunrise; however, the relative humidity is the reverse of air temperature. In a warming climate, the diurnal ranges of temperature and humidity show a changing pattern [23,24]. From the perspective of stable water isotopes, the impact of below-cloud evaporation may also show a diurnal cycle, and the rainwater samples collected in the morning and afternoon logically undergo different modifications due to evaporation.
Some researchers quantitatively estimated the impact of below-cloud evaporation on precipitation isotopes using a modified Stewart model [18,19,20,21,22]. These assessments were mostly conducted on a daily or event-based scale and revealed the intra-annual cycle of below-cloud evaporation in various regions of the world. However, the sample-based meteorological records are usually not sufficient to examine the diurnal variations, because of the low temporal resolution of collected precipitation samples. To improve the resolution issue, recent studies tried to directly input the continuously measured meteorological records in the modified Stewart model, which can extend the assessments to a longer or shorter timescale [25,26]. However, the seasonal difference of diurnal variability was not well examined, and more assessments focusing on diurnal variability are still needed for various climate backgrounds.
The Altai Mountains are a trans-national mountain range in arid central Asia, dominated by westerly moisture; they are a hot spot of modern climate [27,28] and paleoclimate studies [29,30]. Due to the arid land, moisture sources and hydrological resources are always practical topics for regional sustainability [31,32,33,34]. The stable water isotopes are a useful tool to understand hydrological circulation and water resource sustainability. However, studies on stable isotopes in modern precipitation are still limited across the Altai Mountains, especially on the southern slope [35,36,37]. In this study, we collected the hourly meteorological records at several stations on the southern slope of the Altai Mountains and examined the diurnal impact of below-cloud evaporation on isotope compositions of precipitation for this region, which is useful to understand stable water isotope fractionation on a diurnal scale in a typical westerly dominated region.

2. Data and Methods

2.1. Data

The Altai Mountains are a northwest–southeast mountain range located at the boundaries between China, Russia, Kazakhstan and Mongolia in arid central Asia (Figure 1), and China lies on the southern slope of the Altai Mountains. The total length of the Altai Mountains is approximately 1650 km from northwest to southeast, and the mountain range within China is longer than 500 km, accounting for about 1/3 of the total length [38]. The southern slope of the Chinese side belongs to a temperate continental climate, and the mountainous areas are colder and wetter than the surrounding low-lying plains. The annual precipitation increases as elevation rises, and the lapse rate ranges between 30 mm and 80 mm per 100 m; the annual precipitation at the piedmont plain is 100 mm to 200 mm, and at some high-elevation sites, precipitation may be up to 1000 mm per year [38]. The Ertix River (a branch of the Ob River flowing into the Arctic Ocean) originates from the southern slope. The Junggar Basin (and Gurbantunggut Desert) lies to the south of the Altai Mountains.
In this study, seven meteorological stations were selected on the southern slope of the Altai Mountains, including: Jeminay, Habahe, Burqin, Fuhai, Altay, Fuyun and Qinghe, from west to east (Figure 1 and Table 1). The altitudes of these stations range from 1218 m (Qinghe) to 474 m (Burqin). According to the long-term climatologies [38], the annual mean air temperature ranges between 0.5 °C (Qinghe) and 4.7 °C (Habahe), and the annual mean precipitation ranges between 119.6 mm (Fuhai) and 203.3 mm (Jeminay), indicating an arid climate condition. Three hourly meteorological parameters, including air temperature, relative humidity and precipitation amount, were used in this study. From March 2017 to June 2022, there are 286,143 h of meteorological records at these seven stations, and 271,266 h with the full three parameters. The 283,444 hourly precipitation records include 10,209 precipitation hours and 273,235 non-precipitation hours.

2.2. Methods

Here, we applied a modified Stewart model to estimate the changes in stable isotope compositions in raindrops falling from the cloud base. The basic setting of isotope fractionation during water drop evaporation is based on the experimental work of Stewart [39], and the equations were later transformed and modified to quantitatively calculate the isotope fractionation under natural meteorological conditions [19,40]. When the stable isotope compositions of oxygen and hydrogen are expressed using a delta (δ) notation relative to Vienna Standard Mean Ocean Water, the evaporation-caused changes in δ18O and δ2H for a falling raindrop [40] is
Δ δ 18 O = ( 1 18 γ 18 α ) ( f 18 β 1 )
Δ δ 2 H = ( 1 2 γ 2 α ) ( f 2 β 1 )
where 18α (and 2α) are the equilibrium fractionation factors for oxygen (and hydrogen) isotopes derived from air temperature [41], 18γ and 18β (2γ and 2β) are two parameters derived from the equilibrium fractionation factor and relative humidity for oxygen (and hydrogen) isotopes [39], and f is the remaining fraction of raindrop mass. Then, the changes in deuterium excess [7] can be expressed as
Δ d = Δ δ 2 H 8 Δ δ 18 O
Regarding the remaining fraction of raindrop mass, Wang et al. [19] designed a conceptional process as
f = m end m end + m ev
where mend is the terminal mass of raindrops near the surface, and mev is the evaporated mass. According to a spheric assumption, the terminal mass can be determined as
m end = 4 3 ρ π r 3
where ρ is the density of liquid water, and r is the radius of raindrops derived from the measured hourly precipitation [19,42]. Here, the estimated raindrop diameters for precipitation hours with a temperature higher than 0 °C range from 0.65 mm to 2.27 mm, and the arithmetic mean is 0.92 mm. A recent assessment of raindrop size distribution in 2326 Chinese meteorological stations [43] showed a nationwide mass-weighted mean diameter of 1.01 ± 0.3 mm from May to August, and the diameter along the southern slope of the Altai Mountains was between 0.9 mm and 1.0 mm, which is consistent with our estimations based on hourly precipitation in this study. In addition, this estimation is consistent with some short-term in situ observations in arid northwest China [44,45,46].
The evaporated mass is calculated as
m ev = E H v
where E is the evaporation intensity (water mass in unit time) under a specific environment (temperature, relative humidity and raindrop diameter) using a bilinear interpolation [19,47], H is the cloud base height derived from temperature and relative humidity [26], and v is the terminal velocity (distance in unit time) of a falling raindrop derived from raindrop radius and cloud base height [48]. The estimated terminal velocities in this study range between 2.6 m/s and 7.5 m/s for precipitation hours with a temperature higher than 0 °C, and the arithmetic mean is 3.6 m/s, which is consistent with some recent measurements in northwest China [44,45].
The original hourly time series can be weighted to annual, seasonal or diurnal scales using precipitation.

3. Results

3.1. Diurnal Variations of Meteorological Conditions

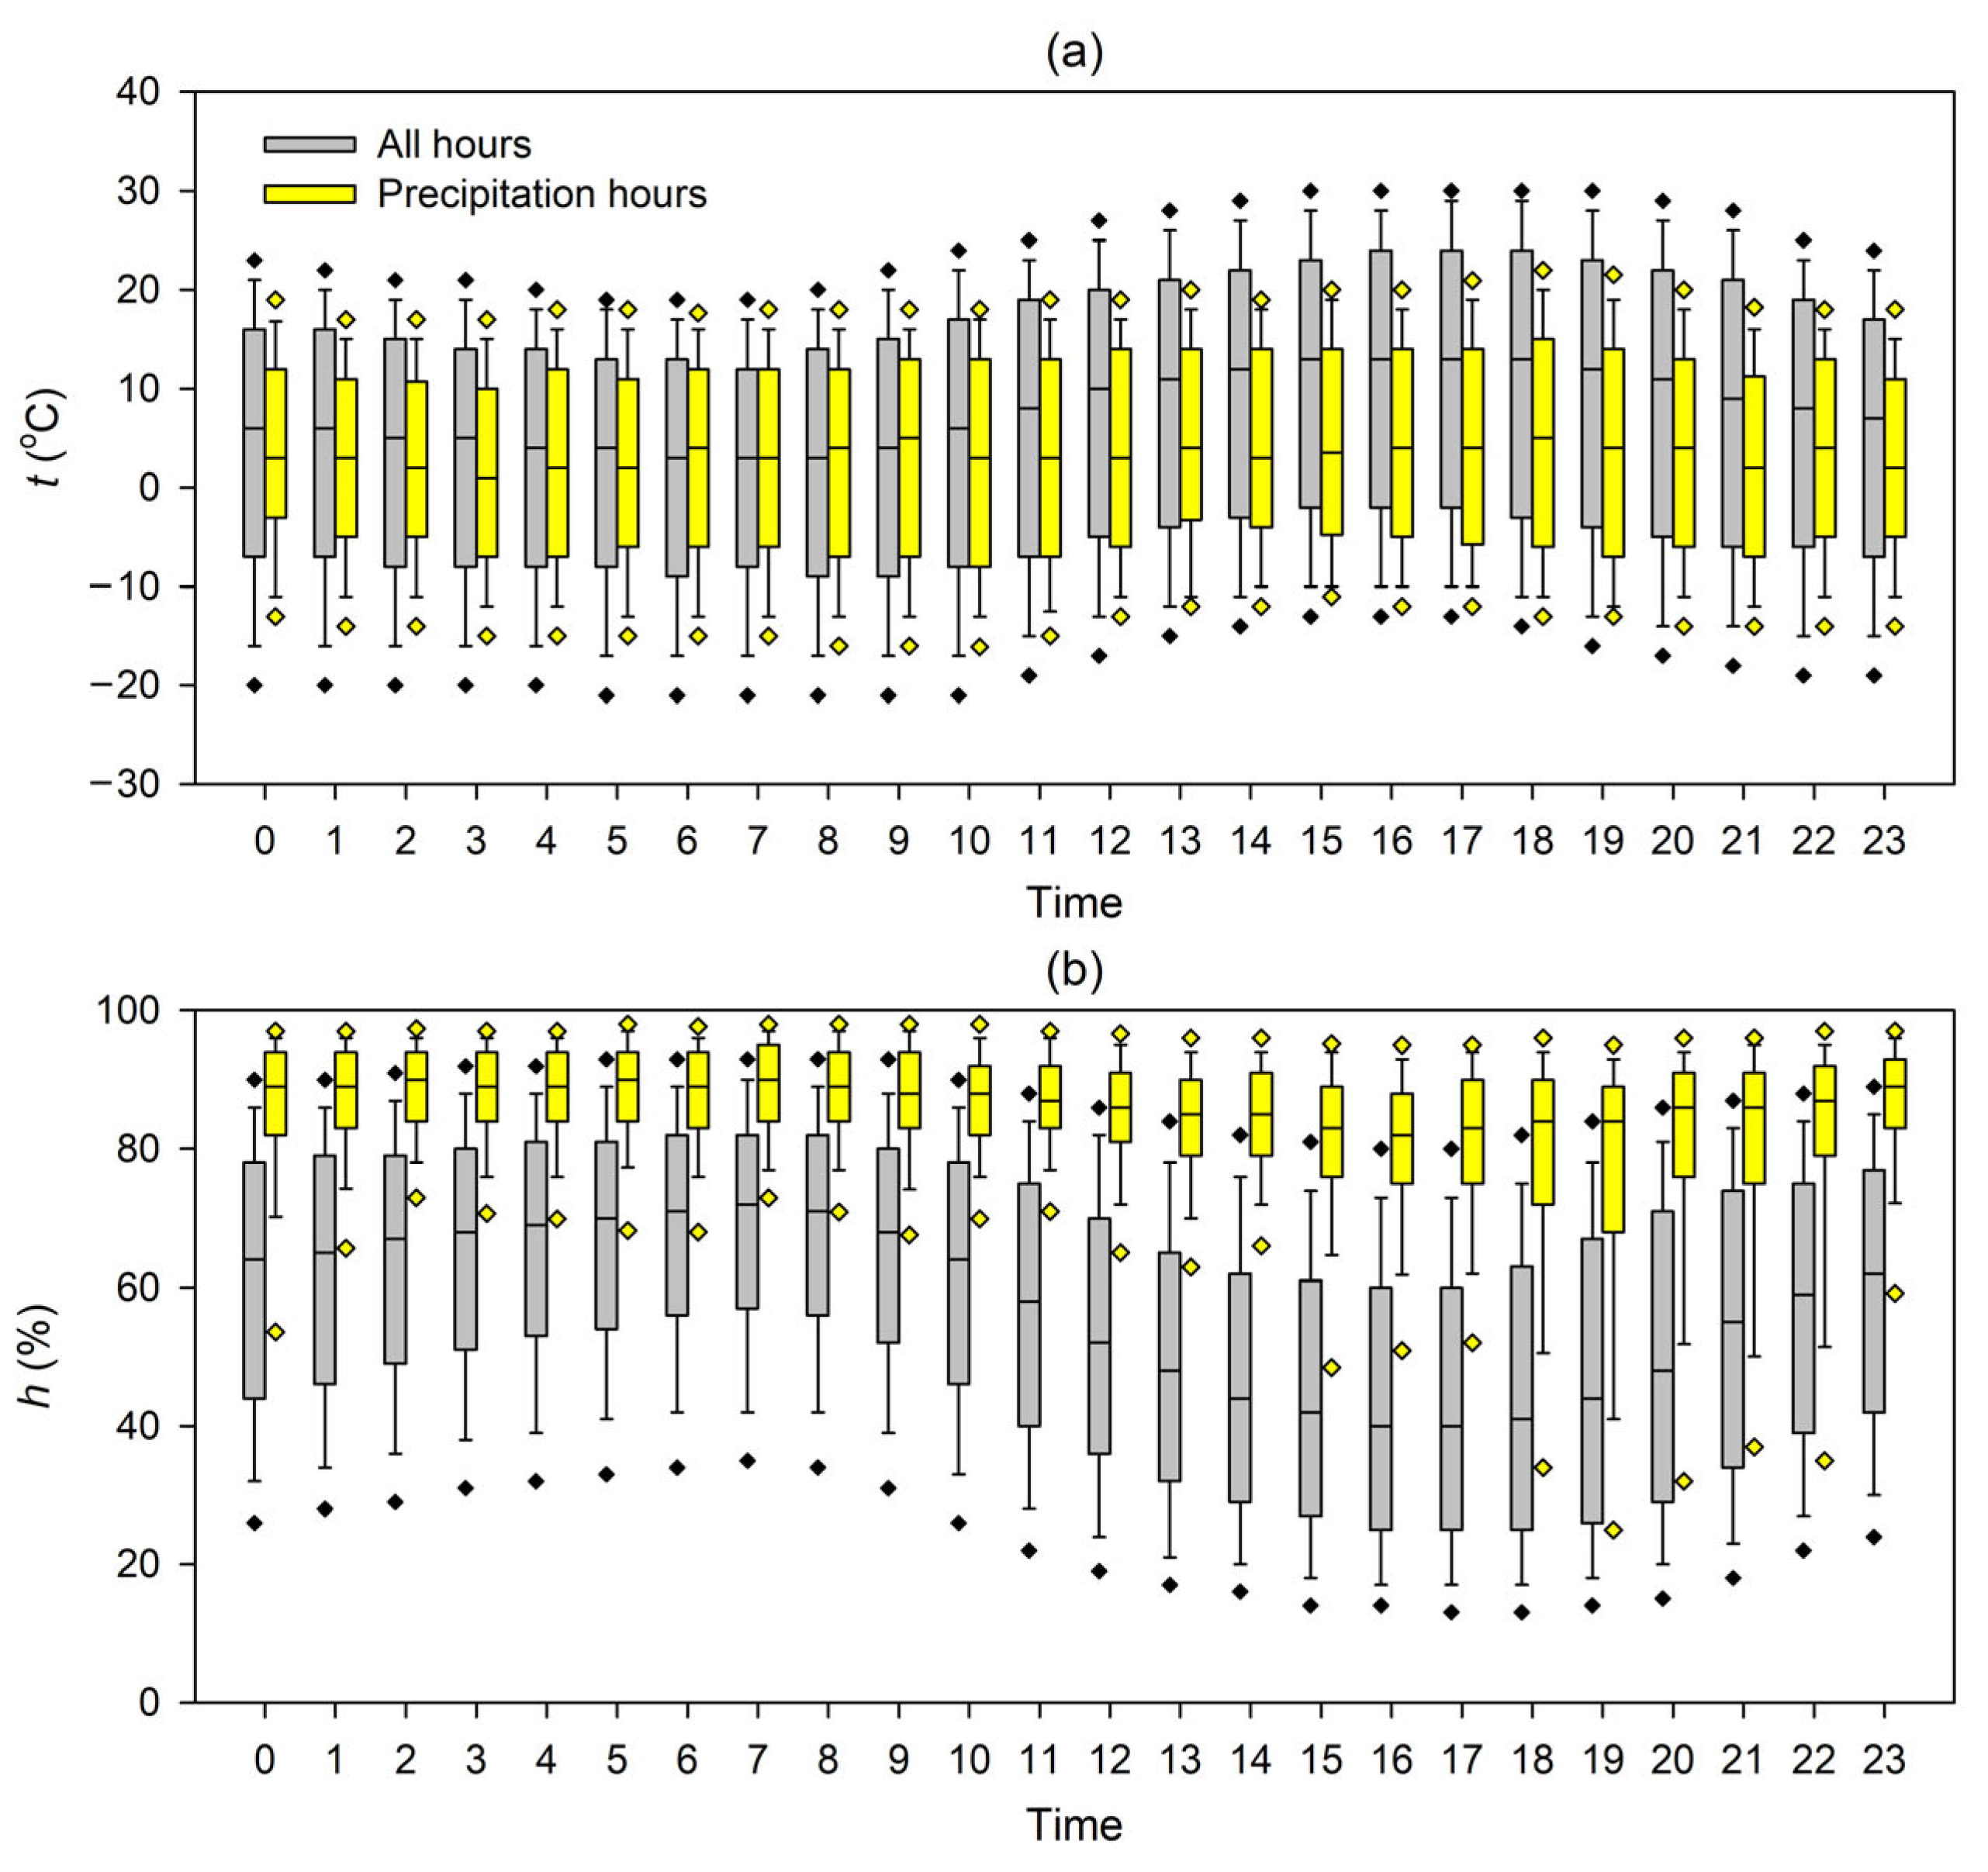
Figure 2 shows the diurnal variations of air temperature and precipitation in the study region for all hours and only precipitation hours. The air temperature for all hours shows a diurnal cycle with a maximum around 16:00 to 18:00 China Standard Time (i.e., Beijing Time, Coordinated Universal Time + 8) and minimum around 6:00 to 8:00 (Figure 2a). It should be noticed that the China Standard Time is about 2 h ahead of the theoretical local time (Coordinated Universal Time + 6) for the stations on the southern slope of the Altai Mountains. The arithmetic mean air temperature is 5.8 °C for all hours and 3.2 °C for precipitation hours. For all hours, the air temperature during daytime, from 10:00 to 22:00 (arithmetic mean is 8.6 °C), is higher than that during nighttime, from 22:00 to 10:00 (arithmetic mean is 3.0 °C); for precipitation hours, the air temperature during daytime (3.8 °C) is higher than that during nighttime (2.5 °C). On most occasions, the air temperature during precipitation is lower than that for all hours, especially during daytime. From 14:00 to 18:00, the air temperature difference between the two groups is much larger than in the other periods, and the arithmetic means are 10.3 °C for all hours and 4.4 °C for precipitation hours; from 6:00 to 8:00, the two groups have similar medians, and the arithmetic means are 1.7 °C for all hours and 2.6 °C for precipitation hours.
The relative humidity generally shows an inversed diurnal cycle to the air temperature (Figure 2b). For all hours, the low relative humidity period usually occurs from 16:00 to 18:00 (arithmetic mean is 43%), and the high relative humidity period occurs from 6:00 to 8:00 (arithmetic mean is 68%). The fluctuation for all hours is much stronger than that for precipitation hours. The median relative humidity for all hours generally ranges from 40% to 70%, and the arithmetic mean is 57%; in contrast, the most relative humidity for precipitation hours is higher than 80%, and the arithmetic mean is 84%. For all hours, the arithmetic means of relative humidity during daytime and nighttime are 49% and 65%, respectively; for precipitation hours, the arithmetic means are 81% and 87%. Although the period from 15:00 to 17:00 has relatively low medians, many low extremes still exist from 18:00 to 22:00.
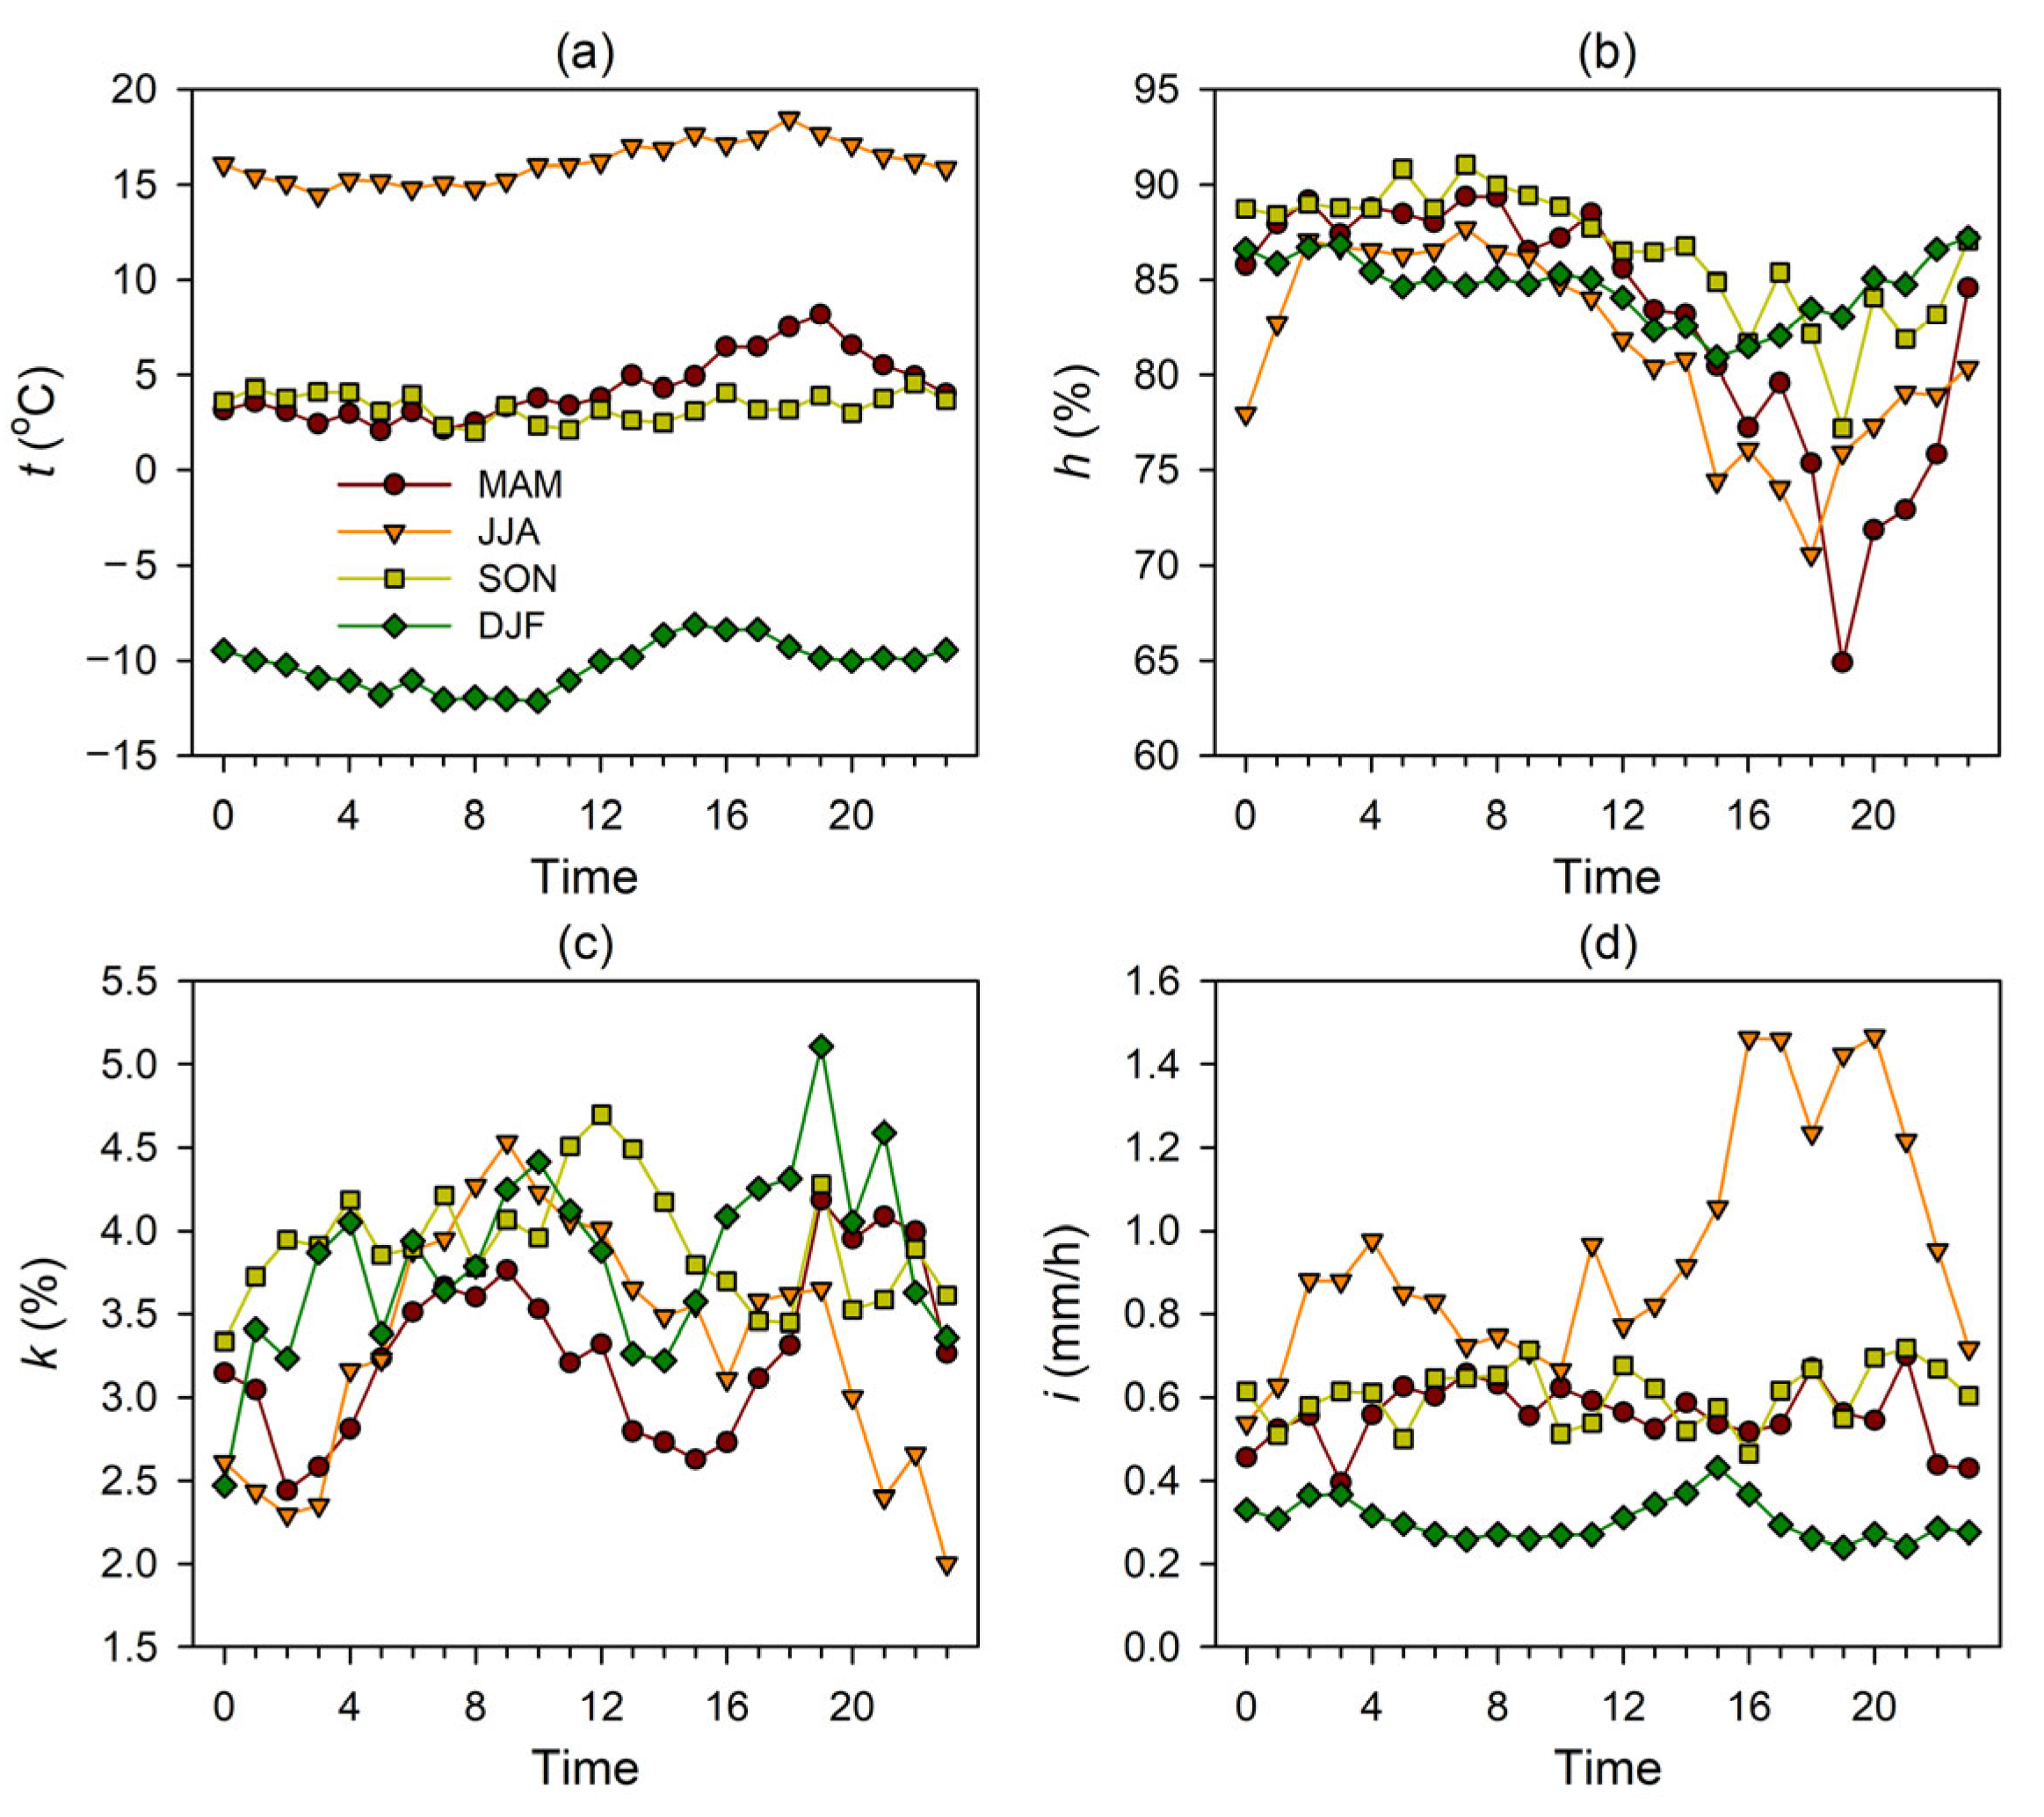
The diurnal variations of meteorological elements during precipitation hours show different patterns for each season in the study region (Figure 3). For air temperature (Figure 3a), the highest value of arithmetic mean air temperature occurs at 18:00 and 19:00 in summer (June, July and August; JJA) and spring (March, April and May; MAM), respectively; in winter (December, January and February; DJF), the peak time is a little earlier, at 15:00; in autumn (September, October and November; SON), there is no distinct peak. Since the air temperature in winter is generally lower than 0 °C, the below-cloud evaporation impact on raindrop isotope compositions is usually ignorable. For relative humidity (Figure 3b), most seasons show a minimum around 19:00, except for winter, when the minimum is at 15:00. During daytime, spring and summer have much lower relative humidity than autumn and winter; during nighttime, the seasonal differences are relatively small.
We provide the diurnal variation of precipitation probability in Figure 3c, which reflects the ratio of precipitation hours and all hours available. For summer, the peak period of precipitation probability is around 9:00; for other seasons there are two peak periods: around 9:00 to 12:00 in the morning and around 19:00 in the afternoon. The precipitation intensity (Figure 3d), i.e., the hourly precipitation amount, shows a quite different diurnal pattern from precipitation probability. From 16:00 to 20:00, there is a distinct peak in summer, indicating a relatively strong rainfall in the afternoon that is usually associated with the convection of heated air after noon. Precipitation intensity in spring and autumn is generally close to around 0.6 mm/h, which is less than that in summer. Winter usually has a very low precipitation intensity, among the four seasons.

3.2. Diurnal Variations of Isotope Compositions

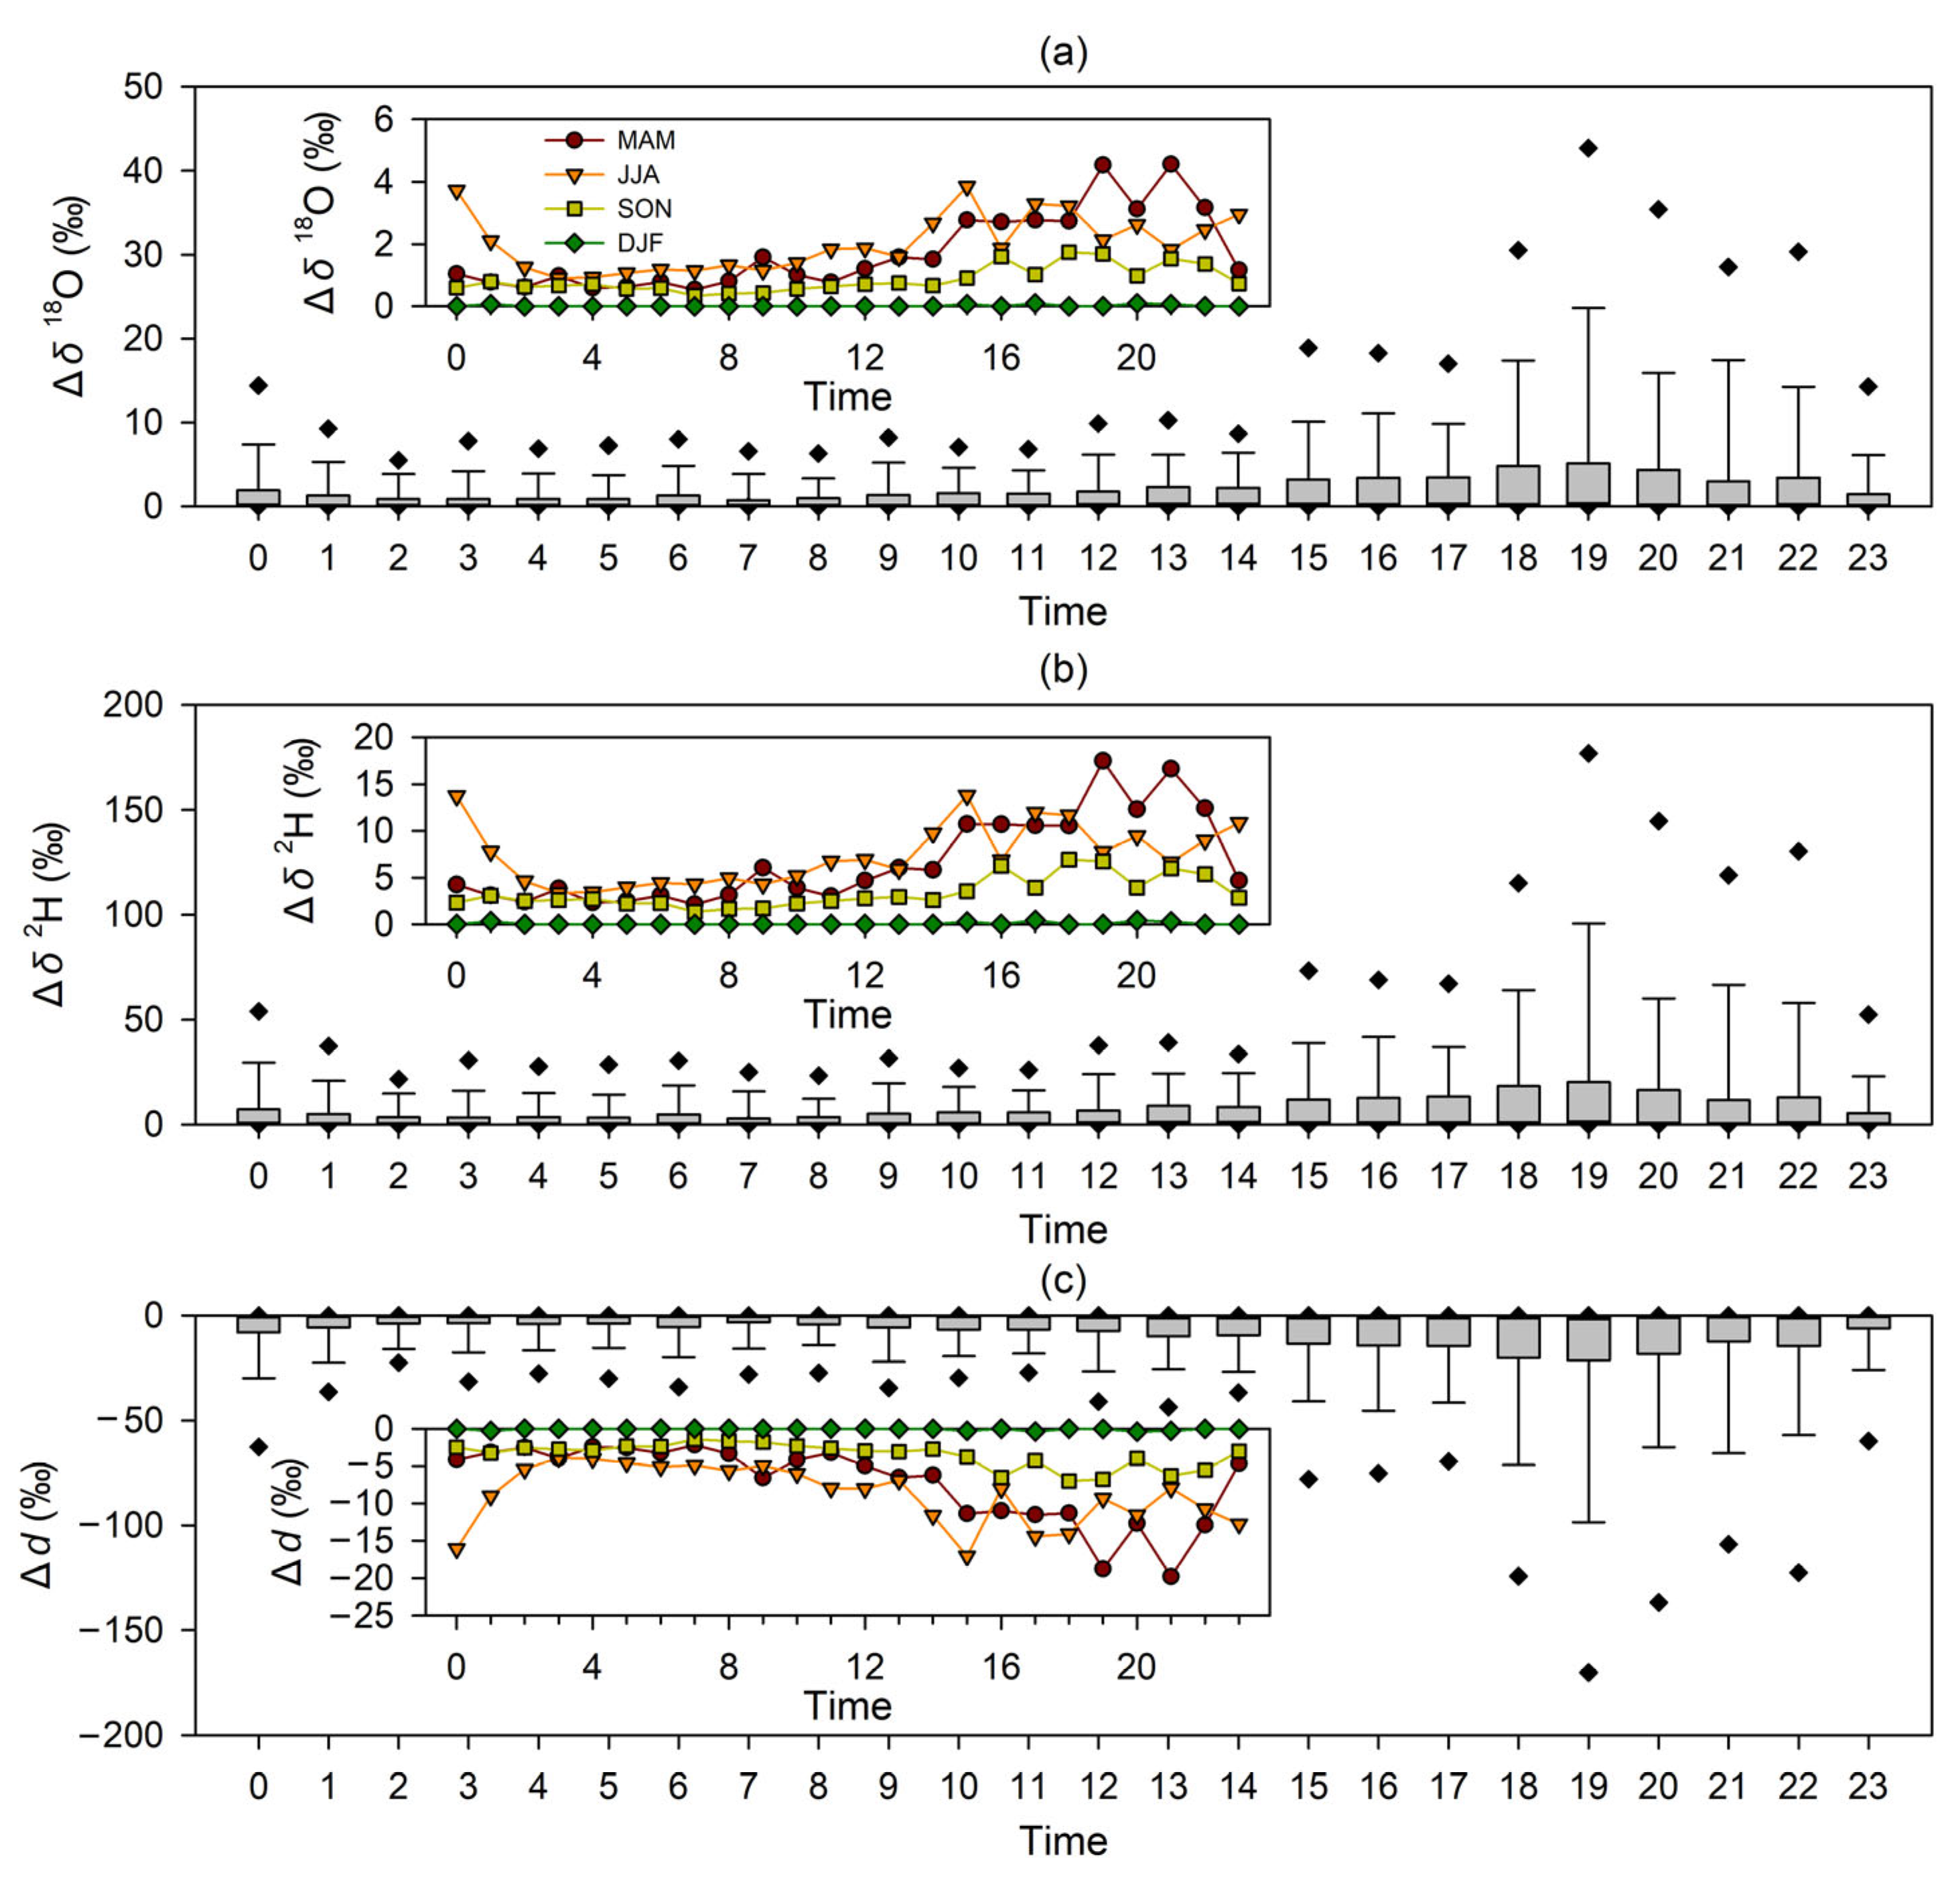
Figure 4 shows the estimated changes in stable isotope compositions in precipitation due to below-cloud evaporation. The impact of below-cloud evaporation is strong in the afternoon, especially from 18:00 to 22:00. During nighttime, the changes in isotope compositions are generally weak. Obvious increases in Δδ18O and Δδ2H, and decreases in Δd, can be found around 15:00. On a seasonal basis, summer and spring usually have a larger impact of below-cloud evaporation than autumn; the winter precipitation is generally not influenced by below-cloud evaporation. We provide the precipitation-weighted means during daytime and nighttime for each season in Table 2. Taking Δd as an example, the weighted means during daytime and nighttime are −8.2‰ and −3.5‰, respectively, and the difference is 4.7‰. The all-day mean (−6.1‰) is quite close to the mean during daytime. The difference between daytime and nighttime is generally large in spring (8.1‰) and summer (4.8‰), and the difference in winter (0.1‰) is very small. Similar patterns can be seen for Δδ18O and Δδ2H, and the annual differences between daytime and nighttime are 1.1‰ for Δδ18O and 4.0‰ for Δδ2H, respectively.
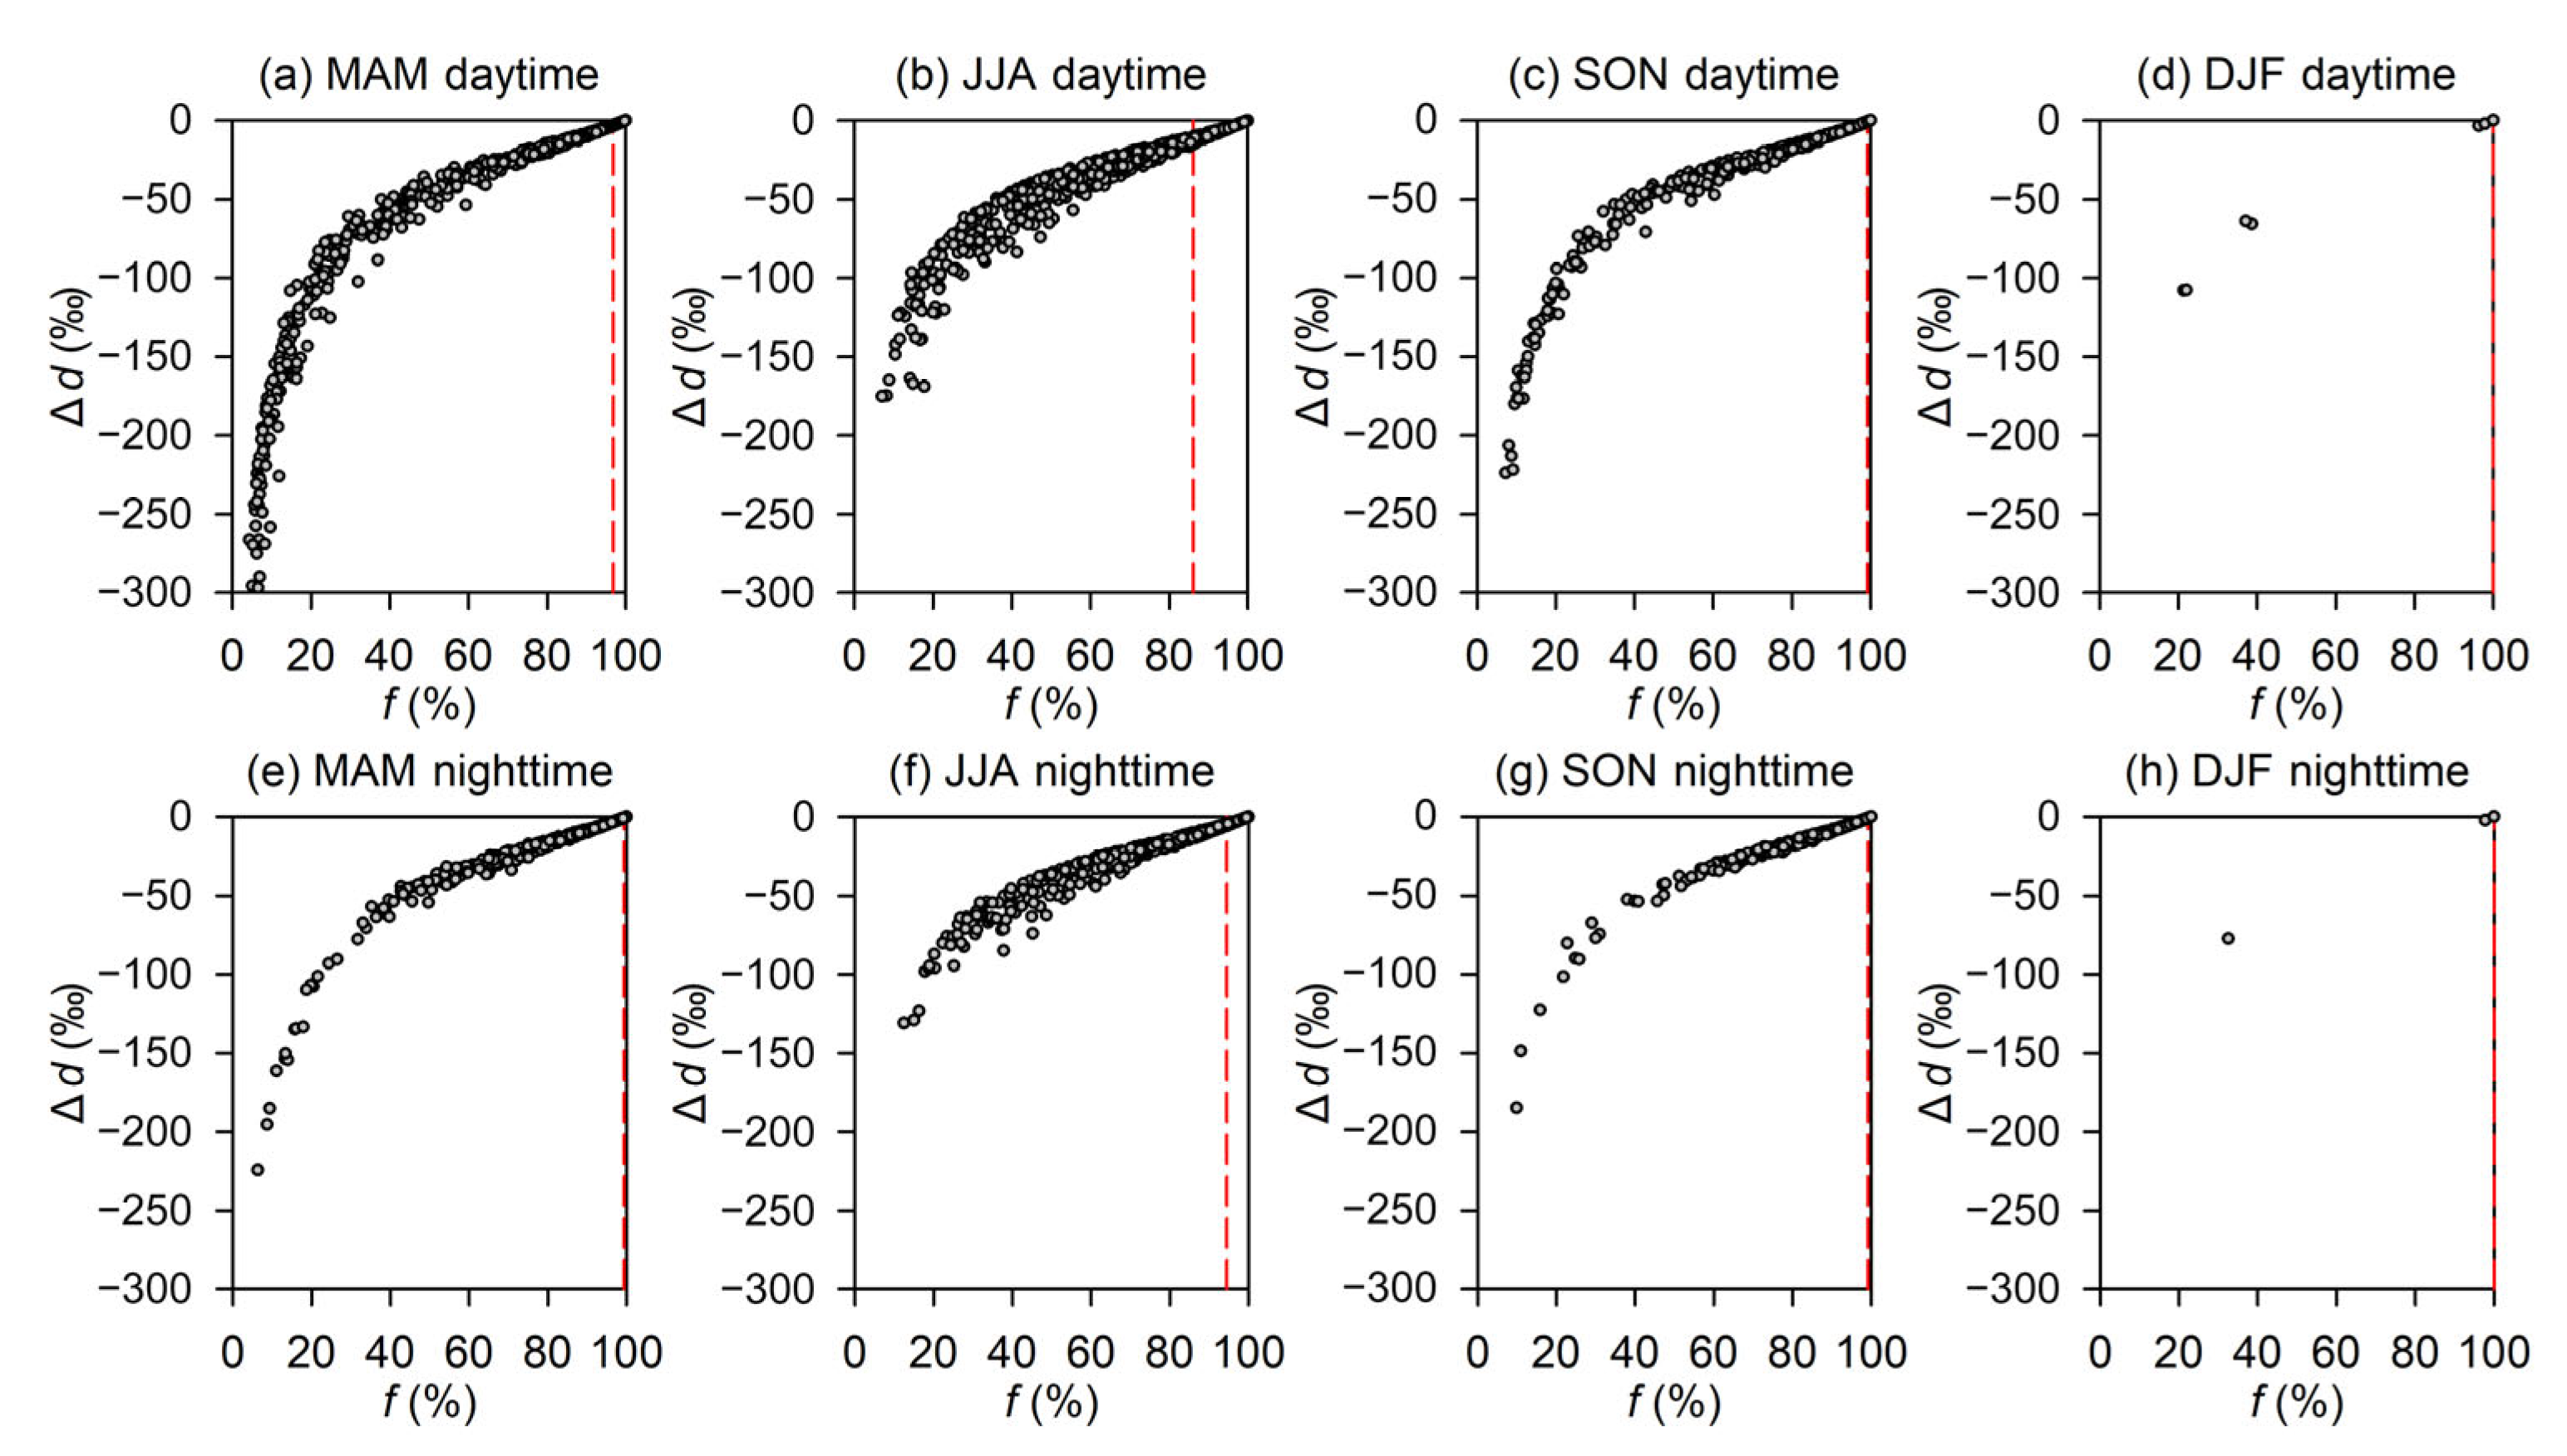
There is a logarithmic function relationship between the Δd value and remaining fraction (f) of raindrops (Figure 5). For the conditions with a high remaining fraction, i.e., weak evaporation, Δd positively correlates with f, which is close to a linear relationship; for the conditions with a low remaining fraction, the linear relationship does not exist. It should be mentioned that although the f value shows a wide range, from approximately 0 to 100%, most points are concentrated at the high f part, which can also be detected from the median of f (vertical dashed line in Figure 5). Generally, the remaining fraction of raindrops during nighttime is larger than that during daytime. Summer has the largest diurnal difference in remaining fraction between daytime (median is 94.4%; Figure 5b) and nighttime (median is 86.1%; Figure 5f); in spring, the medians of f during daytime and nighttime are 96.8% and 99.3%, respectively.

3.3. Sensitivity of Isotope Compositions to Temperature and Relative Humidity

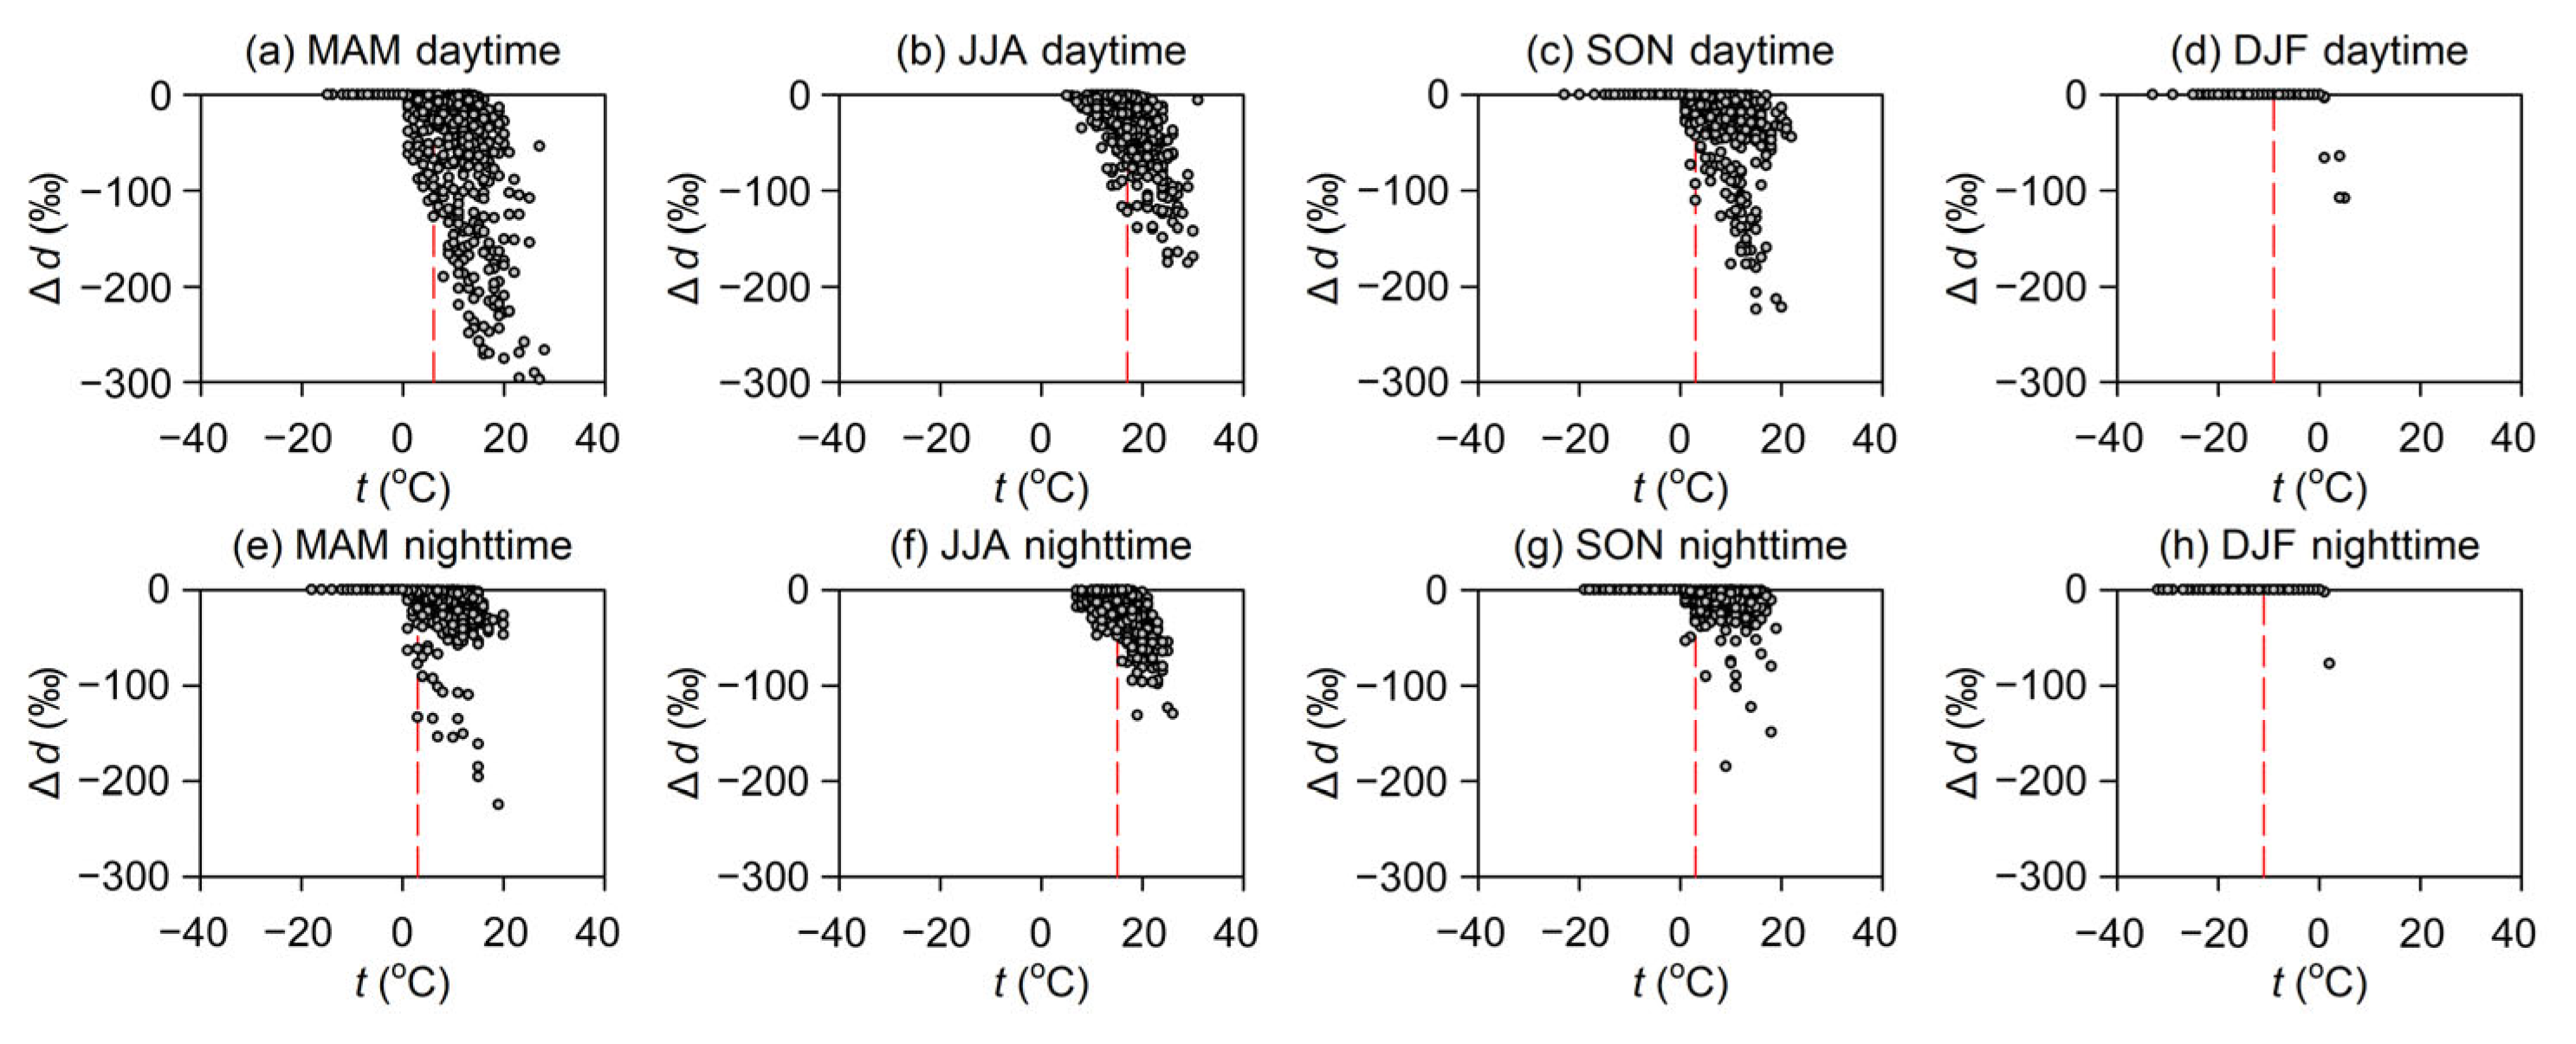
Figure 6 shows the relationship between Δd and air temperature (t) during daytime and nighttime. According to the setting of the modified Stewart model, Δd equals zero when the air temperature is lower than 0 °C. As the temperature increases to higher than 0 °C, there is an enhancing trend of below-cloud evaporation, and Δd tends to a much lower value. In winter, most precipitation hours are colder than 0 °C, and the Δd value is close to zero. The largest temperature difference between daytime and nighttime is in spring among the four seasons, as indicated by the median value of temperature (dashed vertical line in Figure 6). The diurnal difference between medians during daytime and nighttime in summer is slightly less than that in spring.
For most seasons, except winter, Δd negatively correlates to relative humidity (h) in the study region (Figure 7). When relative humidity is less than 20%, the Δd value is even less than −200‰, which means that the isotope compositions in precipitation have been greatly modified by the below-cloud evaporation. Many zero values of Δd can be seen, especially in spring, autumn and winter, which means that the air temperature for these precipitation hours is usually less than 0 °C. Compared to nighttime, daytime usually has more precipitation hours with low Δd values < −100‰.
We calculated the sensitivity of Δd to changes in air temperature and relative humidity (Figure 8). That is, we kept the model input unchanged, except for air temperature or relative humidity, and then examined the recalculated results relative to the original results. There are four temperature scenarios used here, including a decrease by 1 °C and 2 °C, as well as an increase by 1 °C and 2 °C (Figure 8a). As air temperature increases or decreases, the Δd value is not very sensitive during nighttime, especially from 2:00 to 10:00; in contrast, Δd is sensitive in the late afternoon, and the largest impact can be seen at 21:00. If air temperature increases (or decreases) by 2 °C, the Δd value at 21:00 decreases by 0.88‰ (or increases by 0.82‰). If air temperature increases (or decreases) by 1 °C, the Δd value at 21:00 decreases by 0.47‰ (or increases by 0.38‰).
We selected four scenarios for relative humidity, including a decrease of 1% and 2%, as well as an increase of 1% and 2% (Figure 8b). To avoid abnormal relative humidity in the sensitivity analysis, the boundary value is set from 3% to 100%, that is, if the original relative humidity is 99% or 100%, the scenario of a 2% increment corresponds to 100% for the two cases. The period from 2:00 to 10:00 shows a relatively low sensitivity; for this period, the changes in Δd are around 0.6‰ (or around −0.7‰) when relative humidity increases (or decreases) by 2%, and the absolute changes in Δd are around 0.3‰ when the increment or decrement of relative humidity is 1%. From 14:00 to 22:00, the isotope compositions are sensitive to changes in relative humidity; if relative humidity increases (or decreases) by 2%, Δd increases (or decreases) by >1‰.
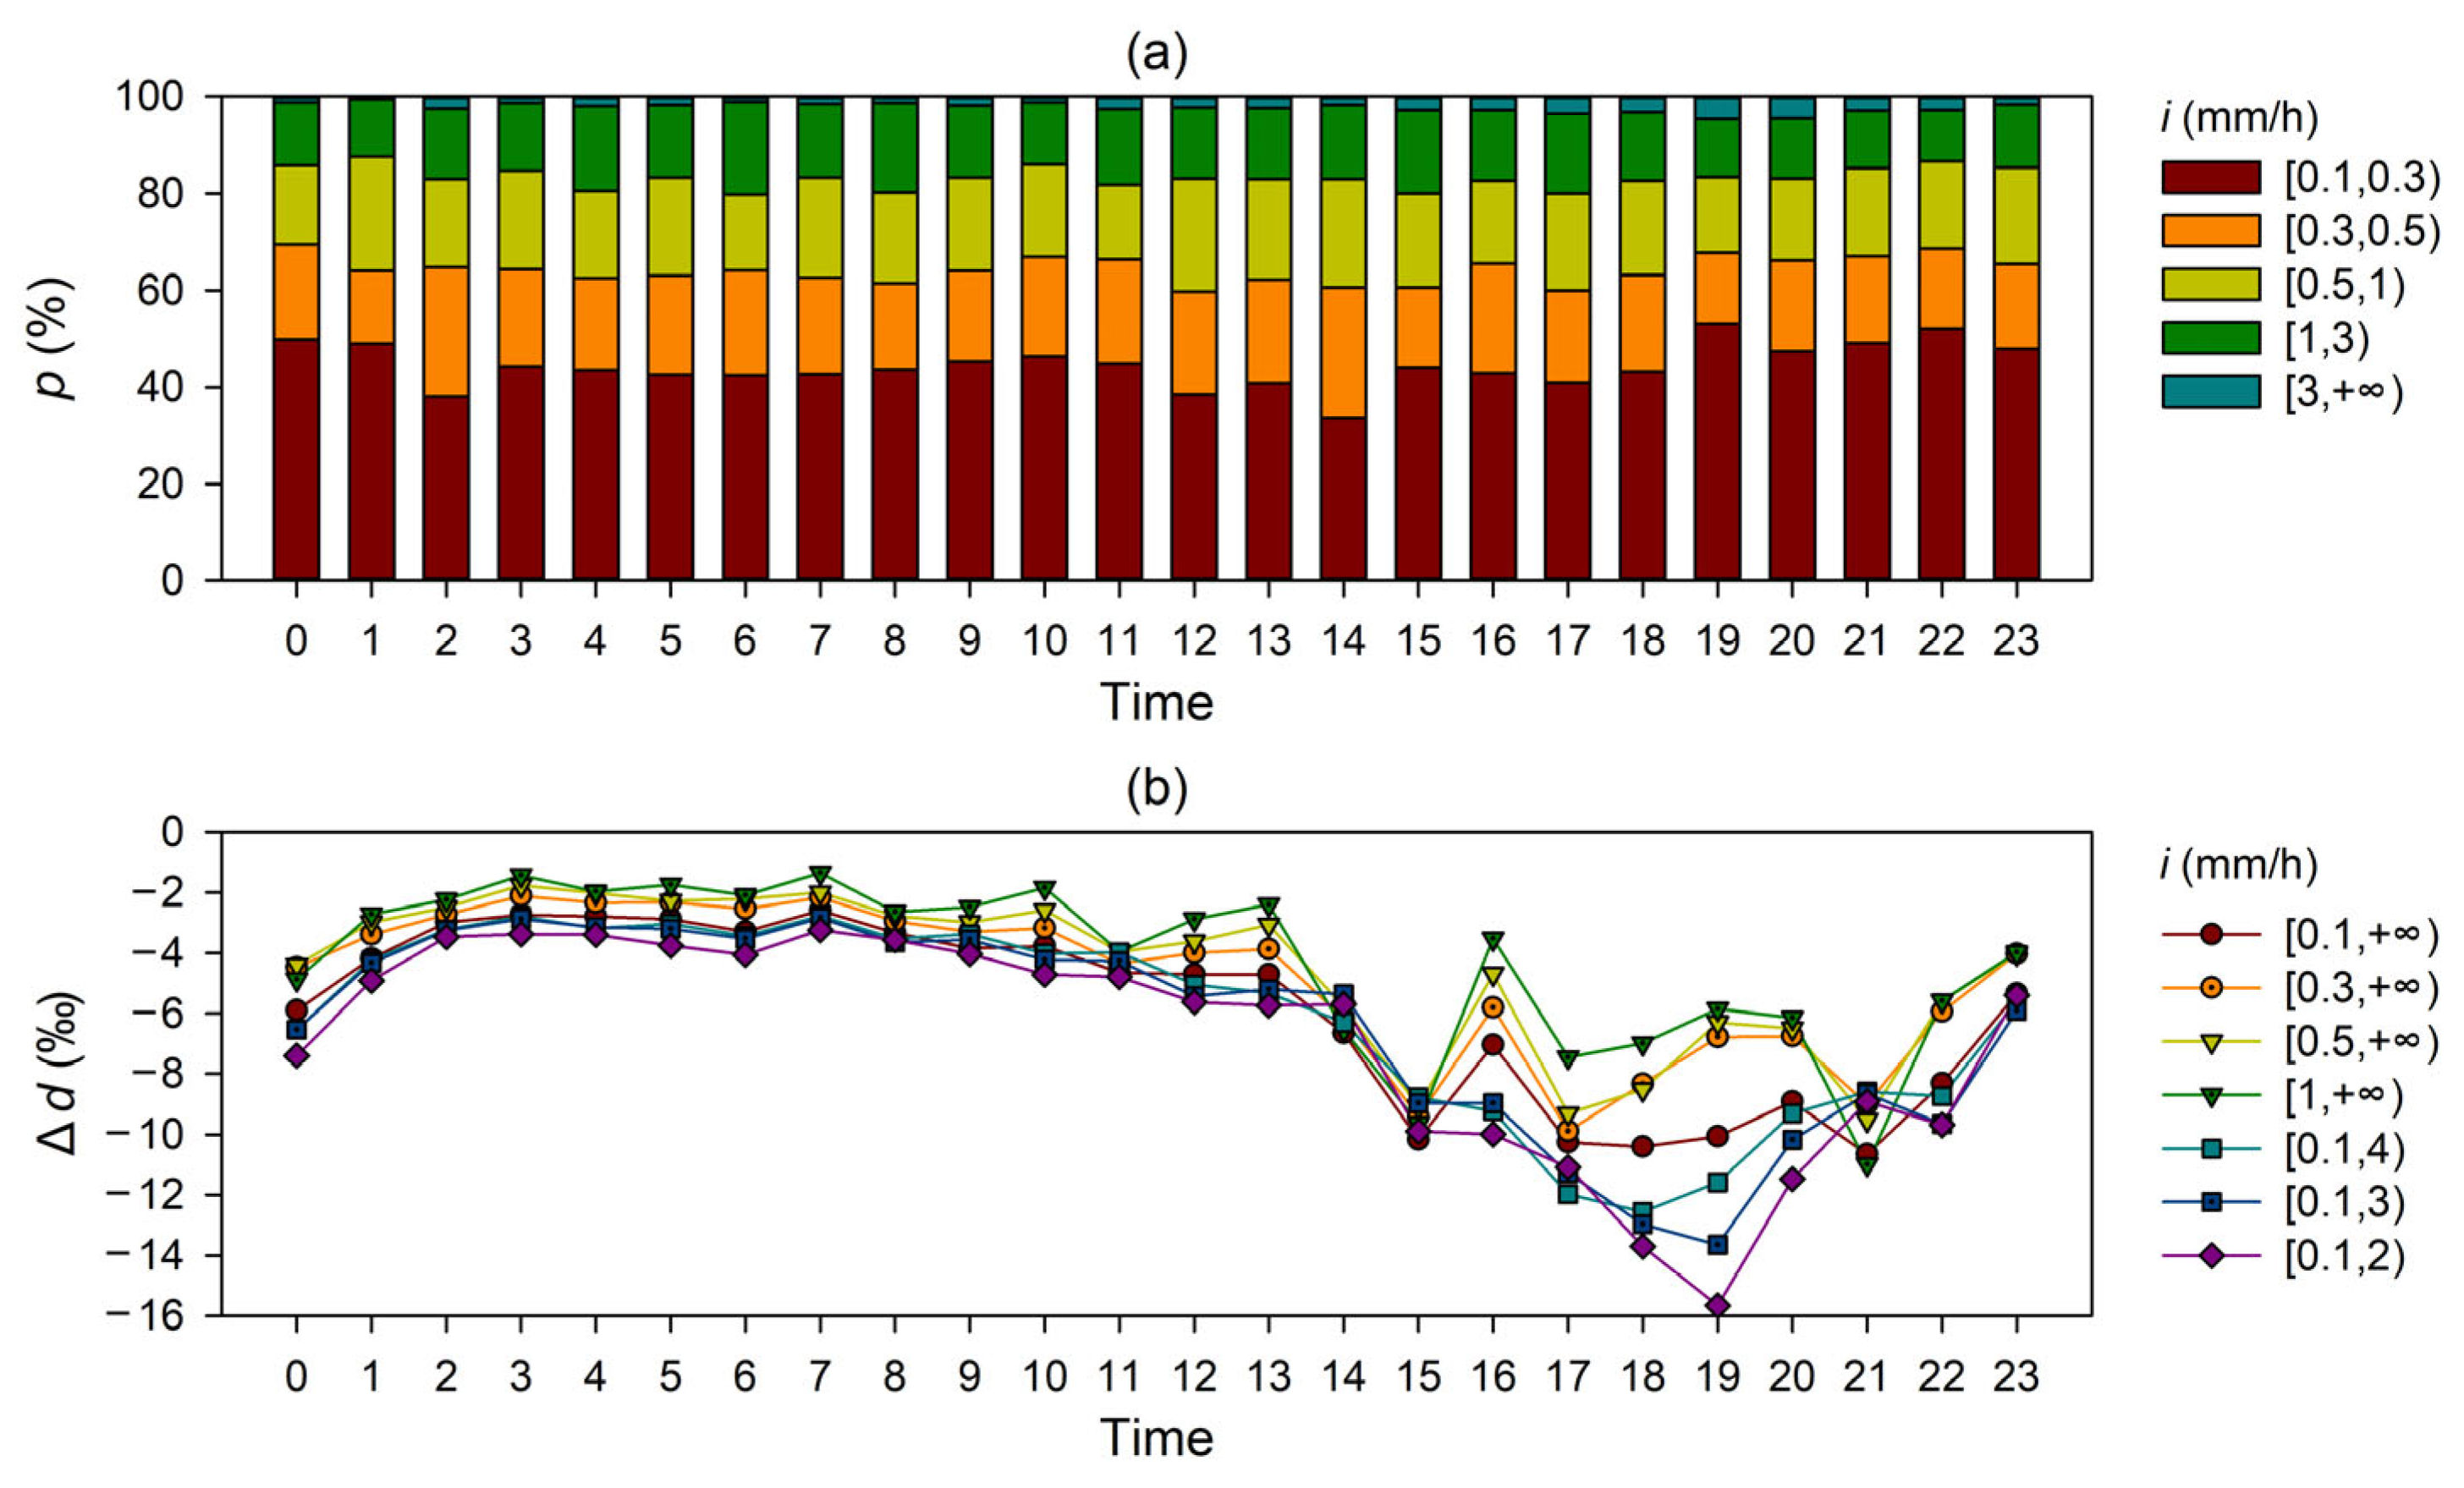
Located in arid central Asia, little precipitation plays an important role, and most precipitation records in the study region show a precipitation intensity of less than 1 mm/h (Figure 9a). For each hour, the proportional contribution of a precipitation intensity less than 0.3 mm/h ranges between 33.7% (14:00) and 53.0% (19:00), and that less than 0.5 mm/h ranges between 59.7% (12:00) and 69.5% (0:00). The contribution of a precipitation intensity larger than 3 mm/h ranges from 0.5% (1:00) to 4.5% for each hour (19:00). In Figure 9b, we present the results of Δd without small or large precipitation intensity hours. Generally, when small intensity is removed, the Δd value increases, indicating that the impact of below-cloud evaporation tends to be weak; in contrast, when some large intensity is removed, the Δd value shows a decreasing trend, and the isotope compositions in raindrops will suffer an enhanced impact of below-cloud evaporation.

4. Discussions

In a nationwide assessment based on long-term daily meteorological data across China [25], stations on the southern slope of the Altai Mountains show a stronger impact of below-cloud evaporation than the weighted mean of China, but the impact seems weaker than that in most stations in arid northwest China. There is no huge mountain range to the west of the Altai Mountains, and the westerly moisture can be transported into the study region, which causes relatively more precipitation compared to the regional mean of arid northwest China [49,50,51]. The study region is located at a relatively high latitude in northwest China, and has relatively low air temperature and a long period of snow cover [52,53].
Isotope signals can be modified due to below-cloud evaporation, which is obvious in an arid and semi-arid climate [17,18,19]. In this study, the modification of δ18O is 1.4‰ on an annual basis, and up to 2.1‰ in summer (Table 2). According to previous observations in the Altay station on the southern slope of the Altai Mountains [35], the stable oxygen isotopes are enriched in summer and depleted in winter, and the annual range is approximately 20‰. Other observations along the mountain range also have a similar magnitude of intra-annual variation in precipitation isotopes [36,54]. Considering the inter-annual and intra-annual variability of stable water isotopes in precipitation in arid northwest China [37], the impact of below-cloud evaporation does not greatly modify the seasonal signals of stable isotopes in precipitation. Similar to other stations in northwest China [25], the strong below-cloud evaporation enhances the intra-annual difference of precipitation isotopes, which then results in a stronger temperature effect of precipitation isotopes on an intra-annual scale.
The diurnal variation of precipitation isotopes due to below-cloud evaporation indicates the different potential impacts of the sampling scheme. Evaporation exists in many processes, not only from the cloud base to the ground, but also in the water collectors. Although the focus of this study is the natural process below cloud base, the natural factors and sampling scheme sometimes have a combined influence on the precipitation samples available for isotope analysis. Much field research has been conducted to prevent or reduce evaporation in water collectors [55,56], and the quantitative estimation in this study is useful to understand the possible natural processes of evaporation from cloud base to water collectors.

5. Conclusions

In this study, we collected the hourly meteorological data at several stations on the southern slope of the Altai Mountains and analyzed the diurnal impact of below-cloud evaporation on stable isotope compositions of precipitation using a modified Stewart model. The impact of below-cloud evaporation is strong in the afternoon, especially from 18:00 to 22:00. During nighttime, the changes in isotope compositions are generally weak. Obvious increases in Δδ18O and Δδ2H, and decreases in Δd, can be found around 15:00. On a seasonal basis, summer and spring usually have a larger impact of below-cloud evaporation than autumn; the winter precipitation is generally not influenced by below-cloud evaporation. On an annual basis, the differences in evaporation-led isotope changes between daytime and nighttime are 1.1‰ for Δδ18O, 4.0‰ for Δδ2H and 4.7‰ for Δd. The period from 2:00 to 10:00 shows relatively low sensitivity to relative humidity, and from 14:00 to 22:00, the isotope compositions are sensitive to changes in relative humidity. Considering the inter-annual and intra-annual variability of stable isotopes in precipitation, the impact of below-cloud evaporation does not greatly modify the seasonal signals of stable isotopes in precipitation.

Author Contributions

Conceptualization, S.W. and L.D.; methodology, S.W., L.D., D.Q. and Y.S.; software, S.W., L.D., Y.X. and Y.S.; validation, S.W. and L.D.; formal analysis, L.D.; investigation, S.W. and L.D.; resources, S.W., D.Q. and Y.S.; data curation, S.W.; writing—original draft preparation, S.W. and L.D.; writing—review and editing, S.W. and L.D.; visualization, S.W. and L.D.; supervision, S.W.; project administration, S.W.; funding acquisition, S.W. All authors have read and agreed to the published version of the manuscript.

Funding

This research was funded by the National Natural Science Foundation of China, grant number 41971034, and the Northwest Normal University, grant number NWNU-LKZD2021-04.

Data Availability Statement

Not applicable.

Conflicts of Interest

The authors declare no conflict of interest.

References

  1. Miguez-Macho, G.; Fan, Y. Spatiotemporal origin of soil water taken up by vegetation. Nature 2021, 598, 624–628. [Google Scholar] [CrossRef] [PubMed]
  2. Vystavna, Y.; Harjung, A.; Monteiro, L.R.; Matiatos, I.; Wassenaar, L.I. Stable isotopes in global lakes integrate catchment and climatic controls on evaporation. Nat. Commun. 2021, 12, 7224. [Google Scholar] [CrossRef] [PubMed]
  3. Shi, M.; Worden, J.R.; Bailey, A.; Noone, D.; Risi, C.; Fu, R.; Worden, S.; Herman, R.; Payne, V.; Pagano, T.; et al. Amazonian terrestrial water balance inferred from satellite-observed water vapor isotopes. Nat. Commun. 2022, 13, 2686. [Google Scholar] [CrossRef] [PubMed]
  4. He, C.; Liu, Z.; Otto-Bliesner, B.L.; Brady, E.C.; Zhu, C.; Tomas, R.; Clark, P.U.; Zhu, J.; Jahn, A.; Gu, S.; et al. Hydroclimate footprint of pan-Asian monsoon water isotope during the last deglaciation. Sci. Adv. 2021, 7, eabe2611. [Google Scholar] [CrossRef]
  5. Sánchez-Murillo, R.; Durán-Quesada, A.M.; Esquivel-Hernández, G.; Rojas-Cantillano, D.; Birkel, C.; Welsh, K.; Sánchez-Llull, M.; Alonso-Hernández, C.M.; Tetzlaff, D.; Soulsby, C.; et al. Deciphering key processes controlling rainfall isotopic variability during extreme tropical cyclones. Nat. Commun. 2019, 10, 4321. [Google Scholar] [CrossRef] [PubMed]
  6. Man, W.; Zhou, T.; Jiang, J.; Zuo, M.; Hu, J. Moisture sources and climatic controls of precipitation stable isotopes over the Tibetan Plateau in water-tagging simulations. J. Geophys. Res. Atmos. 2022, 127, e2021JD036321. [Google Scholar] [CrossRef]
  7. Dansgaard, W. Stable isotopes in precipitation. Tellus 1964, 16, 436–468. [Google Scholar] [CrossRef]
  8. Araguás-Araguás, L.; Froehlich, K.; Rozanski, K. Deuterium and oxygen-18 isotope composition of precipitation and atmospheric moisture. Hydrol. Process. 2000, 14, 1341–1355. [Google Scholar] [CrossRef]
  9. Griffiths, A.D.; Treble, P.C.; Hope, P.; Rudeva, I. Rainfall stable water isotope variability in coastal southwestern Western Australia and its relationship to climate on multiple timescales. J. Geophys. Res. Atmos. 2022, 127, e2021JD035433. [Google Scholar] [CrossRef]
  10. Bedaso, Z.; Wu, S.Y. Daily precipitation isotope variation in Midwestern United States: Implication for hydroclimate and moisture source. Sci. Total Environ. 2020, 713, 136631. [Google Scholar] [CrossRef]
  11. Sun, C.; Chen, W.; Chen, Y.; Cai, Z. Stable isotopes of atmospheric precipitation and its environmental drivers in the Eastern Chinese Loess Plateau, China. J. Hydrol. 2020, 581, 124404. [Google Scholar] [CrossRef]
  12. Birkel, C.; Soulsby, C.; Tetzlaff, D.; Dunn, S.; Spezia, L. High-frequency storm event isotope sampling reveals time-variant transit time distributions and influence of diurnal cycles. Hydrol. Process. 2012, 26, 308–316. [Google Scholar] [CrossRef]
  13. Xu, T.; Sun, X.; Hong, H.; Wang, X.; Cui, M.; Lei, G.; Gao, L.; Liu, J.; Lone, M.A.; Jiang, X. Stable isotope ratios of typhoon rains in Fuzhou, Southeast China, during 2013–2017. J. Hydrol. 2019, 570, 445–453. [Google Scholar] [CrossRef]
  14. Chang, X.; Zhang, X.; Liu, Z.; Wang, R. Differences in stable isotopes in precipitation between day and night: A case study of Changsha. Trop. Geogr. 2021, 41, 635–644. [Google Scholar]
  15. Ichiyanagi, K.; Suwarman, R.; Belgaman, H.A.; Tanoue, M.; Uesugi, T. Diurnal variation of stable isotopes in rainfall observed at Bengkulu for the YMC-Sumatra 2017. IOP Conf. Ser. Earth Environ. Sci. 2019, 303, 012008. [Google Scholar] [CrossRef]
  16. Graf, P.; Wernli, H.; Pfahl, S.; Sodemann, H. A new interpretative framework for below-cloud effects on stable water isotopes in vapour and rain. Atmos. Chem. Phys. 2019, 19, 747–765. [Google Scholar] [CrossRef]
  17. Salamalikis, V.; Argiriou, A.A.; Dotsika, E. Isotopic modeling of the sub-cloud evaporation effect in precipitation. Sci. Total Environ. 2016, 544, 1059–1072. [Google Scholar] [CrossRef] [PubMed]
  18. Crawford, J.; Hollins, S.E.; Meredith, K.T.; Hughes, C.E. Precipitation stable isotope variability and subcloud evaporation processes in a semi-arid region. Hydrol. Process. 2017, 31, 20–34. [Google Scholar] [CrossRef]
  19. Wang, S.; Zhang, M.; Che, Y.; Zhu, X.; Liu, X. Influence of below-cloud evaporation on deuterium excess in precipitation of arid central Asia and its meteorological controls. J. Hydrometeorol. 2016, 17, 1973–1984. [Google Scholar] [CrossRef]
  20. Chen, H.; Chen, Y.; Li, D.; Li, W. Effect of sub-cloud evaporation on precipitation in the Tianshan Mountains (Central Asia) under the influence of global warming. Hydrol. Process. 2020, 34, 5557–5566. [Google Scholar] [CrossRef]
  21. Sun, C.; Chen, Y.; Li, J.; Chen, W.; Li, X. Stable isotope variations in precipitation in the northwesternmost Tibetan Plateau related to various meteorological controlling factors. Atmos. Res. 2019, 227, 66–78. [Google Scholar] [CrossRef]
  22. Li, Z.; Feng, Q.; Wang, Y.; Li, J.; Guo, X.; Li, Y. Effect of sub-cloud evaporation on the δ18O of precipitation in Qilian Mountains and Hexi Corridor, China. Sci. Cold Arid Reg. 2018, 8, 378–387. [Google Scholar]
  23. Sun, X.; Ren, G.; You, Q.; Ren, Y.; Xu, W.; Xue, X.; Zhan, Y.; Zhang, S.; Zhang, P. Global diurnal temperature range (DTR) changes since 1901. Clim. Dyn. 2019, 52, 3343–3356. [Google Scholar] [CrossRef]
  24. Sharifnezhadazizi, Z.; Norouzi, H.; Prakash, S.; Beale, C.; Khanbilvardi, R. A global analysis of land surface temperature diurnal cycle using MODIS observations. J. Appl. Meteorol. Climatol. 2019, 58, 1279–1291. [Google Scholar] [CrossRef]
  25. Wang, S.; Jiao, R.; Zhang, M.; Crawford, J.; Hughes, C.E.; Chen, F. Changes in below-cloud evaporation affect precipitation isotopes during five decades of warming across China. J. Geophys. Res. Atmos. 2021, 126, e2020JD033075. [Google Scholar] [CrossRef]
  26. Wang, L.; Wang, S.; Zhang, M.; Duan, L.; Xia, Y. An hourly-scale assessment of sub-cloud evaporation effect on precipitation isotopes in a rainshadow oasis of northwest China. Atmos. Res. 2022, 274, 106202. [Google Scholar] [CrossRef]
  27. Li, Y.; Zhang, D.; Andreeva, M.; Li, Y.; Fan, L.; Tang, M. Temporal-spatial variability of modern climate in the Altai Mountains during 1970–2015. PLoS ONE 2020, 15, e0230196. [Google Scholar] [CrossRef]
  28. Malygina, N.; Papina, T.; Kononova, N.; Barlyaeva, T. Influence of atmospheric circulation on precipitation in Altai Mountains. J. Mount. Sci. 2017, 14, 46–59. [Google Scholar] [CrossRef]
  29. Huang, X.; Peng, W.; Rudaya, N.; Grimm, E.C.; Chen, X.; Cao, X.; Zhang, J.; Pan, X.; Liu, S.; Chen, C.; et al. Holocene vegetation and climate dynamics in the Altai Mountains and surrounding areas. Geophys. Res. Lett. 2018, 45, 6628–6636. [Google Scholar] [CrossRef]
  30. Zhang, D.; Chen, L.; Feng, Z.; Ran, M.; Yang, Y.; Zhang, Y.; Liu, Q. Four peat humification-recorded Holocene hydroclimate changes in the southern Altai Mountains of China. Holocene 2021, 31, 1304–1314. [Google Scholar] [CrossRef]
  31. Zhang, W.; Shen, Y.; Chen, A.A.; Wu, X. Opportunities and challenges arising from rapid cryospheric changes in the southern Altai Mountains, China. Appl. Sci. 2022, 12, 1406. [Google Scholar] [CrossRef]
  32. Li, Z.; Feng, Q.; Li, Z.; Yuan, R.; Gui, J.; Lv, Y. Climate background, fact and hydrological effect of multiphase water transformation in cold regions of the Western China: A review. Earth Sci. Rev. 2019, 190, 33–57. [Google Scholar]
  33. Chen, Y.; Li, Z.; Fang, G.; Li, W. Large hydrological processes changes in the transboundary rivers of Central Asia. J. Geophys. Res. Atmos. 2018, 123, 5059–5069. [Google Scholar] [CrossRef]
  34. Yao, J.; Chen, Y.; Guan, X.; Zhao, Y.; Chen, J.; Mao, W. Recent climate and hydrological changes in a mountain–basin system in Xinjiang, China. Earth Sci. Rev. 2022, 226, 103957. [Google Scholar] [CrossRef]
  35. Tian, L.; Yao, T.; MacClune, K.; White, J.W.C.; Schilla, A.; Vaughn, B.; Vachon, R.; Ichiyanagi, K. Stable isotopic variations in west China: A consideration of moisture sources. J. Geophys. Res. 2007, 112, D10112. [Google Scholar] [CrossRef]
  36. Malygina, N.S.; Eirikh, A.N.; Kurepina, N.Y.; Papina, T.S. Isotopic composition of precipitation in Altai foothills: Observation and interpolation data. Bull. Tomsk Polytech. Univ. Geo Assets Engine 2019, 330, 44–54. [Google Scholar]
  37. Liu, J.; Song, X.; Yuan, G.; Sun, X.; Yang, L. Stable isotopic compositions of precipitation in China. Tellus B Chem. Phys. Meteorol. 2014, 66, 22567. [Google Scholar] [CrossRef]
  38. Chen, X. Physical Geography of Arid Land in China; Science Press: Beijing, China, 2010; pp. 1–801. [Google Scholar]
  39. Stewart, M.K. Stable isotope fractionation due to evaporation and isotopic exchange of falling waterdrops: Applications to atmospheric processes and evaporation of lakes. J. Geophys. Res. 1975, 80, 1133–1146. [Google Scholar] [CrossRef]
  40. Froehlich, K.; Kralik, M.; Papesch, W.; Rank, D.; Scheifinger, H.; Stichler, W. Deuterium excess in precipitation of Alpine regions—Moisture recycling. Isot. Environ. Health Stud. 2008, 44, 61–70. [Google Scholar] [CrossRef] [PubMed]
  41. Majoube, M. Fractionnement en oxygène 18 et en deutérium entre l’eau et sa vapeur. J. Chim. Phys. 1971, 68, 1423–1436. [Google Scholar] [CrossRef]
  42. Best, A.C. The size distribution of raindrops. Q. J. R. Meteorol. Soc. 1950, 76, 16–36. [Google Scholar] [CrossRef]
  43. Han, Y.; Guo, J.; Li, H.; Chen, T.; Guo, X.; Li, J.; Liu, L.; Shi, L. Investigation of raindrop size distribution and its potential influential factors during warm season over China. Atmos. Res. 2022, 275, 106248. [Google Scholar] [CrossRef]
  44. Zeng, Y.; Yang, L.; Zhou, Y.; Tong, Z.; Jiang, Y.; Chen, P. Characteristics of orographic raindrop size distribution in the Tianshan Mountains, China. Atmos. Res. 2022, 278, 106332. [Google Scholar] [CrossRef]
  45. Jiang, Y.; Yang, L.; Zeng, Y.; Tong, Z.; Li, J.; Liu, F.; Zhang, J.; Liu, J. Comparison of summer raindrop size distribution characteristics in the western and central Tianshan Mountains of China. Meteorol. Appl. 2022, 29, e2067. [Google Scholar] [CrossRef]
  46. Zeng, Y.; Yang, L.; Zhang, Z.; Tong, Z.; Li, J.; Liu, F.; Zhang, J.; Jiang, Y. Characteristics of clouds and raindrop size distribution in Xinjiang, using cloud radar datasets and a disdrometer. Atmosphere 2020, 11, 1382. [Google Scholar] [CrossRef]
  47. Kinzer, G.D.; Gunn, R. The evaporation, temperature and thermal relaxation-time of freely falling waterdrops. J. Meteorol. 1951, 8, 71–83. [Google Scholar] [CrossRef]
  48. Best, A.C. Empirical formulae for the terminal velocity of water drops falling through the atmosphere. Q. J. R. Meteorol. Soc. 1950, 76, 302–311. [Google Scholar] [CrossRef]
  49. Rugenstein, J.K.C.; Chamberlain, C.P. The evolution of hydroclimate in Asia over the Cenozoic: A stable-isotope perspective. Earth Sci. Rev. 2018, 185, 1129–1156. [Google Scholar] [CrossRef]
  50. Jiang, J.; Zhou, T.; Wang, H.; Qian, Y.; Noone, D.; Man, W. Tracking moisture sources of precipitation over central Asia: A study based on the water-source-tagging method. J. Clim. 2020, 33, 10339–10355. [Google Scholar] [CrossRef]
  51. Peng, D.; Zhou, T.; Zhang, L. Moisture sources associated with precipitation during dry and wet seasons over Central Asia. J. Clim. 2020, 33, 10755–10771. [Google Scholar] [CrossRef]
  52. Zhu, L.; Ma, G.; Zhang, Y.; Wang, J.; Tian, W.; Kan, X. Accelerated decline of snow cover in China from 1979 to 2018 observed from space. Sci. Total Environ. 2022, 814, 152491. [Google Scholar] [CrossRef]
  53. Tan, X.; Wu, Z.; Mu, X.; Gao, P.; Zhao, G.; Sun, W.; Gu, C. Spatiotemporal changes in snow cover over China during 1960–2013. Atmos. Res. 2019, 218, 183–194. [Google Scholar]
  54. Burnik Šturm, M.; Ganbaatar, O.; Voigt, C.C.; Kaczensky, P. First field-based observations of δ2H and δ18O values of event-based precipitation, rivers and other water bodies in the Dzungarian Gobi, SW Mongolia. Isot. Environ. Health Stu. 2017, 53, 157–171. [Google Scholar] [CrossRef]
  55. Michelsen, N.; van Geldern, R.; Roßmann, Y.; Bauer, I.; Schulz, S.; Barth, J.A.; Schüth, C. Comparison of precipitation collectors used in isotope hydrology. Chem. Geol. 2018, 488, 171–179. [Google Scholar] [CrossRef]
  56. Von Freyberg, J.; Knapp, J.L.; Rücker, A.; Studer, B.; Kirchner, J.W. Evaluation of a low-cost evaporation protection method for portable water samplers. Hydrol. Earth Syst. Sci. 2020, 24, 5821–5834. [Google Scholar] [CrossRef]
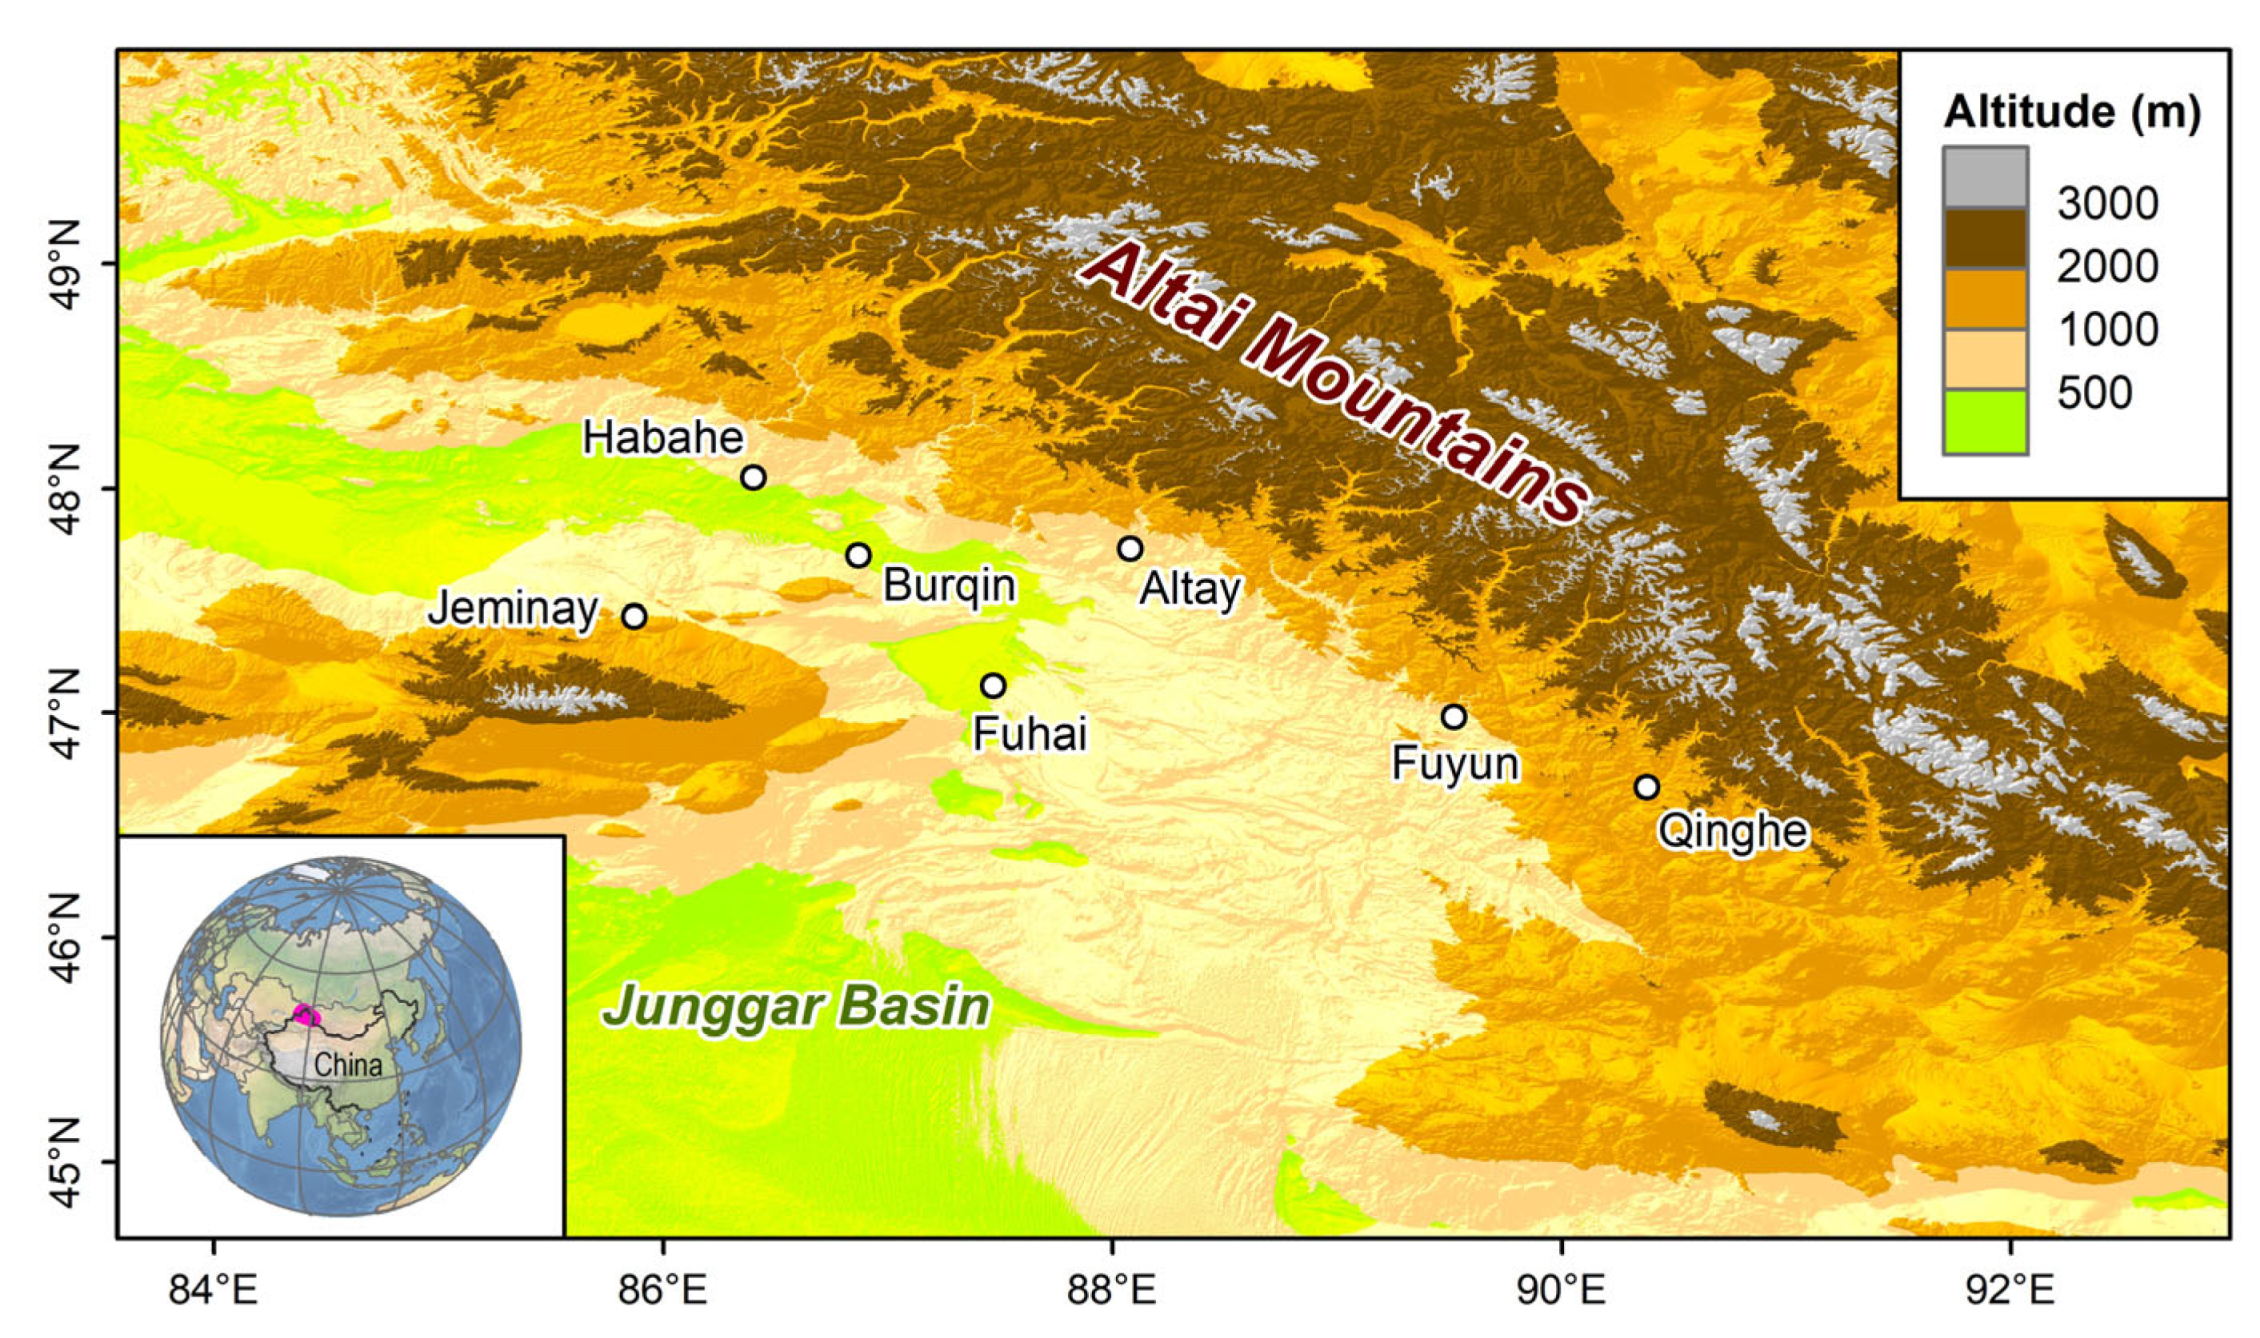
Figure 1. Locations of meteorological stations on the southern slope of the Altai Mountains. This region is marked in magenta on the small map.
Sustainability 14 10013 g001
Figure 2. Box plots showing the diurnal variations of air temperature (a) and relative humidity (b) for all hours and precipitation hours. The top and bottom of the boxes indicate the 25th and 75th percentiles, and the line within indicates the 50th; the error bars indicate the 90th and 10th, and the diamonds outside indicate the 95th and 5th.
Sustainability 14 10013 g002
Figure 3. Diurnal variations of air temperature (a), relative humidity (b), precipitation probability (c) and precipitation intensity (d) for each season.
Sustainability 14 10013 g003
Figure 4. Diurnal variations of changes in δ18O (a), δ2H (b) and d (c) in precipitation. The insert plots show the diurnal variations of precipitation-weighted means for each season.
Sustainability 14 10013 g004
Figure 5. Relationship between Δd and remaining fraction (f) during daytime (ad) and nighttime (eh) for each season. The dashed vertical line denotes the median remaining fraction.
Sustainability 14 10013 g005
Figure 6. Relationship between Δd and air temperature (t) during daytime (ad) and nighttime (eh) for each season. The dashed vertical line denotes the median air temperature.
Sustainability 14 10013 g006
Figure 7. Relationship between Δd and relative humidity (h) during daytime (ad) and nighttime (eh) for each season. The dashed vertical line denotes the median of relative humidity.
Sustainability 14 10013 g007
Figure 8. Diurnal variations of changes in Δd to different scenarios of air temperature (a) and relative humidity (b).
Sustainability 14 10013 g008
Figure 9. Diurnal variations of (a) the proportional contribution of different precipitation intensity ranges and (b) the recalculated Δd without small or large precipitation intensity.
Sustainability 14 10013 g009
Table 1. Locations of meteorological stations and long-term climatologies (T—air temperature, and P—annual precipitation [38]) on the southern slope of the Altai Mountains.
StationLatitude (°N)Longitude (°E)Altitude (m)T (°C)P (mm)
Jeminay47.4385.879844.0203.3
Habahe48.0586.405334.7179.0
Burqin47.7086.874744.5133.8
Fuhai47.1287.475014.0119.6
Altay47.7388.087354.0180.8
Fuyun46.9889.528082.7183.9
Qinghe46.6790.3812180.5167.8
Table 2. Changes in precipitation-weighted mean δ18O, δ2H and d in precipitation during daytime and nighttime.
SeasonΔδ18O (‰)Δδ2H (‰)Δd (‰)
DaytimeNighttimeAllDaytimeNighttimeAllDaytimeNighttimeAll
MAM2.80.91.810.63.47.1−11.6−3.5−7.7
JJA2.51.42.19.05.27.6−10.9−6.1−9.0
SON1.10.60.84.42.33.3−4.5−2.3−3.5
DJF0.00.00.00.10.00.1−0.10.0−0.1
Annual1.90.81.47.23.25.4−8.2−3.5−6.1
Publisher’s Note: MDPI stays neutral with regard to jurisdictional claims in published maps and institutional affiliations.