Article

IoT Based Automatic Diagnosis for Continuous Improvement

1
Instituto Superior Técnico, Universidade de Lisboa, 1049-001 Lisboa, Portugal
2
EfficiencyRising, Lda, Erising, 1800-082 Lisboa, Portugal
3
INESC-ID, Instituto Superior Técnico, Universidade de Lisboa, 1049-001 Lisboa, Portugal
4
IDMEC, Instituto Superior Técnico, Universidade de Lisboa, 1049-001 Lisboa, Portugal
*
Author to whom correspondence should be addressed.
Sustainability 2022, 14(15), 9687; https://doi.org/10.3390/su14159687
Submission received: 1 July 2022 / Revised: 3 August 2022 / Accepted: 4 August 2022 / Published: 6 August 2022
(This article belongs to the Section Waste and Recycling)

Abstract

:
This work responds to the gap in integrating the Internet-of-Things in Continuous Improvement processes, especially to facilitate diagnosis and problem-solving activities regarding manufacturing workstations. An innovative approach, named Automatic Detailed Diagnosis (ADD), is proposed: a non-intrusive, easy-to-install and use, low-cost and flexible system based on industrial Internet-of-Things platforms and devices. The ADD requirements and architecture were systematized from the Continuous Improvement knowledge field, and with the help of Lean Manufacturing professionals. The developed ADD concept is composed of a network of low-power devices with a variety of sensors. Colored light and vibration sensors are used to monitor equipment status, and Bluetooth low-energy and time-of-flight sensors monitor operators’ movements and tasks. A cloud-based platform receives and stores the collected data. That information is retrieved by an application that builds a detailed report on operator–machine interaction. The ADD prototype was tested in a case study carried out in a mold-making company. The ADD was able to detect time performance with an accuracy between 89% and 96%, involving uptime, micro-stops, and setups. In addition, these states were correlated with the operators’ movements and actions.

1. Introduction

Competitiveness determines a company’s survival in the market, and companies that adhere to Lean Manufacturing (LM) practices have assumed competitive positions at a global level [1]. The LM approach focuses on delivering value to the customer and reducing waste [2]. Through Continuous Improvement (CI), one of the foundations of LM, the constant elimination of waste is achieved (activities that do not add value) [3], and the constant search for process efficiency improvement is implemented [4]. CI professionals are responsible for helping organizations identify the inefficiencies’ root causes in the production process, and implementing solutions to eliminate waste. Starting from holistic analyses of the current situation of the production system (derived from Key Process Indicators (KPI) monitoring and/or overall performance mapping, using, e.g., Value Stream Mapping), a detailed diagnosis of the identified critical activity or KPI is usually required for a CI project [5]. This detailed diagnosis involves the presence of the CI team in the Gemba (the place where the action occurs) for a couple of hours, to observe and acquire data about machine activity and operators’ movements and actions, matching it with machine states, as well as collecting distance run by the operators, task times, etc. In this work, this diagnosis will be referred to as Detailed Diagnosis (DD) for the CI project. The DD is crucial in almost all problem-solving projects, as the way to obtain specific data, information, and knowledge for the root cause analysis phase. Traditionally, the DD for CI projects is done through stop-watch analysis and “pen&paper” logic, disregarding the level of digitalization of the production process [6,7].
Several authors consider that the impact and importance of LM and CI will be increasingly relevant if associated with the 4th Industrial Revolution or Industry 4.0 (I4.0) [8,9]. The I4.0 is premised on a highly technological integration of information and communication technologies (ICT) [10], using sensors and the Industrial Internet of Things (IIoT), to acquire equipment and system data, processing it with smart devices and intelligent algorithms, and using it to depict performance, plan and predict. I4.0 is often referred to as generating greater productivity [4], revenue growth, jobs, and investments [11], and more flexible and customizable processes [12,13]. In recent years the concept of Lean 4.0 has been used by several authors, proving that despite their different origins, I4.0 raises the potential of LM (and vice versa), since the combination of the two methods leads to an increase in productivity, profitability, and competitiveness [4,14].
Another recent trend with case studies already published is the merging between LM and Green Manufacturing, generally referred to as Lean & Green Manufacturing (L&G) [15,16,17]. L&G is an approach that integrates the search for operational efficiency and effectiveness of LM with the resources’ efficiency and environmental impact concerns of Green Manufacturing, leveraging L&G as a sustainability pillar within an organization [17]. In addition, several authors point out that L&G is only viable in an I4.0 context due to the massive amounts of data needed to acquire and process information [4,16,18]. Therefore, this evolution of LM is certainly in line with the already defined Industry 5.0. Despite there being no publications on Lean 5.0 yet, following the European Union’s definition of Industry 5.0 [19], one can find a link and even synergies between L&G concepts and Industry 5.0 that foster the placement of the human being at the center of a more sustainable and resilient industry, in which operators work in symbiosis with machines for the evolution of processes [19,20].
Despite the potential and alignment of LM, L&G, and CI with I4.0, and even with Industry 5.0, there are still unexplored areas. On the one hand, there are nowadays a significant number of companies where digitalization is fully implemented and where some aspects of LM are also integrated. Based on the literature, those stages can be summarized as follows: there is an IIoT platform integrated with an equipment sensor where data are acquired and processed to obtain and monitor production variables and KPI; Manufacturing Execution Systems (MESs) allow production control, parameters regulation, and visualization, often supported by digital Visual Management logics. This context allows not only the adoption of good LM practices, but also the digitization of Lean tools such as Kanban, VSM, Jidoka, digitally assisted assembly cells, and the holding of daily meetings with digital whiteboards with real-time KPIs [7,21,22,23,24,25,26]. On the other hand, and despite this level of digitalization and Lean 4.0 integration, when consistent abnormal KPI behavior is detected (e.g., KPI variability or trend, usually called a “problem” in CI lexicon), companies continue to resort to a traditional way of applying problem-solving on a CI project [27,28], as described before. Therefore, whatever the digitalization level, the DD is still done through the traditional way (application of the Methods and Times Study), based on filming and/or direct observation of the workplace (machine/operator) [29,30,31,32]. In fact, despite the high levels of digitalization, essential data and information are required for the problem-solving phase of a CI project that are not available, meaning this is an unexplored area.
This paper presents the concept of Automatic DD (ADD) to address this gap: an I4.0 technologies-based solution, mainly IIoT and sensors, to automatically perform the DD of a manufacturing workstation (operator–machine) and to support the CI teams in problem-solving projects. The proposed ADD concept and application example provided in this study involve the development of a system that has the following characteristics, which make it useful to the CI team: (i) to be robust and accurate—the devices to be used must be able to monitor a set of operators–machines (workstations) supporting the DD objective of solving an abnormal KPI or problem; (ii) to be flexible—be easily transferable from one workstation to another after finding the root causes (e.g., after one or two weeks, according to problem-solving needs); (iii) to be non-intrusive—devices should not depend on access to the equipment’s programmable logic controller (PLC), or on complex and proprietary connections from manufacturers, as their cost is generally extremely high and without an acceptable pay-back period; (iv) to be easy to install—they must allow quick and easy installation from one workstation to another, in order to minimize the effort and avoid dependence on ICT and electronic skills, which are usually not present in the CI teams; (v) to have low acquisition costs—being a non-permanent system and always with some experimental character to guarantee flexibility, it must have a low cost. All these five characteristics encompass the premises of a leaner and greener industry, which is more resilient, in a more robust social environment. Thus, in this study, a validation of the ADD is proposed, where the applicability and universality of the concept are demonstrated, and field tests are carried out to validate it.
Section 2 presents the definition and the main variables that act for the realization of a DD. By framing the existing publications on LM, L&G, CI, and I4.0, it is possible to identify the potential for synergies and impact between these concepts and DD itself, and especially I4.0 as a facilitating factor for an ADD, making it possible to obtain a prototype that meets the needs of a Lean professional in the exercise of their work. In Section 3, the requirements and architecture of the proposed ADD concept are systematized, based on the opinion of CI professionals integrated with findings from the literature survey. Section 4 presents a prototype that was developed to test the proposed ADD concept. It starts from a set of modular devices with IIoT functionalities, which were previously tested and then applied in the industrial environment in a non-intrusive, flexible, and low-cost way. After obtaining and processing the data, the results are compared with data collected by the company itself, to measure the reliability of the prototype developed.

2. Literature Review

2.1. Detailed Diagnosis of Manufacturing Workstations

CI professionals help organizations to overcome efficiency problems by finding the root causes of problems (performance and KPI’s abnormal behavior) and implementing, most often, Lean-based solutions to increase productivity [5,33,34]. When a problem arises (a systematic deviation that implies significant variability and/or a tendency towards the target value established for a KPI) [21,22], a study of the situation is necessary to understand currently used procedures and to find the problem’s root causes: a specific DD is required. A DD relies on observations, data collection, and measurements of processes, people, and the machine–operator relationship [30,35]. The traditional way to obtain a DD is based on methods and a time-consuming study, with filming or/and direct observation of the workstation (machine/operator), done by the CI professionals, consuming considerable time, or limiting the analyzed time via the lack of resources (or intentionally to minimize cost) [7,29,36]. Some authors emphasize the specificity of the DD for CI since it requires, besides the equipment status, the acquisition of information regarding the operator’s interaction with equipment, movements of operators, and transports originated by them [31,37].
This need for specific observation and measurement defines the type of data necessary for a DD. In a non-exhaustive way, in a DD for CI it is necessary to collect information regarding the location of the operator in the various stages of the process, and the various states of the machines (operation, setup, micro-stops, waiting times, among others); is also necessary to know the duration of these phases and states, and, in some cases, the distance traveled by the operators and the time spent in each location [38,39,40]. These collected data allow for detailing the availability, the performance, and the quality of the performance. A detailed understanding of the parcels of the Overall Equipment Effectiveness (OEE) for the equipment under analysis will help in finding the root causes that lead to the solution [40]. These parcels include the setup activities, maintenance activities, micro-stops, and waiting times, among others. Additional information may include the total energy consumption in each step of the process, the consumption of raw material, the energy consumption per setup time (determining the energy that does not add value to the product), and the relationship between the consumption of raw material and the number of non-conformities (material/energy waste indicator). This will allow operational and environmental performance analyses in an L&G logic [16].
A typical DD report to support problem-solving in a CI project is summarized in Figure 1, even though this has to be built using data collected manually (including the machine and/or operator timeline). Lean-related tools are often used to help CI professionals to communicate the results of the DD, such as (i) the Yamazumi chart, showing the total cycle time for each operator when executing a process in the production flow [41,42]; (ii) the Spaghetti Diagram, showing the physical movement of a “work object” through the processes defining the start and end value in the value stream [43]; (iii) an operator–machine chart depicting the relation of the operator movements to the machine status [44]. A DD report created by a CI Team, such as the one shown in Figure 1, can require several days of stop-watch analysis, following the operator on the shop floor and identifying the ongoing tasks for several hours, and inputting data into the computer and elaborating graphs.
The specificity of DD for CI and the fact that is only required when a performance problem is detected are the logical reasons to keep this data acquisition off of the digitalization platform of a production system [35,45]. Nevertheless, the time consumed by the CI professionals might be several days for a unique problem-solving project; to avoid this time (and cost), the user may employ a DD with very limited information (causing a poorer root cause analysis) [27,28].

2.2. Lean Manufacturing, Lean&Green, and Industry 4.0

The designation LM was first used by John Krafick, a researcher at the Massachusetts Institute of Technology, in a publication to refer to the Toyota Production System (TPS) [2]. The TPS was conceived with a focus on reducing waste to increase the competitiveness of the company based on the CI and a set of principles, methods, and tools, summarized in the House of TPS [45]. In this model, the base is the principles, the pillars are the means and tools to be used, and the roof is the result one wants to achieve. CI is positioned at the center of the pillars, meaning that TPS has the empowerment of people as its epicenter. Some authors put the people themselves at the center of the house [23,46], making it explicit how the culture of sustained improvement involves and depends on people [47].
In addition to the search for production output, operational CI, and waste reduction, several authors mention, mainly after 2000, that competitive industries need to pay attention to environmental and social concerns [17]. Other approaches, when combined with LM, can have a great positive impact, such as “Green Manufacturing” methodologies, with environmentally oriented actions, which help to reduce environmental impacts [15]. L&G represents LM evolution, acting in the direction of mapping and quantifying operations that consume unnecessary time and resources (materials, energy, consumables, etc.), and seeking the continuous improvement of these processes [16,18]. L&G’s dependence on a large amount of data, as referred to by several authors [15,48,49], makes the raising of I4.0 the proper time for L&G implementation [16,17]. When implemented, L&G becomes a pillar of sustainable development within a company, also contributing to and being a part of the transition to I4.0 [15,17], and I5.0 soon after. In this way, the Twin Transition, also called the Digital Circular Economy, is sought, in which integrated solutions with a technological and sustainable bias are pursued, favoring the optimization of resources that are essential for the planet [50,51].
I4.0 is a paradigm that introduces a new perspective on how manufacturing can be enhanced with new technologies to improve process and resources efficiency, and reduce waste [52], with some authors concluding that I4.0 technological solutions came to increase the level of competitiveness through the convergence between the physical and digital worlds [8,9]: the manufacturing process becomes intelligent, flexible, adapted and optimized, with data integration, including cloud/intranet, service-orientation and interoperability (the ability of two systems to exchange data and share information and knowledge) [10,53]. With no unanimity among authors, a very common classification identifies the nine technologies described in Table A1 in Appendix A as the enablers or drivers of I4.0 [11,51,54].
According to Kamble et al. [55], a smart manufacturing system benefits from the contribution of three major technologies: a cyber–physical system (CPS), cloud computing, and the Internet-of-Things (IoT). In an industrial context, several CPSs communicate and interact, forming a cyber–physical production system (CPPS)—the smart production system. The communication among CPS, and the integration with physical computational entities (machines, robots, sensors, etc.) associated with human decisions, is done by the IIoT system, which makes the smart production process autonomous and intelligent, being able to decide and trigger human actions [56]. Adding all these factors together with cloud computing, Big Data and Analytics, and conventional systems makes it possible to create Smart Factories [55,57].
Several authors discuss the interdependence of LM and I4.0 to implement both successfully [23,58]. Understanding how this can be accomplished has been the focus of several researchers, making it clear that LM, or even L&G, and I4.0 have common goals, and the I4.0-based smart factory needs L&G approaches, and vice versa, to increase social, operational and resources efficiency and effectiveness [8,14,24,59,60], with human factors having a huge relevance in this accomplishment [61]. The next section helps to understand the specific relevance of several I4.0 technologies to integration with LM and L&G, including CI.

2.3. The Relevance of IoT in the Detailed Diagnosis for Continuous Improvement

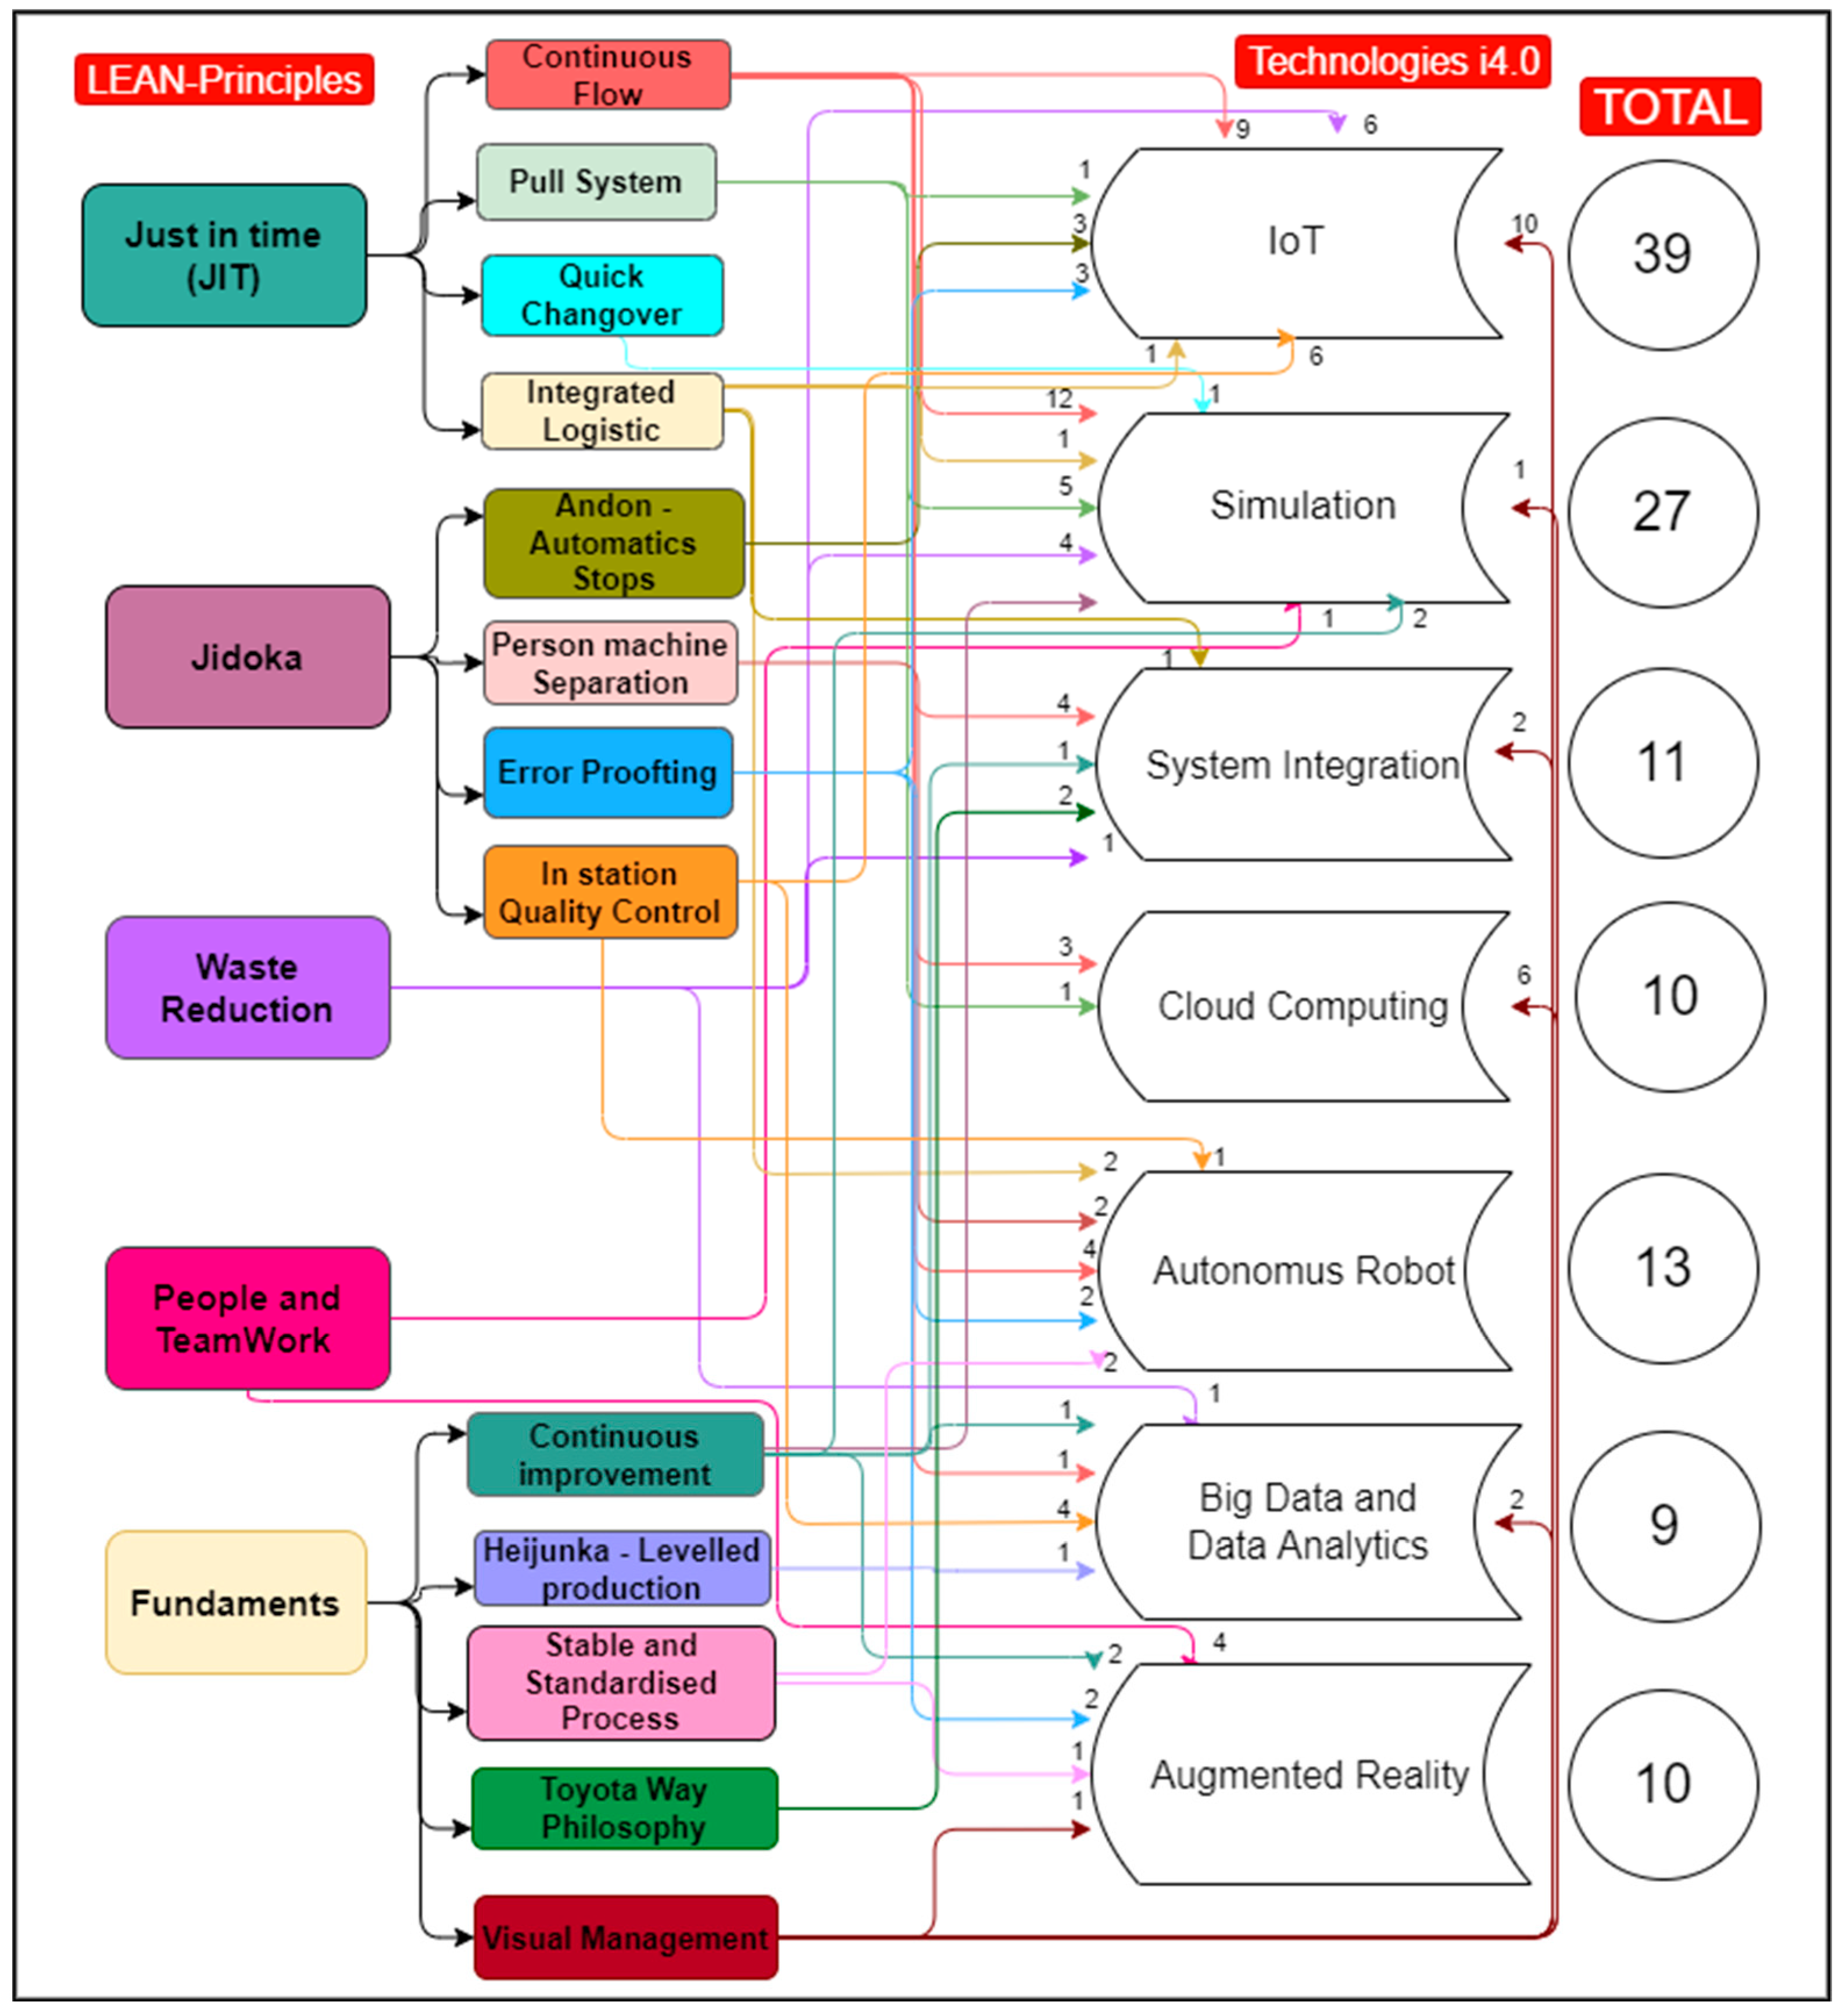
Aiming to deepen the analysis of the correlation between the pillars of LM and the technologies of I4.0, a comprehensive study was performed, and some articles with systematic reviews on the subject were found. In 2017, Wagner et al. [62] presented a study that points out the correlations between I4.0 technologies and Lean principles, by means of an impact matrix. The article presents a practical case study that shows that I4.0 applied in Just-in-Time (JIT) delivery helps to support and stabilize LM based on the integration of Big Data, Data Analytics, and Machine to Machine (M2M). Later, Rosin et al. [58] presented a study based on 115 papers published in the SCOPUS and Google Scholar search engines, dated until the end of 2019. This work correlates the I4.0 technologies with Lean principles and methods. Based on the publication list of Rosin et al. [58], a pictogram (Figure 2) was built by the authors of the current study to easily understand, based on the published documents, the level of relevance of the several I4.0 technologies to the Lean principles and methods.. From the numbers presented in the circles, there is a strong correlation between the I4.0 technologies in Lean pillars, with the most impactful being IoT technology, with 39 connections. This result expresses the versatility and utility of IoT in I4.0, which is presented in several papers, such as those by Okano et al. [63] and Peralta et al. [64].
Remaining on the topic of the article by Rosin et al. [58], in the broader context of LM, IoT aims at the vertical integration of systems between suppliers and customers to facilitate the identification and sharing of the value delivered to the customer [3]. With regard specifically to the principles, the use of IoT in JIT makes it possible to track products in real-time and send production progress data [14,62]. The joint effort of IoT and visual management to democratize information and popularize knowledge leads to a presentation of the collected data in a way that is visually accessible to those involved [23,65]. Regarding the Pull System, IoT helps in the synchronization of workstations and contributes to the better use of Kanbans, enabling its digitization and de-materialization [14,23,66]. Jidoka, also known as the LM’s autonomation pillar, employs the strong influence of IoT combined with technologies such as Big Data and Autonomous Robots to perform quality control in real-time, through error detection and correction, and defect trend identification [58]. In the reduction of waste, the IoT can be used for real-time product tracking, reducing unnecessary transport [23,66,67]. Despite these relevant impacts of IoT, Rosin et.al. [58] concluded that it does not have a significant expression in the pillars of Continuous Improvement and People and Work Teams. In these more human-centered pillars, the most active I4.0 technologies are Virtual Reality (VR) and Augmented Reality (AR) in the context of facilitating training with visual interfaces [68]. Since problem-solving projects are integrated into continuous improvement, there is a clear gap in the use of IoT technologies for traditional problem-solving, which reinforces the importance of this study.
In 2020, Gallo et al. [8] used a compilation of 25 papers created by searching for the keywords “Industry 4.0” and “Lean production” on the SCOPUS and Web of Science platforms. Only papers written in British English were selected, excluding papers from geographic origins such as North America and Oceania, and in this way the authors justified the low number of articles as a result of the research. The paper aimed at identifying which I4.0 tools can be implemented in LM, and which ones can contribute to the greater success of this methodology. Technologies such as IoT, Big Data, Robotic, CPS, and Cloud Computing were cited, and IoT and Big Data were classified as “basic tools”, essential for promoting greater flexibility and competitiveness. The IoT tool is present in 61% of the papers, and Big Data appears in 50%. Narula et al. [69] showed data indicating that cloud manufacturing, simulation, IIoT, and horizontal and vertical integration impact 100% of Lean tools, while cybersecurity and big data analytics impact 93% of Lean tools. These data indicate that the IoT has reached a prominent position compared to other technologies, due to its vast field of application and versatility.
Another element strongly cited in Gallo et al. [8] is the attention to the human factor. Despite talking about tools and technologies, he argues that innovation is not supported without the human factor, and integration between the parties needs to happen to generate a favorable social environment for the implementation of technologies, which is very much in line with the proposal of Industry 5.0, and once again reiterates the importance of the present study.
To gain an updated view of the importance of IoT in LM, a specific search was carried out in this study on the SCOPUS platform with the words “IoT” OR “IIoT” OR “Internet of Things” OR “Industrial Internet of Things” AND “Lean Manufacturing” inserted in the title, key word and abstract fields, focusing on articles in the period between 2021 to 2022, because the period before 2020 has already been covered in the other articles. Twelve papers were found, and it was noted that they can be classified into two large groups: (i) six of them position IoT in a generic way as one of the technologies of I4.0, and (ii) six of them describe specific IoT applications in the Lean realm. The first group of papers confirms a solid future for Lean 4.0, where IoT is essential, [69,70], but they do not give special attention to this discussion since they mostly focus on a general analysis of IIoT’s relevance to LM development [71,72,73,74]. Four of the latter six publications offer no specific insights about CI, presenting applications of IoT to facilitate the performance monitoring of a production system [75], the planning of manufacturing and maintenance tasks [9], the management of autonomous guided vehicles, the assembly assistance of virtual reality [34,76,77] and other types of production automation [78], and the better understanding and vision of the supply chain [79]. One of the publications even states that all LM methods, except CI, benefit from greater effectiveness when combining them with the IoT [61]. The closest reference to the IoT’s impact on CI in this set of papers is made by Lu et al. [80], proposing the integration of IoT with the EVA simulation framework (Efficiency Validate Analysis) to build up a digital twin-enabled VSM approach, which can be considered to support the CI projects, but without relating it with problem-solving projects.
Therefore, based on previously published literature surveys on LM and L&G together with I4.0 technologies, and on the survey done in this study, no specific research was found exploring the application of those technologies in the DD to CI projects. This enhances the purpose of the current study, enabling it to cover the gap that was also identified by other authors [24,27,81].

2.4. IoT-Related Devices Availability

Conscious of the absence of publications regarding the application of IoT to DD for CI, the authors decided to include an analysis of the existing devices and components in the IoT realm that are already used to execute part of the data acquisition and information processing necessary to perform a DD (see Section 2.1).
The IIoT has many areas of application, focusing mainly on Asset Tracking, Predictive Maintenance, Security Monitoring, and Machine Monitoring/Performance, the latter being the area most related to the support of DD. The specific needs of an industrial environment demand several characteristics of IIoT devices: mechanical robustness, electromagnetic protection, electrical supply integrity (voltage drops), the guarantee of signal integrity, and cybersecurity soundness [82].
A comparative market analysis of available IIoT-related devices and products was carried out in Table A2 in Appendix A, identifying its features and types of sensors. The most common built-in sensors aim at measuring temperature and humidity, power and energy, pressure, acceleration, magnetic field, and light. In some of the devices, interesting features can be found: quick and non-intrusive installation (Plug & Play solutions, for example, magnets, stickers); a simple web interface and cloud-based dashboard for data visualization; quick access to asset data via QR code; resistance and long battery life. Although the electronic devices and systems listed in Table A2 in Appendix A are embedded with the most diverse types of sensors, allowing equipment monitoring, they do not cover some of the requirements necessary to reach a DD for CI. As referred to in sub Section 2.1, a key aspect analyzed by Lean professionals is the movements of workers throughout the plant and their correlation with the work of the machine—aspects that these devices do not cover. Other aspects not covered are the identification of the individual operator and the use of proximity sensors to measure the distance to a nearby person or object.
These findings enhance the need to propose an innovative concept to automatize the DD (the ADD). Despite the support that existing IIoT solutions provide, the most challenging factor in combining DD and IIoT is related to the degree to which devices can simultaneously monitor operators’ actions and the states of machines [83]. Naturally, the operator’s monitoring must respect individual data protection and promote wellbeing. The ADD concept covers the identified gap by contributing to the adoption of I5.0 by positioning human beings in this new context, in the search for a more sustainable, resilient industry with a more robust social environment [15,16,17,20].

3. Automatic Detailed Diagnosis Requirements and Architecture

3.1. Requirements Definition with Support of Lean Professionals

The DD of an operator–machine-type workstation for CI actions requires the measurement of several variables, and the generation of a report with relevant data for the analysis and application of problem-solving techniques [32]. As a reminder, the digitization of equipment and the typical MES assure production monitoring and systems control, presenting automatic performance diagnoses (based usually on KPIs); however, they focus on the efficiency of machines, parts rejected, etc., and are most of the time insufficient for problem-solving [84]. Therefore, there is a need for a DD in the Gemba that is usually done by Lean professionals, as explained in Section 2.1. There are two typical scenarios in traditional DD, reflecting a trade-off between time/cost and accuracy:
  • Scenario 1—minimize time and cost spent in the DD (usually half a day or one day of data collection);
  • Scenario 2—assuring data representativeness (by observing the workstation for one or two weeks).
In the first case, despite obtaining a DD quickly, with effort and low cost, the limited amount of data provides less reliable findings, and may yield a result based on biased data that do not portray reality. In the second scenario, large volumes of data provide greater reliability for analysis, but take longer to collect, which incurs more costs in the process. Between these two scenarios, there is a common practice in companies opting for the first scenario. The reasons for this rely on the availability restrictions of Lean professionals and on the associated costs (whether they are internal or sub-contracted). The particularities of the DD for problem-solving require the observation of the Gemba and the presence of analysts throughout the study period [29]. This requirement is linked to the fact that pen&paper, stop-watch, and work sampling are generally used [6,7]. When operators authorize it, video recording can be used, which can reduce the effort but does not preclude the long hours of viewing these same videos filmed by operators [44].
The proposed ADD concept aims to automatize this phase, always keeping, and recommending, the visit to the Gemba of Lean professionals as an essential aspect of CI practice. The following requirements were defined by compiling the DD needs identified in the bibliography (Section 2.1) with practical and operational aspects collected from the experience of one of the authors of this study (a Lean consulting company that performs several DD per year):
  • Preferably be suitable for diagnosing operator-based workstations, in a job–shop context and/or manufacturing cells, because these are the most time-consuming situations [32,40];
  • To be a non-intrusive solution, both to operators and machines, because it should not interfere with regular tasks and, for the latter, most of the machines’ PLC and controls are out of reach for Lean professionals (being either too complex to access or requiring dozens of thousands of euros be spent by the equipment manufacturer);
  • To be flexible and easy to use, because usually, the internal or external Lean professionals’ team does not have expertise in programming and data processing. Additionally, the monitoring is to be carried out for a couple of weeks in one workstation to support a specific problem-solving project, and should be easy to move to another workstation to support another problem-solving project. One must remember that a permanent DD diagnosis of a workstation creates a tremendous amount of useless data if the performance respects the production KPI target values;
  • To be a low-cost solution, to have a short pay-back period by avoiding unessential monitoring by lean professionals, and to allow there to be several ADD sets in the company;
  • To allow for the reporting and analysis of machine time and operator movements/time for several operational statuses (operation, setup, micro stops, waiting, maintenance, etc.) and for several typical locations, avoiding the need to build by “pen&paper” the typical Yamazumi charts, spaghetti diagrams, etc., yet giving similar information [41,42,43];
  • To allow the quantification of wasted material, accepted/rejected parts, energy consumption, and consumables use, among other resources related to efficiency aspects [16];
  • To allow (optionally) the Lean professionals to control the DD’s progress in data collection, via monitoring dashboards for easy data visualization and decision-making [85].
The fulfillment of these requirements by an IIoT-based system would be an important contribution to the integration of LM, L&G, and CI in an I4.0 context, accelerating and increasing the quality of problem-solving projects. The ADD concept, by meeting these requirements, will support the L&G 4.0 paradigm by allowing a holistic analysis of operator-related, economic, and environmental performance, and in addition contributing to Industry 5.0 [16,17].

3.2. Automatic Detailed Diagnosis Architecture and Costs

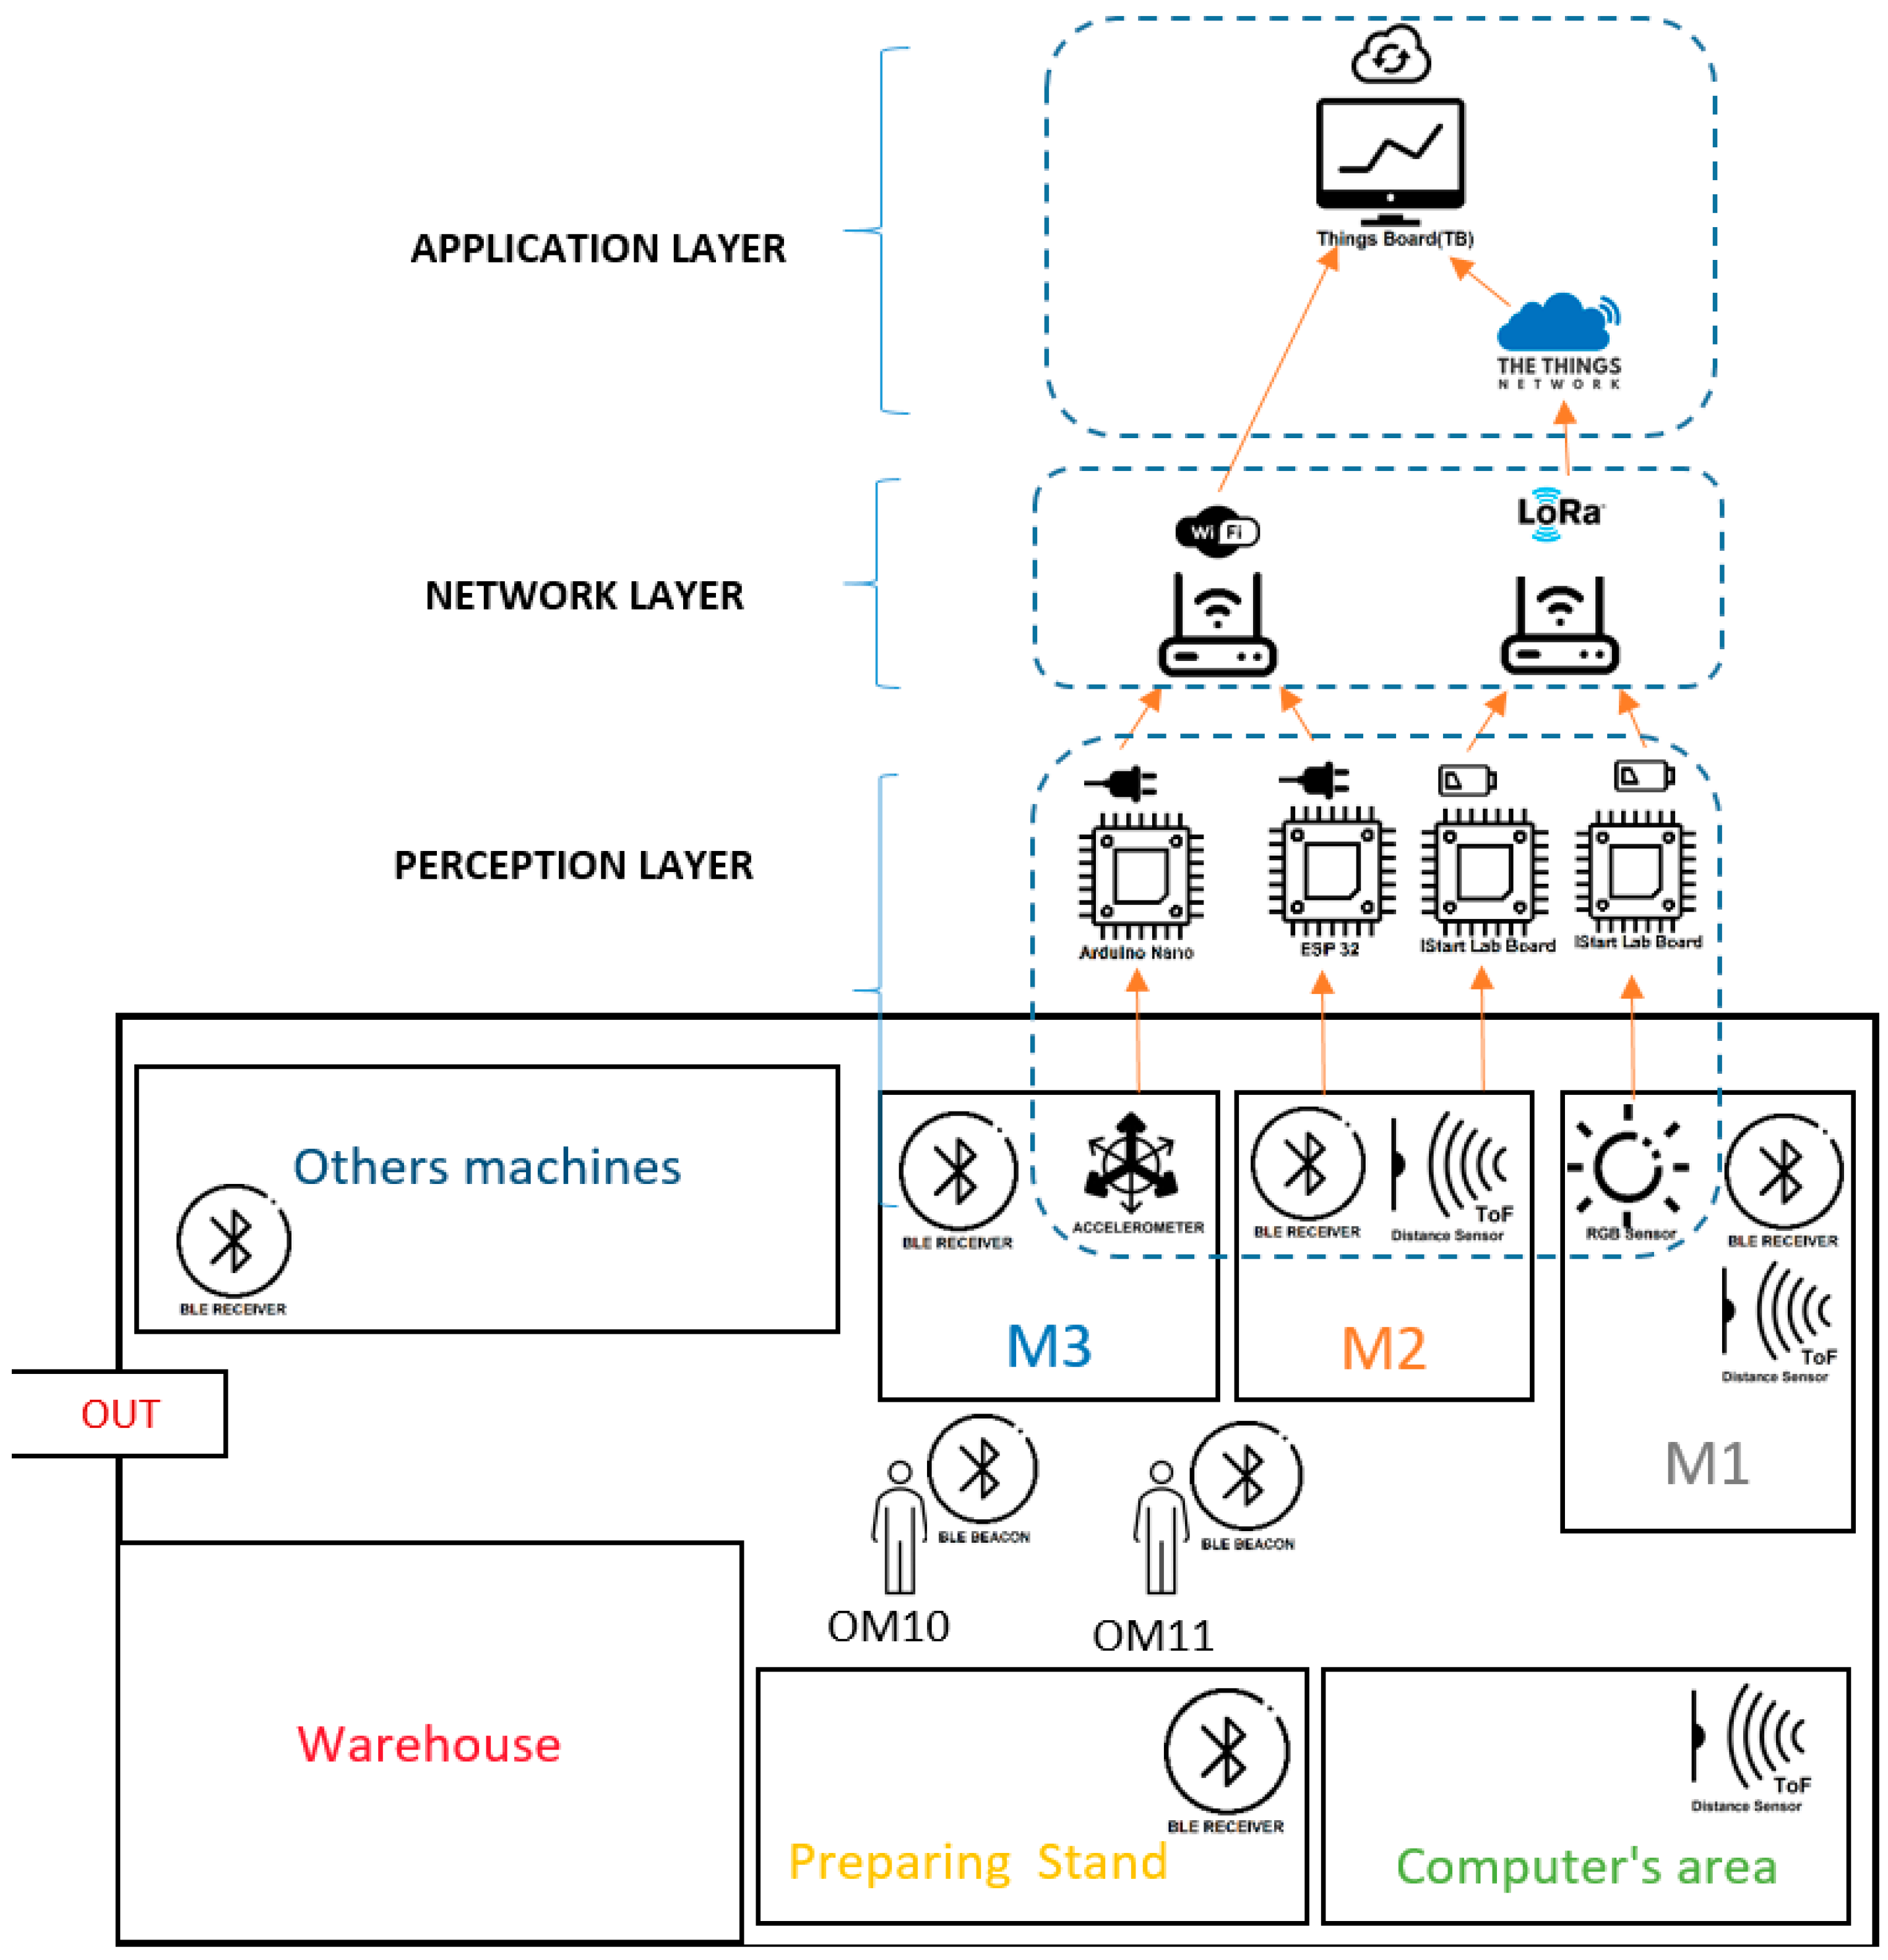
An IIoT system has a well-defined three-layer architecture: (i) a perception layer where data are acquired; (ii) a network layer for data condensation and communication; (iii) an application layer for data storage, analysis, and visualization [86].
For data acquisition, four types of nodes were included in the prototype. The nodes were divided as follows: a node with red, green, and blue (RGB) light sensors to sense the color of the machine’s status indicator; a node with an accelerometer and a microphone to measure the vibration and noise associated with the machine operation; a node with a time-of-flight (ToF) distance sensor to detect the presence of an operator in front of a computer screen; a node with a Bluetooth low-energy (BLE) receiver to identify which of the operator’s BLE tags is closer. Each node includes a microcontroller unit (MCU) that interprets and compresses the acquired signals and sends them through a wireless network. The nodes used in the prototype were developed by iStartLab, the innovation laboratory of Instituto Superior Técnico, Universidade de Lisboa. The nodes also include a module for wireless communication using either LoRa or Wi-Fi. The LoRa communication protocol is used for the battery-operated nodes (RGB and ToF) due to its low-power requirements. The lack of need for a power cord allows for easier installation and more flexibility in the location of the devices. Wi-Fi protocols are used for the nodes that consume more power and need to be plugged into an electrical outlet (BLE and vibration), and, as such, do not require a low-power communication protocol. Fortunately, the location of these nodes is not as critical as the other two, and can thus be installed closer to a power source.
Condensation and communication are performed at the network layer, by gateways that receive data packets from the different end nodes and replicate them to the application layer in a structured way, and they may or may not add system state information (e.g., geographical coordinates, packet counting, timestamp, etc.). In the ADD prototype, a gateway supporting both LoRa and Wi-Fi communication protocols was used, which was connected to the internet through a 4G LTE modem. This way, the data collection was completely independent of the factory’s communication infrastructure.
At the application layer, two software platforms were used. The chosen platform for data storage and visualization was a private version of the open-source software ThingsBoard (TB). However, this platform cannot handle the LoRa protocol. The data from the LoRa nodes were first sent to The Things Network (TTN) online server, and then to TB using a specific integration module.
To obtain an ADD to support problem-solving in a CI project, it is necessary to start from a layout, define the IIoT devices to be used, and arrange them in a way that favors the architecture. In Figure 3, it is possible to visualize the layout scheme of a factory (as proposed in Figure 1) associated with the general architecture of the proposed ADD. This image contains the respective devices and their locations, in order to meet the requirements defined in Section 3.1, plus the details of the layers to understand the logic of an IIoT system’s architecture. The attached Table A3 in Appendix A presents the technical characteristics of the devices and the details of the specifications of the components used in the ADD prototype.
Having in mind the concept of the ADD, i.e., making it adjustable to the specific needs of each problem to be solved, a “choose as you go” policy was used: anyone can define the data that need to be acquired and choose which and how many devices are necessary to collect it. The devices were purchased and assembled in the iStartLab, and the prototype has a cost of goods of around EUR 30 per device, as seen in Table 1. One gateway with LoRa communication and Wi-Fi costs around EUR 230, so it can be said that the cost of the components is around EUR 530 for a system such as the one used in the ADD prototype, with 10 nodes and one gateway, so the low cost of acquiring IoT devices is evident, fulfilling the low-cost logic.
When the proposed IIoT system collaborates in fulfilling the requirements, it contributes to the integration of LM in an I4.0 context, in which, besides the aforementioned low-cost logic it also favors flexible features and an easy to use device; however, this prototype includes neither the production of interactive dashboards nor the energy metering system. These are very important features, but there were two main reasons for not including them: (i) to validate the ADD concept, these two aspects are not critical and can be incorporated in a second phase; (ii) in the industrial case study, the two features were not necessary to validate the reliability of the ADD concept.

4. Validation Experiment and Case Study

4.1. Preliminary Tests

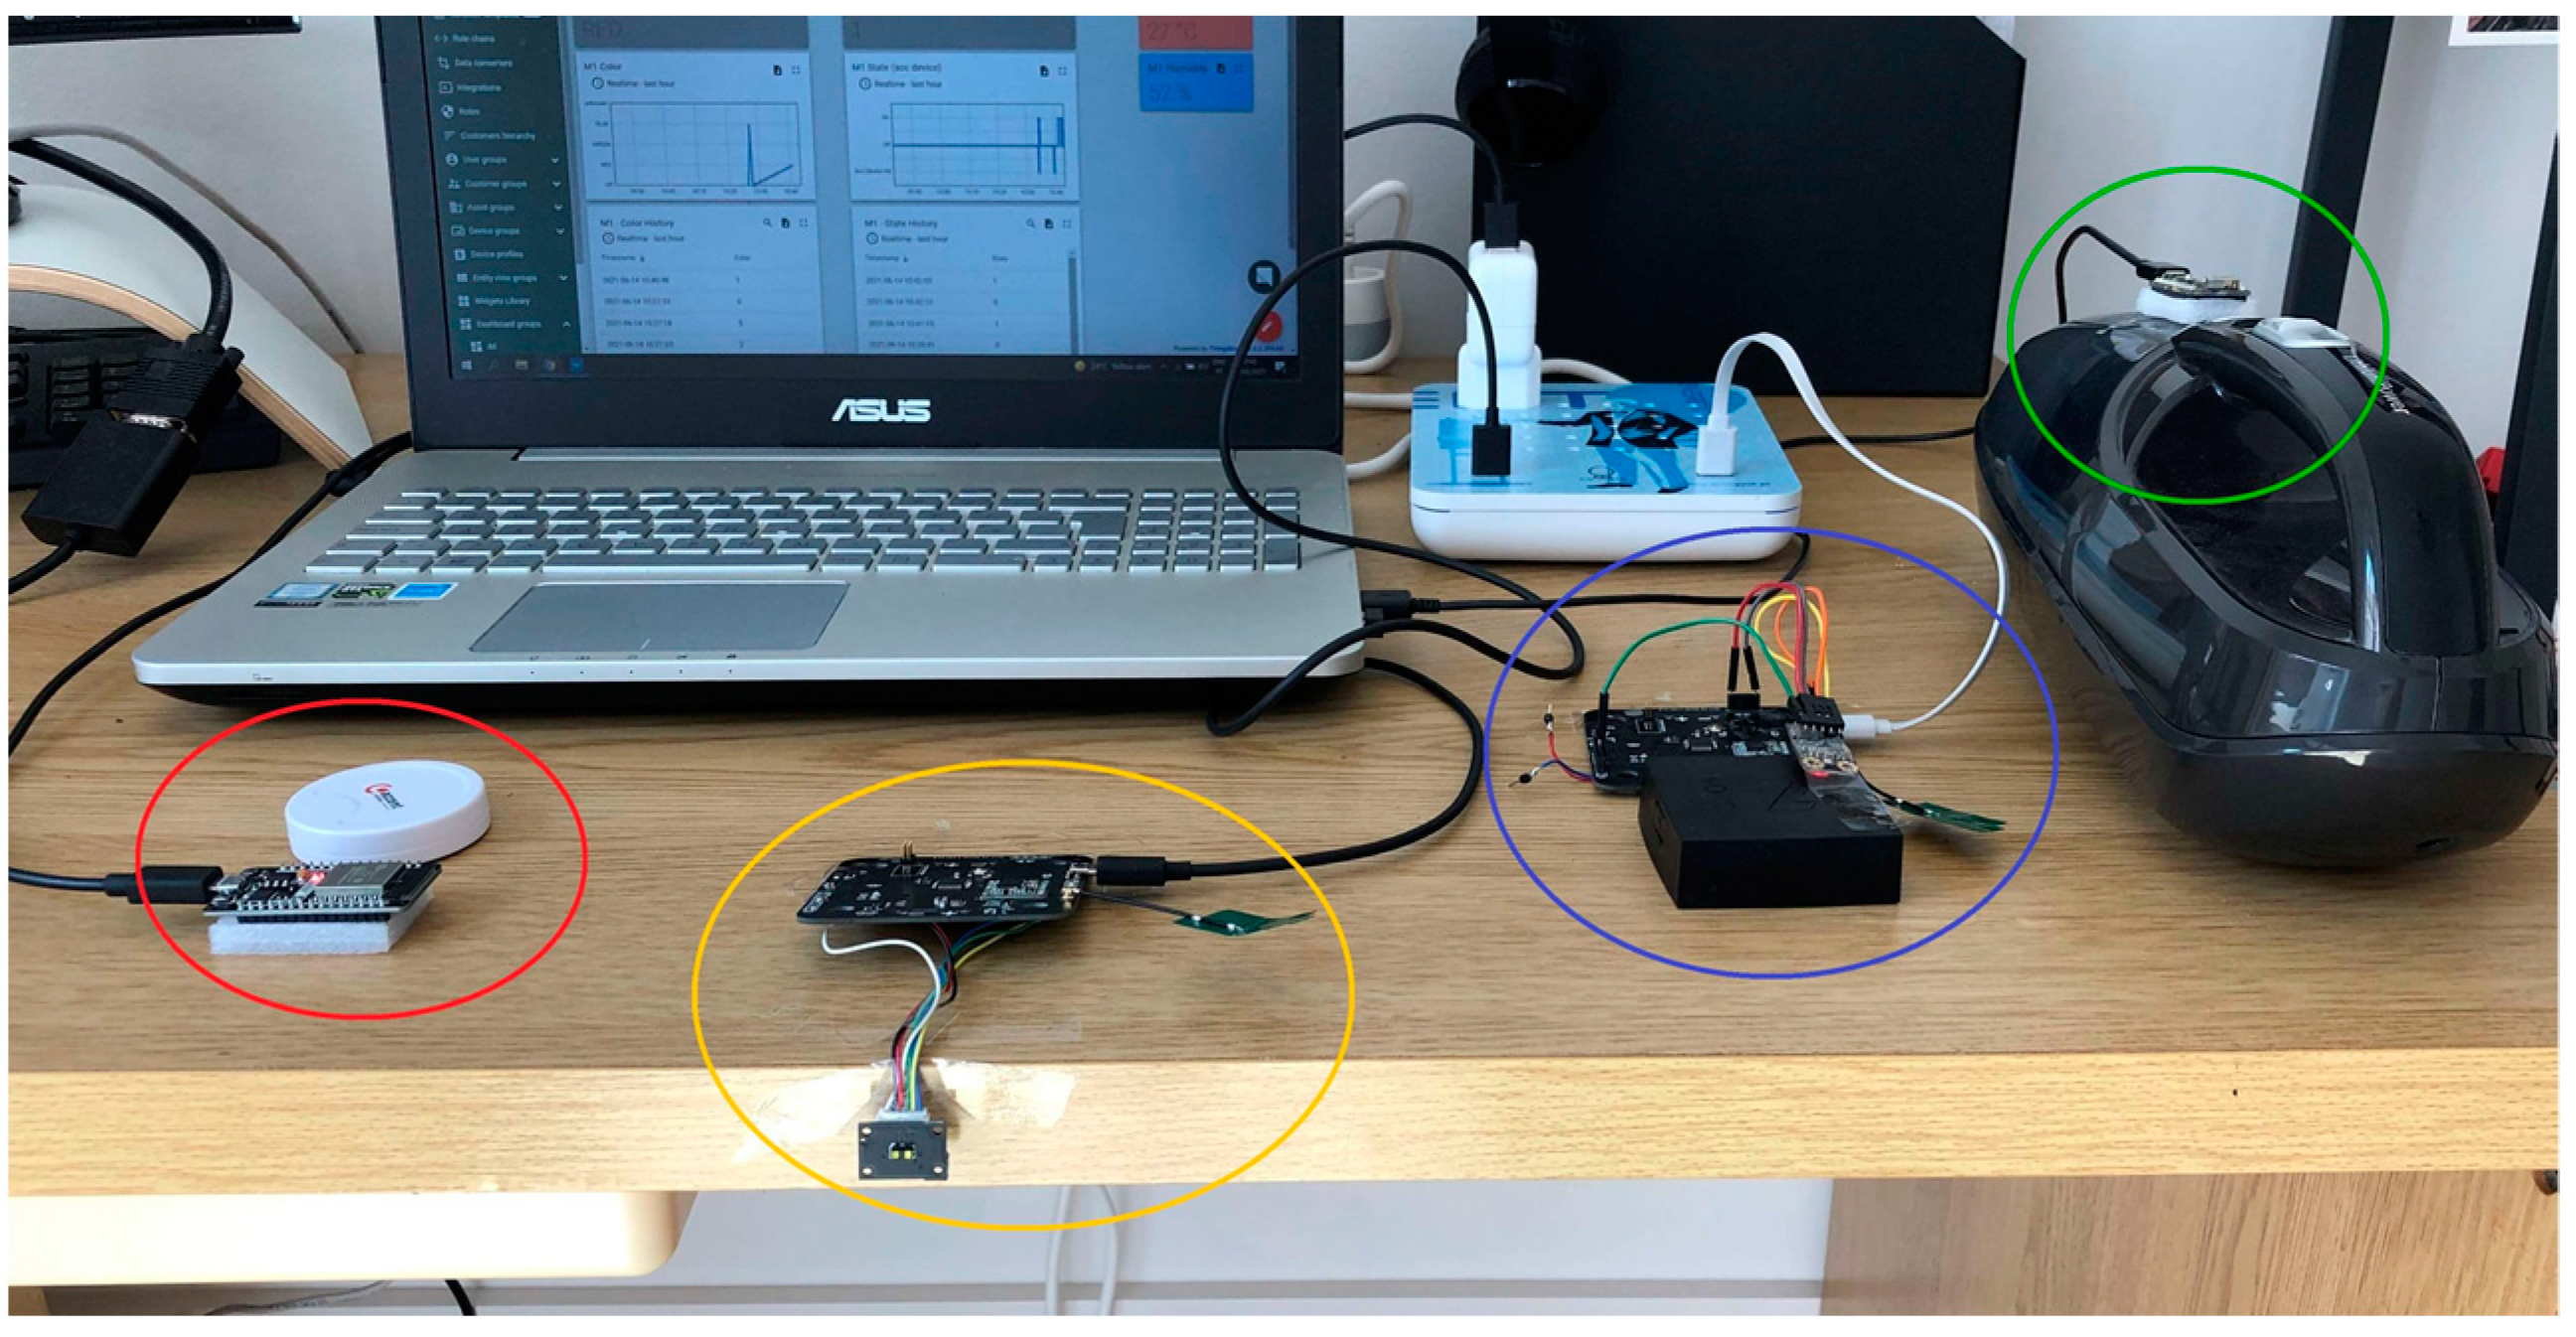
The objective of this section is to carry out preliminary tests to validate the devices built in the prototype by analyzing the conformity of the obtained data and information with those that were expected. Several functional tests were carried out in the iStartLab facilities (Table 2). The vibration nodes were mounted on a 3D printer and a small vacuum cleaner (small VC) operated at two different speeds, in order to identify the on/off status by generating a status graph in the TB platform (Figure 4). The ToF node was used to measure the height of the printer’s base plate during its movements, and to infer each job’s start and finish instants. The RGB sensor was tested in the 3D printer room, which has no natural light, to identify when the operators turned the lights on or off when entering or leaving the room. The RGB node was also tested with a color-changing LED device to analyze the sensor’s ability to detect different colors. The performance of the BLE receiver in monitoring the operator’s location was tested with laboratory collaborators wearing BLE tags positioning themselves in predefined locations. With all nodes individually tested, the next stage was to test how they will work together to ensure a fully functional prototype and avoid problems when moving to the industrial environment.
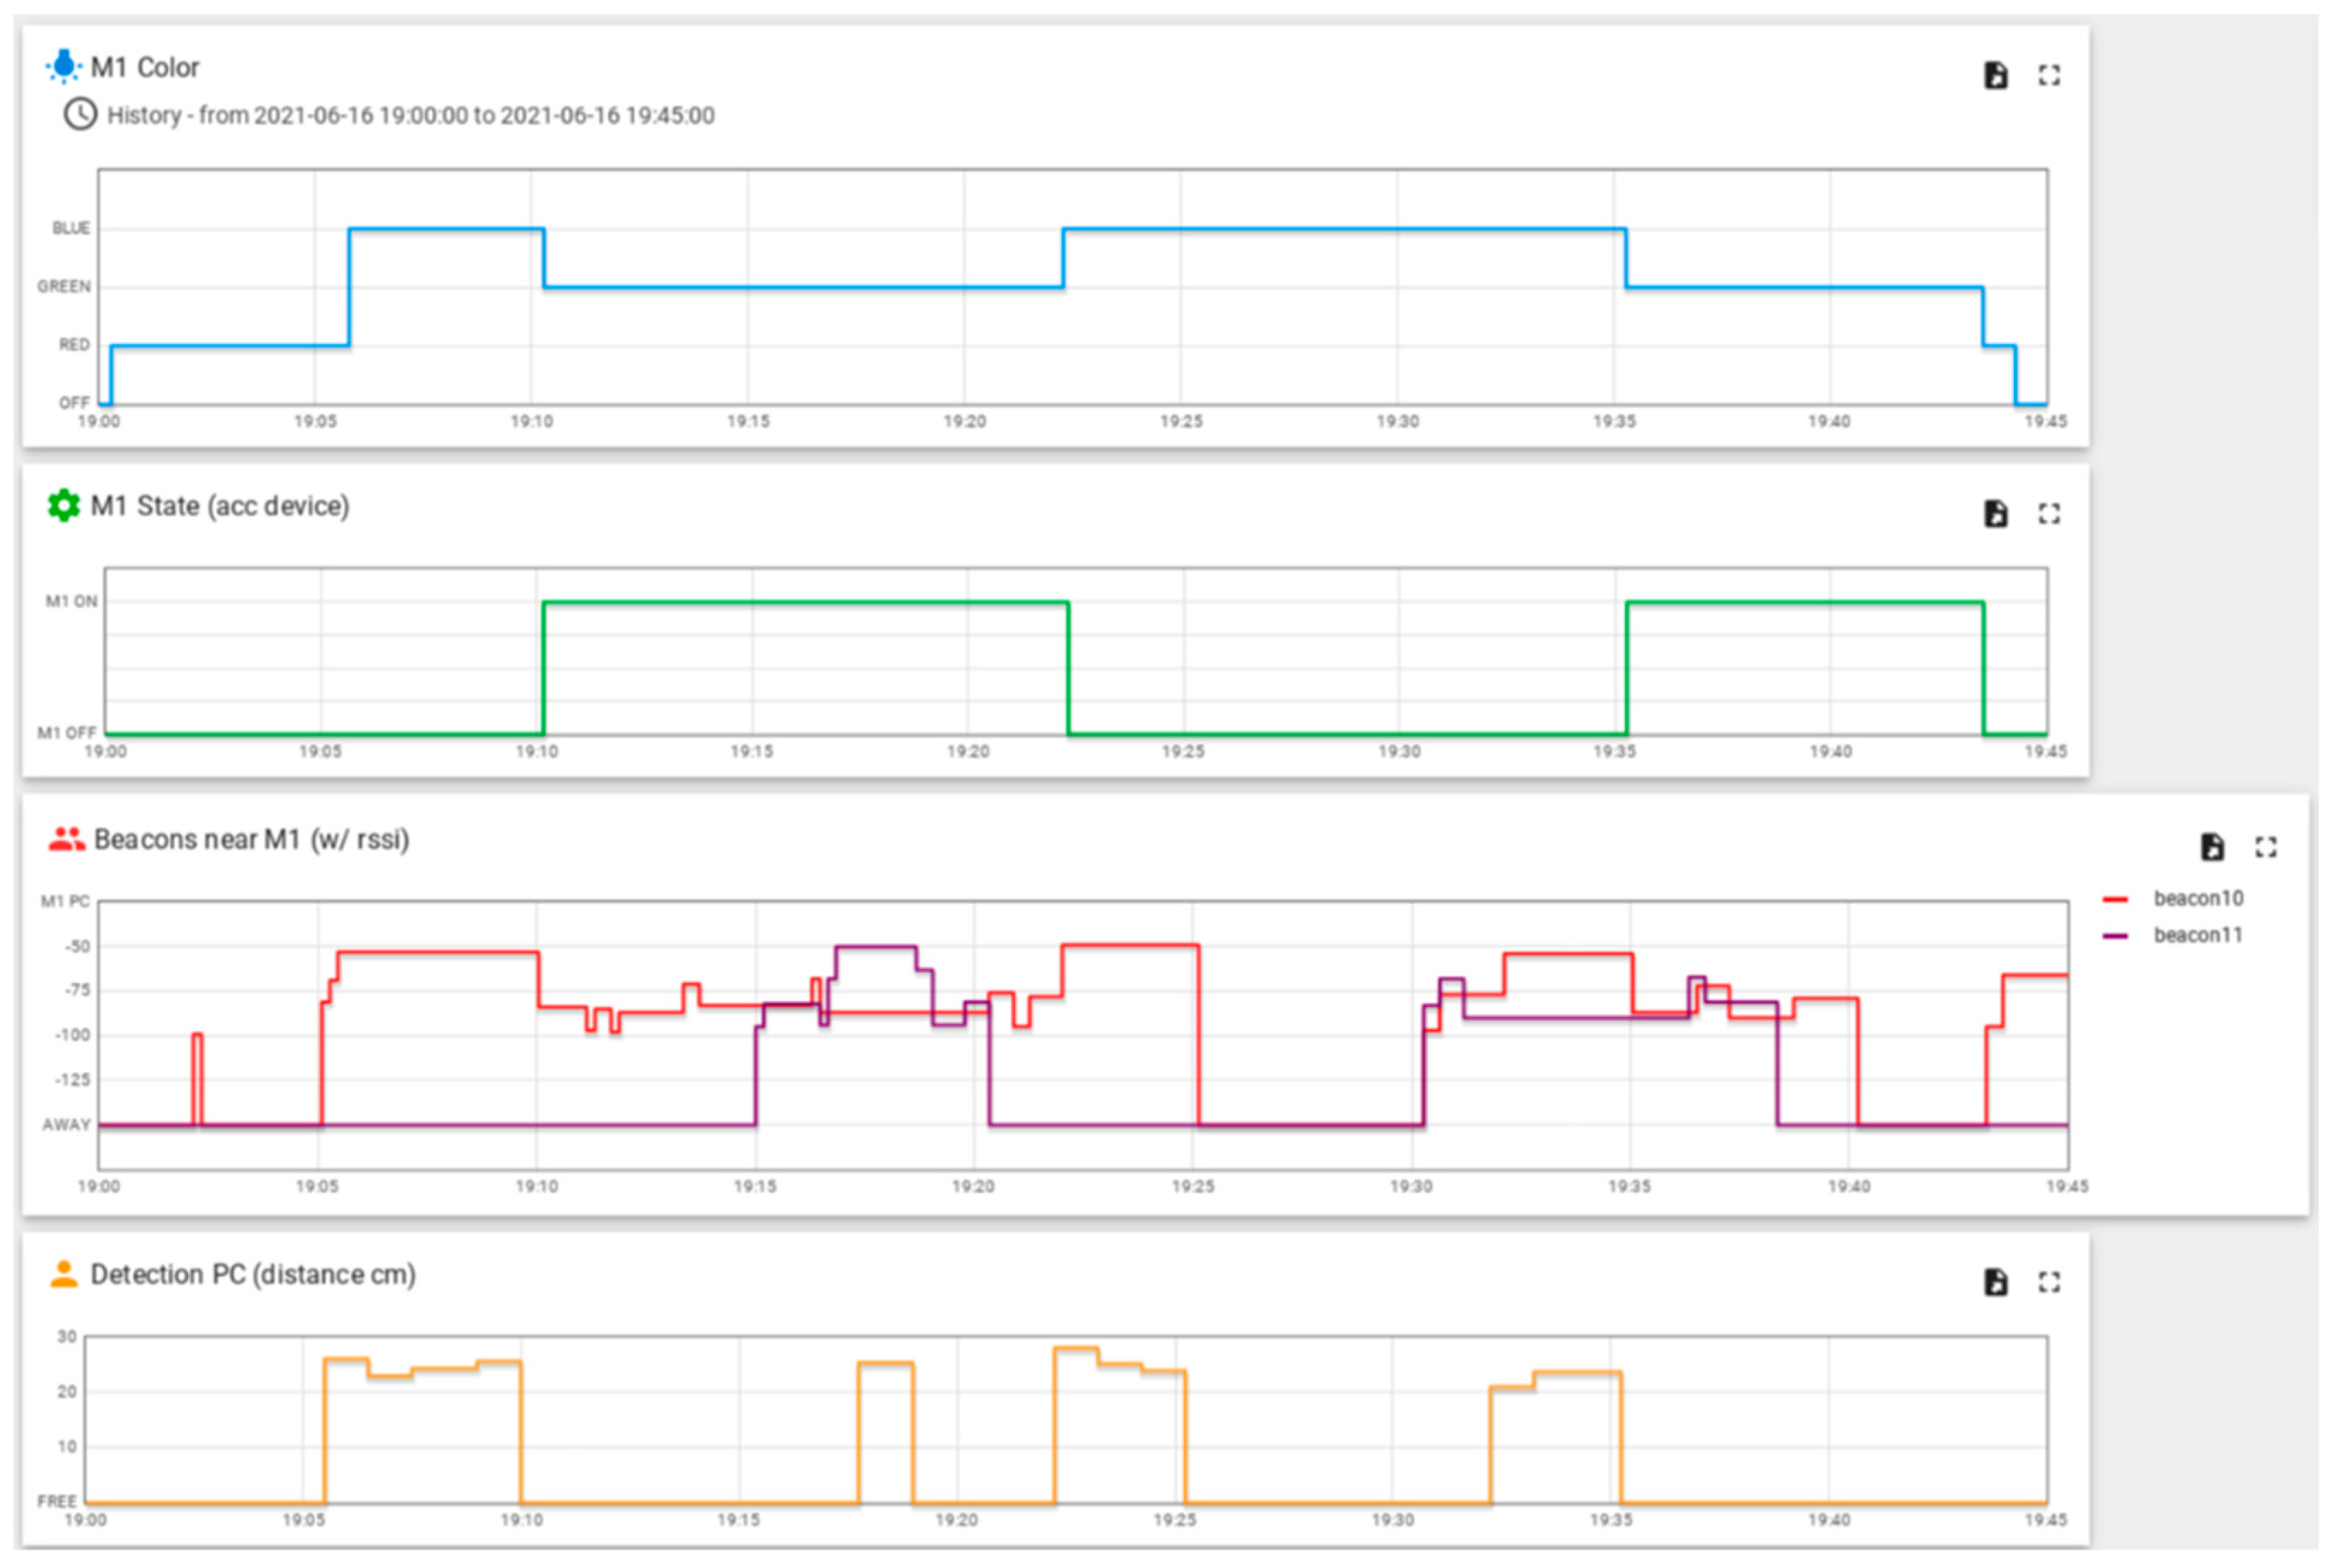
A simulation of workstation activity was performed in the laboratory by imposing a sequence of events and analyzing the response of the developed prototype (Table 3). The layout was composed of a small VC (named M1) with an LED RGB. In contrast with the machine to be monitored in the factory, the small VC did not have an RGB LED indicating all its states. So, to test the RGB node, we used a separate device with an LED whose color was controlled by an app. Every time the state of the small VC changed, the LED color also changed (green when the small VC was turned on but not working, blue when it was on and working, red when it was off but waiting for maintenance/setup tasks, and no color when turned off). Two collaborators of the iStartLab were involved, representing operators O10 and O11, each one wearing their own beacon. Two receivers were used: one near M1 and the other near a computer. The results of these simulated actions in a workstation are presented in Table 3 and Figure 5. The TB platform was used to store and visualize the sensor’s output.
In general, the results shown in Table 3 are satisfactory, making it possible to reconstruct the events from the data collected. There were, as expected, small delays, which must be considered when producing an automatic diagnosis. There was also a “false operator detection” around 19:02 (Figure 5). This detection showed a very weak RSSI and only lasted a few seconds; this was due to the beacon passing close to the room (but outside) when moving to some other location in the room. This is something that will happen quite often in an open environment. So, from this test, the need to use the beacon sensor together with the ToF was confirmed, in order to know if the operator is in front of the equipment and who the operator is. Nevertheless, even with these two sensors, there may still be some difficulty in interpretation, as was the situation between 19:22 and 19:25 in Figure 5, where it is not known whether the operator was close to PC or M1. This could be solved by positioning the ToF and receiver of the BLE at a significant distance from each other, even if their two locations are side by side.
The initial tests showed that the devices worked individually and collectively, in a synchronized way, between all devices. These tests allow us to check not only the quality of the data acquired by the devices, but also the reliability of the operation of the system for long periods of data collection, without any further intervention by our team. The proposed ADD concept, transformed into a prototype, meets the identified requirements of being mainly flexible and non-intrusive, and shows that it is possible to effectively communicate/transmit between nodes with the developed prototype, making it possible to move forward and test the prototype in an industrial case study.

4.2. Industrial Case Study in a Mould-Making Company

The objective of the case study was to verify the use of the ADD prototype in an industrial environment and to understand if it has the potential to replace a diagnosis made by a Lean professional. The ADD prototype was tested in a Portuguese mould-making company, located in Marinha Grande-Leiria. The prototype was implemented in a workstation composed of three CNC milling machines controlled by two operators (O10 and O11). This workstation was chosen because it contains an embedded system (intrusive) that monitors the spindle rotation acquiring data time and the simple status (on and off). Therefore, the results from ADD (non-intrusive) can be compared directly with the ones of this embedded system, which are usually not included in most machines.
Figure 6 illustrates the layout of the workstation, and the position of the prototype’s components (nodes). Table 4 gives the summary of all the data collected and the characterization of that data, as well as for the sensors: (i) five BLE receivers, identified as 1–5, according to the key locations frequently visited by operators; (ii) three ToF sensors, identified as 0–2, according to the positions of operators in front of computers or machine programming panels; (iii) an RGB sensor to capture the status of machine 1 (M1) given by the vertical status sign in the machine; (iv) an accelerometer in M3. In the case study, the energy measuring device was not used. It was not possible to collect data from machine 2, because it did not work during the weeks that the case study was carried out, but BLE and ToF sensors were mounted in the machine as one of the possible locations for the operators. This prototype was operating for 4 weeks (24 h on), while the workstation was operating in two shifts, 5 days per week.
The prototype also includes a dedicated Wi-Fi gateway to send the data captured by the devices to the cloud, where the TB platform allows data processing and visualization. A small python script was developed to retrieve the data using the TB REST API, saving it in CSV files.
The following analyses were done to test the prototype, having in mind the objectives of the ADD approach and the inputs from the Lean professionals (minimum requirements to make ADD useful):
Uptime—Retrieve machine uptime value with the ADD prototype and compare the results with the M1 and M3 spindle rotation embedded systems;
Micro-stops (MS)—Retrieve MS time and number of occurrences with the ADD prototype and compare the results with the M1 and M3 spindle rotation embedded systems, as well as retrieve the permanence time of the operators in each location during MS;
Setups—Retrieve Setup times and the permanence time of the operators in each location during each Setup.
These analyses cover the main objectives of the ADD, namely, to automatically retrieve the machine status and relate the operators’ location (and permanence) during the downtime activities (Setup and MS). Confronting the test with a usual scenario of machines with embedded monitoring systems allows for verifying the accuracy of the ADD prototype. The following paragraphs are dedicated to the analysis of the results obtained.

4.2.1. Total Uptime

Tests were conducted over four weeks for M3, with planned work for 24 h per day, five days per week. The M1 had work allocated only during the first two weeks, working in one shift of eight hours per day, five days per week. The RGB node was used to collect uptime information from M1, while for M3 the vibration node was used, allowing the comparison of the two different sensor types. In Table 5, the total uptime information of both machines regarding the two systems used for data collection, and the differences between measurements, are shown.
It is possible to notice great similarity in the total times of uptime when comparing the data collected by the prototype and those obtained by the company’s system. Regarding M1, where the RGB node was used, the overall difference is 0.10%. These results are highly satisfactory, meaning the RGB node can be used as a non-intrusive way to transform the status machine history when handling data. We should remember that these status lights give information to the user regarding the machine’s status, but machine manufacturers ask for significant investments to allow access to the machine system where this information is recorded.
As regards M3, where the V&N node was used, there were three weeks in which the difference form the company’s embedded system is very small. A greater difference was observed in week three. The V&N node detects vibrations, meaning any operation with the machine, such as tool-change, positioning, or other actions that activate motors, will be detected. The embedded system just detects whether the spindle is rotating, and some of these operations are performed with the spindle stopped. Therefore, the prototype was expected to show differences in spindle rotations, and it was this difference in the classification of the machine state that generated the 3.95% error relative to week three.
These differences are a highly positive advantage of the ADD prototype. By combining RGB and the V&N node data, it is possible to identify accurately the several statuses of the machine with additional information during downtimes regarding whether the machine is being operated or not.
In this regard, the prototype shows great potential, with the advantage of having been coupled to the machine structure without intrusion or damage, while spindle rotation to identify the state of a machine is a highly intrusive process and probably only has value as a permanent solution.

4.2.2. Micro-Stops (MS) and Operator Location

For the analysis of MS, only M3 was considered. With the help of Lean consultants and the company’s production supervisor, the MS for the processes in question was identified as a short downtime in production, at less than 20 min. This parametrization was set in the data processing algorithm. Additionally, the classifier developed to obtain machine states from its vibration only considers states that last more than one minute; therefore, only MS with a duration greater than 1 min was detected. The number of MSs was counted, and their durations in a period of 4 weeks for M3 are present in Table 6.
The MS information gathered with the ADD prototype is compared to that obtained from the machine embedded system; however, just like for the total uptime system, the counted MS uses machine state classification systems, which have different variables. Despite not having a common base, the same definition of a DM time was used for both cases, and this confirms that the numbers of DMs recorded for both systems were almost equal, resulting in only a 1 h 05 m difference in total.
Again, the accuracy of the ADD prototype can be considered as representing well what happened during the four weeks. The benefits for the CI team are highly valuable, meaning it is possible to determine with very high precision how many MSs occurred, their average time, their distribution, and the total time in MS.
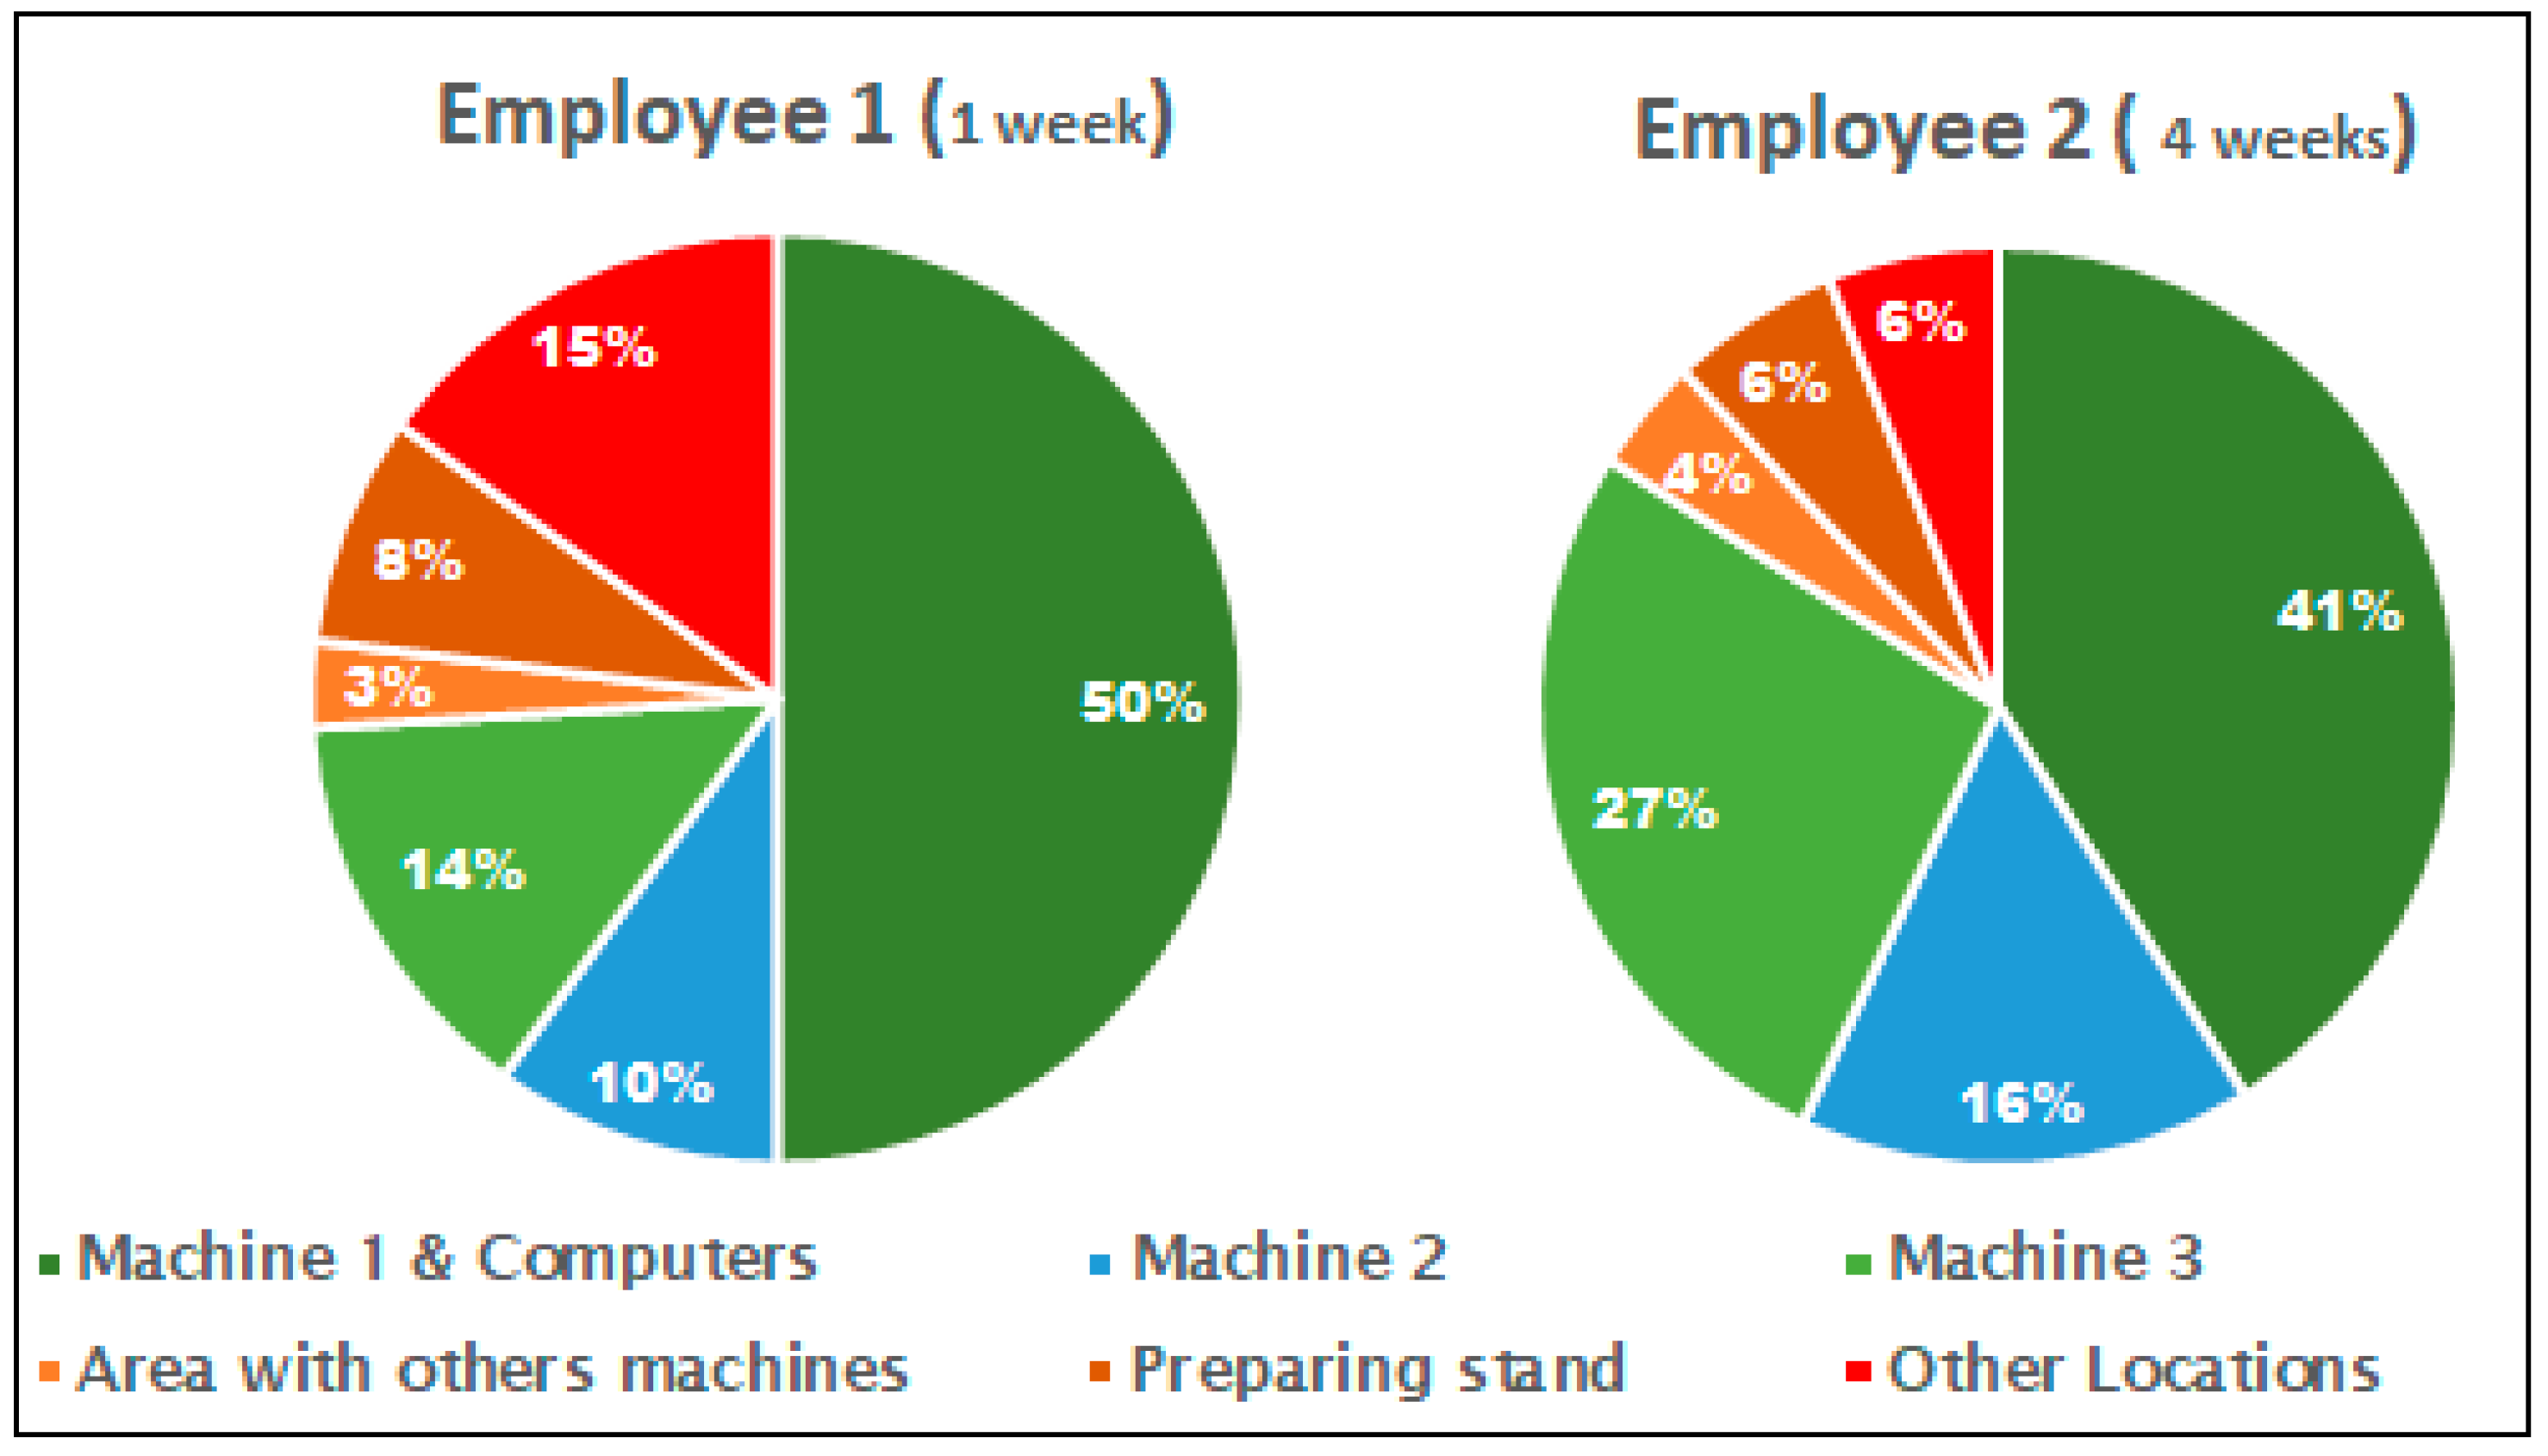
The ADD prototype can also identify, and then support the analysis of, the location of the operators during the MS micro-stops. The V&N node data must be matched with the BLE and ToF nodes. The results are shown in Figure 7 and Table 7.
The results show both operators were near M1 and the computers most of the time, while there were MS events (one of the operators was present in the workstation only in the first week). The operator’s location gives very relevant clues about what happens during each MS, for example, around 1/3 of the time both operators are not near the machines, even though they have stopped. In addition, information such as that shown in Table 7 is relevant. There are MSs related to technical aspects, as they do not require operators’ actions. Despite these very high-level analyses, the ADD prototype makes a tremendous contribution to the workstation diagnosis, by giving crucial information about what is happening in MS.
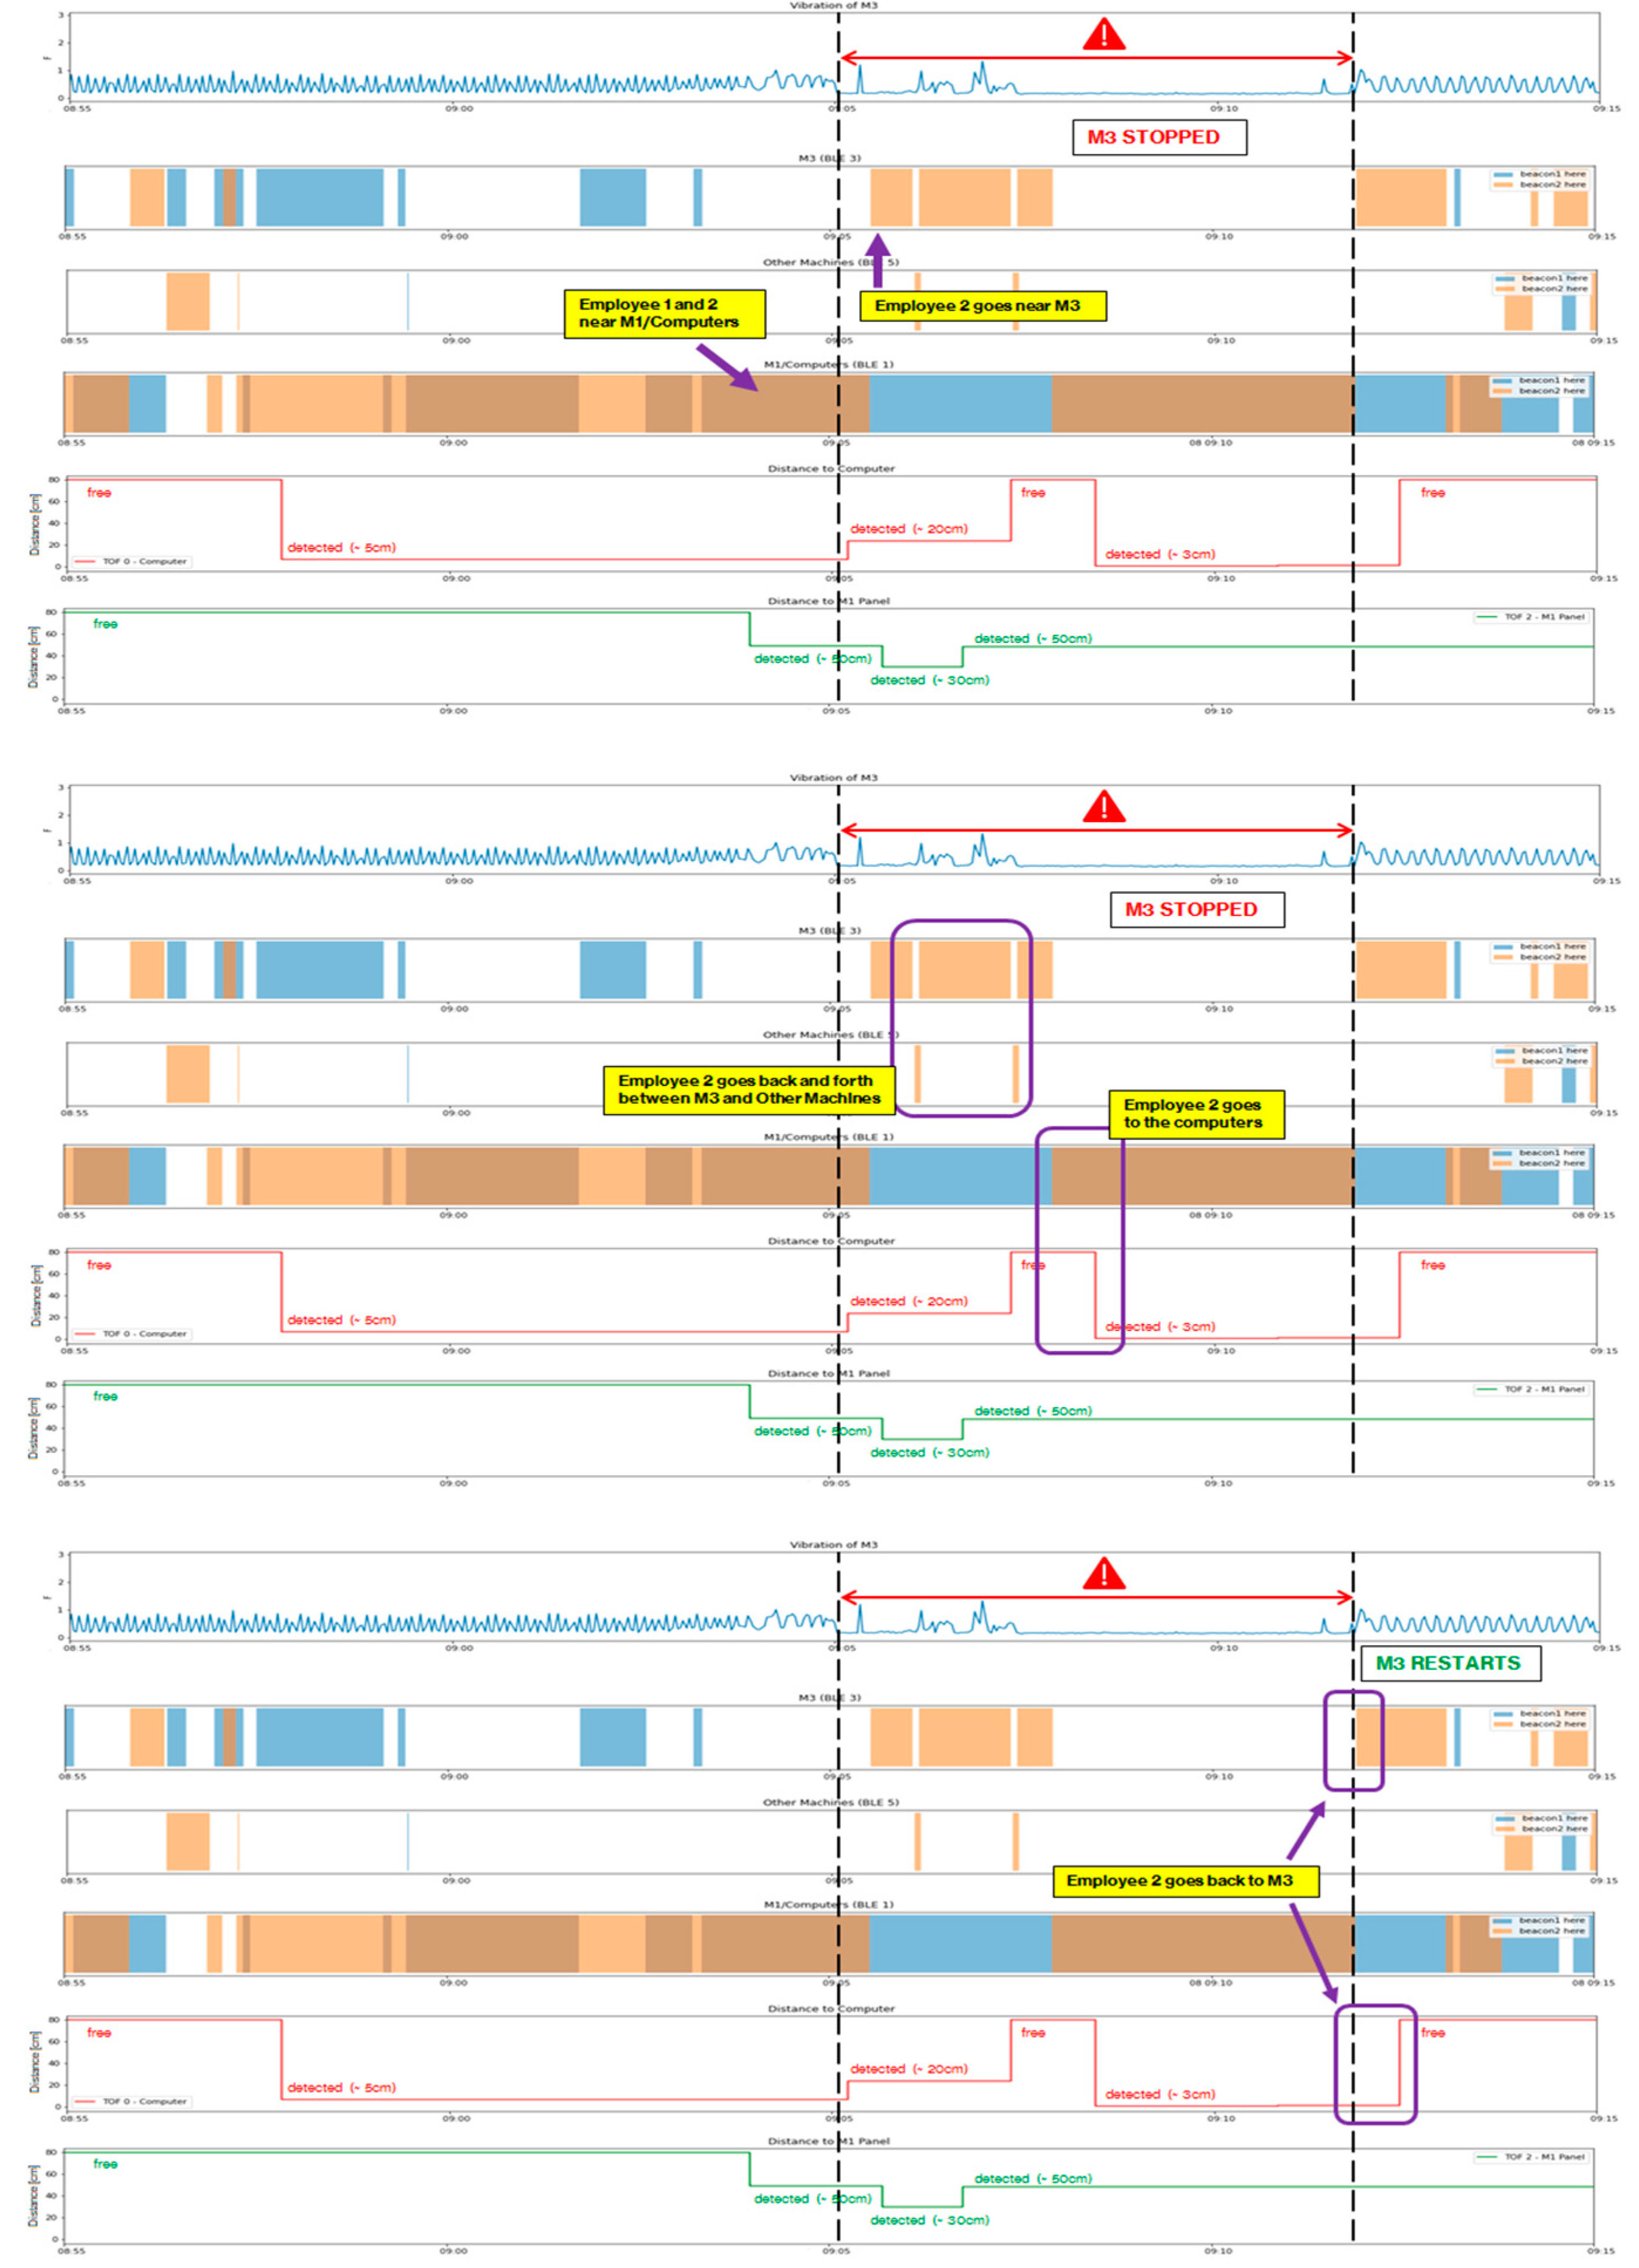
In addition, with the support of the TB platform, it is possible to have a detailed look at specific MS to understand what happened, thus contributing to the path of finding the root causes of MS in the process of problem-solving.
Figure 8 shows the data collected by the vibration node in M3, as well as the data collected by the BLE system, and the different ToF nodes involved in this MS. The interpretation of Figure 8 is summarized in Table 8. This analysis can be performed in detail for any of the MSs detected, but usually, understanding what happened in just a few is enough to identify the root causes. In addition, since the data are available, other data analyses can be done, namely, by segregating MS by duration, by the time of the day, etc.
All these data and information are highly useful for CI teams. The data collected from the ADD prototype not only give Lean professionals an idea of downtime due to MS, but also give them information about where employees are before and during micro-stops, how long it took to approach the machine (waiting time), and the time required to solve the problem. Without the ADD prototype, the CI teams would have to follow both employees around the layout and constantly have an eye on the machines to catch these MS.

4.2.3. Setups

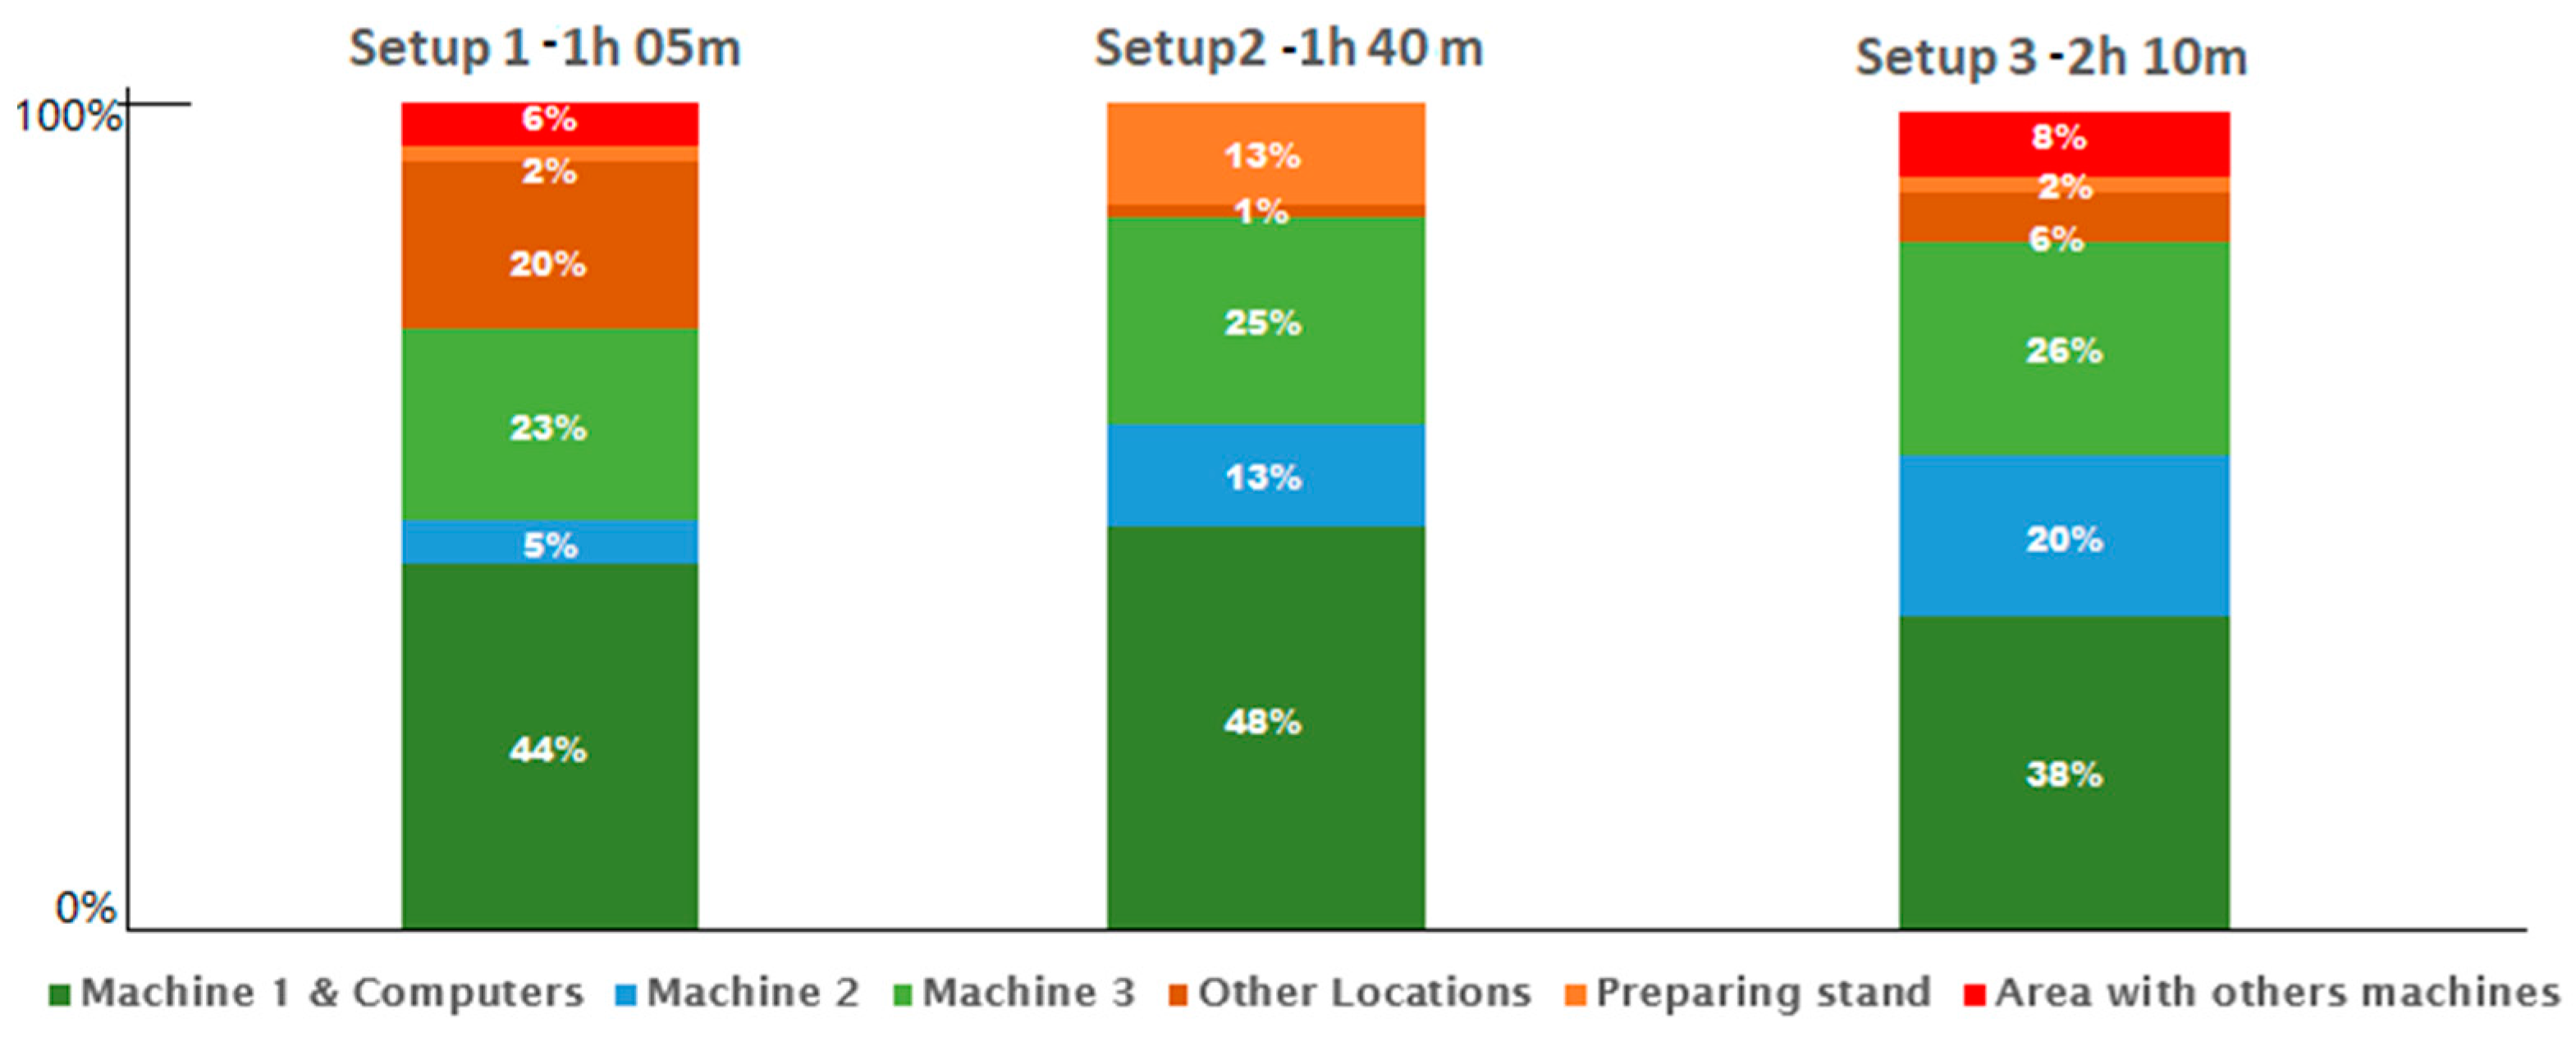
The previous subsections show the usefulness and accuracy of the ADD prototype in retrieving machines’ statuses and the locations of the operators. In this subsection, we will show the usefulness of the ADD prototype in supporting detailed analyses of setups. As mentioned in Section 2, setup analysis via traditional diagnosis procedures can take a long time, take place at inconvenient times, and be constantly subject to delays, with sometimes even hours of delay (to know when they occur). To understand the usefulness of the information provided by the ADD prototype to monitor setups, three setups were selected for analysis.
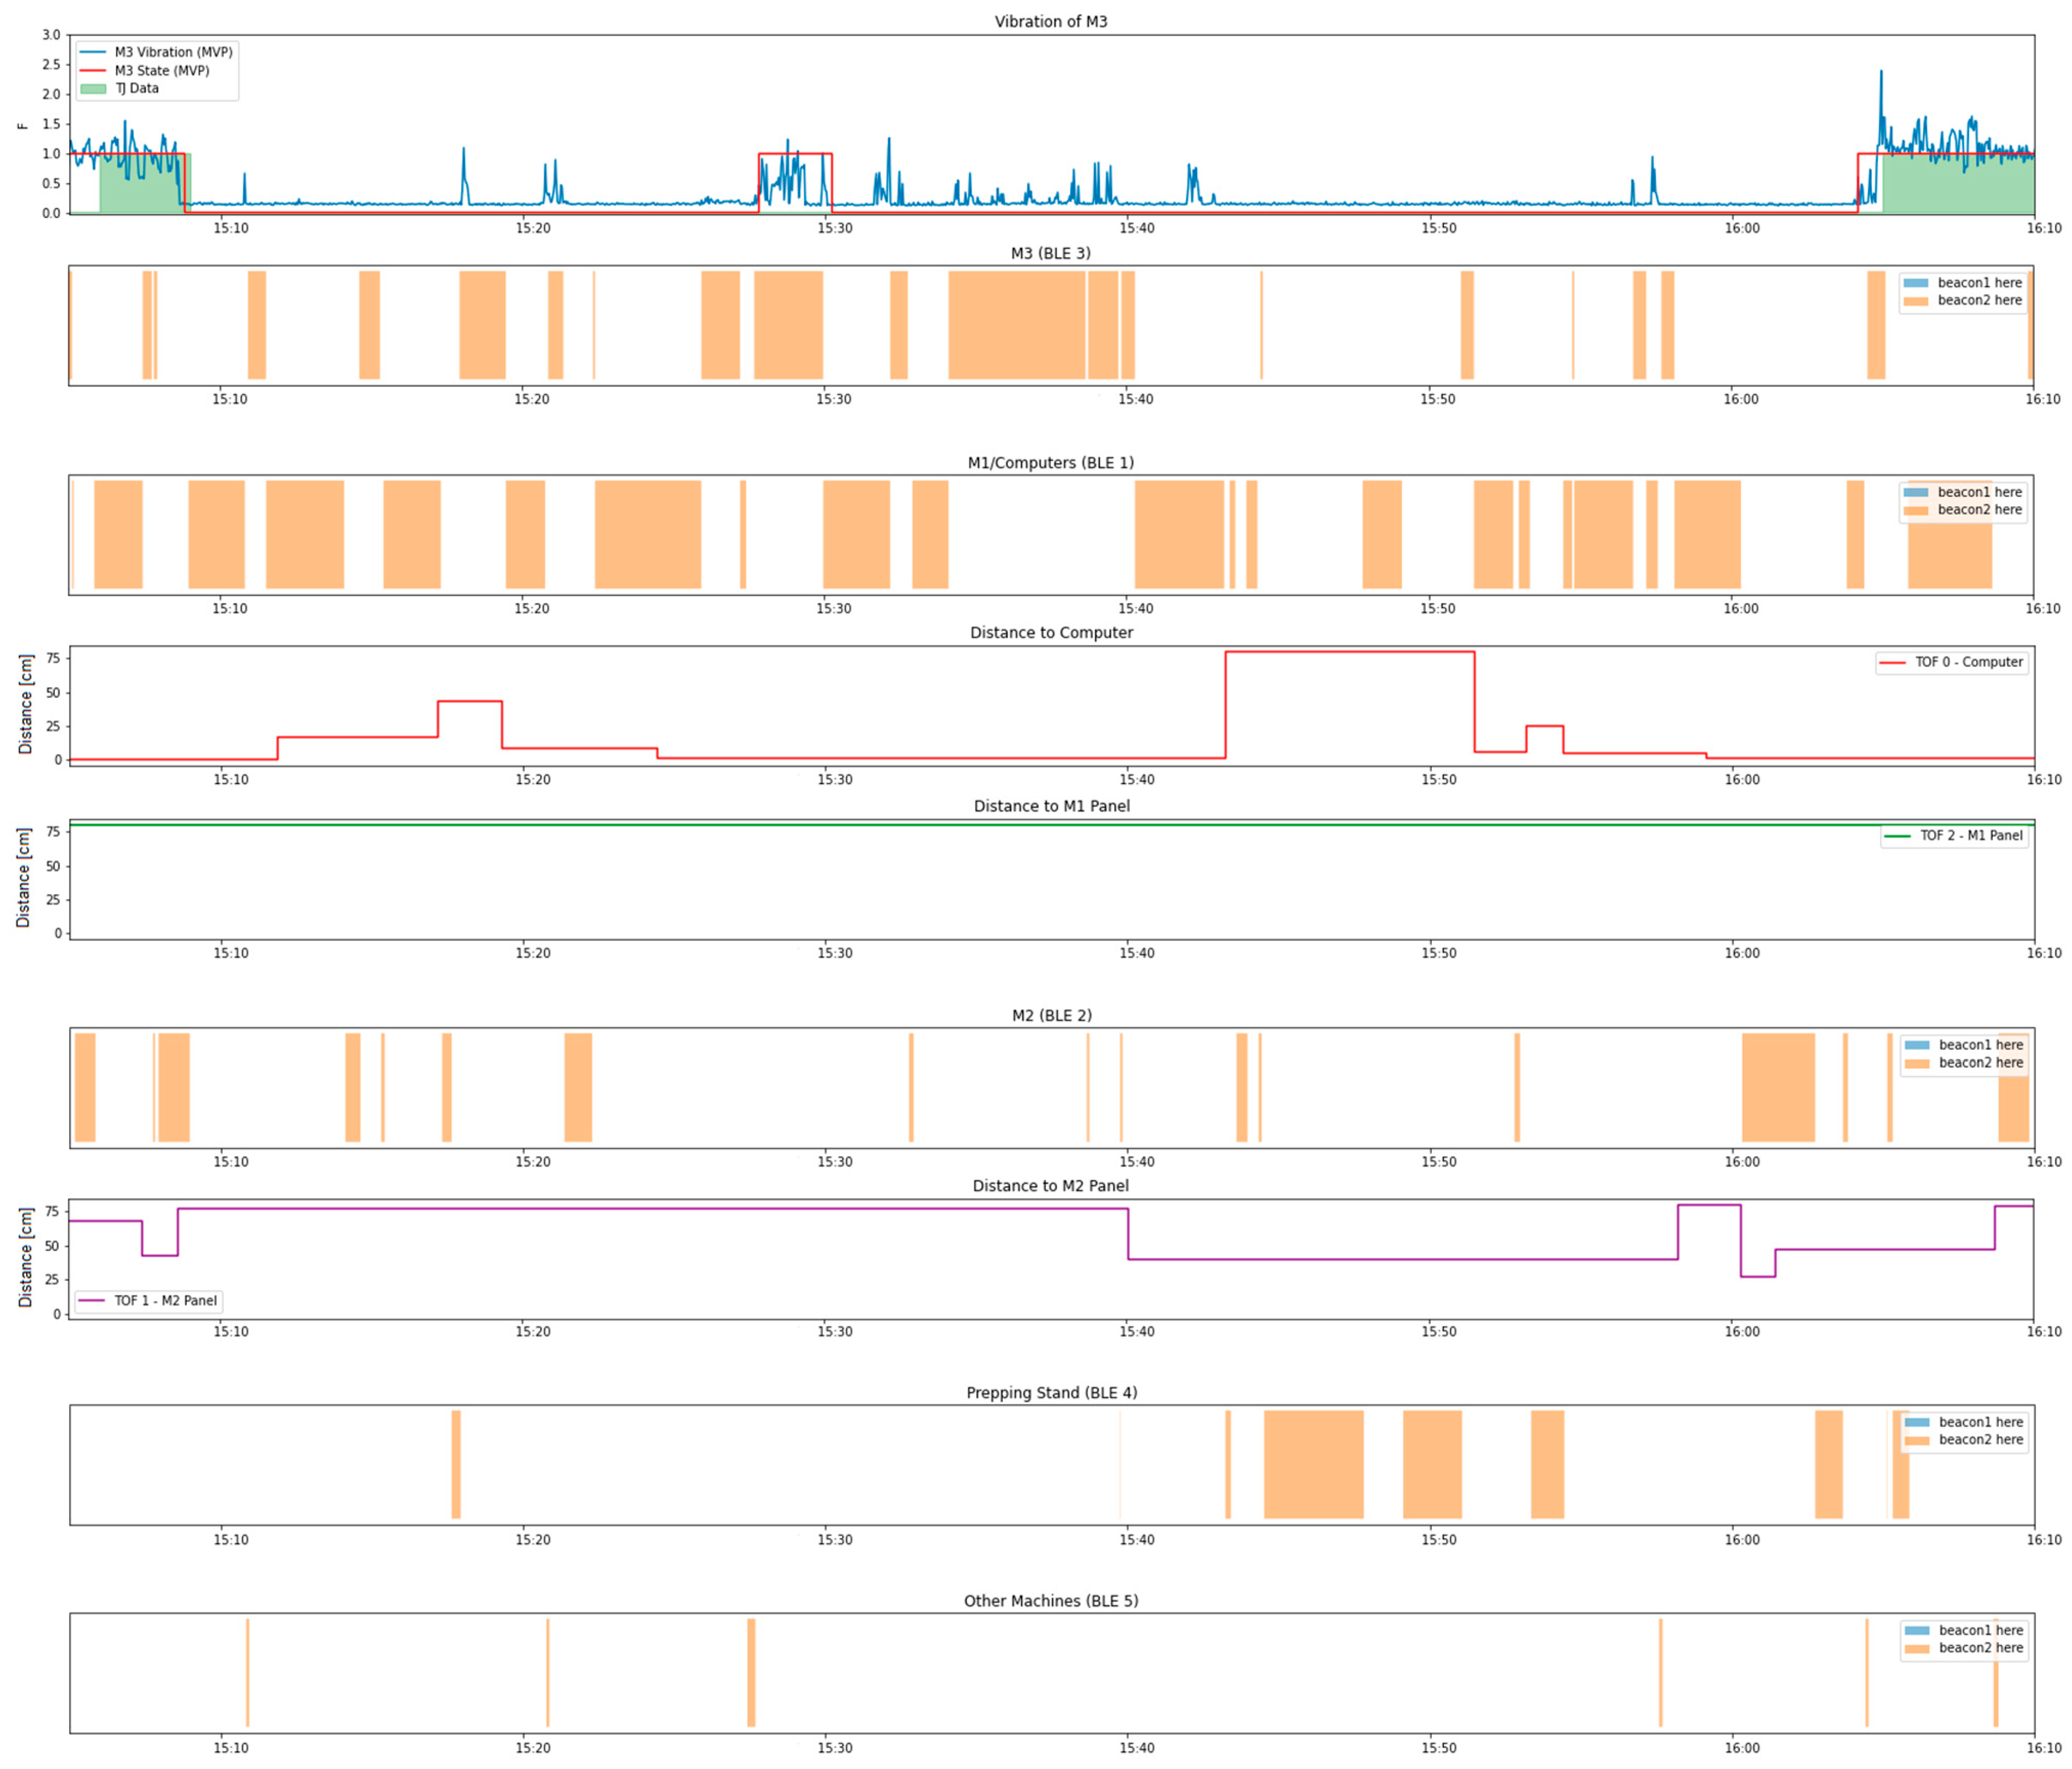
The result of data collection by the ADD prototype is presented in Figure 9. These setups are all from M3, and were performed by O11. We must remember that these results are possible because the V&N node collects machine vibrations, and at the same time the BLE and ToF nodes identify the proximities and distances of the operators to the different locations. The data were sent to the TB platform, and together with the algorithm processing the CSV files, data matching was performed to identify the setup periods and the locations of the operators during these setup periods. The valuable information obtained and presented in Figure 9 is probably not enough to understand all the setup procedure incidences, but can act as a tool to highlight potential inefficiencies in the setup procedures, and to indicate to the CI team that further analysis is needed. As said before, the ADD should be complemented with a few observations in Gemba made by the CI team.
Similarly to the MS analysis, the CI team can analyze in detail the setups timeline (Figure 10). This analysis will help the CI team to identify the root causes of existing waste, and proceed with the problem-solving project in an informed way.
Finally, the purpose of this case study was to test the prototype in an industrial environment and understand its strengths and limitations so as to help Lean professionals gather important data and obtain information about the performance of the workstation. The prototype was able to provide very accurate data when compared to the permanent and embedded systems that were already installed in the Companies’ machines, showing system reliability. In addition, it manages to capture important data on the state of the machines and the movement of employees. These data, when associated, help us to understand the procedures used and tasks done, performing an automatic diagnosis. The ADD prototype, complemented with direct casual observations, certainly represents a powerful tool to support CI teams in CI projects of problem-solving, reducing drastically the time needed for the studies and simultaneously increasing the period covered by the study.

5. Conclusions

This paper presents the concept of the ADD prototype to address the gap in automatically executing a DD from a manufacturing workstation (operator–machine), in order to support CI teams in problem-solving projects. The ADD requirements, defined by a literature survey and CI experts’ inputs, were embedded in the ADD prototype: it must be flexible, non-intrusive and low-cost, and its architecture must be based on information and communication technologies, namely, IIoT.
By encouraging cooperation between man and machine, and analyzing operational, human-centric performance and the energy consumption of devices, the ADD prototype includes the characteristics of Industry 5.0 and the concept of L&G 4.0, integrating solutions with a technological and sustainable bias, favoring the optimization of resources and adding resilience to industrial processes.
The prototype is composed of a set of devices used to collect data (RGB node, vibration and noise node, BLE system node, and ToF node), gateways for wireless communication, and software platforms to convert, store, and visualize the collected data. The prototype was first tested in laboratory conditions and in a mold-making company for validation in an industrial environment. In this case study, the total uptime was very similar to the values obtained by an existing system embedded in the machine that registers when the spindle is rotating (not common in most companies). The RGB node that monitors the machine’s status provided a similarity of 96% with the embedded system. The vibration and noise node measurement showed a similarity of 89% to the same reference. With the BLE node, it was possible to identify the time spent by employees in the different monitored locations. While this information does not give Lean professionals the exact reasons behind the inefficiencies, it helps to reveal where potential inefficiencies exist, and helps professionals address them by identifying their root causes. Micro-stops and setups were identified in an efficient and detailed way, allowing for correlating the operators’ movements with events in the machines, and allowing Lean professionals to estimate performance indicators. The existence of an IIoT-based solution made it possible to carry out a detailed diagnosis with less effort by automating the data collection for longer periods, which allows professionals to focus their effort on the analysis and implementation of solutions. The ADD concept developed and validated in industrial conditions represents an innovation in the CI project diagnosis tasks, and its further development as a usable commercial product will benefit a large number of professionals and companies developing problem-solving projects.
One of the limitations of the work is the unlikelihood of obtaining a comparison of the ADD results with data collected at the Gemba by an analyst (traditional pen&paper approach). This was not possible due to COVID-related sanitary restrictions.
For future works, the ADD results will be compared with traditional pen&paper data collected by CI professionals. In addition, a stand-alone software will be developed, wherein the data can be made available for access, management, and graph generation without any restriction or difficulty, producing easy to interpret reports for the CI teams.

Author Contributions

Conceptualization, P.P. and L.C.d.O.; methodology, P.P. and L.C.d.O.; validation, R.M., D.J. and C.H.; formal analysis, D.J. and C.H.; investigation, R.M. and J.L.; resources, D.J. and L.C.d.O.; data curation, R.M. and C.H.; writing—original draft preparation, R.M.; writing—review and editing, P.P. and J.L.; visualization, R.M. and J.L.; project administration, P.P. and L.C.d.O.; funding acquisition, P.P. All authors have read and agreed to the published version of the manuscript.

Funding

This research was funded by FCT, through IDMEC, under LAETA, grant number UIDB/50022/2020. The authors gratefully acknowledge the funding of Project POCI-01-0247-FEDER-046102, co-financed by Programa Operacional Competitividade e Internacionalização and Programa Operacional Regional de Lisboa, through Fundo Europeu de Desenvolvimento Regional (FEDER) and by National Funds through FCT—Fundação para a Ciência e Tecnologia.

Informed Consent Statement

Informed consent was obtained from all subjects involved in the study.

Data Availability Statement

Not applicable.

Conflicts of Interest

The authors declare no conflict of interest.

Appendix A

Table A1. Technologies’ definitions based on several publications.
TechnologiesDefinition
Autonomous RobotsRobots that operate automated processes and interact with humans or other robots in a self-learning manner
SimulationEnables the virtualization of processes and products to test hypotheses
Big Data and AnalyticsSet of technologies and tools capable of processing and analyzing large volumes of data
Cloud ComputingServices that provide access to databases of machines, systems, software, and tools through networks such as the internet
Internet of Things (IoT)Network infrastructure for communication between identifiable things
Vertical and Horizontal System IntegrationIntegration at all levels of manufacturing, both vertically, among the different areas of the industry, and horizontally, encompassing the various stakeholders
Augmented RealityInsertion of the virtual world into the real environment through the combination of 3D elements
Additive ManufacturingUse of 3D printing for the large-scale printing of parts
Cyber securityServices and technologies aimed at protecting users, systems, equipment, networks and industrial data from illicit intrusion
Table A2. IIoT products analyzed in the market study and their features.
Name/Company/ObjectivesFeaturesSensors
Cisco—Cisco Industrial Asset Vision
All- in-one solution that simplifies asset and facility monitoring in outdoor or indoor environments.
Choice of 11 sensors and Cisco LoRaWan gateway. Backed by Osco security. Cloud-based dashboard. Deploy the sensors and the gateway in min, using a QR code. Automated alerts.Temperature and humidity. Door and window. Water leakage. Light level. Room occupancy. Machine or product temperature. Machine vibration.
Movus—Fit Machine
Continuous condition monitoring solution that monitors temperature, vibration, and acoustics. Uses AI/ML to understand and monitor asset operation and health 24/7.
Multiple sensor types. Quick install using magnets. Cloud-based dashboard. Can use existing Wi-Fi infrastructure or the Movus gateway. QR code for quick access to machine data. ML-based failure prediction.Temperature and humidity, (indoor) pressure. Machine temperature. Accelerometer. Microphone.
Bosch—Sense Connect Detect (SCD)-
Attaches to most machines/components. Collects data, wirelessly via Bluetooth and visualized via mobile app, to reduce maintenance costs, maximize machine production, and drive better business decisions.
Equipped with a few sensors and Bluetooth technology. Easy data visualization via mobile app. Easy install (sticker), resistant and attaches to most assets. Battery included.Light intensity. Temperature. Magnetometer. Accelerometer.
Bosch—Connected Industrial Sensor Solution (CISS)
Small multi-sensor device for harsh industrial environments. Provides machine condition monitoring + early detection and localization of potential issues. Data gathered, via Bluetooth and presented on an app, enables further development of predictive and remote maintenance.
Equipped with several sensors and Bluetooth technology. Easy data visualization via mobile app. Easy to install, resistant (−20° to 80°) but no battery (needs wiring).Temperature and humidity (indoor). Light intensity. Machine or product temperature. Pressure. Accelerometer. Gyroscope. Magnetometer. Microphone.
Bosch—Cross Domain Development Kit (XDK)
Combines a wide array of MEMS sensors with a microcontroller. An ARM Cortex M3 processor analyzes, processes and transmits the sensor data. Monitors, controls and analyzes products remotely via Bluetooth or wireless network.
Equipped with sensors. BT and wireless network. Includes ready-to-use software package. Easy installation. Device needs to be programmed. Includes rechargeable battery.Temperature and humidity (indoor). Light intensity. Machine or product temperature. Pressure. Accelerometer. Gyroscope. Magnetometer. Microphone.
Bosch—Intelligent Vibration Analysis System (IVAS)—PROTOTYPE
Compact and robust equipment 2 MEMS acceleration sensors, for high -bandwidth and high-resolution vibration measurements. Integrates into existing communication infrastructure and offers possibilities to implement use case-specific algorithms on the sensor device.
Two accelerometers (high bandwidth + sensitivity). No wireless technology. No web interface or dashboard. Easy installation. Device needs to be programmed. No battery.
Bosch—TRACI
Wireless and secure sensor solution equipped with LoRa and BLE connectivity for location and asset tracking.
Equipped with sensors, GNSS and BT/wireless network technology. Alerts for accident, maintenance, geophone and temperature. Very robust and battery life of up to 5 years.Product and machine temperature. Accelerometer. Microphone.
Sensolus—SNIT 3 Ultra/Compact
Low-power, plug and play solution to manage smaller assets. Universal solution for tracking and locating valuable non-powered assets in indoor and outdoor locations in an extremely simple way.
GPS and sensors. Compact format, does not include pressure sensor. Simple web interface and cloud-based dashboard with alerts. Quick install (plug and play solution) and 5-year battery life.Product and machine temperature. Pressure. Accelerometer. Magnetometer. Microphone.
Eliko—UWB RTLS 2D pilot kit
The 2D pilot is a great way to test a micro positioning use case.
Battery-powered tags; RTLS Server and software for four anchors; four-port PoE switch.
RTLS manager for system configuration and visualization. Four anchors with ethernet and Wi-Fi connectivity options.
Ifm-io—key + accessories
Tank monitoring using a capacitive continuous level sensor. Measurement of compressed air consumption and leakage monitoring using a compressed air meters. Fan monitoring using vibration diagnosis sensors. Valve monitoring using valve sensors.
Equipped with sensors that need to be wired to the gateway. Web-based dashboard for data visualization and analysis. Non- intrusive but requires installation. Sends SMS/Mail Alerts.Compressed air and leakage. Water level. Machine vibration. Valve.
Advantech—WISI 2410—LoRaWAN Wireless Condition Monitoring Sensor
Replaces traditional human inspection, allowing manufacturers to achieve remote detection and 24 h monitoring. Diagnosing through ISO 10816 helps system integrators get started quickly, reducing the entry threshold for preventive maintenance.
Sensors Quick install and plug and play approach. Simple web interface and cloud-based dashboard. Coverage up to 5 km with 2 years of battery life.Machine temperature. Accelerometer.
I-care Wi-care 100 Series System
Plug and play wireless monitoring solution. Automated tracking of critical equipment, from continuous monitoring to once-a-week intervals, collecting reliably, deployed/configured quickly, permanently or used for spot checks during inspection.
Five sensors. Gateway (Wi-care 920). Signal transmission extender available. Quick install and plug and play approach. Simple cloud-based dashboard with real-time alerts/notifications.Machine temperature. Machine vibration. Speed. Ultra sound.
Advantech Wzzard HVAC/Refrigeration/Energy/Condition-Based Monitoring Starter Kit
Provides a non-intrusive, easily scalable and simple to install solution for monitoring. HVAC/refrigeration/energy/condition-based equipment without disrupting facility operations.
Starter kit with sensors. Simple cloud-based dashboard with alerts via SMS/Mail. SmartSwarm Gateway (connecting up to 100 sensors).Temperature and humidity (indoor). Door and window. Current intensity. Machine temperature. Machine vibration. Energy consumption.
Table A3. Specifications of prototype components.
ComponentSensorDetectionMCUProtocolPower
RGB (red, green, blue) nodeAPDS9960Checks the state of the machine status LED, which has four distinct states: off, red, green, blueATSAMD21G18LoRa
LoRaWAN
Two AA Lithium batteries
(autonomy 4.8 months)
Vibration and noise nodeLSM6DSOXTR Six-axis accelerometer and microphone for machine uptime and downtime detection RP2040Wi-fi
MQTT
Plugged
Bluetooth
low-energy (BLE) system
BLE AntennaPresence of operators in specific locationsESP32Wi-fi
MQTT
Plugged
Time-of-Flight (ToF) nodeVL53L1XThis sensor measures the distance to the first object in front of itATSAMD21G18LoRa
LoRaWAN
Two AA Lithium batteries (autonomy 11.7 months)

References

  1. Lewis, M.A. Lean production and sustainable competitive advantage. Int. J. Oper. Prod. Manag. 2000, 20, 959–978. [Google Scholar] [CrossRef]
  2. Krafick, F.J. Triumph of the Lean Production System. Sloan Manag. Rev. 1988, 30, 41–52. [Google Scholar]
  3. Sony, M. Industry 4.0 and lean management: A proposed integration model and research propositions. Prod. Manuf. Res. 2018, 6, 416–432. [Google Scholar] [CrossRef] [Green Version]
  4. Taghavi, V.; Beauregard, Y. The Relationship between Lean and Industry 4.0: Literature Review. In 5th North American Conference on Industrial Engineering and Operations Management in Detroit; IEOM Society International: Southfield, MI, USA, 2020; pp. 808–820. Available online: http://www.ieomsociety.org/detroit2020/papers/189.pdf (accessed on 30 June 2022).
  5. Rother, M.; Shook, J. Learning to See: Value Stream Mapping to Add Value and Eliminate Muda; Lean Enterprise Institute: Cambridge, MA, USA, 2003. [Google Scholar]
  6. Miqueo, A.; Torralba, M.; Yagüe-Fabra, J.A. Lean manual assembly 4.0: A systematic review. Appl. Sci. 2020, 10, 8555. [Google Scholar] [CrossRef]
  7. Hambach, J.; Kümmel, K.; Metternich, J. Development of a Digital Continuous Improvement System for Production. Procedia CIRP 2017, 63, 330–335. [Google Scholar] [CrossRef]
  8. Gallo, T.; Cagnetti, C.; Silvestri, C.; Ruggieri, A. Industry 4.0 tools in lean production: A systematic literature review. Procedia Comput. Sci. 2021, 180, 394–403. [Google Scholar] [CrossRef]
  9. Rahman, M.S.B.A.; Mohamad, E.; Rahman, B.A. Development of IoT—Enabled data analytics enhance decision support system for lean manufacturing process improvement. Concurr. Eng. Res. Appl. 2021, 29, 208–220. [Google Scholar] [CrossRef]
  10. Saravanan, G.; Parkhe, S.S.; Thakar, C.M.; Kulkarni, V.V.; Mishra, H.G.; Gulothungan, G. Implementation of IoT in production and manufacturing: An Industry 4.0 approach. Mater. Today Proc. 2022, 51, 2427–2430. [Google Scholar] [CrossRef]
  11. Rüßmann, M.; Lorenz, M.; Gerbert, P.; Waldner, M.; Justus, J.; Engel, P.; Harnisch, M. Future of Productivity and Growth in Manufacturing. 2015. Available online: https://www.bcg.com/publications/2015/engineered_products_project_business_industry_4_future_productivity_growth_manufacturing_industries (accessed on 30 June 2022). [CrossRef]
  12. Amaral, A.; Jorge, D.; Peças, P. Small medium enterprises and industry 4.0: Current models’ ineptitude and the proposal of current models ’ ineptitude and the proposal of a methodology to successfully implement. Procedia Manuf. 2019, 41, 1103–1110. [Google Scholar] [CrossRef]
  13. Amaral, A.; Peças, P. SMEs and Industry 4.0: Two case studies of digitalization for a smoother integration. Comput. Ind. 2021, 125, 103333. [Google Scholar] [CrossRef]
  14. Sanders, A.; Elangeswaran, C.; Wulfsberg, J. Industry 4.0 implies lean manufacturing: Research activities in industry 4.0 function as enablers for lean manufacturing. J. Ind. Eng. Manag. 2016, 9, 811–833. [Google Scholar] [CrossRef] [Green Version]
  15. Duarte, S.; Cruz-Machado, V.C. An investigation of lean and green supply chain in the Industry 4.0. In Proceedings of the International Symposium on Industrial Engineering and Operations Management (IEOM), Rabat, Marocco, 11–13 April 2017; pp. 255–265. [Google Scholar]
  16. John, L.; Sampayo, M.; Peças, P. Lean & Green on Industry 4.0 Context—Contribution to Understand L & G Drivers and Design Principles. Int. J. Math. Eng. Manag. Sci. 2021, 6, 1214–1229. [Google Scholar] [CrossRef]
  17. Leong, W.D.; Teng, S.Y.; How, B.S.; Ngan, S.L.; Rahman, A.A.; Tan, C.P.; Ponnambalam, S.; Lam, H.L. Enhancing the adaptability: Lean and green strategy towards the Industry Revolution 4.0. J. Clean. Prod. 2020, 273, 122870. [Google Scholar] [CrossRef]
  18. Mollenkopf, D.; Stolze, H.; Tate, W.L.; Ueltschy, M. Green, lean, and global supply chains. Int. J. Phys. Distrib. Logist. Manag. 2010, 40, 14–41. [Google Scholar] [CrossRef]
  19. Xu, X.; Lu, Y.; Vogel-Heuser, B.; Wang, L. Industry 4.0 and Industry 5.0—Inception, conception and perception. J. Manuf. Syst. 2021, 61, 530–535. [Google Scholar] [CrossRef]
  20. Breque, M.; de Nul, L.; Petridis, A. Industry 5.0: Towards a sustainable, human-centric and resilient European industry. Eur. Comm. Publ. Off. 2021. [Google Scholar] [CrossRef]
  21. Ante, G.; Facchini, F.; Mossa, G.; Digiesi, S. Developing a key performance indicators tree for lean and smart production systems. IFAC Pap. Online 2018, 51, 13–18. [Google Scholar] [CrossRef]
  22. Menon, S.; Shah, S.; Coutroubis, A. Impacts of I4.0 on Sustainable Manufacturing to Achieve Competitive Advantage. In Proceedings of the International Conference on Operations and Supply Chain Management (OSCM 2018), Cranfield, UK, 9–12 September 2018. [Google Scholar]
  23. Mayr, A.; Weigelt, M.; Kühl, A.; Grimm, S.; Erll, A.; Potzel, M.; Franke, J. Lean 4.0-A conceptual conjunction of lean management and Industry 4.0. Procedia CIRP 2018, 72, 622–628. [Google Scholar] [CrossRef]
  24. Valamede, L.S.; Akkari, C.A.S. Lean 4.0: A New Holistic Approach for the Integration of Lean Manufacturing Tools and Digital Technologies. IJMEMS 2020, 5, 851–868. [Google Scholar] [CrossRef]
  25. Peças, P.; Gamb, M.; Sampayo, M.; Jorge, D. PDCA 4. 0: A New Conceptual Approach for Continuous Improvement in the Industry 4.0 Paradigm. Appl. Sci. 2021, 11, 7671. [Google Scholar] [CrossRef]
  26. Vinodh, S.; Antony, J.; Agrawal, R.; Douglas, J.A. Integration of continuous improvement strategies with Industry 4.0: A systematic review and agenda for further research. TQM J. 2021, 33, 441–472. [Google Scholar] [CrossRef]
  27. Rittberger, M.S.S. Continuous Improvement of Lean Processes with Industry 4.0 Technologies. In Proceedings of the 11th International Doctoral Students Workshop on Logistics, Magdeburg, Germany, 18 June 2018; pp. 1–6. Available online: https://www.researchgate.net/publication/339178811_Impacts_of_I40_on_Sustainable_Manufacturing_to_achieve_Competitive_Advantage (accessed on 30 June 2022).
  28. Dogan, O.; Gurcan, O.F. Data perspective of lean six sigma in industry 4.0 era: A guide to improve quality. In Proceedings of the International Conference on Industrial Engineering and Operations Management, Paris, France, 26–27 July 2018; pp. 943–953. Available online: http://www.ieomsociety.org/paris2018/papers/170.pdf (accessed on 30 June 2022).
  29. Hu, Q.; Mason, R.; Williams, S.J.; Found, P. Lean implementation within SMEs: A literature review. J. Manuf. Technol. Manag. 2015, 26, 980–1012. [Google Scholar] [CrossRef] [Green Version]
  30. Pena, D.C.; Silva, D.R.; Rigo, P.M.; Henrique, R.; Lima, P. Estudo de tempos e método no setor de envase de uma indústria de produtos para higiene oral. Rev. Produção Ind. Serviços 2016, 3, 26–37. [Google Scholar]
  31. Boenzi, F.; Mossa, G.; Mummolo, G.; Romano, V.A. Workforce Aging in Production Systems: Modeling and Performance Evaluation. Procedia Eng. 2015, 100, 1108–1115. [Google Scholar] [CrossRef] [Green Version]
  32. Digiesi, S.; Facchini, F.; Mossa, G.; Mummolo, G.; Verriello, R. A Cyber—Based DSS for a Low Carbon Integrated Waste Management System in a Smart City. IFAC Pap. Online 2015, 48, 2356–2361. [Google Scholar] [CrossRef]
  33. Parmenter, D. Key Performance Indicators—Developing, Implementing, and Using Winning KPIs; John Wiley & Sons: Hoboken, NJ, USA, 2007. [Google Scholar]
  34. Peron, M.; Sgarbossa, F.; Strandhagen, J.O. Decision support model for implementing assistive technologies in assembly activities: A case study. Int. J. Prod. Res. 2022, 60, 1341–1367. [Google Scholar] [CrossRef]
  35. Staedele, A.E.; Ensslin, S.R.; Forcellini, F.A. Knowledge building about performance evaluation in lean production An investigation on international scientific research. J. Manuf. Technol. Manag. 2019, 30, 798–820. [Google Scholar] [CrossRef]
  36. Bassuk, J.A.; Washington, I.M. The A3 Problem Solving Report_A 10-Step ScientificMethod to Execute Performance Improvements in anAcademic Research Vivarium. PLoS ONE 2013, 8, e76833. [Google Scholar] [CrossRef]
  37. Digiesi, S.; Facchini, F.; Mossa, G.; Mummolo, G. A RULA-Based Optimization Model for Workers’ Assignment to an Assembly Line. In Proceedings of the XVII International Scientific Conference on Industrial Systems, Novi Sad, Serbia, 4–6 October 2017; Volume 17, pp. 8–13. Available online: http://www.iim.ftn.uns.ac.rs/is17 (accessed on 30 June 2022).
  38. Dresch, A.; Veit, D.R.; Lima, P.N.d.; Lacerda, D.P.; Collatto, D.C. Inducing Brazilian manufacturing SMEs productivity with Lean tools. Int. J. Product. Perform. Manag. 2019, 68, 69–87. [Google Scholar] [CrossRef]
  39. Goldacker, F.; de Oliveira, H.J. Set-up: A path to the lean manufacturing. FAE 2008, 11, 1–14. Available online: https://revistafae.fae.edu/revistafae/article/view/332 (accessed on 30 June 2022).
  40. Huang, S.H.; Dismukes, J.P.; Shi, J.; Su, Q.; Razzak, M.A.; Bodhale, R.; Robinson, D.E. Manufacturing productivity improvement using effectiveness metrics and simulation analysis. Int. J. Prod. Res. 2003, 41, 513–527. [Google Scholar] [CrossRef]
  41. Sabadka, D.; Molnár, V.; Fedorko, G.; Jachowicz, T. Optimization of production processes using the yamazumi method. Adv. Sci. Technol. Res. J. 2017, 11, 175–182. [Google Scholar] [CrossRef] [Green Version]
  42. Adnan, A.; Arbaai, N.; Ismail, A. Improvement of overall efficiency of production line by using line balancing. Asian Res. Publ. Netw. (ARPN) J. Eng. Appl. Sci. 2016, 11. Available online: http://www.arpnjournals.org/jeas/research_papers/rp_2016/jeas_0616_4510.pdf (accessed on 30 June 2022).
  43. Pyzdek, T. Diagramas de Espaguete. In The Lean Healtcare Handbook. Management for Professionals; Springer: Cham, Switzerland, 2021; pp. 25–28. [Google Scholar] [CrossRef]
  44. Barnes, R.M. Movement and Time Study: Work Design and Measurement, 1st ed.; Editora Blucher: São Paulo, Brazil, 1977. [Google Scholar]
  45. Liker, J.K. The Toyota Way: 14 Management Principles from the World’s Greatest Manufacturer; McGraw-Hill: New York, NY, USA, 2004. [Google Scholar]
  46. Blaga, P. The importance of human resources in the continuous improvement of the production quality. Procedia Manuf. 2020, 46, 287–293. [Google Scholar] [CrossRef]
  47. Bhuiyan, N.; Baghel, A. An overview of continuous improvement: From the past to the present. Manag. Decis. 2005, 43, 761–771. [Google Scholar] [CrossRef] [Green Version]
  48. Stock, T.; Seliger, G. Opportunities of Sustainable Manufacturing in Industry 4.0. Procedia CIRP 2016, 40, 536–541. [Google Scholar] [CrossRef] [Green Version]
  49. Pereira, A.C.; Romero, F. A review of the meanings and the implications of the Industry 4.0 concept. Procedia Manuf. 2017, 13, 1206–1214. [Google Scholar] [CrossRef]
  50. Ogrean, C.; Herciu, M. Romania’s SMEs on the Way to EU’s Twin Transition to Digitalization and Sustainability. Stud. Bus. Econ. 2021, 16, 282–295. [Google Scholar] [CrossRef]
  51. Ortega-Gras, J.J.; Bueno-Delgado, M.V.; Cañavate-Cruzado, G.; Garrido-Lova, J. Twin Transition through the Implementation of Industry 4.0 Technologies: Desk-Research Analysis and Practical Use Cases in Europe. Sustainability 2021, 13, 13601. [Google Scholar] [CrossRef]
  52. Kamble, S.S.; Gunasekaran, A.; Gawankar, S.A. Sustainable Industry 4.0 framework: A systematic literature review identifying the current trends and future perspectives. Process Saf. Environ. Prot. 2018, 117, 408–425. [Google Scholar] [CrossRef]
  53. Lu, Y. Industry 4.0: A survey on technologies, applications and open research issues. J. Ind. Inf. Integr. 2017, 6, 1–10. [Google Scholar] [CrossRef]
  54. Narula, S.; Prakash, S.; Dwivedy, M.; Talwar, V.; Tiwari, S.P. Industry 4.0 adoption key factors: An empirical study on manufacturing industry. Emerald Insight 2020, 17, 697–725. [Google Scholar] [CrossRef]
  55. Kamble, S.S.; Gunasekaran, A.; Ghadge, A.; Raut, R. A performance measurement system for industry 4.0 enabled smart manufacturing system in SMMEs- A review and empirical investigation. Int. J. Prod. Econ. 2020, 229, 107853. [Google Scholar] [CrossRef]
  56. Dalmarco, G.; Ramalho, F.R.; Barros, A.C.; Soares, A.L. Providing industry 4.0 technologies: The case of a production technology cluster. J. High Technol. Manag. Res. 2019, 30, 100355. [Google Scholar] [CrossRef]
  57. Amaral, A.; Peças, P. A Framework for Assessing Manufacturing SMEs Industry. Appl. Sci. 2021, 11, 6127. [Google Scholar] [CrossRef]
  58. Rosin, F.; Forget, P.; Lamouri, S.; Pellerin, R. Impacts of Industry 4.0 technologies on Lean principles. Int. J. Prod. Res. 2020, 58, 1644–1661. [Google Scholar] [CrossRef]
  59. Agostinho, V.; Baldo, C.R. Assessment of the impact of Industry 4.0 on the skills of Lean professionals. Procedia CIRP 2021, 96, 225–229. [Google Scholar] [CrossRef]
  60. Ionel, D.S.; Opran, C.G.; Valimareanu, B.C. Lean Manufacturing 4.0—Dynamic physical and cybernetic system for Industry 4.0. IOP Conf. Ser. Mater. Sci. Eng. 2020, 916, 10. [Google Scholar] [CrossRef]
  61. Anosike, A.; Alafropatis, K.; Garza-Reyes, J.A.; Kumar, A.; Luthra, S.; Rocha-Lona, L. Lean manufacturing and internet of things—A synergetic or antagonist relationship? Comput. Ind. 2021, 129, 103464. [Google Scholar] [CrossRef]
  62. Wagner, T.; Herrmann, C.; Thiede, S. Industry 4.0 impacts on lean production systems. Procedia CIRP 2017, 63, 125–131. [Google Scholar] [CrossRef]
  63. Okano, M.T. IOT and Industry 4.0: The Industrial New Revolution. In Proceedings of the International Conference on Management and Information Systems, Istanbul, Turkey, 17–20 October 2017; pp. 75–82. Available online: http://www.icmis.net/icmis17/icmis17cd/pdf/S188.pdf (accessed on 30 June 2022).
  64. Peralta, G.; Iglesias-Urkia, M.; Barcelo, M.; Gomez, R.; Moran, A.; Bilbao, J. Fog computing based efficient IoT scheme for the Industry 4.0. IEEE Int. Work. Electron. Control. Meas. Signals Appl. Mechatron. 2017, 1–6. [Google Scholar] [CrossRef]
  65. Hwang, G.; Lee, J.; Park, J.; Chang, T.-W. Developing performance measurement system for Internet of Things and smart factory environment. Int. J. Prod. Res. 2017, 55, 2590–2602. [Google Scholar] [CrossRef]
  66. Mrugalska, B.; Wyrwicka, M.K. Towards Lean Production in Industry 4.0. Procedia Eng. 2017, 182, 466–473. [Google Scholar] [CrossRef]
  67. CEFRIO. Prendre Part à la Révolution Manufacturière? Du Rattrapage Technologique à l’Industrie 4.0 chez les PME [Getting on the Manufacturing Revolution? Technological Catching Up with Industry 4.0 by SME]. CEFRIO 2016. Available online: https://espace2.etsmtl.ca/id/eprint/14578/1/Prendre-part-à-la-révolution-manufacturière-Du-rattrapage-technologique-à-l’Industrie-4.0-chez-les-PME.pdf (accessed on 30 June 2022).
  68. Al-Ahmari, A.M.; Abidi, M.H.; Ahmad, A.; Darmoul, S. Development of a virtual manufacturing assembly simulation system. Adv. Mech. Eng. 2016, 8, 1–13. [Google Scholar] [CrossRef] [Green Version]
  69. Narula, S.; Puppala, H.; Kumar, A.; Luthra, S.; Dwivedy, M.; Prakash, S.; Talwar, V. Are Industry 4.0 technologies enablers of lean? Evidence from manufacturing industries. Int. J. Lean Six Sigma 2022. [Google Scholar] [CrossRef]
  70. Tripathi, V. A Sustainable Methodology Using Lean and Smart Manufacturing for the Cleaner Production of Shop Floor Management in Industry 4.0. Mathematics 2022, 10, 347. [Google Scholar] [CrossRef]
  71. Javaid, M.; Haleem, A.; Singh, R.P.; Rab, S.; Suman, R.; Khan, S. Exploring relationships between Lean 4.0 and manufacturing industry. Ind. Rob. 2022, 49, 402–414. [Google Scholar] [CrossRef]
  72. Rifqi, H.; Zamma, A.; Souda, S.B.; Hansali, M. Positive Effect of Industry 4.0 on Quality and Operations Management. Int. J. Online Biomed. Eng. 2021, 17, 133–147. [Google Scholar] [CrossRef]
  73. Tripathi, V. A Novel Smart Production Management System for the Enhancement of Industrial Sustainability in Industry 4.0. Math. Probl. Eng. 2022, 2022, 6424869. [Google Scholar] [CrossRef]
  74. Zarrar, A.; Rasool, M.H.; Raza, S.M.M.; Rasheed, A. IoT-Enabled Lean Manufacturing: Use of IoT as a Support Tool for Lean Manufacturing. In Proceedings of the 2021 International Conference on Artificial Intelligence of Things (ICAIoT), Virtual Conference, 3–4 September 2021; Volume 2021, pp. 15–20. [Google Scholar] [CrossRef]
  75. Fukuzawa, M.; Sugie, R.; Park, Y.; Shi, J. An Exploratory Case Study on the Metrics and Performance of IoT Investment in Japanese Manufacturing Firms. Sustainability 2022, 14, 2708. [Google Scholar] [CrossRef]
  76. Simonetto, M.; Peron, M.; Fragapane, G.; Sgarbossa, F. Digital Assembly Assistance System in Industry 4.0 Era: A Case Study with Projected Augmented Reality. Adv. Manuf. Autom. X 2021, 644–651. Available online: https://ntnuopen.ntnu.no/ntnu-xmlui/bitstream/handle/11250/2729767/Simonetto_DigitalAssemblyAssistanceSysteminIndustry4.0era.pdf?sequence=1 (accessed on 30 June 2022).
  77. Simonetto, M.; Arena, S.; Peron, M. A methodological framework to integrate motion capture system and virtual reality for assembly system 4.0 workplace design. Saf. Sci. 2022, 146, 105561. [Google Scholar] [CrossRef]
  78. Vlachos, I.P.; Pascazzi, R.M.; Zobolas, G.; Repoussis, P.; Giannakis, M. Lean manufacturing systems in the area of Industry 4.0: A lean automation plan of AGVs/IoT integration. Prod. Plan. Control 2021, 9537287. [Google Scholar] [CrossRef]
  79. Cifone, F.D.; Hoberg, K.; Holweg, M.; Staudacher, A.P. ‘Lean 4.0’: How can digital technologies support lean practices? Int. J. Prod. Econ. 2021, 241, 108258. [Google Scholar] [CrossRef]
  80. Lu, Y.; Liu, Z.; Min, Q. A digital twin-enabled value stream mapping approach for production process reengineering in SMEs. Int. J. Comput. Integr. Manuf. 2021, 34, 764–782. [Google Scholar] [CrossRef]
  81. Meister, M.; Bessle, J.; Cviko, A.; Boing, T.; Metternich, J. Manufacturing Analytics for problem-solving processes in production. Procedia CIRP 2019, 81, 1–6. [Google Scholar] [CrossRef]
  82. Chen, B.; Wan, J.; Shu, L.; Li, P.; Mukherjee, M.; Yin, B. Smart Factory of Industry 4.0: Key Technologies, Application Case, and Challenges. IEEE Access 2017, 6, 6505–6519. [Google Scholar] [CrossRef]
  83. Rüttimann, B.G.; Stöckli, M.T. Lean and Industry 4.0—Twins, Partners, or Contenders? A Due Clarification Regarding the Supposed Clash of Two Production Systems. J. Serv. Sci. Manag. 2016, 9, 485–500. [Google Scholar] [CrossRef] [Green Version]
  84. de Ugarte, B.S.; Artiba, A.; Pellerin, R. Manufacturing execution system—A literature review. Prod. Plan. Control 2009, 20, 525–539. [Google Scholar] [CrossRef]
  85. Ray, P.P. A survey on Internet of Things architectures. J. King Saud Univ. Comput. Inf. Sci. 2018, 30, 291–319. [Google Scholar] [CrossRef] [Green Version]
  86. Lin, J.; Yu, W.; Zhang, N.; Yang, X.; Zhang, H.; Zhao, W. A Survey on Internet of Things: Architecture, Enabling Technologies, Security and Privacy, and Applications. IEEE Internet Things J. 2017, 4, 1125. [Google Scholar] [CrossRef]
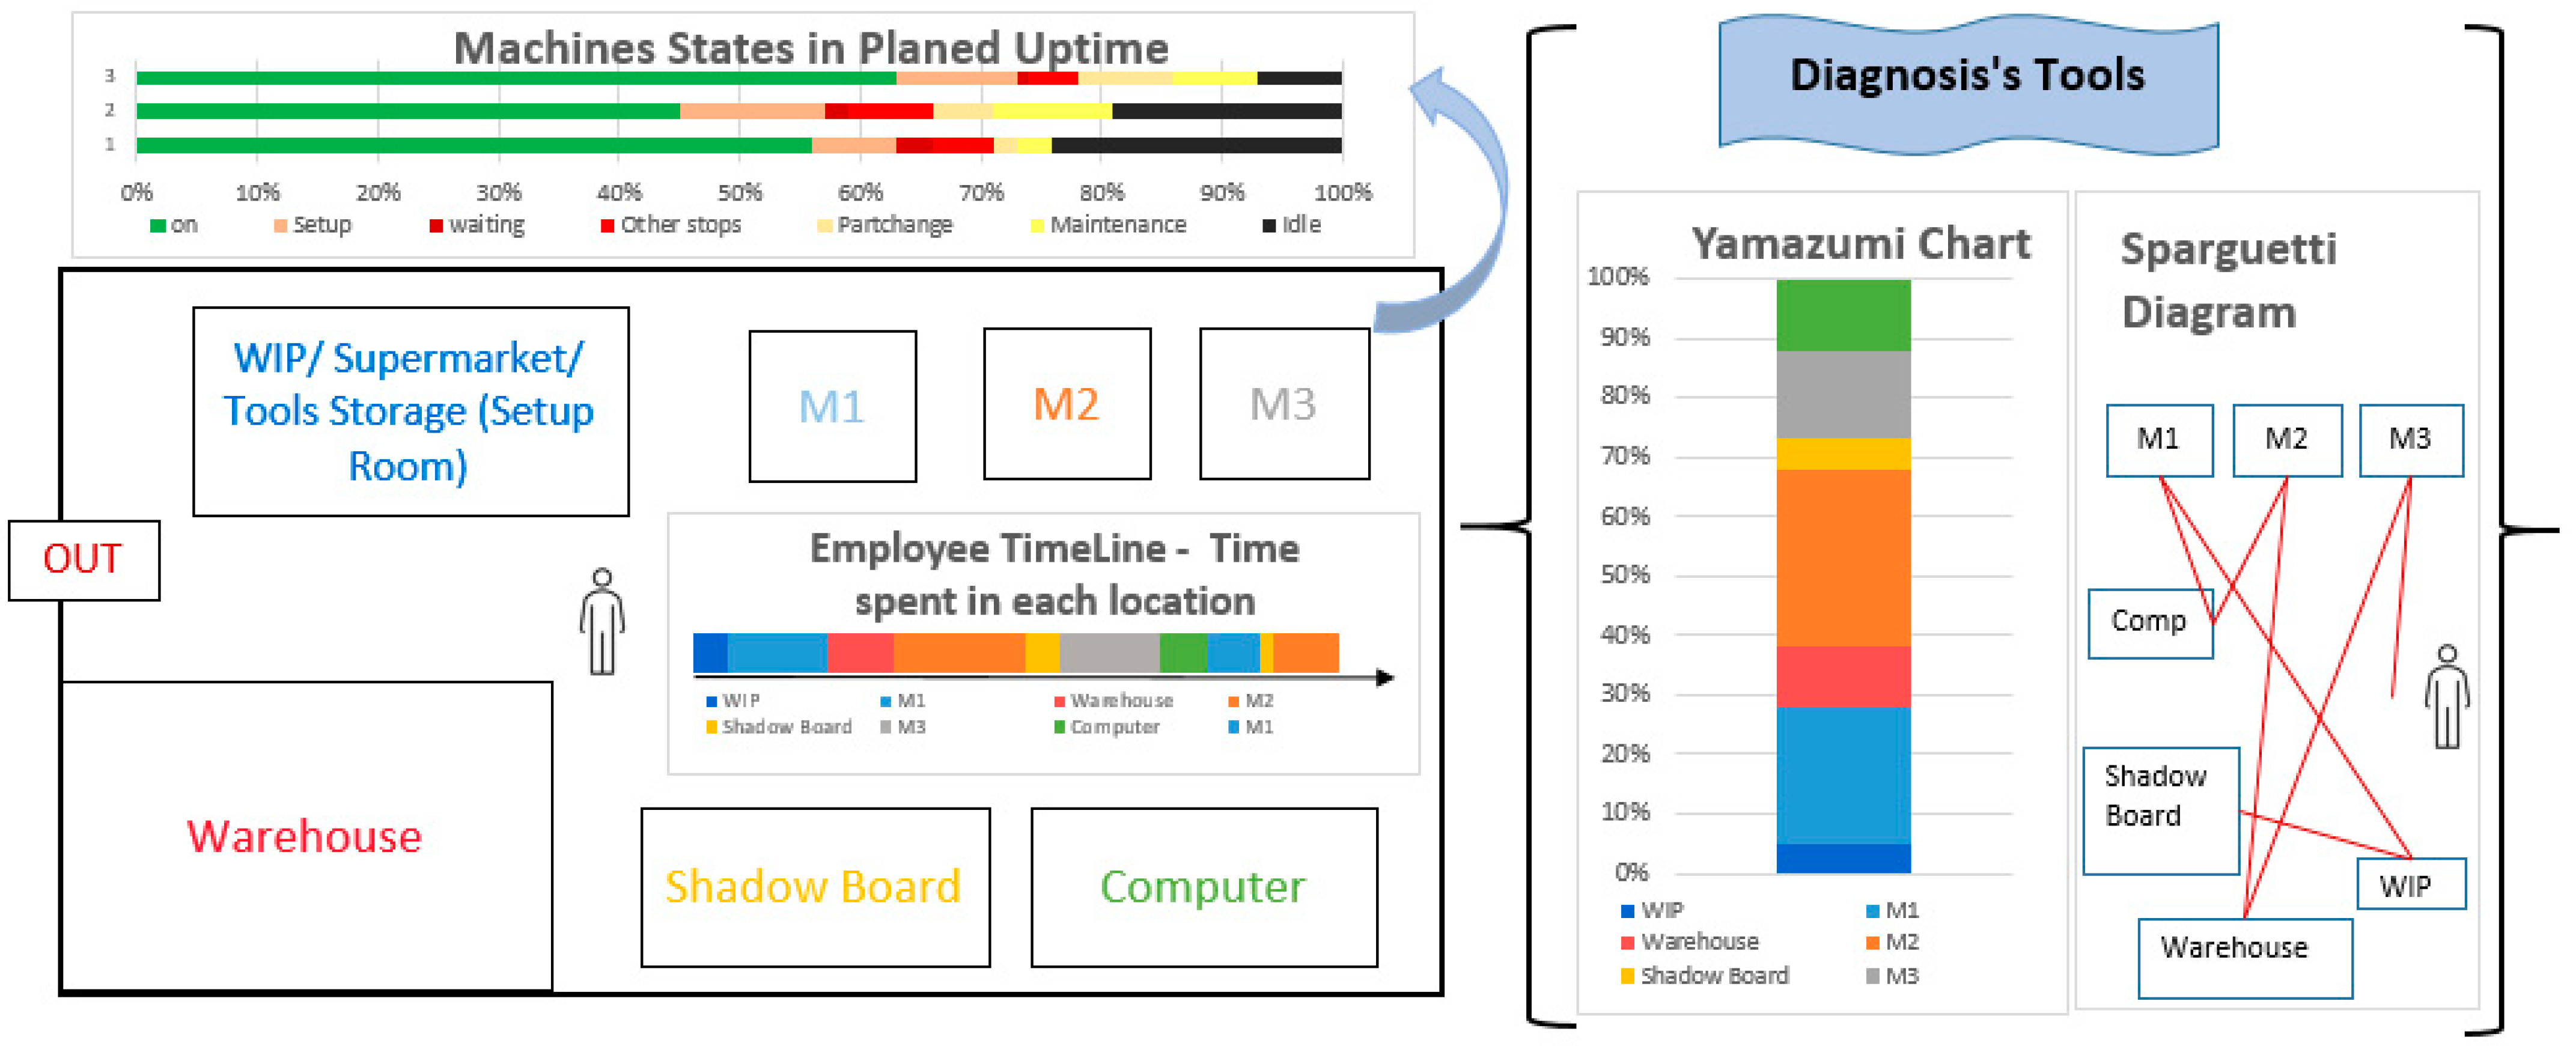
Figure 1. A common report of a DD created by a CI Team.
Sustainability 14 09687 g001
Figure 2. Correlation between Lean principles and technologies of I4.0, based on Rosin et al. [58], a literature review comprising papers from 2011 to 2019.
Sustainability 14 09687 g002
Figure 3. Workstation layout with the sensors and IoT communication technologies used, as well as three layers of the IoT architecture.
Sustainability 14 09687 g003
Figure 4. ADD prototype tests assembled, including the BLE system (red), the ToF node (yellow), the RGB node (purple), and the vibration node placed on the frame of the monitored machine (green).
Sustainability 14 09687 g004
Figure 5. TB dashboard for M1: LED color (blue), machine state (green), BLE beacon signal strength for operators O10 (red) and O11 (purple), and the presence of an operator in front of the computer (yellow).
Sustainability 14 09687 g005
Figure 6. Map of the factory’s monitored area.
Sustainability 14 09687 g006
Figure 7. Distribution of time spent by each employee at the monitored locations. Other locations reflect the times outside the monitored locations.
Sustainability 14 09687 g007
Figure 8. Annotated dashboard of an M3 micro-stop: vibration (blue), employees near M3, other machines and M1 (employee 1 in blue and employee 2 in orange), someone in front of computers (red), someone in front of M1 programming panel (green). The dashboard is repeated 3 times with notes regarding the movement of employees.
Sustainability 14 09687 g008
Figure 9. Yamazumi chart indicating the time (in minutes) spent by Employee 2 (O11) in the five monitored locations (and outside those—“other locations”) during the setup. For reference, the duration of each setup is given.
Sustainability 14 09687 g009
Figure 10. Dashboard of an M3 setup: vibration (blue), M3 state (red), spindle on (green), employees near M3 and M1 (employee 1 in blue and employee 2 in orange), someone in front of computers (red), someone in front of the M1 programming panel (green), employees near M2, someone in front of the M2 programming panel (purple), employees near the prepping stand and other machines.
Sustainability 14 09687 g010
Table 1. Approximate and detailed cost of goods for each prototype device.
Vibration and Noise Node RGB Node ToF Node BLE System Gateway
Arduino Nano RP2040 Connect IStartlab Board with Antenna IStartlab Board with Antenna ESP32LtAP LR8 LTE kit by MikroTik
Device Board (EUR) 22 19 19 12
Sensor or Beacon (EUR)X RGB Sensor ToF Sensor 1x Beacon
4 7 13
Power Cable & Adapter (EUR) 7XX 7
Box (EUR) 2 4 4
Total (EUR) 31 27 30 34 230
Table 2. Sensors, functionalities, and measurements of the performed tests, together with the requirements.
TypeSensorsFunctionNodesRequirements
Machine Monitoring
Tests IStartLab
Luminosity SensorUnderground roomLDRMachine status
Light-dependent resistor (LDR) working as a luminosity sensor
Distance SensorMeasure the height of the base plate of the printerToFMachine status
Machine Monitoring (State)LED Associated with RGB SensorTo follow the color of the machine’s state indicator from the appRGBMachine status
Variation of Accelerometer ValuesMonitoring variations in the accelerometer valuesVibrationMachine status
Employee Location MonitoringBeaconTo identify whether a beacon was at a certain location in a particular instantBLEOperator monitoring, flexible, non-intrusive and low cost
Table 3. Events imposed and the resulting timestamps of the sensors (+ means a delay observed inferior to 60 s).
NTimestampEventSensorTime Read
119:00M1 REDRGB19:01
219:05O10 NEAR M1 BEACON 19:05
in front of COMPUTERToF19:05+
319:06M1 BLUERGB19:06+
419:10O10 away from computerBEACON + ToF19:10
M1 ONVIBRATION19:10+
M1 GREENRGB19:10++
519:15O11 NEAR M1BEACON19:15
619:17O11 in front of computerToF19:17
719:20O11 away from M1BEACON19:20+
819:22O10 in front of computerToF19:22
M1 BLUERGB19:22
M1 OFFVIBRATION19:22
919:25O10 away from M1BEACON19:25+
1019:30O10 and O11 NEAR M1BEACON19:30+
1119:32O10 in front of computerToF19:32
1219:35O10 away from computerToF19:35
M1 GREENRGB19:35+
M1 ONVIBRATION19:35
1319:38O11 away from M1BEACON19:38
1419:40O10 AWAY FROM M1BEACON19:40+
1519:43O10 NEAR M1 BEACON19:43
M1 REDRBG19:43+
M1 OFFVIBRATION19:43+
1619:45M1 COLOR OFFRGB19:45
Table 4. Variables and description of prototype node.
VariablesDescriptionPrototype Node
M1-RGBIndicates the color and timestamp of the changes in the light indicator of machine 1 that correspond to the state of the machine. {0: off, 1: red, 2: green, 3: blue}RGB node
M3V
M3N
Contains the timestamp, vibration values (M3V) and noise energy values (M3N) captured from the frame of machine 3, which needs processing to provide categorical information about the machine’s state.Vibration and
noise node
Loc 1
Loc 2
Loc 3
Loc 4
Loc 5
Contains the timestamp, the beacon ID (1—employee 1 or 2—employee 2), the state (0—away, 1—near) and the RSSI values captured by the BLE Receivers located near machine 1 (Loc 1), machine 2 (Loc 2), machine 3 (Loc 3), the prepping stand (Loc 4) and in the an extra area with some other machines (Loc 5).BLE Receiver 1
BLE Receiver 2
BLE Receiver 3
BLE Receiver 4
BLE Receiver 5
ToF 0
ToF 1
ToF 2
Contains the timestamp and the distance to the first object in front of the devices attached the computers of machine 1 (ToF 0), and programing panels of machine 2 (ToF 1) and Machine 1 (ToF 2).ToF node 0
ToF node 1
ToF node 2
Table 5. Total uptime of machine 1 (during 2 weeks) and machine 3 (during 4 weeks) retrieved by the ADD prototype and by the embedded system available in the company.
Machine 1Machine 3
WeeksADD Prototype
(RGB Node)
CompanyΔΔ(%)ADD Prototype
(V&N Node)
CompanyΔΔ(%)
17 h 34 m7 h 32 m2 m0.1%41 h 28 m41 h 27 m1 m0.01%
222 h 09 m22 h 10 m1 m0.03%46 h 18 m45 h 17 m1 h 1 m0.84%
3 47 h 20 m42 h 35 m4 h 45 m3.95%
4 36 h 40 m36 h 53 m13 m0.18%
1 a 429 h 43 m29 h 42 m1 m0.10%171 h 45 m166 h 12 m5 h 33 m1.16%
Table 6. The total micro-stops (MS) of Machine 3 that occurred during the case study. Comparison between the prototype and the system from the company.
PrototypeCompanyΔ(%)
Number of MS1091080.9%
MS Total Time13 h 50 m14 h 55 m7.3%
Table 7. Comparison between MS with action from employees and MS without action from employees, from the MS detected by the prototype. The table contains the total number of MSs and the average and median of the MS durations in each situation.
Total MSs Mean MS Duration Median MS Duration
MS with Employee Action 798 m 30 s 7 m
MS without Employee Action 304 m3 m 12 s
Table 8. Summary of the actions of MS.
TimestampEvent
108:55–9:00O10 Displacement M3 to M1/computers
O11 NEAR M1
209:05M3 MICRO STOPS
309:06O11 NEAR M3
409:06–09:07O11 Displacement M3 to other machines
509:08O11 NEAR M1/Computers
609:08–09:12O11 in front of computer
709:12O11 NEAR M3
809:12M3 RESTARTS
Publisher’s Note: MDPI stays neutral with regard to jurisdictional claims in published maps and institutional affiliations.