Article

Economic and Environmental Assessment of Biomass Power Plants in Southern Italy

1
Department of Engineering, University of Palermo, Viale delle Scienze, Bld 8, 90128 Palermo, Italy
2
Department of Engineering, University of Messina, Contrada di Dio, 98166 Messina, Italy
*
Author to whom correspondence should be addressed.
Sustainability 2022, 14(15), 9676; https://doi.org/10.3390/su14159676
Submission received: 10 July 2022 / Revised: 1 August 2022 / Accepted: 4 August 2022 / Published: 5 August 2022
(This article belongs to the Special Issue Sustainable Reuse of Waste towards Circular Economy)

Abstract

:
In 2019, Europe adopted the New Green Deal as a strategic plan to become a competitive, resource-efficient, and driven economy by reducing its gas emissions and carbon footprint. Due the COVID-19 pandemic, this strategic plan was recently updated to expedite the green transition of European industries. Therefore, the present paper deals with the problem of deciding an appropriate size for a biomass plant that directly produces electric energy by means of two different conversion processes: combustion and gasification. After an initial estimation of the energy potential in western Sicily, GIS data of biomass growth were used to identify the appropriate size for the power plants under investigation. The economic feasibility of biomass utilization was evaluated over a capacity range of 10 to 30 MW, considering total capital investments, revenues from energy sales, and total operating costs. Moreover, the effect of variations on incentive prices was analyzed by means of a sensitivity analysis. Comparing the different plant solutions considered, the environmental sustainability was also analyzed using the life cycle assessment (LCA) approach. The results showed that the combustion solution had a higher profitability and a lower environmental impact for each plant size. The obtained results also demonstrated that providing power from residual biomass in small agricultural communities would significantly reduce their environmental impacts while improving the economic feasibility of their waste management practices.

1. Introduction

Supporting renewable energy production is one of the main priorities of the European Union (EU)’s policy agenda [1]. The final goal is a reduction in greenhouse gas (GHG) emissions that fulfils the targets defined at the Paris Conference of Parties 21 [2]. In this way, it will be possible to reduce European countries’ dependence on fossil fuels imported from abroad. Nevertheless, renewable electricity capacity additions in Europe declined by 13% in 2020 compared with 2019, probably due to the concurrent health emergency. In fact, lockdown procedures delayed the construction of new power plants, owing to logistical issues, social distancing measures, and funding reductions. Fortunately, some of these problems are short-term impacts of the COVID-19 pandemic, and additions are expected to rebound in 2021, possibly approaching the levels of 2019 [3]. From the perspective of renewable power production, Sicily—in particular the area of Trapani—has abundant biomass resources arising from the agricultural sector. Specifically, the generation of products such as wine and olive oil makes available significant amounts of residues after harvesting and processing. As a result, the efficient utilization of these agricultural residues is crucial for providing bioenergy, reducing the environmental impact, and supporting the rural sector. Therefore, the present study focuses on the main agricultural biomasses produced in large quantities in the western part of Sicily which are available for future power generation. A geographic information system (GIS) model was introduced as the first step towards the development of an integrated decision support system for studying the impact of investments in renewable energy. In this regard, a recent review described the development of GIS data models for finding more appropriate locations for power plants based on the geographical biomass availability and other energy-related parameters [4]. In agriculture, GISs have already been used for many purposes, such as the optimization of agro-engineering processes [5], shelf-life monitoring [6], and planting management [7]. The use of GISs for renewable energy site selection has been considered previously at the local, regional, and national levels [8,9,10,11,12]. In the context of the present paper, the GIS model was applied to the identification and characterization of potential biomass utilization for the specific area considered. In future work, this information will serve as the basis for determining a suitable location for a biomass farm. In this paper, after an initial estimation of the energetic potential of the available biomass, we determined an appropriate size for a power plant that directly produces electric energy by means of combustion and gasification conversion processes. The economic feasibility of the different types of power plant was evaluated, considering total capital investments, revenues from energy sales, and total operating costs. Moreover, the effect of variations on incentive prices was analyzed by means of a sensitivity analysis. To test the environmental impact, the life cycle assessment (LCA) methodology was used. As far as the authors are aware, this is the first study in which both of these aspects of sustainability are considered simultaneously. The results demonstrated that generating power from residual biomass in small agricultural communities would significantly reduce their environmental impacts while making their waste management practices economically feasible.

2. Materials and Methods

2.1. Energy Content of Biomass Sources

Data reported in [13] highlight that Southern Italy produces a large amount of agricultural residues and generates most of the pruning and pomace residues of the whole country. These numbers further prove the potential of agricultural residues for energy production. The largest concentrated source of agricultural residues is in western Sicily, and it mainly derives from the annual and periodic pruning of vineyards, olive groves, citrus groves, almond groves, and orchards. This biomass consists of branches removed by pruning, which are commonly burned on site by farmers. In the area of Trapani, biomass production mainly derives from grapes and olives scraps (Figure 1).
Therefore, the present study focuses on these two types of biomass, also taking into account the waste derived from the extraction process (i.e., pomace) of olives. The maximum energy contribution is summarized in Table 1, with LHV indicating the lower heating value.
The electrical energy power output Pe (MW) can be calculated with the following equation:
P e = M · LHV · η e 3600 · H ,
where M (ton/year) is the amount of biomass, ηe is the plant energy conversion efficiency, and H is the plant annual operating hours (hours/year). Based on Equation (1) and assuming the total operating hours of 8000/year and a mean conversion efficiency of 30% [14], the maximum plant size was calculated to be about 30 MW.

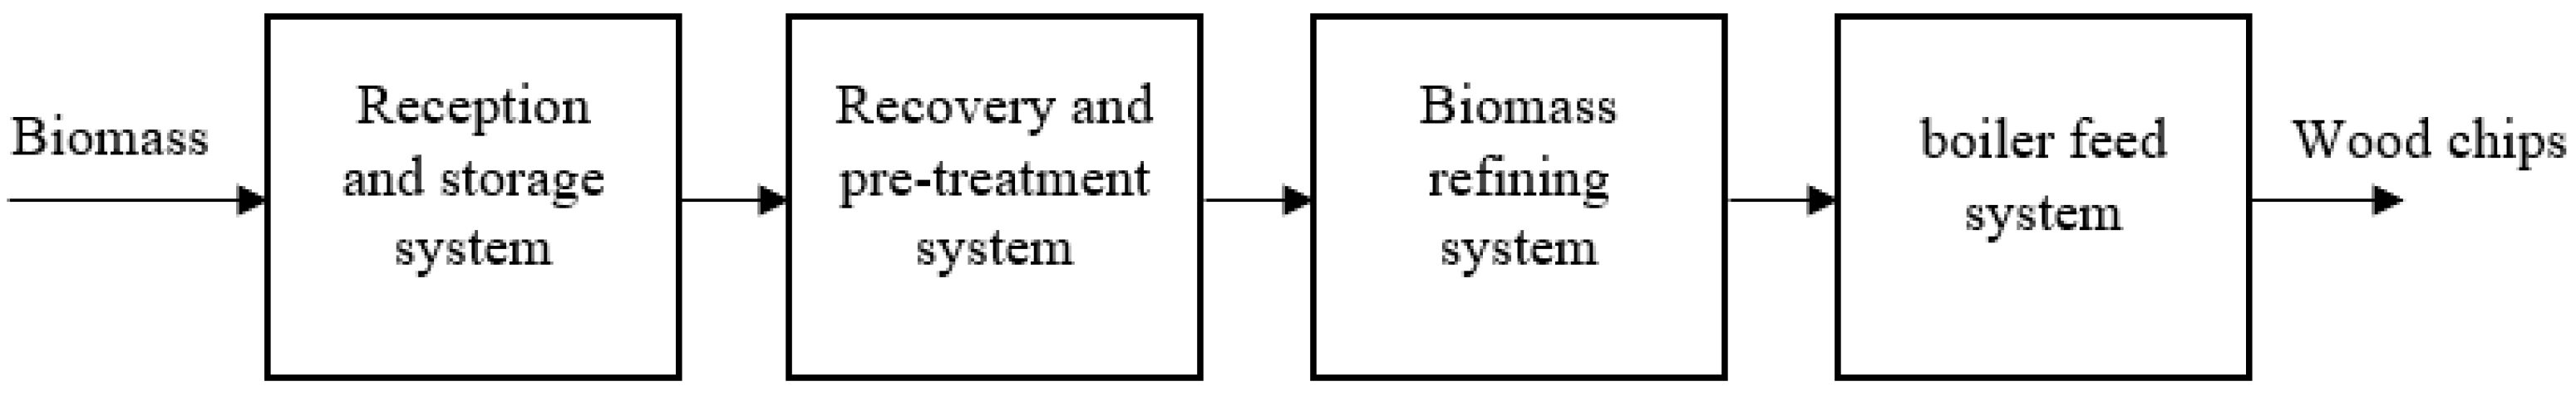
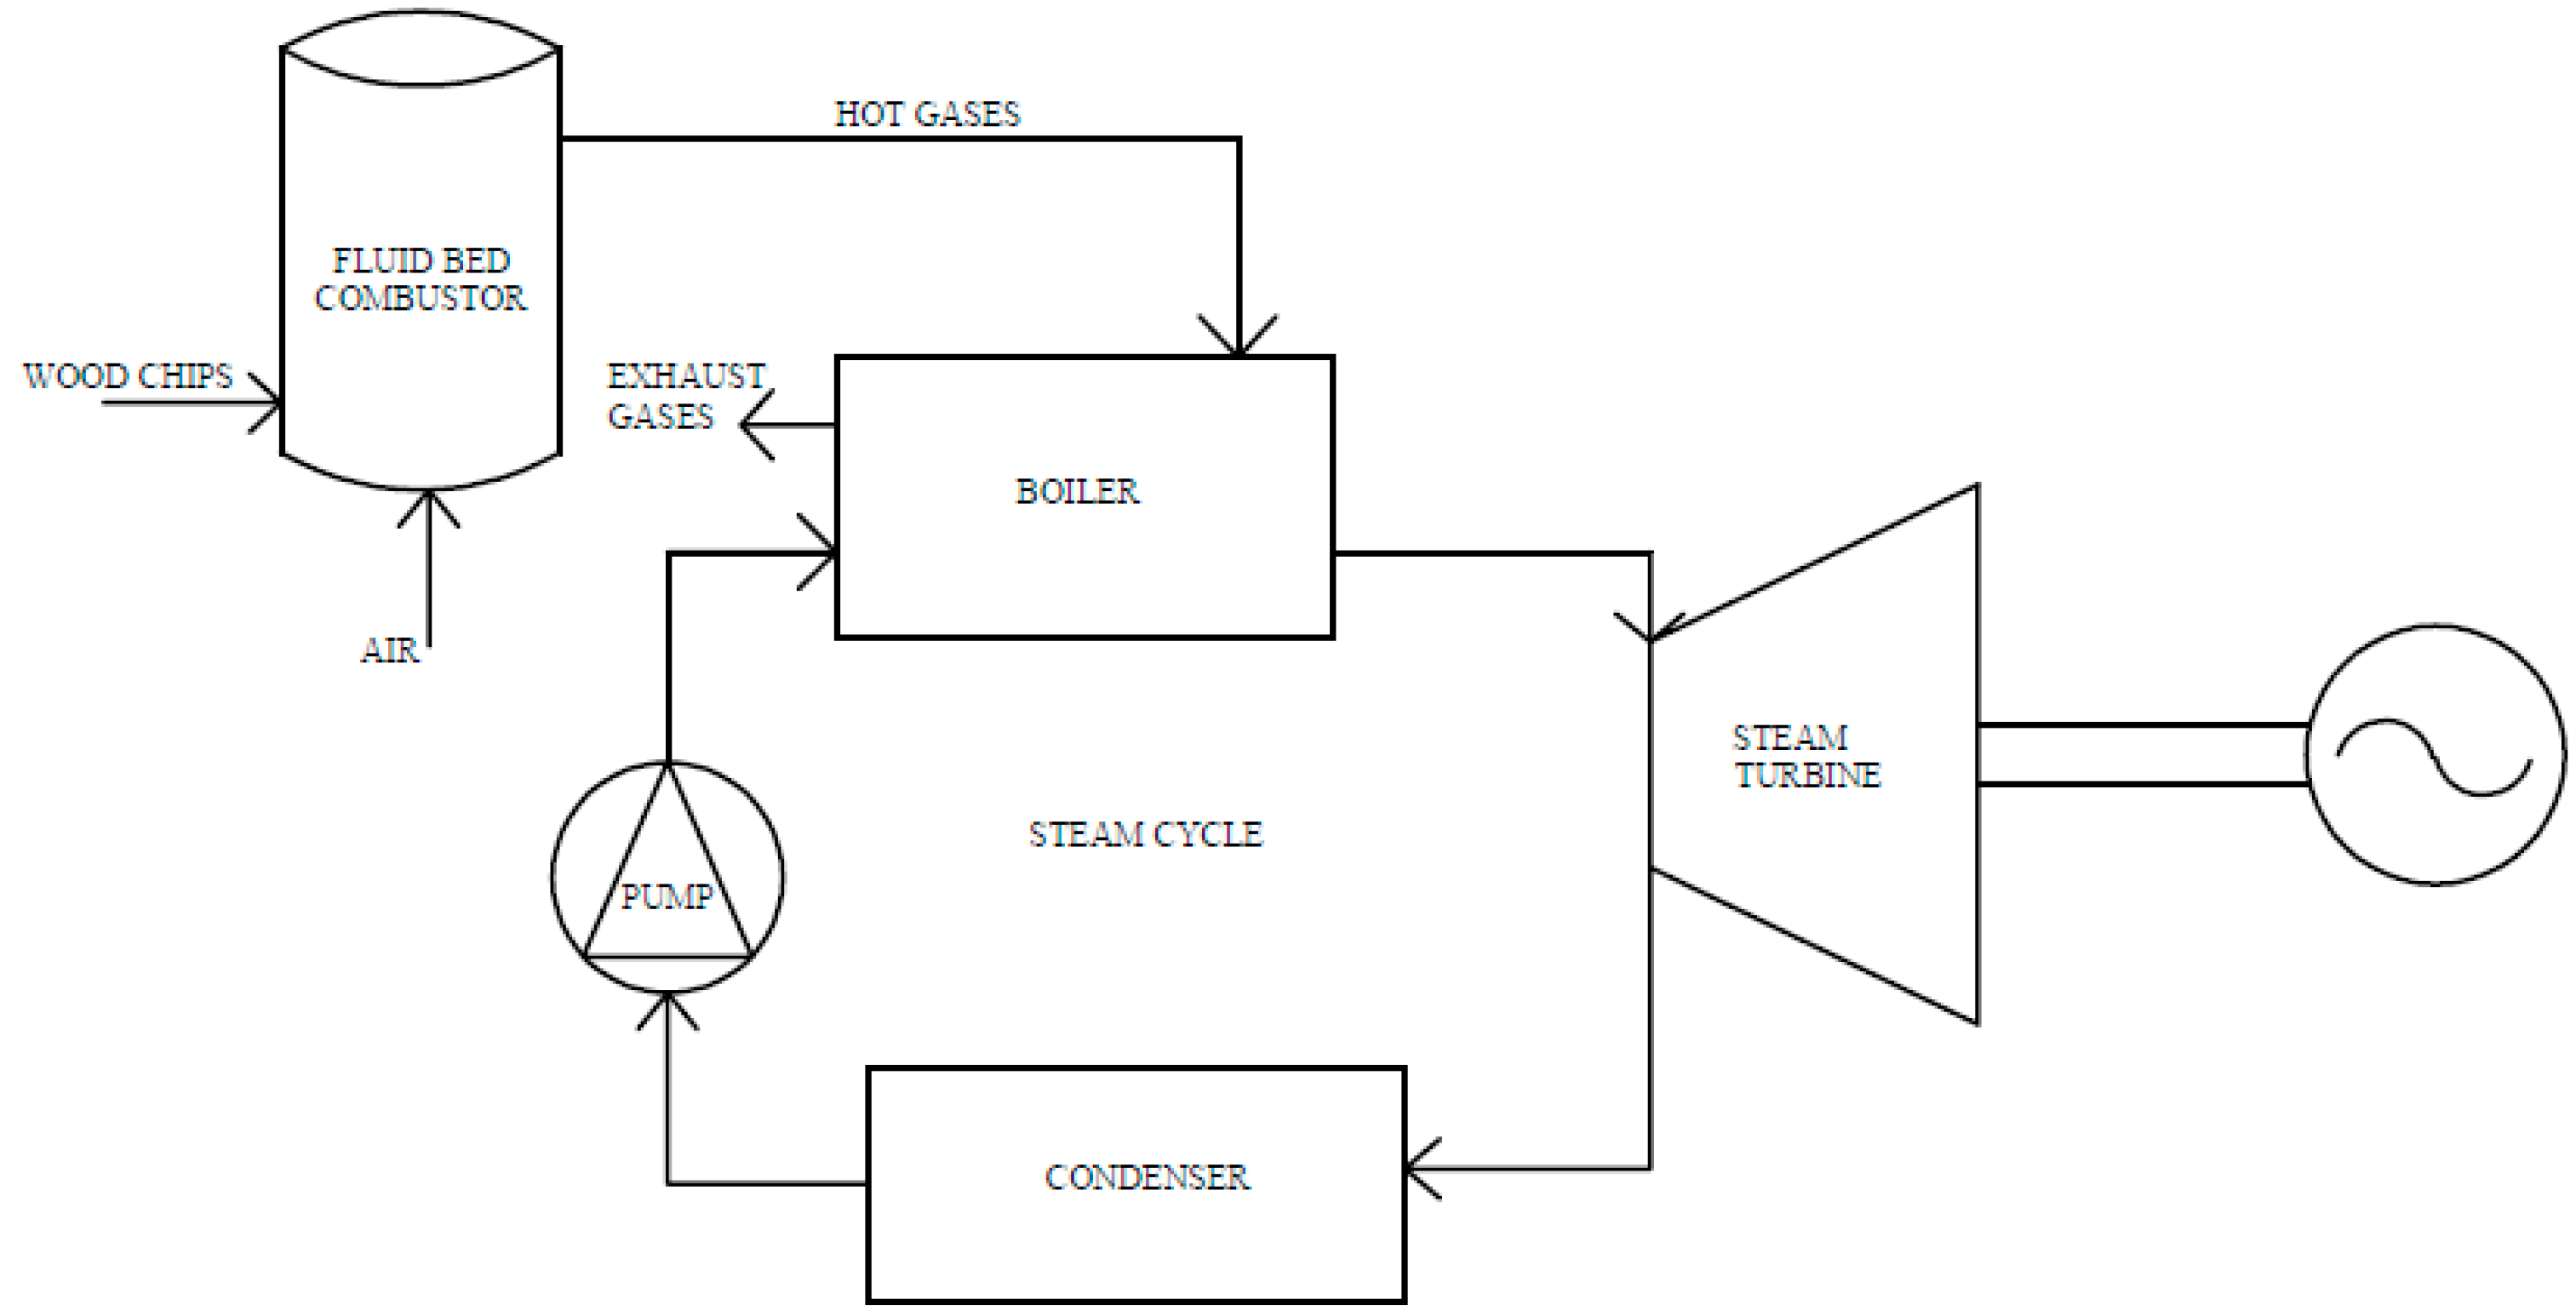
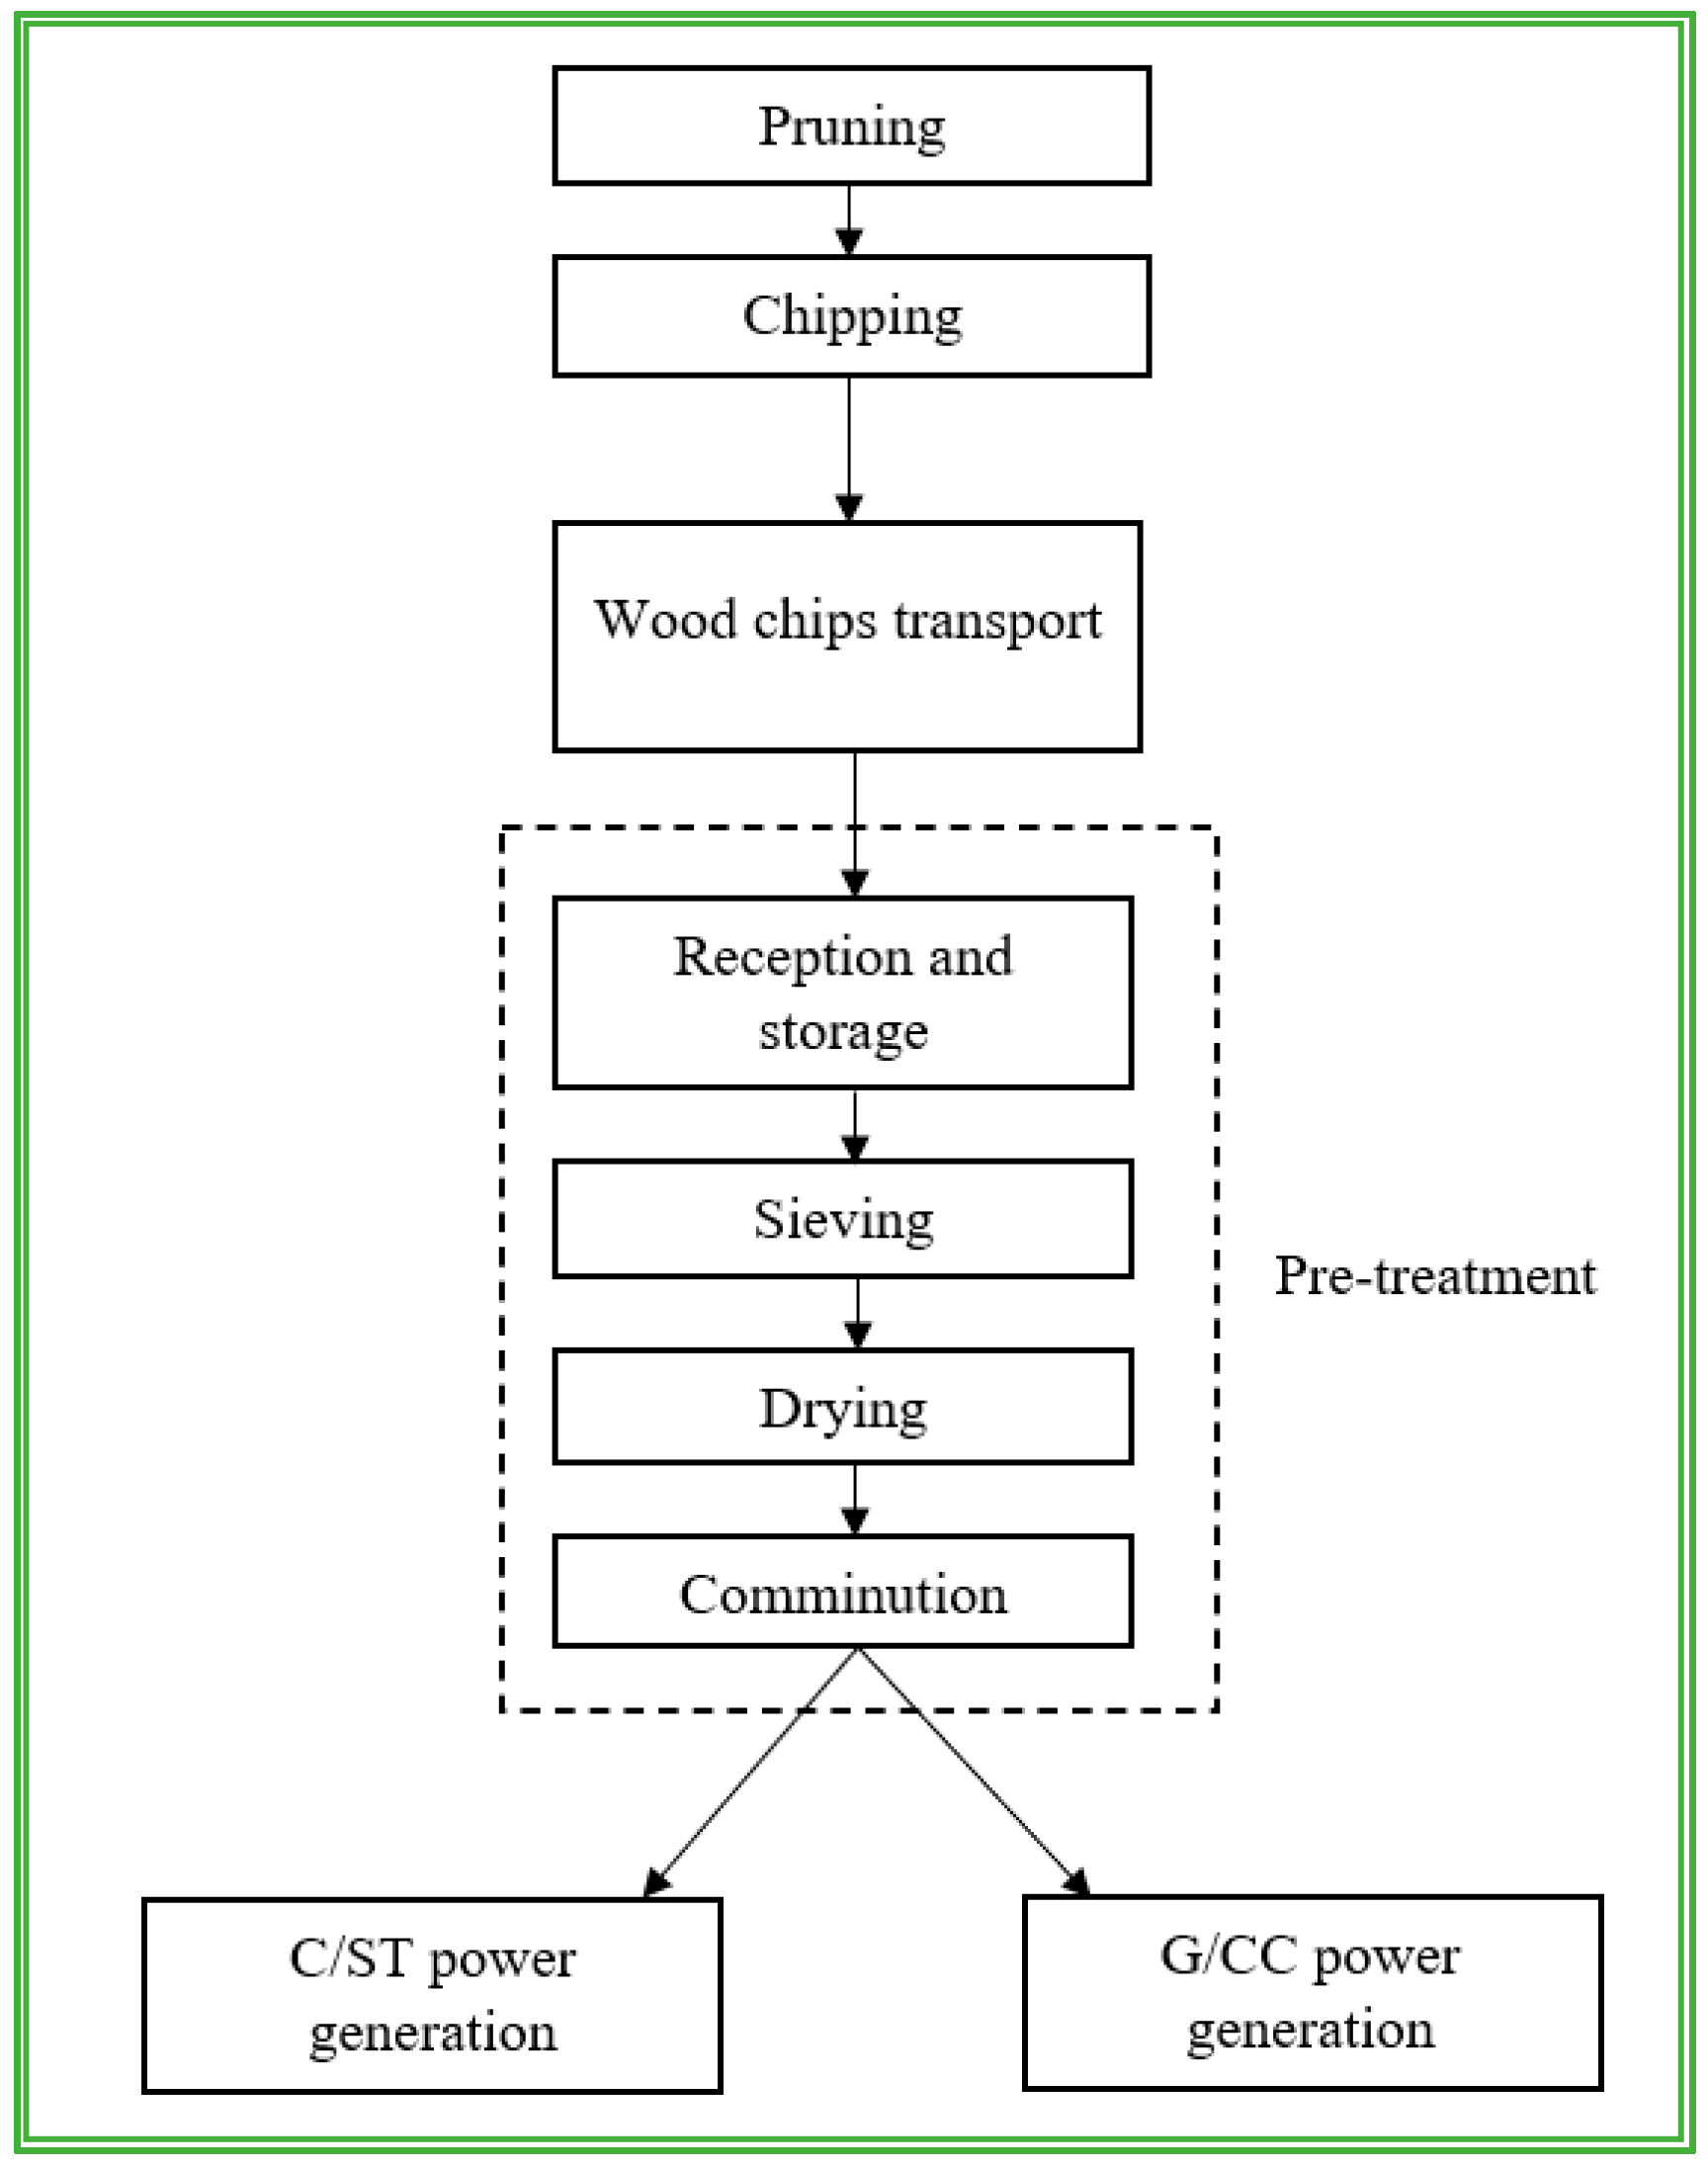
2.2. Biomass Power Plant Configurations

The conversion of biomass to energy can be achieved by adopting different technological solutions that can be separated into two basic categories: thermochemical processes and biochemical/biological processes. In this study, we chose two different thermal processes that represent the best available solutions for the selected power range (5–50 MW) [15]. Specifically, the two solutions identified were:
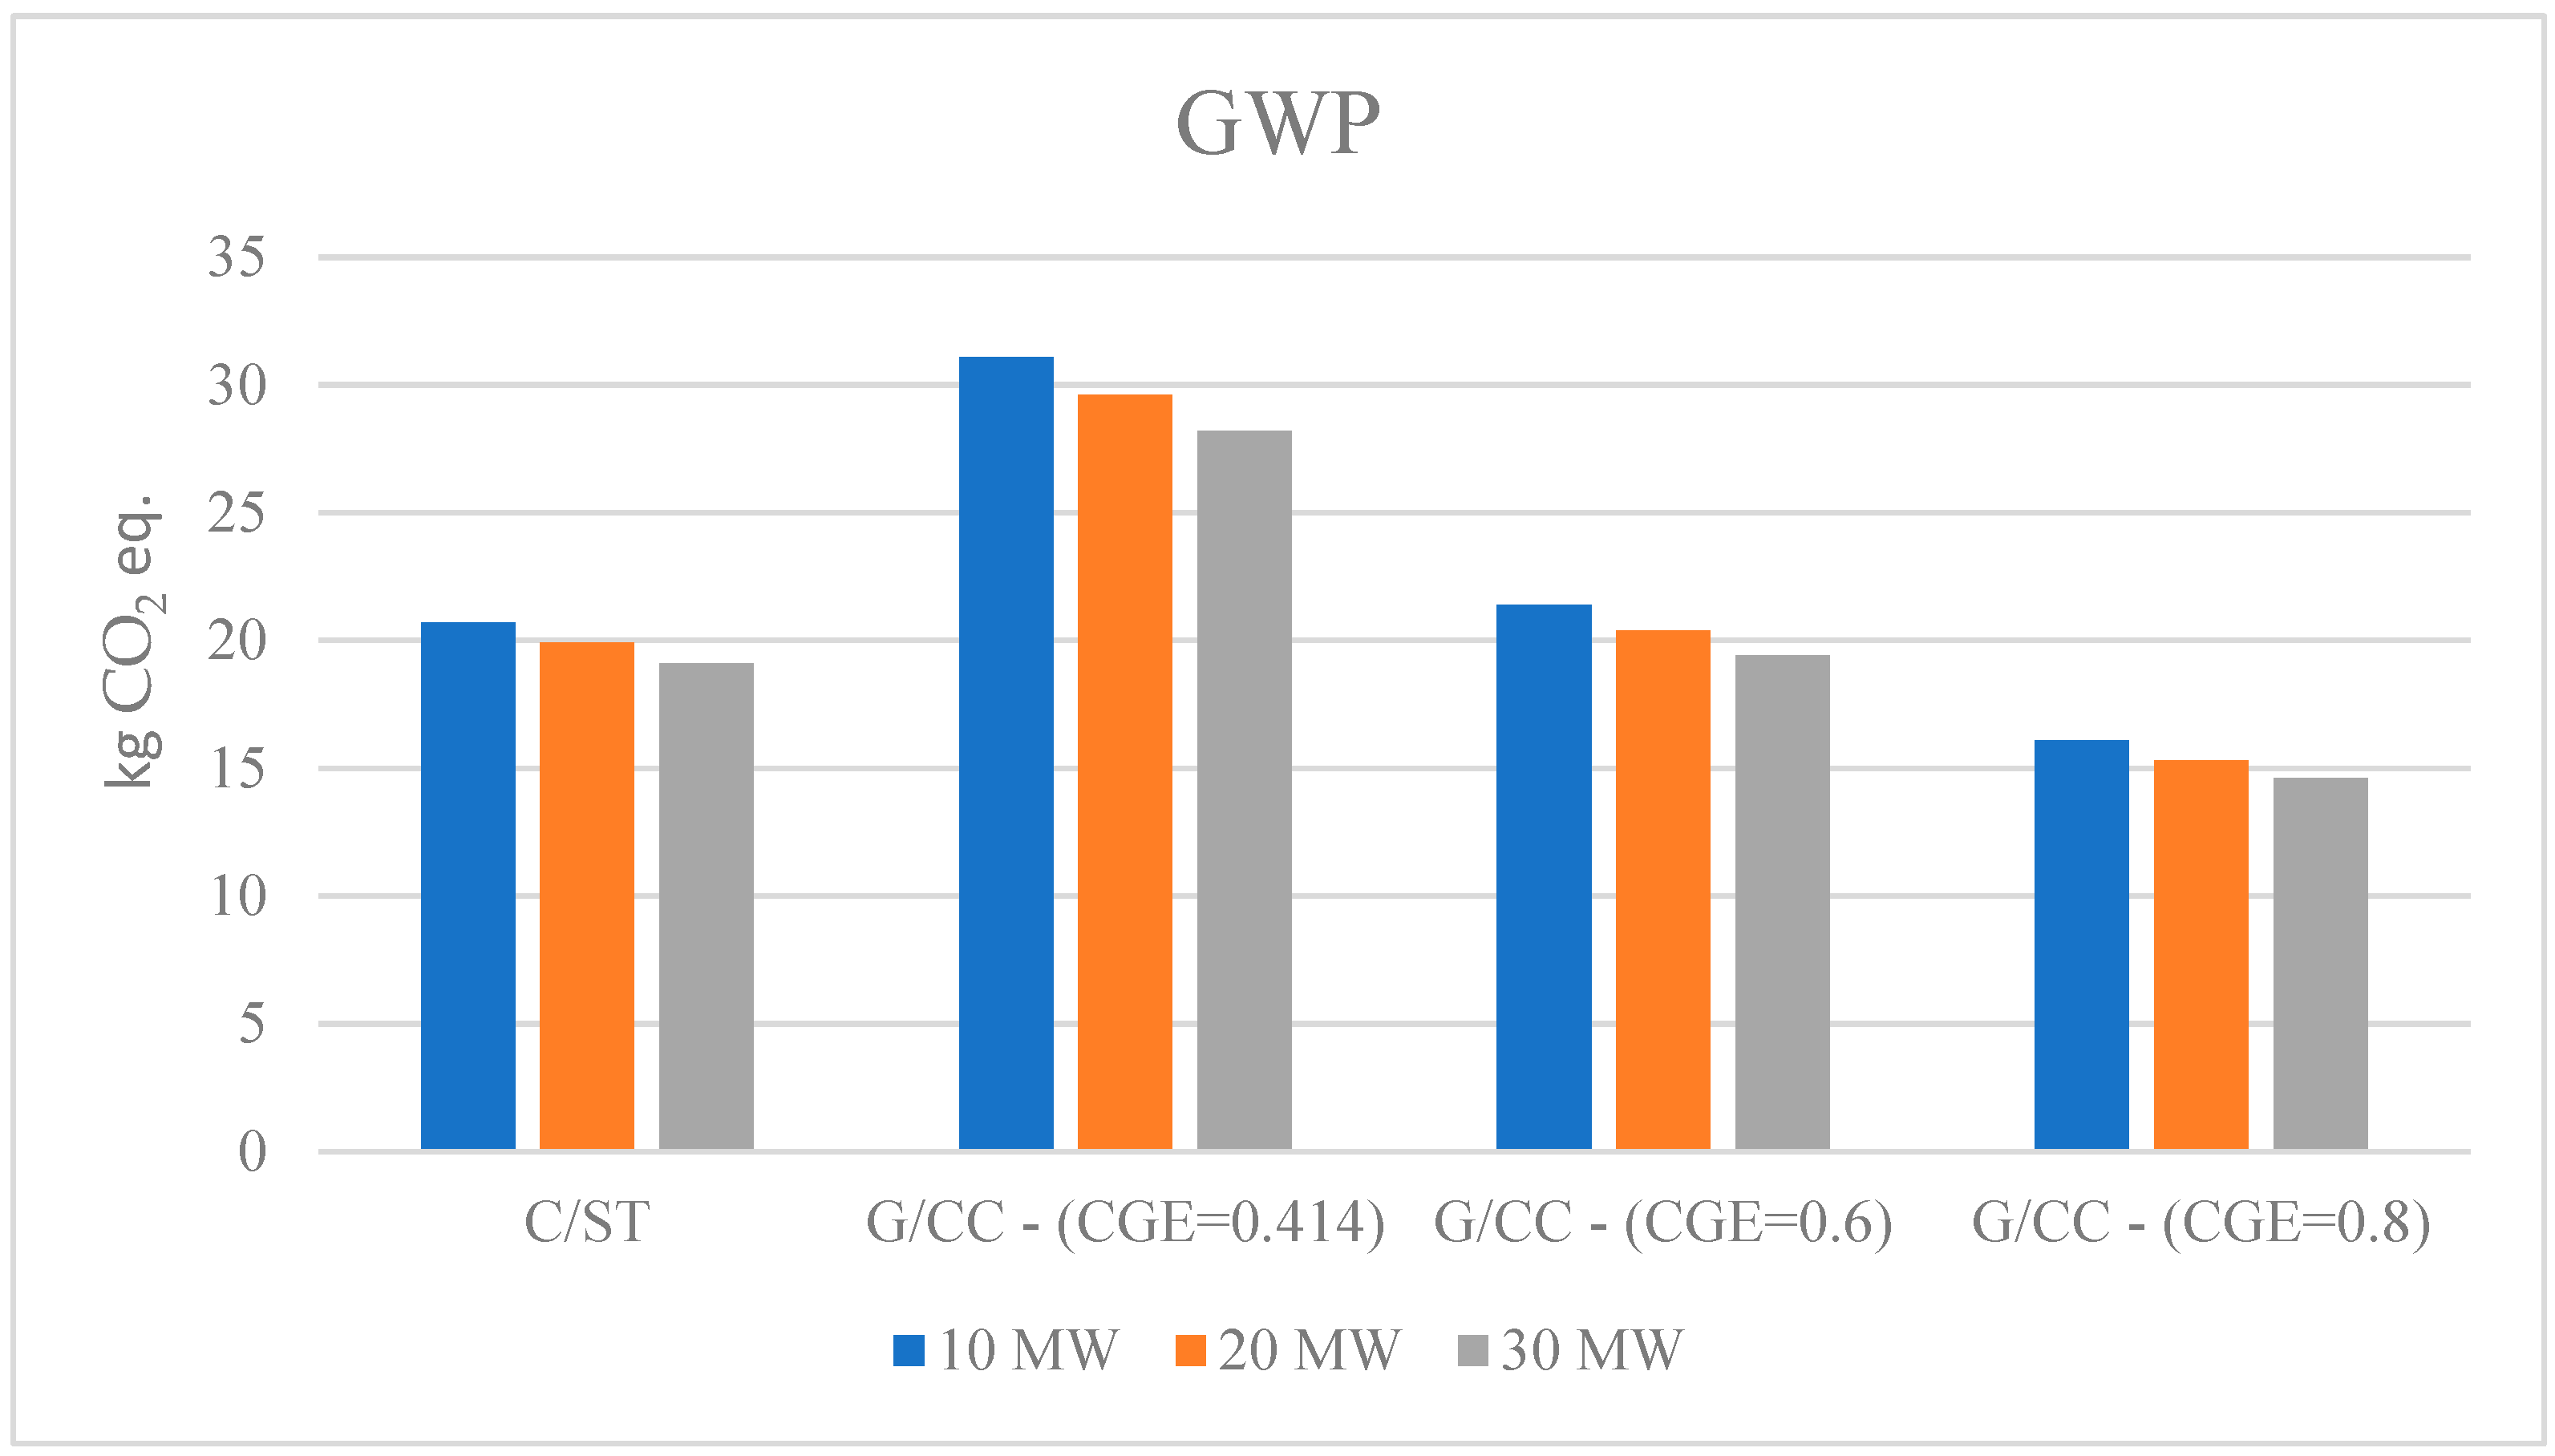
  • Fluid bed combustion, followed by steam turbine cycle power generation (C/ST);
  • Fluid bed gasification, followed by combined gas–steam cycle power generation (G/CC).
Considering that the maximum available power was about 30 MW for each plant configuration, three different power sizes (i.e., 30, 20, and 10 MW) were chosen to investigate possible variations in the biomass availability.
Both plant solutions comprise three main sections (Figure 2), namely the biomass storage and handling section, the power generation section, and the air pollution control section. The first and third sections are the same for the two plants, while important technological differences characterize each power generation section.
The biomass storage and handling section receives the biomass and moves it towards the combustor/gasifier entrance. This section consists of four main subsystems, which are schematized in Figure 3. Having previously been reduced to the form of coarse wood chips at the collection site, the biomass is input into the reception and storage system, where it partially loses its moisture content through an air-drying process. Afterwards, the biomass is moved to the pretreatment system, which separates any metal and non-metal fractions. In the refining system, the biomass is shredded and passed through a mechanical sieve so that the wood chips are within the size range of 1–30 mm in order to ensure optimal combustion or gasification. Finally, the wood chips are moved to the combustor/gasifier entrance.
The C/ST power section (Figure 4) consists of a traditional steam cycle. Hot gases produced by the fluid bed combustor are used to obtain superheated steam in the boiler, which is typically a counter-current heat exchanger to maximize heat transfer. Common values for the pressure and temperature of the steam flow leaving the boiler are, respectively, 100–150 bar and 550–600 °C [16,17]. The turbine exploits the steam expansion, allowing the conversion of mechanical energy into electrical energy, with an efficiency of 80–85% [16] Finally, the low-pressure steam flow is condensed and pumped back into the boiler, with negligible pumping work.
Figure 5 represents the G/CC power generation section, which comprises a more complex plant configuration than the C/ST plant. The incoming wood chips must be dried in order to reduce their moisture content from 50% to a value smaller than 15% [18]. The obtained dried biomass is then introduced into a fluid bed gasifier, where the syngas is produced along with a solid coal residue, in weight percentages equal to 95% and 5%, respectively [19,20]. Before reaching the combustion chamber, the syngas undergoes filtering and cleaning processes, with the aim of collecting any dust contained within. Then, the clean syngas is fed into the combustion chamber as the fuel of the combined gas–steam cycle for electricity generation.
The temperature of the hot gas leaving the combustion chamber reaches maximum values in the range of 1200–1300 °C, due to the mechanical resistance of materials at high temperatures. Then, the gas expands in the turbine, which typically takes place at compression ratios of 15–20, achieving the first conversion of mechanical energy into electrical energy of the combined cycle. The exhaust gases at the turbine outlet contain a very high amount of thermal energy, approximately 58% [21] of the chemical energy introduced by the fuel. This energy is recovered in the steam cycle thanks to the heat recovery steam generator (HRSG) system, which is a counter-current heat exchanger. The efficiency of the electricity production of the combined gas–steam cycle depends on the size of the plant and can reach values of 50–55%, compared with the maximum efficiency values of the simple gas cycle of 35–38% [21,22]. The air pollution control section consists of a catalytic system for the abatement of the polluting emissions of NOX, SOX, and CO that are produced by combustion and exist in the exhaust gases. This last section is included in the configurations of both plants, as was already mentioned.

2.3. Economic Analysis

The economic evaluation was carried out based on total capital investment (TCI, EUR), total operating cost (TOC, EUR/y), and revenues from the electric energy saving and sales (R, EUR/y). The economic comparison between the different scenarios was based on the net present value (NPV). More specifically, the TCI costs included power generation costs, piping costs, electrical costs, civil works costs, direct installation costs, auxiliary services costs, instrumentations costs, and site preparation costs. Piping, electrical, and civil works costs were based on literature data [23,24].
Finally, direct installation, auxiliary services, instrumentations, site preparation, engineering, and start-up costs were calculated as a percentage of the power generation costs. Total operating costs were computed as the sum of operating labor costs, purchased biomass costs, biomass transport costs, and maintenance costs. Specifically, the annual labor cost L was calculated as the product of an average annual cost per worker of EUR 26,000, and the number n of total annual working personnel was estimated depending on the plant size in the range (12–36) [25]. Biomass transport cost (BT) was assessed by Equation (2):
B T = B f V c · C t ,
where Bf is the biomass flow rate (t/y) of each type of plant, Vc is the vehicle capacity (t/vehicle), and Ct is the unit transport cost (EUR/vehicle], considering an average route from the barycenter of the area where the plant is assumed to be located.
Maintenance costs and insurance costs were calculated as a percentage of TCI, as reported in the literature [26]. Revenues from the sale of the produced electric energy were computed as the product of the percentage of the electric energy effectively available for sale (assumed to be equal to 90%, taking account of the energy needs of the auxiliary equipment) according to the current market price of electricity and factoring in government subsidies. The Italian government subsidies are applicable for plants powered by renewable sources that have a capacity higher than or equal to 1 MW. Therefore, 10, 20, and 30 MW plants can access the green certificate mechanism, which was replaced by new incentives in 2016. The access to this kind of incentive is regulated through the Gestione Riconoscimento Incentivo (GRIN) application.
The incentive tariff IT was calculated using the following equation:
IT = k · ( 180 R e ) · 0.78 ,
In (3), k is a coefficient that depends on the type of renewable source. Specifically, k = 1.80 for biomass and biogas produced by agriculture, livestock farming, and short-chain forestry. The maximum value in EUR/MWh that a renewable energy producer can receive is 180, and Re is the electricity price annually defined by the authority based on the economic conditions recorded on the market in the previous year (125.06 EUR/MWh for the year 2021).
Therefore, the economic profitability of the two plant configurations for the three different power sizes was evaluated based on net present value (NPV) and investment payback time. A positive NPV indicates that earnings generated by the investment exceed the anticipated costs, so that investment is profitable. On the other hand, payback time is a risk indicator that refers to the period required to recover the investment. This indicator is generally considered acceptable for values not exceeding 4 years [27].

2.4. LCA Analysis

This section summarizes the evaluation of the environmental footprint of the biomass electricity production valorized by both plant configuration systems (i.e., C/ST and G/CC). The environmental impact study was intended to be a preliminary analysis of the general environmental performance of the biomass-to-energy conversion chain. To this end, the life cycle assessment (LCA) approach was used in accordance with the ISO guidelines [28], allowing us to highlight the environmental burden of each step of the biomass chain. LCA was performed by Simapro software 9.1.1, which was also used to determine the mass and energy flows needed to produce electricity. The inventory phase was based on literature contributions and the ecoinvent database. Specifically, the inventory data collection was based on a generic environmental burden for each life cycle phase. Therefore, only background data of the processes involved were considered.

2.4.1. Goal and Scope Definition

The functional unit chosen was 1 MWh of electricity produced by both plants for all sizes. In this regard, it is worth noting that the energy conversion efficiency strongly depends on both the plant configuration and size. The combined gas–steam cycle can reach energy conversion efficiency values of 50%, as already mentioned in Section 2.2. On the other hand, the simple gas or steam cycles have significantly lower efficiency values. In addition—based on existing plants—the larger the plant size, the higher the plant performance. With this in mind, different energy conversion efficiencies were introduced for each plant configuration and size. Table 2 shows the proposed scenarios [25].
The system boundaries of the environmental study involved the main life cycle phases of the biomass-to-energy conversion chain. This chain begins with the pruning of branches in the vineyards and olive groves and ends with the electricity production at the plant. Figure 6 shows the proposed system boundaries. The environmental impact of the infrastructure required was disregarded.
The environmental performance of the considered biomass chain was evaluated by the global warming potential (GWP) indicator, which allows the consideration of the effects of emissions on climate change. In this regard, the CO2 emission cycle of the biomass was assumed to have zero impact, since the CO2 released during biomass combustion is equal to that absorbed during plant growth by means of the chlorophyll photosynthesis process [29]. This assumption implies that both the combustion and gasification phases produce zero CO2 emissions, while the CO2 emissions of the remaining phases (e.g., the transport phase) were calculated in detail.
The national production mix of electricity was considered for the processes that need a power supply.

2.4.2. Life Cycle Inventory

Depending on the geographical area and technological availability, the pruning process of vineyards and olive groves can be performed in different ways by means of suitable machinery. In this regard, the commercial machinery that is available on the market has been adapted from agricultural equipment intended for other processes. In the context of the present study, the pruning of both vineyards and olive groves should be performed by a tractor-driven pruning machine. The inventory data of the pruning process were based on the ecoinvent report on agricultural production systems [30], wherein the fuel consumption and emissions relating to the main agricultural processes are summarized. Due to the lack of specific data on the pruning process, the inventory of the mowing process carried out using a tractor-powered mower was used as reference.
The on-site chipping process can be carried out by two types of chipper, i.e., semi-industrial (power range of 40–70 kW) and industrial (power of 150 kW) [31]. A semi-industrial tractor-powered chipper of 70 kW was considered for our study, assuming an average hourly fuel consumption of 17 L of diesel and an average productivity of 5 t/h [31].
The data inventory of wood chip transport to plant site was based on the assumption that the supply area of the biomass is circular and the plant is located at the center. According to this scenario, the larger the size of the plant, the higher the radius of the catchment area to meet the annual biomass demands. The average round trip distance for every delivery to the plant was calculated as two times 2/3 of the radius of the catchment area. Equation (4) was used for the final average round trip computation.
D T = 4 3 · ( M δ B π ) 0.5 ,
In (4), M is the annual biomass flow rate, dependent on the plant size according to Equation (1), and D is the biomass specific density, computed as the ratio between the overall biomass annual production (see Table 1) and the surface covered by the area of Trapani (2470 km2). Table 3 summarizes both the distance traveled for every round trip and the distance per ton of biomass collected, assuming a transport vehicle capacity of 20 tons.
The pretreatment phase consists of several substeps performed to prepare the biomass to feed the combustor or gasifier. The processes to be carried out are shown in Figure 7, and the inventory data are based on literature contributions [18]. As regards the inventory data of both energy conversion systems, all emissions produced by the combustion processes were considered except for CO2, in accordance with the main assumption of this study (as explained in Section 2.4.1). The emission data of wood chip boilers were based on a report concerning biomass combustion [32], while data on emissions from the syngas combustion were taken from [33]. As regards the G/CC plant, the gasification process allows the production of around 1.3–1.4 kg of syngas per kg of biomass as raw material [20]. However, the LHV of syngas is much lower than that of biomass as raw material (6 MJ/kg). This decrease in thermal potential is due to the feeding of the gasification process by the heat released from the initial biomass [19]. Table 4 summarizes all data inventories for each life cycle phase.

3. Results and Discussion

3.1. Economic Assessment

The economic performance and profitability of both the solutions were investigated and compared over a capacity range of 10–30 MW. The analysis was carried out using the reference values for the influencing economic parameters described in Section 2. The obtained results are summarized in Table 5, Table 6 and Table 7.
Table 5 shows that the TCI substantially increased with the size for both plant solutions. Furthermore, the investment costs for the G/CC plant were greater than those for the C/ST plant, since the first configuration plant is technologically more complex and requires the installation of more auxiliary equipment. In fact, the biomass storage/handling costs, power generation costs, and direct installation costs increased significantly from one configuration plant to the other. On the other hand, as regards the operating costs (Table 6), the C/ST plant involved slightly higher costs than the G/CC plant. Specifically, the biomass costs and biomass transport cost were higher for the C/ST plant with the same amount of energy produced, due to the lower energy conversion efficiency of the steam cycle. However, the maintenance costs of the G/CC plant were higher due to its more complex plant configuration. Finally, Table 7 shows the revenue arising from the sale of the electricity produced. This was calculated as the product of the power of the plant, assuming 8000 operating hours per year and taking account of the sale price of electricity.
Considering a 20-year useful life, the cash flows of the two power plants for each power size are presented in Table 8.
The NPV assessment was based on the hypothesis of a low interest rate (i = 4%) and the consideration of three different incentive tariff scenarios (i.e., 100% IT, 50% IT, and 0% IT). Figure 7 shows that the economic profitability of the G/CC plant was always slightly lower than that of the C/ST plant. In fact, the results of the economic analysis showed that the plant engineering solution with a steam cycle (i.e., C/ST) was to be preferred over that with a combined gas–steam cycle (i.e., G/CC) for any size and for any incentive tariff scenario. By comparing the cost and revenue data between the two system solutions (i.e., Table 5, Table 6 and Table 7), it can be seen that as the size increased, the installation costs of the G/CC plant increased significantly compared to those of the C/ST plant with practically similar operating costs and the same revenue values. This finding can be justified by the fact that a G/CC plant is technologically more complex, and costs increase considerably with the size. Ultimately, from the point of view of economic profitability, the two plant solutions were almost on par, despite the different installation costs. Therefore, the results of the environmental analysis become fundamental for the choice of the optimal sustainable solution.

3.2. Life Cycle Impact Results

The electricity that can be obtained from 1 ton of biomass depends on the overall energy conversion efficiency. For the G/CC plant, this parameter is the product of the energy conversion efficiency of the combined cycle calculated by the so-called cold gas efficiency (CGE, η CG) (Equation (5)), where the numerator refers to the chemical energy of the syngas and the denominator is the chemical energy of the biomass as raw material.
η C G = M s y n g a s L H V s y n g a s M b i o m a s s L H V b i o m a s s
The CGE is obviously dependent on the conversion efficiency of the gasification process, which can vary widely. It is normally influenced by the gasification conditions, i.e., the quantity and quality of the oxidizing agent. For example, the use of pure oxygen instead of air leads to qualitatively better syngas production, with a higher LHV. Different ηCG values have been suggested in the literature [19]. In this study, the ηCG was set to 0.414 [20]. Table 9 shows the electrical energy obtained per 1 ton of biomass as raw material for each plant size. In addition, the results of a sensitivity analysis for different ηCG values are reported. Improving the gasification efficiency led to a better yield from the G/CC plant, which was more efficient than the steam cycle for ηCG values higher than 0.6.
Figure 8 shows the GWP indicator results. It is worth remembering that biomass is considered a renewable resource because its carbon dioxide production cycle is zero, as explained in Section 2.4.1. Therefore, the values shown in Figure 8 are only related to the necessary processes of the biomass chain (i.e., pruning, chipping, transport, and pretreatment). The GWP results demonstrated that the G/CC plant solution was only better than the C/ST solution for a CGE value higher than 0.8. Therefore, it can be said that unless the gasification efficiency is very high, the steam cycle plant also remains preferable from the point of view of environmental impact. This can be justified by the small LHV value of the syngas (i.e., 4–6 MJ/kg) and by the fact that part of the heat released during gasification is used to feed the gasification process itself [19].

4. Conclusions

This paper examined the sustainability of two biomass power generation technologies: steam turbine cycle power generation and fluid bed gasification followed by combined gas–steam cycle power generation. From the point of view of economic profitability, the two plant solutions were almost on par, despite the different installation costs. By comparing the cost and revenue data between the two system solutions, we determined that as the size increased, the installation costs of the G/CC plant increased significantly compared to those of the C/ST plant with practically similar operating costs and the same revenue values. Therefore, the results of the environmental analysis became fundamental to identifying the most sustainable solution. The GWP indicator showed that the C/ST solution had a lower environmental impact for each plant size. However, the G/CC solution became more effective when the CGE value was equal to 0.8. In conclusion, the obtained results showed that unless the gasification efficiency is very high, the steam cycle plant also remains preferable from the point of view of environmental impact. As far as the authors are aware, this is the first study in which both of these aspects of sustainability are considered simultaneously. Further investigations should focus on other agricultural residues to diversify the energy sources and improve the resiliency of rural energy systems, and a multi-criteria decision-making approach should be developed for selecting the optimal location of the plant facility.

Author Contributions

Conceptualization, G.L.S. and R.M.; methodology, L.A.; validation, G.L.S. and C.M.L.F.; resources, L.A.; writing—original draft preparation, G.L.S. and L.A.; writing—review and editing, R.M. and C.M.L.F.; supervision, G.L.S. All authors have read and agreed to the published version of the manuscript.

Funding

This research received no external funding.

Institutional Review Board Statement

Not applicable.

Informed Consent Statement

Not applicable.

Conflicts of Interest

The authors declare no conflict of interest.

References

  1. European Commission Clean Energy. The European Green Deal; European Commission Clean Energy: Brussels, Belgium, 2019. [Google Scholar]
  2. Robbins, A. How to understand the results of the climate change summit: Conference of Parties21 (COP21) Paris 2015. J. Public Health Policy 2016, 37, 129–132. [Google Scholar] [CrossRef] [PubMed] [Green Version]
  3. IEA. Renewable Electricity Capacity Additions, 2007–2021, Updated IEA Forecast. Available online: https://www.iea.org/data-and-statistics/charts/renewable-electricity-capacity-additions-2007-2021-updated-iea-forecast (accessed on 19 March 2021).
  4. Bharti, A.; Paritosh, K.; Mandla, V.R.; Chawade, A.; Vivekanand, V. GIS Application for the Estimation of Bioenergy Potential from Agriculture Residues: An Overview. Energies 2021, 14, 898. [Google Scholar] [CrossRef]
  5. Sciortino, R.; Micale, R.; Enea, M.; La Scalia, G. A webGIS-based system for real time shelf life prediction. Comput. Electron. Agric. 2016, 127, 451–459. [Google Scholar] [CrossRef]
  6. La Scalia, G.; Marra, F.P.; Rühl, J.; Sciortino, R.; Caruso, T. Fuzzy multi-criteria decision-making methodology to optimise olive agro-engineering processes based on geo-spatial technologies. Int. J. Manag. Decis. Mak. 2016, 15, 1–15. [Google Scholar]
  7. Miglietta, P.P.; Micale, R.; Sciortino, R.; Caruso, T.; Giallanza, A.; La Scalia, G. The sustainability of olive orchard planting management for different harvesting techniques: An integrated methodology. J. Clean. Prod. 2019, 238, 117989. [Google Scholar] [CrossRef]
  8. Haase, M.; Rösch, C.; Ketzer, D. GIS-based assessment of sustainable crop residue potentials in European regions. Biomass Bioenergy 2016, 86, 156–171. [Google Scholar] [CrossRef]
  9. Malico, I.; Carrajola, J.; Gomes, C.P.; Lima, J.C. Biomass residues for energy production and habitat preservation. Case study in a montado area in Southwestern Europe. J. Clean. Prod. 2016, 112, 3676–3683. [Google Scholar] [CrossRef] [Green Version]
  10. Garcia, D.A.; Sangiorgio, S.; Rosa, F. Estimating the potential biomasses energy source of forest and agricultural residues in the Cinque Terre Italian National Park. Energy Procedia 2015, 82, 674–680. [Google Scholar] [CrossRef] [Green Version]
  11. Lourinho, G.; Brito, P. Assessment of biomass energy potential in a region of Portugal (Alto Alentejo). Energy 2015, 81, 189–201. [Google Scholar] [CrossRef]
  12. Höhn, J.; Lehtonen, E.; Rasi, S.; Rintala, J. A Geographical Information System (GIS) based methodology for determination of potential biomasses and sites for biogas plants in southern Finland. Appl. Energy 2014, 113, 1–10. [Google Scholar] [CrossRef]
  13. Moliner, C.; Arato, E.; Marchelli, F. Current Status of Energy Production from Solid Biomass in Southern Italy. Energies 2021, 14, 2576. [Google Scholar] [CrossRef]
  14. Nandimandalam, H.; Gude, V.G.; Marufuzzaman, M. Environmental impact assessment of biomass supported electricity generation for sustainable rural energy systems—A case study of Grenada County, Mississippi, USA. Sci. Total Environ. 2022, 802, 149716. [Google Scholar] [CrossRef] [PubMed]
  15. Riva, G. Impianti a Biomasse per la Produzione di Energia Elettrica; Rapporto preparato dall’Ufficio Centrale del CTI: Milano, Italy, 2000. [Google Scholar]
  16. Qu, J.; Feng, Y.; Zhu, Y.; Zhou, S.; Zhang, W. Design and thermodynamic analysis of a combined system including steam Rankine cycle, organic Rankine cycle, and power turbine for marine low-speed diesel engine waste heat recovery. Energy Convers. Manag. 2021, 245, 114580. [Google Scholar] [CrossRef]
  17. Zhang, H.H.; Li, M.J.; Feng, Y.Q.; Xi, H.; Hung, T.C. Assessment and working fluid comparison of steam Rankine cycle-Organic Rankine cycle combined system for severe cold territories. Case Stud. Therm. Eng. 2021, 18, 101601. [Google Scholar] [CrossRef]
  18. Beagle, E.; Belmont, E. Comparative life cycle assessment of biomass utilization for electricity generation in the European Union and the United States. Energy Policy 2019, 128, 267–275. [Google Scholar] [CrossRef]
  19. Calì, G.; Deiana, P.; Bassano, C.; Meloni, S.; Maggio, E.; Mascia, M.; Pettinau, A. Syngas Production, Clean-Up and Wastewater Management in a Demo-Scale Fixed-Bed Updraft Biomass Gasification Unit. Energies 2020, 13, 2594. [Google Scholar] [CrossRef]
  20. Petrillo, A.; Travaglioni, M.; Di Fraia, S.; Vanoli, L.; Cirillo, D.; La Villetta, M. Experimental study and Life Cycle Assessment of biomass small-scale trigeneration plant. J. Clean. Prod. 2021, 326, 129234. [Google Scholar] [CrossRef]
  21. Maheshwari, M.; Singh, O. Thermodynamic study of different configurations of gas-steam combined cycles employing intercooling and different means of cooling in topping cycle. Appl. Therm. Eng. 2019, 162, 114249. [Google Scholar] [CrossRef]
  22. He, X.; Wang, H.; Li, R.; Sun, H.; Chen, H.; Li, C.; Ge, G.; Tao, F. Thermo-conversion of a physical energy storage system with high-energy density: Combination of thermal energy storage and gas-steam combined cycle. Energy 2022, 239, 122325. [Google Scholar] [CrossRef]
  23. Cardoso, J.; Silva, V.; Eusébio, D. Techno-economic analysis of a biomass gasification power plant dealing with forestry residues blends for electricity production in Portugal. J. Clean. Prod. 2019, 212, 741–753. [Google Scholar] [CrossRef]
  24. Malek, A.B.M.A.; Hasanuzzaman, M.; Rahim, N.A.; Turki, Y.A.A. Techno-economic analysis and environmental impact assessment of a 10 MW biomass-based power plant in Malaysia. J. Clean. Prod. 2017, 141, 502–513. [Google Scholar] [CrossRef]
  25. Caputo, A.; Palumbo, M.; Pelagagge, P.M.; Scacchia, F. Economics of biomass energy utilization in combustion and gasification plants: Effects of logistic variables. Biomass Bioenergy 2005, 28, 35–51. [Google Scholar] [CrossRef]
  26. Bridgwater, A.V.; Toft, A.J.; Brammer, J.G. A techno- economic comparison of power production by biomass fast pyrolysis with gasification and combustion. Renew. Sustain. Energy Rev. 2002, 6, 181–248. [Google Scholar] [CrossRef]
  27. La Scalia, G.; Micale, R.; Cannizzaro, L.; Marra, F.P. A sustainable phenolic compound extraction system from olive oil mill wastewater. J. Clean. Prod. 2017, 142, 3782–3788. [Google Scholar] [CrossRef]
  28. ISO 14040; Environmental Management Life Cycle Assessment–Principles and Framework. International Organization for Standardization (ISO), European Standard: Geneva, Switzerland, 2006.
  29. Gustavsson, L.; Börjesson, P.; Johansson, B.; Svenningsson, P. Reducing CO2 emissions by substituting biomass for fossil fuels. Energy 1995, 20, 1097–1113. [Google Scholar] [CrossRef]
  30. Nemecek, T.; Heil, A.; Huguenin, O.; Meier, S.; Erzinger, S.; Blaser, S.; Dux, D.; Zimmermann, A. Life Cycle Inventories of Agricultural Production Systems; Final Report Ecoinvent 2000 No. 15; Swiss Centre for Life Cycle Inventories: Dübendorf, Switzerland, 2003. [Google Scholar]
  31. Ente NAzionale per la Meccanizzazione Agricola (ENAMA). Progetto Biomasse ENAMA: Stato dell’arte degli Impianti di Produzione di Energia da Biomasse; Ente NAzionale per la Meccanizzazione Agricola (ENAMA): Lazio, Italy, 2012. [Google Scholar]
  32. Van Belle, J.F. A model to estimate fossil CO2 emission during the harvesting of forest residues for energy with an application on the case of chipping. Biomass Bioenergy 2006, 30, 1067–1075. [Google Scholar] [CrossRef]
  33. Whitty, K.J.; Eddings, E.G.; Zhang, H. Emissions from syngas combustion. Combust. Sci. Technol. 2008, 180, 1117–1136. [Google Scholar] [CrossRef]
Figure 1. Main areas of biomass production in Trapani (dark grey: vineyard; light grey: olive groves).
Sustainability 14 09676 g001
Figure 2. General configuration of C/ST and G/CC plants.
Sustainability 14 09676 g002
Figure 3. Subsystems of the biomass storage and handling section.
Sustainability 14 09676 g003
Figure 4. C/ST power generation section.
Sustainability 14 09676 g004
Figure 5. G/CC power generation section.
Sustainability 14 09676 g005
Figure 6. System boundaries.
Sustainability 14 09676 g006
Figure 7. NPV trend of C/ST and G/CC solutions for different power sizes and incentive tariffs.
Sustainability 14 09676 g007
Figure 8. GWP indicator results.
Sustainability 14 09676 g008
Table 1. Energy contribution for each type of biomass.
Biomass(t/y)LHV (MJ/kg)Energy (MJ/kg)
Vineyard165,29718.02,975,356,800
Olive16,77317.6295,205,645
Pomace15,72415.5243,726,650
Table 2. Energy conversion efficiencies for different plant configurations and sizes.
Plant ConfigurationPlant Size (MW)Energy Conversion Efficiency
C/ST100.25
200.26
300.27
G/CC100.39
200.41
300.43
Table 3. Distance traveled for each round trip.
Plant Size (MW)Biomass (t)Catchment Area (km2)Radius (km)Average Round Trip (km)Distance per Ton (km/t)
1056,629768.315.6320.851.04
20113,2581536.522.1129.481.47
30169,8882304.827.0836.111.80
Table 4. Life cycle inventories.
Life Cycle StepFuel Consumption (Diesel) (kg t−1 of Biomass)Electricity Consumption/Transport (kWh/km t−1 of Biomass)Emissions (g t−1 of Biomass)
HCNOxCO
PruningVineyards1.72 4.3266.966.84
Olive groves2.27 5.6888.109.00
ChippingVineyards3.22 5.0486.0412.96
Olive groves3.22 6.63113.2117.05
Transport10 MW 1.04 km
20 MW 1.47 km
30 MW 1.80 km
PretreatmentReception and storage 1 kWh
Sieving 0.87 kWh
Drying0.72 kWh of natural gas18.76 kWh
Comminution 37.71 kWh
PM2.5NOxCO
C/ST 1981820324
G/CC 1672340134
Table 5. Total capital investments (EUR).
C/ST G/CC
Power Size (MW)102030102030
Biomass storage/handling costs930,7951,547,8812,108,3093,427,8115,340,7986,894,473
Power generation costs10,136,91815,472,66819,891,61311,921,57119,416,49325,559,681
Air pollution costs1,682,7892,496,4753,156,7071,682,7892,496,4753,156,707
Piping costs1,152,6871,810,8322,381,5431,152,6871,810,8322,381,543
Electrical costs3,077,4494,795,3996,227,5413,077,4494,795,3996,227,541
Civil works costs3,825,1585,010,4925,875,5643,825,1585,010,4925,875,564
Direct installation costs8,287,82612,686,06616,351,80911,070,91117,714,94823,147,060
Indirect costs2,805,1104,293,7455,534,4583,747,0785,995,8297,834,390
Total TCI31,898,73348,113,56061,527,54439,905,45462,581,26681,076,959
Table 6. Total operating costs EUR/y.
C/ST G/CC
Power Size (MW)102030102030
Labor costs312,000624,000936,000312,000624,000936,000
Biomass cost1,685,7903,241,9044,682,7501,080,6352,055,8412,940,331
Biomass transport cost457,440882,5721,330,790292,992526,644812,073
Maintenance cost478,481721,703922,9131,197,1641,877,4382,432,309
Insurance cost318,987481,136615,275399,055625,813810,770
Total TOC3,252,6985,951,3158,487,7283,281,8455,709,7367,931,482
Table 7. Revenue (EUR/yr).
Power Size (MW)102030
Revenue14,586,48029,172,96043,759,440
Table 8. Net cash flow.
YEARC/STG/CC
10 MW20 MW30 MW10 MW20 MW30 MW
0−31,898,733−48,113,560−61,527,544−39,905,454−62,581,266−81,076,959
111,333,78223,221,64535,271,71211,176,63523,463,22435,827,958
211,333,78223,221,64535,271,71211,176,63523,463,22435,827,958
1811,333,78223,221,64535,271,71211,176,63523,463,22435,827,958
1911,333,78223,221,64535,271,71211,176,63523,463,22435,827,958
2011,333,78223,221,64535,271,71211,176,63523,463,22435,827,958
Table 9. Electrical energy per ton of biomass raw material.
PlantSize (MW)Electricity per Biomass Ton (MWhel t−1 of Biomass)
C/ST101.25
201.30
301.35
G/CC—(ηCG = 0.414)100.81
200.85
300.89
G/CC—(ηCG = 0.6)101.17
201.23
301.29
G/CC—(ηCG = 0.8)101.56
201.64
301.72
Publisher’s Note: MDPI stays neutral with regard to jurisdictional claims in published maps and institutional affiliations.

