Article

Effects of Renewable and Non-Renewable Energy Consumption, GHG, ICT on Sustainable Economic Growth: Evidence from Old and New EU Countries

1
Faculty of Economics, University of Montenegro, 81000 Podgorica, Montenegro
2
Groupe de Recherche en Droit, Économie et Gestion, Graduate School of Economics and Management, Université Côte d’Azur, 06300 Nice, France
3
Department of Administrative Sciences, Metropolitan College, Boston University, 1010 Commonwealth Avenue, Boston, MA 02215, USA
4
Global Development Policy Center, Boston University, Boston, MA 02215, USA
5
Faculty of Mechanical Engineering, University of Montenegro, 81000 Podgorica, Montenegro
*
Author to whom correspondence should be addressed.
Sustainability 2022, 14(15), 9662; https://doi.org/10.3390/su14159662
Submission received: 1 July 2022 / Revised: 31 July 2022 / Accepted: 2 August 2022 / Published: 5 August 2022

Abstract

:
Balancing of different dimensions of development—economic, environmental, social, is an imperative of policies and strategies of sustainable growth, which are practiced today in the EU and globally. The main aim of our paper is to investigate the relationship between renewable (REC) and non-renewable energy consumption (NREC), greenhouse gas (GHG) emissions and share of ICT in total exports, on one hand, and GDP p.c. on the other. We created a model for EU countries divided in two groups—old and new EU members, by using PMG and ARDL models. Considering the size and structure of the sample of countries, the selected variables in the model and the relevant period (2000–2020), to a certain extent, we filled the research gap in the existing literature. Our results indicate that a 1% increase in the share of REC and ICT in total exports leads to GDP p.c. growth in the long run by 0.151% and 0.168% in old EU countries, i.e., 0.067% and 0.039% in new EU countries, respectively. Contrary, an increase of NREC by 1% has a significant and negative impact on GDP p.c. in the long run, in both groups, leading to a decrease of economic growth by 0.512% in the old and 1.306% in the new EU group. We find a 1% increase of GHG emissions was accompanied by an increase of GDP p.c. in new EU countries by 0.939%, while that impact is insignificant in old EU countries in the long run. We conclude our paper with final remarks and policy implications.

1. Introduction

In the 1950s, macroeconomics and economic growth received significant scientific attention. Starting from the understanding of the availability of natural capital in abundance, the economic theory has long been focused on produced and human capital. However, with exponential population growth and accelerated economic development, attention is focused on natural capital, which is a necessary condition for achieving sustainable growth and development. EU affirmed the concept of sustainable development, which presents a global political agreement that is made up of a balance between the social, economic and environmental aspects of development at all levels, from local to global.
Energy is key to the process of economic growth in many countries. Therefore, the main issue is the contribution of all energy sources to economic growth. Energy consumption is one of the basic indicators of economic growth and development. On the other hand, more efficient use of energy requires a higher level of economic development. In the past two decades, EU members have been working intensively on creating an internal energy market and an energy union. It is emphasized that it is crucial for the EU to decouple energy consumption from economic growth. After the financial sector, energy is probably the largest global industry, i.e., the industry with the widest impact on other sectors of the economy, on which the entire economic activity depends. Changes in the structure of GDP that have occurred in the past decades lead to significantly lower energy consumption per unit of GDP, i.e., to a decrease in energy intensity.
Non-renewable energy sources, as potential carriers of some form of energy that have been created but cannot be renewed, represent the most important source of total world energy. The use of non-renewable energy sources is primarily associated with significant environmental pollution and climate disturbances. The key disadvantage of non-renewable energy sources is the combustion of fossil fuels (coal, oil, gas) into the atmosphere, creating a large amount of carbon dioxide (CO2). The problem of non-renewable resources escalated in the 1970s when many industries around the world were suddenly faced with shortages of the materials from which their products are manufactured. According to Motesharrei et al. [1], uncontrolled exploitation of non-renewable natural resources, unequal distribution of wealth and excessive consumption of these resources could lead to the collapse of industrial society over several decades. Higher energy consumption is a consequence of the world’s population growth, while the reduction of reserves of non-renewable energy sources (oil, gas and coal) represents a threat to the survival of the current living conditions. The EU directive on energy efficiency [2], which was adopted in 2012, establishes a common framework of measures to improve energy efficiency within the EU, which would ensure the achievement of the goal of reducing energy consumption by 20% by 2020. In 2014, EU countries agreed on a new goal regarding the energy efficiency, of at least 27% or more of reduction by 2030. Furthermore, the European Commission has proposed a binding goal of increasing energy efficiency by 30% in all countries by 2030. The increase in economic efficiency has led to the fact that the EU today consumes less energy than ten years ago.
Renewable energy has strategic importance for overall social development. The “100% renewable energy” approach implies a situation in which all energy needs are met exclusively from renewable energy sources. Numerous scientific studies qualify sources of renewable energy, i.e., permanent energy sources, as one of the key components of the concept of sustainable growth and development. At the same time, these sources contribute to the reduction of ecological vulnerability and the stimulation of economic and social development. Within the Europe 2020 strategy for smart, sustainable and inclusive growth [3], the share of renewable energy in gross final energy consumption is determined as a key indicator for measuring progress. The European Commission [4] emphasized that a more coordinated European approach to establishing and reforming support programs should be determined, as well as noting that renewable energy trading among EU member states should be strengthened. In 2014, the European Commission proposed a set of energy and climate targets for 2030 [5] that seek to encourage private investment in infrastructure and low-carbon technologies. However, the key obstacles to the widespread implementation of renewable energy strategies are not technological, but mainly political in nature.
Primarily due to the use of fossil fuels (coal, oil, natural gas) in energy and industrial plants and modern traffic, as well as due to intensive agriculture, deforestation and other activities, the GHG emissions have increased significantly since the beginning of the industrialization period. Achieving zero net emissions implies reducing GHG in such a way that they are equal to the amount of CO2 that can be absorbed from the atmosphere. Countries will have to stop the practice of relying on the growth of their economies on carbon, through increasing energy efficiency and the share of renewable energy sources (solar, wind energy and biomass, hydro and geothermal energy) in total consumption. EU and its member countries are obliged to report on their GHG emissions annually, in accordance with the United Nations Framework Convention on Climate Change (UNFCCC). The annual report on the GHG inventory at the EU level is prepared by the European Environment Agency, whereby countries should also report annually on policies and measures in the field of climate change through national communications. The EU inventory is based on the monitoring of GHG emissions by member states. The goal of the new Monitoring Mechanism Regulation (MMR) from 2013 [6] was to improve the quality of reporting data, help member states monitor progress in achieving emission reduction goals in the period 2013–2020, and facilitate the further development of EU policies in the field of climate change. EU is recognized as a leader in the field of climate policies, both because of its commitment to undertaking further efforts at the international level, and because of its own ambitious goals and concrete instruments, such as the EU Emissions Trading System (ETS).
One of the key prerequisites for economic and social development is the rapid growth of information and communication technology (ICT), which is considered a generic technology of exceptional importance for every country. As early as 2000, the OECD [7] proved the contribution of information and communication technology to GDP growth. As the bearer of development processes, ICT emphasized changes in business relations, contributed to the establishment of new forms of business and communication, improved the growth of innovation and productivity and affirmed the improvement of global efficiency. The consequences of these changes are: high level of economic efficiency, new competitive conditions, development and growth of sectors that use new technologies, market liberalization, different marketing structure, reduction of obstacles in trade and easier access to information, globalization of business. In this context, the significant economic impact of ICT in the EU is particularly emphasized at the beginning of this century. According to some estimates, the ICT sector is responsible for about half of the achieved productivity, considering return on investment in this sector. At the same time, the progress of digital technology represents a potential that must be exploited. The European Commission adopted the Digital Agenda for Europe [8] among the seven leading initiatives of the Europe 2020 development strategy, which should enable Europe to benefit from new jobs, promote economic prosperity and improve business and the everyday life of EU citizens. ICT is a catalyst for economic development, often in a short period of time, that optimizes the rising costs of human inputs. Information technologies continue to represent the main drivers of change in the global world, at all macroeconomic and microeconomic levels, and ICT specifically is even an imperative of the economy, regardless of the development level.
Our research paper’s goal is to estimate effects of renewable (REC) and non-renewable energy consumption (NREC), greenhouse gas (GHG) emissions and ICT on sustainable economic growth, on a sample of EU countries over the 2000–2020 period. We created a model for two groups of countries—old and new EU members by applying the ARDL method, as one of the most used methods in applied economics. The ARDL model allows for the identification of short-run and long-run relationships and can be categorized as an error correction model. The advantage of this approach is that it can be used regardless of whether the variables are integrated I(0) or I(1), and in the case when the dependent variable is integrated of the first order (I(1)). The approach cannot be used only in the case when one of the variables is integrated of the second order (I(2)). In addition, this method offers consistent and efficient estimators as it eliminates the problems resulting from endogeneity by including lag length for both endogenous and exogenous variables [9]. As the ARDL method may tolerate different lags in different variables, the method is very attractive and flexible. Menegaki [10] notes that the ARDL approach is more reliable for small samples as compared to Johansen and Juselius’s cointegration methodology. The choice of the most consistent estimation procedure (Mean Group or Pool Mean Group) will be determined by applying the Hausman test, considering individual characteristics (country, region, etc.) to provide a superior assessment of the long-term relationship. Although the MG (group mean) approach assumes heterogeneity of coefficients, adjustment parameter errors, and variances in both the short and long run, the PMG approach assumes heterogeneity of short-run coefficients, while long-run coefficients are assumed to be identical and homogeneous for all individuals in the panel. The estimation of the model for different groups of countries takes into account the heterogeneity in the long-term coefficients by country groups, while in the case of applying the PMG estimator, the homogeneity of the long-term coefficients within the same group of countries is assumed.
The specifics of our research, which represent a contribution to the existing literature, are as follows:
  • All selected independent variables in our model (NREC, REC, GHG and ICT) can be linked to the concept of sustainable economic growth, which was the criterion for their selection. The inclusion of these independent variables in the model allowed us to evaluate how old and new EU members based economic growth on sustainable foundations in the previous period, which made a contribution to the existing literature in this field. At the same time, this provided an opportunity to define policy implications in the last section of our paper, which represents a certain practical contribution of our research;
  • Our research covers all EU countries divided into new and old member states. This represents a contribution to the existing literature in the sense that the results of our model provide the possibility of comparative analysis between these two groups of countries;
  • Our research covered the period 2000–2020, which was marked by various events (global financial, migrant and political crisis) that had an impact on the growth of economies in the old and new EU member countries.
The structure of the paper is as follows. First, we present a brief overview of selected variables in our model, emphasizing the need for countries to base their economic growth on sustainable foundations. In Section 2, we then offer a detailed overview of the results of numerous empirical research on economic growth determinants included in our model, for EU and other countries. The following section outlines the data and methodology which we used in our model creation. In Section 4, we present our results accompanied by discussion. The final section offers concluding remarks with recommendations for policymakers who create sustainable economic growth policies.

2. Literature Review

In this section, we focus on the key results of previous empirical research that relate to the effect estimates of determinants included in our model on economic growth in EU countries. We present the results of research covering not only EU, but also other countries, in order to compare obtained results.
Currently, in the world, there are dirty and clean sources of energy. Dirty sources are fossil fuels (coal, natural gas, oil and nuclear energy) related to environmental pollution and are being depleted. In contrast, clean energy comes from natural renewable sources that do not pollute the environment and have a minor negative effect on it. Moreover, clean energy comprises the energy of sun, wind, water (wave, hydropower and tidal energy), geothermal energy and biomass (waste, wood and crops) [11]. Renewable energy can help countries to develop green economy, to reduce carbon emissions and to achieve the United Nations Sustainable Development Goals [12]. This reveals the significance of new technologies and policy initiatives targeted on renewable energy. The results of a recent empirical study demonstrate that the renewable energy consumption has a positive impact on economic growth in the EU countries, both in the short and long run, encouraging further development of renewable energy sources [13]. Armeanu et al. [14] conclude that renewable energy sources are eco-friendly sources of energy or green energy. Additionally, they consider that renewable energy sources drive sustainable growth through energy and financial savings accomplished by substituting non-renewable energy sources and expensive energy with low-priced renewable energy sources, resulting in slower exhaustion of natural resources. Kahia et al. [15] warn that most renewable energy technologies can be less competitive than non-renewable energies due to their high level of initial cost of capital and therefore, high electricity costs. This indicates the competitive disadvantage of renewable energy due to the long payback period required to recover the high initial cost of capital.
EU Directive on the promotion of the use of energy from renewable sources [16], signed in 2009, estimated that in all EU countries by 2020, the use of energy from the renewable sources will be 20%. Across the EU countries, this target varies from 10% to 49%. Pursuant the new Directive signed in 2018, all EU countries should decrease GHG emissions by 2030, for at least 40% compared to 1990 level on one hand, and to increase the share of renewable energy sources up to 32% and increase energy efficiency by at least 32.5%, on another [17].
Based on the literature review, it can be concluded that the nexus between renewable energy consumption and economic growth is controversial: it ranges from positive, through neutral, to negative [18]. Some papers also examined the presence of a long-term relationship between renewable and non-renewable energy and economic growth [19]. In addition, certain studies investigated the existence of short run causality where the results confirmed the relationship that occurs, also, in the long run [20,21] where the impact of renewable energy on economic growth was positive. A large number of studies have confirmed the contribution of renewable energy to economic growth. Soava et al. [22] revealed a positive impact of renewable energy consumption on economic growth, on a sample of EU-28 member states from 1995 until 2015. The Granger causality test indicated both one-way and two-way causal relations between renewable energy consumption and economic growth for different countries. Additionally, Rafindadi and Ozturk [23] note two-way causal relations between renewable energy consumption and economic growth in Germany in the 1971–2013 period. Therefore, they estimate that a 1% increase in renewable energy consumption contributes to economic growth by 0.2194%. Furthermore, Alper and Oguz [24] examined the causal relations between economic growth, renewable energy consumption, capital and labor in the new member states of the EU from 1990 until 2009 by applying ARDL approach. They indicated a significant and positive impact for Bulgaria, Estonia, Poland and Slovenia, but insignificant for other new EU countries. On a sample of 20 OECD countries, out of which 12 belong to the old EU group, in the period 1990–2008, Ohler and Fetters [25] confirmed that renewable energy sources (wind, biomass, waste and hydroelectric power) are positively related with GDP in the long run. In addition, they proved a short-run bidirectional relation only between hydroelectric power and waste and GDP growth. Additionally, in the 1995–2015 period, Saint Akadiri et al. [26], applying the ARDL approach, found the existence of positive and significant long-term relationship between environmental sustainability, renewable energy consumption and economic growth in EU-28 countries. Inglesi-Lotz [27] concluded that the renewable energy consumption growth increases GDP and GDP p.c. in the OECD countries (of which 23 countries are EU members) in the 1990–2010 period.
Contrary to the above-presented results, Silva et al. [28] have warned that renewable energy can initially decrease the growth of the economy in a certain number of EU countries. Chen et al. [29] proved significant and positive impact of renewable energy consumption on economic growth only when developing countries and non-OECD countries overcome a certain threshold of renewable energy consumption. Otherwise, this impact is negative. Additionally, they confirm no significant impact of renewable energy consumption on economic growth in developed countries and positive and significant impact in OECD members.
A certain number of studies have examined the impact of non-renewable energy sources on economic growth. Coal, oil and natural gas, which are the traditional energy sources, contribute significantly to the economic growth [30]. However, considering the issues of global warming and GHG emissions, all essential measures need to be taken to avoid environmental disasters. Therefore, the global warming impact on the economy is assessed to decrease the global GDP by 25% [31]. Therefore, transition from non-renewable to a renewable source of energy is urgently needed. Regarding non-renewable energy, Asiedu et al. [32] found that an increase of non-renewable energy on the sample of 26 European countries decreases economic growth. So far, non-renewable energy leads to economic growth, but environmental decline. Le et al. [33] on a sample of 102 countries, which includes all EU countries in the period from 1996 to 2012, found that both renewable and non-renewable energy consumption significantly contribute to income. Their results confirm that renewable energy sources to a significant extent contribute to environmental protection in developed countries. On the contrary, developing countries still have difficulties in utilizing renewable energy sources in order to decrease GHG emissions, which entails substantial scope for policy improvements in this area. Interestingly, Gozgor et al. [34], using ARDL and panel quantile regression methods on the EU sample during 1990–2013, fount that both economic complexity and consumption of energy from non-renewable and renewable sources are accompanied with increase in economic growth. According to Saqib [35], non-renewable energy consumption leads to carbon footprint, while green energy sources are more environmentally friendly.
In addition to methane (CH2), carbon dioxide (CO2) is the main contributor in the GHG emission inventory leading to planetary heating. Earlier research has found that almost 59% of total GHG emissions are CO2 emissions, which are dominantly generated by energy consumption and economic growth [36]. Some studies have found bidirectional causality between carbon emissions and economic growth [37]. In other studies, only unidirectional causality is found between growth and CO2 emissions [38]. Therefore, the relationship between CO2 emissions and economic growth is of great importance for sustainable economic growth. Numerous empirical findings related to the nexus between CO2 and economic growth should serve to policy makers to define pollution control policies, which should help strengthen sustainable economic growth and development. Not a small number of studies have indicated that the consumption of primary energy sources has led to GDP growth, but also to high pollution [39].
A certain number of studies on CO2 emissions and economic growth relationship cover European countries, including EU member states. Acaravci and Ozturk [40], on a sample of a certain number of EU countries, found positive long-run elasticity estimates of carbon emissions with respect to real GDP and negative long-run elasticity estimates of carbon emissions with respect to the square of per capita real GDP (at a significance level of 1% in Denmark and 5% in Italy, while statistically insignificant in Germany, Greece, Iceland and Portugal). At the same time, a one-way causal relationship has been noted in Denmark, Germany, Greece, Iceland, Italy, Portugal and Switzerland between energy consumption, real GDP and the square of per capita real GDP on the one hand and carbon emissions per capita on the other. A short-run unidirectional causal relationship is observed in Denmark and Italy between real GDP per capita and the square of per capita real GDP, on the one hand, and carbon emissions per capita, on the other. In general, the results of this research showed that the practices of rationalization of energy consumption and controlled CO2 emissions in most of the considered countries will not have a negative impact on real output growth. Lee and Brahmasrene [41] explored the nexus between CO2 emissions, tourism, FDI and economic growth between 1988 and 2009 for the EU countries. Their results confirmed that CO2 emissions, FDI and tourism have a positive effect on economic growth, but also that economic growth has had a positive effect on CO2 emissions. Kasman and Duman [42], on the sample of new EU members and countries aspiring to become EU members, suggest that in these countries, a decrease of CO2 emissions should not be expected in the near future if their economic outputs continue to increase. In OECD countries, including EU member states, Sun et al. [43] concluded that the volume of CO2 emissions will continue to grow in the long run if economic productivity continues to grow, while policies should focus on increasing the participation of green technology and clean energy, in order to decarbonize the energy industry. Furthermore, Saboori et al. [44] in 27 OECD countries, including 15 EU countries, confirmed a long-run bidirectional relationship between economic growth, CO2 emissions and energy consumption in the road sector. Saidi and Hammami [45] confirmed the negative impact of CO2 emissions on the economic growth in 60 countries (including a certain number of European countries), finding that a 1% increase in CO2 emissions reduces economic growth by 0.0067%. In this regard, they recommended investment in clean and alternative energy sources for sustainable economic growth. In three regional sub-panels, including Europe, for the period 1990–2011, Omri et al. [46] confirmed that CO2 emissions affected significantly and negatively economic growth in all the panels, including the panel of European countries. Only for the Middle Eastern, North African and sub-Saharan panel, it has been confirmed that CO2 emissions are positively linked to economic growth. Dogan and Aslan [47], using a sample of EU countries, pointed to the existence of two-way causality between real income and CO2 emissions. However, Gardiner and Hajek [48] determined that CO2 emissions affect GDP in both the old and new EU member countries, while a negative bidirectional relationship was only confirmed for the 15 old EU countries. Therefore, it is recommended to increase the share of renewable energy sources in the energy mix and increase energy efficiency. A recent study, covering certain number of EU countries, confirmed that there has been no separation of economic growth from CO2 emissions in France and Spain, which indicates an insufficient reduction in energy consumption from non-renewable sources. However, Sweden has managed to decouple economic growth from CO2 emissions, making CO2 emissions less sensitive to variations in GDP, which confirms that environmental policies have not hampered economic growth [49]. Additionally, Wang et al. [50] showed that Sweden and other European countries, such as Germany, France, Finland and Denmark, grew with reduced CO2 emissions, with decarbonization of the energy system being crucial. They also emphasize that decarbonization must be further accelerated if the Paris climate target is to be achieved. Moreover, the authors warn that the challenges of reconciling the economic growth goals and climate change mitigation are complicated by further support of fossil fuel production and emission-intensive industries, without using the influence of public policy as climate-relevant for changing economic structure. A study covering Germany in the period 1975–2014 determined the long-run relationship between CO2, energy consumption and economic growth, and recommended the introduction of energy tax and regulatory mechanisms to limit the use of fossil fuels and encourage the use of hydropower and biomass as green energy sources [51].
Numerous studies that investigated the nexus between CO2 emissions and economic growth were conducted on the sample of developing and countries that are significant emitters of GHG emissions. Analyzing the relationship between CO2 and economic growth in selected higher CO2 emissions economies, Azam et al. [52] concluded that uncontrolled CO2 emissions have a destructive effect on economic growth if the use of green economies and good environmental practices are lacking. This research confirmed that in some countries, e.g., the USA, China and Japan, the results for the individual analysis across countries, over the period from 1971 to 2013, showed that CO2 emissions have a significant and positive relationship with economic growth. On the contrary, in India, as one of the largest emitters of CO2, a negative impact of CO2 emissions on economic growth is found, which can serve as a good basis for further policy implications, and to force economic development on a sustainable basis. However, Wang et al. [53] confirmed separation of economic growth from CO2 emissions in the USA, in the period 2007–2016, when energy-related CO2 emissions fell by 12% (with a total of 738.14 million metric tons), while GDP increased by 19%. Bozkurt and Akan [54] found a positive relationship between CO2 emissions and economic growth and warned that achieving long-term growth and development with high carbon emissions may damage the quality of the environment. They suggest that solution in these countries should be sought in the mechanisms of CO2 emission control and the implementation of regulatory policies to reduce emissions. Additionally, the results of another study show that total primary energy and CO2 consumption have a long-run and positive causal relationship with GDP growth in developing countries, which leads to high levels of pollution [55]. Ahmad and Du [56] confirm the existence of a long-run and positive relationship between CO2 emission and economic growth. Therefore, they suggest a greater focus on sectors that require less energy consumption, as well as reducing non-renewable energy consumption. Adebayo [57] noted that CO2 emissions, energy use, urbanization and globalization were driving economic growth in Japan for the period 1970–2015. Borhan et al. [58] in ASEAN-8 countries determined a negative relationship between CO2 emissions and GDP p.c., which confirms the long-term destructive effect of environmental pollution on economic prosperity. Interestingly, some studies have confirmed that economic growth does not have to be accompanied by growth of CO2 emissions, i.e., it can be achieved without endangering the quality of the environment [59,60]. Therefore, the development of low-carbon economies and the adaptation of industrial structures are the basic levers for achieving the climate change mitigation goal. Additionally, the experience of some countries has shown a different relationship between CO2 and economic growth, depending on the country’s stage of development [55]. In the first phase, when the country’s development is based on less energy-intensive activities (agriculture, fisheries, forestry), there is a negative path between CO2 and economic growth (emissions fall, GDP grows). In the industrialization phase, it shows the positive path (emissions grow, GDP grows), while in the third phase, when the country focuses on green energy policy, it again shows the negative path between CO2 emissions and GDP growth. Therefore, the recommendation of this study is to constantly balance economic and environmental conditions, where renewable energy has a significant role in the balancing process and the realization of the interests of sustainable development.
ICT has been recognized as one of the key factors of economic growth for two decades. According to the World Bank [61] (p. 20) definition, ICT includes “hardware, software, networks, and media collection, storage, processing, transmission, and presentation of information (voice, data, text, images)”. Intensive and rapid expansion of ICT, especially in the last two decades, has encouraged research on the impact of this technology on economic growth in EU countries. Both developed and underdeveloped economies have turned to ICT, which is used as a modern tool to increase competitiveness, employment and economic growth. Therefore, some research has recognized this technology as a driver of economic growth in both developed and developing countries [62]. It is noticeable that the development of ICT is not homogeneous, but in both groups of countries, there are pronounced differences between regions. In addition, countries need to be as interested as possible in investing in ICT because the greater the investment in this technology, the greater the return on these investments.
The benefits of using ICT are multiple: promoting and developing entrepreneurship and sustainable development [63,64], faster and cheaper access to new markets [65,66], reduced production costs and increased productivity [67,68], fast and efficient access to new information and knowledge [69,70]. The dominant number of empirical studies has confirmed that this technology has significant economic implications, and that it is an important driver of economic growth. Empirical evidence relates to productivity growth, poverty reduction, and increasing economic growth. Relevant international institutions recognize ICT as a key factor of economic growth. Accordingly, the World Economic Forum [71] in its 2013 report confirmed that an increase in digitalization by 10% leads to a decrease in unemployment by 1.02% and an increase in GDP p.c. to 0.75%. With the generation of new jobs and sources of income, and the reduction of costs of health and education services, this technology has long been recognized as one of the key actors in poverty reduction [72].
Previous studies have focused on the impact of telecommunications, as an important aspect of ICT, on economic growth. Thus, research conducted on the sample of CEE countries confirmed the nexus between telecommunication investment, as part of ICT investment, and economic growth. Moreover, further increase in these investments can improve the impact of aggregate investment on economic growth [73]. Similarly, Roller and Waverman [74] in OECD countries, including old EU members, found that a 10% increase in telecommunications investment increases GDP by 2.8%, while Datta and Agarwal [75], for the same group of countries, confirmed a statistically significant and positive correlation between these two variables. In addition, a study on the impact of ICT on economic growth conducted for OECD countries, dominantly including European countries, found that the broadband penetration rate of 10% leads to an increase in GDP p.c. by 0.9–1.5% [76]. Another study offered similar results, for EU countries belonging to the OECD, proving that ICT positively impacts GDP growth [77]. Furthermore, Shiu and Lam [78] found in over 100 countries a two-way relationship between telecommunications and economic growth in European and high-income countries, while in other countries in the sample, the impact of GDP on telecommunications investment was identified. Additionally, Pradhan et al. [79,80] detected a bidirectional causal relationship between telecommunications development and economic growth (long-term and short-term), in both developed and developing countries. Similarly, another study that was regionally conceived confirmed the impact of telecommunications on income at the regional level [81]. Moreover, Hanclova et al. [82] confirmed the influence of ICT capital on economic growth in old and new EU countries and demonstrated that the elasticity in new EU was higher compared to the old EU group.
Subsequent research focused more on the impact of internet on economic growth. Thus, research including a large number of countries and using cross-country data assessed that internet access is statistically significant and positively correlated with economic growth, which contributes to the effect of knowledge and information spillovers across countries [83]. Another study did not establish a direct relationship between internet use and economic growth, but an indirect one, through trade openness [68], finding that internet use contributes more to trade in countries lower-income than in high-income countries. Salahuddin and Gow [84] obtained similar results. Namely, their findings from ARDL cointegration tests confirmed the positive and long-term effects of internet use on economic growth, while the short-term relationship between these variables is found to be statistically insignificant. Therefore, the policy implication of this research was a further increase in investment in internet infrastructure development. Chen et al. [64] examined the impact of the internet on better access to external financing, which overcomes the financial difficulties of small and micro businesses in particular. Overcoming the information asymmetry and reducing agency costs improves the credit availability of companies, which contributes to their sustainable development. Najarzadeh et al. [85] confirmed the positive and statistically significant impact of internet use on productivity growth. Their research showed that increasing the number of internet users by 1% increases GDP per employee by USD 8.16–14.6. Based on the findings, policy implications of this research were related to subsidizing the bringing of the internet to remote locations, taking initiatives to reduce internet membership fees, expanding internet bands and strengthen internet security.
Numerous studies have identified statistically significant and positive effects of ICT investment on economic growth [86,87], which implies that it is necessary to implement special policies that facilitate ICT investment, in order to improve economic growth. Another study found that a 10% increase in fixed broadband penetration increases GDP p.c. growth by more than 1%, both in developed and developing countries [88]. Crandall and Singer [89] offer similar results which showed that increasing broadband investments affects job creation and employment and intensifies economic growth, while Thompson and Garbacz [90] proved that mobile broadband has a positive and significant impact on GDP per household, with a greater impact in underdeveloped countries. A positive impact of broadband adoption on economic growth was confirmed in a study covering EU countries for the period 2005–2011 [91], where in the defined scenario, the total benefits outweigh the costs by over 30% at EU level. This implies the recommendation for public support for the generalized build out of broadband infrastructure. The research on the sample of CEE countries [92] pointed out the significant and positive impact of investment in ICT on GDP p.c., which is why incentives for technological development and investment in this technology should be provided. Interestingly, Yousefi [93] did not confirm the contribution of ICT investment on GDP in developing countries, and concluded that impact of ICT is stronger in high-income countries, compared to low-income countries. Additionally, one study showed that investments in ICT are important for increasing the cost efficiency of banking sector [94], while another assessed the impact of internet banking on improving the efficiency of banks [95,96]. Similarly, recent studies have confirmed a significant and positive impact of ICT investment on economic growth [97,98,99,100].
The research above is summarized in Table 1. By reviewing the literature, it can be concluded that a small number of studies simultaneously covered new and old EU countries. Namely, studies predominantly cover the EU as a whole, only old or only new EU countries, or certain groups within new or old EU members. By including in our research all EU countries, divided into groups of new and old, we find that we have made a contribution to the existing literature. The literature manifests that there is not a single empirical study that has attempted to estimate effects of REC, NREC, GHG and ICT on GDP p.c. We emphasize that all selected independent variables in our model can be linked to the concept of sustainable economic growth, which was the criterion for the selection of variables. Our paper aims to examine the extent to which EU countries, grouped as old and new members, based their economic growth on sustainable basis, in the period 2000–2020, thus contributing to the existing sustainable economic growth literature. The period included in our model was marked by the global financial crisis, the migrant and political crisis of the Eurozone member countries, all of which had an impact on the growth of EU economies.

3. Materials and Methods

Based on a detailed review of the literature, we have identified variables that have a key impact on the sustainable economic growth. Therefore, gross domestic product per capita will be considered as a function of non-renewable energy consumption, renewable energy consumption, greenhouse gas emissions and exports of ICT products. The initial model can be written as:
g d p p c i t = f n e c i t ,     r e c i t ,     g h g i t ,     i c t i t
By applying panel analysis and after logarithmization and in case of meeting the necessary criteria, the model can be noted as:
l n g d p p c i t = β 0 + β 1 l n n e c i t + β 2 l n r e c i t + β 3 l n g h g i t + β 4 l n i c t i t + v i t
In order to examine the stationarity of time series, and with the purpose of differentiating the use of first- and second-generation unit root tests, we applied the Pesaran [101] interdependence test. Pesaran CD statistics are calculated:
C D = 2 T N N 1 i = 1 N 1 j = i + 1 N ρ ^ i j
where ρ ^ i j represents the correlation coefficients between the data for each observation. H0 hypothesis tests that the data are independent. After determining the existence of interdependence between the data, we perform appropriate unit root tests. In order to take into account the established data interdependence, Pesaran [102] considers Cross-Sectional Augmented Dickey–Fuller (CADF) regression:
Δ y i t = α i + ρ i y i t 1 + β i y ¯ t 1 + j = 0 k γ i j Δ y ¯ t 1 + j = 0 k δ i j y i t 1 + ε i t  
where α i is a deterministic term, y ¯ t is a cross-sectional mean at time t and k is the lag order.
CIPS statistic that is based on the average od individual CADF statistics:
C I P S = 1 N i = 1 N t i N , T
where t i N , T is the t-statistic of the estimate of ρ i .
Kao [103] and Pedroni [104] cointegration tests between panels will be used to determine whether or not there is cointegration between the data. The existence of a cointegration relationship between the variables is necessary to conduct further analysis.
The ARDL model can be formulated as follows:
Δ l n g d p p c i t = α 0 + φ i   j = 1 p Δ l n g d p p c i t j + θ i   j = 1 q Δ l n n e c i t j + ω i   j = 1 q Δ l n g h g i t j + β i   j = 1 q Δ l n g d p p c i t j + δ i   j = 1 q Δ l n i c t i t j + π E C T t 1 + λ 1 l n g d p p c i t 1 + λ 2 l n r e c i t 1 + λ 3 l n n e c i t 1 + λ 4 l n g h g i t 1 + λ 5 l n i c t i t 1 + ε i t
where i = 1,…, N denotes the country and t = 1, …, T denotes time period. ∆ represents operator difference, ECT turn coefficients, ECT (−1) stands for the error correction term explained from the long-run equilibrium association, while λ 1 , λ 2 ,   λ 3 ,   λ 4   and   λ 5 represent the coefficients of long-term impact, and p, q, q, q, q the maximum number of lags, ε i t is standard error.
Figure 1 shows a methodological flowchart presenting the steps that will be carried out in the analysis, with the aim of determining long-term relationships between variables.
Our paper analyzes the annual data for 28 European Union countries, including 15 old and 13 new member states. All countries that joined the Union before the fifth enlargement in 2004 form a group of old countries. EU member states that joined during the fifth enlargement and later form the new EU group. The overview of countries by groups is given in Table 2. We analyzed data over the 2000–2020 period. Panel data are unbalanced due to some missing data and a poorer statistical base for some new EU member states.
Our research covered data for the following variables: gross domestic product per capita (gdppc), as a depended variable, and non-renewable energy consumption (nec), renewable energy consumption (rec), greenhouse gas emissions (ghg) and share of ICT in total exports (ict), as independent variables. All data are derived from the World Bank and Eurostat database. Overview of variables and their definitions are presented in Table 3.
Table 4 shows descriptive data statistics for the analyzed groups of countries. There is a significant difference in the value of average GDP p.c. by groups of countries, where old EU countries have a many-times-higher average value of GDP p.c. of USD 42,879.21, compared to the average value of GDP p.c. in the new member states of USD 14,242.76. The share of renewable and non-renewable energy in total energy consumption is approximate in both groups of countries, while older member states have higher GHG emissions p.c. The share of ICT technology in total exports is slightly higher in the new EU member states. Analyzing the number of observations, we notice that we have a larger amount of data for the old EU group of countries, compared to the countries in the new EU group, for the reasons explained above.
Figure 2 shows that, in both groups of countries in the period from 2000, the share of energy consumption from renewable energy sources increased significantly. At the beginning of the analyzed period, both groups of countries have approximately similar share of renewable energy, which in the case of old EU countries is approximately 12%, while being about 13% in new EU. However, when observing the growth trend, we notice that in the old EU group, this growth started much earlier and has been continuous since 2002, while in the new EU countries, the accelerated growth of the share of renewable energy started in 2008. Although at the beginning of the analyzed period the old EU group is characterized by a smaller share of renewable energy, in 2018 its share is higher compared to new EU countries.
The scatter diagram presented in Figure 3 shows the relationship between GDP p.c. and the share of renewable energy consumption, for both groups of countries. We notice that relationships between variables are approximately similar, regardless of the group of countries. There is a positive correlation between variables, so the higher the share of renewable energy consumption, the higher the value of gross domestic product per capita and vice versa. Particularly significant is the part of the graph showing the share of renewable energy consumption of more than 19%, where there is a very strong positive correlation between variables in both groups of countries.

4. Results and Discussion

In this section, we present our results, followed by discussion and comparative analysis. 
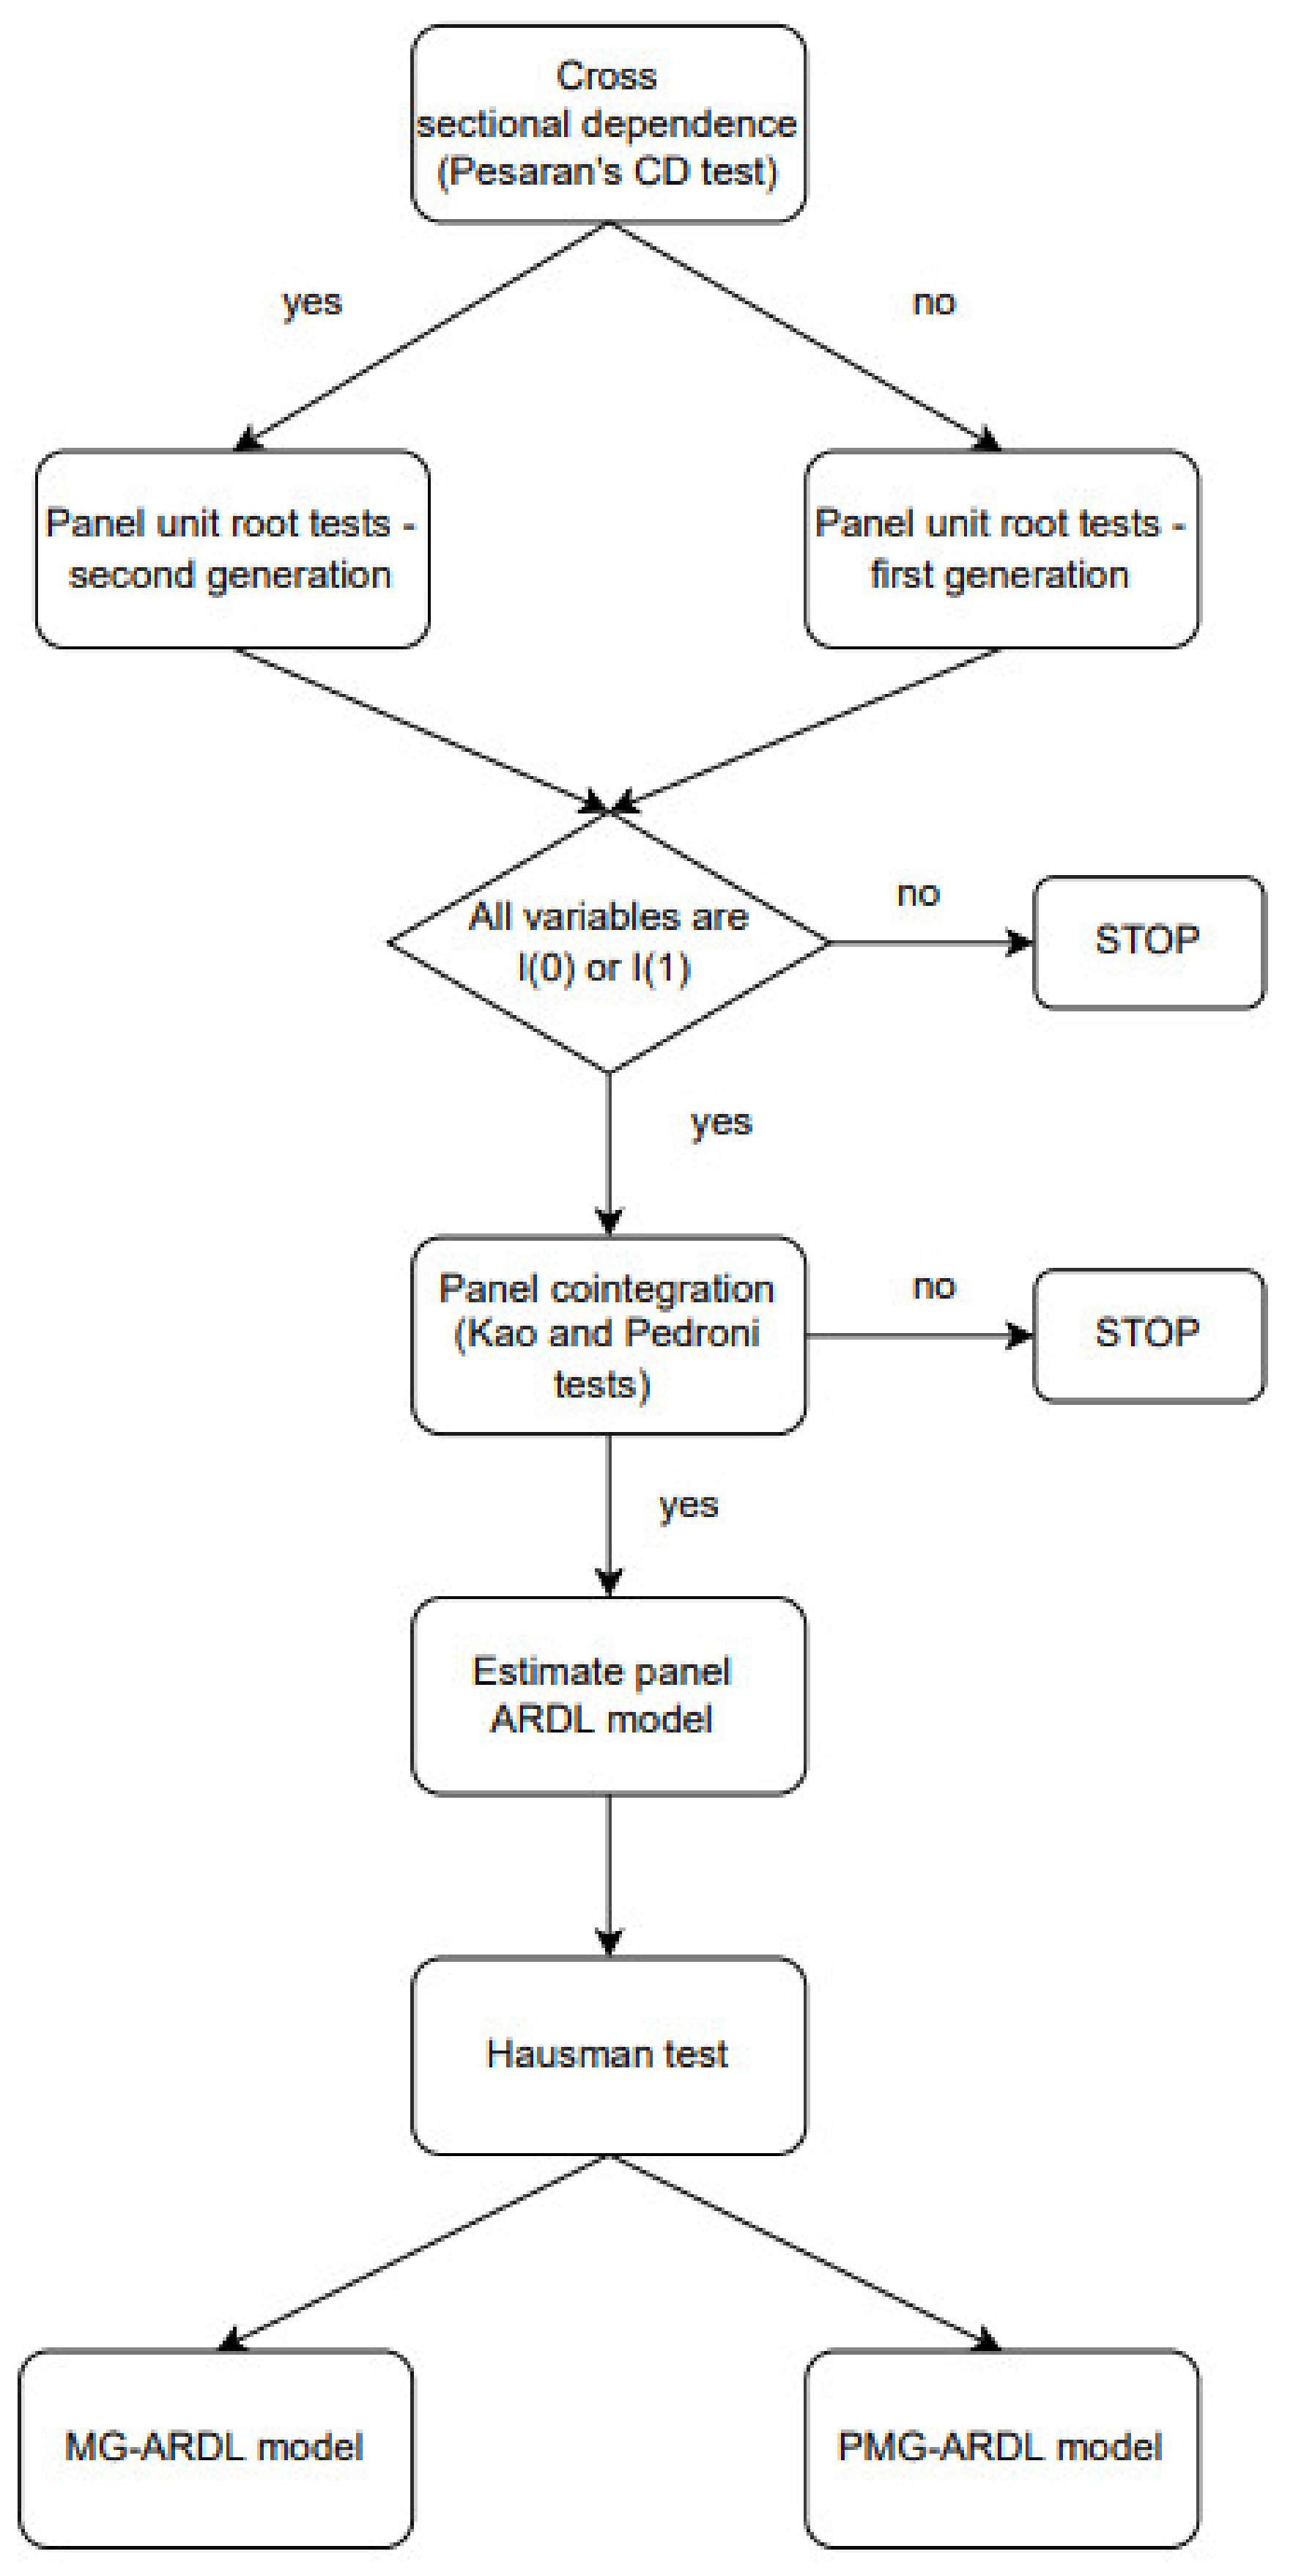
Table 5 shows the results of Pesaran’s CD test of data interdependence [102] for the observed series. The null hypothesis claims that there is no interdependence between the data. Based on the calculated p-values, we reject the null hypothesis, except for the variable lnict in new EU countries. According to the determined interdependence of data for all variables, second-generation unit root tests will be conducted, which are robust in relation to the determined dependence.
Conducting the unit root test of the second generation, Pesaran [102] examined the stationarity of the variables. Table 6 shows the results of the unit root test for the original data and for the first data difference for both groups of countries. For further application of panel ARDL analysis, it is necessary that all variables be of the order of integration I (0) or I (1). If the variables of the order of integration are greater than I (1), they cannot be used in further analysis.
At the level of both groups of analyzed countries, all variables meet the required condition, and are stationary on the first difference. In addition, the variable logarithm of the GDP p.c. in both groups of countries at the level is non-stationary, but differentiation gives its stationary representation. In old EU countries, all remaining variables are stationary and also at the data level. In the new EU group of countries, only the variable logarithm of the share of ICT in total exports is stationary at the level, while the other variables are nonstationary. Identical results for the variable lnict in the new EU countries are obtained if the first generation of unit root tests are applied. The number of lags during the test was determined by minimizing the Akaike information criterion.
In order to determine the cointegration between the panels, we applied the Kao and Pedroni cointegration tests. Based on the results of the conducted cointegration tests between the panels for both groups of countries, shown in Table 7, we can conclude that there is a cointegration relationship between the variables. Namely, the test results indicate that there is a long-term relationship between the variables, so that an adequate panel ARDL model can be estimated.
The corresponding panel ARDL (1,1,1,1) model was evaluated using PMG estimator based on the results of the conducted Hausman test. As aforementioned, the aim of our paper is to examine the relationships between gross GDP p.c. and other analyzed variables. Table 8, which follows, presents the estimated models for both groups of countries. Observing both models, we notice that the error correction coefficients are statistically significant and negative, which means that the models return to equilibrium after external shock. The values of the error correction coefficients are approximate, so after the external shock, the model for the old EU member states is adjusted to equilibrium by 13.4%, while the model estimated for the new EU member countries is adjusted to equilibrium by 13.2% in each time period.
According to Table 8, in the continuation, we present the interpretation of our final results:
  • Based on the estimated model for the old EU member states, we find that the growth of the share of renewable energy consumption of 1% in the long run leads to a significant growth of GDP p.c. by 0.151% in the old EU countries, and 0.067% in the new EU countries. Contrary, the growth of the share of energy consumption from non-renewable sources has a significant and negative impact on GDP p.c. in the long run, in both groups, leading to a decrease of GDP p.c. by 0.512% and 1.306%, respectively, for the old and new EU group if the share of energy consumption from this source increases by 1%. Interestingly, an increase in the share of energy consumption from non-renewable sources of 1% in the long run has a significant and positive impact on the reduction of GDP p.c. by 1.306%, in the new EU countries. In the short run, the growth of renewable energy consumption by 1% decreases GDP p.c. by 0.339%.
Results of recent studies on the impact of non-renewable and renewable energy consumption on economic growth confirm the results of our research. Therefore, Soava et al. [22] found a positive impact of renewable energy consumption on economic growth, in EU-28 countries, for the period 1995–2015. Additionally, Chen et al. [29] found that the impact of renewable energy consumption on economic growth is significant and positive when countries overcome a certain threshold of renewable energy consumption. Similarly, Inglesi-Lotz [27] found that the increase in renewable energy consumption increases GDP and GDP p.c. in the OECD countries, including 23 EU countries, in 1990–2010 period. Furthermore, Rafindadi and Ozturk [23] revealed bidirectional relations between renewable energy consumption and economic growth in Germany from 1971 to 2013, and demonstrated that a 1% increase in consumption of renewable energy leads to economic growth by 0.2194%. Interestingly, Alper and Oguz [24] on the sample of new EU countries in 1990–2009 found significant and positive impact between these two variables only for Bulgaria, Estonia, Poland and Slovenia, while being insignificant for other countries. For 20 OECD countries, out of which 12 belong to the old EU group, in the 1990–2008 period, Ohler and Fetters [25] indicate that renewable energy sources are positively related with GDP in the long run.
We also find support for our results in the impact of non-renewable sources on economic growth in other studies. Therefore, Asiedu et al. [32] found that a rise in non-renewable energy in the 26 European countries, from 1990 to 2018, decreases economic growth. So far, non-renewable energy leads to economic growth, but environmental decline. However, the results of some other research do not fully overlap with our results. For example, Le et al. [33], studying a sample of around 100 countries, which includes all EU countries in the period 1996 to 2012, proved that both renewable and non-renewable energy consumption contribute significantly to income. They noted that renewable energy sources contribute significantly to environmental protection in developed countries, while developing countries are still struggling to utilize these sources to tackle GHG emissions. Gozgor et al. [34] reported similar results.
  • In old EU countries, the impact of GHG emissions is not statistically significant in the long run, while a short-term increase in GHG emissions of 1% leads to an increase in GDP p.c. by 0.205%. On the other hand, in the new EU group, the impact of GHG emissions is significant, whereby an increase of 1% is accompanied by GDP p.c. increase of 0.939% in the long run.
Comparing the results of our research with the results of others, we note that the results of numerous other studies have confirmed the positive relationship between CO2 emissions and economic growth [53], but also warned on environmental degradation if long-term growth and development are achieved with CO2 emissions. Additionally, Lee and Brahmasrene [41] confirmed that CO2 emissions, FDI and tourism have a positive effect on economic growth. Similarly, Al-Mulali and Sab [39], for a sample of developing countries, confirmed that the consumption of primary energy and CO2 has a long-run and a positive impact on GDP growth, with high emissions. Therefore, Ahmad and Du [56], with similar results, suggested a greater orientation of the economic structure towards sectors that are smaller consumers of electricity, as well as basing economic growth on green energy consumption. On the sample of European countries, Piłatowska and Geise [49] confirmed that some countries have unfortunately not yet fully decoupled economic growth from CO2 emissions, although some European countries have succeeded in doing so without slowing economic growth. Saidi and Hammami [45], on a sample of European countries, also confirmed that the correlation between CO2 emissions and economic growth is positive and statistically significant, while Kasman and Duman [42] warn that CO2 emissions should not be expected to fall if GDP grows. We can conclude that our results suggest that EU countries need to further direct their economic growth towards growth on a sustainable basis.
  • In both groups of countries, in the long term, an increase of the share of ICT products in total exports by 1% leads to an increase of GDP p.c. by 0.168% and 0.039% in the old and the new EU group, respectively.
Our results on the impact of ICT on economic growth have strong support in the results of other research. Namely, a significant number of empirical studies have confirmed the statistically significant and positive impact of ICT on economic growth and its role in economic growth on a sustainable basis. The importance of further development of modern ICT technologies can be compared with the greatest technological achievements of mankind. Broadband can help the transition to the “low carbon” economies, effective action against climate change and the effects it produces. As it can be concluded from the literature review (Section 2), numerous studies have confirmed the positive impact of telecommunications on economic growth [73,74,75,81]. When the internet took a key role in the development of ICT, a large number of studies confirmed the positive correlation of the internet with economic growth [83]. Some research confirmed the indirect impact of the internet on economic growth, through trade openness [68,84], which encouraged rapid and intensive development of internet infrastructure. A recent study on the sample of Eurozone countries confirmed the positive impact of ICT on economic growth, with the contribution of this technology to economic growth being particularly emphasized in the period of global financial crisis [105].
Comparing our study with the existing literature, we find that our research is characterized by some specificities that contribute to its novelty and originality. Studies in the previous period were not dominantly focused on the dimension of economic growth sustainability. Our model does not include typical economic variables (e.g., unemployment rate, inflation, FDI, trade openness, gross fixed capital formation, etc.), but variables with an impact on sustainable economic growth (REC, NREC, GHG and ICT). Thus, the goal of our research is to determine whether and to what extent the EU countries in the previous twenty-year period based its growth/grew on a sustainable basis. In our paper, we consider the impact of variables in the short and long term on sustainable economic growth, while in other studies covering EU countries, the impact was mainly considered only in the long term [24,26,32,47,62,81].
Previous research usually/dominantly treats either only the old, or only the new EU countries [23,24,42,51,81], or the EU as a whole [13,14,22,26,32,41,48,82,91], or groups within one of these two groups of countries [49,92]. In our research, we separately covered old and new EU countries, which allowed us to compare the results between these two groups of countries, which contributed to existing literature.
Our paper covered the long and recent period (2000–2020), which included the latest impacts of variables from our model on the economic growth of EU countries.
In our paper, we consider the impact of total GHG emissions, while other studies that included EU countries usually observed only the impact of CO2 gas emissions on economic growth [40,41,43,44,45,47,48,49].

5. Concluding Remarks with Policy Implications

One of the basic challenges facing the modern world is balancing the goals of sustainable economic growth and reducing environmental impact. In this paper, we estimated the effects of certain determinants on sustainable economic growth on the sample of new and old EU members on different development stages which represent an important contribution to the sustainable growth literature in EU countries. Results of our research suggest that an increase in the share of renewable energy consumption leads to an increase in GDP p.c., while an increase in the share of non-renewable energy consumption leads to a decrease in GDP p.c., in both groups of countries. We note that the impact coefficient of renewable energy consumption on economic growth is higher in old EU countries than new EU, while the impact coefficient of non-renewable energy consumption is higher in new EU countries. Likewise, our results indicate a significant and positive impact of the growth of the share of ICT products in total exports on GDP p.c. in the long run, also for both groups of countries, with the impact coefficient being higher in old EU countries. In the long run, GHG emissions are positively correlated with GDP p.c. in new EU countries, so the increase in emissions by 1% in these countries was accompanied by an increase in GDP p.c. by 0.939%. Interestingly, the impact of GHG emissions on economic growth is insignificant in old EU member states. This indicates that obviously economic growth in EU countries is still accompanied by carbon emissions.
In continuation, based on our findings, we present final conclusions with policy implications for EU member countries:
  • The results of our research on the positive impact of renewable energies consumption on economic growth fully justify the EU’s political decisions to increase renewable energy in the total energy consumption. Such policies need to be further strengthened and integrated into future EU and national strategies of EU member states. The adoption of the Renewable Energy Directive (EU) 2018/2001, the Energy Efficiency Directive (EU) 2018/2002, the Governance Regulation (EU) 2018/1999, and the Energy Performance of the Building Directive (EU) 2018/844 created a good basis for harmonization of national regulations with the EU legal framework in this area. Although replacing or supplementing non-renewable energies with green energy has a capital cost on economic growth and performance, achieving the goals of sustainable growth by 2030 by renewable energy consumption and reducing pollution is achievable in the EU-28 and should have no alternatives. To this end, intensifying cooperation mechanisms between EU member states should mitigate the risks of energy deficit in the market through the implementation of good practices in renewable energy management, contribute to further development of resilient energy infrastructure, and reduce dependence on fossil fuel imports from non-EU countries. This should increase marketability and reduce energy price volatility in the global market, and at the same time contribute to the reduction of carbon. Further development of regional partnerships should strengthen the institutional framework, in order to encourage the further development of renewable energy production and make available the most promising green energy technologies. The introduction of subsidies and/or tax credits on renewable energy production and consumption, tax breaks and discounts for the implementation of green energy infrastructure, as well as green energy certificates, should be included in the economic strategies of EU member states and could serve as a useful policy tool. In this way, increasing the share of renewable energy in total energy would discourage the use of fossil fuels and is likely to affect the price of energy produced from non-renewable sources, on the one hand, and mitigate the damage caused by GHG emissions, on another. In addition, it would strengthen the impact of renewable energies consumption on economic growth, stop the negative long-term impact of non-renewable energies consumption on the economic growth of EU member states, and minimize long-term damage from carbon emissions.
  • Sustainable economic growth requires a gradual transformation of economy, society and changes in the environmental ecosystem. In order to accomplish these objectives, it is important to consider the role of the environment in economic growth. EU countries would need to transform from carbon-intensive economies into green economies. Furthermore, policy makers can consider the GHG emissions reduction potential against other sustainability factors when deciding which sustainability policy to adopt. Hence, the policy makers in EU member countries and the Union level, in order to mitigate carbon emission should implement adequate policies to control carbon emissions. In 2020, as a consequence of the COVID-19 health crisis, the EU energy sector experienced a decline in energy demand and supply. In the same year, the International Energy Agency forecasted a decrease in GHG emissions of between 4% and 7% compared to 2019. However, such reductions are not sufficient in order to meet the relevant climate goals. To prevent a temperature increase of more than 2 degrees Celsius, GHG emissions must decline by a minimum of 7% annually over the next decade, which would involve significant investments. Therefore, it is necessary for EU countries to make structural shifts in their economies to become low-carbon economies. Thus, focused and coordinated policy action is important, not only at the individual country and EU level, but also globally. EU governments should actively participate in the ETS (Emissions Trading System) with the aim of reducing GHG emissions through trade permits for every ton of CO2 which companies emit. ETS, as the largest market for GHG emissions, aims to reduce emissions. Additionally, governments of the EU member states should dedicate its policy to fulfilment of the EU’s program “Fit for 55”, which aims to reduce GHG emissions by a minimum of 55% by 2030. Setting a carbon price for imports of certain goods from less climate-ambitious countries would encourage the decarbonization of industry in the EU. In addition, policy makers should focus more on building landfills with regional centers, reconstructing existing and building new renewable energy power plants, but also increasing electric rail traffic and energy efficiency through hybrid vehicles.
  • ICT is a materialization factor of modern advantages on a global level. That is why ICT initiatives are a reality on which sustainable development is based. Regarding future economic growth in EU countries, the ICT infrastructure, which governments should prioritize, needs to be further upgraded and expanded. This strengthens the relationship between ICT and sustainable economic growth. The emphasis is on broadband adoption and internet users as ICT is an important factor in business communication and decision making. Furthermore, the ICT sector, which has exclusivity over information, in the EU countries has the potential to intensify technological diffusion and innovation in the economy and thus stimulate economic growth. European policies need to continue to act to strengthen the activities that have the greatest potential for creating new value, namely, the internet and software, in order to further strengthen the impact of ICT on sustainable economic growth. Additionally, following the example of the USA, EU countries need to intensify cooperation with certain Asian countries (which have become the leaders in these technologies) in the field of ICT research and development. Through its relevant policies, the EU must make additional and joint efforts to increase the use of ICT, especially in less developed countries. To this end, EU countries (especially less developed ones) should increase digital network and internet coverage, make ICT applications accessible and adapted to a large number of users, harmonize multiple communication channels (between different regions within the EU) and encourage the use of smart ICT by competence levels in all segments of the EU population. Additionally, policy makers in EU countries should pay special attention to relevant policies that support internet finance. This reduces information asymmetry and increases access to external finance, which encourages sustainable growth of economic entities. By realizing the above mentioned, ICT is placed in the function of creating new value, i.e., raising sustainable economic growth. In addition, the innovative potential of EU countries should be raised especially in new frontier technology areas, such as artificial intelligence, automation, cyber-security systems, etc. Thus, ICT innovations create conditions for the transformation of traditional industries into more knowledge-intensive industries, with the potential for new innovations.
One of the limitations in our research is that due to unavailability of some data for the previous period, we included time series of data from 2000 to 2020. The unavailability of some data from the period covered by our model caused a decrease in the number of regressors in the model. We emphasize to readers that the aforementioned cannot affect the validity of the model and the results obtained. A recommendation for further research may be the application of the Augmented Mean Group (AMG) and Common Correlated Effects Mean Group (CCEMG) estimators, in order to control and compare the differences that exist for each of the countries individually within both analyzed groups. Additionally, a recommendation for further research is to develop similar analysis on a group of countries with similar income levels. The inclusion of the entire COVID and post-COVID period in the analysis could have an impact on the results, which might merit further research. We expect that in the future, there will be more such and similar research, as the EU countries should nurture economic growth on a sustainable basis and create policies that contribute to such growth.

Author Contributions

Conceptualization, M.Ž., J.Ć. and S.R.; methodology, B.P. and I.V.; software, B.P., I.V. and M.Ž.; validation, B.P., I.V., M.Ž. and R.V.; formal analysis, S.L. and J.Ć.; investigation, M.Ž., S.L. and J.Ć.; resources, M.Ž., J.Ć., B.P., I.V. and R.V.; data curation, B.P., I.V. and R.V.; writing—original draft preparation, M.Ž., J.Ć., S.R.; writing—review and editing, S.L., B.P., I.V. and R.V.; visualization, B.P., S.L. and S.R.; supervision, M.Ž., J.Ć. and S.R. All authors have read and agreed to the published version of the manuscript.

Funding

This research received no external funding.

Institutional Review Board Statement

Not applicable.

Informed Consent Statement

Not applicable.

Data Availability Statement

Not applicable.

Conflicts of Interest

The authors declare no conflict of interest.

References

  1. Motesharrei, S.; Rivas, J.; Kalnay, E. Human and nature dynamics (HANDY): Modeling inequality and use of resources in the collapse or sustainability of societies. Ecol. Econ. 2014, 101, 90–102. [Google Scholar] [CrossRef] [Green Version]
  2. European Commission. Directive 2012/27/EU of the European Parliament and of the Council of 25 October 2012 on energy efficiency, amending Directives 2009/125/EC and 2010/30/EU and repealing Directives 2004/8/EC and 2006/32/EC. Off. J. Eur. Union 2022, L 315/1, 1–56. Available online: https://eur-lex.europa.eu/legal-content/EN/TXT/PDF/?uri=CELEX:32012L0027&from=EN (accessed on 18 July 2022).
  3. European Commission. Europe 2020. A European Strategy for Smart, Sustainable and Inclusive Growth. Working Paper. 2010. Available online: https://ec.europa.eu/eu2020/pdf/COMPLET%20EN%20BARROSO%20%20%20007%20-%20Europe%202020%20-%20EN%20version.pdf (accessed on 15 June 2022).
  4. European Commission. Communication from the Commission to the European Parliament, the Council, the European Economic and Social Committee and the Committee of the Regions. Renewable Energy: A Major Player in the European Energy Market. Renewable Energy: An Important Factor In the European Energy Market. Available online: https://eur-lex.europa.eu/LexUriServ/LexUriServ.do?uri=COM:2012:0271:FIN:EN:PDF (accessed on 20 July 2022).
  5. European Commission. 2030 Targets. EU Policy, Strategy and Legislation for 2030 Environmental, Energy and Climate Targets. Available online: https://ec.europa.eu/info/energy-climate-change-environment/overall-targets-and-reporting/2030-targets_en (accessed on 20 July 2022).
  6. European Environmental Agency. Monitoring Mechanism Regulation 525/2013. Available online: https//www.eea.europa.eu/policy-documents/monitoring-mechanism-regulation-525-2013 (accessed on 19 July 2022).
  7. OECD. Information Technology Outlook 2000. ICTs, E-Commerce and the Information Economy. Available online: https://www.oecd-ilibrary.org/science-and-technology/information-technology-outlook-2000_it_outlook-2000-en (accessed on 17 July 2022).
  8. European Commission. The Digital Agenda for Europe: Key Initiative, Why Digital Agenda for Europe? Brussels, 2010, 3–15. Available online: https://eur-lex.europa.eu/legal-content/EN/TXT/PDF/?uri=CELEX:52010DC0245&from=en (accessed on 19 July 2022).
  9. Attiaoui, I.; Toumi, H.; Ammouri, B.; Gargouri, I. Causality links among renewable energy consumption, CO2 emissions, and economic growth in Africa: Evidence from a panel ARDL-PMG approach. Environ. Sci. Polutt. R. 2017, 24, 13036–13048. [Google Scholar] [CrossRef] [PubMed]
  10. Menegaki, A.N. The ARDL method in the energy-growth nexus field; best implementation strategies. Economies 2019, 7, 105. [Google Scholar] [CrossRef] [Green Version]
  11. Nelson, V.C.; Starcher, K.L. Introduction to Renewable Energy, 2nd ed.; CRC Press: Boca Raton, FL, USA, 2015. [Google Scholar] [CrossRef]
  12. United Nations. The 17 Goals: Sustainable development. United Nations, Department of Economic and Social Affairs. 2015. Available online: https://www.un.org/sustainabledevelopment/wp-content/uploads/2019/01/SDG_Guidelines_AUG_2019_Final.pdf (accessed on 9 June 2022).
  13. Davidson, N.; Maksimova, E.; Mariev, O. How does renewable energy consumption affect economic growth? Evidence from the European Union countries. In Proceedings of the 21st International Scientific Conference Globalization and its Socio-Economic Consequences, Zilina, Slovakia, 13 October 2021. [Google Scholar] [CrossRef]
  14. Armeanu, D.Ş.; Vintilă, G.; Gherghina, Ş.C. Does renewable energy drive sustainable economic growth? Multivariate panel data evidence for EU-28 countries. Energies 2017, 10, 381. [Google Scholar] [CrossRef]
  15. Kahia, M.; Aïssa, M.S.B.; Charfeddine, L. Impact of renewable and non-renewable energy consumption on economic growth: New evidence from the MENA Net Oil Exporting Countries (NOECs). Energy 2016, 116, 102–115. [Google Scholar] [CrossRef]
  16. European Commission. Directive 2009/28/EC of the European Parliament and of the Council on the promotion of the use of energy from renewable sources and amending and subsequently repealing Directives 2001/77/EC and 2003/30/EC. Off. J. Eur. Union 2009, 140/116, 1–47. Available online: https://eur-lex.europa.eu/legal-content/EN/TXT/PDF/?uri=CELEX:32009L0028&from=en (accessed on 5 June 2022).
  17. European Commission. Directive 2018/2001 of the European Parliament and of the Council of 11 December 2018 on the promotion of the use of energy from renewable sources and amending and subsequently repealing Directives 2001/77/EC and 2003/30/EC. Off. J. Eur. Union 2018, 5, 82–168. Available online: https://eurlex.europa.eu/legal-content/EN/TXT/PDF/?uri=CELEX:32018L2001&from=fr (accessed on 5 June 2022).
  18. Adewuyi, A.O.; Awodumi, O.B. Renewable and non-renewable energy-growth-emissions linkages: Review of emerging trends with policy implications. Renew. Sust. Energ. Rev. 2017, 69, 275–291. [Google Scholar] [CrossRef]
  19. Chang, T.; Gupta, R.; Inglesi-Lotz, R.; Simo-Kengne, B.; Smithers, D.; Trembling, A. Renewable energy and growth: Evidence from heterogeneous panel of G7 countries using Granger causality. Renew. Sust. Energ. Rev. 2015, 52, 1405–1412. [Google Scholar] [CrossRef] [Green Version]
  20. Sadorsky, P. Renewable energy consumption and income in emerging economies. Energ. Policy 2009, 37, 4021–4028. [Google Scholar] [CrossRef]
  21. Gyamfi, B.A.; Bein, M.A.; Bekun, F.V. Investigating the nexus between hydroelectricity energy, renewable energy, nonrenewable energy consumption on output: Evidence from E7 countries. Environ. Sci. Pollut. R. 2020, 27, 25327–25339. [Google Scholar] [CrossRef]
  22. Soava, G.; Mehedintu, A.; Sterpu, M.; Raduteanu, M. Impact of renewable energy consumption on economic growth: Evidence from European Union countries. Technol. Econ. Dev. Eco. 2018, 24, 914–932. [Google Scholar] [CrossRef]
  23. Rafindadi, A.A.; Ozturk, I. Impacts of renewable energy consumption on the German economic growth: Evidence from combined cointegration test. Renew. Sust. Energ. Rev. 2017, 75, 1130–1141. [Google Scholar] [CrossRef]
  24. Alper, A.; Oguz, O. The role of renewable energy consumption in economic growth: Evidence from asymmetric causality. Renew. Sust. Energ. Rev. 2016, 60, 953–959. [Google Scholar] [CrossRef]
  25. Ohler, A.; Fetters, I. The causal relationship between renewable electricity generation and GDP growth: A study of energy sources. Energ. Econ. 2014, 43, 125–139. [Google Scholar] [CrossRef]
  26. Saint Akadiri, S.; Alola, A.A.; Akadiri, A.C.; Alola, U.V. Renewable energy consumption in EU-28 countries: Policy toward pollution mitigation and economic sustainability. Energ. Policy 2019, 132, 803–810. [Google Scholar] [CrossRef]
  27. Inglesi-Lotz, R. The impact of renewable energy consumption to economic growth: A panel data application. Energ. Econ. 2016, 53, 58–63. [Google Scholar] [CrossRef] [Green Version]
  28. Silva, S.; Soares, I.; Pinho, C. The impact of renewable energy sources on economic growth and CO2 emissions: A SVAR approach. Eur. Res. Stud. J. 2012, 15, 133–144. [Google Scholar] [CrossRef] [Green Version]
  29. Chen, C.; Pinar, M.; Stengos, T. Renewable energy consumption and economic growth nexus: Evidence from a threshold model. Energ. Policy 2020, 139, 111295. [Google Scholar] [CrossRef]
  30. Ellabban, O.; Abu-Rub, H.; Blaabjerg, F. Renewable energy resources: Current status, future prospects and their enabling technology. Renew. Sust. Energ. Rev. 2014, 39, 748–764. [Google Scholar] [CrossRef]
  31. DeCanio, S.J. The political economy of global carbon emissions reductions. Ecol. Econ. 2009, 68, 915–924. [Google Scholar] [CrossRef]
  32. Asiedu, B.A.; Hassan, A.A.; Bein, M.A. Renewable energy, non-renewable energy, and economic growth: Evidence from 26 European countries. Environ. Sci. Pollut. R. 2021, 28, 11119–11128. [Google Scholar] [CrossRef]
  33. Le, T.H.; Chang, Y.; Park, D. Renewable and nonrenewable energy consumption, economic growth, and emissions: International evidence. Energ. J. 2020, 41, 73–92. [Google Scholar] [CrossRef]
  34. Gozgor, G.; Lau, C.K.M.; Lu, Z. Energy consumption and economic growth: New evidence from the OECD countries. Energy 2018, 153, 27–34. [Google Scholar] [CrossRef] [Green Version]
  35. Saqib, N. Green energy, non-renewable energy, financial development and economic growth with carbon footprint: Heterogeneous panel evidence from cross-country. Econ. Res. Ekon. Istraz. 2022, 1–20. [Google Scholar] [CrossRef]
  36. Bacon, R.W.; Bhattacharya, S. Growth and CO2 emissions: How do different countries fare? Environ. Work. Pap. Ser. 2007, 113, 1–50. [Google Scholar]
  37. Yang, Z.; Zhao, Y. Energy consumption, carbon emissions, and economic growth in India: Evidence from directed acyclic graphs. Econ. Model. 2014, 38, 533–540. [Google Scholar] [CrossRef]
  38. Bhattacharya, M.; Lean, H.H.; Bhattacharya, S. Economic Growth, Coal Demand, Carbon Dioxide Emissions: Empirical Findings from India with Policy Implications; Monash University, Department of Economics: Melbourne, VIC, Australia, 2014; Available online: https://www.monash.edu/__data/assets/pdf_file/0003/925707/economic_growth,_coal_demand,_carbon_dioxide_emissions_empirical_findings_from_india_with_policy_implications.pdf (accessed on 19 May 2022).
  39. Al-Mulali, U.; Sab, C.N.B.C. The impact of energy consumption and CO2 emission on the economic growth and financial development in the Sub Saharan African countries. Energy 2012, 39, 180–186. [Google Scholar] [CrossRef]
  40. Acaravci, A.; Ozturk, I. On the relationship between energy consumption, CO2 emissions and economic growth in Europe. Energy 2010, 35, 5412–5420. [Google Scholar] [CrossRef]
  41. Lee, J.W.; Brahmasrene, T. Investigating the influence of tourism on economic growth and carbon emissions: Evidence from panel analysis of the European Union. Tour. Manag. 2013, 38, 69–76. [Google Scholar] [CrossRef]
  42. Kasman, A.; Duman, Y.S. CO2 emissions, economic growth, energy consumption, trade and urbanization in new EU member and candidate countries: A panel data analysis. Econ. Model. 2015, 44, 97–103. [Google Scholar] [CrossRef]
  43. Sun, H.; Samuel, C.A.; Amissah, J.C.K.; Taghizadeh-Hesary, F.; Mensah, I.A. Non-linear nexus between CO2 emissions and economic growth: A comparison of OECD and B&R countries. Energy 2020, 212, 118637. [Google Scholar] [CrossRef]
  44. Saboori, B.; Sapri, M.; bin Baba, M. Economic growth, energy consumption and CO2 emissions in OECD (Organization for Economic Co-operation and Development)’s transport sector: A fully modified bi-directional relationship approach. Energy 2014, 66, 150–161. [Google Scholar] [CrossRef]
  45. Saidi, K.; Hammami, S. The impact of energy consumption and CO2 emissions on economic growth: Fresh evidence from dynamic simultaneous-equations models. Sustain. Cities Soc. 2015, 14, 178–186. [Google Scholar] [CrossRef]
  46. Omri, A.; Nguyen, D.K.; Rault, C. Causal interactions between CO2 emissions, FDI, and economic growth: Evidence from dynamic simultaneous-equation models. Econ. Model. 2014, 42, 382–389. [Google Scholar] [CrossRef] [Green Version]
  47. Dogan, E.; Aslan, A. Exploring the relationship among CO2 emissions, real GDP, energy consumption and tourism in the EU and candidate countries: Evidence from panel models robust to heterogeneity and cross-sectional dependence. Renew. Sust. Energ. Rev. 2017, 77, 239–245. [Google Scholar] [CrossRef]
  48. Gardiner, R.; Hajek, P. Interactions among energy consumption, CO2, and economic development in European Union countries. Sustain. Dev. 2020, 28, 723–740. [Google Scholar] [CrossRef]
  49. Piłatowska, M.; Geise, A. Impact of clean energy on CO2 emissions and economic growth within the phases of renewables diffusion in selected European countries. Energies 2021, 14, 812. [Google Scholar] [CrossRef]
  50. Wang, R.; Assenova, V.A.; Hertwich, E.G. Energy system decarbonization and productivity gains reduced the coupling of CO2 emissions and economic growth in 73 countries between 1970 and 2016. One Earth 2021, 4, 1614–1624. [Google Scholar] [CrossRef]
  51. Khoshnevis Yazdi, S.; Shakouri, B. The renewable energy, CO2 emissions, and economic growth: VAR model. Energ. Source Part B. 2018, 13, 53–59. [Google Scholar] [CrossRef]
  52. Azam, M.; Khan, A.Q.; Abdullah, H.B.; Qureshi, M.E. The impact of CO2 emissions on economic growth: Evidence from selected higher CO2 emissions economies. Environ. Sci. Pollut. R. 2016, 23, 6376–6389. [Google Scholar] [CrossRef]
  53. Wang, Q.; Jiang, X.T.; Ge, S.; Jiang, R. Is economic growth compatible with a reduction in CO2 emissions? Empirical analysis of the United States. Resour. Conserv. Recycl. 2019, 151, 104443. [Google Scholar] [CrossRef]
  54. Bozkurt, C.; Akan, Y. Economic growth, CO2 emissions and energy consumption: The Turkish case. Int. J. Energy Econ. Policy 2014, 4, 484–494. [Google Scholar]
  55. Bekhet, H.A.; Othman, N.S. The role of renewable energy to validate dynamic interaction between CO2 emissions and GDP toward sustainable development in Malaysia. Energ. Econ. 2018, 72, 47–61. [Google Scholar] [CrossRef]
  56. Ahmad, N.; Du, L. Effects of energy production and CO2 emissions on economic growth in Iran: ARDL approach. Energy 2017, 123, 521–537. [Google Scholar] [CrossRef]
  57. Adebayo, T.S. Do CO2 emissions, energy consumption and globalization promote economic growth? Empirical evidence from Japan. Enviro. Sci. Pollut. R. 2021, 28, 34714–34729. [Google Scholar] [CrossRef]
  58. Borhan, H.; Ahmed, E.M.; Hitam, M. The impact of CO2 on economic growth in ASEAN-8. Procedia Soc. Behav. Sci. 2012, 35, 389–397. [Google Scholar] [CrossRef] [Green Version]
  59. Ghosh, B.C.; Alam, K.J.; Osmani, M.A.G. Economic growth, CO2 emissions and energy consumption: The case of Bangladesh. Int. J. Bus. Econ. Res. 2014, 3, 220–227. [Google Scholar] [CrossRef] [Green Version]
  60. Lim, K.M.; Lim, S.Y.; Yoo, S.H. Oil consumption, CO2 emission, and economic growth: Evidence from the Philippines. Sustainability 2014, 6, 967–979. [Google Scholar] [CrossRef] [Green Version]
  61. World Bank Group. Information and Communication Technologies: A World Bank Group Strategy; World Bank: Washington, DC, USA, 2002; Available online: https://documents1.worldbank.org/curated/en/421471468325303463/pdf/800880PUB0Info00Box379796B00PUBLIC0.pdf (accessed on 20 May 2022).
  62. Lovrić, L. Information-communication technology impact on labor productivity growth of EU developing countries. Zb. Rad. Ekon. Fak. Rije. 2012, 30, 223–245. [Google Scholar]
  63. Henry, B.C. ICT for sustainable development. Sci. Technol. 2012, 2, 142–145. [Google Scholar] [CrossRef] [Green Version]
  64. Chen, Y.; Gong, X.; Chu, C.C.; Cao, Y. Access to the internet and access to finance: Theory and evidence. Sustainability 2018, 10, 2534. [Google Scholar] [CrossRef] [Green Version]
  65. Alfaro Cortés, E.; Alfaro Navarro, J.L. Do ICT influence economic growth and human development in European Union countries? Int. Adv. Econ. Res. 2011, 17, 17–28. [Google Scholar] [CrossRef]
  66. Pradhan, R.P.; Mallik, G.; Bagchi, T.P. Information communication technology (ICT) infrastructure and economic growth: A causality evinced by cross-country panel data. IIMB Manag. Rev. 2018, 30, 91–103. [Google Scholar] [CrossRef]
  67. García-Muñiz, A.S.; Vicente, M.R. ICT technologies in Europe: A study of technological diffusion and economic growth under network theory. Telecommun. Policy 2014, 38, 360–370. [Google Scholar] [CrossRef]
  68. Meijers, H. Does the Internet generate economic growth, international trade, or both? Int. Econ. Econ. Policy 2014, 11, 137–163. [Google Scholar] [CrossRef] [Green Version]
  69. Pradhan, R.P.; Arvin, M.B.; Nair, M.; Bennett, S.E. Sustainable economic growth in the European Union: The role of ICT, venture capital, and innovation. Rev. Financ. Econ. 2020, 38, 34–62. [Google Scholar] [CrossRef]
  70. Sepehrdoust, H.; Ghorbanseresht, M. Impact of information and communication technology and financial development on economic growth of OPEC developing economies. Kasetsart J. Soc. Sci. 2018, 40, 546–551. [Google Scholar] [CrossRef]
  71. World Economic Forum. The Global Information Technology Report 2013, Digitization for Economic Growth and Jobs in a Interconnected World. 2013. Available online: https://www3.weforum.org/docs/WEF_GITR_Report_2013.pdf (accessed on 16 May 2022).
  72. OECD. ICTs for Development: Improving Policy Coherence; OECD: Paris, France, 2010; Available online: https://read.oecd-ilibrary.org/development/icts-for-development_9789264077409-en#page1 (accessed on 25 May 2022).
  73. Madden, G.; Savage, S.J. CEE telecommunications investment and economic growth. Inf. Econ. Policy 1998, 10, 173–195. [Google Scholar] [CrossRef] [Green Version]
  74. Roller, L.H.; Waverman, L. Telecommunications infrastructure and economic development: A simultaneous approach. Am. Econ. Rev. 2001, 91, 909–923. [Google Scholar] [CrossRef] [Green Version]
  75. Datta, A.; Agarwal, S. Telecommunications and economic growth: A panel data approach. Appl. Econ. 2004, 36, 1649–1654. [Google Scholar] [CrossRef]
  76. Czernich, N.; Falck, O.; Kretschmer, T.; Woessmann, L. Broadband Infrastructure and Economic Growth. Econ. J. 2011, 121, 505–532. [Google Scholar] [CrossRef]
  77. Fernández-Portillo, A.; Almodóvar-González, M.; Hernández-Mogollón, R. Impact of ICT development on economic growth. A study of OECD European Union countries. Technol. Soc. 2020, 63, 101420. [Google Scholar] [CrossRef]
  78. Shiu, A.; Lam, P.L. Causal relationship between telecommunications and economic growth: A study of 105 countries. In Proceedings of the 17th Biennial Conference of the International Telecommunications Society, Montreal, QC, Canada, 24 June 2008. [Google Scholar]
  79. Pradhan, R.P.; Arvin, M.B.; Norman, N.R.; Bele, S.K. Economic growth and the development of telecommunications infrastructure in the G-20 countries: A panel-VAR approach. Telecommun. Policy 2014, 38, 634–649. [Google Scholar] [CrossRef]
  80. Pradhan, R.P.; Arvin, M.B.; Hall, J.H. Economic growth, development of telecommunications infrastructure, and financial development in Asia, 1991–2012. Q. Rev. Econ. Finance 2016, 59, 25–38. [Google Scholar] [CrossRef]
  81. Cieślik, A.; Kaniewska, M. Telecommunications infrastructure and regional economic development: The case of Poland. Reg. Studies 2004, 38, 713–725. [Google Scholar] [CrossRef]
  82. Hanclova, J.; Doucek, P.; Fischer, J.; Vltavska, K. Does ICT capital affect economic growth in the EU-15 and EU-12 countries? J. Bus. Econ. Manag. 2015, 16, 387–406. [Google Scholar] [CrossRef] [Green Version]
  83. Choi, C.; Yi, M.H. The effect of the Internet on economic growth: Evidence from cross-country. Econ. Lett. 2009, 105, 39–41. [Google Scholar] [CrossRef]
  84. Salahuddin, M.; Gow, J. The effects of Internet usage, financial development and trade openness on economic growth in South Africa: A time series analysis. Telemat. Inform. 2016, 33, 1141–1154. [Google Scholar] [CrossRef] [Green Version]
  85. Najarzadeh, R.; Rahimzadeh, F.; Reed, M. Does the Internet increase labor productivity? Evidence from a cross-country dynamic panel. J. Policy Model. 2014, 36, 986–993. [Google Scholar] [CrossRef]
  86. Nasab, E.H.; Aghaei, M. The effect of ICT on economic growth: Further evidence. Int. Bull. Bus. Adm. 2009, 5, 46–56. [Google Scholar]
  87. Dimelis, S.P.; Papaioannou, S.K. FDI and ICT effects on productivity growth: A comparative analysis of developing and developed countries. Eur. J. Dev. Res. 2010, 22, 79–96. [Google Scholar] [CrossRef]
  88. Qiang, C.Z.W.; Rossotto, C.M.; Kimura, K. Information and Communications for Development 2009: Extending Reach and Increasing Impact; World Bank: Washington, DC, USA, 2009; Available online: https://documents1.worldbank.org/curated/en/645821468337815208/pdf/487910PUB0EPI1101Official0Use0Only1.pdf (accessed on 17 May 2022).
  89. Crandall, R.W.; Singer, H.J. The Economic Impact of Broadband Investment. Study for Broadband America. 2010. Available online: https://www.researchgate.net/profile/Charles-Jackson-6/publication/265631048_C_The_Effect_of_Ubiquitous_Broadband_Adoption_on_Investment_Jobs_and_the_US_Economy/links/587cdbd108ae9275d4e7100a/C-The-Effect-of-Ubiquitous-Broadband-Adoption-on-Investment-Jobs-and-the-US-Economy.pdf (accessed on 17 June 2022).
  90. Thompson, H.G., Jr.; Garbacz, C. Economic impacts of mobile versus fixed broadband. Telecommun. Policy 2011, 35, 999–1009. [Google Scholar] [CrossRef]
  91. Gruber, H.; Hatonen, J.; Koutroumpis, P. Broadband access in the EU: An assessment of future economic benefits. Telecommun. Policy 2014, 18, 1046–1058. [Google Scholar] [CrossRef] [Green Version]
  92. Zagorchev, A.; Vasconcellos, G.; Bae, Y. Financial development, technology, growth and performance: Evidence from the accession to the EU. J. Int. Financ. Mark. Inst. Money 2011, 21, 743–759. [Google Scholar] [CrossRef]
  93. Yousefi, A. The Impact of Information and Communication Technology on Economic Growth: Evidence from Developed and Developing Countries. Econ. Innov. New Technol. 2011, 20, 581–596. [Google Scholar] [CrossRef]
  94. Lin, H.J.; Lin, W. International E-Banking: ICT Investments and the Basel Accord. J. Comp. Int. Manag. 2007, 10, 23–39. [Google Scholar]
  95. Stoica, O.; Mehdian, S.; Sargu, A. The impact of Internet banking on the performance of Romanian banks: DEA and PCA approach. Procedia Econ. Financ. 2015, 20, 610–622. [Google Scholar] [CrossRef] [Green Version]
  96. Ghita-Mitrescu, S.; Duhnea, C. Internet Banking in Romania at a Glance. Ovidius Univ. Ann. Econ. Sci. Ser. 2016, 16, 508–514. [Google Scholar]
  97. Niebel, T. ICT and economic growth–Comparing developing, emerging and developed countries. World Dev. 2018, 104, 197–211. [Google Scholar] [CrossRef] [Green Version]
  98. Majeed, M.T.; Ayub, T. Information and Communication Technology (ICT) and Economic Growth Nexus: A Comparative Global Analysis. Pak. J. Commer. Soc. Sci. 2018, 12, 443–476. [Google Scholar]
  99. Haftu, G.G. Information communications technology and economic growth in Sub-Saharan Africa: A panel data approach. Telecommun. Policy 2018, 43, 88–99. [Google Scholar] [CrossRef]
  100. Latif, Z.; Latif, S.; Ximei, L.; Pathan, Z.H.; Salam, S.; Jianqiu, Z. The dynamics of ICT, foreign direct investment, globalization and economic growth: Panel estimation robust to heterogeneity and cross-sectional dependence. Telemat. Inform. 2018, 35, 318–328. [Google Scholar] [CrossRef]
  101. Pesaran, M.H. General diagnostic tests for cross-sectional dependence in panels. Empir. Econ. 2021, 60, 13–50. [Google Scholar] [CrossRef]
  102. Pesaran, M.H. A simple panel unit root test in the presence of cross-section dependence. J. Appl. Economet. 2007, 22, 265–312. [Google Scholar] [CrossRef] [Green Version]
  103. Kao, C. Spurious regression and residual-based tests for cointegration in panel data. J. Econometrics 1999, 90, 1–44. [Google Scholar] [CrossRef]
  104. Pedroni, P. Panel cointegration: Asymptotic and finite sample properties of pooled time series tests with an application to the PPP hypothesis. Econ. Theory 2004, 20, 597–625. [Google Scholar] [CrossRef] [Green Version]
  105. Laitsou, E.; Kargas, A.; Varoutas, D. How ICT affects economic growth in the Euro area during the economic crisis. NETNOMICS Econ. Res. Electron. Netw. 2020, 21, 59–81. [Google Scholar] [CrossRef]
Figure 1. Methodological flowchart.
Sustainability 14 09662 g001
Figure 2. Annual share of renewable energy consumption in total consumption. (a) Old EU countries; (b) New EU countries.
Sustainability 14 09662 g002
Figure 3. Scatter diagram: GDP p.c. and share of renewable energy consumption by group of countries. (a) Old EU countries; (b) New EU countries.
Sustainability 14 09662 g003
Table 1. Summary of the studies on the effects of renewable and non-renewable energy consumption, GHG and ICT on economic growth.
Author(s) & YearCountry(ies)ScopeFindings
Effects of REC and NREC on economic growth
Davidson et al. [13]EU countries1990–2015REC positively affects economic growth both in the short and long run
Armeanu et al. [14]EU countries 2003–2014REC positively affects economic growth
Kahia et al. [15]MENA Net Oil Exporting Countries1980–2012NREC increases real GDP in the long and short run, while REC in the long run increases GDP and in the short run does not have any impact on GDP
Chang et al. [19]G7 countries1990–2011In Germany, Italy, UK and USA, economic growth and REC do not affect each other, while REC causes economic growth in Canada, France and Japan
Sadorsky [20]18 countries 1994–2003REC positively affects economic growth
Gyamfi et al. [21]E7 countries 1990–2018NREC contribution to real GDP is positively significant
Soava et al. [22]EU countries1995–2015Positive impact of REC on economic growth
Rafindadi and Ozturk [23]Germany1971–2013Increase in REC boosts economic growth
Alper and Oguz [24]new EU countries1990–2009REC has positive impacts on economic growth.
Ohler and Fetters [25]20 OECD countries 1990–2008REC is positively related with GDP in the long run
Saint Akadiri et al. [26]EU countries1995–2015Positive and significant long-run nexus among REC and economic growth
Inglesi-Lotz [27]OECD countries 1990–2010Influence of REC on economic growth is positive and statistically significant
Silva et al. [28]4 countries 1960–2004REC can initially decrease the growth of the economy
Chen et al. [29]103 countries 1995–2015Effect of REC on economic growth in developed countries is insignificant, while in developing or non-OECD countries, it is positive and significant only if those countries surpass a certain threshold of REC
Asiedu et al. [32]26 EU countries1990–2018REC marginally decreases, while NREC decreases economic growth
Le et al. [33]102 countries 1996–2012REC and NREC contribute significantly to income
Gozgor et al. [34]OECD countries1990–2013NREC and REC are positively associated with a higher rate of economic growth
Saqib [35]63 emerging and developed economies1990–2020Positive bivariate correlation of GDP, NREC and REC
Effects of GHG on economic growth and vice versa
Yang and Zhao [37]India1970–2008CO2 emissions were accompanied by economic growth
Al-Mulali and Sab [39]Sub Saharan African countries1980–2008CO2 emission had a positive causal relationship on GDP growth in the long run
Acaravci and Ozturk [40]European countries1960–2005Positive long-run elasticity of carbon emissions with respect to real GDP
Lee and Brahmasrene [41]EU countries1988–2009Positive relationship between economic growth and CO2 emissions
Kasman et al. [42]new EU and candidate countries1992–2010Per capita emissions increase until a certain level of p.c. real GDP, then they start to decrease
Sun et al. [43]OECD and B&R countries1992–2015Volume of CO2 emissions will continue to increase in the long-run if economic productivity continues to grow
Saboori et al. [44]OECD countries1960–2008Positive long-run relationship between CO2 emissions and economic growth
Saidi and Hammami [45]58 countries 1990–2012Negative impact of CO2 on economic growth
Omri et al. [46]54 countries (3 regional sub-panels)1990–2011CO2 emissions affected significantly and negatively economic growth
Dogan and Aslan [47]EU and candidate countries1995–2011Real income mitigates CO2 emissions
Gardiner and Hajek [48]EU countries1990–2015Shock in GDP is due to fluctuations in CO2 emissions
Piłatowska and Geise [49]France, Spain and Sweden1965–2019No separation of economic growth from CO2 emissions in France and Spain, whereas they are decoupled in Sweden
Wang et al. [50]73 countries1970–2016In the absence of mitigation mechanisms, emissions would have grown at the same rate as the economy
Bozkurt and Akan [54]Turkey1960–2010Carbon emission has a negative effect on economic growth
Ahmad and Du [56]Iran1971–2011CO2 emissions have positive relation with the economic growth
Adebayo [57]Japan1970–2015CO2 emissions trigger economic growth
Khoshnevis Yazdi and Shakouri [51]Germany1975–2014Economic growth increases CO2 emissions
Azam et al. [52]selected higher CO2 emissions economies1971–2013CO2 emissions have a positive relationship with economic growth (China, Japan and USA) and negative (India)
Borhan et al. [58]ASEAN-81965–2010CO2 shows negative significant relationship with income
Ghosh et al. [59]Bangladesh1972–2011Economic growth does not have to be accompanied by growth of CO2 emissions
Lim et al. [60]The Philippines1965–2012Economic growth can continue without increasing CO2 emissions.
Bekhet and Othman [55]Malaysia1971–2015Causality from CO2 emission to economic growth depends on the country’s development phase
Effects of ICT on economic growth
Lovrić [62]25 European developed and developing countries2001–2010Positive and significant impact of ICT on labor productivity, and then on economic growth
Pradhan et al. [65]G20 countries2001–2012Positive association among ICT infrastructure and economic growth
García-Muñiza and Vicente [67]27 EU countries2000, 2005, 2007ICT allows faster and cheaper access to new markets
Meijers [68]213 countries1990–2008ICT reduces production costs and increases productivity
Pradhan et al. [69]25 European countries1989–2016Innovations cause economic growth factors in the long run
Sepehrdoust and Ghorbanseresht [70]OPEC developing countries2002–2015ICT variables increase economic growth
Madden and Savage [73]CEE countries1990–1995Positive relationship between ICT investments and growth
Roller and Waverman [74]OECD countries 1970–1990Increase in the penetration rate generates significant aggregate economic output
Datta and Agarwal [75]OECD countries1980–1992Significant and positive correlation between telecommunications infrastructure and growth
Czernich et al. [76]OECD countries1996–2007Increase in broadband penetration raises annual p.c. growth
Fernández-Portillo et al. [77]OECD Countries2004–2017ICT drives economic growth
Shiu and Lam [78]105 countries1980–2006Positive bidirectional relationship between telecommunications development and economic growth in high-income countries
Pradhan et al. [79]G20 countries1991–2012Positive bidirectional relationship between ICT and economic growth
Pradhan et al. [80]21 Asian countries1991–2012Positive bidirectional relationship between ICT and economic growth
Cieślik and Kaniewska [81]Poland1989–1998Positive and statistically significant relationship between telecommunications infrastructure and the level of income
Hanclova et al. [82]EU countries1994–2008ICT affects economic growth (elasticity being higher in new EU members)
Choi and Yi [83]207 countries1991–2001Internet plays a positive and significant role in economic growth
Salahuddin and Gow [84]South Africa1991–2013Internet use stimulates economic growth
Najarzadeh et al. [85]108 countries1995–2010Increasing the number of internet users increases GDP per employed person
Nasab and Aghaei [86]OPEC countries1990–2007Significant impact of investments in ICT on economic growth
Dimelis and Papaioannou [87]42 developing and developed countries1993–2001Contribution of ICT to economic growth is quite high
Qiang et al. [88]120 countries1980–2016A 10% increase in fixed broadband penetration increases GDP p.c. growth by more than 1%
Crandall and Singer [89]USA2003–2009Increasing broadband investments intensifies economic growth
Thompson and Garbacz [90]43 countries2005–2009Mobile broadband has a positive and significant impact on GDP per household
Gruber et al. [91]EU countries2005–2011Positive impact of broadband adoption on economic growth
Zagorchev et al. [92]CEE countries1997–2004Investment in ICT have significant positive impacts on GDP
Yousefi [93]62 countries2000–2006ICT increases economic growth in the high and upper-middle income groups, but fails to contribute in the lower-middle income group countries
Lin and Lin [94]51 countries1993–2000Investments in ICT increase the cost efficiency of banking sector
Stoica et al. [95]Romania2001–2010Investments in ICT enhance the cost efficiency of banking sector
Niebel [97]59 countries1995–2010Positive link between ICT and economic development
Majeed and Ayub [98]149 countries1980–2015ICT accelerates both global and regional economic growth
Haftu [99]Sub-Saharan Africa2006–2015Growth in mobile phone penetration contributes significantly to the GDP p.c.
Latif et al. [100]BRICS countries2000–2014ICT positively contributes to economic growth
Table 2. Groups of countries according to the EU accession.
OLDNEW
AustriaBulgaria
BelgiumCroatia
DenmarkCyprus
FinlandCzech Republic
FranceEstonia
GermanyHungary
GreeceLatvia
IrelandLithuania
ItalyMalta
LuxembourgPoland
NetherlandsRomania
PortugalSlovakia
SpainSlovenia
Sweden
United Kingdom
Table 3. Overview of variables in our research.
VariableAbbreviationExplanation
Gross domestic product
per capita *
gdppcGDP p.c. is gross domestic product divided by midyear population. GDP is the sum of gross value added by all resident producers in the economy plus any product taxes and minus any subsidies not included in the value of the products.
Non-renewable energy consumption *necRepresents the share of non-renewable energy in total final energy consumption. Non-renewable energy is energy derived from finite resources that are not replaced quickly enough to keep up with the speed of consumption. Most non-renewable energy sources are fossil fuels such as petroleum and crude oil, coal and natural gas, but nuclear fuel, mainly used to produce electricity.
Renewable energy consumption *recRepresents the share of renewable energy in total final energy consumption. Renewable energy sources are natural resources which will replenish to replace the portion depleted by usage and consumption. It includes energy of sun, wind, moving water (hydropower, wave and tidal energy), heat below the earth surface (geo-thermal energy) and biomass (such as wood, waste and crops).
Greenhouse gas emissions **ghgThe indicator measures total national emissions (from both ESD and ETS sectors), including carbon dioxide (CO2), methane (CH4), nitrous oxide (N2O), and the so-called F-gases, from all sectors of the GHG emission inventories. Using each gas’ individual global warming potential, they are being integrated into a single indicator expressed in units of CO2 equivalents.
Share of ICT in total exports * ictInformation and communication technology goods exports include computers and peripheral equipment, communication equipment, consumer electronic equipment, electronic components, and other information and technology goods (miscellaneous).
* World Bank definition. ** Eurostat definition.
Table 4. Descriptive statistics.
Title 1VariableObsMeanStd. Dev.MinMax
OLDgdppc31542,879.2119,571.1717,292.63112372.7
nec28584.1802312.9646447.108599.1472
rec28515.8197712.964640.852852.8915
ghg30010.853674.9891411.729.4
ict3156.3843685.4566121.06759736.81885
NEWgdppc27314,240.765731.3563717.67728,211.06
nec24783.8759910.0032957.4018100
rec24716.1240110.00329042.5982
ghg2607.6219233.244125−0.715
ict2719.47392210.400720.79341963.63605
Table 5. Pesaran data interdependence test.
Title 1VariableCD-Testp-Value
OLDlngdppc25.927410.0000
lnnec40.40640.0000
lnrec40.438120.0000
lnghg36.439230.0000
lnict38.54270.0000
NEWlngdppc35.948760.0000
lnnec33.34080.0000
lnrec33.122220.0000
lnghg25.927410.0000
lnict−0.9750300.3295
Table 6. Pesaran unit root test of second generation.
LevelFirst Difference
VariableCIPSp-ValueCIPSp-Value
OLDlngdppc−1.27851≥0.10−2.25953<0.10
lnnec−2.51271<0.01−6.41963<0.01
lnrec−2.55004<0.01−3.78802<0.01
lnghg−3.15198<0.01−3.1716<0.01
lnict−2.19495<0.10−2.94625<0.01
NEWlngdppc−2.11258≥0.10−2.23888<0.10
lnnec−1.12511≥0.10−9.50162<0.01
lnrec−0.55063≥0.10−3.00539<0.01
lnghg−1.54648≥0.10−3.08082<0.01
lnict−2.79541<0.01−3.11749<0.01
Table 7. Kao and Pedroni cointegration tests.
Kao Test for CointegrationOLDNEW
Statisticp-ValueStatisticp-Value
Modified Dickey–Fuller t1.49620.0673−1.85510.0318
Dickey–Fuller t2.02390.0215−2.27560.0114
Augmented Dickey–Fuller t0.61890.268−3.38150.0004
Unadjusted modified Dickey–Fuller t1.46480.0715−1.27010.102
Unadjusted Dickey–Fuller t1.98870.0234−2.00390.0225
Pedroni test for cointegration
Ho: No cointegration
Ha: All panels are cointegrated
Statisticp-ValueStatisticp-Value
Modified variance ratio−3.2840.0005−4.11140.000
Modified Phillips–Perron t2.73470.00311.77890.0376
Phillips–Perron t0.42610.335−0.69690.2429
Augmented Dickey–Fuller t1.68120.0464−1.54060.0617
Pedroni test for cointegration
Ho: No cointegration
Ha: All panels are cointegrated
Statisticp-ValueStatisticp-Value
Modified Phillips–Perron t3.68180.00013.06360.0011
Phillips–Perron t−0.44960.3265−0.0240.4904
Augmented Dickey–Fuller t0.48130.3152−0.3560.3609
Table 8. Panel ARDL models, PMG estimation for all countries.
OLDNEW
CoefficientCoefficient
Long-run
lnner−0.512 *−1.306 ***
(0.29)(0.465)
lnrec0.151 ***0.067 **
(0.021)(0.034)
lnghg0.1760.939 ***
(0.157)(0.077)
lnict0.168 ***0.039 ***
(0.04)(0.006)
Short-run
ECT−0.134 ***−0.132 **
(0.047)(0.063)
∆lnner−0.719−0.446
(0.555)(0.609)
∆lnrec0.028−0.339 **
(0.072)(0.166)
∆lnghg0.205 ***0.147 ***
(0.053)(0.049)
∆lnict−0.005−0.018 ***
(0.015)(0.007)
_cons1.615 ***1.772 **
(0.557)(0.84)
Hausman test1.251.35
p-value0.86690.8528
Note: *, ** and *** indicate that the coefficients are significant at the 10%, 5% and 1% level of significance, respectively.
Publisher’s Note: MDPI stays neutral with regard to jurisdictional claims in published maps and institutional affiliations.

