Article

Multi-Objective Prediction of the Mechanical Properties and Environmental Impact Appraisals of Self-Healing Concrete for Sustainable Structures

1
Department of Civil & Mechanical Engineering, Kampala International University, Western Campus, Kampala 25454, Uganda
2
Department of Structural Engineering, Faculty of Engineering and Technology, Future University in Egypt, New Cairo 11865, Egypt
3
Facultad de Ingeniería Mecánica y Ciencias de la Producción, Escuela Superior Politécnica del Litoral, ESPOL, Campus Gustavo Galindo Km 30.5 Vía Perimetral, Guayaquil 090506, Ecuador
4
Center of Nanotechnology Research and Development (CIDNA), Escuela Superior Politécnica del Litoral, ESPOL, Campus Gustavo Galindo Km 30.5 Vía Perimetral, Guayaquil 090506, Ecuador
5
Department of Civil Engineering, Shahid Bahonar University of Kerman, Kerman 7616913439, Iran
6
Chairman Board of Trustees, Faculty of Engineering and Technology, Future University in Egypt, New Cairo 11865, Egypt
7
Department of Civil Engineering, University of Birjand, Birjand 9717434765, Iran
8
GGG Research Lab, Department of Civil Engineering, Michael Okpara University of Agriculture, Umudike 440109, Nigeria
*
Author to whom correspondence should be addressed.
Sustainability 2022, 14(15), 9573; https://doi.org/10.3390/su14159573
Submission received: 23 June 2022 / Revised: 14 July 2022 / Accepted: 21 July 2022 / Published: 4 August 2022
(This article belongs to the Special Issue Sustainable Building Materials: An Eco-Approach for Construction)

Abstract

:
As the most commonly used construction material, concrete produces extreme amounts of carbon dioxide (CO2) yearly. For this resulting environmental impact on our planet, supplementary materials are being studied daily for their potentials to replace concrete constituents responsible for the environmental damage caused by the use of concrete. Therefore, the production of bio-concrete has been studied by utilizing the environmental and structural benefit of the bacteria, Bacillus subtilis, in concrete. This bio-concrete is known as self-healing concrete (SHC) due to its potential to trigger biochemical processes which heal cracks, reduce porosity, and improve strength of concrete throughout its life span. In this research paper, the life cycle assessment (LCA) based on the environmental impact indices of global warming potential, terrestrial acidification, terrestrial eco-toxicity, freshwater eco-toxicity, marine eco-toxicity, human carcinogenic toxicity, and human non-carcinogenic toxicity of SHC produced with Bacillus subtilis has been evaluated. Secondly, predictive models for the mechanical properties of the concrete, which included compressive (Fc), splitting tensile (Ft), and flexural (Ff) strengths and slump (S), have been studied by using artificial intelligence techniques. The results of the LCA conducted on the multiple data of Bacillus subtilis-based SHC mixes show that the global warming potential of SHC-350 mix (350 kg cement mix) is 18% less pollutant than self-healing geopolymer concrete referred to in the literature study. The more impactful mix in the present study has about 6% more CO2 emissions. In the terrestrial acidification index, the present study shows a 69–75% reduction compared to the literature. The results of the predictive models show that ANN outclassed GEP and EPR in the prediction of Fc, Ft, Ff, and S with minimal error and overall performance.

1. Introduction

1.1. Background

The Portland cement invention in 1820 revolutionized the building industry. Since then, concrete has become the world’s leading building material [1,2,3,4]. The problem with concrete is that it has low tensile strength, which is why it cracks so easily in use despite its apparent advantages in terms of compression strength, molding, and raw material cost [3,5,6]. Concrete macro-cracks can develop as micro-cracks and enlarge to become macro-cracks, causing damage to the architectural beauty and reducing bearing capacity. Species such as chloride ions, sulfates ions, and carbon dioxide may enter the concrete through cracks that provide access to the interior. In turn, this accelerates concrete carbonization, reinforcement corrosion, and excess expansion. Structures become less durable and concrete’s service life is shortened dramatically when these effects take place. Concrete cracks damage structures such as roofs, pipes, reservoirs, and water-holding structures, causing leaks and affecting their functionality [7].
There is a high probability that a crack in cement concrete composites, regardless of whether it is autogenous or caused by loading, can occur, and if it does occur, it can be difficult to detect or remedy, which poses a danger to safety and durability, especially for infrastructure designed with a high sealing requirement [4]. Concrete particles react with unhydrated cement particles under conditions of continuous water addition and fill cracks with less than 0.1 mm width [8,9]. However, cracks larger than 0.3 mm may encounter limitations with these natural self-healing mechanisms. Accordingly, previous research has examined cracks in concrete over the past two decades with the aim of improving their self-healing capacity [6,10]. Most commonly, cementitious materials have been used for grouting and epoxy resins have been used for crack injection. In the presence of an inaccessible structure, all these treatments may not be efficient to repair the cracks, since they are applied manually. Additionally, concrete structures require regular inspections throughout their lifetime, which could pose an additional financial burden on their owners. Therefore, the development of self-healing concrete that can repair cracks is of particular interest, since it reduces maintenance costs and automates the repair process, leading to reduced maintenance costs [11,12]. Sustainable civil engineering is undoubtedly gaining prominence with the development of self-healing materials [13].
The French Academy of Science observed self-healing in 1836 when unhydrated cement particles were further hydrated and calcium hydroxide dissolved in concrete mixed together with carbon dioxide. In this process, unhydrated cement particles are continually hydrated, resulting in calcium carbonate precipitation [14]. Hydraulic concrete self-healing was observed by Ivanov and Polyakov [15] in 1974. Gray [16] reported in 1984 that an interfacial zone between steel fibers and cement mortar matrix was able to heal more autonomously under continuous water curing than a fractured plain mortar or concrete matrix under continuous water curing. Materials mixing (nanofillers, mineral additives, curing agents, fibers) and self-healing (electrode position, capsules, shape memory alloy, bacteria and vascular) are by far the most common self-healing techniques proposed for concrete [4].
Several methods have been explored to improve concrete’s self-healing ability, as demonstrated in this study, including microencapsulated healing agents, super absorbing polymers, brittle tube sealing, shape memory alloys, bacterial concrete, and crystallized admixtures [17,18,19,20,21,22,23,24,25,26,27,28,29,30,31,32,33]. In addition to increasing compressive strength and reducing porosity, Pei et al. [34] showed that Bacillus subtilis was incorporated into mortar mixtures at a certain dosage. Fresh cement paste/mortar is a mixture of bacteria and has not yet been fully understood. For strength enhancement as presented in Figure 1, Mondal et al. [35] recommend 105 cells per milliliter, and for durability (reduced water absorption and penetration depth), 107 cells per milliliter. It was discovered by Schreiberova et al. [36] that cement paste fluidity improved when bacteria grew in the admixtures. The self-healing properties of cracks in concrete, the benefits of which are presented in Figure 1, at an early age as well as structural cracks were studied by Reddy and Ravitheja [13] using crystalline admixtures under four different exposure conditions. Fourier transform infrared spectroscopy and energy-dispersive spectroscopy were used to determine the physical (morphological) and chemical composition of the hardened pastes. After age and structural cracks, the samples of crystalline admixture with concrete showed a high compressive strength and split tensile strength, regardless of exposure conditions. The calcite content has substantially increased as evidenced by the results of Scanning Electron Microscopy (SEM), energy-dispersive spectroscopy, and Fourier transform infrared spectroscopy. According to the Zhang et al. paper [4], autogenous and autonomous healing concretes have been fabricated, characterized, and demonstrated. One of the more damaging reactions that concrete structures may endure during service life has been examined by Allahyari et al. [3], including the development of cracks in self-healing concrete and its mechanical properties. An accelerated ASR test was conducted, which was a periodic measurement of length and weight. The test also measured the elasticity and compression of the material. Additionally, SEM was used to assess the microstructure of the specimens. Researchers have developed an analytical model to predict expansion induced by ASR in self-healing concrete. The study’s results showed that self-healing concrete was unable to repair ASR damage. Self-healing concrete has undergone changes in terms of expansion characteristics and mechanical properties due to exposure to ASR. In Kim et al.’s study [1], the use of linear and nonlinear resonance acoustic spectroscopy was used to monitor the degree of self-healing in concrete incorporating both self-healing capsules and crystalline admixtures. To measure the acoustic nonlinearity parameter (α) and linear resonance frequency in concrete after two months of flexural and longitudinal vibration using impact-based excitation, two months of vibration were required. A nonlinearity parameter was also evaluated for multiple impacts where the amplitudes were adjusted manually and for single impacts where the amplitudes were artificially shifted by shifting the windowing region. A linear resonance frequency increase of 86% to 97% was observed after 63 days of self-healing. An inverse linear relationship was observed between resonance frequency and external crack area. However, a significant correlation was not found between the change in (α) and the number of partially filled cracks.

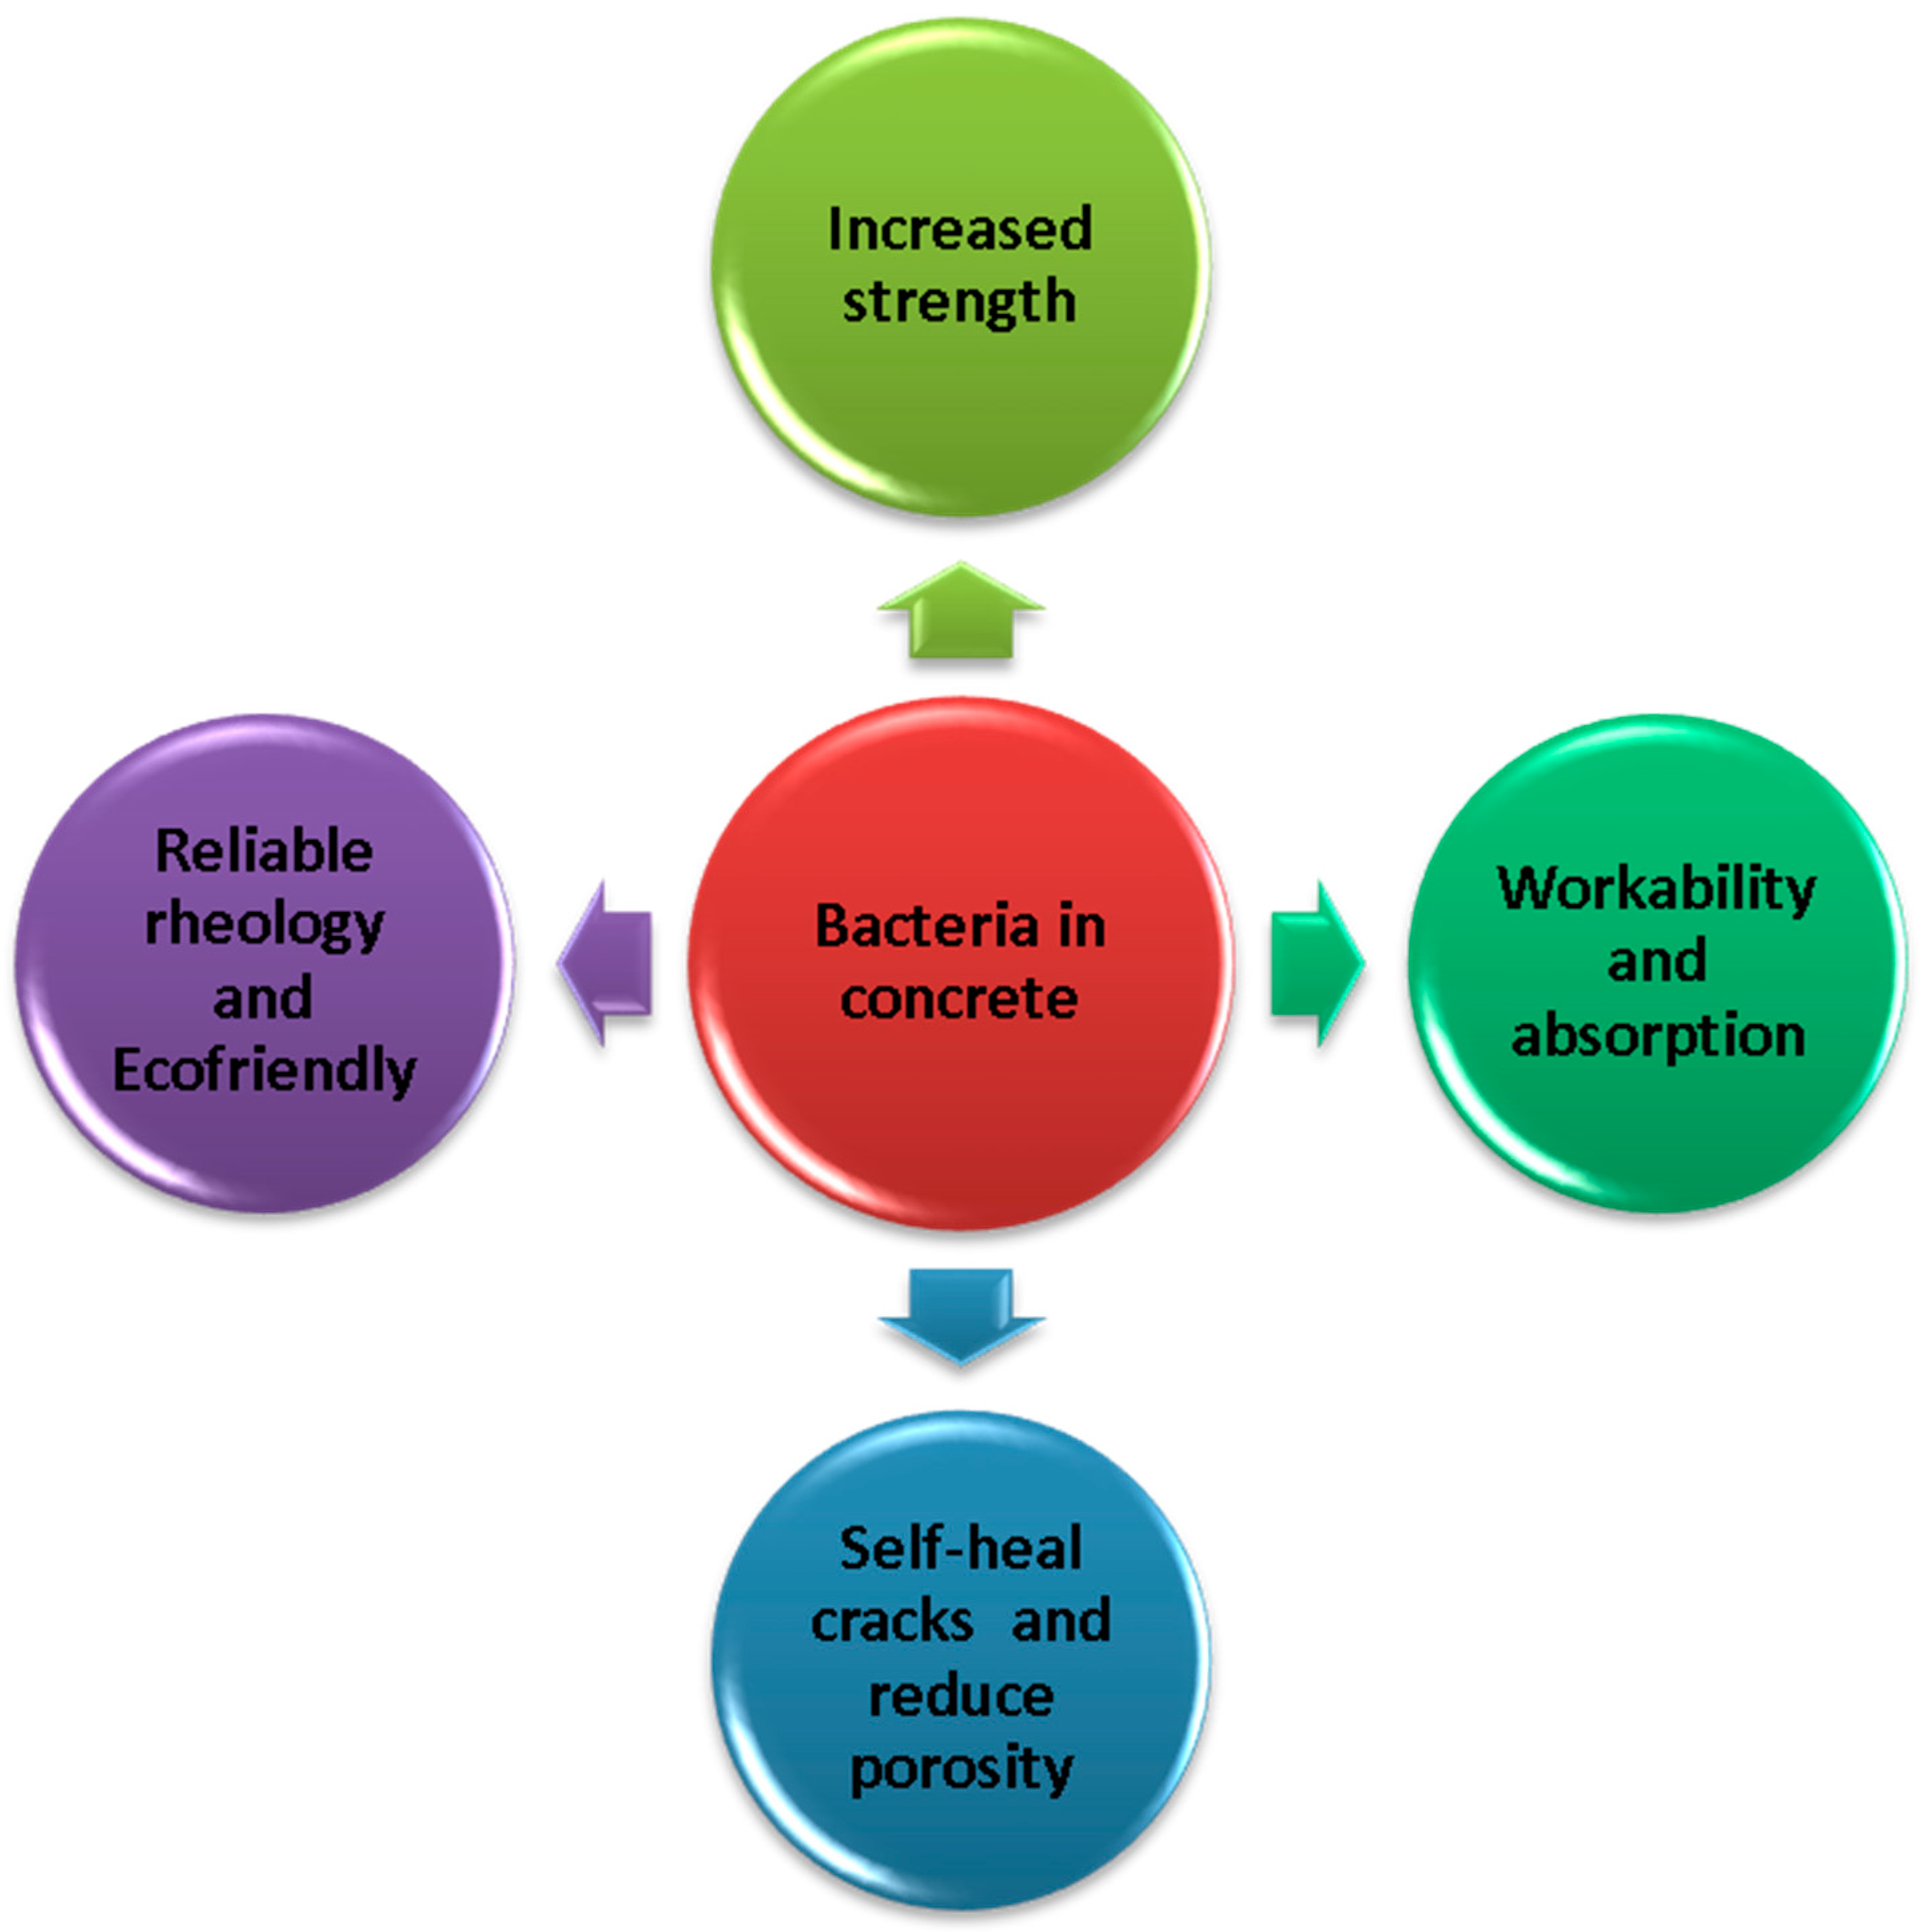
1.2. Strength and Workability of Self-Healing Concrete

Cement-based concrete contributes to high environmental impact and health hazards as well as causes numerous devastating effects on the eco-system (Figure 2). On the other hand, the mechanical improvements which are achieved by utilizing supplementary cement sources are of great importance to the strength and life cycle needs of a sustainable infrastructure. Despite the fact that researchers have indicated that self-healing concrete can heal cracks, it is critical to evaluate its workability in its fresh state and also its long-term performance in hardened state to ensure that concrete’s properties are not adversely impacted by these healing products [37].
Vijay et al. [38] investigated the impact of combining Bacillus subtilis bacteria spore powder with calcium lactate on the workability of two concrete mixes: basalt-fiber reinforced concrete and conventional concrete. With the goal of boosting concrete strength, the bacterial content had been set at 105 cfu/mL and calcium lactate had been employed as a nutrition supply at a dose of 0.5% by cement weight. No superplasticizer was employed in the mixture. Bacillus subtilis mixed with calcium lactate improved the slump value of conventional concrete, according to the findings. The involvement of calcium lactate as a retarding ingredient increased the workability of bacterial concrete. In addition, basalt fibers were added to the bacterial concrete, resulting in a slump value that was substantially identical to that of conventional concrete lacking bacteria. Conventional bacterial concrete or bio-concrete is more workable than the fiber-reinforced bacterial mixture. According to an investigation by Mohammed et al. [39], employing iron-respiring bacteria grown in Tryptone Soya Broth (TSB) did not have any effect on the slump grade and fresh density of CEM I concrete. The CEM III concrete mixes, on the other hand, demonstrated a different pattern. It shows a 9% reduction in slump level and a small decrease in the unit weight of concrete.
Chahal et al. [40] found that substituting 10% of the cement with silica fume enhanced the compressive strength of bacterial concrete by 52%, 66%, and 45%, with corresponding cell doses of 103, 105, and 107 cells/mL, in comparison to control concrete lacking bacteria and SF. The same tendency was observed when rice husk ash [41] or natural zeolite were used instead of cement [42]. Other studies by Vijay et al. [38] and Khaliq et al. [43] investigated using Bacillus subtilis with calcium lactate as a nutrition source. The compressive strength of the 28 day-concrete with Bacillus subtilis at a cell content of 105 cells/mL is approximately 20% greater than that of concrete lacking bacteria, as reported by Vijay and Murmu [38].
Wang et al. 2022 [44] studied the impact of using “Hydrogel” on the self-healing behavior of cementitious materials. They found that using “Hydrogel” decreases the desorption ratio, displayed very low shrinkage in the cement matrix and hence improve the self-healing process.
This research study was important to assess the sustainability of the use of bacteria in concrete since cement production releases about 4% of the worldwide total of CO2 emissions, which is generated at two points: (i) as a byproduct of burning fossil fuels such as coal which generate the heat required to drive the cement-production process and (ii) from the thermal decomposition of CaCO3 in the process of clinker production. Moreover, it is estimated that 1 tons of cement produced releases about 780 kg of CO2, 70% of which is from decarbonation process and 30% on energy use. More so, the production and use of concrete is also estimated to release over 8% of the global CO2 emission.
In this paper, the life cycle assessment of Bacillus subtilis self-healing concrete was conducted to determine the environmental impact of the utilization of this bacteria. Seven impact indices were considered which are global warming potential, terrestrial acidification, terrestrial eco-toxicity, freshwater eco-toxicity, marine eco-toxicity, human carcinogenic toxicity, and human non-carcinogenic toxicity. Furthermore, intelligent predictive models were proposed based on artificial neural networks (ANN), evolutionary polynomial regressions (EPR), and gene expression programming (GEP) techniques for Fc, Ft, and Ff for the SHC cured for 28 days and for the slump; which was the test of the workability behavior of the concrete. Lastly, the performances of the models was analyzed by using various indices which included line of best fits, variances, and the Taylor diagram.

2. Methodology

2.1. Data Collection

In this research work, an extensive literature exercise was conducted and this gave rise to multiple data sets of self-healing concrete produced under the influence of concentrations of Bacillus subtilis and these were collected from the previous works of Pei et al., Mondal et al., and Schreiberova et al. [34,35,36]. These data points contain the traditional constituents of concrete: cement, aggregates, and water in addition to the bacteria concentrations. It also includes the measured mechanical properties which are slump (workability behavior), 28 days cured compressive, splitting tensile, and flexural strengths besides the life cycle assessment evaluation. Predictive models were proposed for sustainable infrastructure design, construction, and lifetime performance monitoring. The entire exercise has been presented as a theoretical framework in Figure 3.

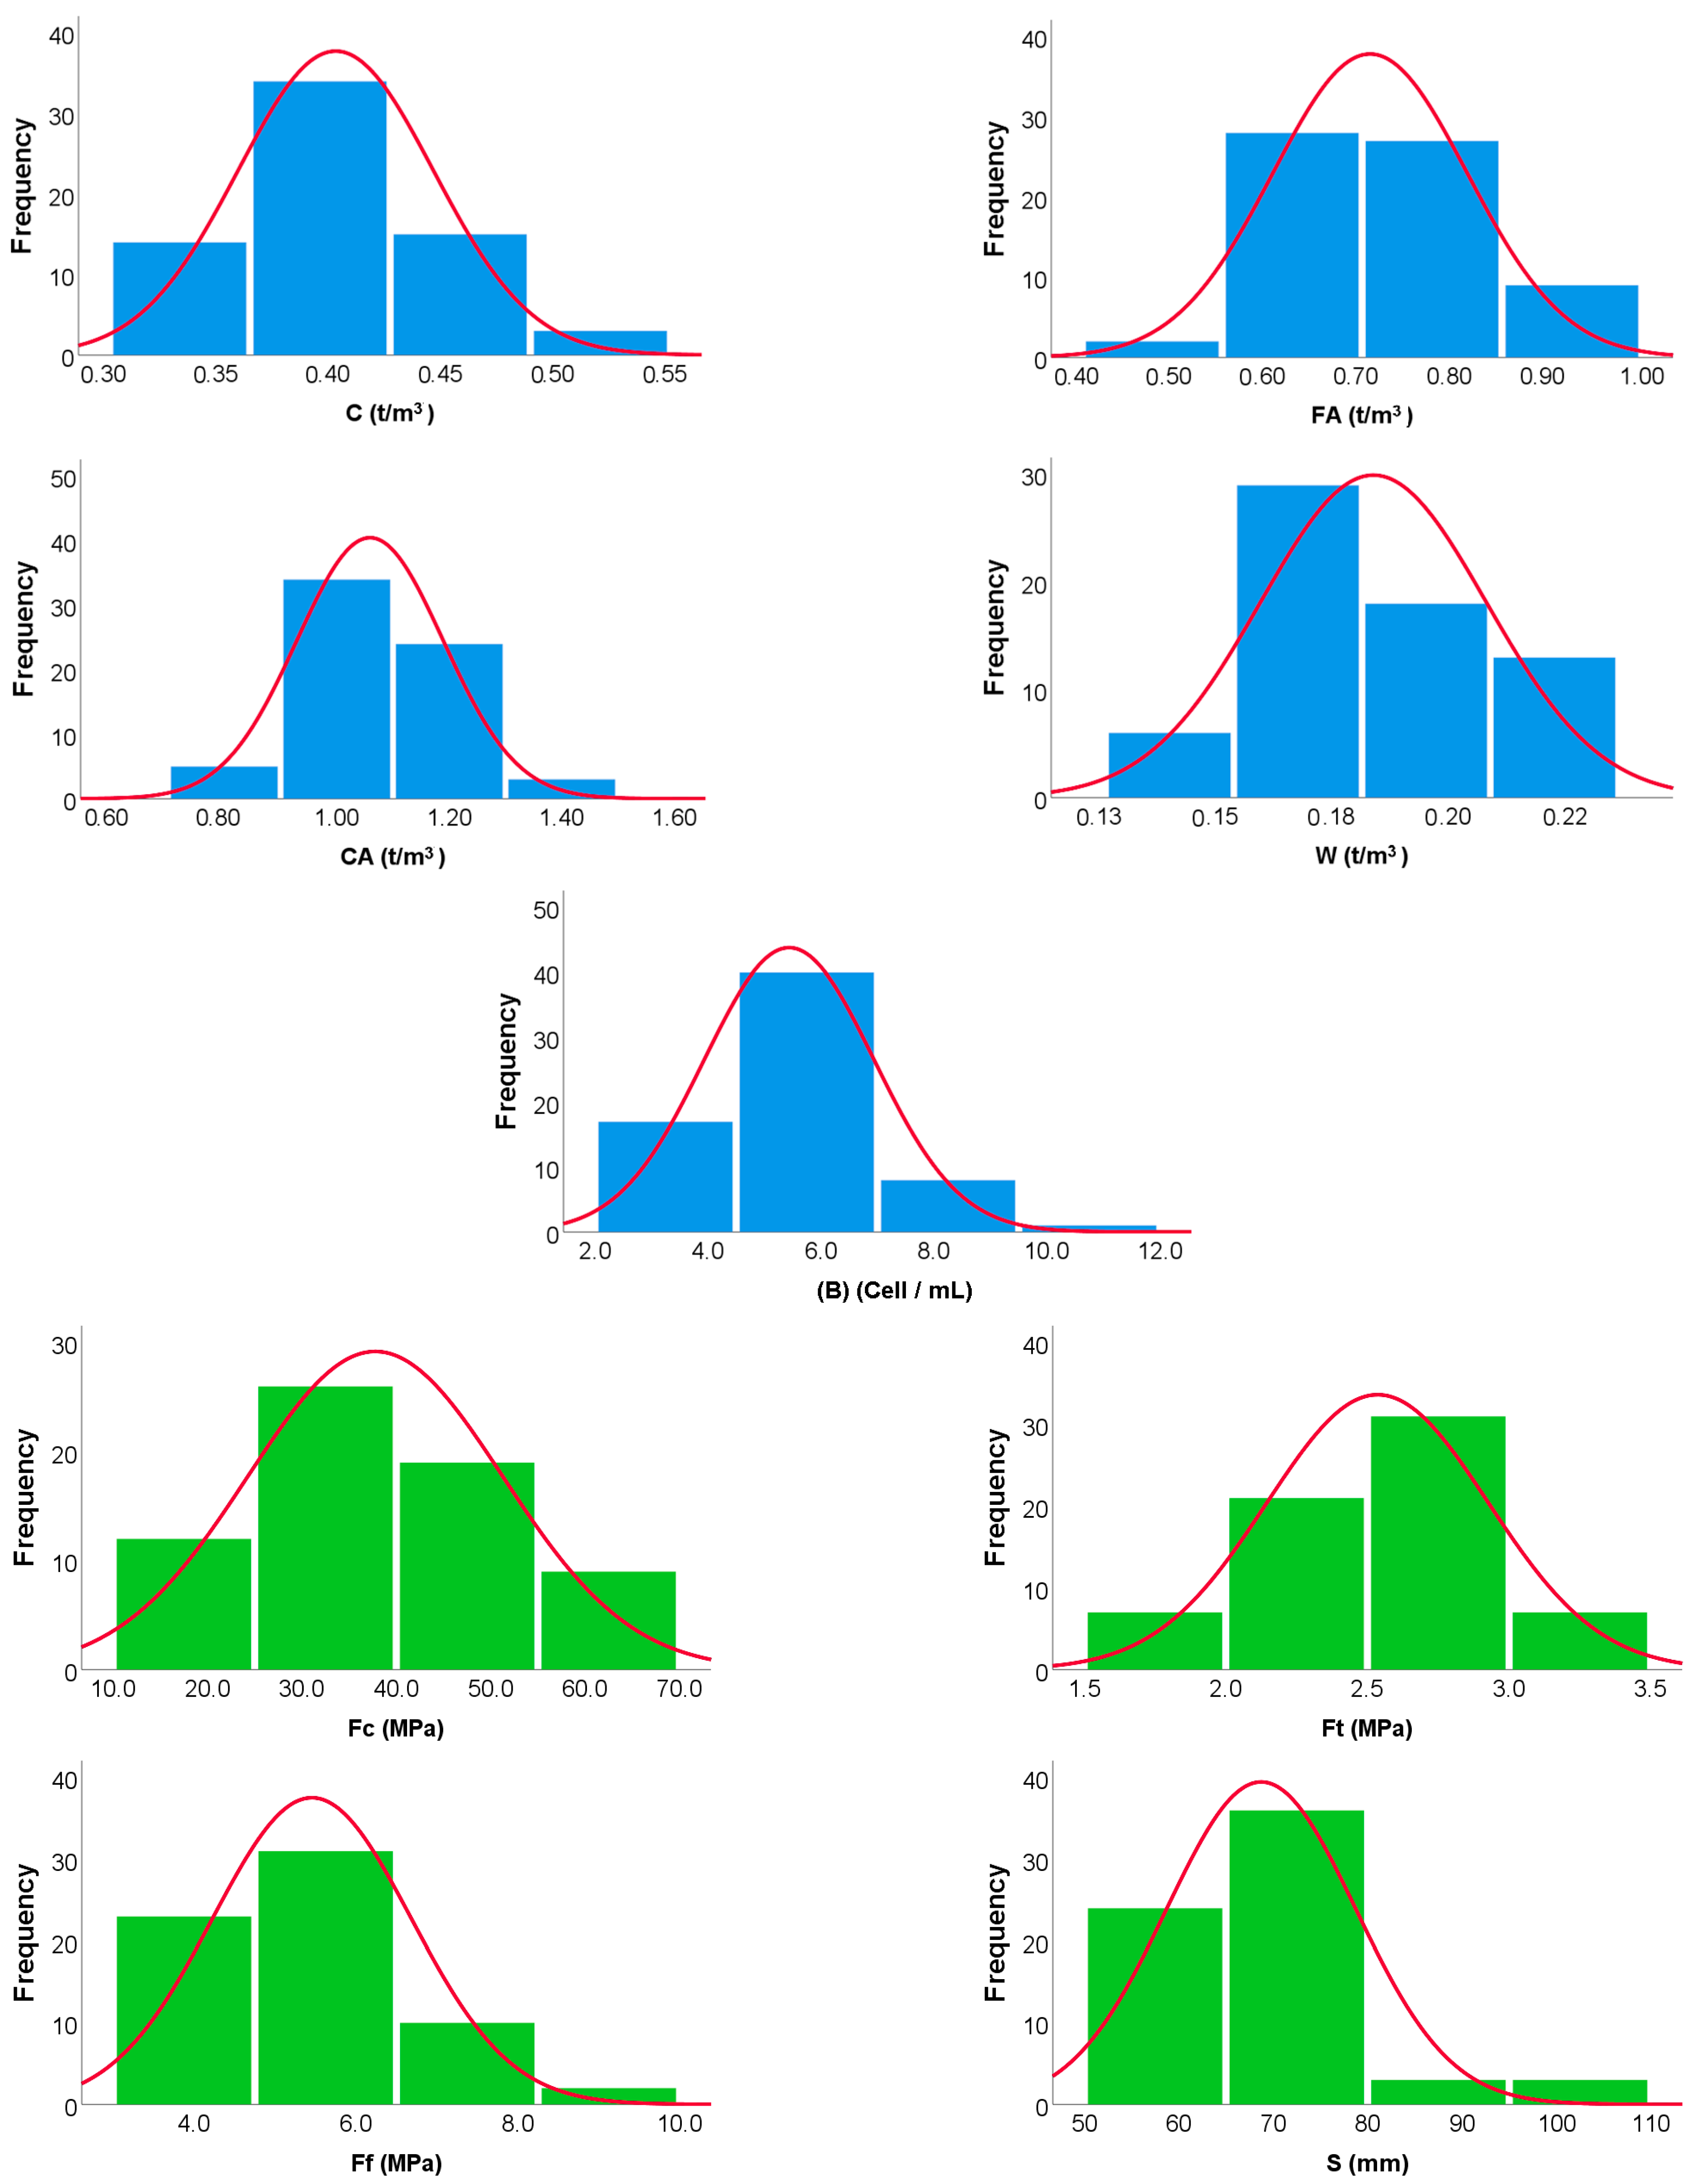
2.2. Statistical Analysis of Collected Database

Multiple records were collected for experimental tested self-healing concrete mixtures with different component ratios, including the bacteria concentration. Each record contains the following data: cement content (C) ton/m3, fine aggregates content (FA) ton/m3, coarse aggregates content (CA) ton/m3, water content (W) ton/m3, the logarithm of bacteria concentration (B) log(cell/mL), 28 days cylinder compressive strength of concrete (Fc) MPa, 28 days splitting tensile strength of concrete (Ft) MPa, 28 days flexural strength of concrete (Ff) MPa, and slump of fresh concrete (S) mm.
The collected records were divided into a training set (80%) and a validation set (20%). Table 1 and Table 2 summarize their statistical characteristics and the Pearson correlation matrix, while the whole database is listed in Table 3. Finally, Figure 4 shows the histograms for both inputs and outputs, which shows the distribution functions of the studied concrete parameters and how the inputs are consistent with the outputs. It can be observed from Figure 4 that the studied parameters and properties have a uni-modal distribution without any outliers except Ff and S, which have skewed distribution to the right.

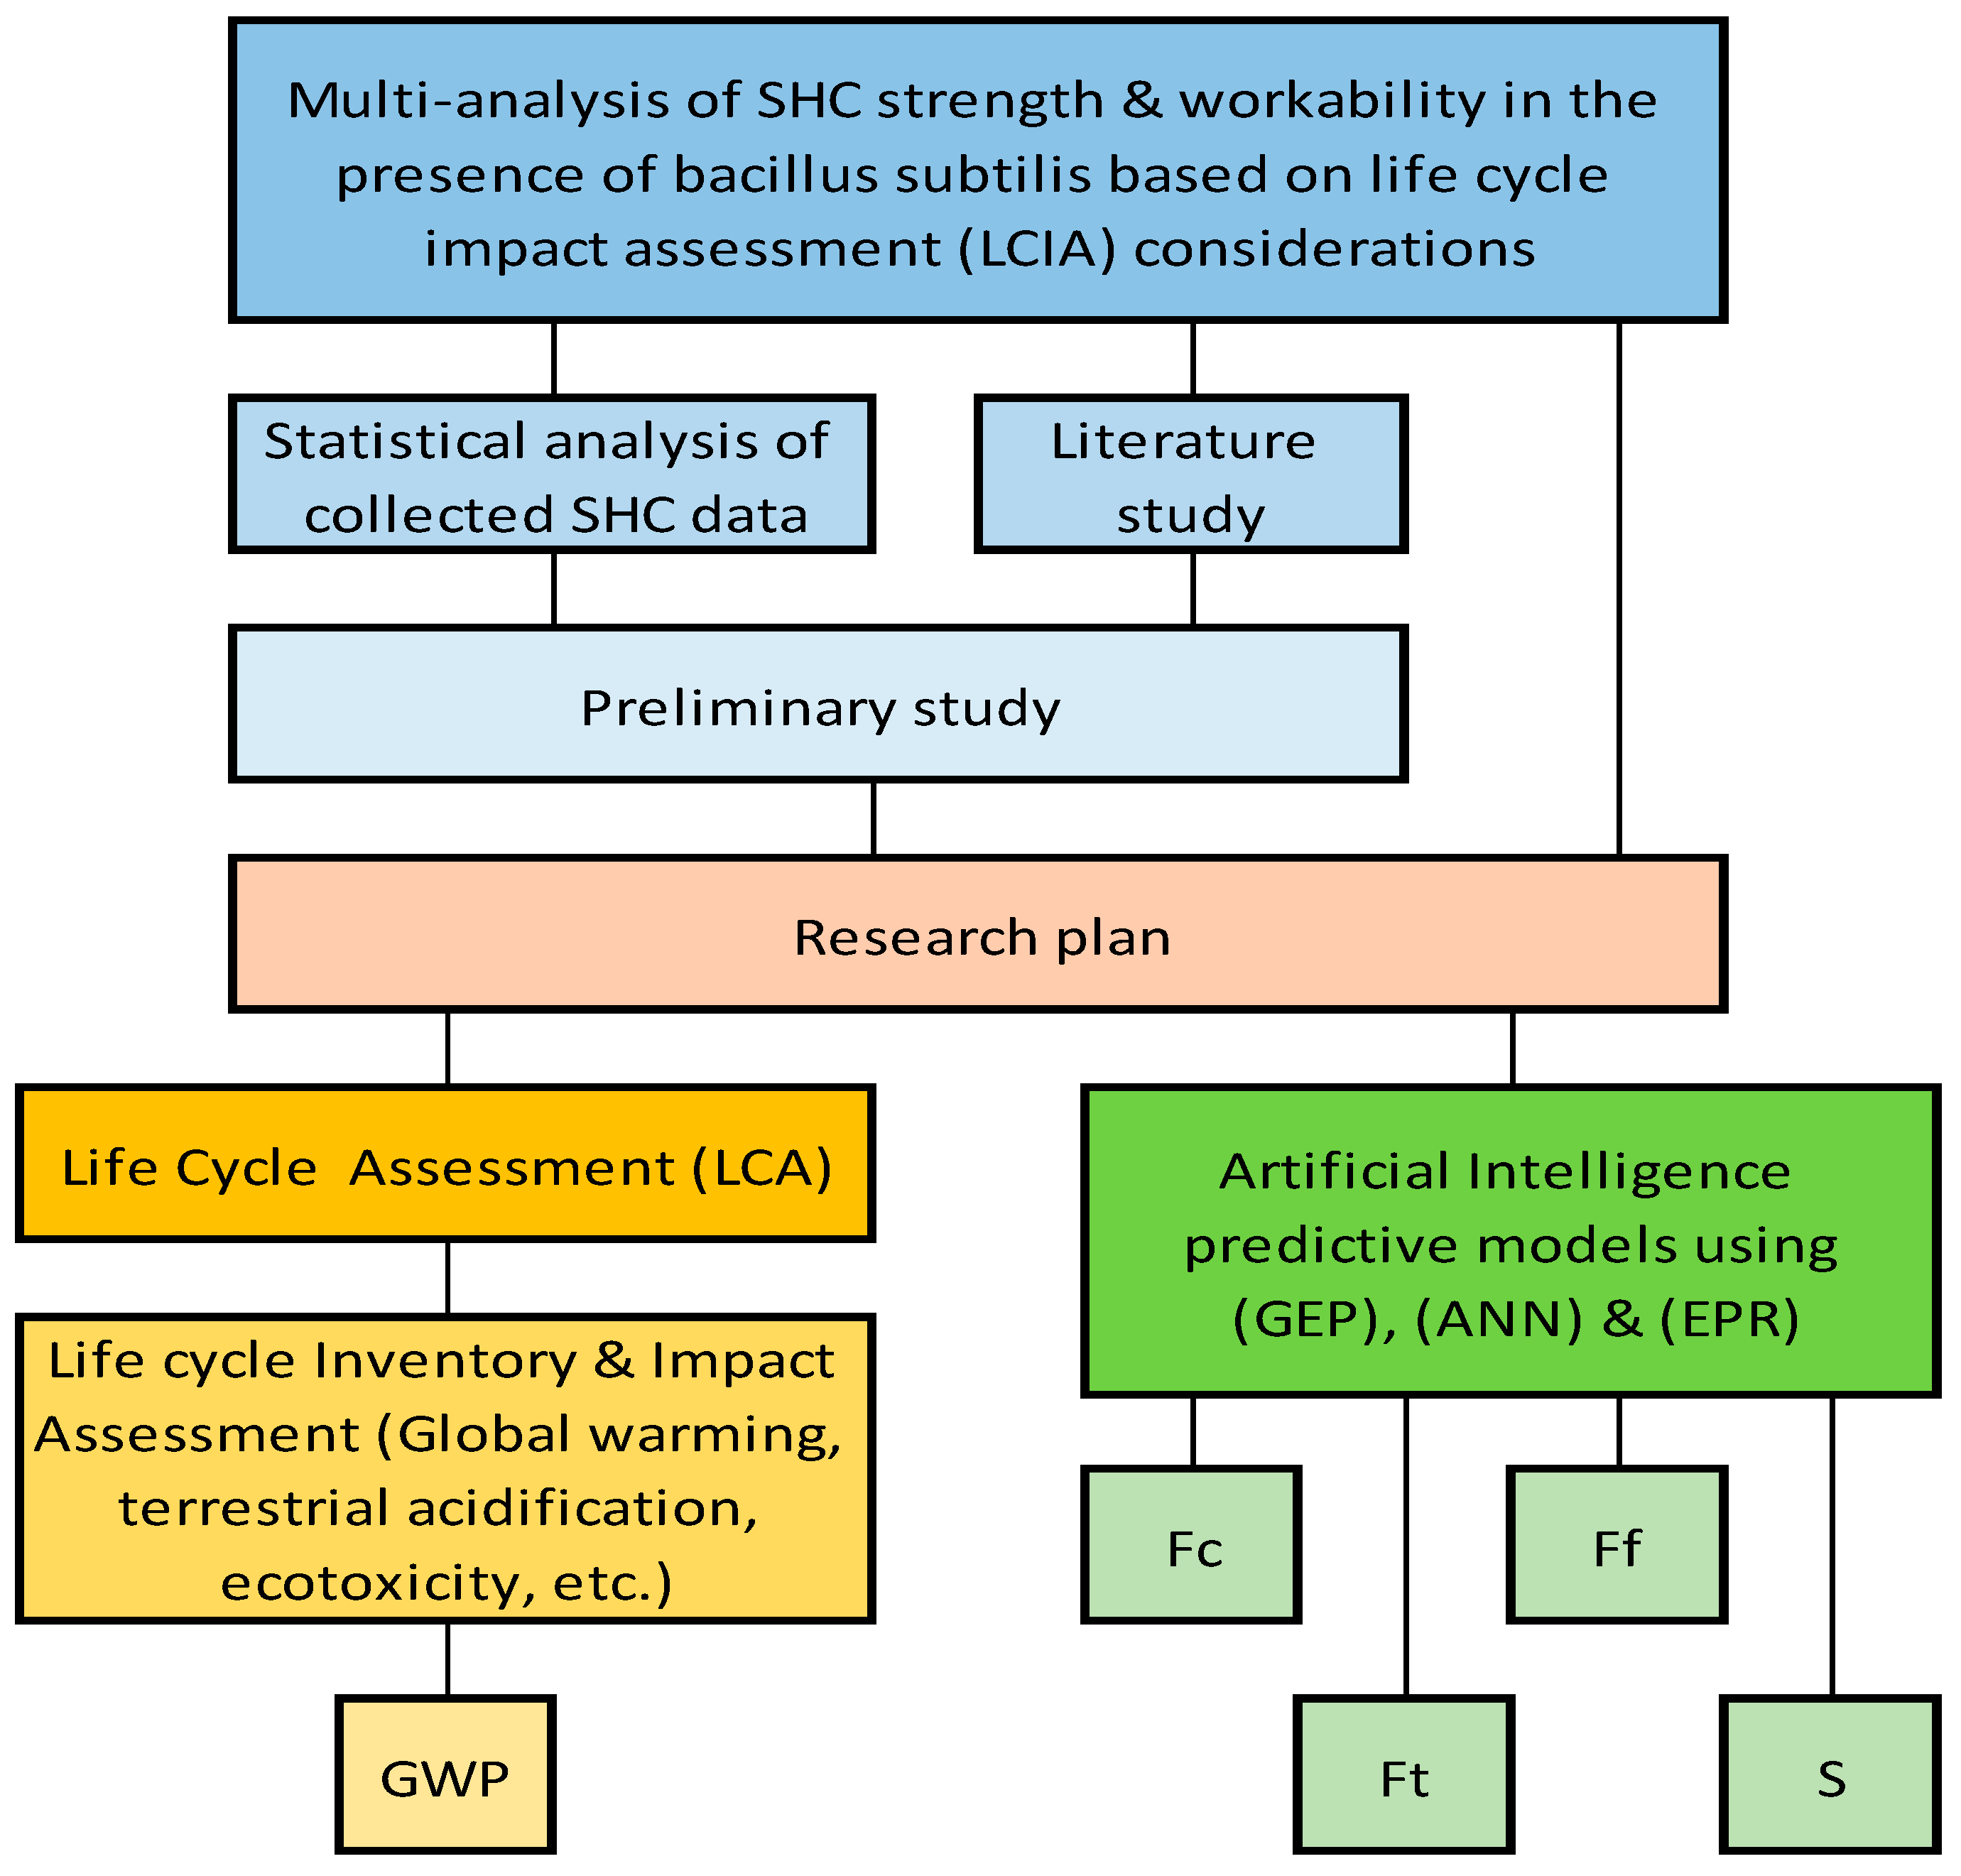
2.3. Research Program

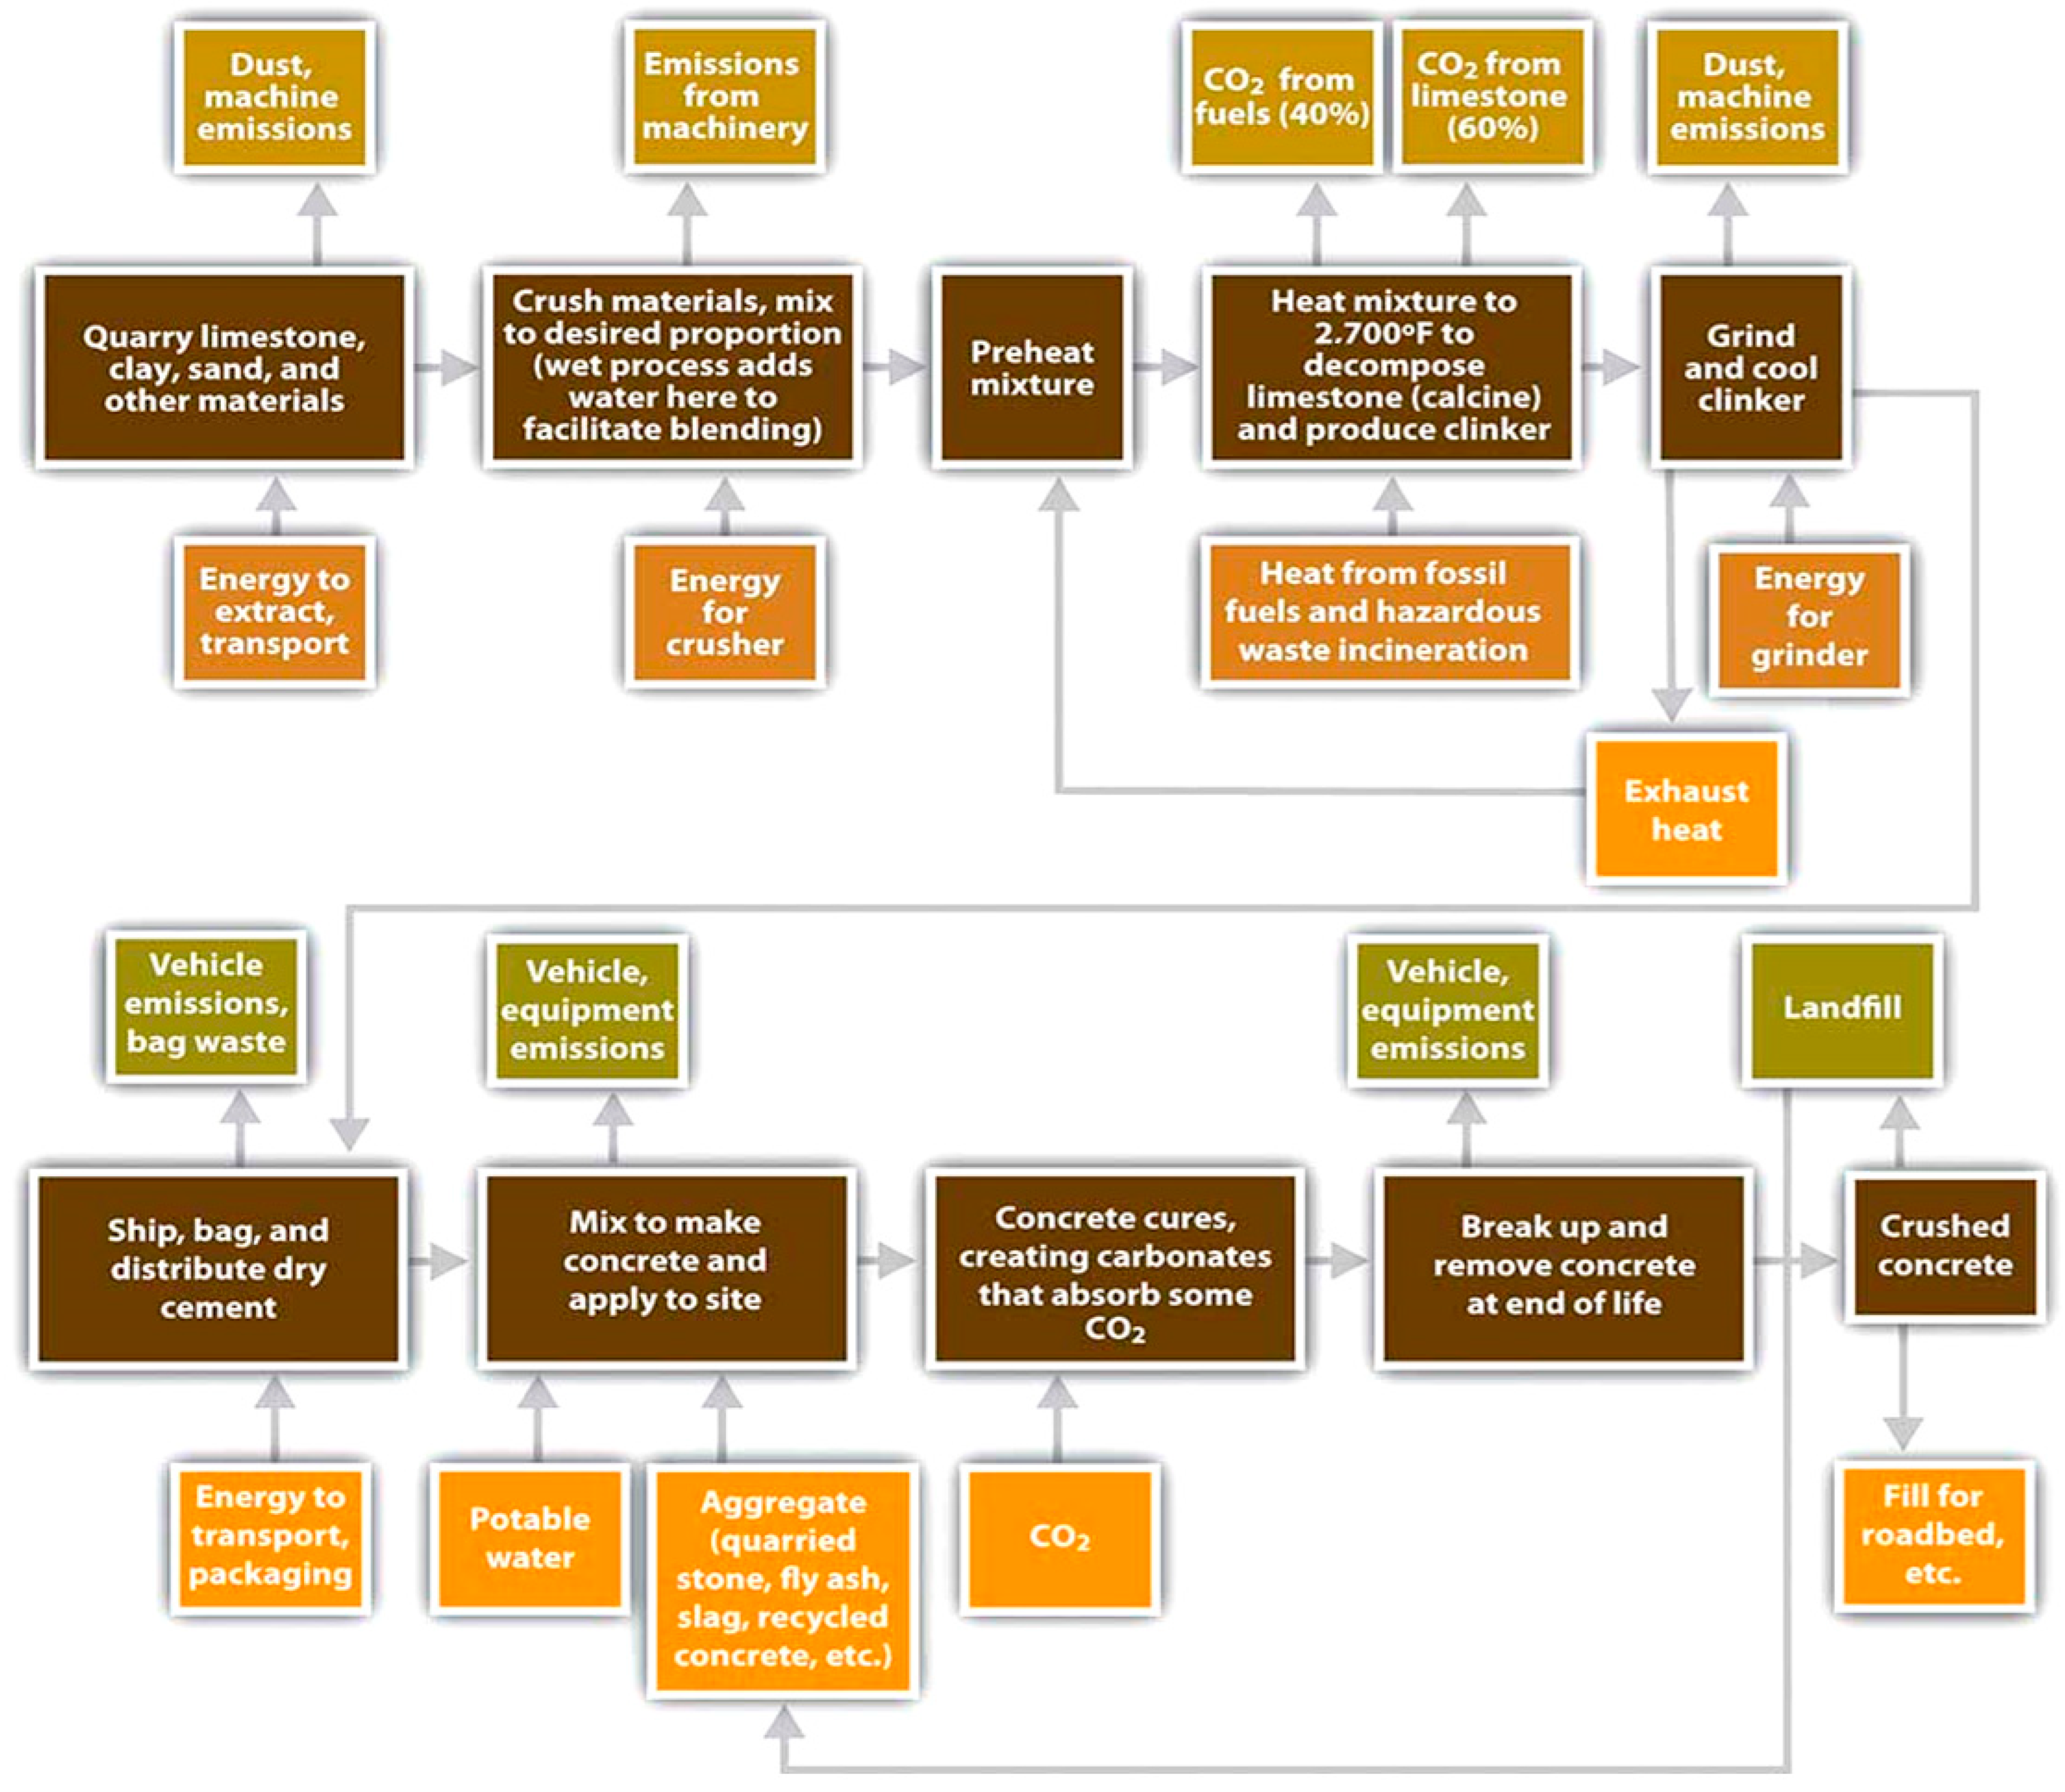
2.3.1. Life Cycle Assessment, Goal and Scope

The main objective of this study is to compare different sustainable concrete mixes and evaluate their impact on the environment. The burdens of different dosages of self-healing concrete were assessed and compared to studies in the literature to predict the best option in terms of environmental impact. Twenty mixes were appraised for their impacts using a cradle-to-gate life cycle assessment (LCA), as seen in Table 3. The functional unit of the system was evaluated as 1 m3 of self-healing concrete, considering the dosages given in Table 3.
The mixes were grouped according to the percentage of cement used because it is the most polluted component in concrete. These results in the seven categories were evaluated with variations in the proportion of bacteria included in the self-healing concrete. The mixes for the self-healing concrete have the following codes based on the concrete: SHC-456 (456 kg cement), SHC-383 (383 kg cement), SHC-403 (403 kg cement), SHC-394A (394 kg cement), SHC-350 (350 kg cement), SHC-394B (394 kg cement, more aggregates), and SHC-450 (450 kg cement).
The concrete mixes considered all emissions and energy consumption from the reagents utilized and the nutrient broth for the bacteria (Bacillus subtilis). In addition, the impact of calcium lactate or urea is compared as the feed chemical for bacteria to produce calcium carbonate. Afterward, the concrete mix with less environmental impact is analyzed to assess the individual contribution from each process considered. The analysis is performed using SimaPro Ver.9.2.0 software by PRé Sustainability, LE Amersfoort, The Netherlands [45] under ISO norms [46]. The system boundary for the dosages assessed in the LCA can be seen in Figure 5.

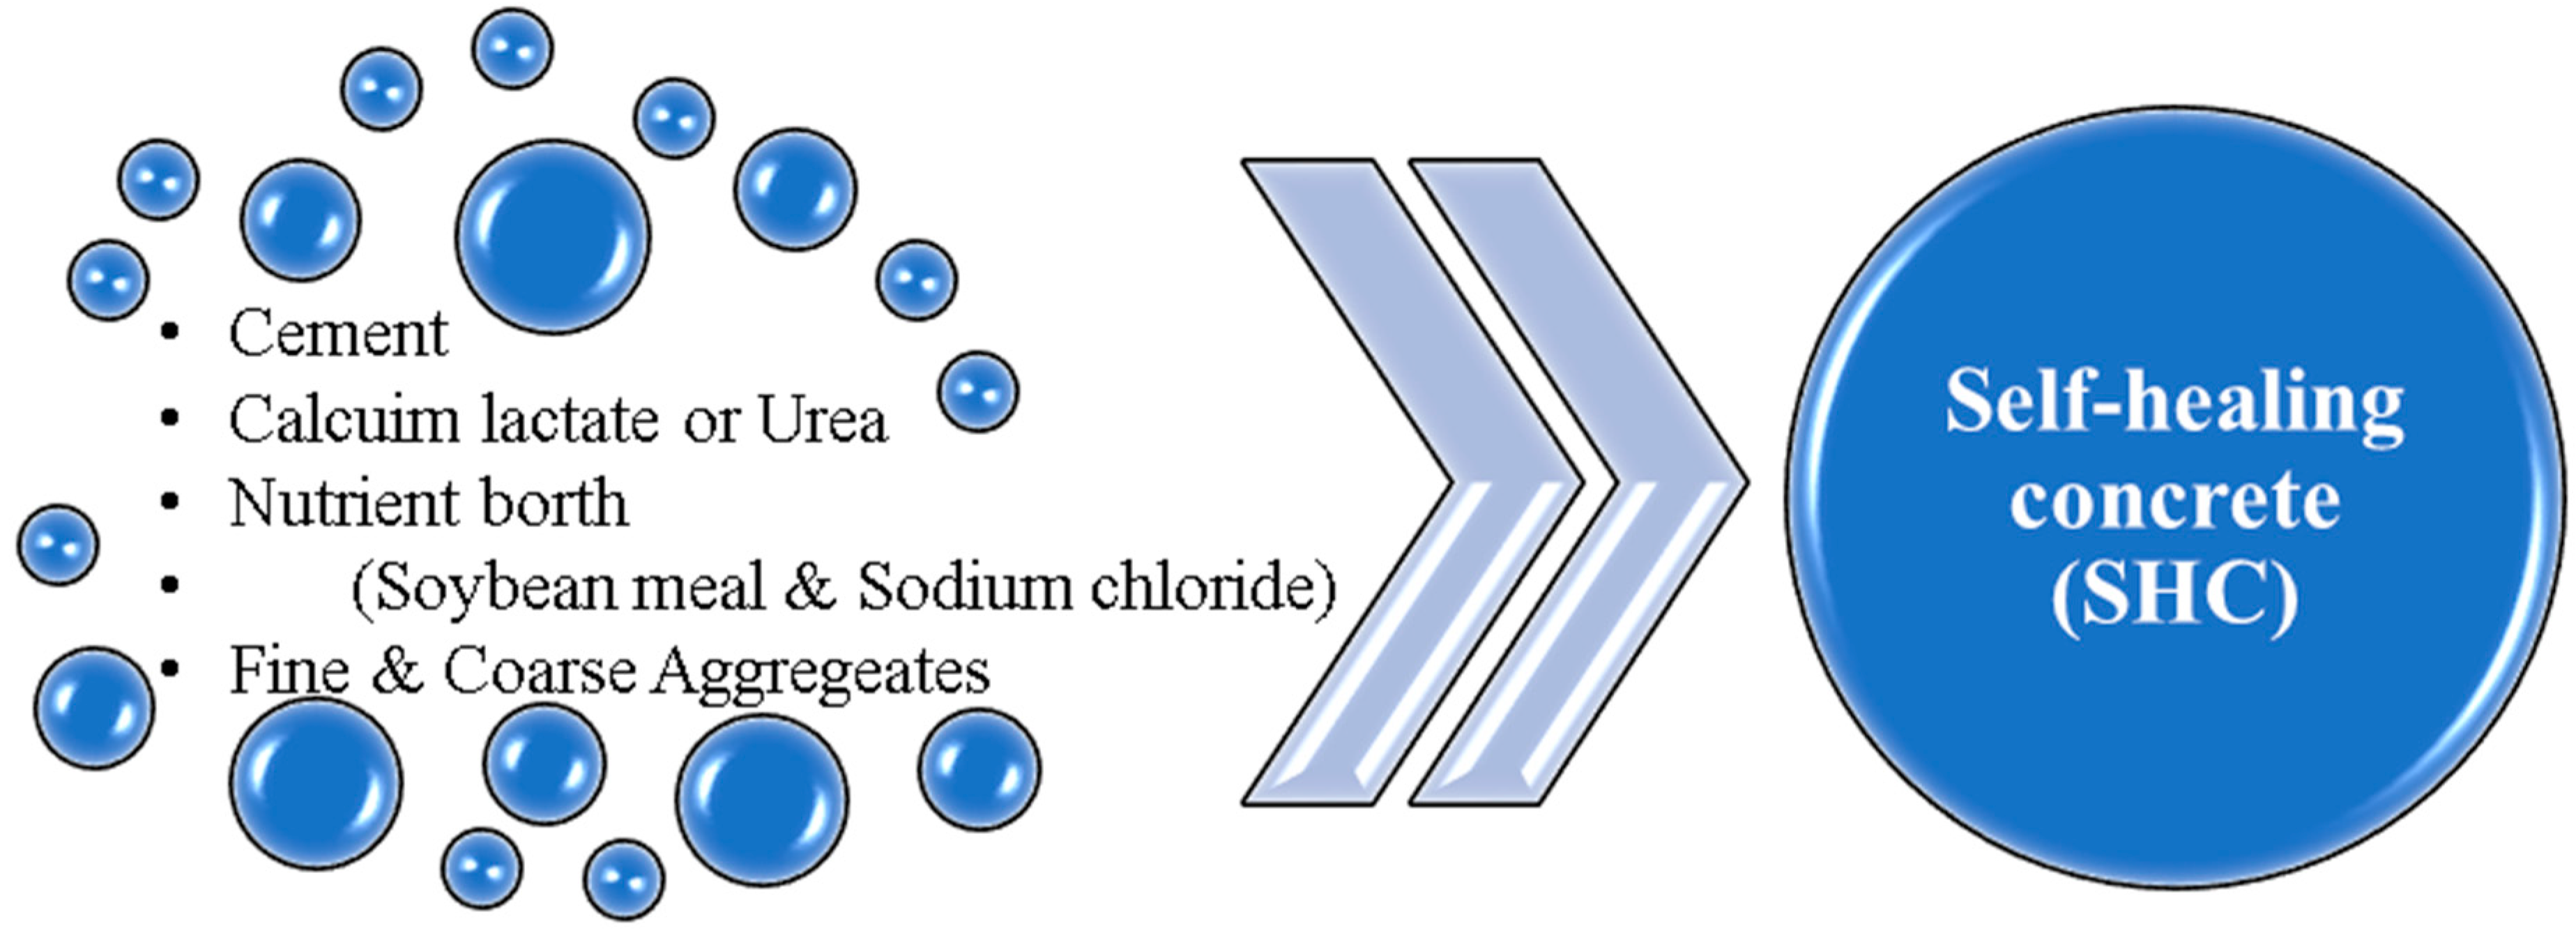
2.3.2. Life Cycle Inventory

The data were modeled based on the dosages and materials presented in Table 1. The Ecoinvent database (v.3.7.1) was used for materials and energy included in the inventory [47]. The energy requirement for the autoclave and incubator processes related to the bacteria has been included in the inventory considering the information from the literature [48].
In the nutrient broth, the yeast extract and peptone are not included in the Ecoinvent database; thus, the inventory was modeled using soybean meal. The literature shows that using soybean meal can be the alternative with more similarities to the extract [49]. The energy consumption per unit produced and the environmental impact of the soybean meal is better than other alternatives such as fish powder waste, white gluten waste, and wheat bran [50]. For the broth, 10 g of soybean meal and 5 g of sodium chloride were considered per L of water [51,52,53]. Additionally, 5% of calcium lactates or the equivalent of urea was considered to evaluate the added burden to the mixes.

2.3.3. Impact Assessment Method

The environmental impact of the life cycle of the mixes can be obtained from the inventory by utilizing a methodology to transform quantities into environmental impact categories. One of the most complete LCA methods, ReCiPe Midpoint H [54], was used to estimate the environmental impacts of 1 m3 of self-healing concrete production. This method shows the simulation of 18 different impact indicators. This study mainly focuses on the most impacting categories such as climate change, terrestrial eco-toxicity, freshwater eco-toxicity, marine eco-toxicity, human carcinogenic toxicity, and human non-carcinogenic toxicity.

2.3.4. Soft Computing Plan

Three different artificial intelligence (AI) techniques were used to predict the characteristic strengths and the slump of concrete using the collected database. These techniques are gene expression programming (GEP), artificial neural network (ANN), and polynomial regression optimized using genetic algorithm which is known as evolutionary polynomial regression (EPR). All the three developed models were used to predict the characteristic compressive, splitting, and flexural strengths (Fc, Ft, and Ff in MPa) and slump using cement content (C, t/m3), fine aggregate content (FA, t/m3), coarse aggregate content (CA, t/m3), water content (W, t/m3), and the logarithm of bacteria concentration (B) log (cell/mL).
Each model on the three developed models was based on a different approach (evolutionary approach for GP, mimicking biological neurons for ANN and optimized mathematical regression technique for EPR). However, for all the developed models, prediction accuracy was evaluated in terms of sum of squared errors (SSE).
The following section discusses the results of each model. The accuracies of developed models were evaluated by comparing the SSE between predicted and calculated shear strength parameters values. The results of all developed models are summarized in Table 4.

3. Results and Discussion

3.1. General Behavior of the Self-Healing Concrete

Figure 6 presents the behavior of the mechanical properties of the studied database containing the mixes of self-healing concrete under the influence of different concentrations in log (cell/mL) of Bacillus subtilis. In Figure 6a–d corresponding to behavioral responses on 28 days compressive, splitting tensile, and flexural strengths and slump, which is the measure of the concrete workability at its rheology phase, respectively, it can be observed that the mixes are more localized within the 105–109 (cell/mL) bin with a widely spread few as outliers from the 105–109 (cell/mL). This localized behavior agrees with the suggestions of Pei et al., Mondal et al., and Schreiberova et al. [34,35,36], which have recommended 105–107 cells/mL for improved strength, durability (reduced water absorption and penetration depth), and improved fluidity and workability [55]. It can further be observed that between 30–70 MPa for Fc, the SHC strength has a more distributed arrangement and more within the 5–9 bin; between 2–3 MPa for the Ft, the SHC strength has more distribution and yet more within the 5–9 log(cells/mL) bin; between 4–8 MPa for the Ff, the SHC strength has more distribution yet within the same studied bin; and finally between 50–90 mm for the S, the workability behavior has more distribution and within the 5–9 log(cells/mL) bin. However, the proposed intelligent proposed models and closed-form equations will be applied in consonance with the recommendations of these observations to achieve the desire strength and workability and of course the cement use with the reduced environmental impact while introducing favorable levels of Bacillus subtilis.

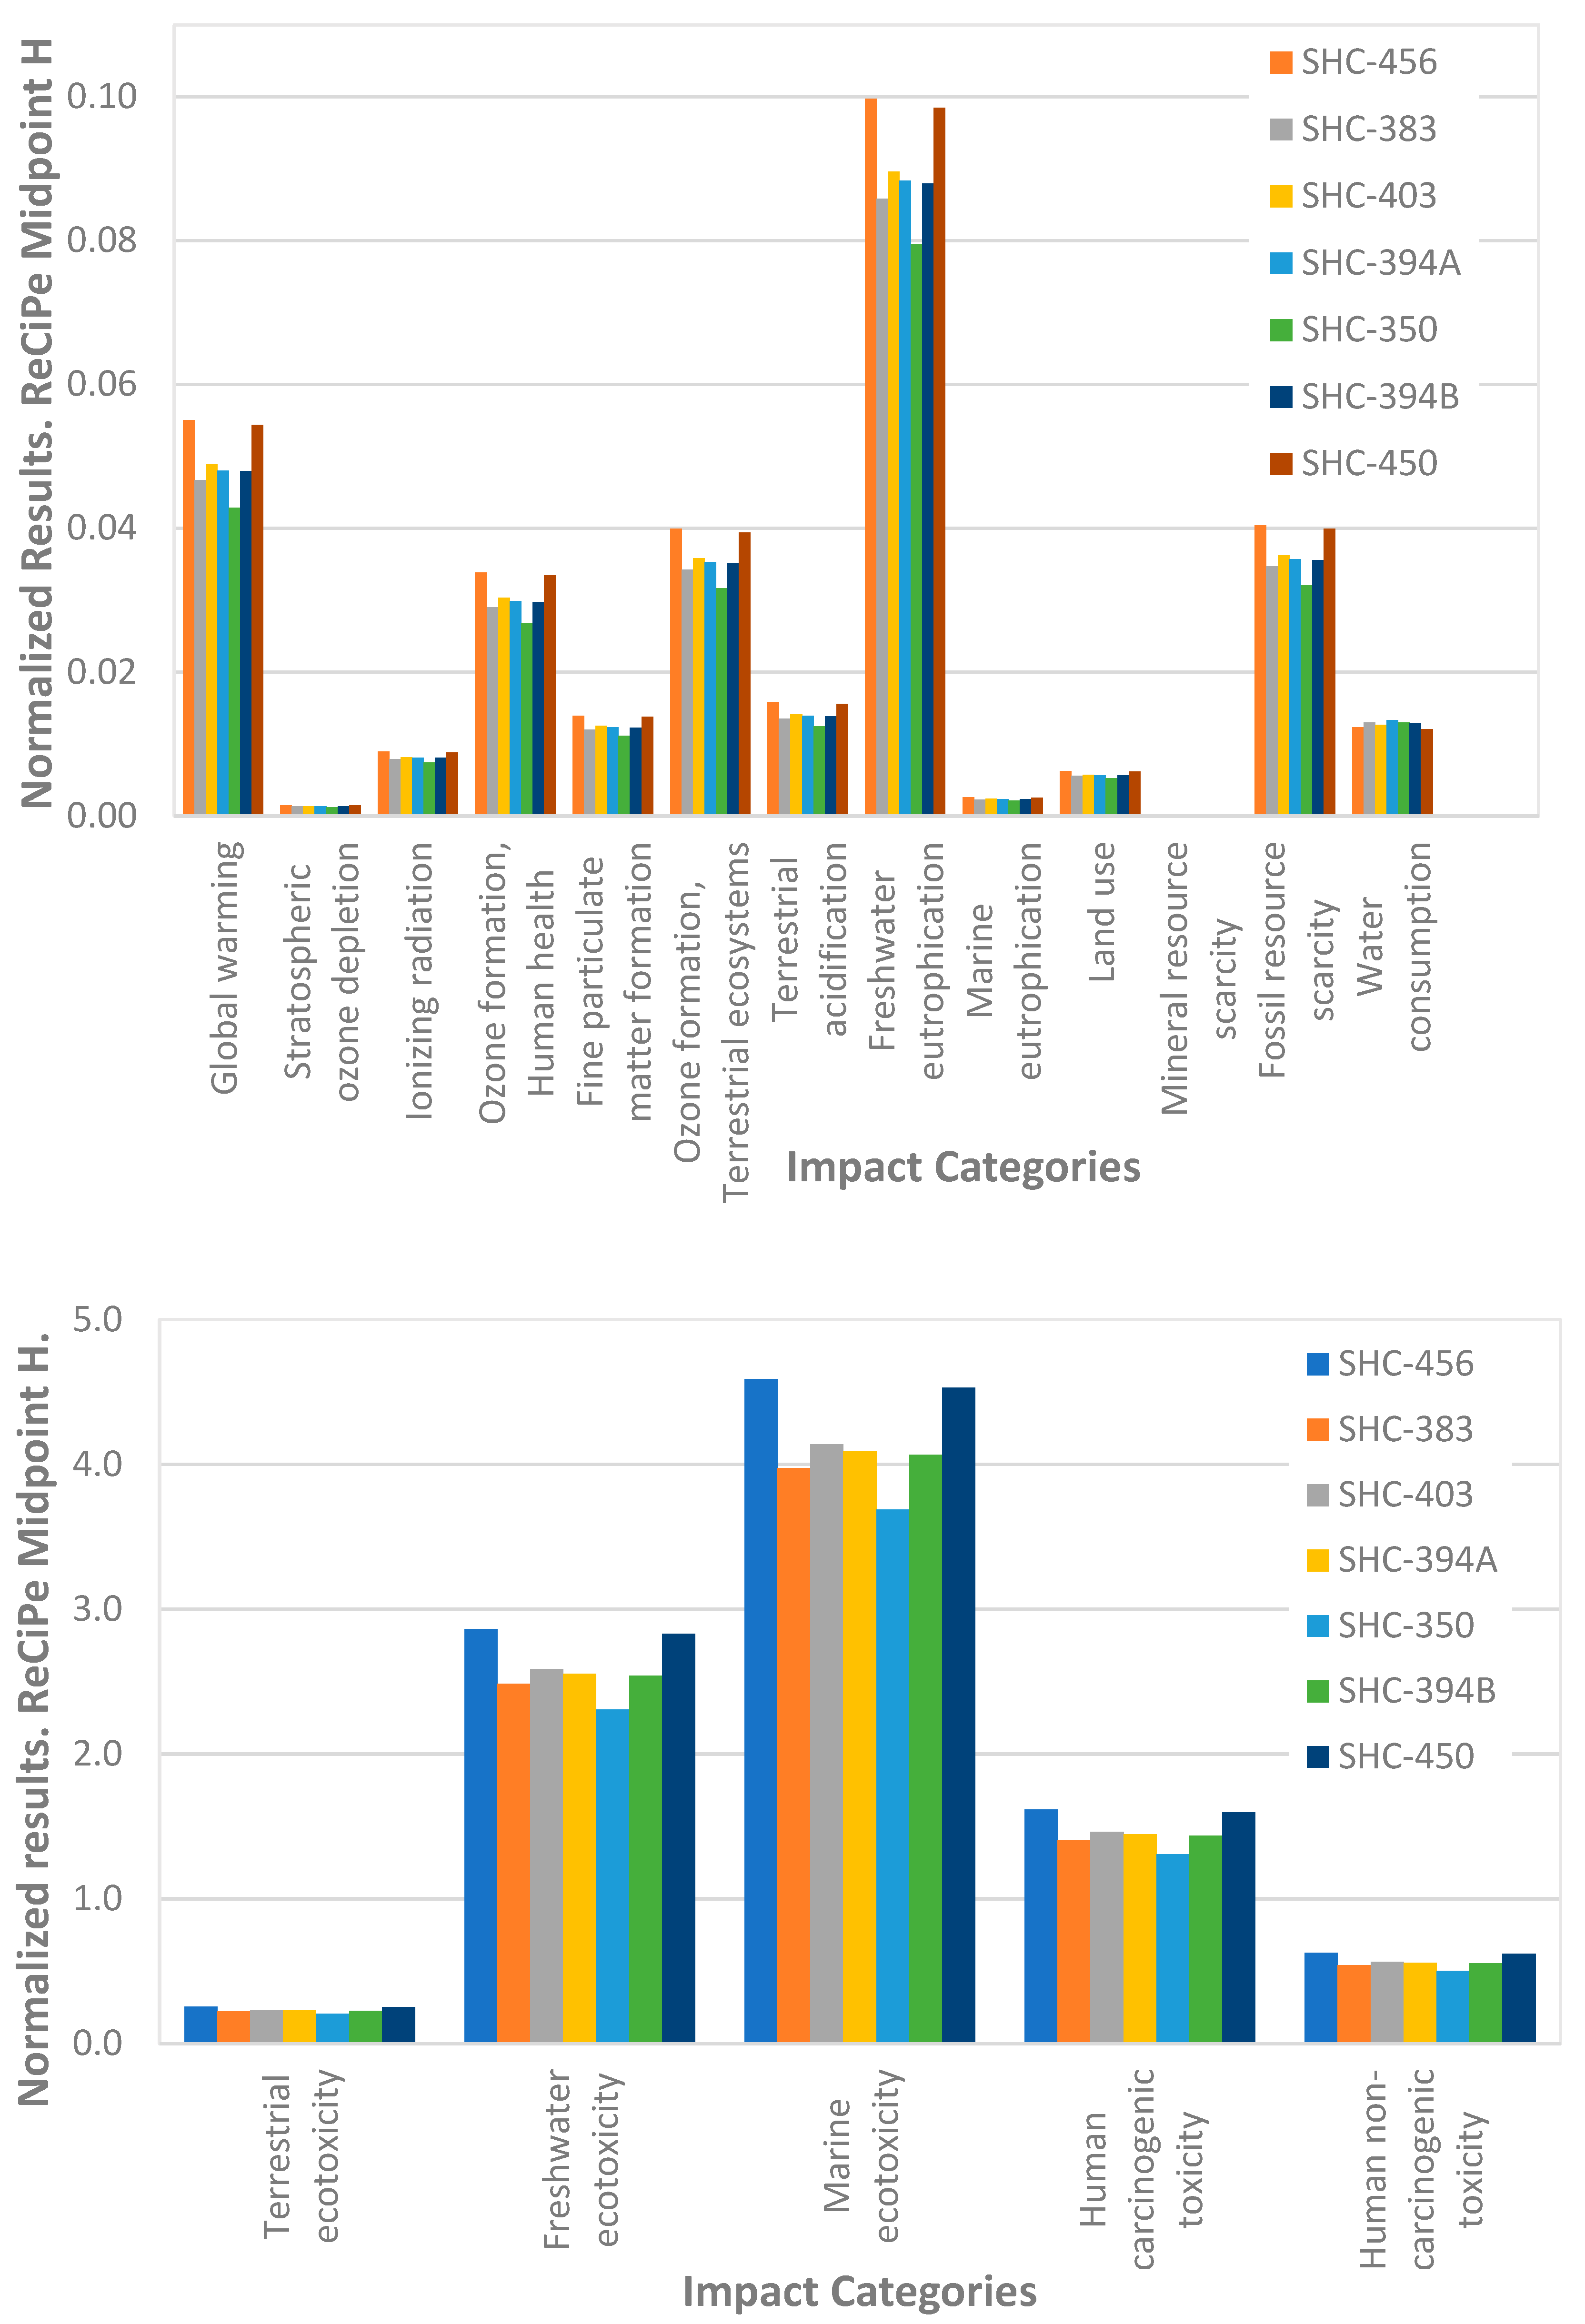
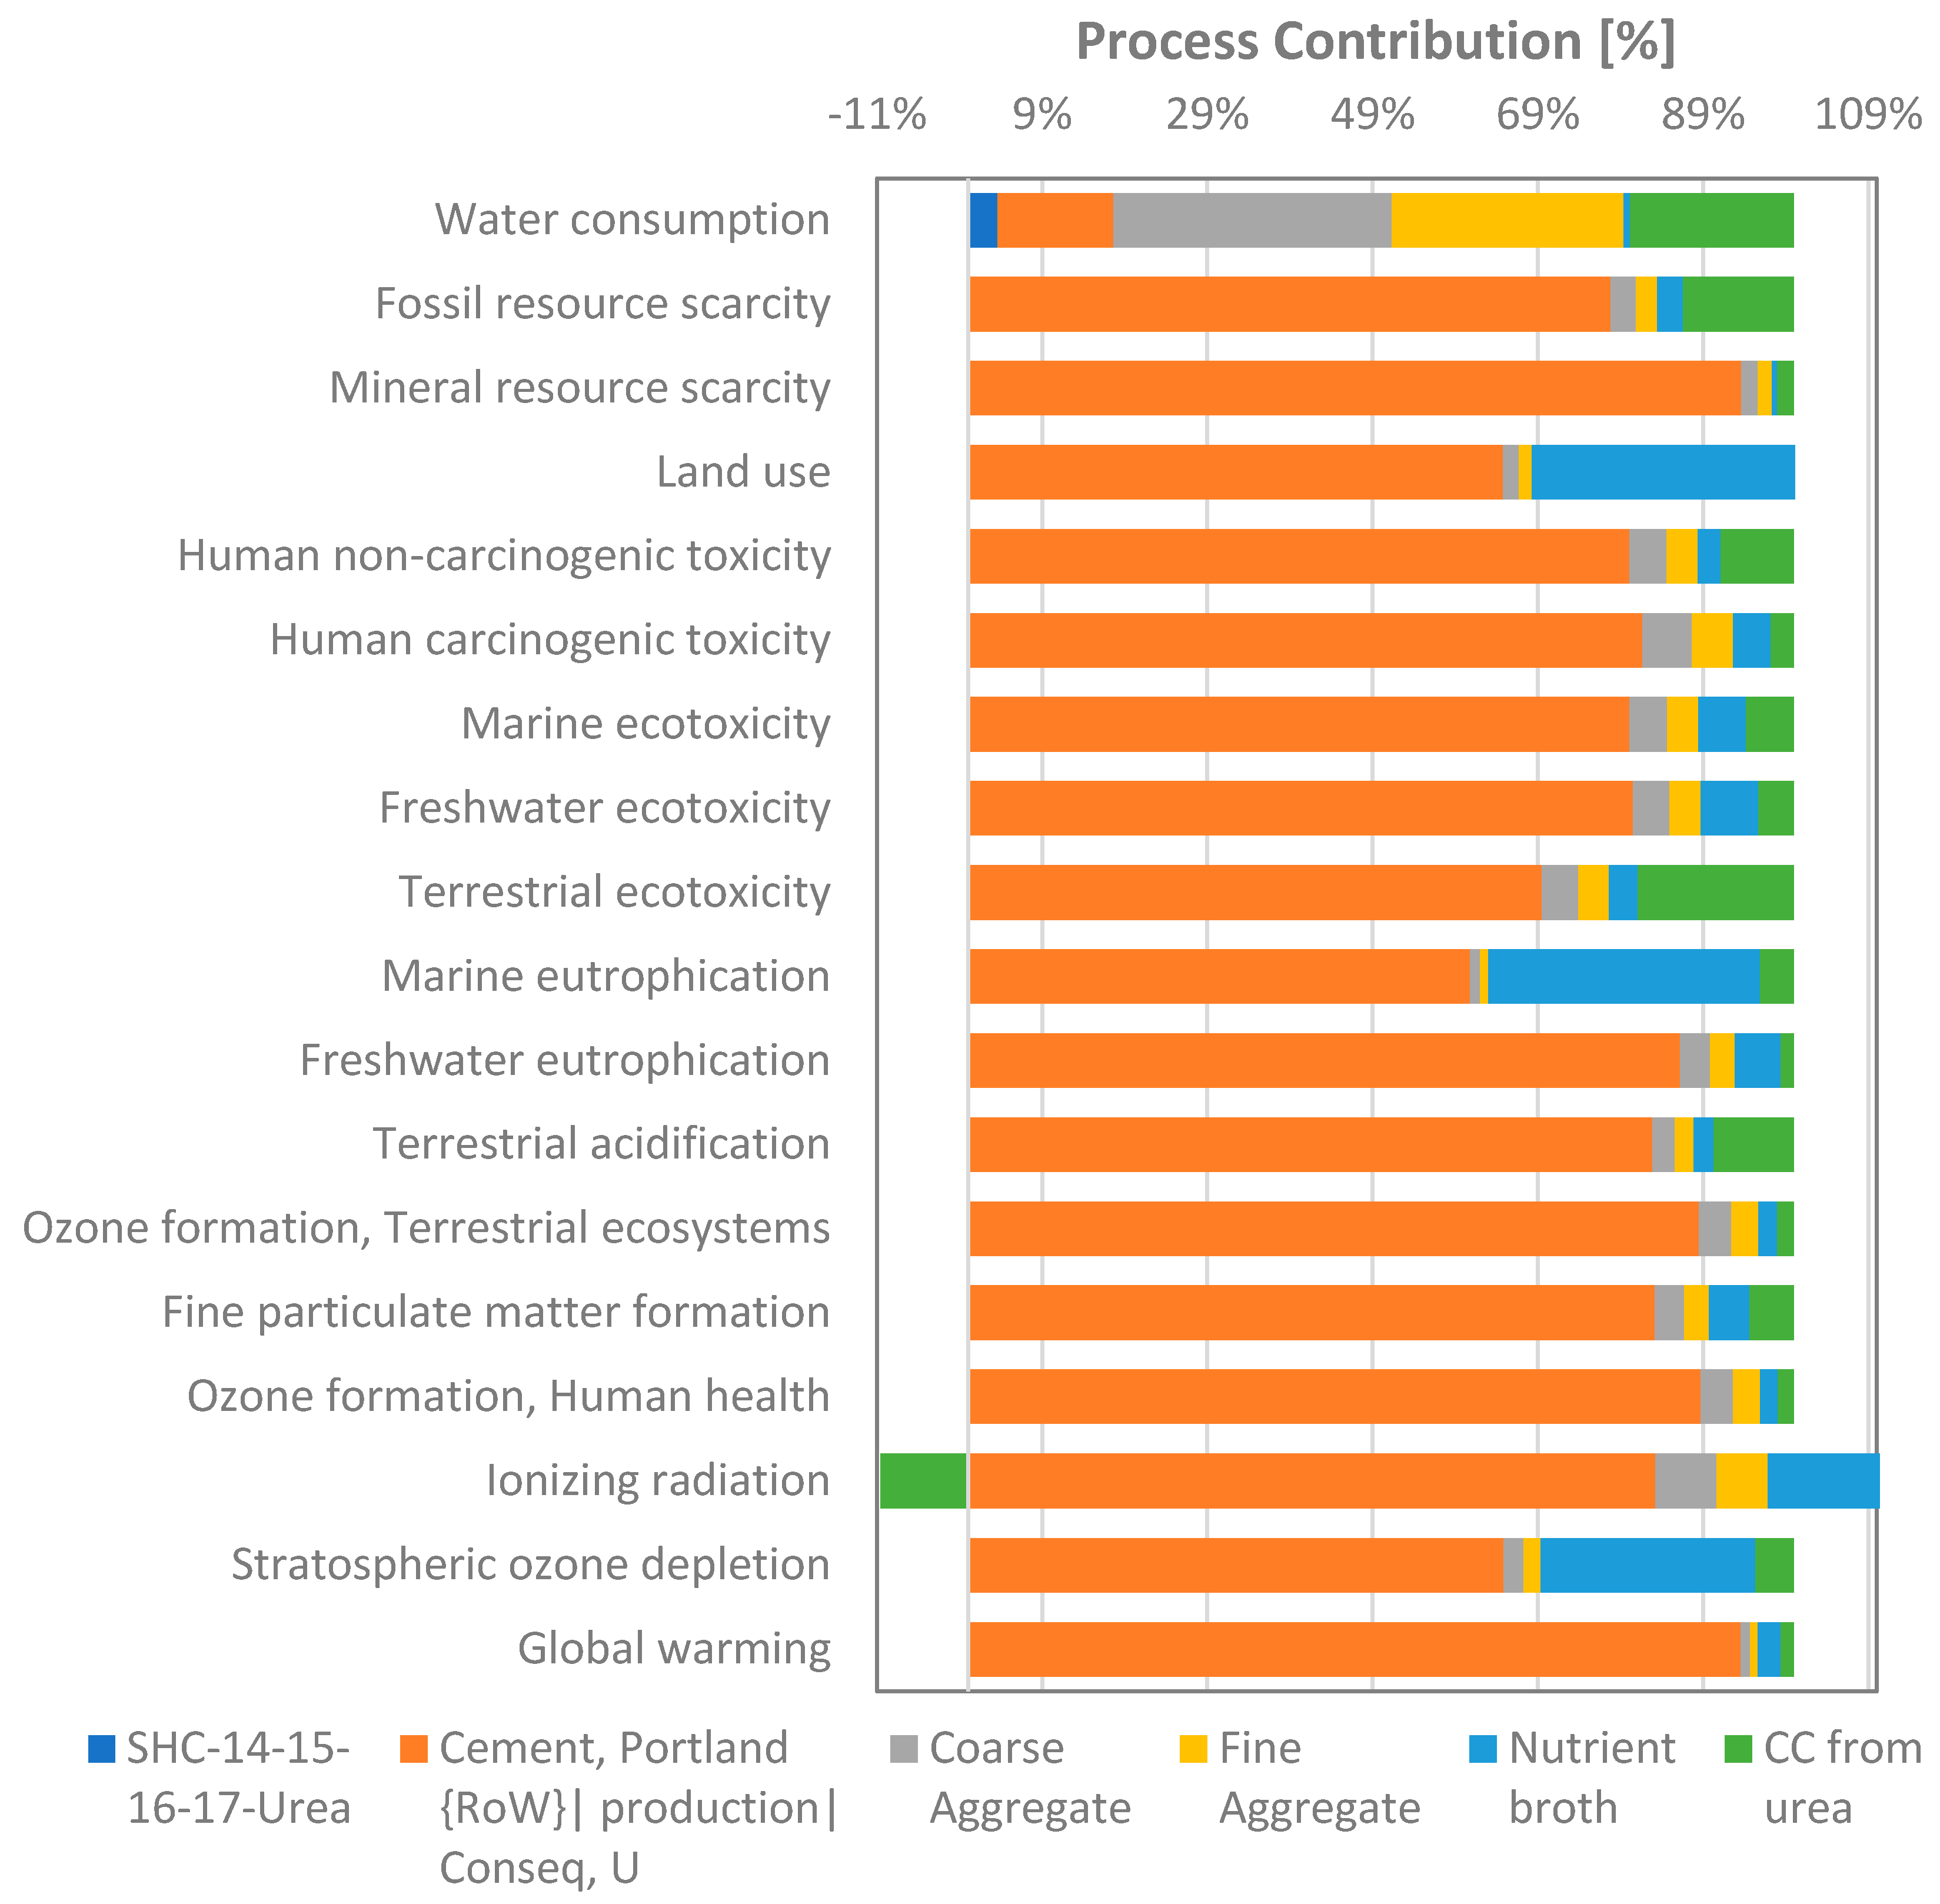
3.2. Life Cycle Assessment and Analysis

The midpoint LCA results are presented in Table 4. As mentioned before, six impact categories are evaluated in the assessment. As seen in the table, the amount of cement used in concrete production directly influences the impact on each category. For instance, the self-healing concrete (SHC) with 456 kg of cement per m3 of concrete incurs 28.5% more global warming than the SHC with 350 kg of cement per m3. The mixes evaluated in the current study have 3–25% less environmental impact on climate change than regular ordinary Portland cement (OPC) concrete [56].
Ramagiri et al. [48] reported the LCA of different geopolymer mixes and self-healing concrete. They found that SHC performed better in every category except for the Global Warming Potential (GWP) because of the use of OPC. OPC production is one of the main contributors to carbon dioxide in any concrete matrix [57]. Similarly, in the current study, the SHC (350 kg/m3) mix has the lowest environmental burden because it has the lowest proportion of cement in the dosage. Figure 7 shows the tendency to lower impacts depending on the amount of OPC used in the mixes. Global warming potential was found to be among the categories with lower impacts. On the other hand, the eco-toxicity and human toxicity categories have higher normalized results.
The principal contributor to the impacts on the different mixes is OPC. In Figure 8, the SHC mix with the lowest environmental impact was analyzed. The contribution from OPC varies from 14% in the water consumption category to 94% in the global warming potential. The second contributor is the coarse aggregate, as seen in the graph. As stated earlier, there is a direct proportion between cement usages in the mix with the scores of each environmental impact category.
Self-healing concrete may result in a better performance in terms of sustainability because of its durability. Garces et al. [56] analyzed the environmental impacts under the LCA methodology for Ordinary Portland concrete, geopolymer concrete, and self-healing geopolymer concrete. The global warming potential of the SHC-350 mix is 18% less pollutant than the self-healing geopolymer concrete of referred study. The more impactful mix design of the present study has ~6% more carbon dioxide emissions. In addition, in the terrestrial acidification category, the present study shows a 69–75% reduction compared to the literature [56]. The reduction depends on the mix design considered, as seen in Table 4. Another study [58] reported a 500 kg CO2 emission per m3, which is 50% more than the SHC-350 mix design considered in the current study. Despite the findings discussed earlier, one reference shows that self-healing geopolymer concrete has less impact than the mixes from this study, 298.19 kg of CO2-eq vs. 342 kg of CO2-eq [59].

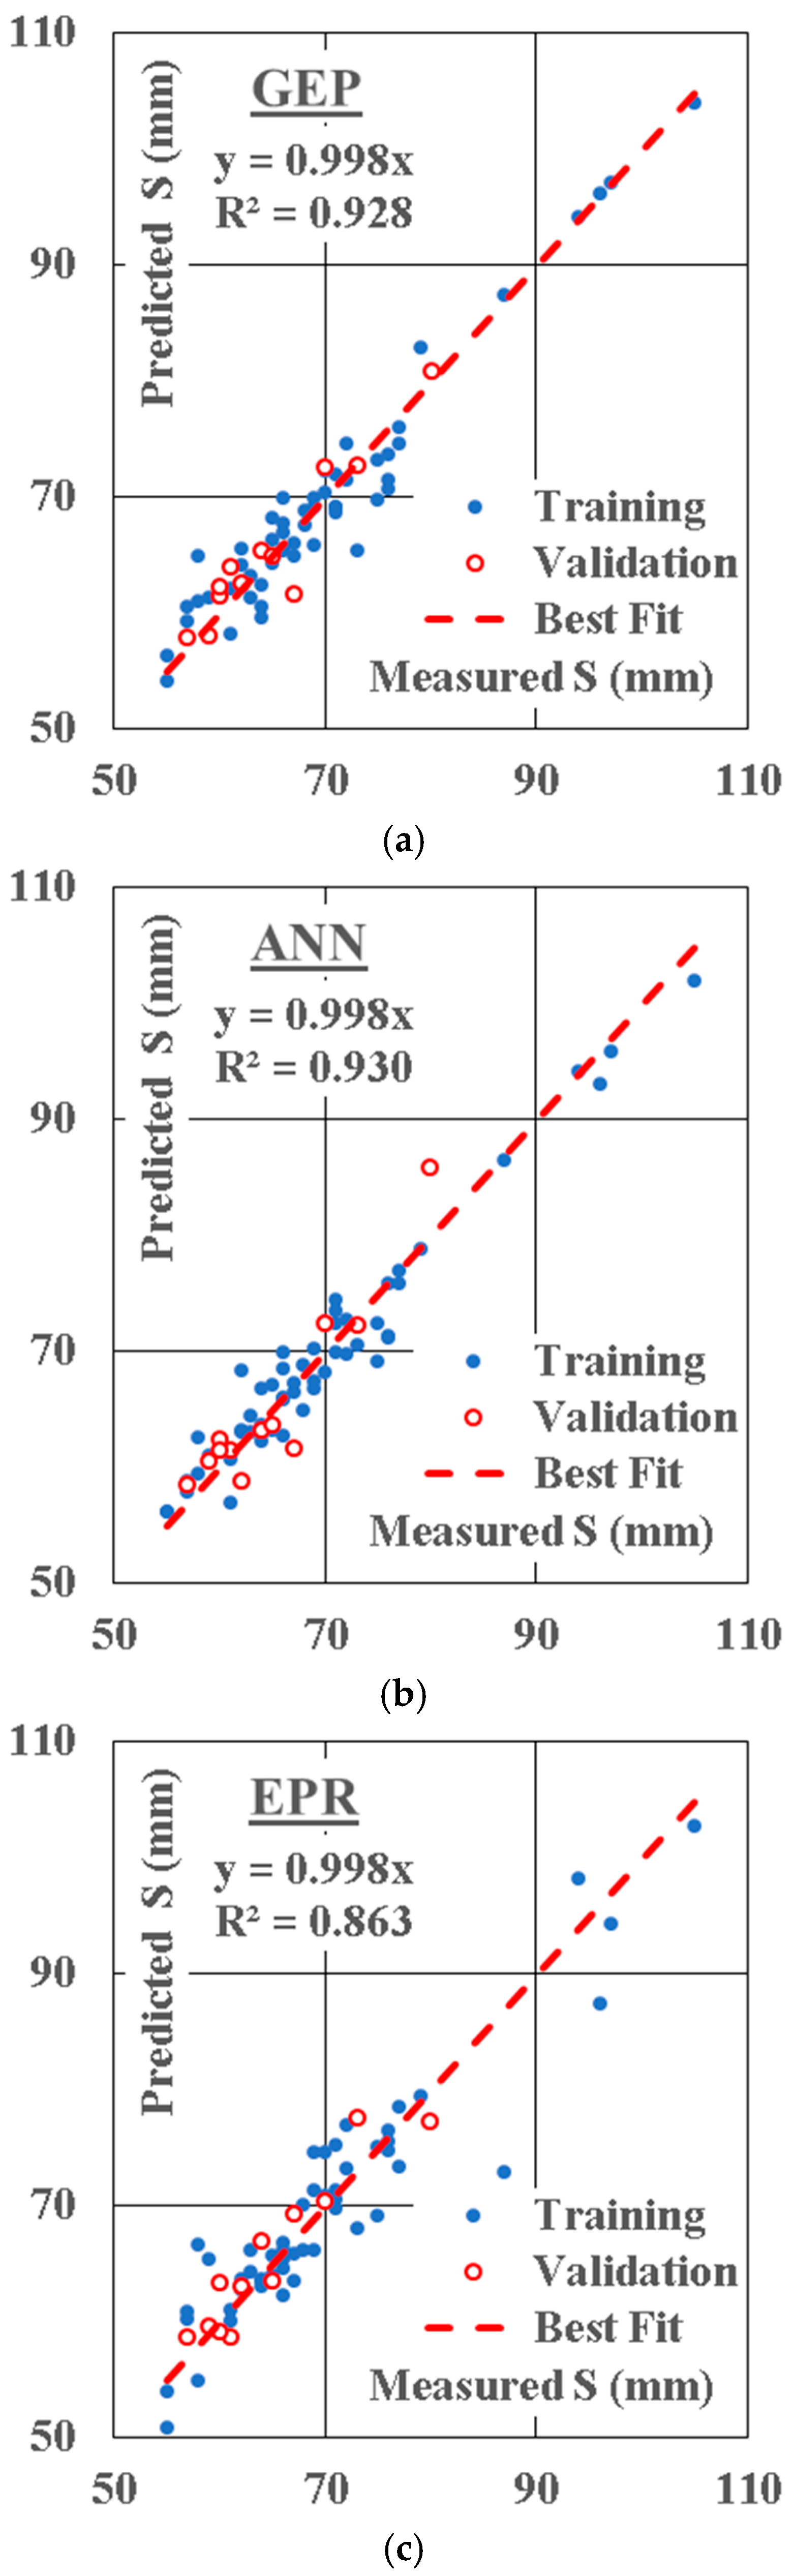
3.3. Models Prediction

3.3.1. Model (1)—Using (GEP) Technique

The developed GEP model has 64 lines of code. The population size, survivor size, and number of generations were 10,000, 3000, and 1000, respectively. Equations (1)–(4) presented the output formulas for Fc, Ft, Ff, and S, respectively. The average errors in % of total dataset are 9.3%, 8.1%, 10.0%, and 3.8%, while the R2 values are 0.927, 0.591, 0.758, and 0.928, respectively. These closed-form Equations (1)–(4) represent a manual technique to determine the mechanical properties (Fc, Ft, Ff, and S) of the Bacillus subtilis-based concrete for the purposes of design, a construction guide, and performance monitoring of the constructed infrastructure. The estimation of Fc and S has performed above 90%, which is a good outcome for sustainable concrete production and application.
Fc   = ( C . ( 2 FA . W + 2 ) W . ( X + 2 C + 2 ) + Y . CA ) ( Z . CA 2 . ( CA 2 + X ) B . Y ) + 50 X 2 CA 2 ( 9 50 CA 31 Y ) + Z . C . ( 3 W + 2 ) W + W ( CA 2 + X + W ) + Y 2 where :   X = ( FA 2 C ) ,   Y = ( X 2 3 C . X 6 C 2 ) ,   Z = ( 2 C . FA + 2 C W + X 2 )
Ft   = Z 2 ( Y 2 + X 2 + C 2 + C W ) 2 + 5 X 4 . FA . ( X 4 + 0.1 ) FA + 5 FA . CA 5 + ( X 4 + 0.1 ) ( α 2 + B ) ( X 4 ( 1 CA . FA ) Y . FA CA . FA + 1 ) + CA + FA where :   X = FA ( C + W 0.1 ) ,   Y = ( 2 W FA + C ) ,   Z = CA 2 10 W . FA 10 W . CA , α = CA . ( 2 Y + 1 FA CA W ) ( X FA 2 + Y )
Ff   = Y + 13.3 C ( Y X 4 ) CA 2 0.7 ( Z X 2 ( X C ) + B . Z + 13.3 C Y α 2 ) + 0.58 CA . W B . ( α 2 12.3 C Y X 3 Y ) W . C . ( α Z X 4 C . X 4 Y ) + C 0.43 where :   X = ( FA C FA ) ,   Y = ( 0.58 CA 4 + C X ) ,   Z = ( X 2 X C ) ,   α = ( 0.58 Y X )
S   = X 2 X CA 3.6 X + Y FA + 0.265 ( X + CA ) ( α Z + Z 0.57 CA FA ( 3.6 X ) ) ( 3.6 X FA + 3.6 X + 0.265 ) + B . CA 2 12.8 W 2 + CA FA 3.6 X α + 66.8 where :   X = ( 1 W B . FA ) ,   Y = ( 0.28 CA ) 2 ,   Z = ( Y 18.6 66.6 FA 1 ) , α = ( W . B . ( W 0.015 ) )

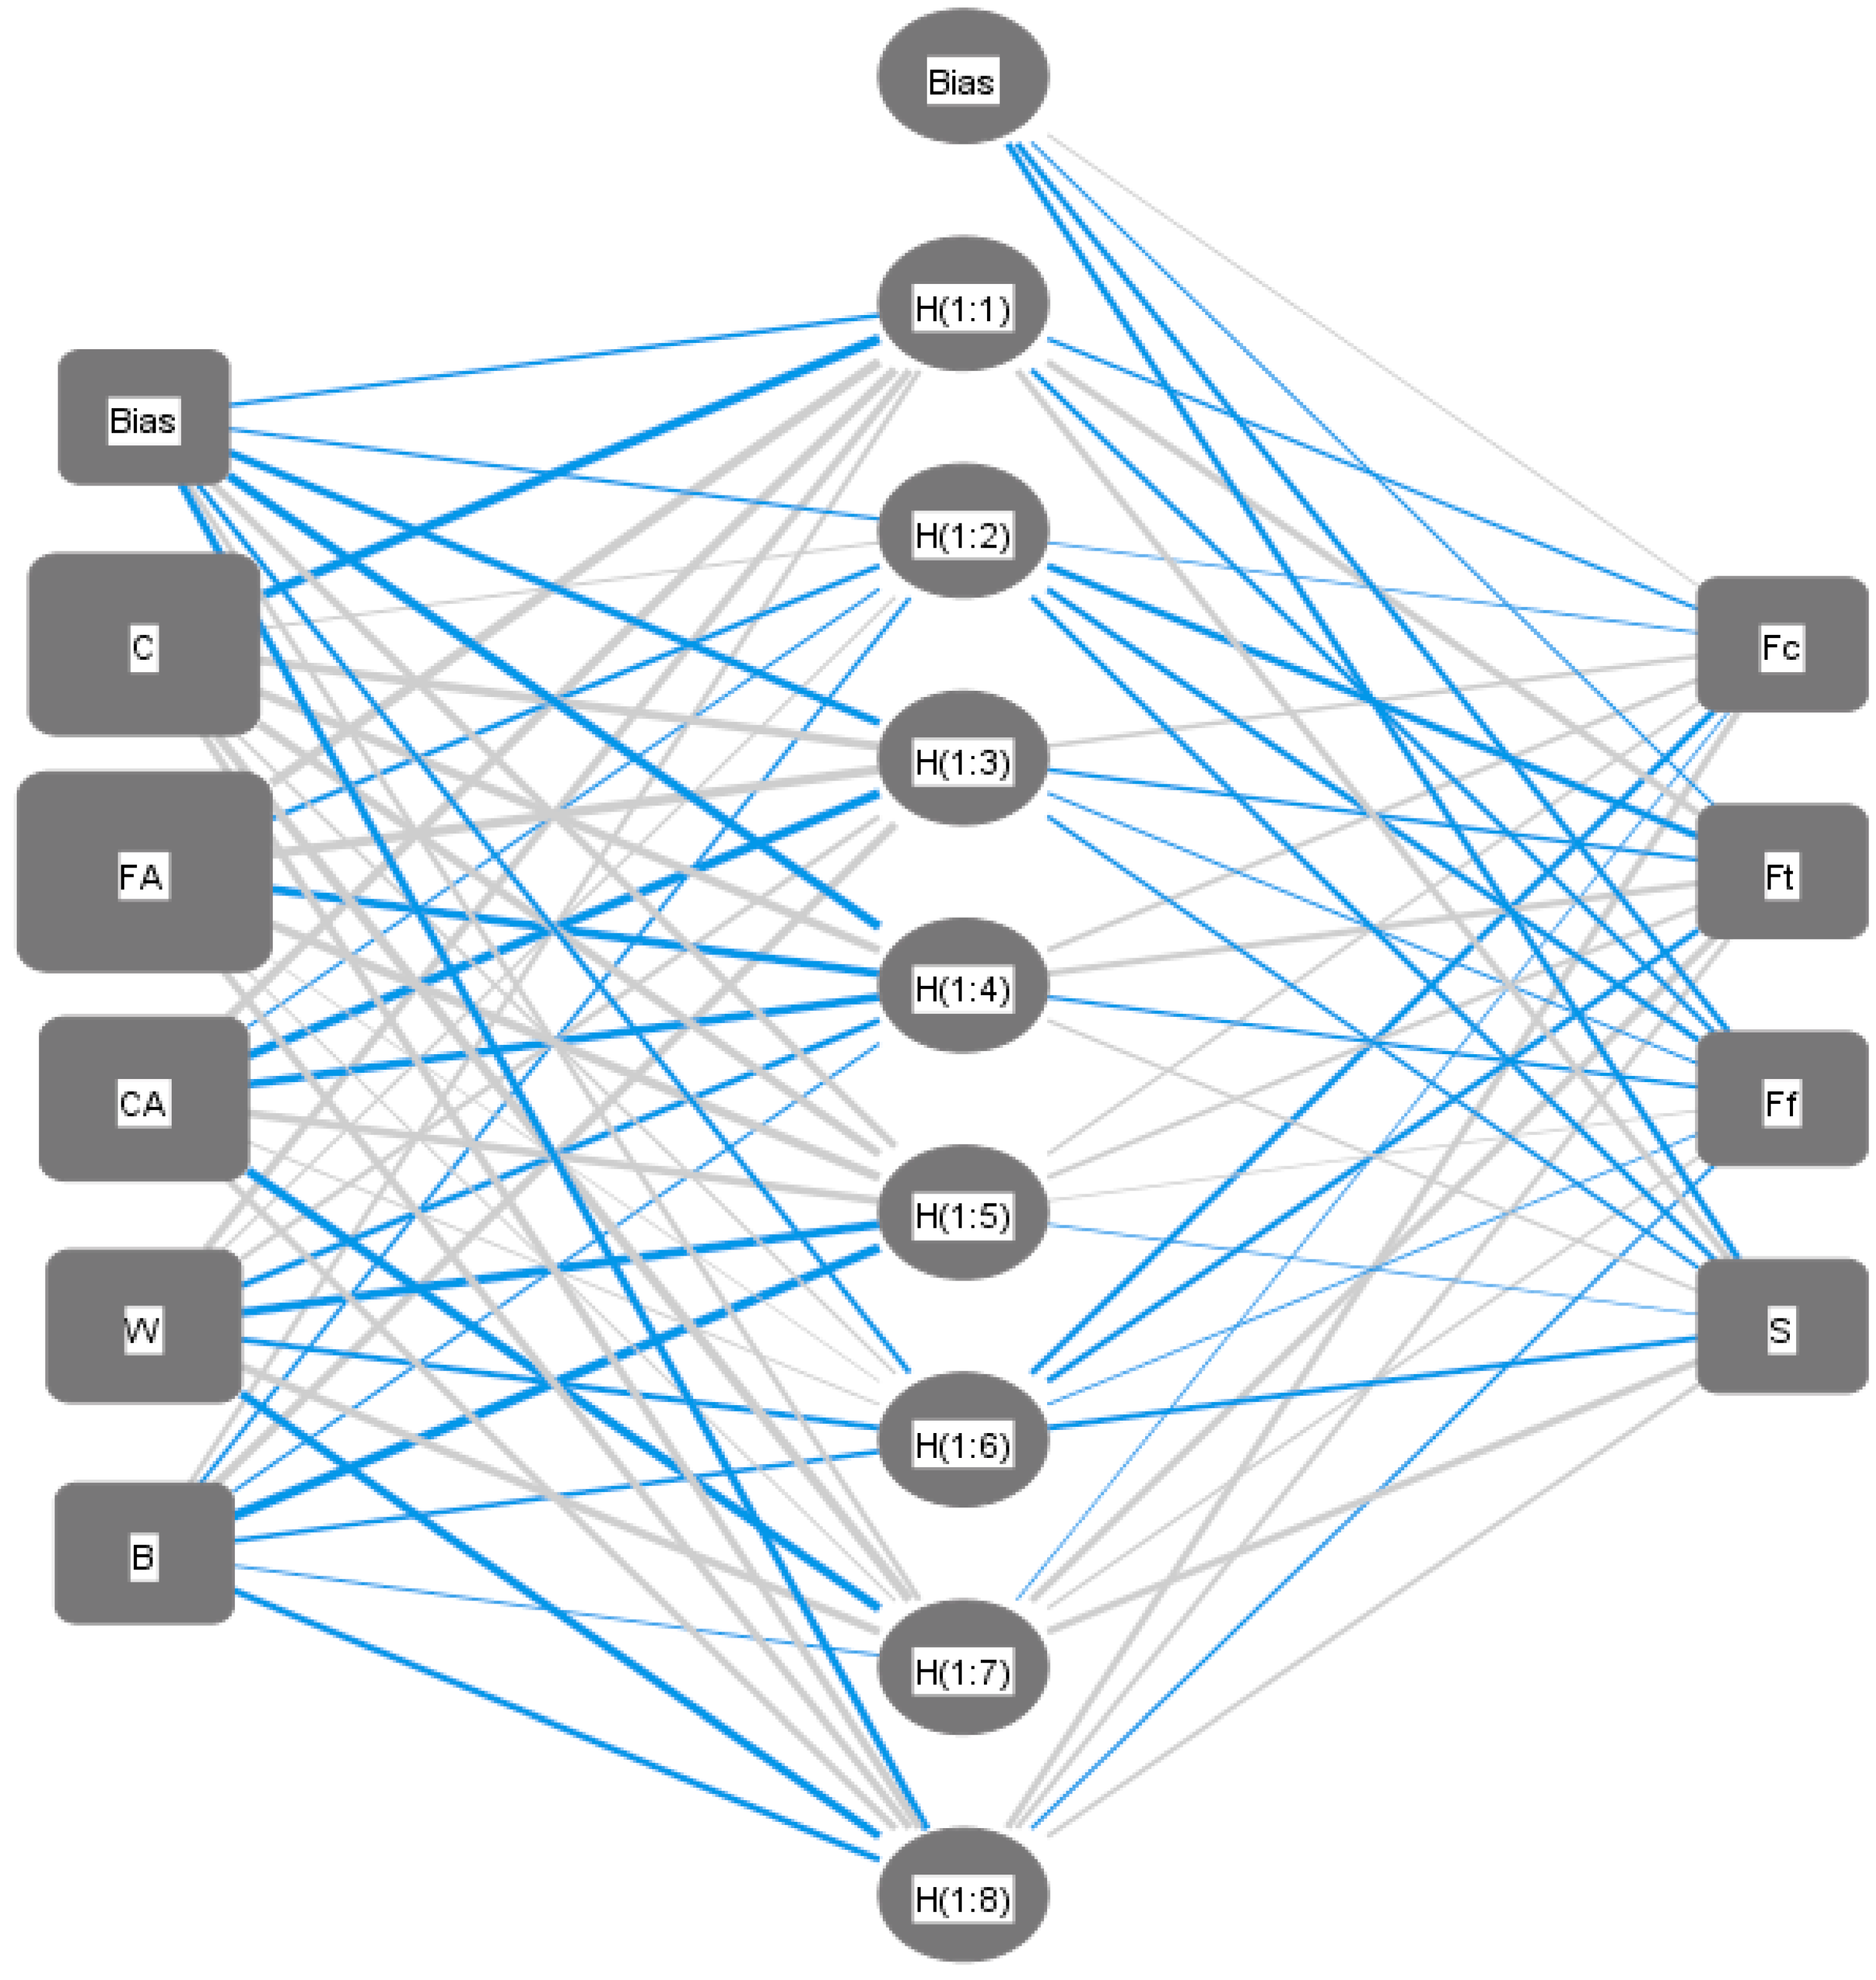
3.3.2. Model (2)—Using (ANN) Technique

The developed model layout is (5:8:4), normalization method (−1.0 to 1.0), activation function (Hyper Tan), and “Back Propagation (BP)” traditional algorithm. The developed model was used to predict the following outputs, Fc, Ft, Ff, and S. The used network layout is illustrated in Figure 9 while its weight matrix is showed in Table 5. The average errors % of the total dataset are 5.5%, 3.8%, 6.6%, and 3.6% and the R2 values are 0.976, 0.936, 0.904, and 0.930, respectively. The relative importance of values for each input parameter are illustrated in Figure 10, which shows that fine aggregates content is the most important input, then cement content, coarse aggregate content, water content, and finally the bacteria concentration.

3.3.3. Model (3)—Using (EPR) Technique

Finally, the developed EPR model was limited to cubic level. For 5 inputs, there are 56 possible terms (35 + 15 + 5 + 1 = 56) as follows:
i = 1 i = 5 j = 1 j = 5 k = 1 k = 5 X i . X j . X k + i = 1 i = 5 j = 1 j = 5 X i . X j + i = 1 i = 5 X i + C
The GA technique was applied on these 56 terms to select the most effective 32 terms to predict the values of Fc, Ft, Ff, and S. The outputs are illustrated in Equations (5)–(8). The average errors in % are 7.5%, 5.4%, 9.6%, and 5.0% and R2 values are 0.953, 0.861, 0.777, and 0.863, respectively, for the total datasets.
Fc = 146961   C . FA . W 39090   C . CA . W 412   C . CA . B + 2320   C . CA 2 + 40495   C . W + 698   C . W . B                                                     448235   C . W 2 + 452   C . B 6.9   C . B 2 12610   C 2 34065   C 2 . FA + 5810   C 2 . CA                                                     + 73525   C 2 . W 101   C 2 . B + 15145   C 3 + 2305   FA + 4975   FA . CA + 2038   FA . CA . W                                                     + 250   FA . CA . B 5120   FA . CA 2 23344   FA . W 344   FA . W . B 99500   FA . W 2                                                     260   FA . B + 3.75   FA . B 2 2690   FA 2 + 2768   FA 2 . CA 4500   CA + 33180   CA . W 2                                                     + 2720   CA 2 + 399400   W 3 + 990
Ft = 492   C . FA . W   42.5   C . FA   + 572   C . CA   + 2992   C . CA . W   + 30.7   C . B   1.47   C . B 2 871   C 2                                                     118   C 2 . FA   1340   C 2 . CA   4485   C 2 . W   20.6   C 2 . B   + 2700   C 3 + 216   FA                                                     30.3   FA . CA   179   FA . CA . W   0.55   FA . CA . B   + 9.6   FA . CA 2 9.43   FA . W                                                       + 31   FA . W . B   + 372   FA . W 2 3.37   FA . B   0.59   FA . B 2 124   FA 2 + 26.5   FA 2 . CA                                                       + 461   FA 2 . W   + 3.46   FA 2 . B   1176   CA . W   + 1115   W   53.2   W . B   + 3.2   W . B 2                                                     + 0.03   B 3 121
Ff = 12476   C . FA . W 691   C . CA 2 + 4020   C . W 809   C 2 2685   C 2 . FA + 1824   C 2 . CA + 20.9   FA . B                                                     14192   C 2 . W + 3.87   C 2 . B + 2377   C 3 893   FA + 454   FA . CA 3373   FA . CA . W                                                     + 1.33   FA . CA . B + 383   FA . CA 2 + 2996   FA . W 2.88   FA . W . B 8213   FA . W 2                                                     0.07   FA . B 2 + 443   FA 2 449   FA 2 . CA 1073   FA 2 . W 12.2   FA 2 . B + 122   FA 3                                                     399   CA + 2495   CA . W 4022   W + 4406   W 2 5.6   B 0.55   B 2                                                     + 0.04   B 3 + 612
S = 124710   C . FA . W 371   C . FA 2 + 8223   C . CA + 2932   C . W 91   C . W . B + 261551   C . W 2                                                     246   C . B + 27.6   C . B 2 10995   C 2 29110   C 2 . FA 7798   C 2 . CA 244384   C 2 . W                                                     375   C 2 . B + 72000   C 3 + 4591   FA 4247   FA . CA + 21318   FA . CA . W                                                     19.5   FA . CA . B 4040   FA . CA 2 2508   FA . W + 215   FA . W . B 126020   FA . W 2                                                     + 40   FA . B + 8.5   FA . B 2 3039   FA 2 + 6385   FA 2 . CA 16797   FA 2 . W 103.3   FA 2 . B                                                     7907   CA 2 . W + 1228   CA 3 B 3 1100
Table 6 shows the summary of performance accuracies of the predicted models for Fc, Ft, Ff, and S while the fitness models are graphed in Figure 11, Figure 12, Figure 13 and Figure 14. In the predicted model, the Taylor diagram representation in Figure 15, the root mean square error (RMSE) envelopes, the standard deviation distribution, and coefficient of correlation between the measured (experimental) data and predicted data are shown. Figure 15a shows that the measured and predicted Fc has an RMSE of 5%, standard deviation range of 10–20 MPa and correlation coefficient of between 0.95 and 0.99. In Figure 15b, the measured and predicted Ft has an RMSE of 0.1–0.2%, standard deviation range of 0.25–0.5 MPa and correlation coefficient of between 0.8 and 0.9. In Figure 15c, the measured and predicted Ff has an RMSE of 0.25–0.5%, standard deviation range of 1–1.5 MPa, and correlation coefficient of between 0.9 and 0.95. In Figure 15d, the measured and predicted S has an RMSE of 5%, standard deviation range of 10–20 mm, and correlation coefficient of between 0.9 and 0.99. Figure 16 and Figure 17 show the variances and relative errors between the measured experimental data and the predicted values.

4. Conclusions

This research presents a life cycle assessment of self-healing concrete produced with Bacillus subtilis and three models using three (AI) techniques (GEP, ANN, and EPR) to predict the cylinder compressive strength (Fc), splitting tensile strength (Ft) MPa, flexural strength (Ff) MPa of 28 days hardening self-healing concrete besides the slump (S) of the fresh concrete.
The life cycle assessment showed that the mix containing 350 kg of cement per m3 had the best overall environmental profile with reduction in every environmental indicator. This mix showed better performance than the self-healing geopolymer in the climate change category. Cement always presents itself as the contributor with more impact in self-healing concrete mixtures.
The developed models used cement content (C), fine aggregate content (FA), coarse aggregate content (CA), water content (W), and the logarithm of bacteria concentration (B) as inputs. The results of comparing the accuracies of the developed models can be concluded with the following points:
-
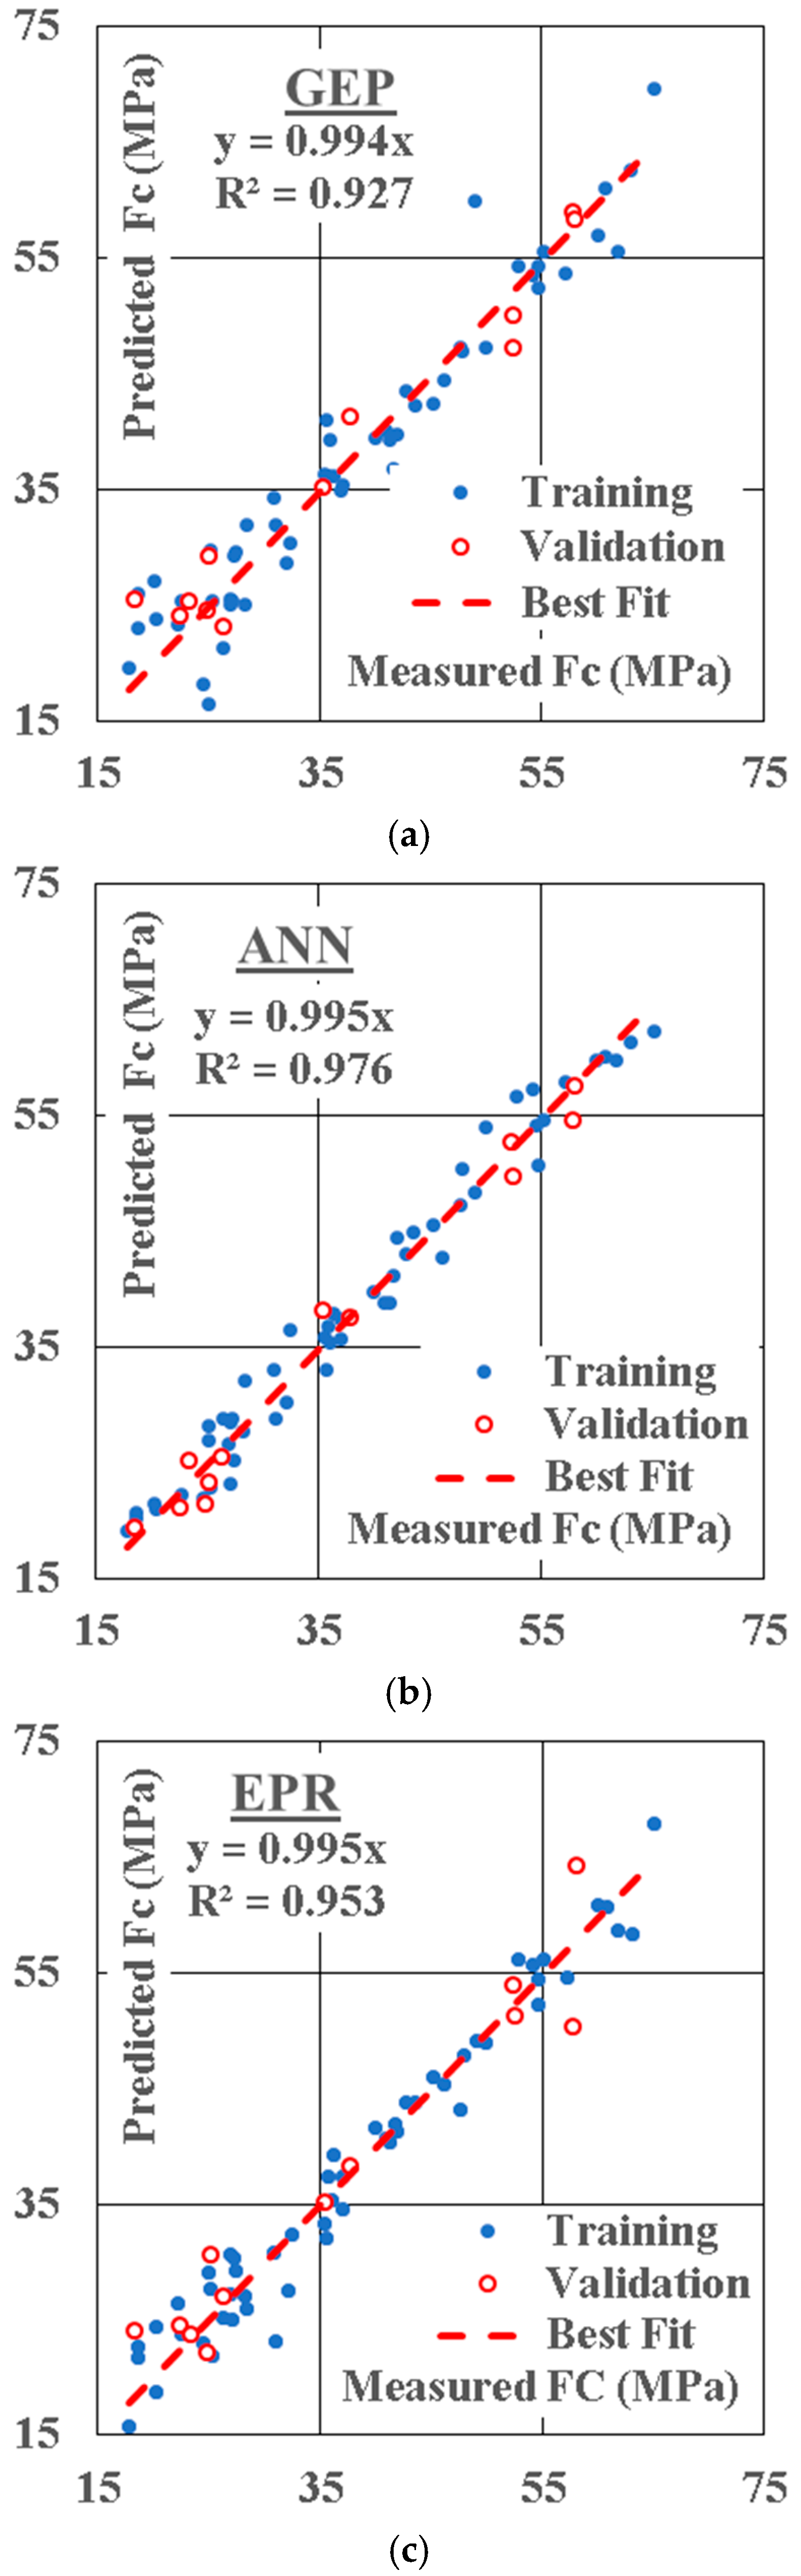
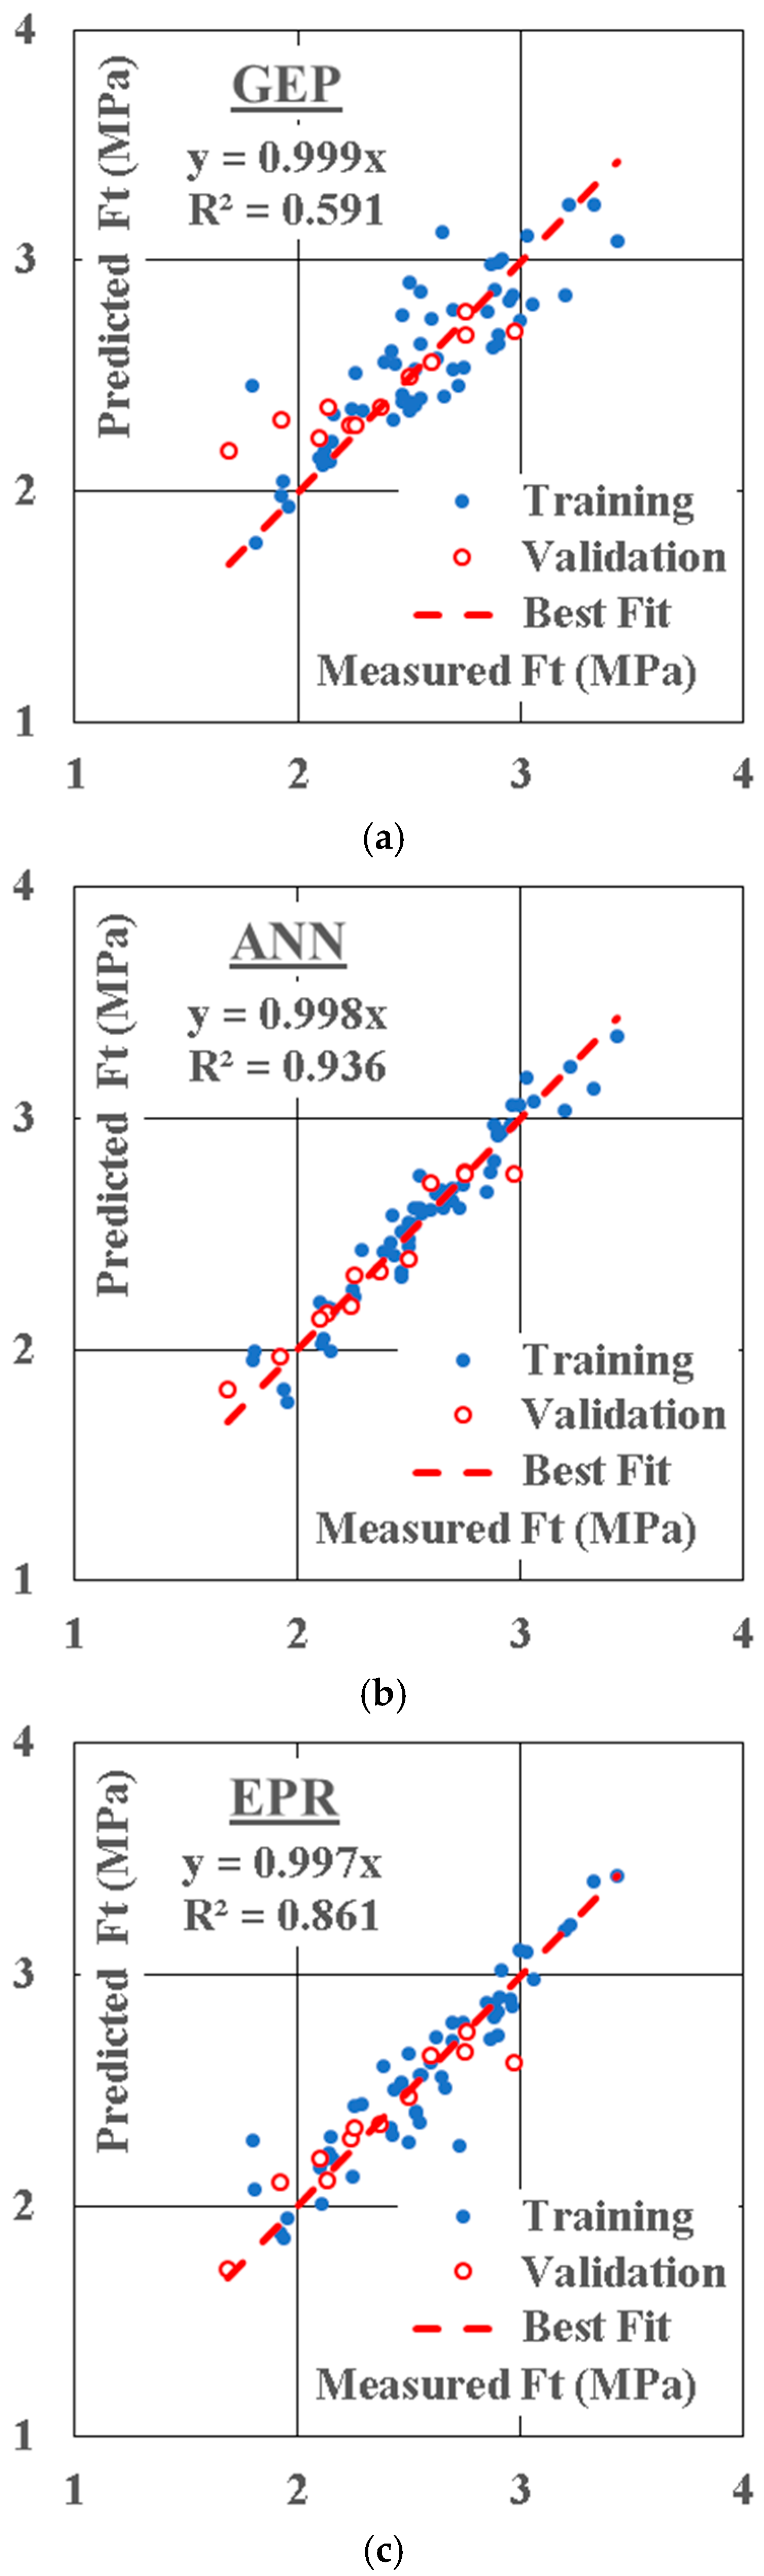
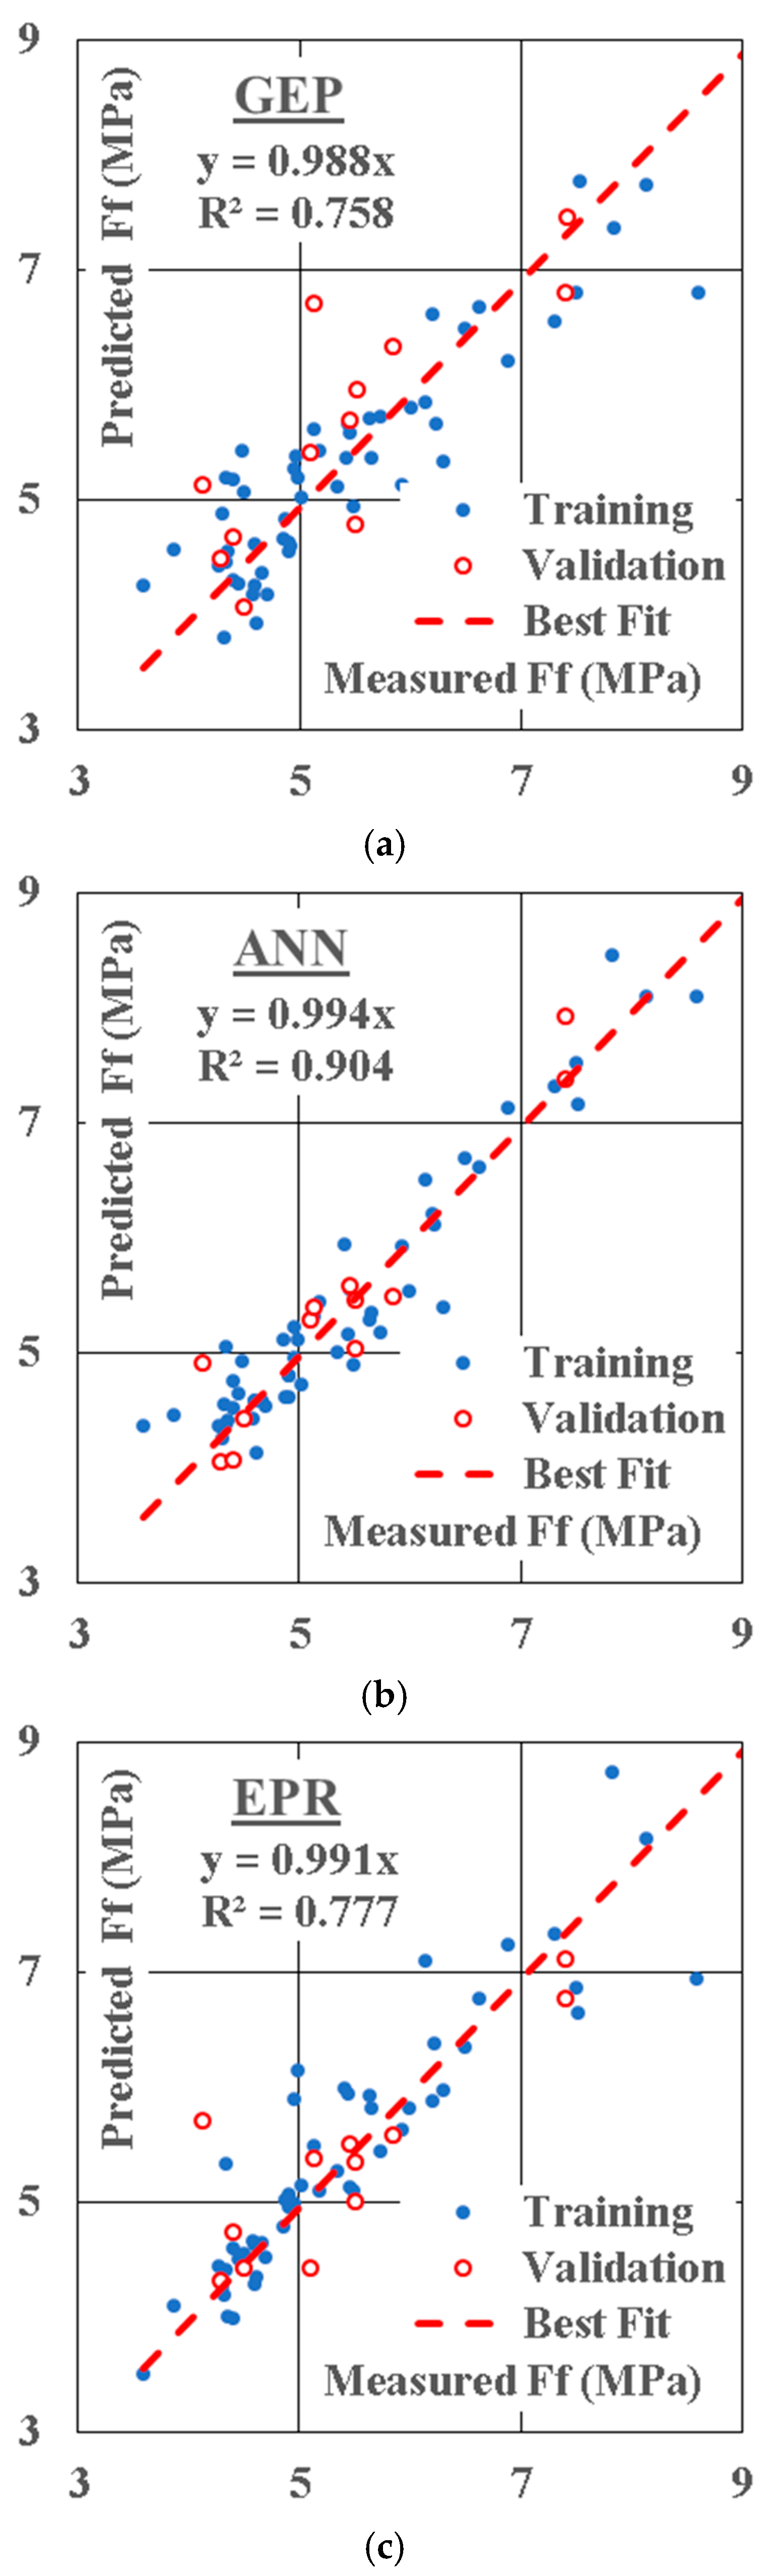
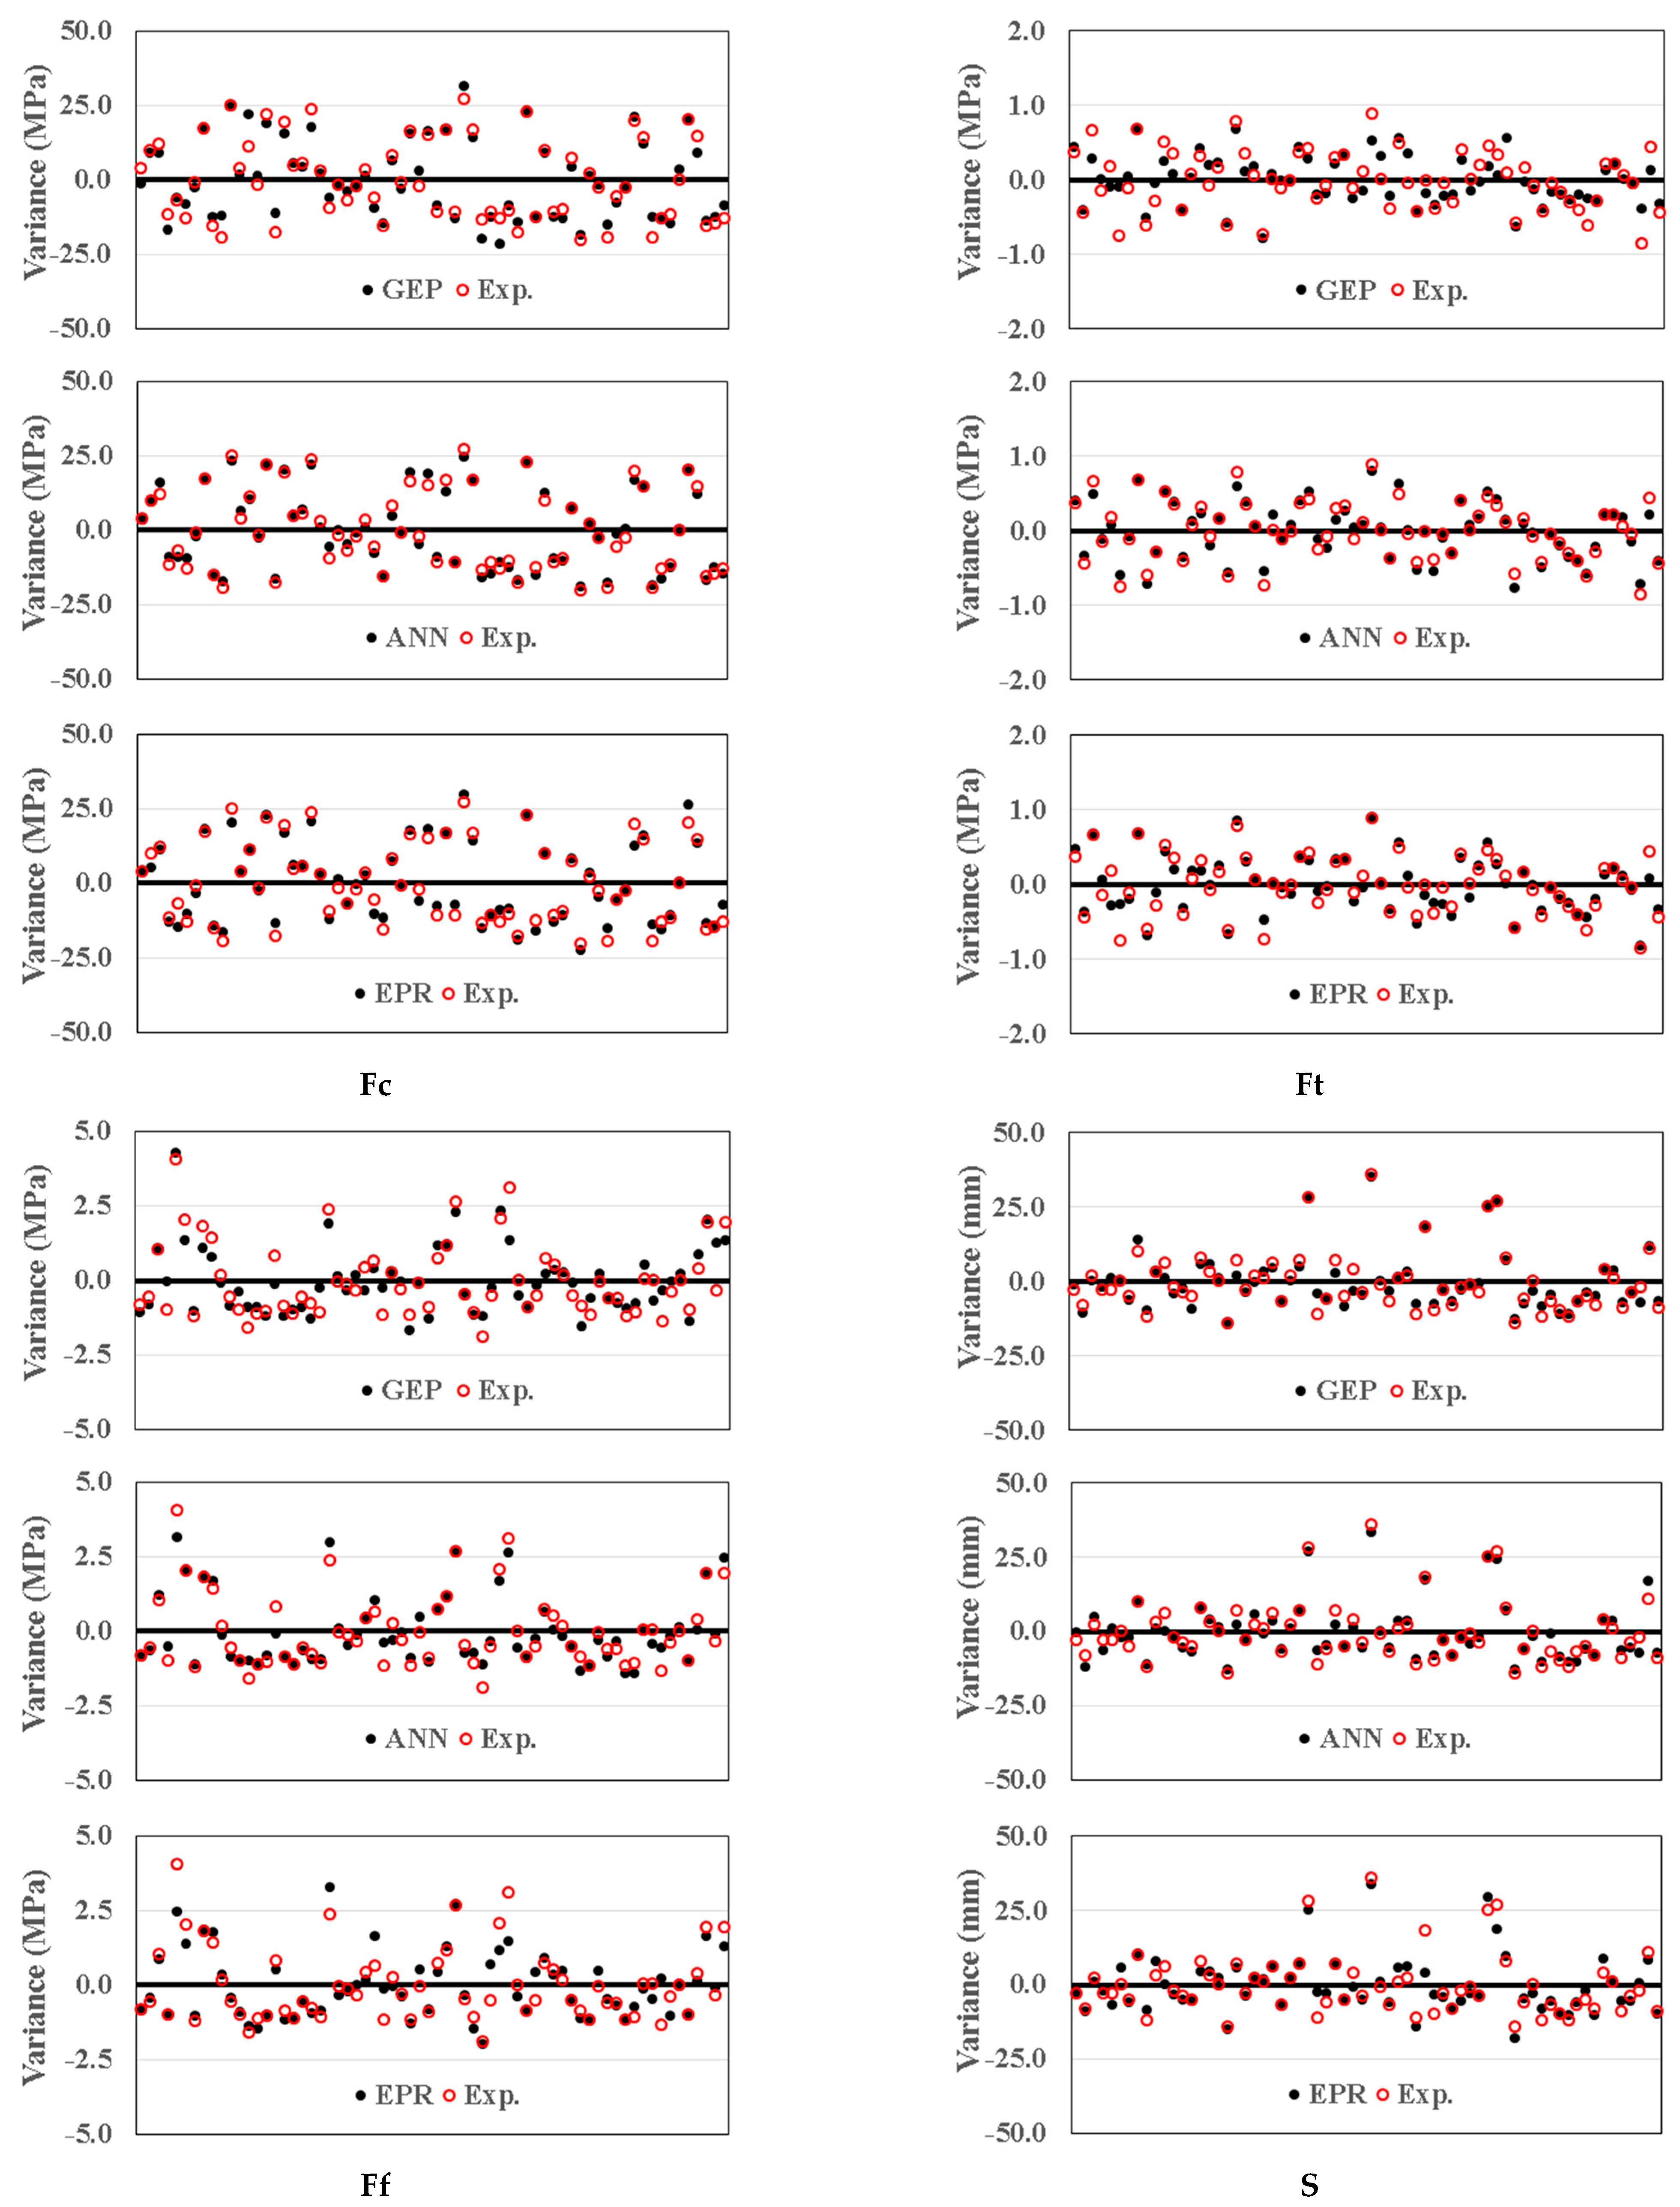
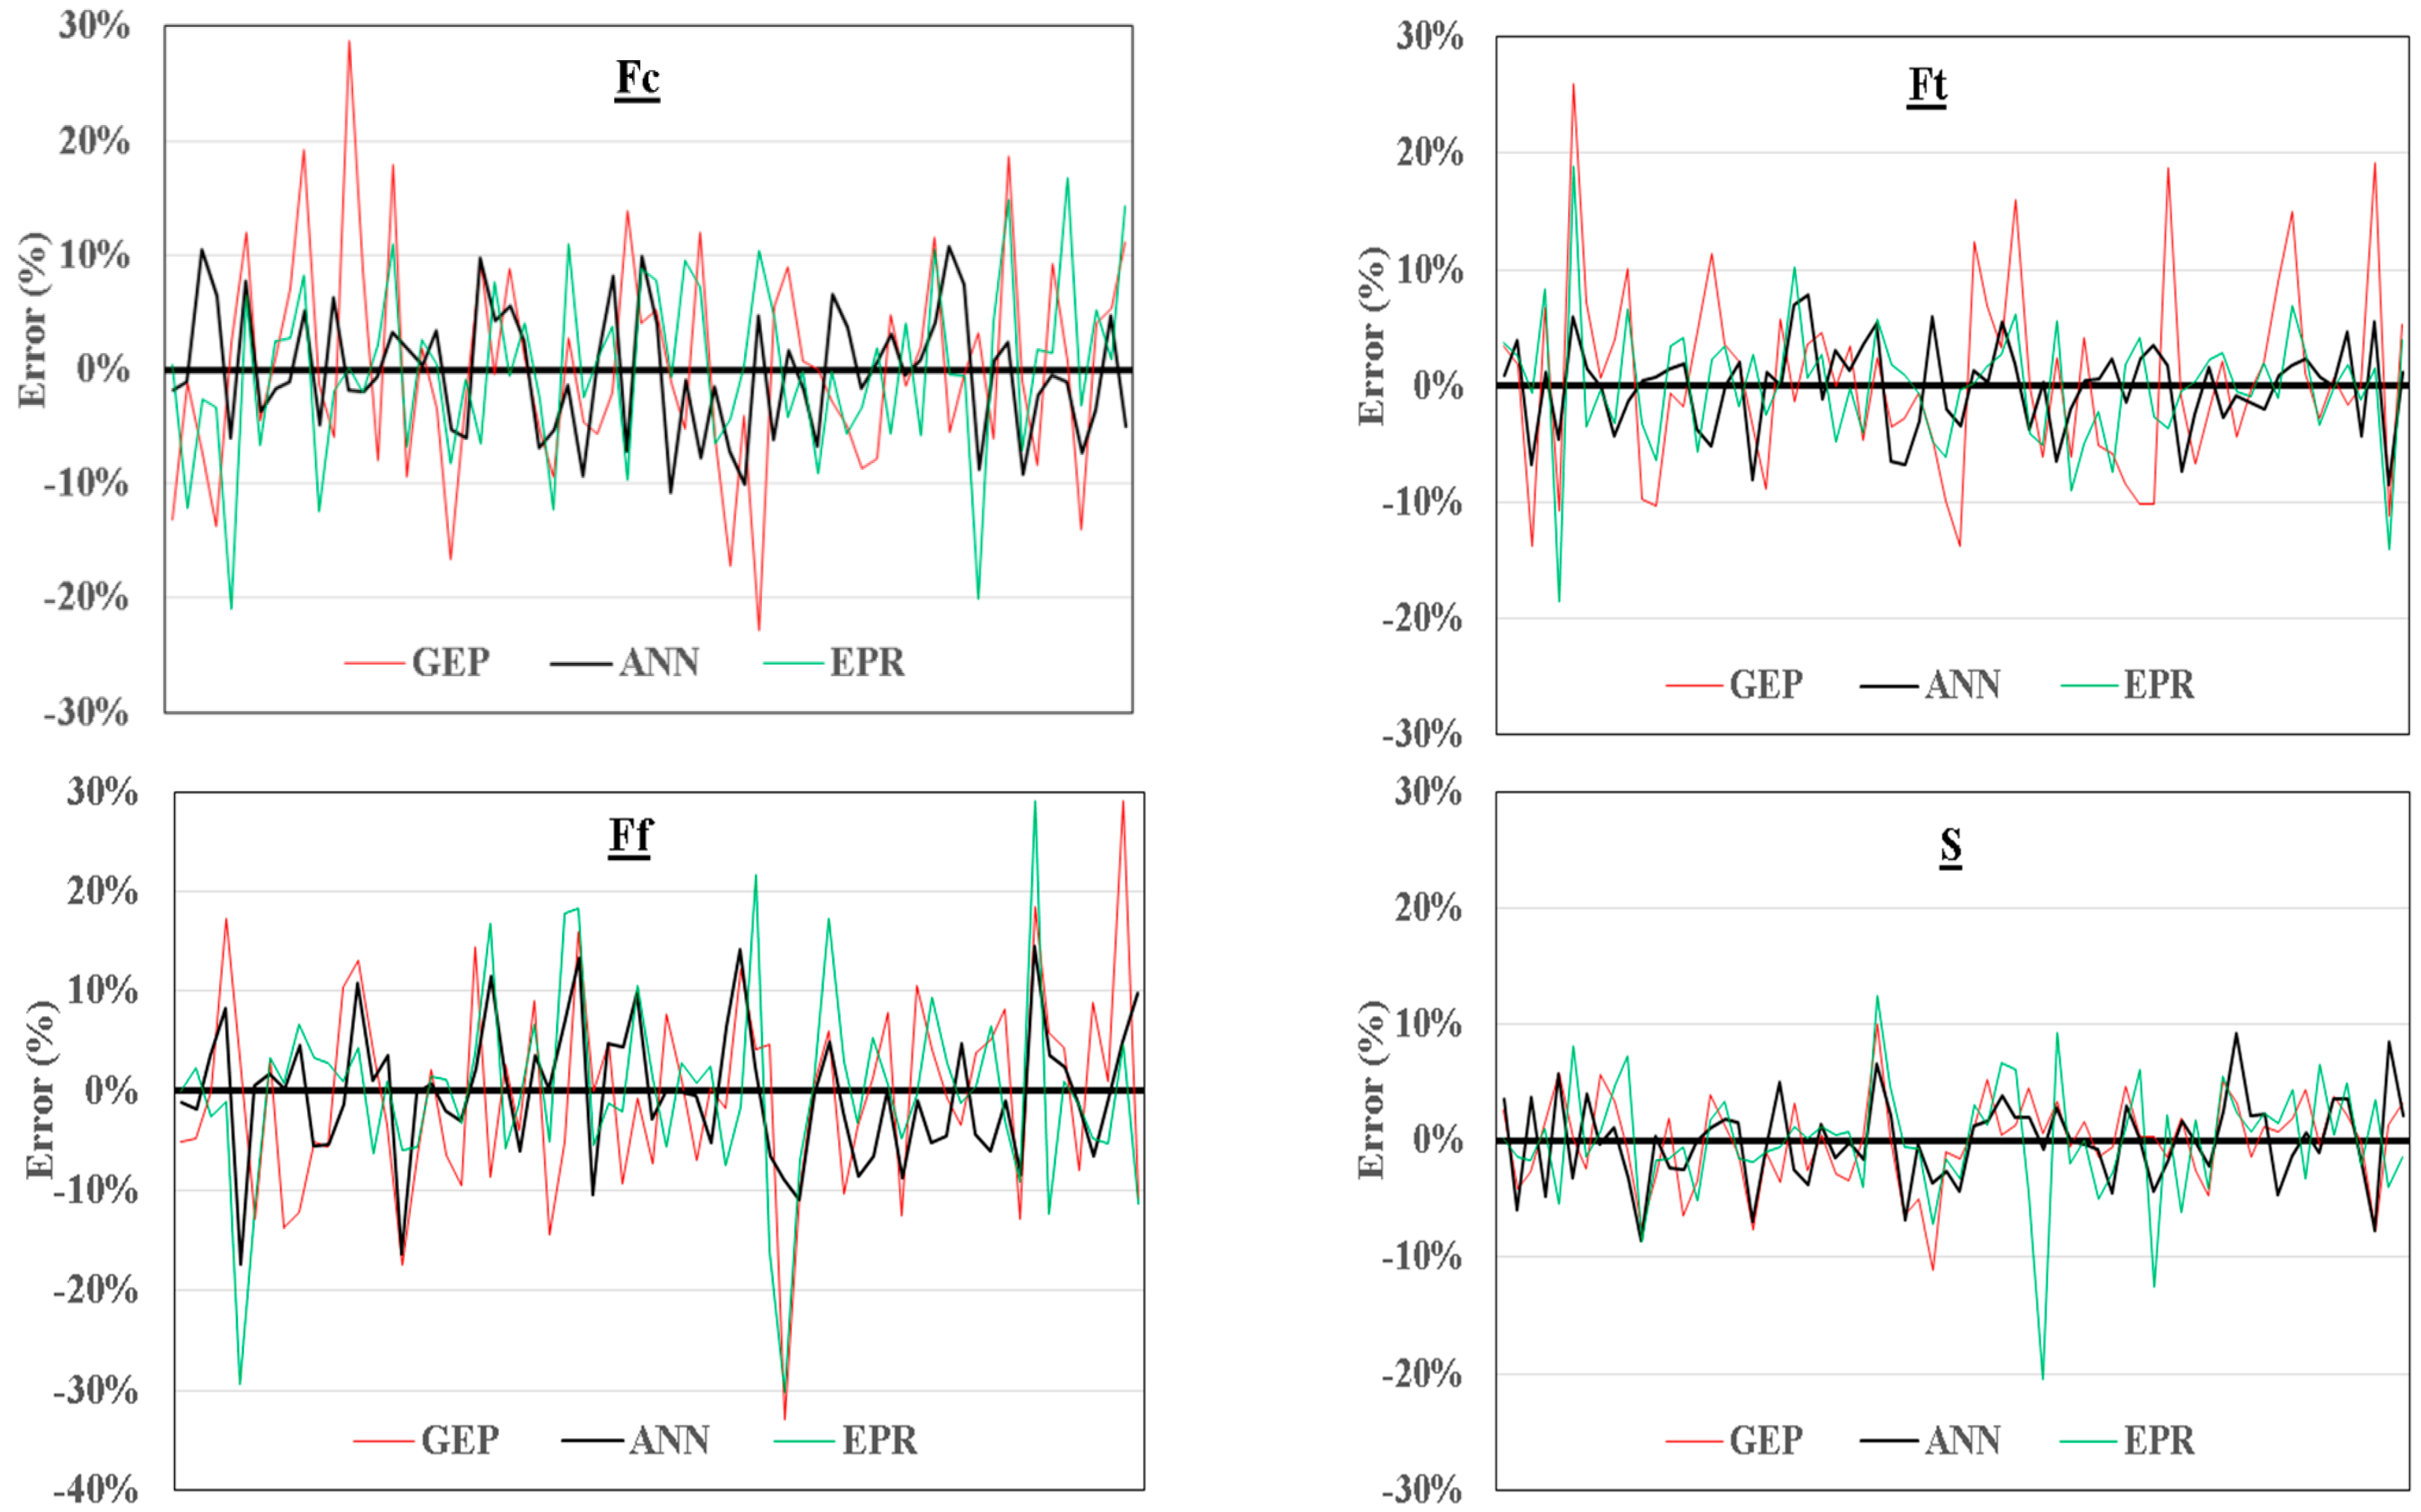
GEP and EPR models shared almost the same level of accuracy; GEP: 90.7%, 91.9%, 90.0%, and 96.2%, EPR: 92.5%, 94.6%, 90.4%, and 95.0% for Fc, Ft, Ff, and S, respectively. They both generated a set of closed form equations with almost the same level of complexity. Hence, both modes are equivalent and could be applied manually.
-
The ANN model presented slightly higher levels of complexity, accuracy, and lower scattering than GP and EPR (ANN, 94.5%, 96.2%, 93.4%, and 96.4% for Fc, Ft, Ff, and S, respectively). Although it has a better accuracy, the generated model cannot be applied manually.
-
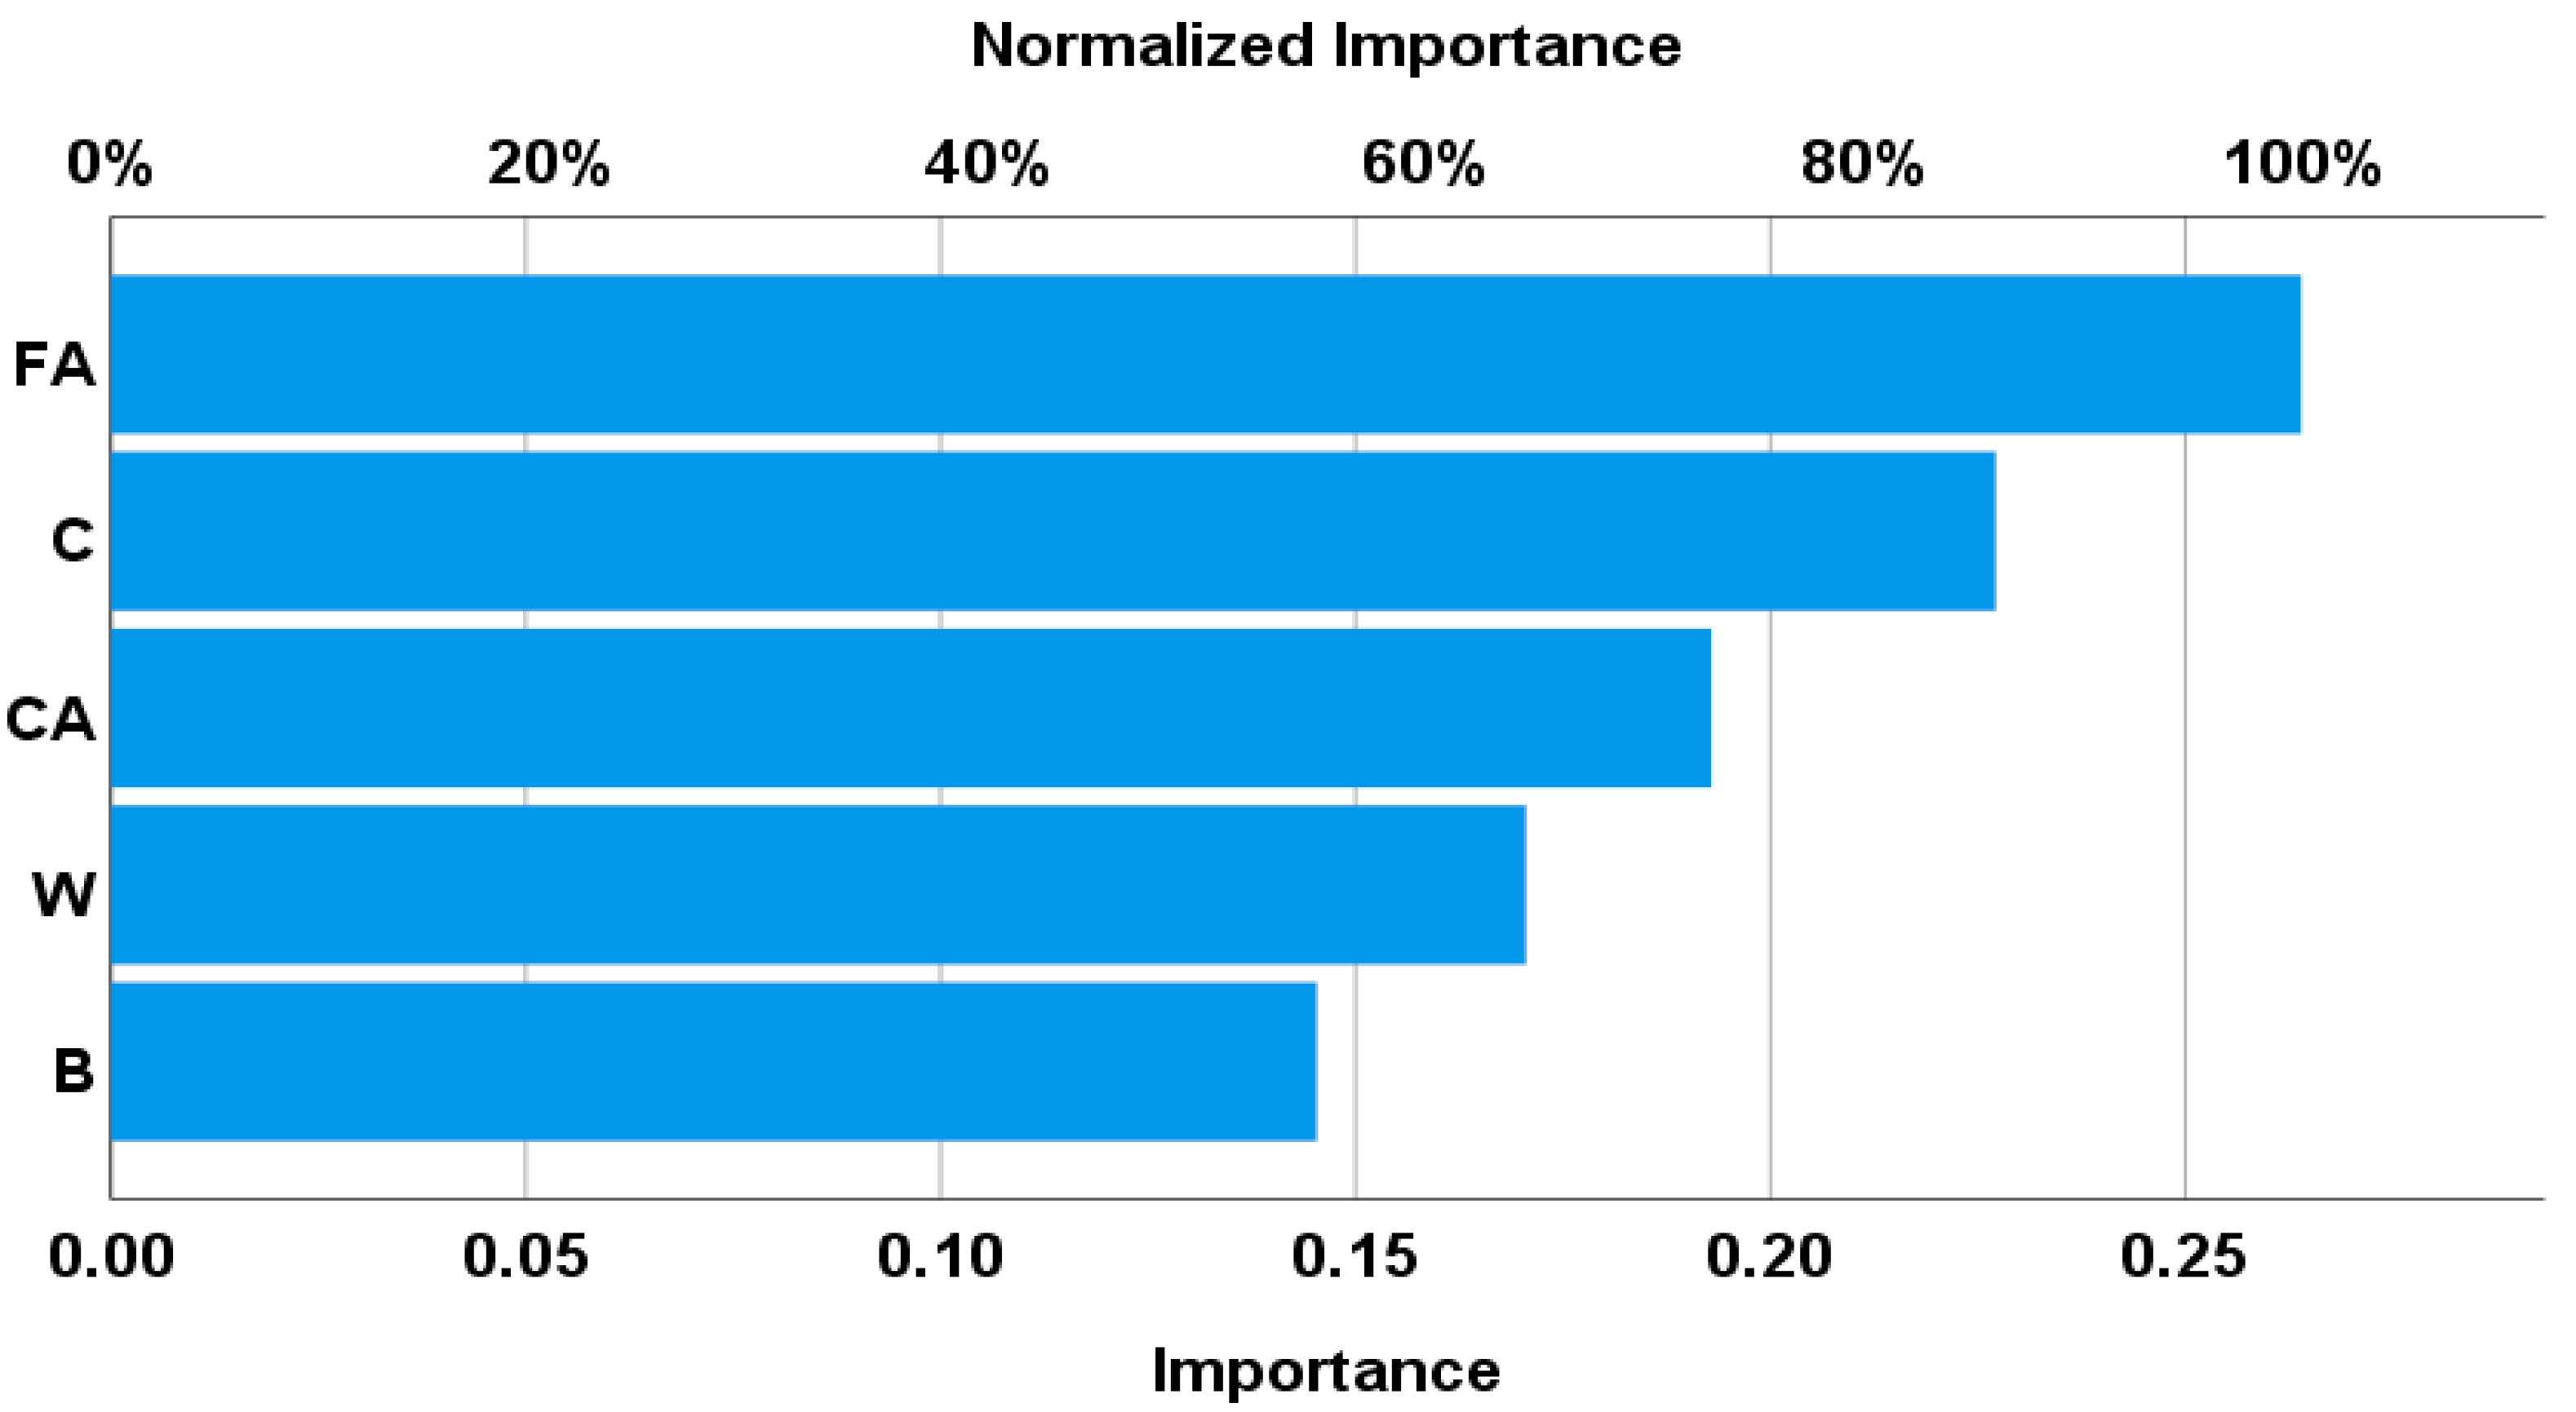
The summation of the absolute weights of each neuron in the input layer of the developed (ANN) model indicated that cement and fine aggregate contents (C, FA) are the most important factors, which presents about 50% of the total influence. Water and coarse aggregate contents (W, CA) come second in the importance ranking with about (35%) of the influence. Finally, bacteria concentration (B) had the lowest effect with about (15%).
-
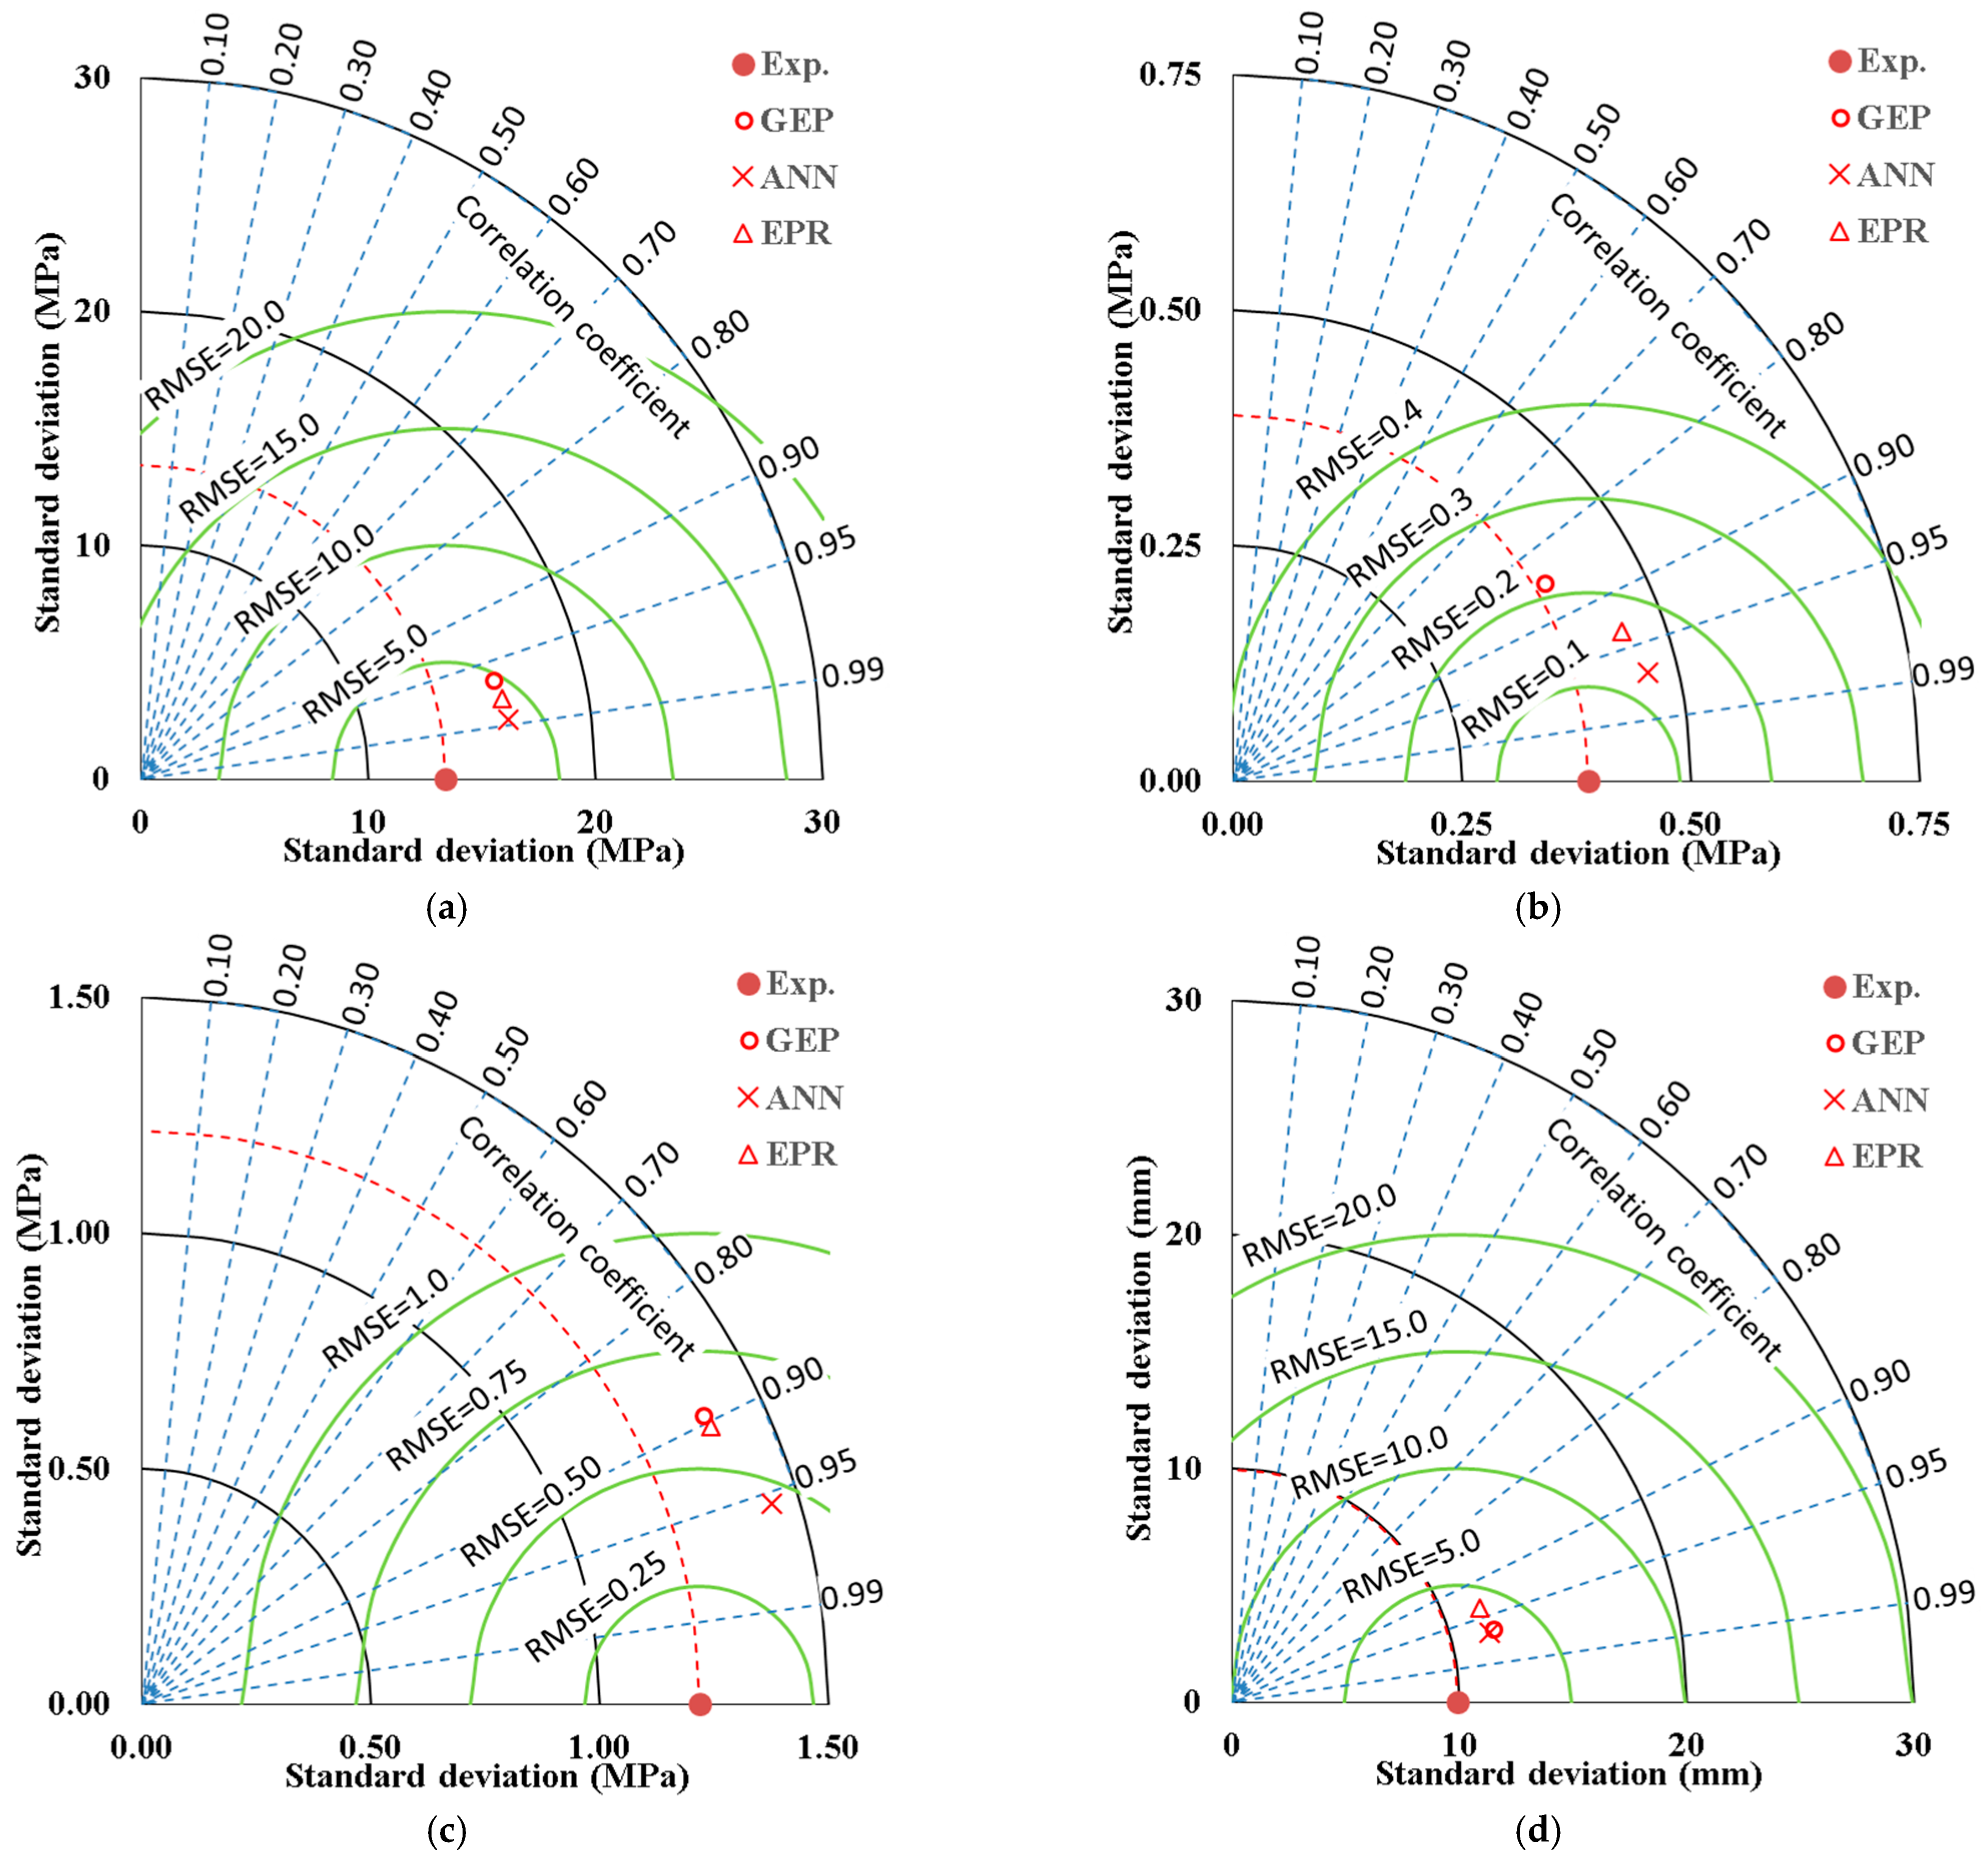
Taylor charts in Figure 15 showed that the correlation coefficients exceeded 95% for ANN models, 90% for EPR, and GEP models except GEP-Ft ≈ 85%.
-
GA technique successfully reduced the 56 terms of conventional polynomial regression quadrilateral formula to only 32 terms without significant impact on its accuracy.
-
Like any other regression technique, the generated formulas are valid within the considered range of parameter values, beyond this range; the prediction accuracy should be verified.

Author Contributions

Conceptualization, K.C.O.; methodology, A.M.E.; software, A.R.; formal analysis, H.B.; investigation, A.S.; data curation, K.I.; writing—original draft preparation, H.J.; supervision, H.A.M. All authors have read and agreed to the published version of the manuscript.

Funding

This research received no external funding.

Institutional Review Board Statement

Not applicable.

Informed Consent Statement

Not applicable.

Data Availability Statement

The data supporting the results of this research work have been reported in this manuscript.

Acknowledgments

We would like to thank Pré Consultants B.V. for providing the SimaPro software license for academic use and research.

Conflicts of Interest

The authors have no conflict of interests that may appear to affect the publication of this research paper.

References

  1. Kim, R.; Woo, U.; Shin, M.; Ahn, E.; Choi, H. Evaluation of self-healing in concrete using linear and nonlinear resonance spectroscopy. Constr. Build. Mater. 2022, 335, 127492. [Google Scholar] [CrossRef]
  2. Wang, X.F.; Yang, Z.H.; Fang, C.; Han, N.X.; Zhu, G.M.; Tang, J.N.; Xing, F. Evaluation of the mechanical performance recovery of self-healing cementitious materials–its methods and future development: A review. Constr. Build. Mater. 2019, 212, 400–421. [Google Scholar] [CrossRef]
  3. Allahyari, H.; Heidarpour, A.; Shayan, A. Experimental and analytical studies of bacterial self-healing concrete subjected to alkali-silica-reaction. Constr. Build. Mater. 2021, 310, 125149. [Google Scholar] [CrossRef]
  4. Zhang, W.; Zheng, Q.; Ashour, A.; Han, B. Self-healing cement concrete composites for resilient infrastructures: A review. Compos. Part. B Eng. 2020, 189, 107892. [Google Scholar] [CrossRef]
  5. Yıldırım, G.; Keskin, Ö.K.; Keskin, S.B.; Şahmaran, M.; Lachemi, M. A review of intrinsic self-healing capability of engineered cementitious composites: Recovery of transport and mechanical properties. Constr. Build. Mater. 2015, 101, 10–21. [Google Scholar] [CrossRef]
  6. Van Tittelboom, K.; De Belie, N. Self-Healing in Cementitious Materials—A Review. Materials 2013, 6, 2182–2217. [Google Scholar] [CrossRef] [Green Version]
  7. Huang, H.; Ye, G.; Qian, C.; Schlangen, E. Self-healing in cementitious materials: Materials, methods and service conditions. Mater. Des. 2016, 92, 499–511. [Google Scholar] [CrossRef]
  8. Hearn, N. Self-sealing, autogenous healing and continued hydration: What is the difference? Mater. Struct. 1998, 31, 563–567. [Google Scholar] [CrossRef]
  9. Aldea, C.M.; Song, W.J.; Popovics, J.S.; Shah, S.P. Extent of Healing of Cracked Normal Strength Concrete. J. Mater. Civ. Eng. 2000, 12, 92–96. [Google Scholar] [CrossRef]
  10. De Belie, N.; Gruyaert, E.; Al-Tabbaa, A.; Antonaci, P.; Baera, C.; Bajare, D.; Darquennes, A.; Davies, R.; Ferrara, L.; Jefferson, T.; et al. A Review of Self-Healing Concrete for Damage Management of Structures. Adv. Mater. Interfaces 2018, 5, 1800074. [Google Scholar] [CrossRef]
  11. Ryu, J.-S. An experimental study on the repair of concrete crack by electrochemical technique. Mater. Struct. 2001, 34, 433–437. [Google Scholar] [CrossRef]
  12. Wang, X.F.; Xing, F.; Xie, Q.; Han, N.X.; Kishi, T.; Ahn, T.H. Mechanical behavior of a capsule embedded in cementitious matrix-macro model and numerical simulation. J. Ceram. Process. Res. 2015, 16, 74–82. [Google Scholar]
  13. Chandra Sekhara Reddy, T.; Ravitheja, A. Macro mechanical properties of self healing concrete with crystalline admixture under different environments. Ain Shams Eng. J. 2019, 10, 23–32. [Google Scholar] [CrossRef]
  14. de Rooij, M.; Van Tittelboom, K.; De Belie, N.; Schlangen, E. (Eds.) Self-Healing Phenomena in Cement-Based Materials. In RILEM State-of-the-Art Reports; Springer: Dordrecht, The Netherlands, 2013; Volume 11, ISBN 978-94-007-6623-5. [Google Scholar]
  15. Ivanov, F.M.; Polyakov, B.I. Self-healing and durability of hydraulic concrete. Hydrotech. Constr. 1974, 8, 844–849. [Google Scholar] [CrossRef]
  16. Gray, R.J. Autogenous healing of fibre/matrix interfacial bond in fibre-reinforced mortar. Cem. Concr. Res. 1984, 14, 315–317. [Google Scholar] [CrossRef]
  17. Snoeck, D.; De Belie, N. Repeated Autogenous Healing in Strain-Hardening Cementitious Composites by Using Superabsorbent Polymers. J. Mater. Civ. Eng. 2016, 28, 4015086. [Google Scholar] [CrossRef] [Green Version]
  18. Kim, J.S.; Schlangen, E. Super absorbent polymers to simulate self healing in ECC. In Proceedings of the 2nd International Symposium on Service Life Design for Infrastructures, RILEM Publications SARL, Delft, The Netherlands, 4–6 October 2010; pp. 849–858. [Google Scholar]
  19. Wiktor, V.; Jonkers, H.M. Quantification of crack-healing in novel bacteria-based self-healing concrete. Cem. Concr. Compos. 2011, 33, 763–770. [Google Scholar] [CrossRef]
  20. Xu, J.; Chen, B.; Xie, T. Experimental and theoretical analysis of bubble departure behavior in narrow rectangular channel. Prog. Nucl. Energy 2014, 77, 1–10. [Google Scholar] [CrossRef]
  21. Yang, Z.; Hollar, J.; He, X.; Shi, X. A self-healing cementitious composite using oil core/silica gel shell microcapsules. Cem. Concr. Compos. 2011, 33, 506–512. [Google Scholar] [CrossRef]
  22. Chunxiang, Q.; Jianyun, W.; Ruixing, W.; Liang, C. Corrosion protection of cement-based building materials by surface deposition of CaCO3 by Bacillus pasteurii. Mater. Sci. Eng. C 2009, 29, 1273–1280. [Google Scholar] [CrossRef]
  23. Keller, M.W.; Sottos, N.R. Mechanical Properties of Microcapsules Used in a Self-Healing Polymer. Exp. Mech. 2006, 46, 725–733. [Google Scholar] [CrossRef] [Green Version]
  24. De Muynck, W.; Debrouwer, D.; De Belie, N.; Verstraete, W. Bacterial carbonate precipitation improves the durability of cementitious materials. Cem. Concr. Res. 2008, 38, 1005–1014. [Google Scholar] [CrossRef]
  25. Snoeck, D.; Van Tittelboom, K.; Steuperaert, S.; Dubruel, P.; De Belie, N. Self-healing cementitious materials by the combination of microfibres and superabsorbent polymers. J. Intell. Mater. Syst. Struct. 2014, 25, 13–24. [Google Scholar] [CrossRef] [Green Version]
  26. Jonkers, H.M.; Thijssen, A.; Muyzer, G.; Copuroglu, O.; Schlangen, E. Application of bacteria as self-healing agent for the development of sustainable concrete. Ecol. Eng. 2010, 36, 230–235. [Google Scholar] [CrossRef]
  27. Kessler, M.; Sottos, N.; White, S. Self-healing structural composite materials. Compos. Part. A Appl. Sci. Manuf. 2003, 34, 743–753. [Google Scholar] [CrossRef]
  28. Tziviloglou, E.; Wiktor, V.; Jonkers, H.M.; Schlangen, E. Bacteria-based self-healing concrete to increase liquid tightness of cracks. Constr. Build. Mater. 2016, 122, 118–125. [Google Scholar] [CrossRef]
  29. Qureshi, T.S.; Kanellopoulos, A.; Al-Tabbaa, A. Encapsulation of expansive powder minerals within a concentric glass capsule system for self-healing concrete. Constr. Build. Mater. 2016, 121, 629–643. [Google Scholar] [CrossRef]
  30. Perez, G.; Gaitero, J.J.; Erkizia, E.; Jimenez, I.; Guerrero, A. Characterisation of cement pastes with innovative self-healing system based in epoxy-amine adhesive. Cem. Concr. Compos. 2015, 60, 55–64. [Google Scholar] [CrossRef]
  31. Huang, H.; Ye, G.; Shui, Z. Feasibility of self-healing in cementitious materials–By using capsules or a vascular system? Constr. Build. Mater. 2014, 63, 108–118. [Google Scholar] [CrossRef]
  32. Wang, J.Y.; Soens, H.; Verstraete, W.; De Belie, N. Self-healing concrete by use of microencapsulated bacterial spores. Cem. Concr. Res. 2014, 56, 139–152. [Google Scholar] [CrossRef]
  33. Van Tittelboom, K.; De Belie, N.; Van Loo, D.; Jacobs, P. Self-healing efficiency of cementitious materials containing tubular capsules filled with healing agent. Cem. Concr. Compos. 2011, 33, 497–505. [Google Scholar] [CrossRef]
  34. Pei, R.; Liu, J.; Wang, S.; Yang, M. Use of bacterial cell walls to improve the mechanical performance of concrete. Cem. Concr. Compos. 2013, 39, 122–130. [Google Scholar] [CrossRef]
  35. Mondal, S.; Ghosh, A. (Dey) Investigation into the optimal bacterial concentration for compressive strength enhancement of microbial concrete. Constr. Build. Mater. 2018, 183, 202–214. [Google Scholar] [CrossRef]
  36. Schreiberová, H.; Bílý, P.; Fládr, J.; Šeps, K.; Chylík, R.; Trtík, T. Impact of the self-healing agent composition on material characteristics of bio-based self-healing concrete. Case Stud. Constr. Mater. 2019, 11, e00250. [Google Scholar] [CrossRef]
  37. Hermawan, H.; Minne, P.; Serna, P.; Gruyaert, E. Understanding the Impacts of Healing Agents on the Properties of Fresh and Hardened Self-Healing Concrete: A Review. Processes 2021, 9, 2206. [Google Scholar] [CrossRef]
  38. Vijay, K.; Murmu, M. Self-repairing of concrete cracks by using bacteria and basalt fiber. SN Appl. Sci. 2019, 1, 1344. [Google Scholar] [CrossRef] [Green Version]
  39. Mohammed, H.; Ortoneda-Pedrola, M.; Nakouti, I.; Bras, A. Experimental characterisation of non-encapsulated bio-based concrete with self-healing capacity. Constr. Build. Mater. 2020, 256, 119411. [Google Scholar] [CrossRef]
  40. Chahal, N.; Siddique, R.; Rajor, A. Influence of bacteria on the compressive strength, water absorption and rapid chloride permeability of concrete incorporating silica fume. Constr. Build. Mater. 2012, 37, 645–651. [Google Scholar] [CrossRef]
  41. Ameri, F.; Shoaei, P.; Bahrami, N.; Vaezi, M.; Ozbakkaloglu, T. Optimum rice husk ash content and bacterial concentration in self-compacting concrete. Constr. Build. Mater. 2019, 222, 796–813. [Google Scholar] [CrossRef]
  42. Jafarnia, M.S.; Khodadad Saryazdi, M.; Moshtaghioun, S.M. Use of bacteria for repairing cracks and improving properties of concrete containing limestone powder and natural zeolite. Constr. Build. Mater. 2020, 242, 118059. [Google Scholar] [CrossRef]
  43. Khaliq, W.; Ehsan, M.B. Crack healing in concrete using various bio influenced self-healing techniques. Constr. Build. Mater. 2016, 102, 349–357. [Google Scholar] [CrossRef]
  44. Wang, H.; Habibi, M.; Marzouki, R.; Majdi, A.; Shariati, M.; Denic, N.; Zaki´c, A.; Khorami, M.; Khadimallah, M.A.; Ebid, A.A.K. Improving the Self-Healing of Cementitious Materials with a Hydrogel System. Gels 2022, 8, 278. [Google Scholar] [CrossRef]
  45. Pré-Sustainability, B.V. LCA Software for Informed Change-Makers, SimaPro 9.2; Pré-Sustainability, B.V.: LE Amersfoort, The Netherlands, 2019. [Google Scholar]
  46. ISO 14040; Environmental Management–Life Cycle Assessment—Principles and Framework. International Organization for Standardization: Geneva, Switzerland, 2006.
  47. Wernet, G.; Bauer, C.; Steubing, B.; Reinhard, J.; Moreno-Ruiz, E.; Weidema, B. The ecoinvent database version 3 (part I): Overview and methodology. Int. J. Life Cycle Assess. 2016, 21, 1218–1230. [Google Scholar] [CrossRef]
  48. Ramagiri, K.K.; Chintha, R.; Bandlamudi, R.K.; De Maeijer, P.K.; Kar, A. Cradle-to-gate life cycle and economic assessment of sustainable concrete mixes—alkali-activated concrete (Aac) and bacterial concrete (bc). Infrastructures 2021, 6, 104. [Google Scholar] [CrossRef]
  49. Sahnoun, M.; Kriaa, M.; Elgharbi, F.; Ayadi, D.Z.; Bejar, S.; Kammoun, R. Aspergillus oryzae S2 alpha-amylase production under solid state fermentation: Optimization of culture conditions. Int. J. Biol. Macromol. 2015, 75, 73–80. [Google Scholar] [CrossRef] [PubMed]
  50. Myhr, A.; Røyne, F.; Brandtsegg, A.S.; Bjerkseter, C.; Throne-Holst, H.; Borch, A.; Wentzel, A.; Røyne, A. Towards a low CO2 emission building material employing bacterial metabolism (2/2): Prospects for global warming potential reduction in the concrete industry. PLoS ONE 2019, 14, e0208643. [Google Scholar] [CrossRef] [PubMed]
  51. Nguyen, T.H.; Ghorbel, E.; Fares, H.; Cousture, A. Bacterial self-healing of concrete and durability assessment. Cem. Concr. Compos. 2019, 104, 103340. [Google Scholar] [CrossRef]
  52. Yatish Reddy, P.V.; Ramesh, B.; Prem Kumar, L. Influence of bacteria in self healing of concrete-a review. Mater. Today Proc. 2020, 33, 4212–4218. [Google Scholar] [CrossRef]
  53. Safiuddin, M.; Ihtheshaam, S.; Kareem, R.A.; Shalam. A study on self-healing concrete. Mater. Today Proc. 2022, 52, 1175–1181. [Google Scholar] [CrossRef]
  54. Huijbregts, M.A.J.; Steinmann, Z.J.N.; Elshout, P.M.F.; Stam, G.; Verones, F.; Vieira, M.; Zijp, M.; Hollander, A.; van Zelm, R. ReCiPe2016: A harmonised life cycle impact assessment method at midpoint and endpoint level. Int. J. Life Cycle Assess. 2017, 22, 138–147. [Google Scholar] [CrossRef]
  55. Riofrio, A.; Cornejo, M.; Baykara, H. Life cycle and environmental impact evaluation of polylactic acid (PLA) production in Ecuador. Int. J. Life Cycle Assess. 2022, 27, 834–848. [Google Scholar] [CrossRef]
  56. Garces, J.I.T.; Dollente, I.J.; Beltran, A.B.; Tan, R.R.; Promentilla, M.A.B. Life cycle assessment of self-healing geopolymer concrete. Clean. Eng. Technol. 2021, 4, 100147. [Google Scholar] [CrossRef]
  57. Asadollahfardi, G.; Katebi, A.; Taherian, P.; Panahandeh, A. Environmental life cycle assessment of concrete with different mixed designs. Int. J. Constr. Manag. 2021, 21, 665–676. [Google Scholar] [CrossRef]
  58. Politecnico, F.P.; Milano, D.; Zurich, E.; Van Den Heede, P.; De Belie, N.; Pittau, F.; Habert, G.; Mignon, A. Life Cycle Assessment of Self-Healing Engineered Cementitious Composite (SH-ECC) Used for the Rehabilitation of Bridges. 2018. Available online: https://www.researchgate.net/publication/332443894 (accessed on 18 May 2022).
  59. Garces, J.I.T.; Tan, R.R.; Beltran, A.B.; Ongpeng, J.M.C.; Promentilla, M.A.B. Environmental Life Cycle Assessment of Alkali-activated Material with Different Mix Designs and Self-healing Agents Chemical Engineering Transactions Environmental Life Cycle Assessment of Alkali-activated Material with Different Mix Designs and Self-heal. Chem. Eng. J. 2021, 88, 835–841. [Google Scholar] [CrossRef]
Figure 1. Environmental and structural benefits of bacteria-bacillus subtilis in concrete.
Sustainability 14 09573 g001
Figure 2. The environmental impact of concrete production and use.
Sustainability 14 09573 g002
Figure 3. Theoretical framework of the life cycle assessment evaluation and mechanical properties of Bacillus subtilis self-healing concrete.
Sustainability 14 09573 g003
Figure 4. Distribution histograms for inputs (in blue) and outputs (in green).
Sustainability 14 09573 g004
Figure 5. System boundary for 1 m3 self-healing concrete production.
Sustainability 14 09573 g005
Figure 6. The effect of the bacteria concentration-Bacillus subtilis (B) on the mechanical properties: (a) Fc, (b) Ft, (c) Ff, and (d) S of the SHC.
Sustainability 14 09573 g006
Figure 7. Normalized results for 1 m3 of the different SHC mixes.
Sustainability 14 09573 g007
Figure 8. Process contribution for the SHC-350 (350 kg of cement).
Sustainability 14 09573 g008
Figure 9. The architecture layout for the developed ANN models.
Sustainability 14 09573 g009
Figure 10. Relative importance of input parameters.
Sustainability 14 09573 g010
Figure 11. Relation between predicted and calculated (Fc) values using the developed models: (a) GEP, (b) ANN, and (c) EPR.
Sustainability 14 09573 g011
Figure 12. Relation between predicted and calculated (Ft) values using the developed models: (a) GEP, (b) ANN, and (c) EPR.
Sustainability 14 09573 g012
Figure 13. Relation between predicted and calculated (Ff) values using the developed models: (a) GEP, (b) ANN, and (c) EPR.
Sustainability 14 09573 g013
Figure 14. Relation between predicted and calculated (S) values using the developed models: (a) GEP, (b) ANN, and (c) EPR.
Sustainability 14 09573 g014
Figure 15. Taylor charts showing RMSE, correlation coefficient and standard deviation of measure and predicted models for (a) Fc, (b) Ft, (c) Ff, and (d) S.
Sustainability 14 09573 g015
Figure 16. Variances between measured and model parameters for Fc, Ft, Ff, and S.
Sustainability 14 09573 g016
Figure 17. Relative errors (%) (predicted measured)/average for Fc, Ft, Ff, and S.
Sustainability 14 09573 g017
Table 1. Statistical analysis of collected database.
RangeMinimumMaximumMeanS.D.VarianceSkewnessKurtosis
C0.200.310.510.400.040.000.51−0.09
FA0.500.480.980.710.100.010.240.03
CA0.630.781.411.060.130.020.480.48
W0.100.130.230.180.020.00−0.04−0.67
B7.492.5710.065.441.502.260.400.65
Fc47.317.865.1037.813.52182.80.36−1.08
Ft1.751.693.442.540.390.15−0.01−0.44
Ff5.963.589.545.451.231.511.231.25
S50.055.0105.068.710.00100.021.573.10
Table 2. Pearson correlation matrix.
CFACAWBFcFtFfS
C1.00
FA−0.411.00
CA0.060.121.00
W0.73−0.240.161.00
B0.330.04−0.020.121.00
Fc−0.010.44−0.16−0.340.241.00
Ft0.160.320.310.090.520.451.00
Ff0.44−0.15−0.090.380.27−0.29−0.121.00
S0.250.190.250.350.60−0.020.620.141.00
Table 3. The utilized database.
CFACAWBFcFtFfS
t/m3t/m3t/m3t/m3Log (cell/mL)MPaMPaMPamm
Training set
0.3960.6751.4100.1784.53441.7542.9184.65366.00
0.4500.6750.9000.1893.00047.7002.1004.90061.00
0.4500.6750.9000.1899.00050.0003.2006.50071.00
0.4030.7921.1490.2124.07626.4152.3904.48266.00
0.4190.7111.1700.1965.40431.0842.7269.54466.00
0.4030.7081.0360.1816.00025.2001.8007.50069.00
0.3510.6411.1020.1395.68337.0902.4234.26664.00
0.5070.7460.9370.19710.06155.1873.2227.30779.00
0.3980.6150.9820.1683.78722.6601.9386.88357.00
0.3830.7271.1030.1926.00018.6702.2605.65072.00
0.3760.9141.0930.1685.28563.0763.0594.91175.00
0.3940.6751.2280.1585.00042.0002.9004.50067.00
0.3470.8380.9650.1346.48149.0772.1423.86665.00
0.3620.6581.1140.1354.90836.0512.6224.35364.00
0.3620.8891.1040.1647.50459.9992.8654.45377.00
0.4000.7381.2420.2166.29520.2392.4716.29572.00
0.3500.8611.0310.1586.00057.2102.7004.60069.00
0.4380.5800.7810.1722.57342.8031.9274.33955.00
0.4000.7051.3980.1615.61143.5893.3334.90976.00
0.3500.8611.0310.1585.00061.7902.9004.70066.00
0.3940.6751.2280.1586.00041.0002.6004.40071.00
0.4420.7281.1720.1996.59728.4121.8127.83670.00
0.4560.5551.0400.2057.00036.3002.5505.45075.00
0.4360.4831.0320.1924.87630.9712.4375.33962.00
0.4560.5551.0400.2056.00035.8002.5305.13071.00
0.4920.5701.1580.2167.95741.3532.9055.92076.00
0.4320.7551.1890.2236.30132.1452.9676.13697.00
0.3690.7191.0210.1774.88422.2852.2934.33258.00
0.3960.6010.8420.1865.44946.2112.4725.73963.00
0.4680.5581.1730.2236.06537.0252.8505.17876.00
0.3100.8590.8840.1454.70354.2292.8864.31264.00
0.3950.5470.9170.1796.60735.6932.4295.41573.00
0.3380.7841.0010.1395.90452.8442.6604.58465.00
0.4380.8111.1770.2247.01127.2743.4356.196105.00
0.4670.7530.9370.2116.86054.7212.5556.62968.00
0.4390.7191.1110.2034.20126.9972.1628.13062.00
0.3920.9761.0960.1716.12265.1033.0285.01270.00
0.3500.8611.0310.1587.00054.6602.5004.40071.00
0.3410.6451.0470.1893.60124.6002.1133.58458.00
0.3810.6770.9400.1755.41427.0282.5304.97887.00
0.3770.6020.8840.1774.84825.0612.1547.52859.00
0.4030.7081.0360.1815.00027.4702.5008.60066.00
0.3990.7681.1610.1993.07620.3662.2475.48561.00
0.3720.9251.0480.1734.39760.8012.9534.59567.00
0.3830.7271.1030.1925.00025.3302.5504.95068.00
0.4240.5980.8530.1638.58147.9362.7476.22765.00
0.3940.7501.0370.1977.00027.1403.0006.00094.00
0.3940.7501.0370.1976.00028.2502.8805.64096.00
0.4190.6911.3770.1736.71845.2892.6464.96077.00
0.3380.6231.0250.1742.62017.8331.9574.60555.00
0.3940.6751.2280.1584.00040.0002.7004.30063.00
0.4560.5551.0400.2055.00035.5002.4705.44069.00
0.3830.7271.1030.1923.00018.6702.1204.87057.00
0.4030.4950.9510.1975.70832.4702.5014.85962.00
Validation set
0.3770.6561.1690.1553.40835.3842.3754.29259.00
0.3430.7450.9200.1493.82957.8292.2394.39257.00
0.4620.7370.9260.2173.04652.3972.1385.51262.00
0.3520.6791.0290.1635.64218.4371.9265.49864.00
0.3830.7271.1030.1924.00024.8802.2604.12061.00
0.3960.7671.1580.2155.29526.3012.7525.09973.00
0.5140.6261.1850.2335.72337.7692.7575.46170.00
0.3500.8611.0310.1584.00058.0202.6004.50060.00
0.4500.6750.9000.1896.00052.5002.5005.85065.00
0.3860.6100.9180.1575.61822.5091.6907.41467.00
0.3780.7480.9290.1686.58523.3562.9755.13380.00
0.4030.7081.0360.1814.00025.1302.1007.40060.00
Table 4. LCA results for the different mixes considering the amount of cement.
Impact
Category
Global
Warming
Terrestrial AcidificationTerrestrial Eco-ToxicityFreshwater Eco-ToxicityMarine
Eco-toxicity
Human
Carcinogenic Toxicity
Human Non-carcinogenic
Toxicity
Unitkg CO2 eqkg SO2 eqkg 1,4-DCBkg 1,4-DCBkg 1,4-DCBkg 1,4-DCBkg 1,4-DCB
SHC (456 kg/m3)439.560.6962663.5144.7354.47493.28
SHC (383 kg/m3)372.620.554230.43.0474.1023.89180.46
SHC (403 kg/m3)390.880.58239.93.1724.2714.04683.89
SHC (394 kg/m3)383.40.57237.23.1344.224.00682.84
SHC (350 kg/m3)342.20.511213.92.8313.8073.61874.51
SHC (394 kg/m3, more aggregates)382.70.568235.73.1174.1963.97782.37
SHC (450 kg/m3)433.90.64262.63.4714.6764.41892.1
DCB: dichlorobenzene.
Table 5. Weights matrix for the developed ANN model.
Hidden Layer
H(1:1)H(1:2)H(1:3)H(1:4)H(1:5)H(1:6)H(1:7)H(1:8)
Input Layer(Bias)−0.34−0.24−1.80−7.881.31−0.580.52−2.62
C−23.330.135.715.293.800.2013.741.90
FA15.33−0.5114.49−4.406.510.030.101.55
CA5.99−0.18−9.99−3.293.000.09−7.901.00
W1.670.180.43−0.83−6.45−0.723.05−4.74
B0.48−0.263.10−0.20−32.02−0.42−0.12−0.97
Hidden Layer
H(1:1)H(1:2)H(1:3)H(1:4)H(1:5)H(1:6)H(1:7)H(1:8)(Bias)
Output LayerFc−0.24−0.040.350.370.22−0.85−0.040.980.07
Ft1.02−1.25−0.330.830.37−0.721.090.45−0.16
Ff−0.50−0.80−0.14−0.260.04−0.060.21−0.22−0.73
S0.90−0.71−0.270.21−0.03−0.711.060.35−0.90
Table 6. Accuracies of developed models.
ItemTechniqueModelSSEAverage Error %R2
FcGEPEquation (1)8179.30.927
ANNFigure 3, Table 32845.50.976
EPREquation (5)5317.50.953
FtGEPEquation (2)38.10.591
ANNFigure 3, Table 313.80.936
EPREquation (6)15.40.861
FfGEPEquation (3)19100.758
ANNFigure 3, Table 396.60.904
EPREquation (7)189.60.777
SGEPEquation (4)4433.80.928
ANNFigure 3, Table 34123.60.930
EPREquation (8)7845.00.863
Publisher’s Note: MDPI stays neutral with regard to jurisdictional claims in published maps and institutional affiliations.

