
Assessing the Potential of Wind Energy as Sustainable Energy Production in Ramallah, Palestine


Abstract
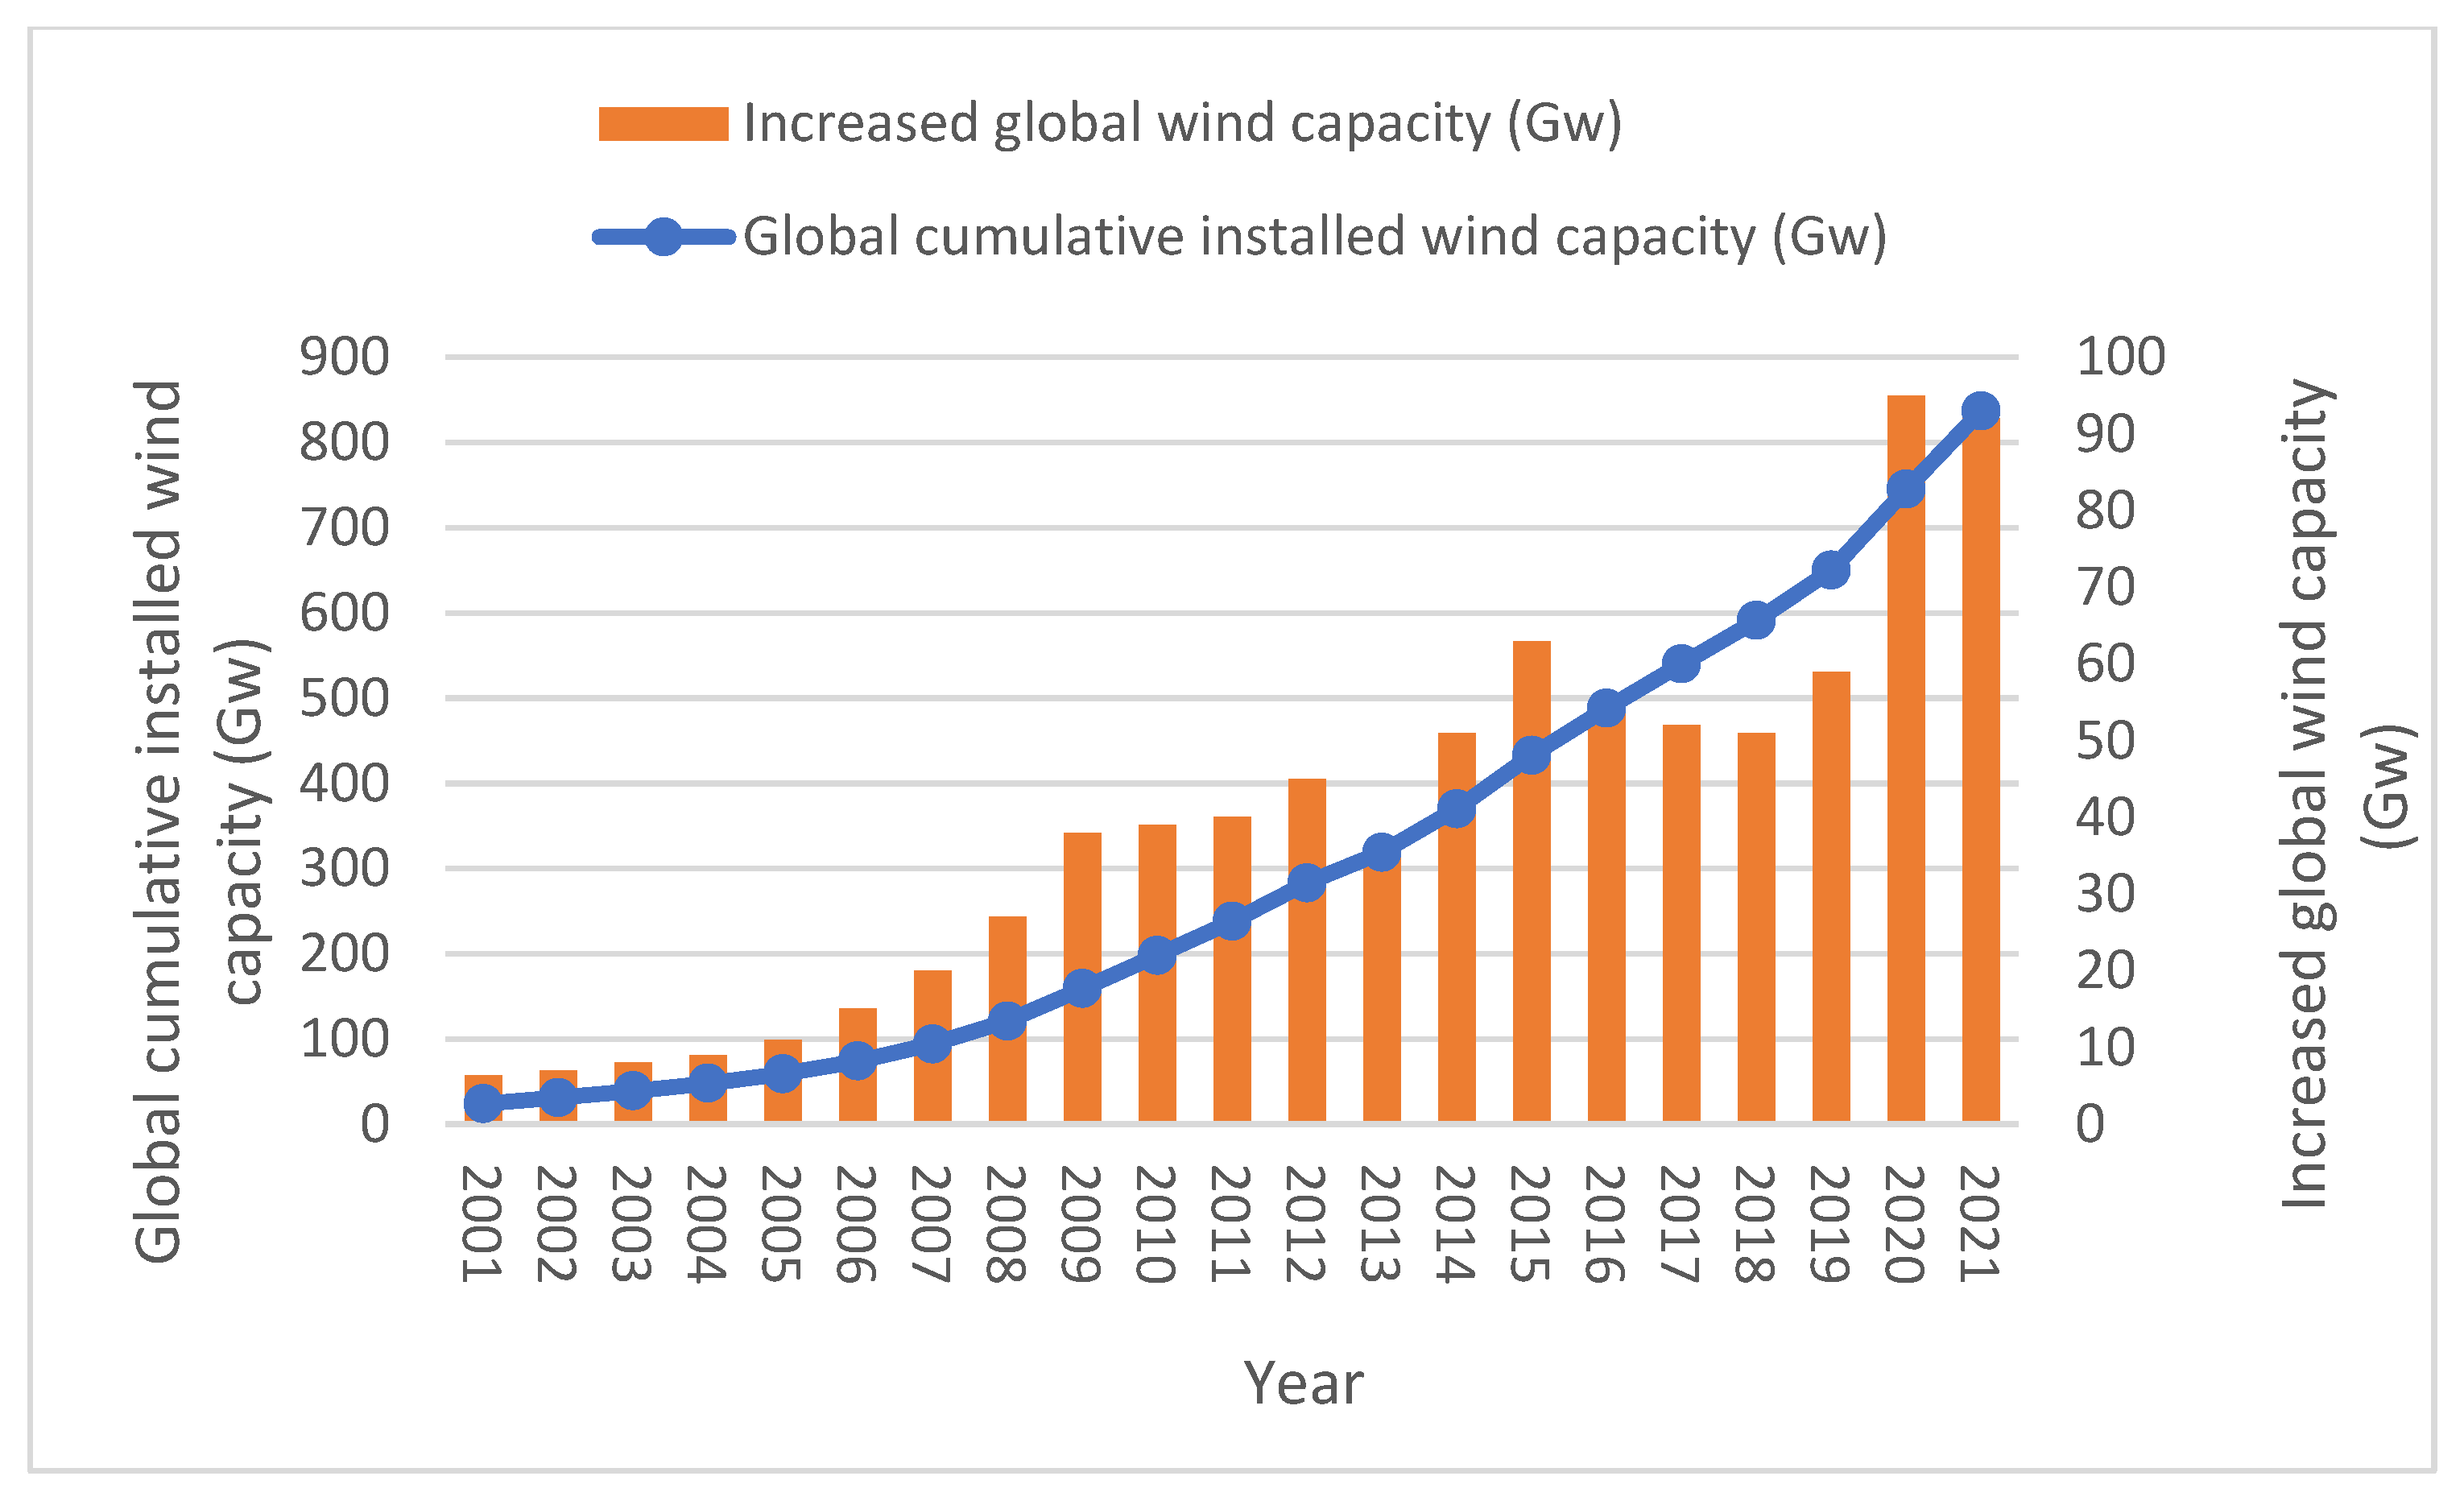
:1. Introduction
2. Materials and Methods
2.1. Palestine’s Climate
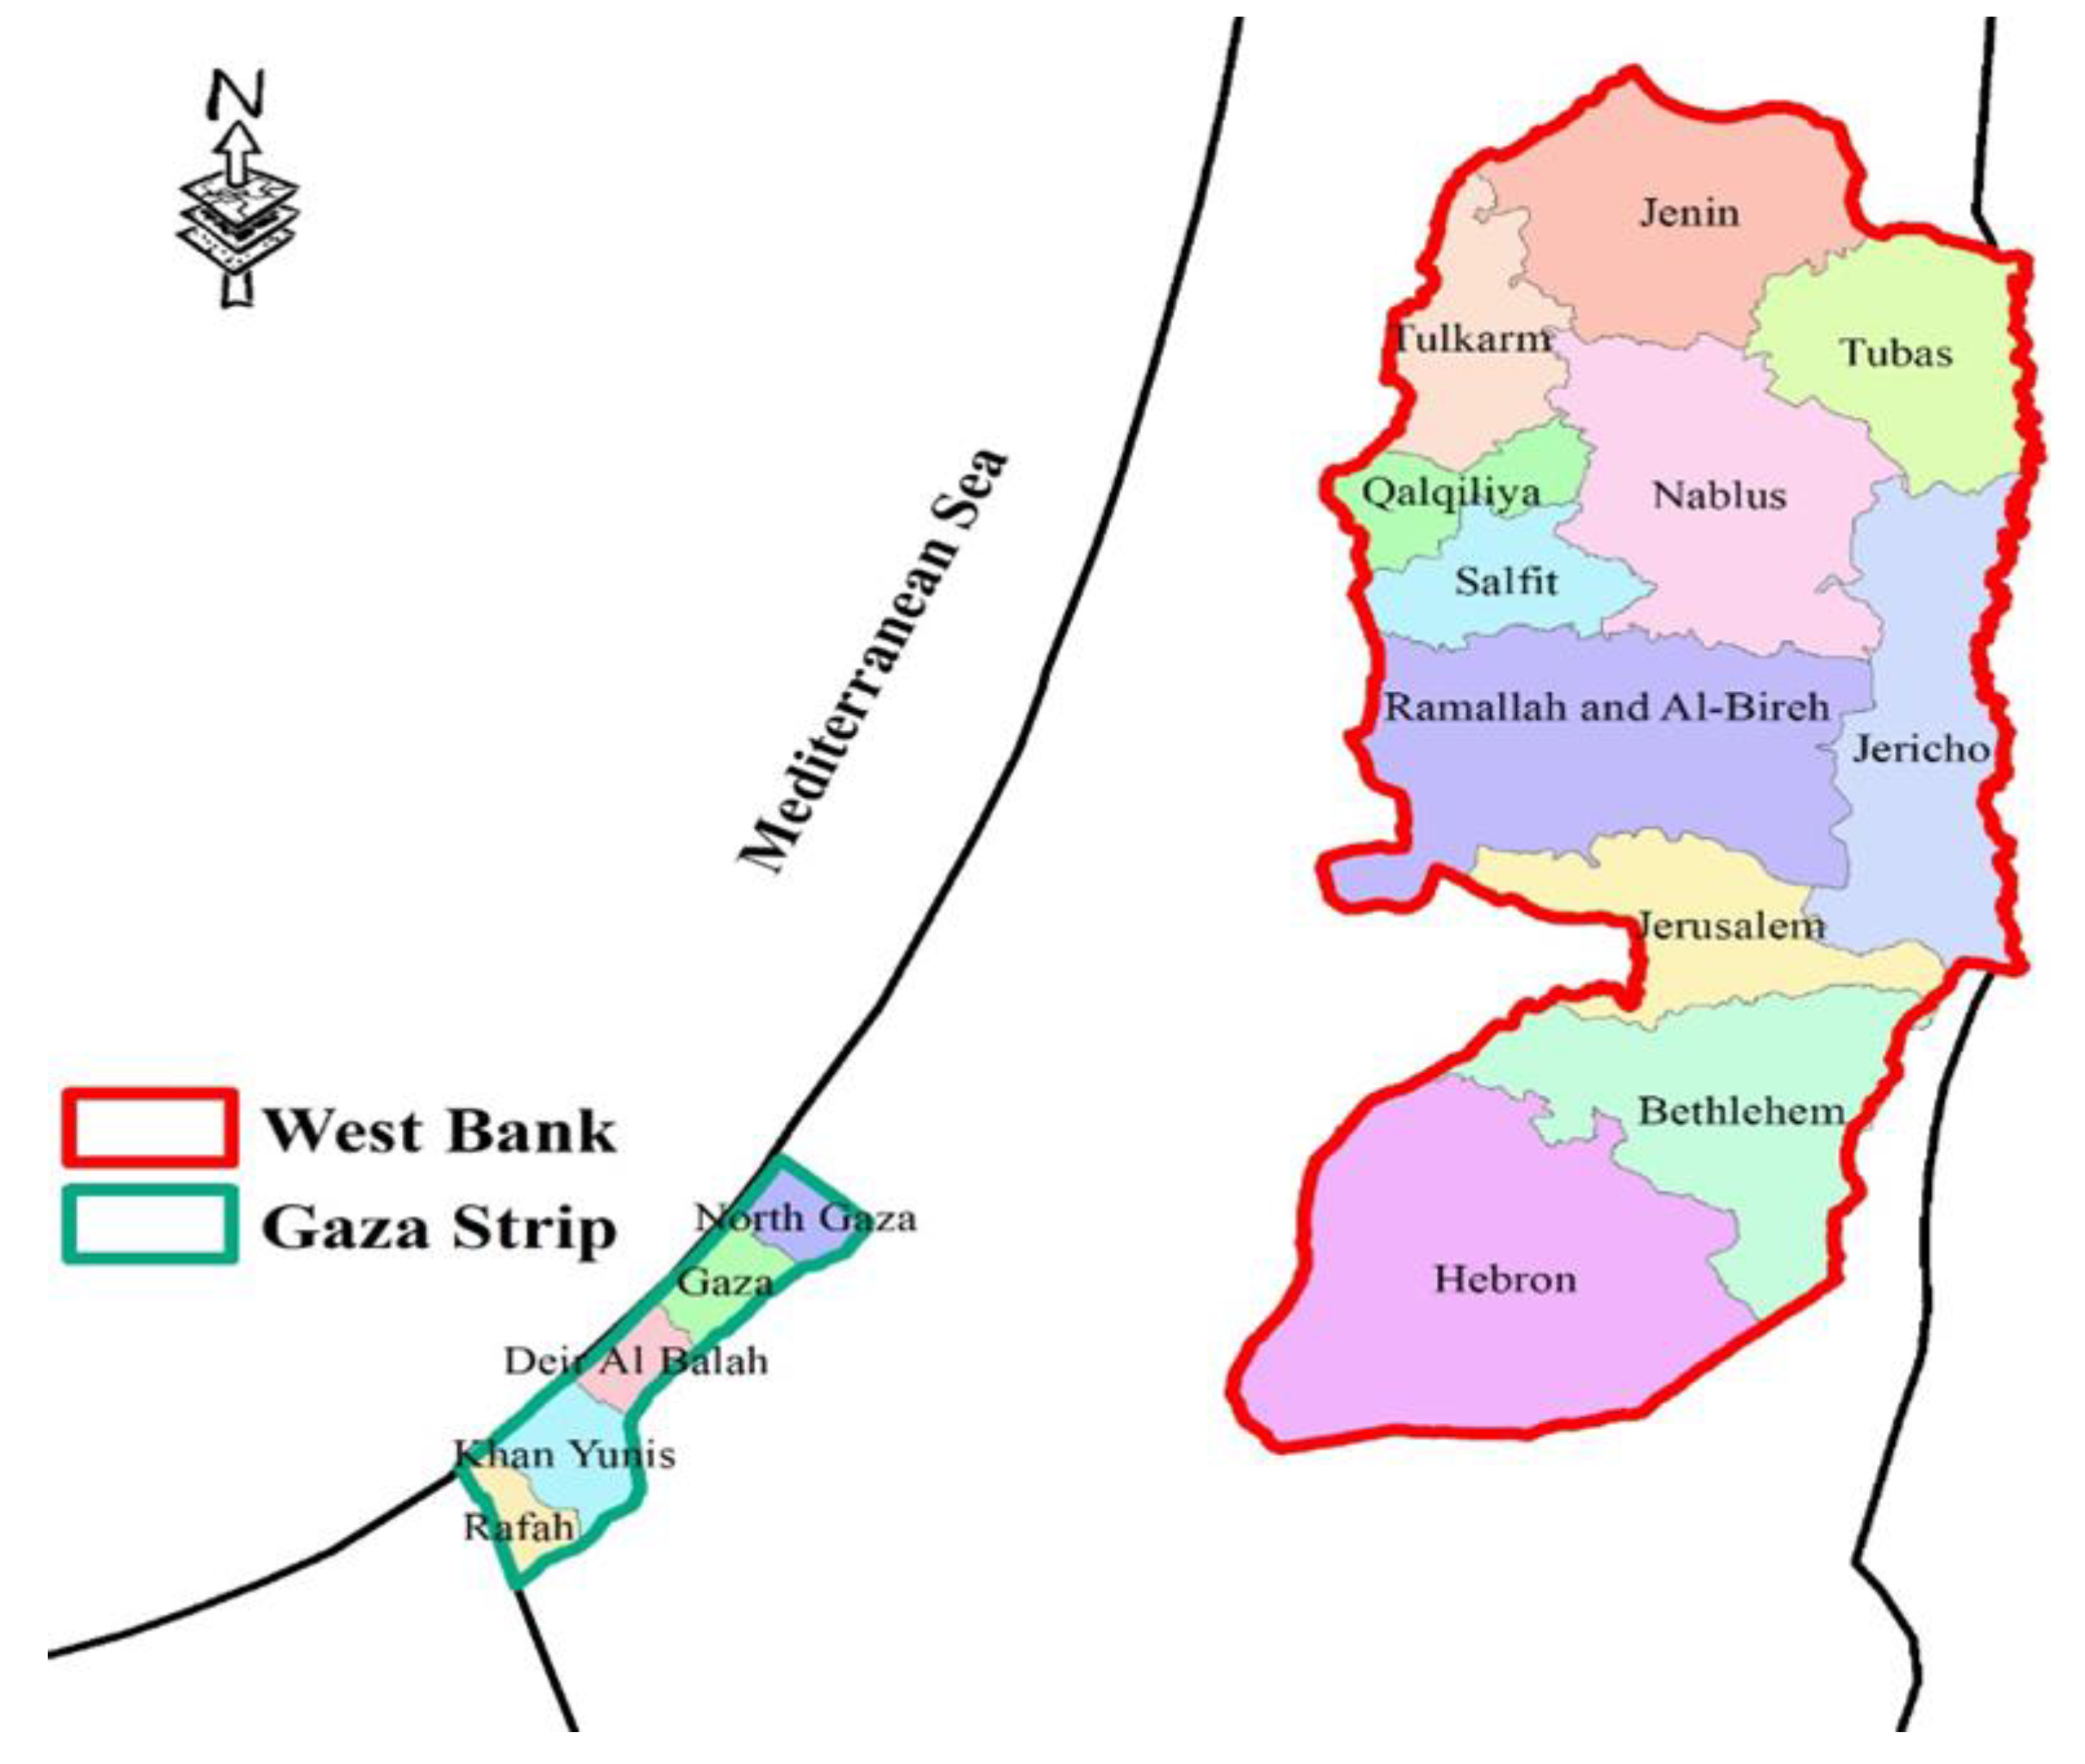
2.2. Data Collection and Site Description (31°53′ N 35°13′ E)
2.3. Evaluation of Wind Potential
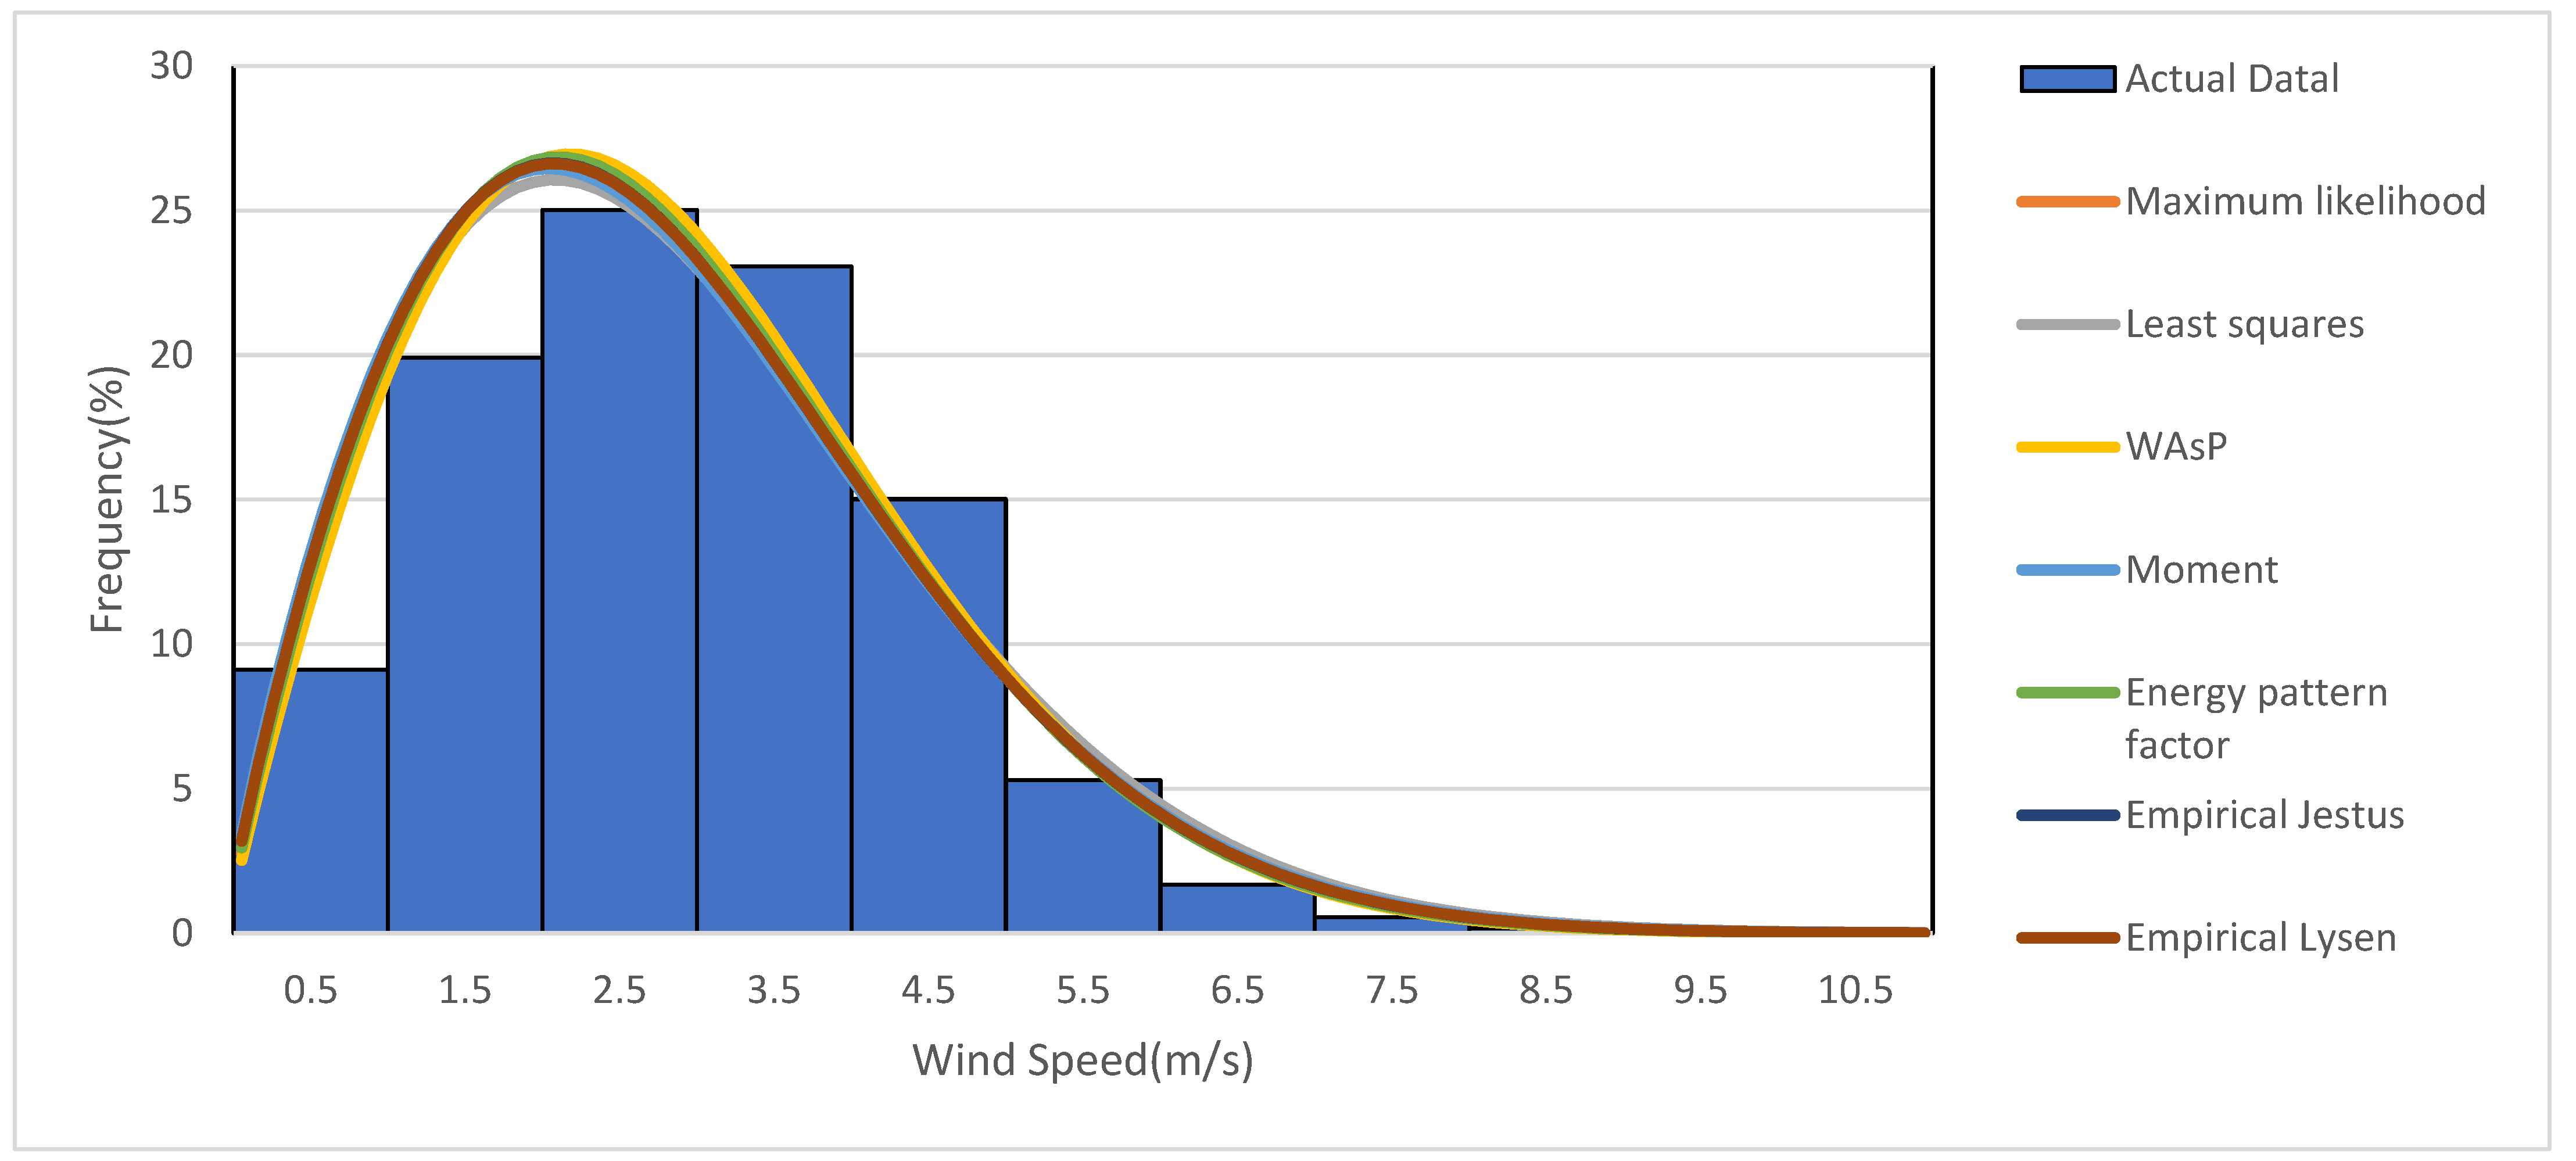
The Different Estimators for Computing the Weibull Parameters
WAsP Method
- (i)
- The fitted mean power density for the Weibull and the mean power density for the observed data must be the same;
- (ii)
- For the observed distribution, any frequency value more than the observed average speed must match the fitted Weibull.
Graphical Method (Least Squares)
Maximum Likelihood Estimator (MLE) Method
Moment Method (MOM)
Energy Pattern Factor Method
Empirical Method of Jesus
Empirical Method of Lysen
2.4. Methodology
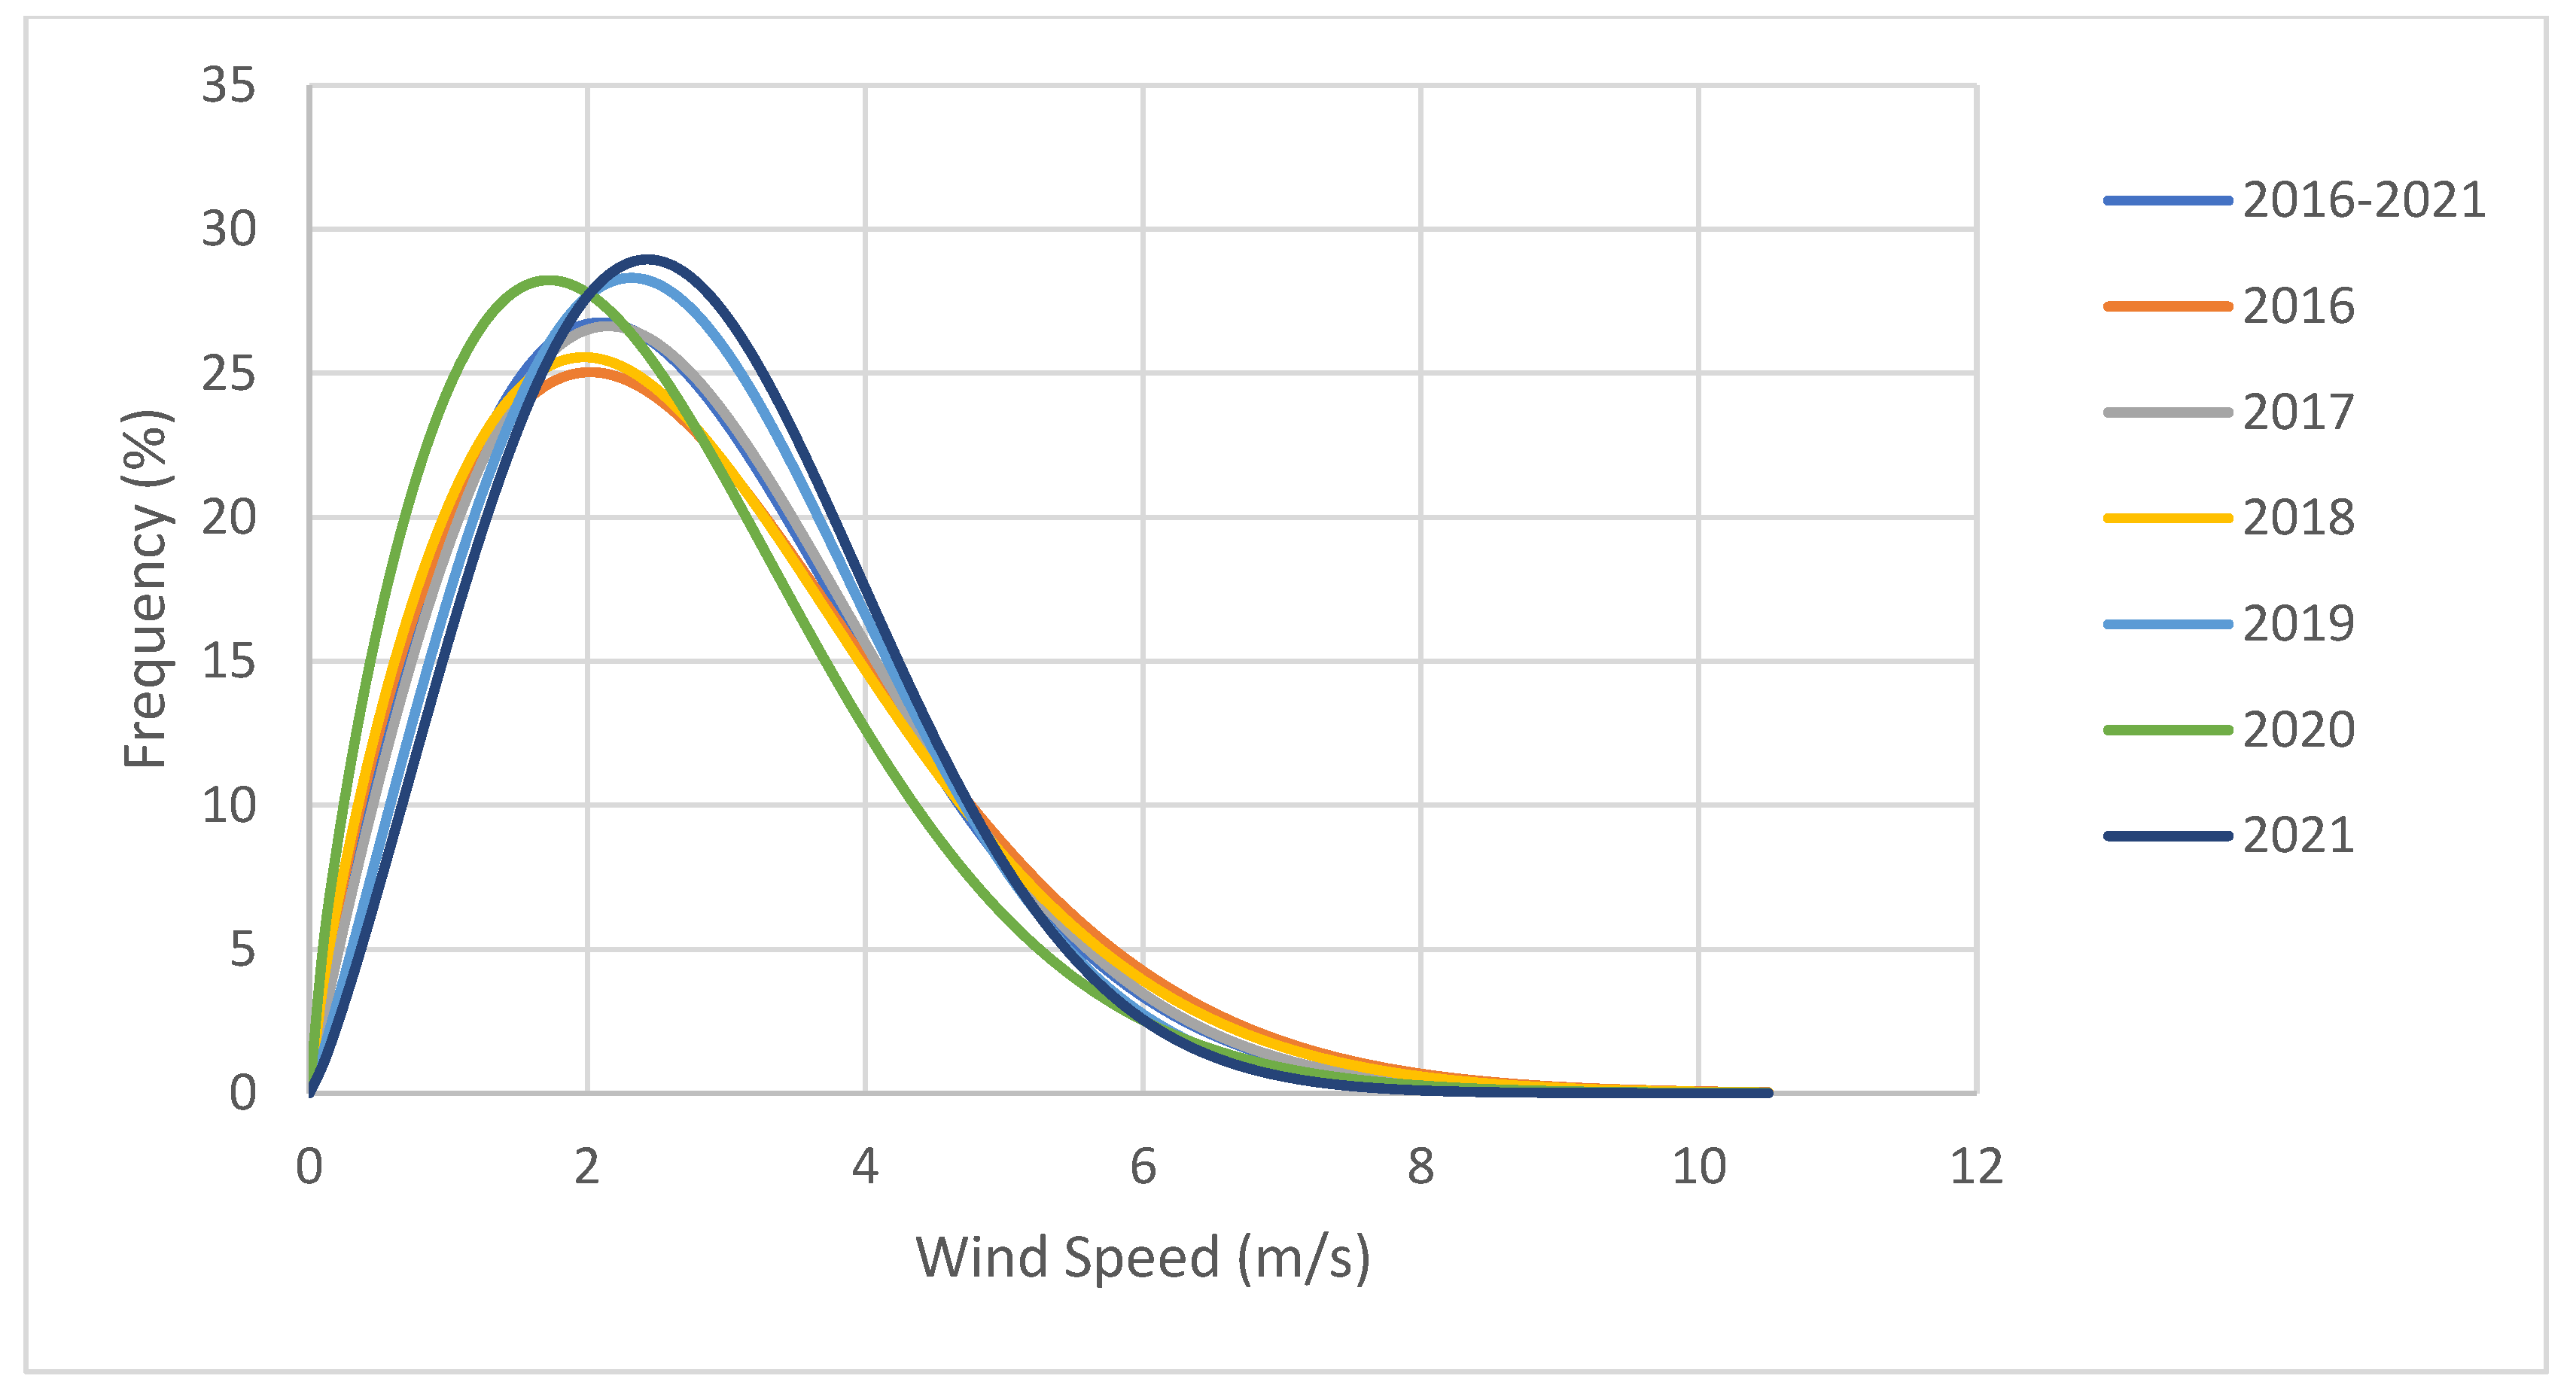
2.4.1. Wind Speed Statistics
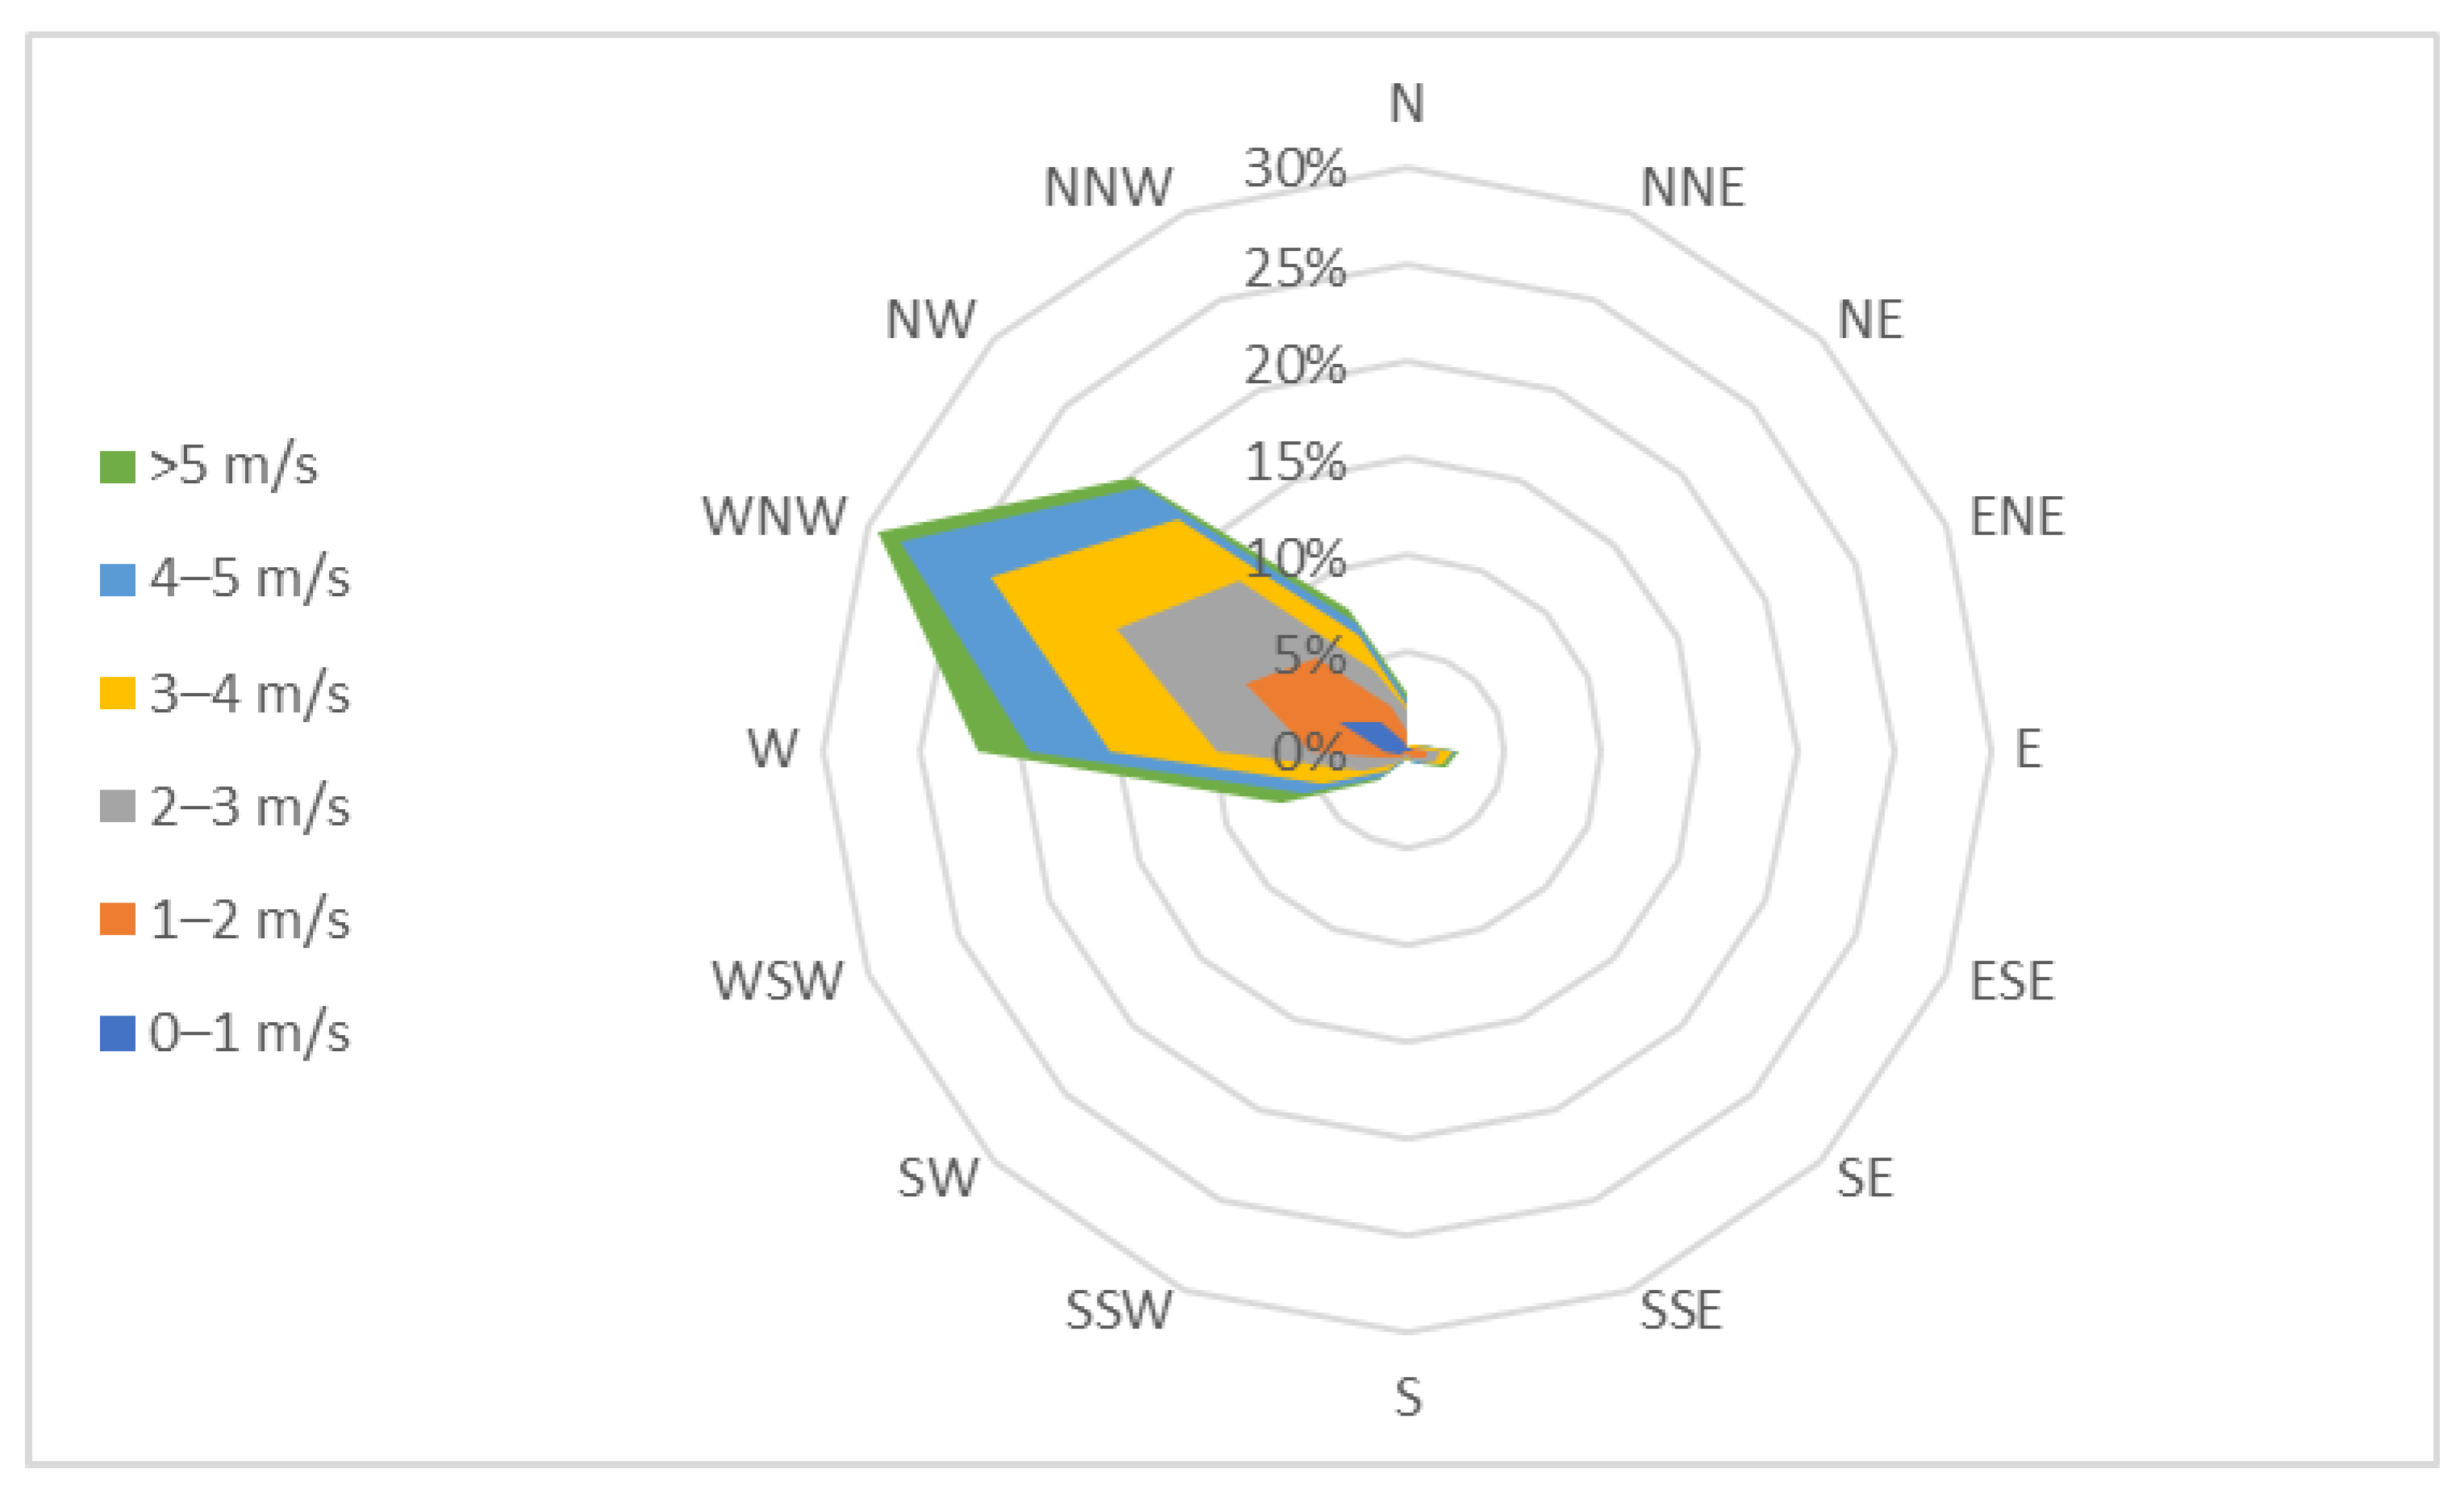
2.4.2. Wind Direction
2.4.3. Goodness-of-Fit Tests
2.4.4. Wind Speed Fluctuation with Altitude
2.5. Estimation and Investigation of Wind Power
2.5.1. Wind Power Density
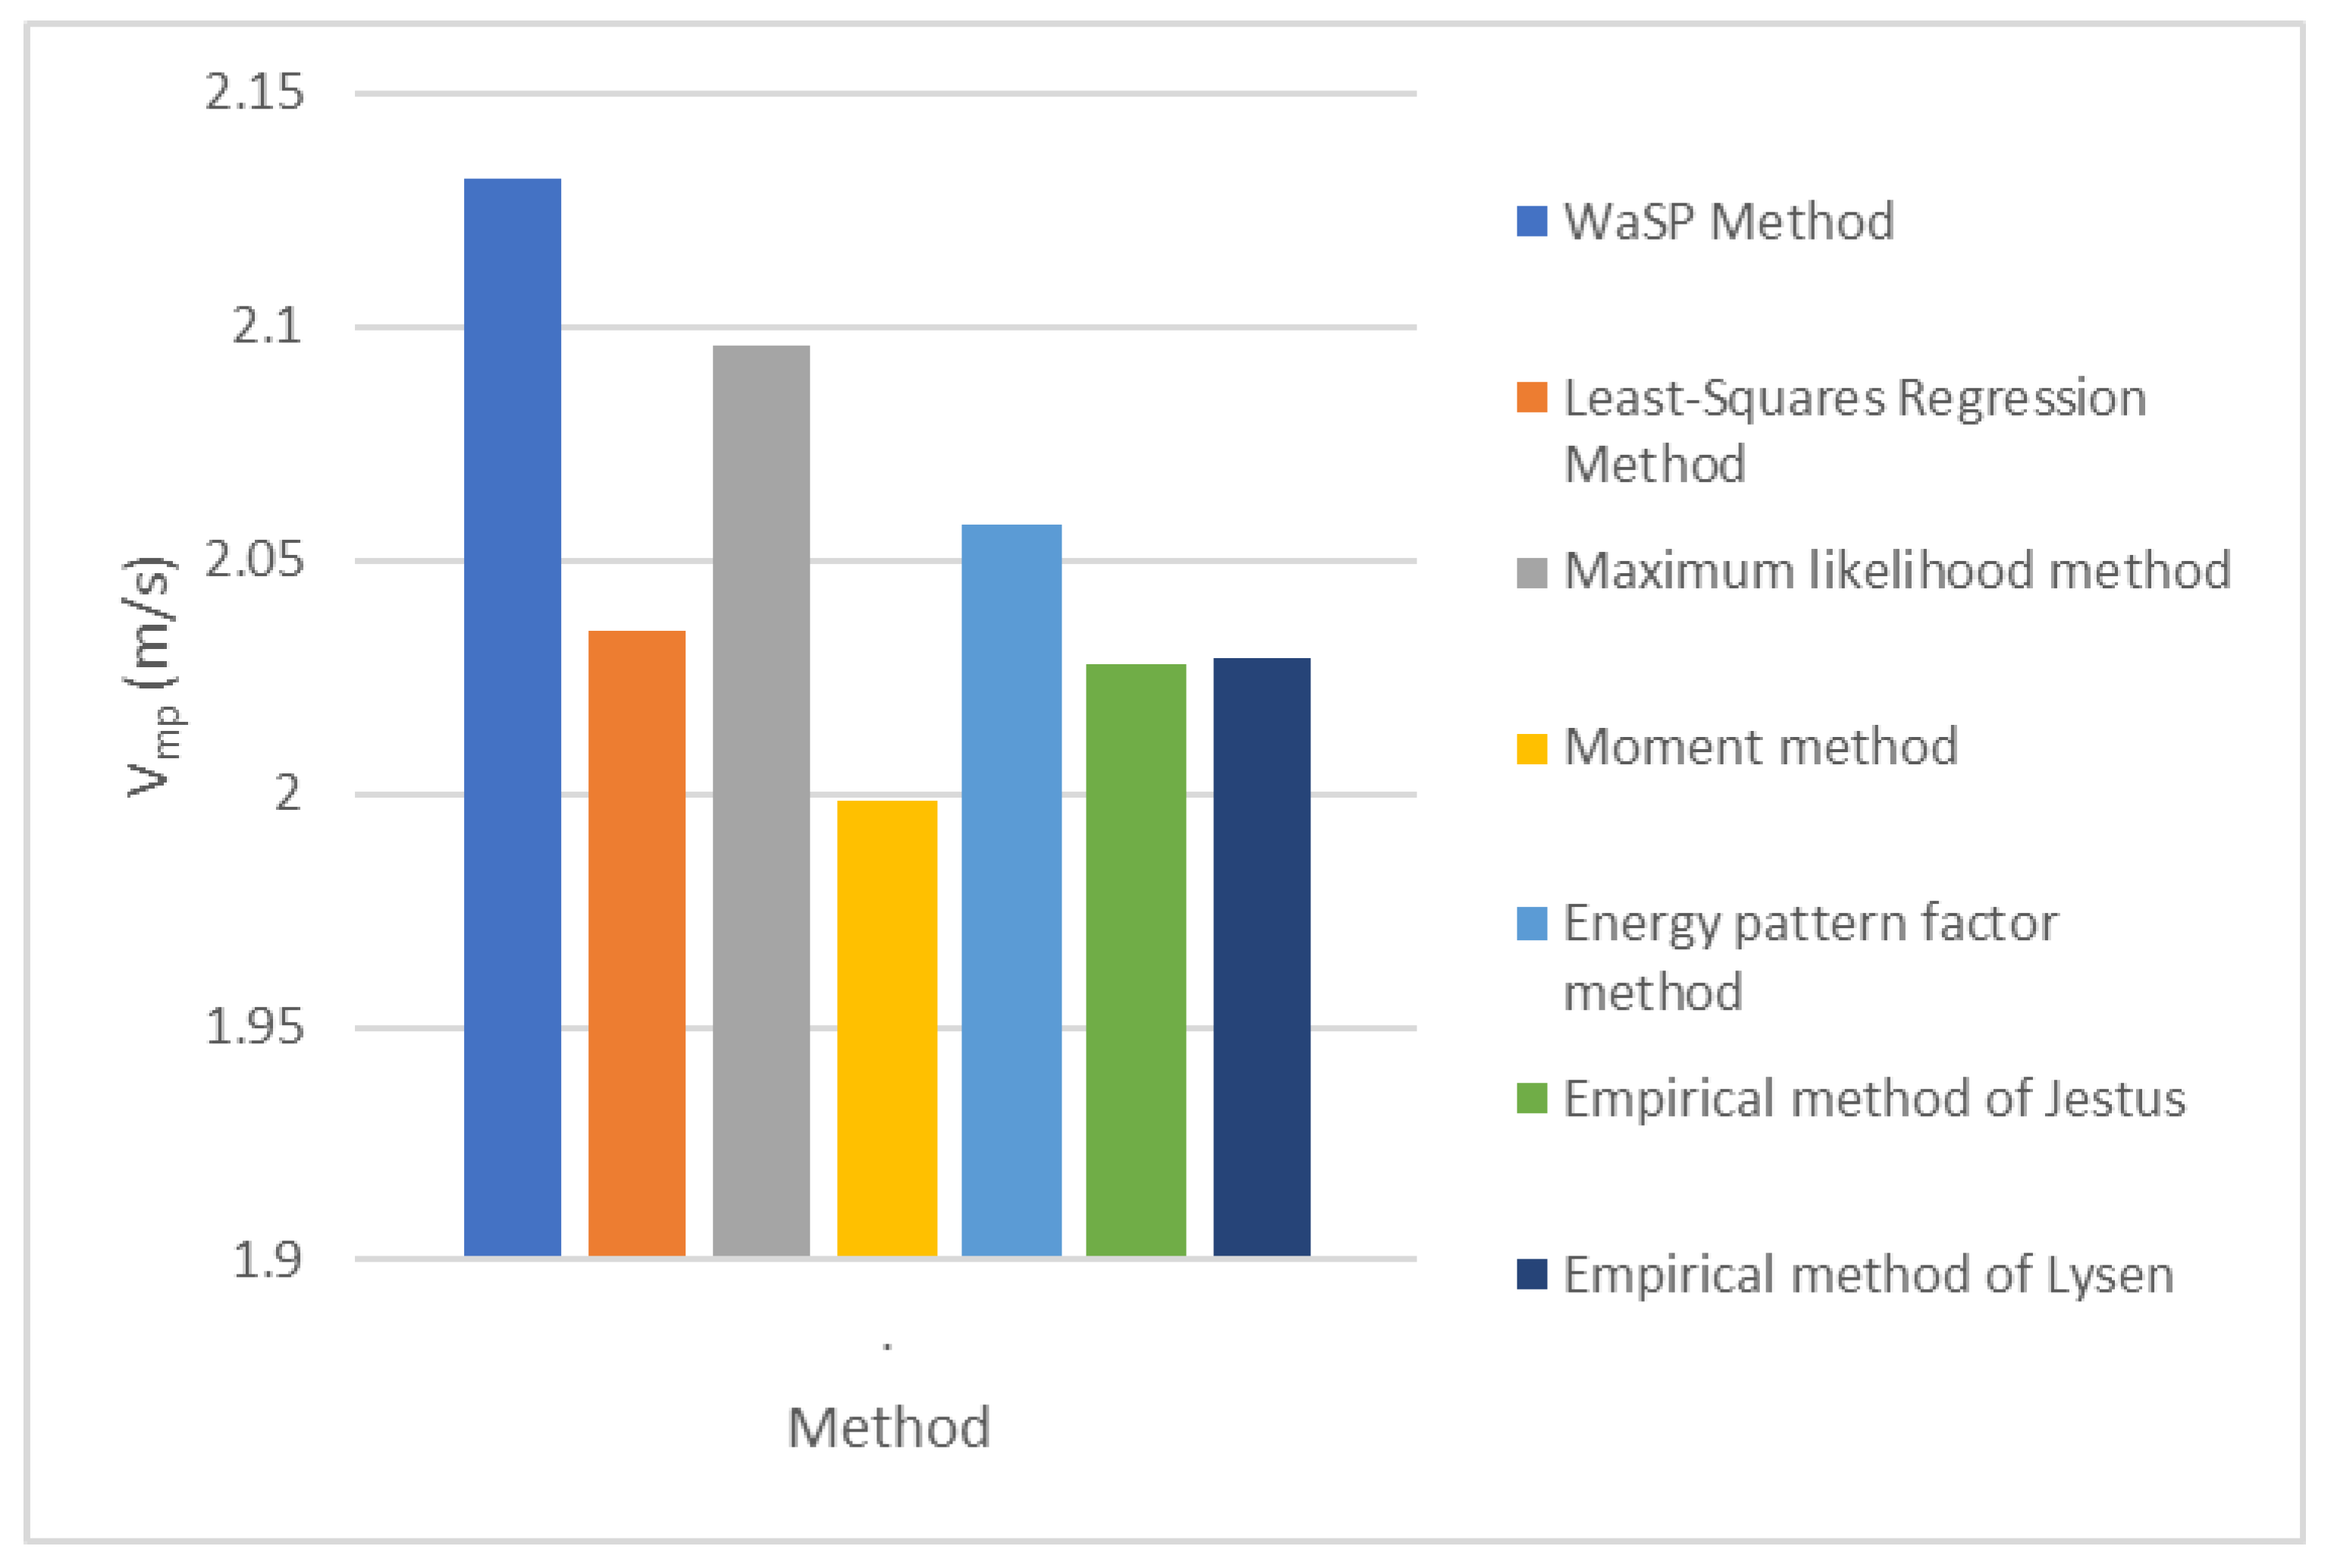
2.5.2. The Most Probable Wind Speed (Vmp)
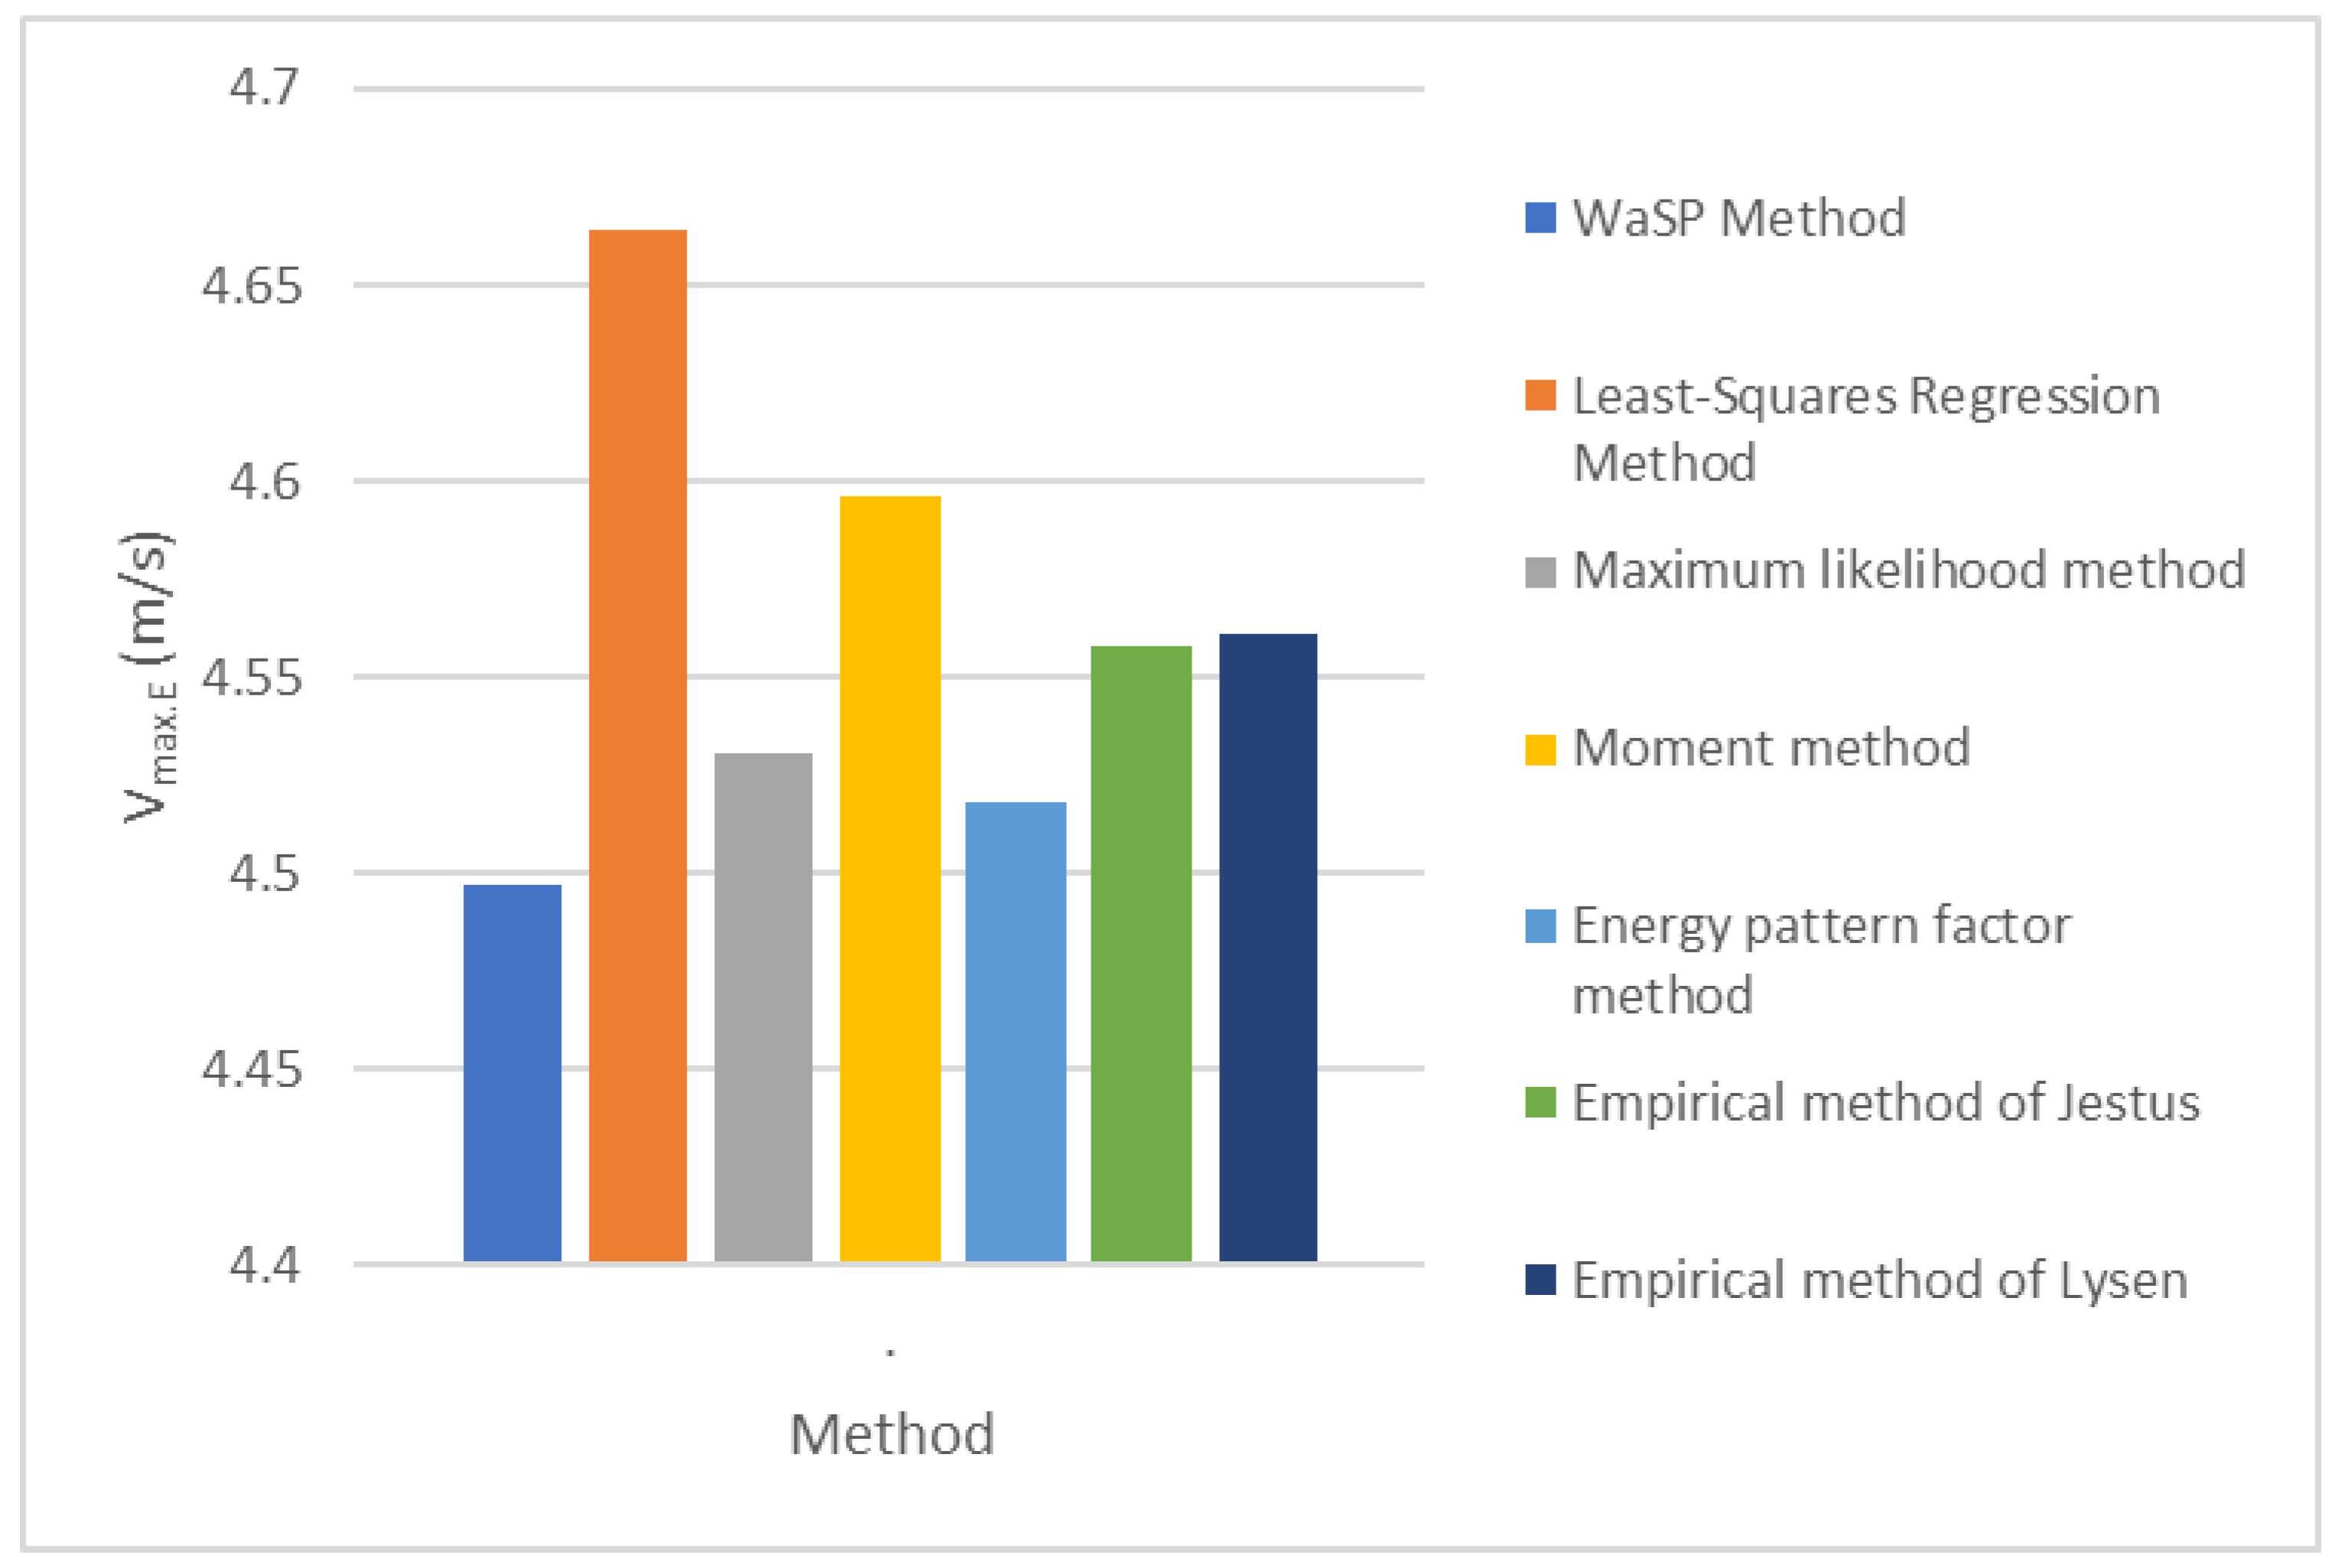
2.5.3. Wind Speed Carrying Maximum Energy (Vmax,E)
2.6. Energy Output and Environmental, Technical, and Financial Feasibility Study for Different Commercial Wind Turbines by RETScreen
3. Results
4. Discussion
5. Conclusions
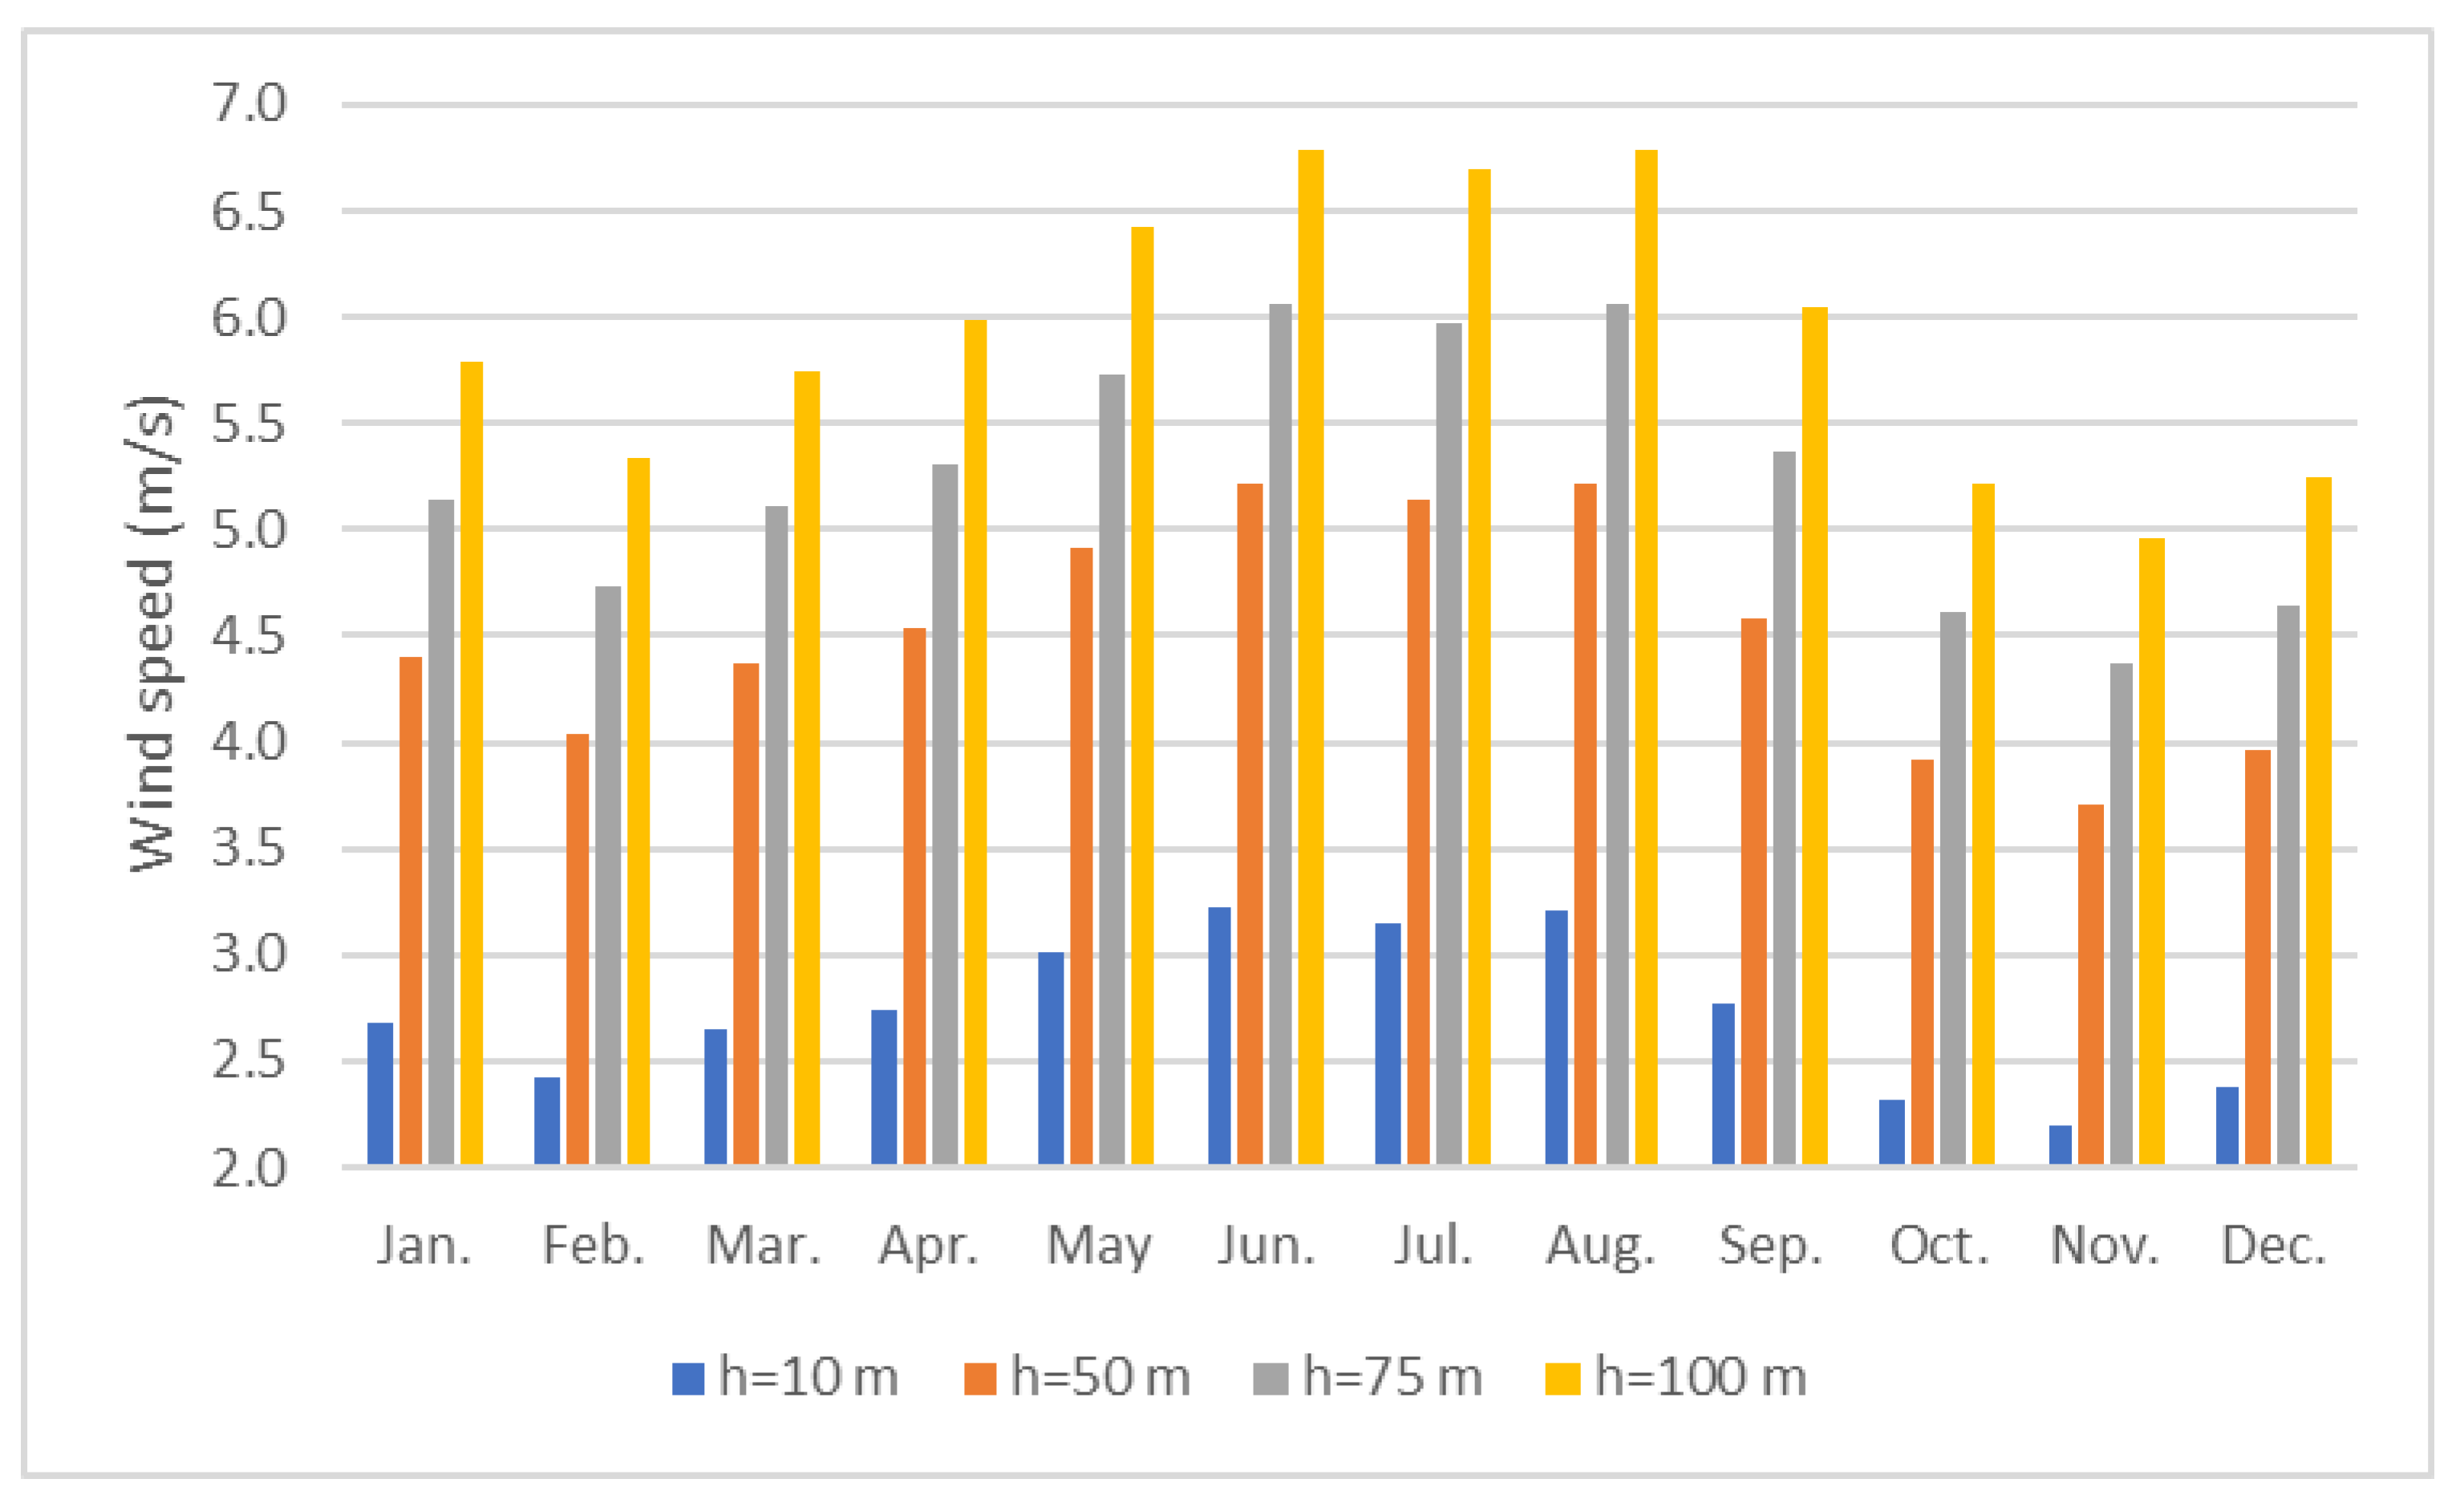
- The mean monthly wind speed varies between 2.20–3.22 m/s at 10 m heights, 3.71–5.22 m/s at 50 m, 4.37–6.06 m/s at 75 m, and 4.95 and 6.79 m/s at 100 m;
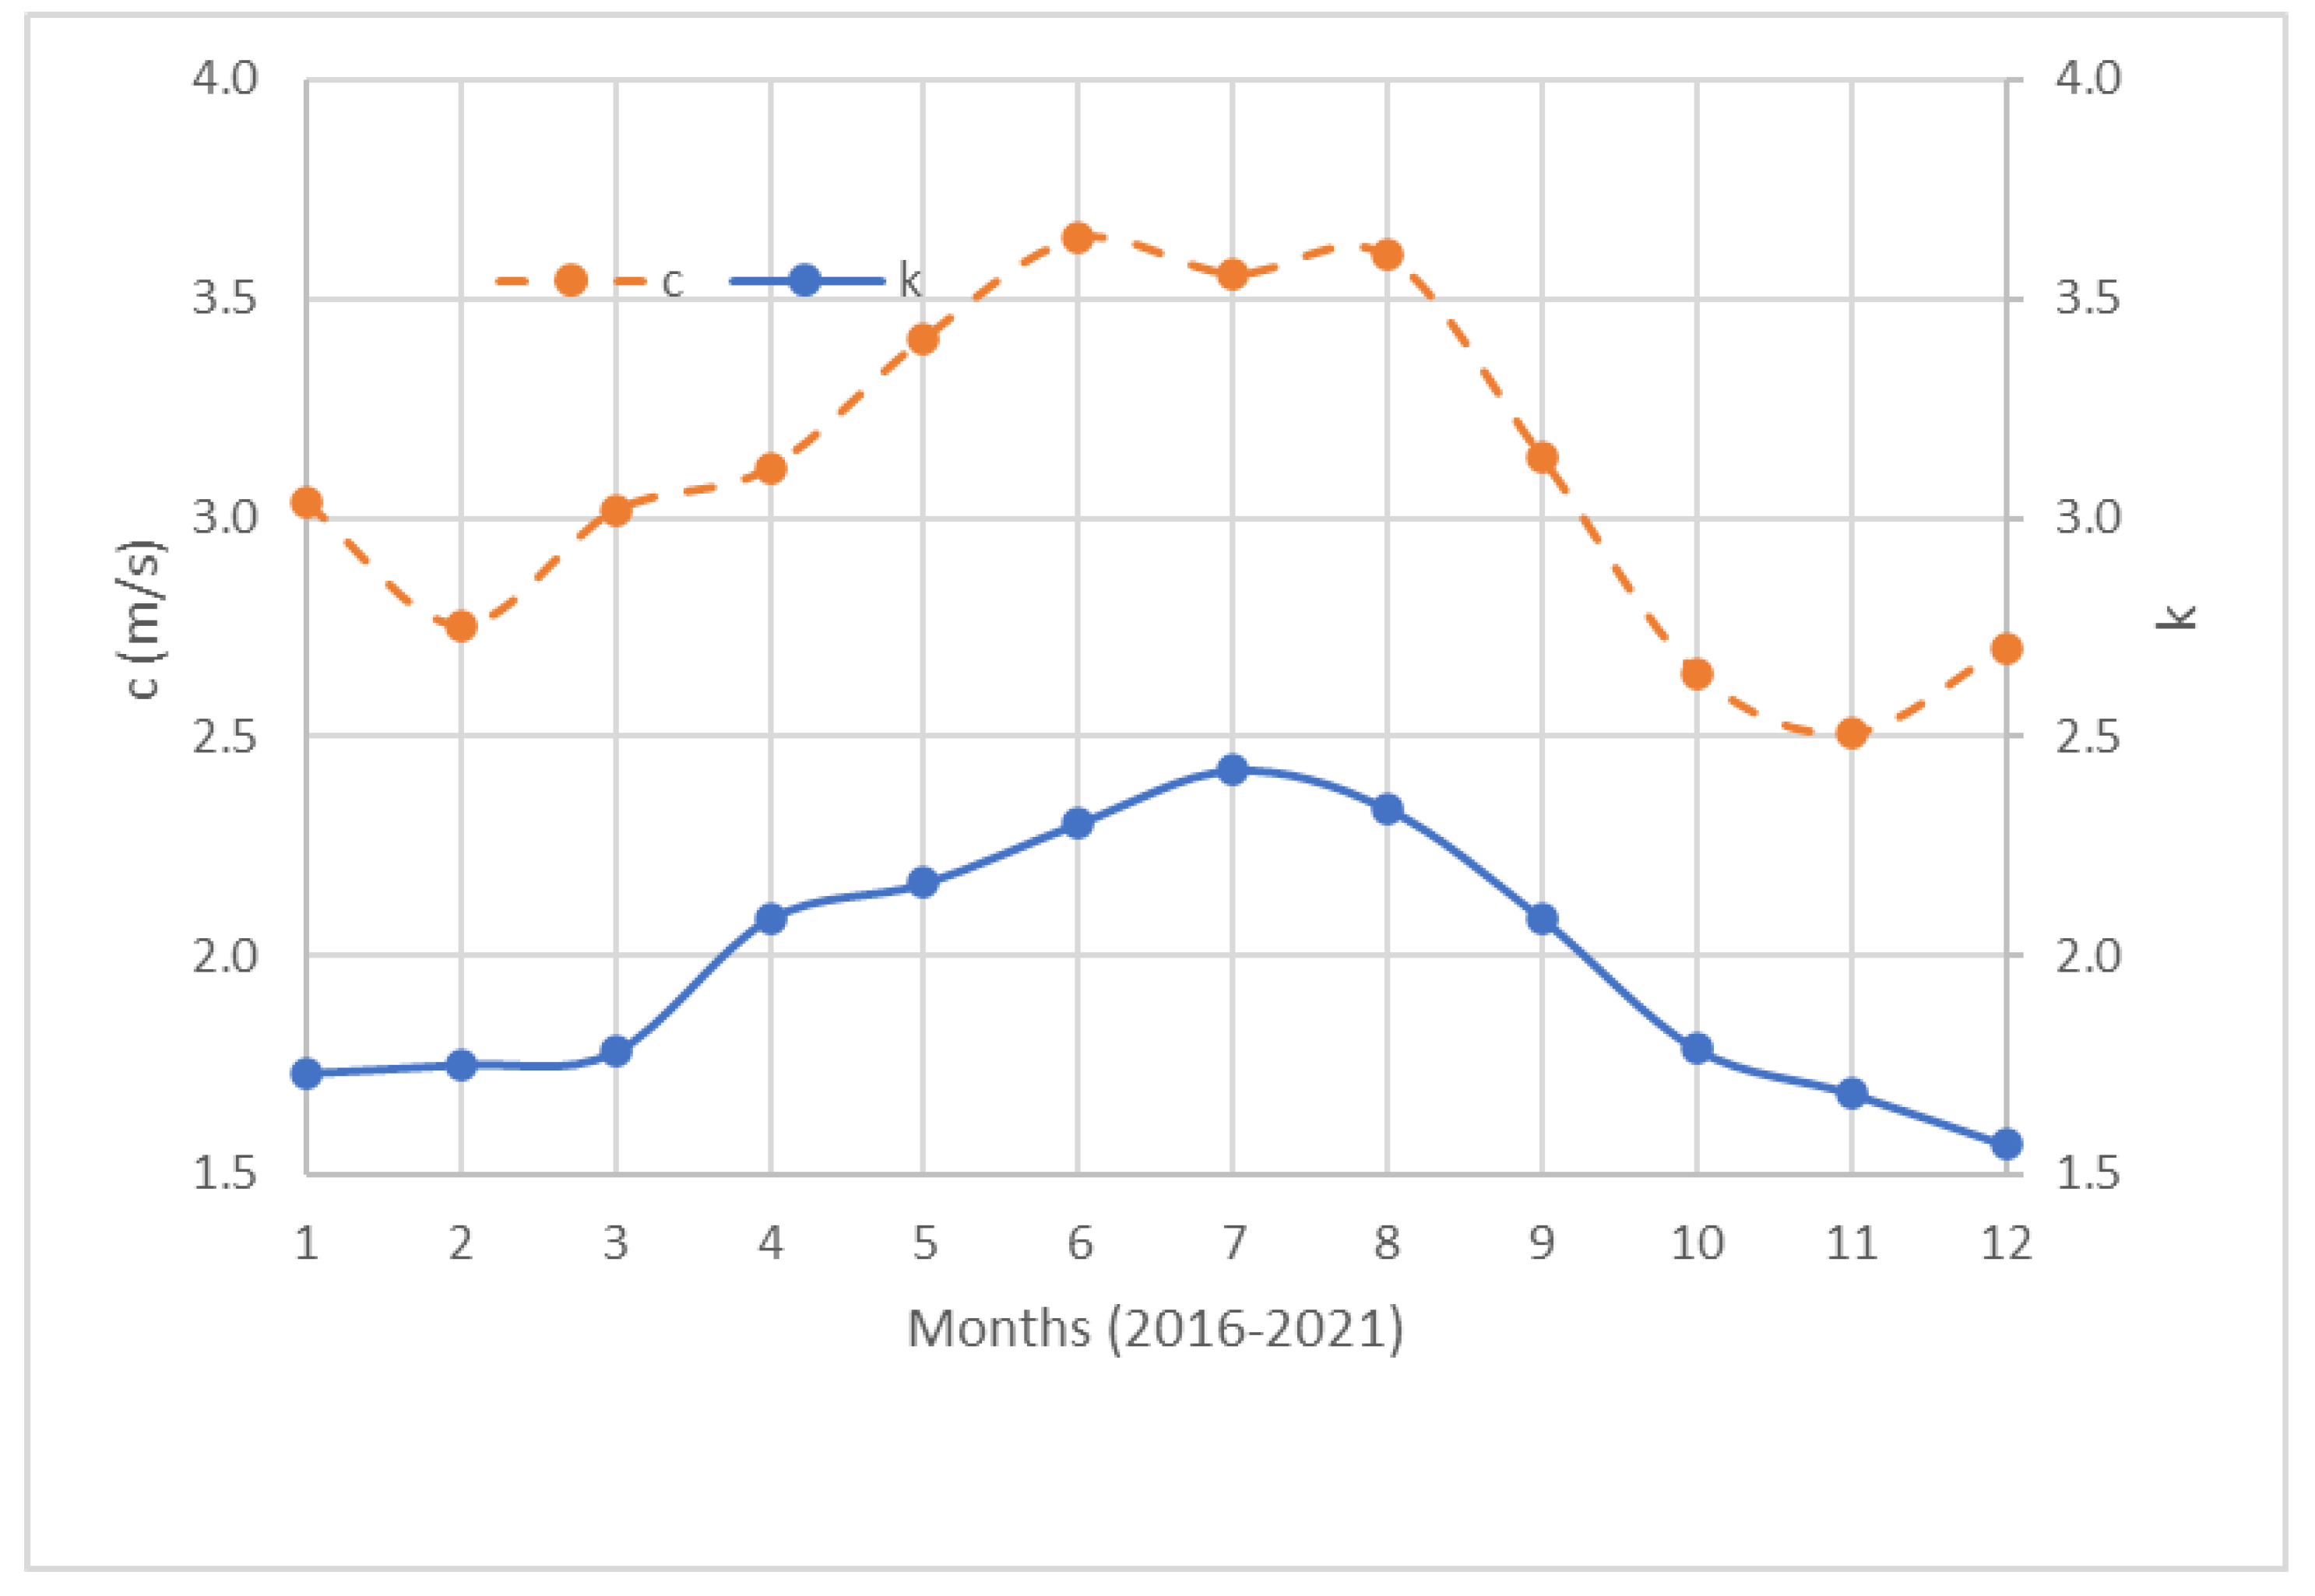
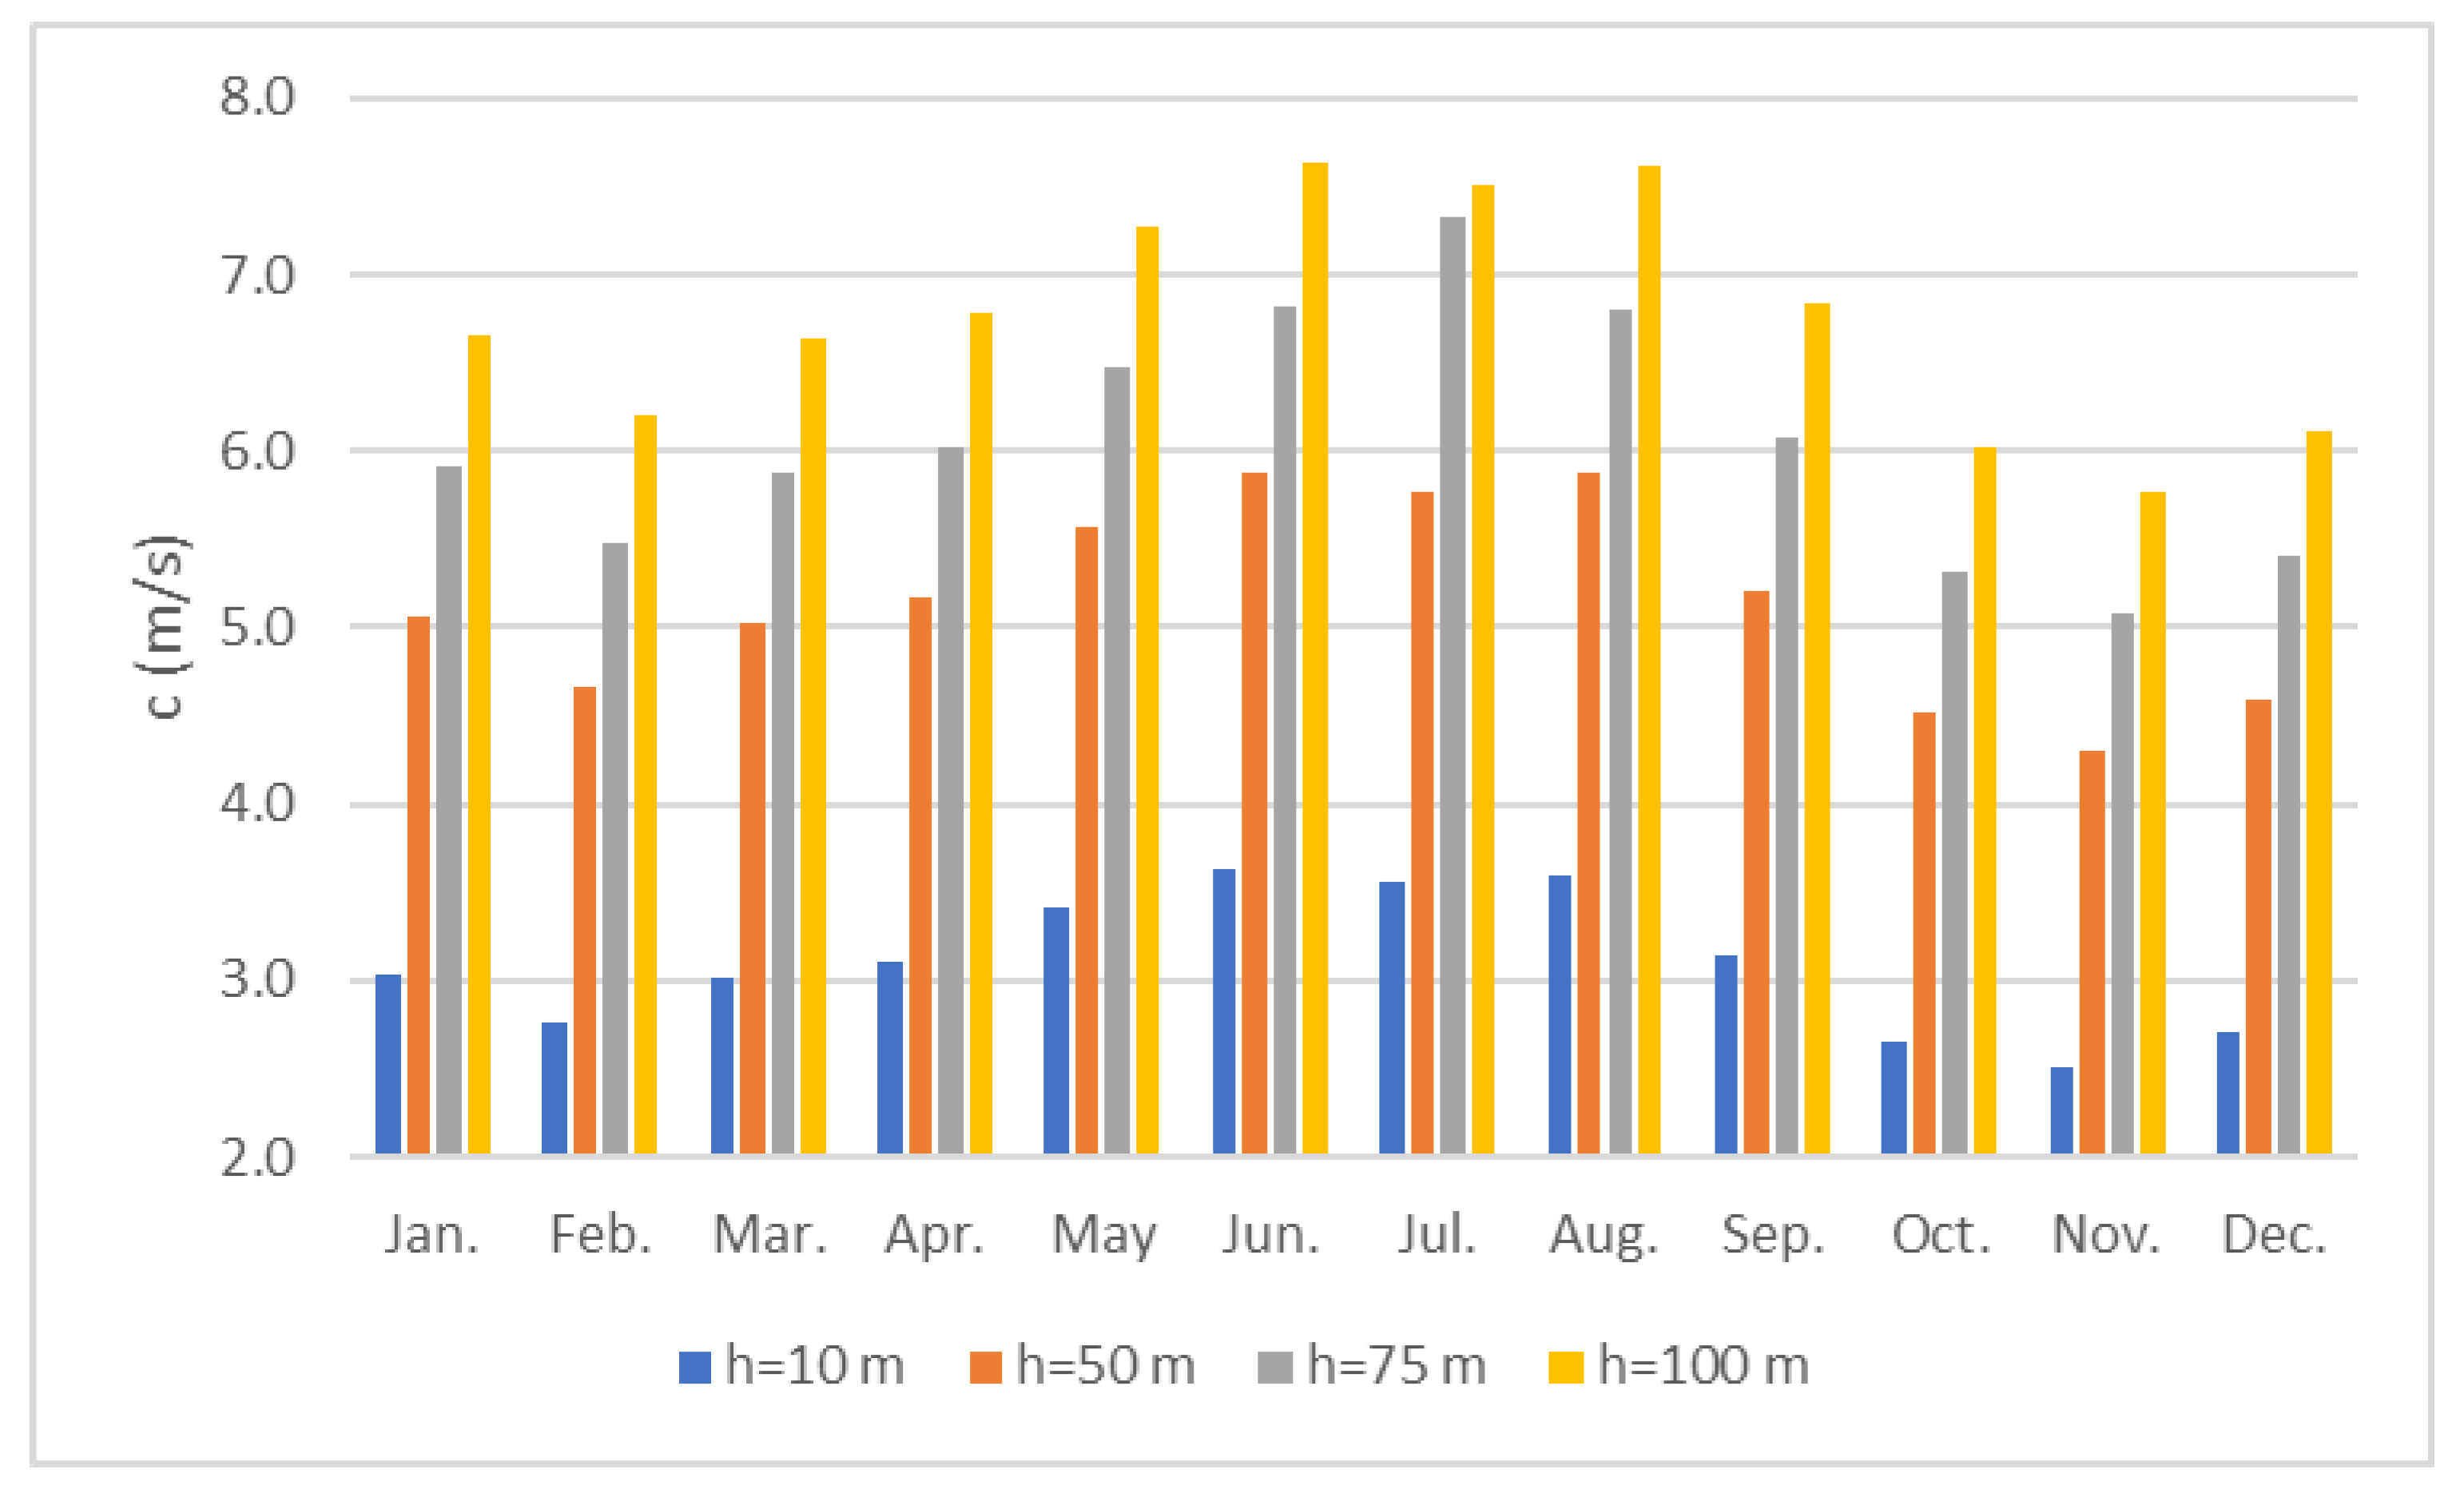
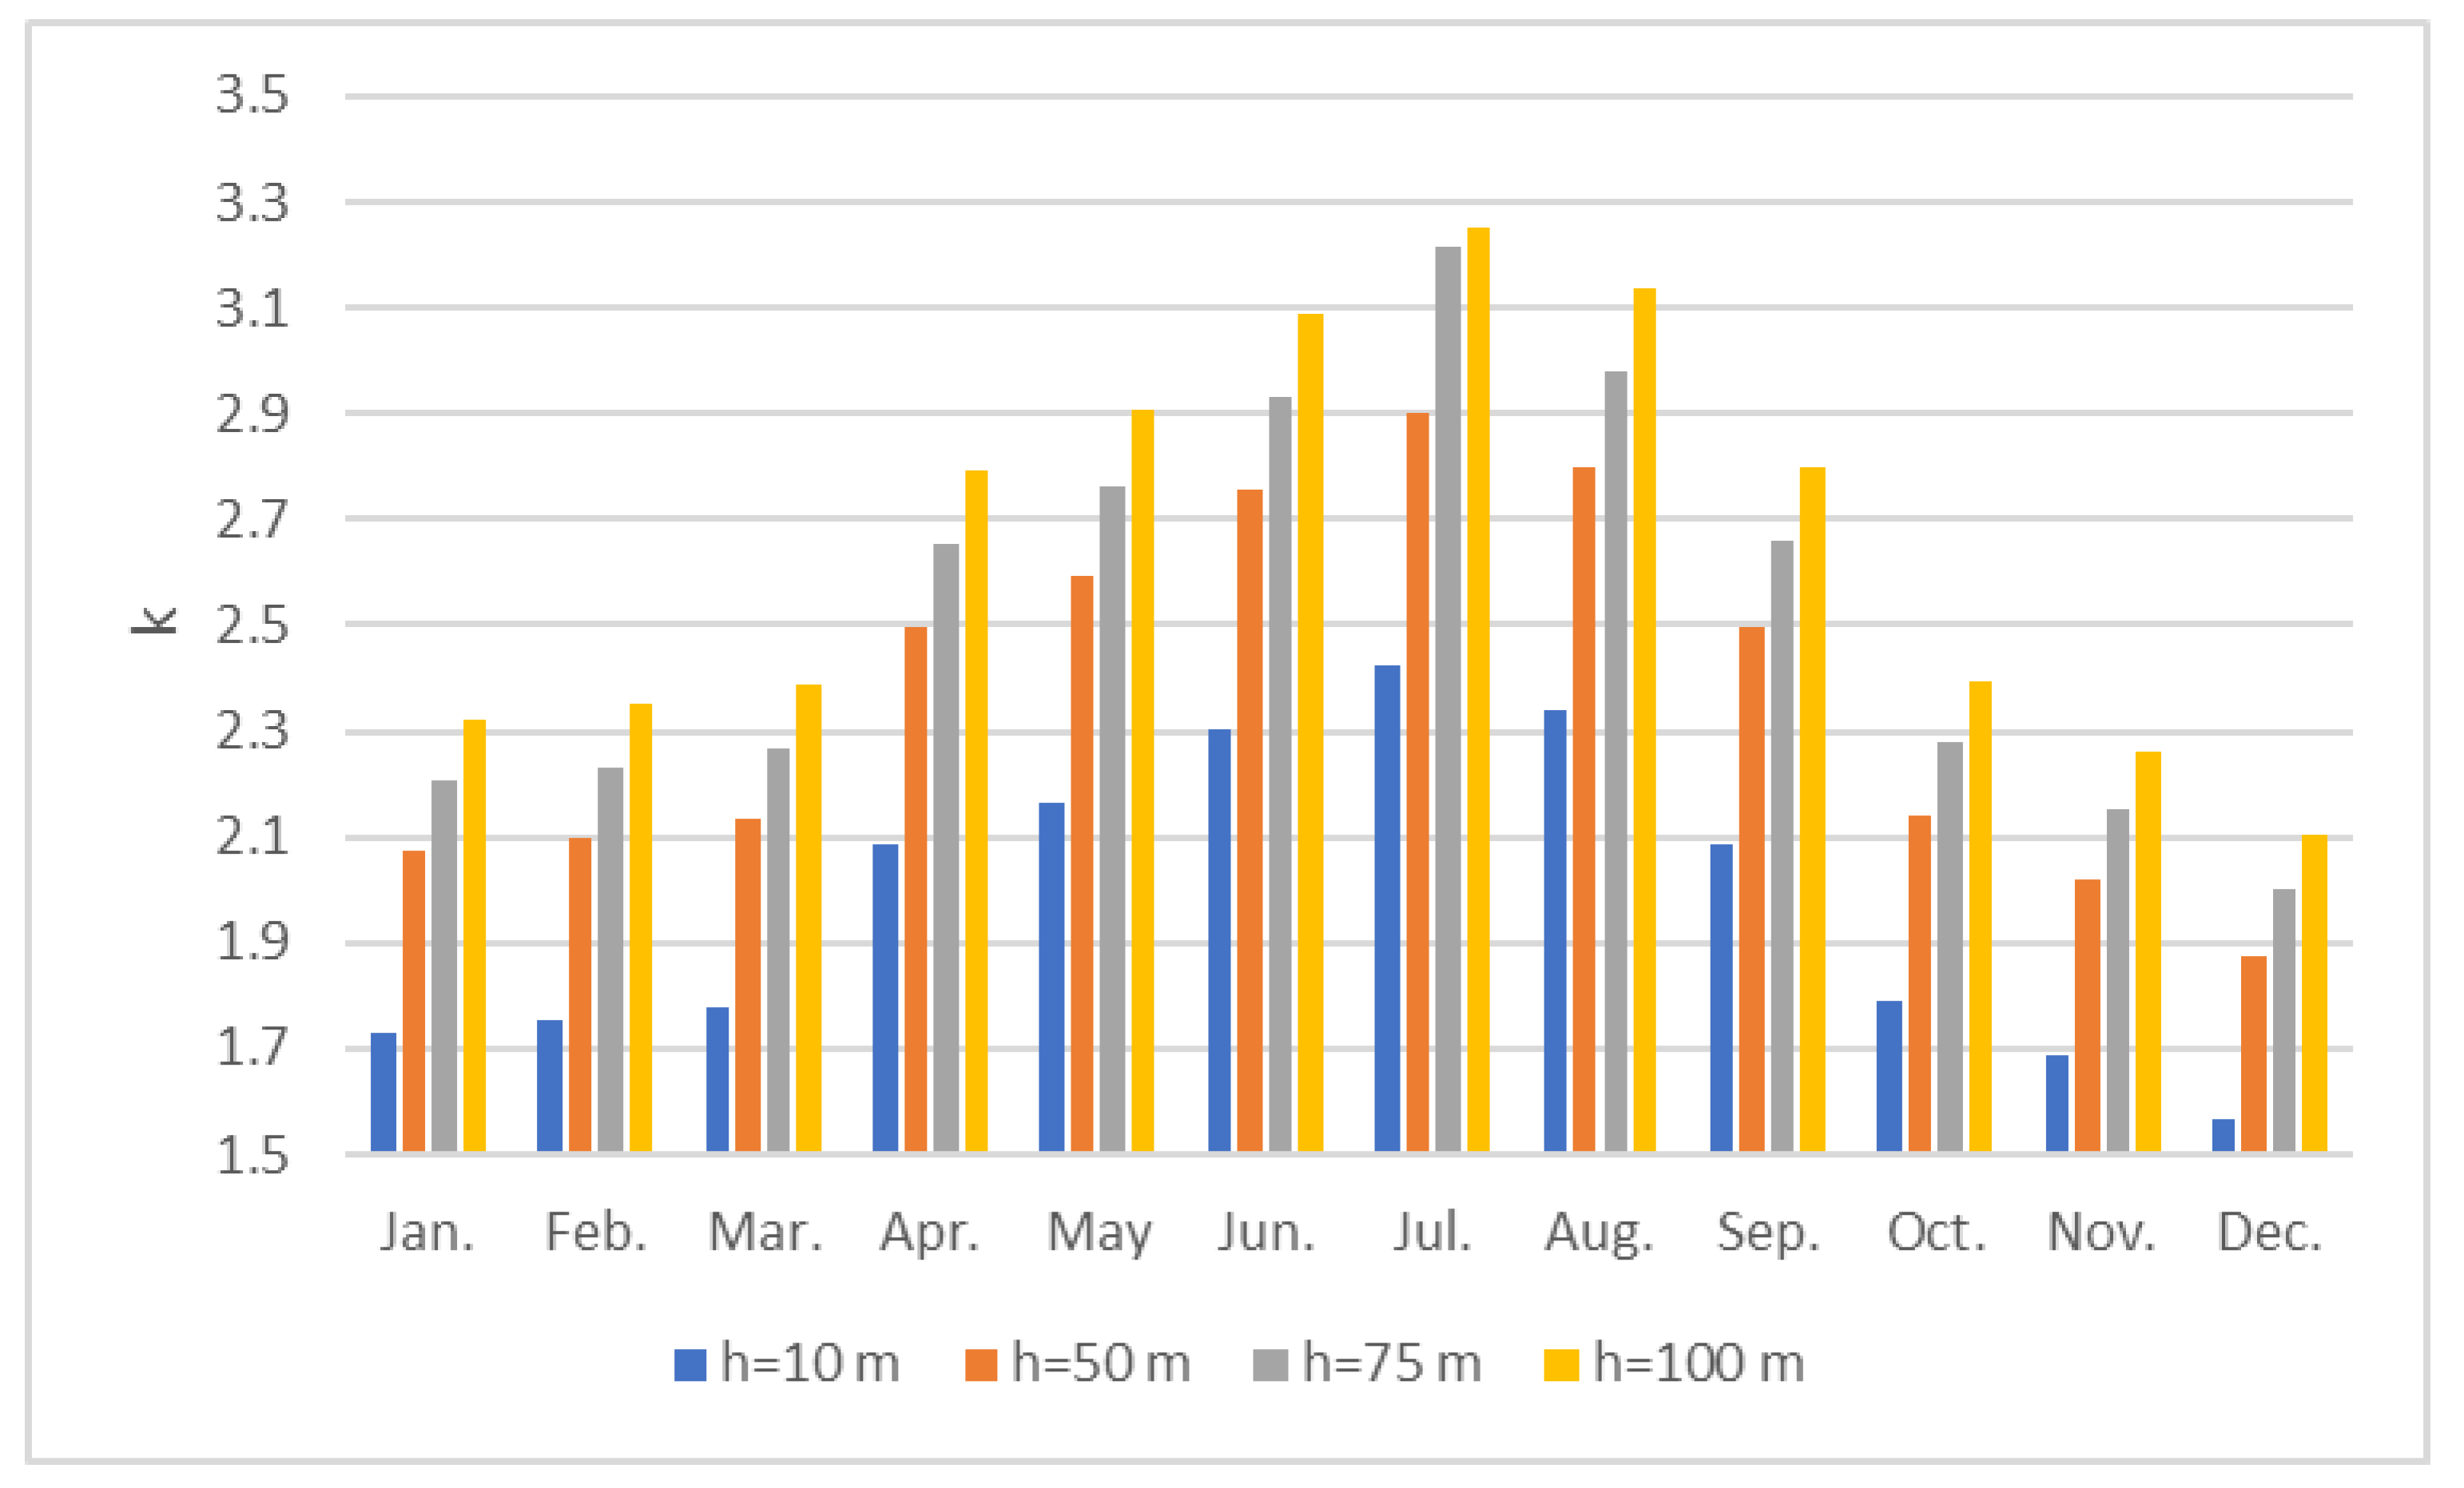
- The variations of k and c were calculated to be in the range of 1.88–2.9 and 4.31–5.88 m/s respectively at 50 m, 2.00–3.22 m/s, and 5.09–6.82 m/s respectively at 75 m, and 2.1–3.25and 5.78–7.63 m/s, respectively, at 100 m;
- The main wind direction in Ramallah was from the west-northwest (WNW) with 29.5% of occurrence;
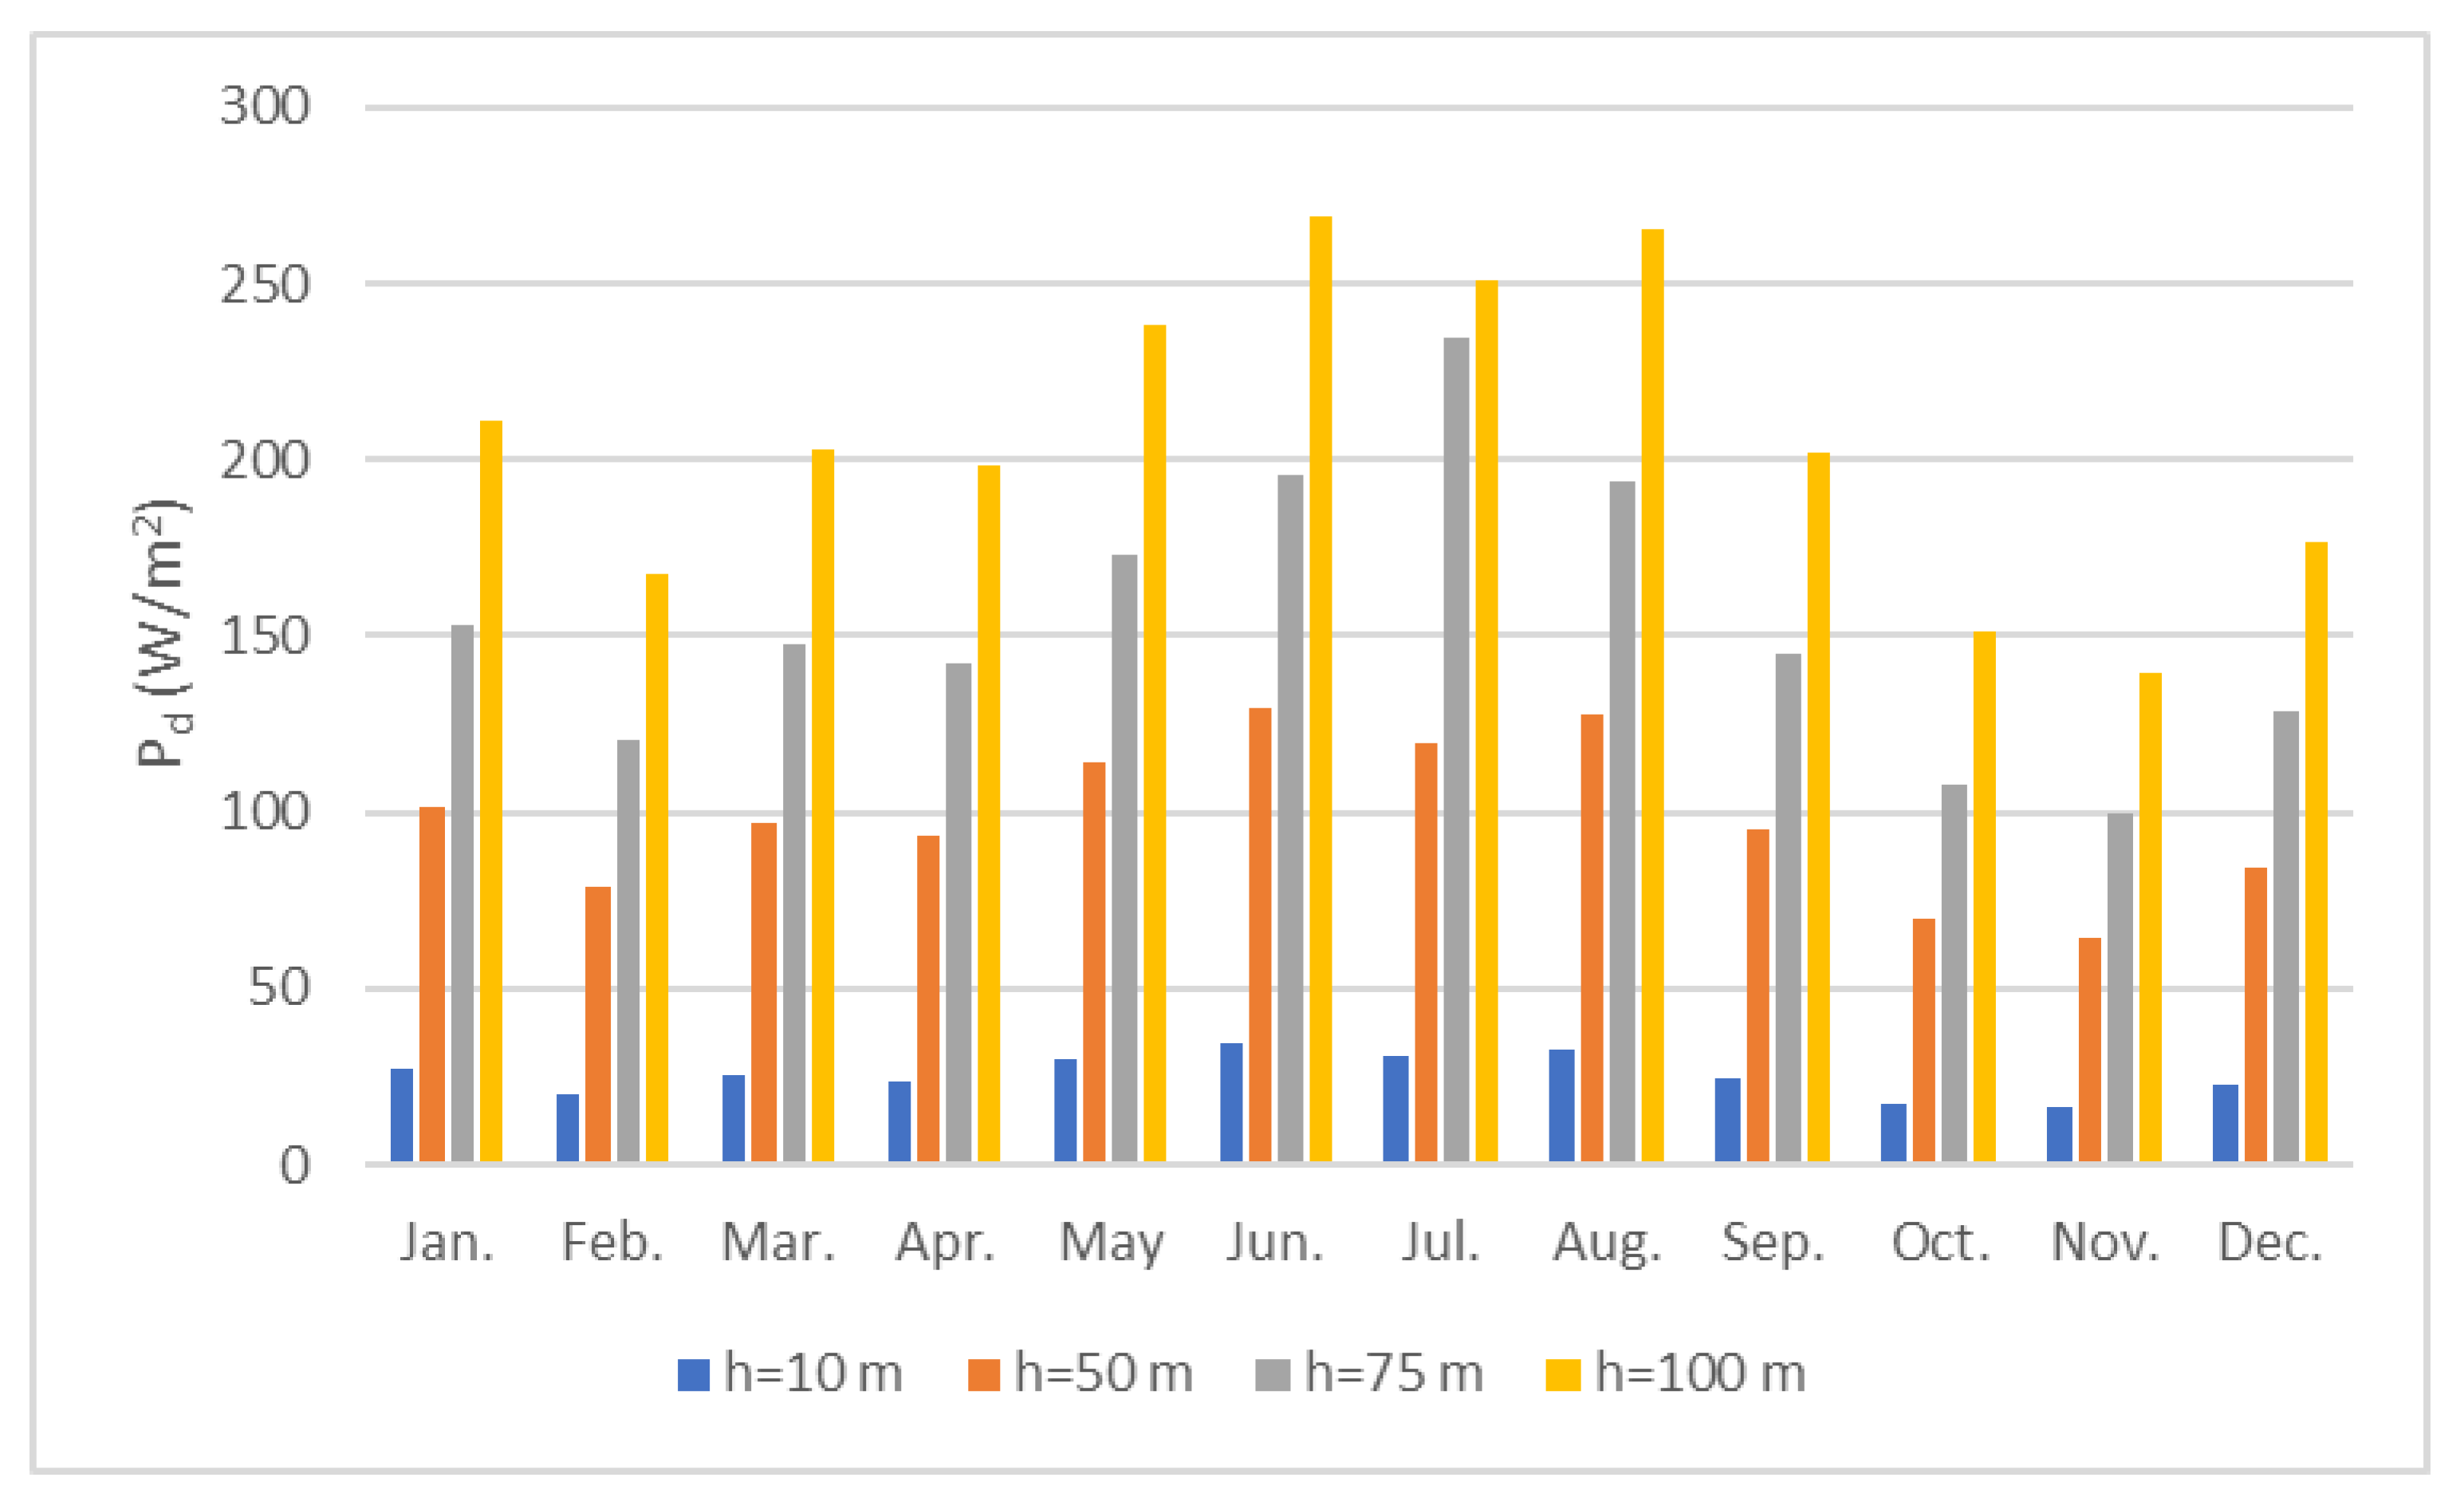
- The summer months have the highest power density and reach 129.9 at 50 m, 196.0 at 75 m, and 268.9 W/m2 at 100 m;
- Cf for the fifteen selected wind turbines was found to vary from 16% to 36%;
- Among the fifteen wind turbines studied, it was found that wind to energy W2E103/2500-160m has the highest capacity factors about 36%;
- For a cost-effective investment in wind energy, only five turbines could be suitable in Ramallah out of the 15 turbines that were studied;
- Wind energy has been found to have a high economic potential at a cost of less than 0.07 $/kWh for an appropriate selection of wind turbine models.
Author Contributions
Funding
Informed Consent Statement
Acknowledgments
Conflicts of Interest
Abbreviations
| WB | West Bank |
| GS | Gaza Strip |
| PNA | Palestinian National Authority |
| Probability density function | |
| c | Weibull scale parameter |
| k | Weibull shape parameter |
| CDF | Accumulative distribution function |
| LRRM | Least-squares regression method |
| MLE | Maximum likelihood estimator |
| MOM | Moment method |
| Epf | Energy pattern factor |
| The upper incomplete gamma function | |
| Mean wind speed | |
| σ | Wind speed standard deviation |
| R2 | Coefficient of determination |
| RMSE | Root mean square error |
| MBE | Mean bias error |
| MAE | Mean bias absolute error |
| α | Surface roughness coefficient |
| Pd | Wind power density |
| Vmp | Most probable wind speed |
| Vmax,E | Wind speed carrying maximum energy |
| O&M | Operation and maintenance costs |
| CF | Capacity factor |
| NPV | Net present value |
| GHG | Greenhouse gases |
| Eout | The yearly energy generated |
| (NREAP) | New renewable energy action plan |
| GWh | Gigawatt hours |
| $/KWh | United States dollar per kilowatt hours |
| tCO2 | Tons of Co2 |
| $ | United States dollar |
| kW | Kilowatt |
Appendix A

| Characteristic | Value |
|---|---|
| Array losses | 2% |
| Airfoil losses | 2% |
| Miscellaneous losses | 6% |
| Availability | 98% |
| Initial costs | 1450 $/KW |
| O&M costs (savings) | 40 $/KWh |
| Electricity export rate $/KWh | 0.17 |
| Pressure Coefficient | 0.971 |
| Temperature Coefficient | 0.996 |
| Losses Coefficient | 0.88 |
| Transmission and distribution (T&D) losses | 7% |
| GHG emission factor (excl. T&D) | 0.493 |
| Fuel cost escalation rate | 2% |
| Inflation rate | 2% |
| Discount rate | 9% |
| Reinvestment rate | 9% |
| Project life | 20 year |
| Incentives and grants | 0 |
| Debt ratio | 0 |
References
- Baseer, M.A.; Meyer, J.P.; Rehman, S.; Alam, M.M. Wind power characteristics of seven data collection sites in Jubail. Saudi Arabia using Weibull parameters. Renew. Energy 2017, 102, 35–49. [Google Scholar] [CrossRef] [Green Version]
- Allouhi, A.; Zamzoum, O.; Islam, M.R.; Saidur, R.; Kousksou, T.; Jamil, A.; Derouich, A. Evaluation of wind energy potential in Morocco’s coastal regions. Renew. Sustain. Energy Rev. 2017, 72, 311–324. [Google Scholar] [CrossRef]
- Bataineh, K.M.; Dalalah, D. Assessment of wind energy potential for selected areas in Jordan. Renew. Energy 2013, 59, 75–81. [Google Scholar] [CrossRef]
- Didane, D.H.; Wahab, A.A.; Shamsudin, S.S.; Rosly, N.; Zulkafli, M.F.; Mohd, S. Assessment of wind energy potential in the capital city of Chad, N’Djamena. In AIP Conference Proceedings; AIP Publishing LLC: Melville, NY, USA, 2017; Volume 1831, p. 20049. [Google Scholar]
- Balat, M. A Review of Modern Wind Turbine Technology. Energy Sources Part A Recovery Util. Environ. Eff. 2009, 31, 1561–1572. [Google Scholar] [CrossRef]
- Global Wind Energy Council. Global Wind Report. 2021. Available online: https://gwec.net/global-wind-report-2021/ (accessed on 17 July 2022).
- Statista. Installed Wind Power Capacity Worldwide 2001–2021. 2022. Available online: https://www.statista.com/statistics/268363/installed-wind-power-capacity-worldwide/ (accessed on 17 July 2022).
- Juaidi, A.; Abdallah, R.; Ayadi, O.; Salameh, T.; Hasan, A.A.; Ramahi, A. Wind energy in Jordan and Palestine: Current status and future perspectives. Renew. Energy Prod. Distrib. 2022, 1, 229–269. [Google Scholar]
- Palestinian Central Bureau of Statistics. Palestine in Figures 2020. Ramallah. 2021. Available online: https://www.pcbs.gov.ps/ (accessed on 17 July 2022).
- PCBS. Imported Energy in Palestine by Type of Energy and Month. 2019. Available online: https://www.pcbs.gov.ps/statisticsIndicatorsTables.aspx?lang=en&table_id=525 (accessed on 17 July 2022).
- Juaidi, A.; Montoya, F.G.; Ibrik, I.H.; Manzano-Agugliaro, F. An overview of renewable energy potential in Palestine. Renew. Sustain. Energy Rev. 2016, 65, 943–960. [Google Scholar] [CrossRef]
- West Bank Hospital Adding Wind Turbine—HCO News. 2012. Available online: https://hconews.com/2012/10/24/west-bank-hospital-adding-wind-turbine/ (accessed on 17 July 2021).
- Hasan, A. Wind energy in west bank and gaza strip. Renew. Energy 1992, 2, 637–639. [Google Scholar] [CrossRef]
- Ibrik, I.H. Techno-Economic Analysis of Wind Energy Resources Based on Real Measurements in West Bank–Palestine. Int. J. Energy Econ. Policy 2019, 9, 26–32. [Google Scholar] [CrossRef]
- Kitaneh, R.; Alsamamra, H.; Aljunaidi, A. Modeling of wind energy in some areas of Palestine. Energy Convers. Manag. 2012, 62, 64–69. [Google Scholar] [CrossRef]
- Salem, H.S. The potential of wind energy in Palestine with healthcare and residential examples in the West Bank and the Gaza Strip. J. Nat. Sci. Sustain. Technol. 2019, 13, 73–97. [Google Scholar]
- Odeh, Y. Wind Power Potential in Palestine/Israel: An Investigation Study for the Potential of Wind Power in Palestine/Israel, with Emphasis on the Political Obstacles. Master’s Thesis, Gotland University, Visby, Sweden, 2011. [Google Scholar]
- Khatib, T.; Bazyan, A.; Assi, H.; Malhis, S. Palestin? Energy Policy for Photovoltaic Generation: Current Status and What Should Be Next? Sustainability 2021, 13, 2996. [Google Scholar] [CrossRef]
- Badawi, A.S.A.; Hasbullaha, N.F.; Yusoff, S.H.; Hashim, A. Energy and Power Estimation for Three Different Locations in Palestine. Indones. J. Electr. Eng. Comput. Sci. 2019, 14, 1049–1056. [Google Scholar] [CrossRef]
- Shabbaneh, R.; Hasan, A. Wind energy potential in Palestine. Renew. Energy 1997, 11, 479–483. [Google Scholar] [CrossRef]
- Nassar, Y.; Alsadi, S. Wind energy potential in Gaza Strip-Palestine state. Sol. Energy Sustain. Dev. J. 2018, 7, 41–57. [Google Scholar] [CrossRef]
- Fant, C.; Adam Schlosser, C.; Strzepek, K. The impact of climate change on wind and solar resources in southern Africa. Appl. Energy 2016, 161, 556–564. [Google Scholar] [CrossRef] [Green Version]
- Palestinian Meteorological Department, Ministry of Transportation. Available online: https://www.pmd.ps/ (accessed on 17 July 2021).
- Mahbub, A.M.; Rehman, S.; Meyer, J.; Al-Hadhrami, L.M. Wind Speed and Power Characteristics at Different Heights for a Wind Data Collection Tower in Saudi Arabia; Linköping University Electronic Press: Linköping, Sweden, 2011; pp. 4082–4089. [Google Scholar] [CrossRef]
- Radoičić, G.; Jovanović, M. Transient simulation of impulse wind effect on a tall shipyard frame structure. J. Appl. Eng. Sci. 2017, 15, 192–202. [Google Scholar] [CrossRef] [Green Version]
- De Meij, A.; Vinuesa, J.-F.; Maupas, V.; Waddle, J.; Price, I.; Yaseen, B.; Ismail, A. Wind energy resource mapping of Palestine. Renew. Sustain. Energy Rev. 2016, 56, 551–562. [Google Scholar] [CrossRef]
- Bailey, B.H.; McDonald, S.L.; Bernadett, D.W.; Markus, M.J.; Elsholz, K.V. Wind Resource Assessment Handbook: Fundamentals for Conducting a Successful Monitoring Program; No. NREL/SR-440-22223; ON: DE97000250; National Renewable Energy Lab.: Golden, CO, USA; AWS Scientific, Inc.: Albany, NY, USA, 1997. [Google Scholar]
- Burton, T.; Jenkins, N.; Sharpe, D.; Bossanyi, E. Wind Energy Handbook; John Wiley & Sons: Hoboken, NJ, USA, 2011. [Google Scholar]
- Gardner, P.; Garrad, A.; Jamieson, P.; Snodin, H.; Nicholls, G.; Tindal, A. Wind Energy—The Facts—Technology (Volume 1). 2004. Available online: http://www.ewea.org/fileadmin/ewea_documents/documents/publications/WETF/Facts_Volume_1.pdf (accessed on 17 July 2021).
- Landberg, L.; Myllerup, L.; Rathmann, O.; Petersen, E.L.; Jørgensen, B.H.; Badger, J.; Mortensen, N.G. Wind resource estimation—An overview. Wind Energy 2003, 6, 261–271. [Google Scholar] [CrossRef]
- Manwell, J.F.; McGowan, J.G.; Rogers, A.L. Wind Energy Explained: Theory, Design and Application; John Wiley & Son: Hoboken, NJ, USA, 2010. [Google Scholar]
- Carta, J.A.; Ramírez, P.; Velázquez, S. A review of wind speed probability distributions used in wind energy analysis. Renew. Sustain. Energy Rev. 2009, 13, 933–955. [Google Scholar] [CrossRef]
- Didane, D.H.; Rosly, N.; Zulkafli, M.F.; Shamsudin, S.S. Evaluation of Wind Energy Potential as a Power Generation Source in Chad. Int. J. Rotating Mach. 2017, 2017, 3121875. [Google Scholar] [CrossRef] [Green Version]
- Keyhani, A.; Ghasemi-Varnamkhasti, M.; Khanali, M.; Abbaszadeh, R. An assessment of wind energy potential as a power generation source in the capital of Iran, Tehran. Energy 2010, 35, 188–201. [Google Scholar] [CrossRef]
- Deep, S.; Sarkar, A.; Ghawat, M.; Rajak, M.K. Estimation of the wind energy potential for coastal locations in India using the Weibull model. Renew. Energy 2020, 161, 319–339. [Google Scholar] [CrossRef]
- Fyrippis, I.; Axaopoulos, P.J.; Panayiotou, G. Wind energy potential assessment in Naxos Island, Greece. Appl. Energy 2010, 87, 577–586. [Google Scholar] [CrossRef]
- Li, Y.; Wu, X.-P.; Li, Q.-S.; Tee, K.F. Assessment of onshore wind energy potential under different geographical climate conditions in China. Energy 2018, 152, 498–511. [Google Scholar] [CrossRef]
- Alayat, M.M.; Kassem, Y.; Çamur, H. Assessment of wind energy potential as a power generation source: A case study of eight selected locations in Northern Cyprus. Energies 2018, 11, 2697. [Google Scholar] [CrossRef] [Green Version]
- Oyedepo, S.O.; Adaramola, M.S.; Paul, S.S. Analysis of wind speed data and wind energy potential in three selected locations in southeast Nigeria. Int. J. Energy Environ. Eng. 2012, 3, 7. [Google Scholar] [CrossRef] [Green Version]
- Persaud, S.; Flynn, D.; Fox, B. Potential for wind generation on the Guyana coastlands. Renew. Energy 1999, 18, 175–189. [Google Scholar] [CrossRef]
- Fazelpour, F.; Soltani, N.; Rosen, M.A. Wind resource assessment and wind power potential for the city of Ardabil, Iran. Int. J. Energy Environ. Eng. 2015, 6, 431–438. [Google Scholar] [CrossRef] [Green Version]
- Solyali, D.; Altunç, M.; Tolun, S.; Aslan, Z. Wind resource assessment of Northern Cyprus. Renew. Sustain. Energy Rev. 2016, 55, 180–187. [Google Scholar] [CrossRef]
- Himri, Y.; Merzouk, M.; Merzouk, N.K.; Himri, S. Potential and economic feasibility of wind energy in south West region of Algeria. Sustain. Energy Technol. Assess. 2020, 38, 100643. [Google Scholar] [CrossRef]
- Alavi, O.; Sedaghat, A.; Mostafaeipour, A. Sensitivity analysis of different wind speed distribution models with actual and truncated wind data: A case study for Kerman, Iran. Energy Convers. Manag. 2016, 120, 51–61. [Google Scholar] [CrossRef]
- De Andrade, C.F.; Neto, H.F.M.; Rocha, P.A.C.; da Silva, M.E.V. An efficiency comparison of numerical methods for determining Weibull parameters for wind energy applications: A new approach applied to the northeast region of Brazil. Energy Convers. Manag. 2014, 86, 801–808. [Google Scholar] [CrossRef]
- Justus, C.; Hargraves, W.; Mikhail, A.; Graber, D. Methods for estimating wind speed frequency distributions. J. Appl. Meteorol. 1978, 17, 350–353. [Google Scholar] [CrossRef]
- Lysen, H. Introduction to Wind Energy. Consultancy Services, Wind Energy, Developing Countries; CWD 82–1; Consultancy Services Wind Energy Developing Countries: Amersfoort, The Netherlands, 1983. [Google Scholar]
- Ammari, H.D.; Al-Rwashdeh, S.S.; Al-Najideen, M.I. Evaluation of wind energy potential and electricity generation at five locations in Jordan. Sustain. Cities Soc. 2015, 15, 135–143. [Google Scholar] [CrossRef]
- Ozay, C.; Celiktas, M.S. Statistical analysis of wind speed using two-parameter Weibull distribution in Alaçatı region. Energy Convers. Manag. 2016, 121, 49–54. [Google Scholar] [CrossRef]
- Masseran, N. Evaluating wind power density models and their statistical properties. Energy 2015, 84, 533–541. [Google Scholar] [CrossRef]
- Irwanto, M.; Gomesh, N.; Mamat, M.; Yusoff, Y. Assessment of wind power generation potential in Perlis, Malaysia. Renew. Sustain. Energy Rev. 2014, 38, 296–308. [Google Scholar] [CrossRef]
- Wiser, R.H.; Bolinger, M.; Hoen, B.; Millstein, D.; Rand, J.; Barbose, G.L.; Darghouth, N.R.; Gorman, W.; Jeong, S.; Mills, A.D.; et al. Land-Based Wind Market Report: 2021 Edition; Lawrence Berkeley National Lab. (LBNL): Berkeley, CA, USA, 2021. [Google Scholar]
- Chauhan, A.; Saini, R.P. Statistical analysis of wind speed data using Weibull distribution parameters. In Proceedings of the 2014 1st International Conference on Non Conventional Energy (ICONCE 2014), Kalyani, India, 16–17 January 2014; pp. 160–163. [Google Scholar]


| Year | Mean Speed (m/s) | Standard Deviation (m/s) | Variation Coefficient | Monthly Minimum (m/s) | Monthly Maximum (m/s) | Median (m/s) |
|---|---|---|---|---|---|---|
| 2016 | 2.82 | 1.688 | 59.8 | 2.37 | 3.40 | 2.86 |
| 2017 | 2.78 | 1.535 | 55.3 | 2.21 | 3.50 | 2.65 |
| 2018 | 2.77 | 1.653 | 59.7 | 1.95 | 3.60 | 2.75 |
| 2019 | 2.76 | 1.426 | 51.7 | 2.01 | 3.40 | 2.75 |
| 2020 | 2.46 | 1.530 | 62.2 | 1.49 | 3.60 | 2.37 |
| 2021 | 2.80 | 1.379 | 49.3 | 2.26 | 3.34 | 2.81 |
| 2016–2021 | 2.73 | 1.544 | 56.6 | 2.19 | 3.22 | 2.71 |
| Wind Turbine Model | Rated Power (kW) | Rated Speed (m/s) | Cut-In Speed (m/s) | Cut-Out Speed (m/s) | Rotor Diameter (m) | Hub Height (m) |
|---|---|---|---|---|---|---|
| PowerWind 500–50m | 500 | 10 | 3 | 25 | 56 | 50 |
| EWT DW 54–500KW–50m | 500 | 10 | 3 | 25 | 54 | 50 |
| CSIC HZ Windpower H102–2000 | 2000 | 12 | 3 | 25 | 102 | 70 |
| EWT DW 52–500KW–75m | 500 | 10 | 3 | 25 | 52 | 75 |
| EWT DW 54–500KW–75m | 500 | 10 | 3 | 25 | 54 | 75 |
| Guodian United Power UP77/1500–75m | 1500 | 11 | 3 | 25 | 75 | 77.36 |
| AAER A–2000–100 | 2000 | 12 | 3 | 20 | 84 | 100 |
| REpower MM92–100m | 2000 | 11 | 3 | 24 | 92.5 | 100 |
| Sinovel SL1500/77–100m | 1500 | 12 | 3 | 20 | 77.4 | 100 |
| Vensys77–100m | 1500 | 12 | 3 | 22 | 77 | 100 |
| Wind To Energy W2E93/2000–100m | 2000 | 13 | 3 | 24 | 93 | 100 |
| REpower 5M–117 | 5000 | 13 | 3 | 25 | 126 | 117 |
| ENERCON–101–135m | 3000 | 13 | 3 | 25 | 101 | 135 |
| Fuhrlaender FL3000–140m | 3000 | 13 | 3 | 25 | 120.6 | 140 |
| Wind To Energy W2E103/2500–160m | 2500 | 12 | 3 | 25 | 103 | 160 |
| Parameter Estimation Method | WAsP Method | Least-Squares Regression Method | Maximum Likelihood Method | Moment Method | Energy Pattern Factor Method | Empirical Method of Jestus | Empirical Method of Lysen |
|---|---|---|---|---|---|---|---|
| k | 1.930 | 1.837 | 1.901 | 1.833 | 1.883 | 1.857 | 1.857 |
| c (m/s) | 3.111 | 3.123 | 3.104 | 3.073 | 3.076 | 3.075 | 3.077 |
| R2 | 0.99842 | 0.99854 | 0.99855 | 0.99848 | 0.99842 | 0.99845 | 0.99846 |
| RMSE | 0.01100 | 0.01014 | 0.01010 | 0.01056 | 0.01093 | 0.01074 | 0.01072 |
| MBE | −0.09653 | −0.09339 | −0.09312 | −0.09459 | −0.09607 | −0.09531 | −0.09526 |
| MAE | 0.09654 | 0.09339 | 0.09312 | 0.09459 | 0.09607 | 0.09531 | 0.09526 |
| (w/m2) | 25.5 | 27.4 | 25.8 | 26.1 | 25.4 | 25.8 | 25.8 |
| Vmp | 2.13 | 2.04 | 2.10 | 2.00 | 2.06 | 2.03 | 2.03 |
| Vmax,E | 4.50 | 4.66 | 4.53 | 4.60 | 4.52 | 4.56 | 4.56 |
| h (m) | V (m/s) | k | c (m/s) | Pd (W/m2) |
|---|---|---|---|---|
| 10 | 2.73 | 1.90 | 3.10 | 25.77 |
| 50 | 4.51 | 2.28 | 5.15 | 98.83 |
| 75 | 5.26 | 2.43 | 6.06 | 153.28 |
| 100 | 5.93 | 2.55 | 6.78 | 207.59 |
| Wind Turbine Model | Cf (%) | Eout (GWh) | Simple Payback (Year) | Net Present Value (NPV)($) | Energy Production Cost ($/KWh) | Gross Annual GHG Emission Reduction (tCO2) | GHG Reduction Equivalent to Cars and Trucks Not Used |
|---|---|---|---|---|---|---|---|
| PowerWind 500–50m | 15.5 | 0.765 | 7.6 | 293,363 | 0.152 | 334 | 61.2 |
| EWT DW 54–500KW–50m | 16.7 | 0.825 | 7 | 388,780 | 0.141 | 360 | 65.2 |
| CSIC HZ WindpowerH102–2000 | 17 | 3.365 | 6.8 | 1,662,588 | 0.138 | 1469 | 269 |
| EWT DW 52–500KW–75m | 21.8 | 1.08 | 5.1 | 799,630 | 0.108 | 471 | 86.3 |
| EWT DW 54–500KW–75m | 23.8 | 1.178 | 4.6 | 958,613 | 0.099 | 514 | 94.2 |
| Guodian United Power UP77/1500–75m | 18.3 | 2.718 | 6.2 | 1,560,615 | 0.128 | 1186 | 217 |
| AAER A–2000–100 | 19.6 | 3.874 | 5.8 | 2,482,432 | 0.12 | 1691 | 310 |
| REpower MM92–100m | 23.8 | 4.704 | 4.6 | 3,818,911 | 0.099 | 2053 | 376 |
| Sinovel SL1500/77–100m | 21.1 | 3.138 | 5.3 | 2,235,957 | 0.11 | 1369 | 251 |
| Vensys77–100m | 22.1 | 3.279 | 5 | 2,463,305 | 0.106 | 1431 | 262 |
| Wind To Energy W2E93/2000–100m | 22.5 | 4.461 | 4.9 | 3,427,503 | 0.104 | 1947 | 357 |
| REpower 5M–117 | 20.2 | 10.017 | 5.5 | 6,741,153 | 0.116 | 4372 | 801 |
| ENERCON–101–135m | 27.8 | 8.251 | 3.9 | 7,653,764 | 0.085 | 3601 | 660 |
| Fuhrlaender FL3000–140m | 34.7 | 10.313 | 3 | 10,973,802 | 0.068 | 4501 | 824 |
| Wind To Energy W2E103/2500–160m | 35.7 | 8.751 | 3 | 9,398,214 | 0.066 | 3819 | 700 |
Publisher’s Note: MDPI stays neutral with regard to jurisdictional claims in published maps and institutional affiliations. |
© 2022 by the authors. Licensee MDPI, Basel, Switzerland. This article is an open access article distributed under the terms and conditions of the Creative Commons Attribution (CC BY) license (https://creativecommons.org/licenses/by/4.0/).
Share and Cite
Abdallah, R.; Çamur, H. Assessing the Potential of Wind Energy as Sustainable Energy Production in Ramallah, Palestine. Sustainability 2022, 14, 9352. https://doi.org/10.3390/su14159352
Abdallah R, Çamur H. Assessing the Potential of Wind Energy as Sustainable Energy Production in Ramallah, Palestine. Sustainability. 2022; 14(15):9352. https://doi.org/10.3390/su14159352
Chicago/Turabian StyleAbdallah, Ramez, and Hüseyin Çamur. 2022. "Assessing the Potential of Wind Energy as Sustainable Energy Production in Ramallah, Palestine" Sustainability 14, no. 15: 9352. https://doi.org/10.3390/su14159352
APA StyleAbdallah, R., & Çamur, H. (2022). Assessing the Potential of Wind Energy as Sustainable Energy Production in Ramallah, Palestine. Sustainability, 14(15), 9352. https://doi.org/10.3390/su14159352