Article

Avoiding Buffer Tank Overflow in an Iron Ore Dewatering System with Integrated Control System

by
Ênio L. Junior
1,2,
Moisés T. da Silva
3,* and
Thiago A. M. Euzébio
3
1
Programa de Pós-Graduação em Instrumentação, Controle e Automação de Processos de Mineração, Universidade Federal de Ouro Preto e Instituto Tecnológico Vale, Ouro Preto 35400-000, MG, Brazil
2
Vale S.A., Canaã dos Carajás 68537-000, PA, Brazil
3
Instituto Tecnológico Vale (ITV), Ouro Preto 35400-000, MG, Brazil
*
Author to whom correspondence should be addressed.
Sustainability 2022, 14(15), 9347; https://doi.org/10.3390/su14159347
Submission received: 9 May 2022 / Revised: 23 June 2022 / Accepted: 13 July 2022 / Published: 30 July 2022
(This article belongs to the Topic Mining Safety and Sustainability)

Abstract

:
High water usage is necessary while ore passes through the many stages of a mineral processing plant. However, a dewatering system filters the final ore pulp product to remove the water, which is reutilized in the previous processes. This step is fundamental to reducing the fresh new water consumption. Usually, several tanks, pumps, and filters form a dewatering system—any failure or shutdowns from those components disbalance the pulp flow. The waste of many tons of water and ore products for a tailing dam is the worst consequence of a mass disbalance in a dewatering system. This paper proposes an advanced regulatory control strategy composed of cascade and override loops for a dewatering system. The main purpose is to increase the production period, even under filter failure and changes in the inlet pulp characteristics. This control strategy is evaluated using a digital model of a large-scale Brazilian iron ore processing plant. Two scenarios are investigated: the simultaneous failure of two filters and disturbances in the flow and density of the thickener. The simulation results show that the proposed control strategy could extend the period of operation of the dewatering plant under failures in the disc filters and reject significant disturbances. For the considered simulation period, the proposed solution increases the time to overflow by 72 % when compared to the previous control strategy. Thus, it is possible to avoid the waste of approximately 2448.36 tons of ore pulp that would be sent to the tailings dam.

1. Introduction

Recycling water in the process industry is important from a sustainability point of view. Mineral processing plants widely use dewatering systems to recover water and partially dry the processed ore. This operation has two purposes: to ensure the simple transport of ore and to reduce freshwater consumption [1]. The early stages of iron ore processing consume large volumes of water. After the dewatering operation, approximately 90 % of the process water is recovered for reuse [2].
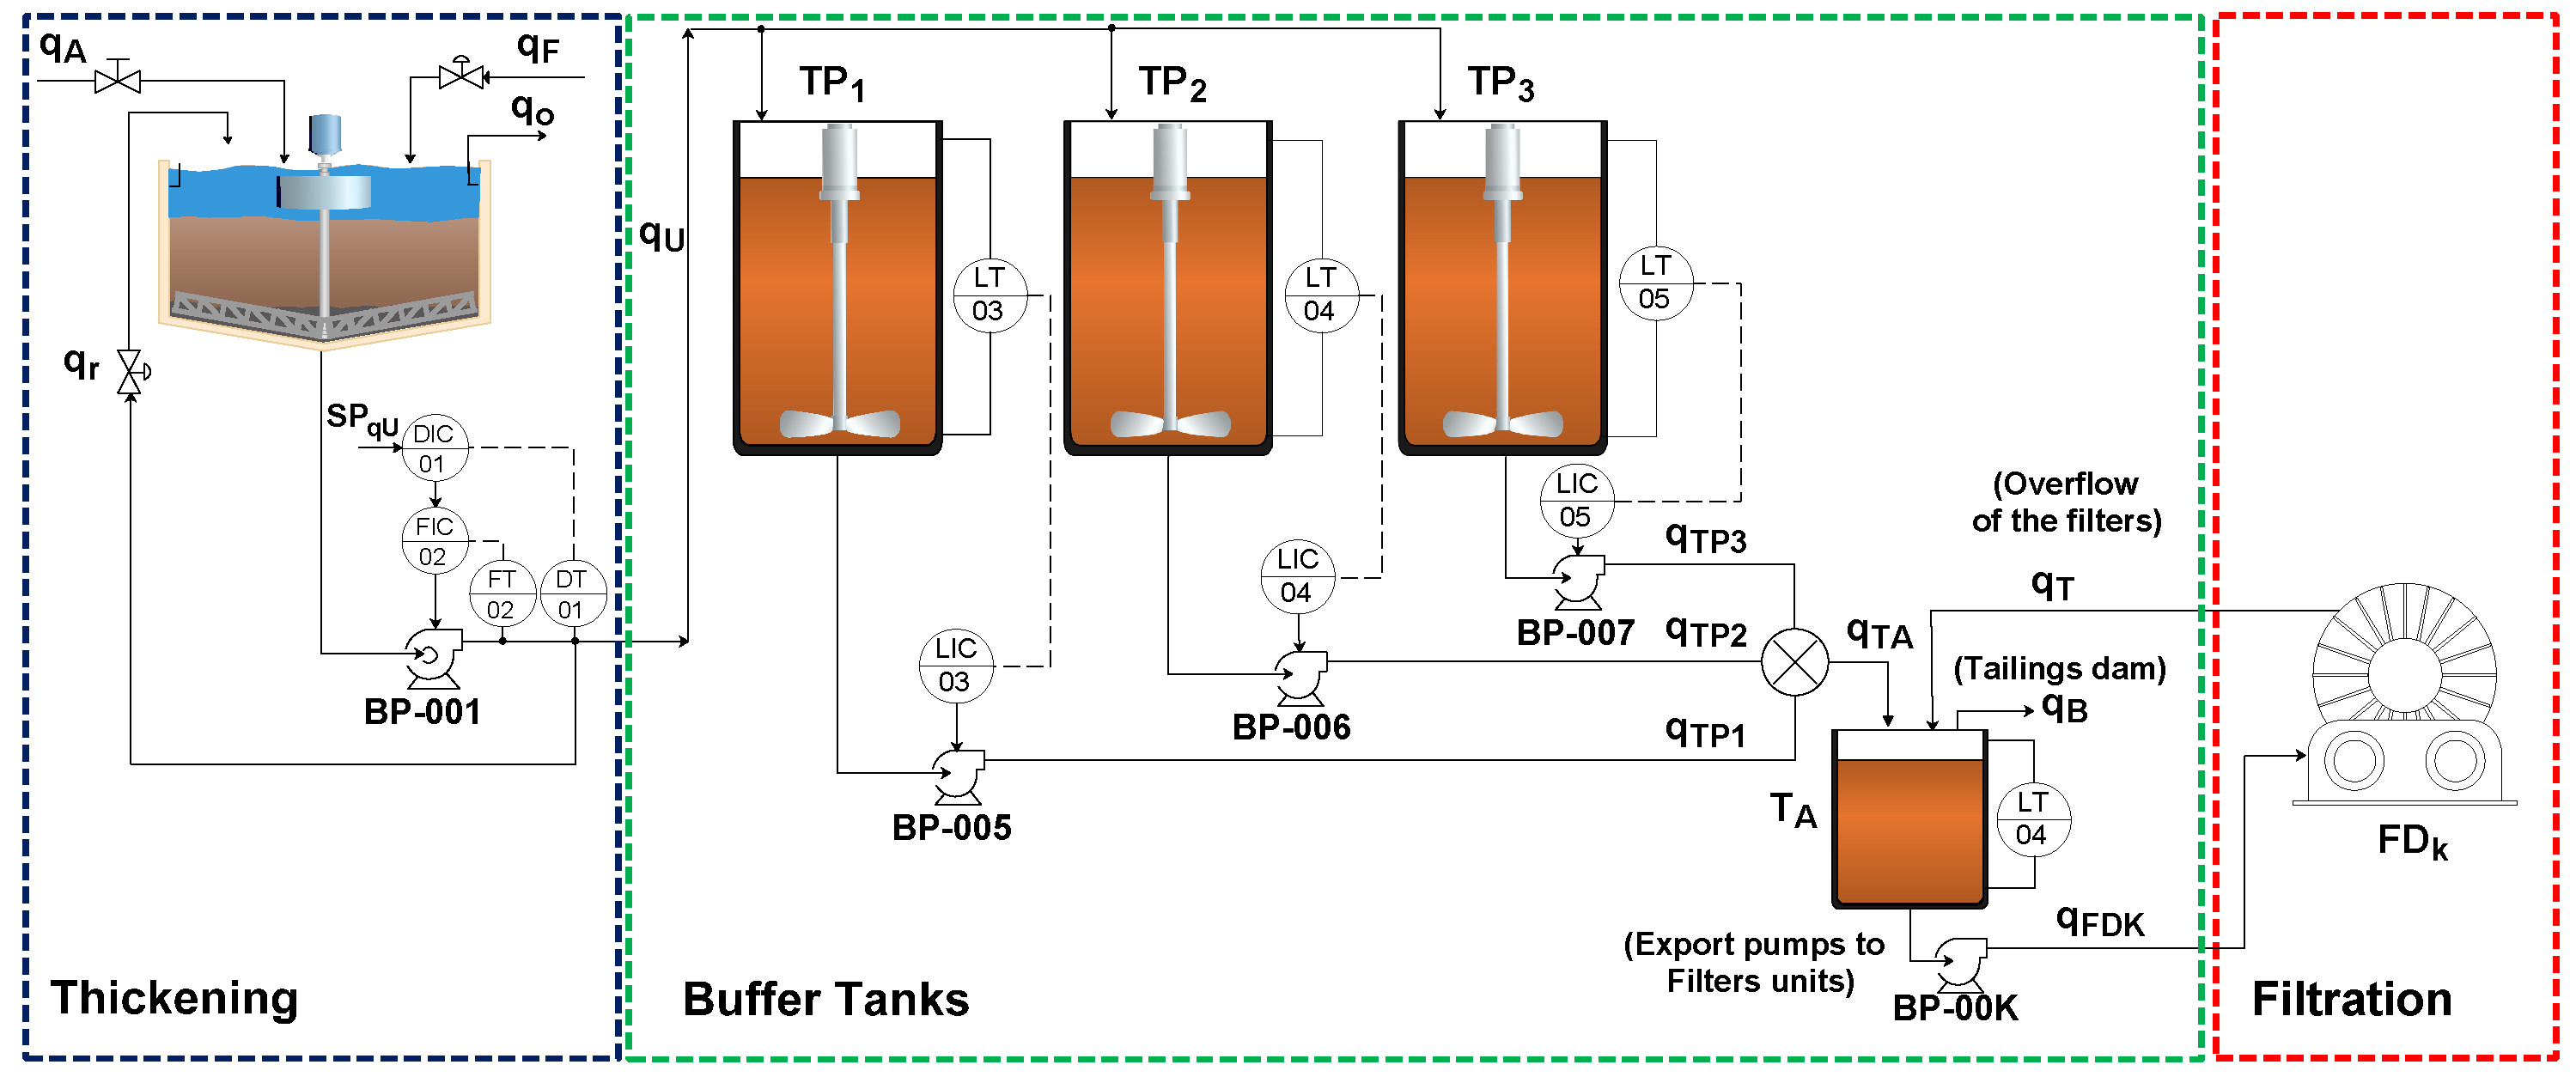
Basically, three units of operation comprise a dewatering system. The first unit consists of pulp thickening, in which the inlet pulp is separated into two products: clarified water to be reused and thickened pulp containing a high level of solids ( 60 % to 70 % by weight). The second unit is made up of buffer tanks, whose purpose is to temporarily store the thickened pulp to minimize the flow difference between the previous stage and the next one, i.e., the filtration stage. Filters comprise the third and last unit and are used to remove part of the residual water so that the final product is approximately 90 wt% solids. For instance, in [3], a maximum water recovery of 97 % was achieved by treating the slurry in a dewatering circuit with a combination of high rate thickener and press filter in a chromite ore beneficiation plant. Due to the importance of water recovery, this operation is fundamental, and it is monitored continuously to ensure maximum performance.
Even when applying the best maintenance practices, equipment failure is an inevitable event that can affect the productivity of an industry. In dewatering plants, filters frequently present malfunctions that inhibit their use for several minutes to hours. These well-known failures motivate the parallel positioning of filters to let them work simultaneously and independently. Despite the alternative routes, when one or more filters suddenly fail, the dewatering circuit needs to be adapted to the new temporary condition. In some cases, buffer tanks are not enough to support the flow difference, and the thickened pulp overflows into the tailings dam. This waste of valuable processed ore and water negatively impacts key production performance and sustainability indices [4].
To control the dewatering process, it is essential to consider all subprocesses. However, a significant part of the existing control approaches focus on just one specific part, such as thickening [5,6,7,8,9] and pulp tanks [10,11]. These control strategies do not consider the effects of a unit’s operations on other stages of the process. Furthermore, restrictions must be respected for the safe operation of the process. For instance, tank levels must remain in safe ranges, the pulp density must remain in a range that does not compromise the operation of pumps and valves, and so on.
In this context, few academic papers address the control of mineral processing plants by taking into account the effects of unit operations on the other stages. In [12], a multivariable controller, which combines fuzzy control and other strategies, was applied to a thickener in an iron ore concentration plant. In that work, the effects of the underflow flow rate and density variations, which cause problems in a subsequent flotation step, were taken into account. The proposed control strategy seeks to reduce the variability of these process variables so that the flotation stage’s efficiency is not impaired. Similarly, an intelligent control strategy was proposed by [13] for an iron ore pumping circuit. In that study, the control system attenuates flow and density disturbances at the entrance of a passage box. The strategy allows the box level to fluctuate within the operating limits, reducing the harmful effects of the disturbance on the efficiency of the hydrocyclone powered by the box. On the other hand, in [14], a fault-tolerant fuzzy controller was designed to manipulate the setpoints of the regulatory tank level in buffer tanks to control the storage tank level. Since this strategy uses a natural language, the controllers are easily understood by a nonspecialist. However, these controllers are difficult to tune and maintain.
In a practical way, advanced control solutions are still challenging to implement and maintain in the mineral industry. According to [15], regulatory control strategies are still dominant in this industry. Advanced control applications, such as predictive control, can be found, though in considerably fewer numbers. The main reasons for the still rare use of advanced control in the mineral industry are the lack of process models, the high variability of the process and points of operation and the lack of trained professionals to keep the system running. On the other hand, regulatory control strategies can be used to control more complex processes, including the interactions and restrictions between different stages. Techniques referred to as advanced regulatory control (ARC) can be used [16]. These techniques are often implemented in addition to basic process controls. Basic process controls are designed to meet the basic operating requirements of an industrial plant. In contrast, ARC control techniques are normally added later to achieve better performance and sustainability of the operation of a process. For instance, in [17], a cooling water circuit controlled by an ARC controller obtained a 30 % reduction in its energy consumption. This type of application does not require the use of detailed process models or the acquisition of new assets, as it can be implemented in the control systems typically in use in the industry as a programmable logic controller (PLC). In [18], several advanced control schemes were applied to pressure buffering control in industrial gas headers. The goal was to reduce gas emissions and improve consumer stability. The application of an adaptive model-based predictive controller in different mineral processing operations was performed by [19]. The proposed controller enables significant performance improvements compared to conventional control strategies for processes with long-time delays and multivariable interactions.
The main scope of this paper is to present a novel control strategy to automatically adjust the dewatering system to minimize the loss of valuable materials into tailings dams. An advanced regulatory controller is designed and compared to a traditional and nonintegrated controller usually encountered on the shop floor. The primary purpose is to enlarge the production period, even under random filter failure and dynamic changes in the inlet pulp characteristics. This study is conducted via a dynamic simulator of a large iron ore processing plant in Brazil. To the best of our knowledge, no control strategy manipulates all dewatering stages, and our strategy is failure tolerant regarding faults in filters.
This paper is organized as follows: In Section 2, the dewatering process is described, as well as the current control strategy. In Section 3, the operational problems of the dewatering plant under study are discussed. The proposed control strategy applied to the dewatering process is presented in Section 4. The results attained using the proposed control strategy are presented in Section 5. Finally, in Section 6, the conclusions are discussed.

2. The Dewatering System

In this section, we describe the dewatering process and the existing regulatory control strategy.

2.1. The Dewatering Process Description

The proposed control strategy is developed for a mineral processing plant of Vale S.A., a mining company in Brazil. In this process, water is mixed with iron ore. This mixture produces a pulp, which goes through several unit operations. At the end of the process, iron ore must be dewatered to be transported as a final product. The dewatering process removes water from iron ore for reuse as process water [20].
The dewatering process is composed of three stages: (i) thickening, (ii) the transport and storage of pulp, and (iii) filtration. The schematic diagram of the dewatering process under study is shown in Figure 1. In this process, the pulp with low-grade solids (about 57.4 wt%) feeds a thickener (feed flow, q A ). The thickener has a diameter of 35 m and is designed to process up to 1957 m 3 /h of pulp. This equipment continuously makes a solid–liquid separation, producing a clearer overflow and an underflow (thickened flow, q U ) with a higher grade of solids (about 65 wt%). The flocculant (anionic polyacrylamide) is used to accelerate the sedimentation of the solids and ensure the recovered water with turbidity around 200 NTU. The thickener is discharged using a centrifugal pump (BP-001), and part of the material is recirculated. The estimated period of effective operation per year is 7930 h.
After the thickening process, the pulp flows into three buffer tanks ( T P 1 , T P 2 , and T P 3 ), with volume of 250 m 3 each tank. Due to the high residence time, agitators are used to prevent the sedimentation of particles. Pumps BP-005, BP-006, and BP-007, at the outlet of each buffer tank, regulate the pulp flow that goes to the storage tank ( T A ). All tanks have a level measurement, and in the case of overflow, all material is wasted on the tailings dam. In this case, the plant operation must be stopped.
Pulp from the storage tank feeds a set of vacuum disc filters (filters feed flow, q F D K ) through eight export pumps (BP-00K). The filtering unit provokes a negative differential pressure, which makes the pulp pass through a semipermeable membrane designed to hold almost all the solids and leave the clearer water to pass through [2]—the solid deposit on the membrane increases, forming a cake. After the cake is thick enough, the deposited solids are removed by applying a positive differential pressure on the disc membrane. At the end of this cycle, two products are yielded: a solid cake (93 wt% of solids) and the filtrate (water recovered).
The filtering units, named F D k in Figure 1, have 12 discs with a diameter of 1.9 m and a volume of 5 m 3 in the pulp basins. These units operate independently and each unit can process up to 190 m 3 /h of pulp. If a larger volume of pulp is pumped into the filters, any excess material will leak into the basins and return via overflow pipes to the storage tank ( T A ).

2.2. The Current Control Strategy

The current control strategy consists of the nonintegrated operation of the different stages of the dewatering process. The closed-loop system is depicted in Figure 2. Signal r denotes the setpoint, u is the system inputs (manipulated variable), and y is the process outputs (controlled variable). G ( s ) represents the system dynamics and C ( s ) indicates the controller transfer function. The setpoints of the thickener underflow density, thickener outflow, and buffer tank level are modified over time by a human operator. In addition, the operator constantly monitors the storage tank level ( H T A ) to prevent overflow into the tailings dam if one or more filters fail.
Among the several strategies applied to control loops, the most used in the industry for regulatory layer is the PID controller [21]. The main reasons for this are: it is easier to maintain; there are few tuning parameters; offers good performance and robustness regardless of operating point [22]. There are five regulatory control loops in the current control strategy: FIC02, DIC01, LIC03, LIC04, and LIC05. The FIC02 loop controls the thickener outflow ( q U ), and the DIC01 controls the thickener underflow density ( ρ U ). These loops make up a cascading structure, where the master loop is DIC01 and the slave is FIC02. The LIC03, LIC04, and LIC05 loops manipulate the respective frequency bump to control the levels of the buffer tanks T P 1 , T P 2 , and T P 3 . For these loops, the regulatory controller setpoints are defined by the human operator. Table 1 shows the PI controller parameters for the loops used in the current control strategy with the respective filter time constant ( λ ). These controllers are defined using the method proposed by [23]. For all loops, the PI controller considered in this paper is formulated as
C ( s ) = K p 1 + 1 T i s ,
where K p and T i are the proportional gain and integral time, respectively.

3. Problem Description

As described in Section 2, the dewatering plant is composed of subprocesses. The first subprocess consists of pulp thickening. Then, the pulp is transported and stored in tanks, which have volumes capable of absorbing variations in the process flow. These tanks feed the filtration stage, which removes residual water, delivering ore with low moisture content.
The current control strategy consists of a nonintegrated operation. Thus, it does not take into account the effects of unit operations on the other stages of the process. Beyond that, the control strategy does not consider a global objective. Thus, the operation of the process can be severely impaired. In addition, constraints must be respected. For instance, the pulp density must remain within a range that does not compromise the pump’s operation.
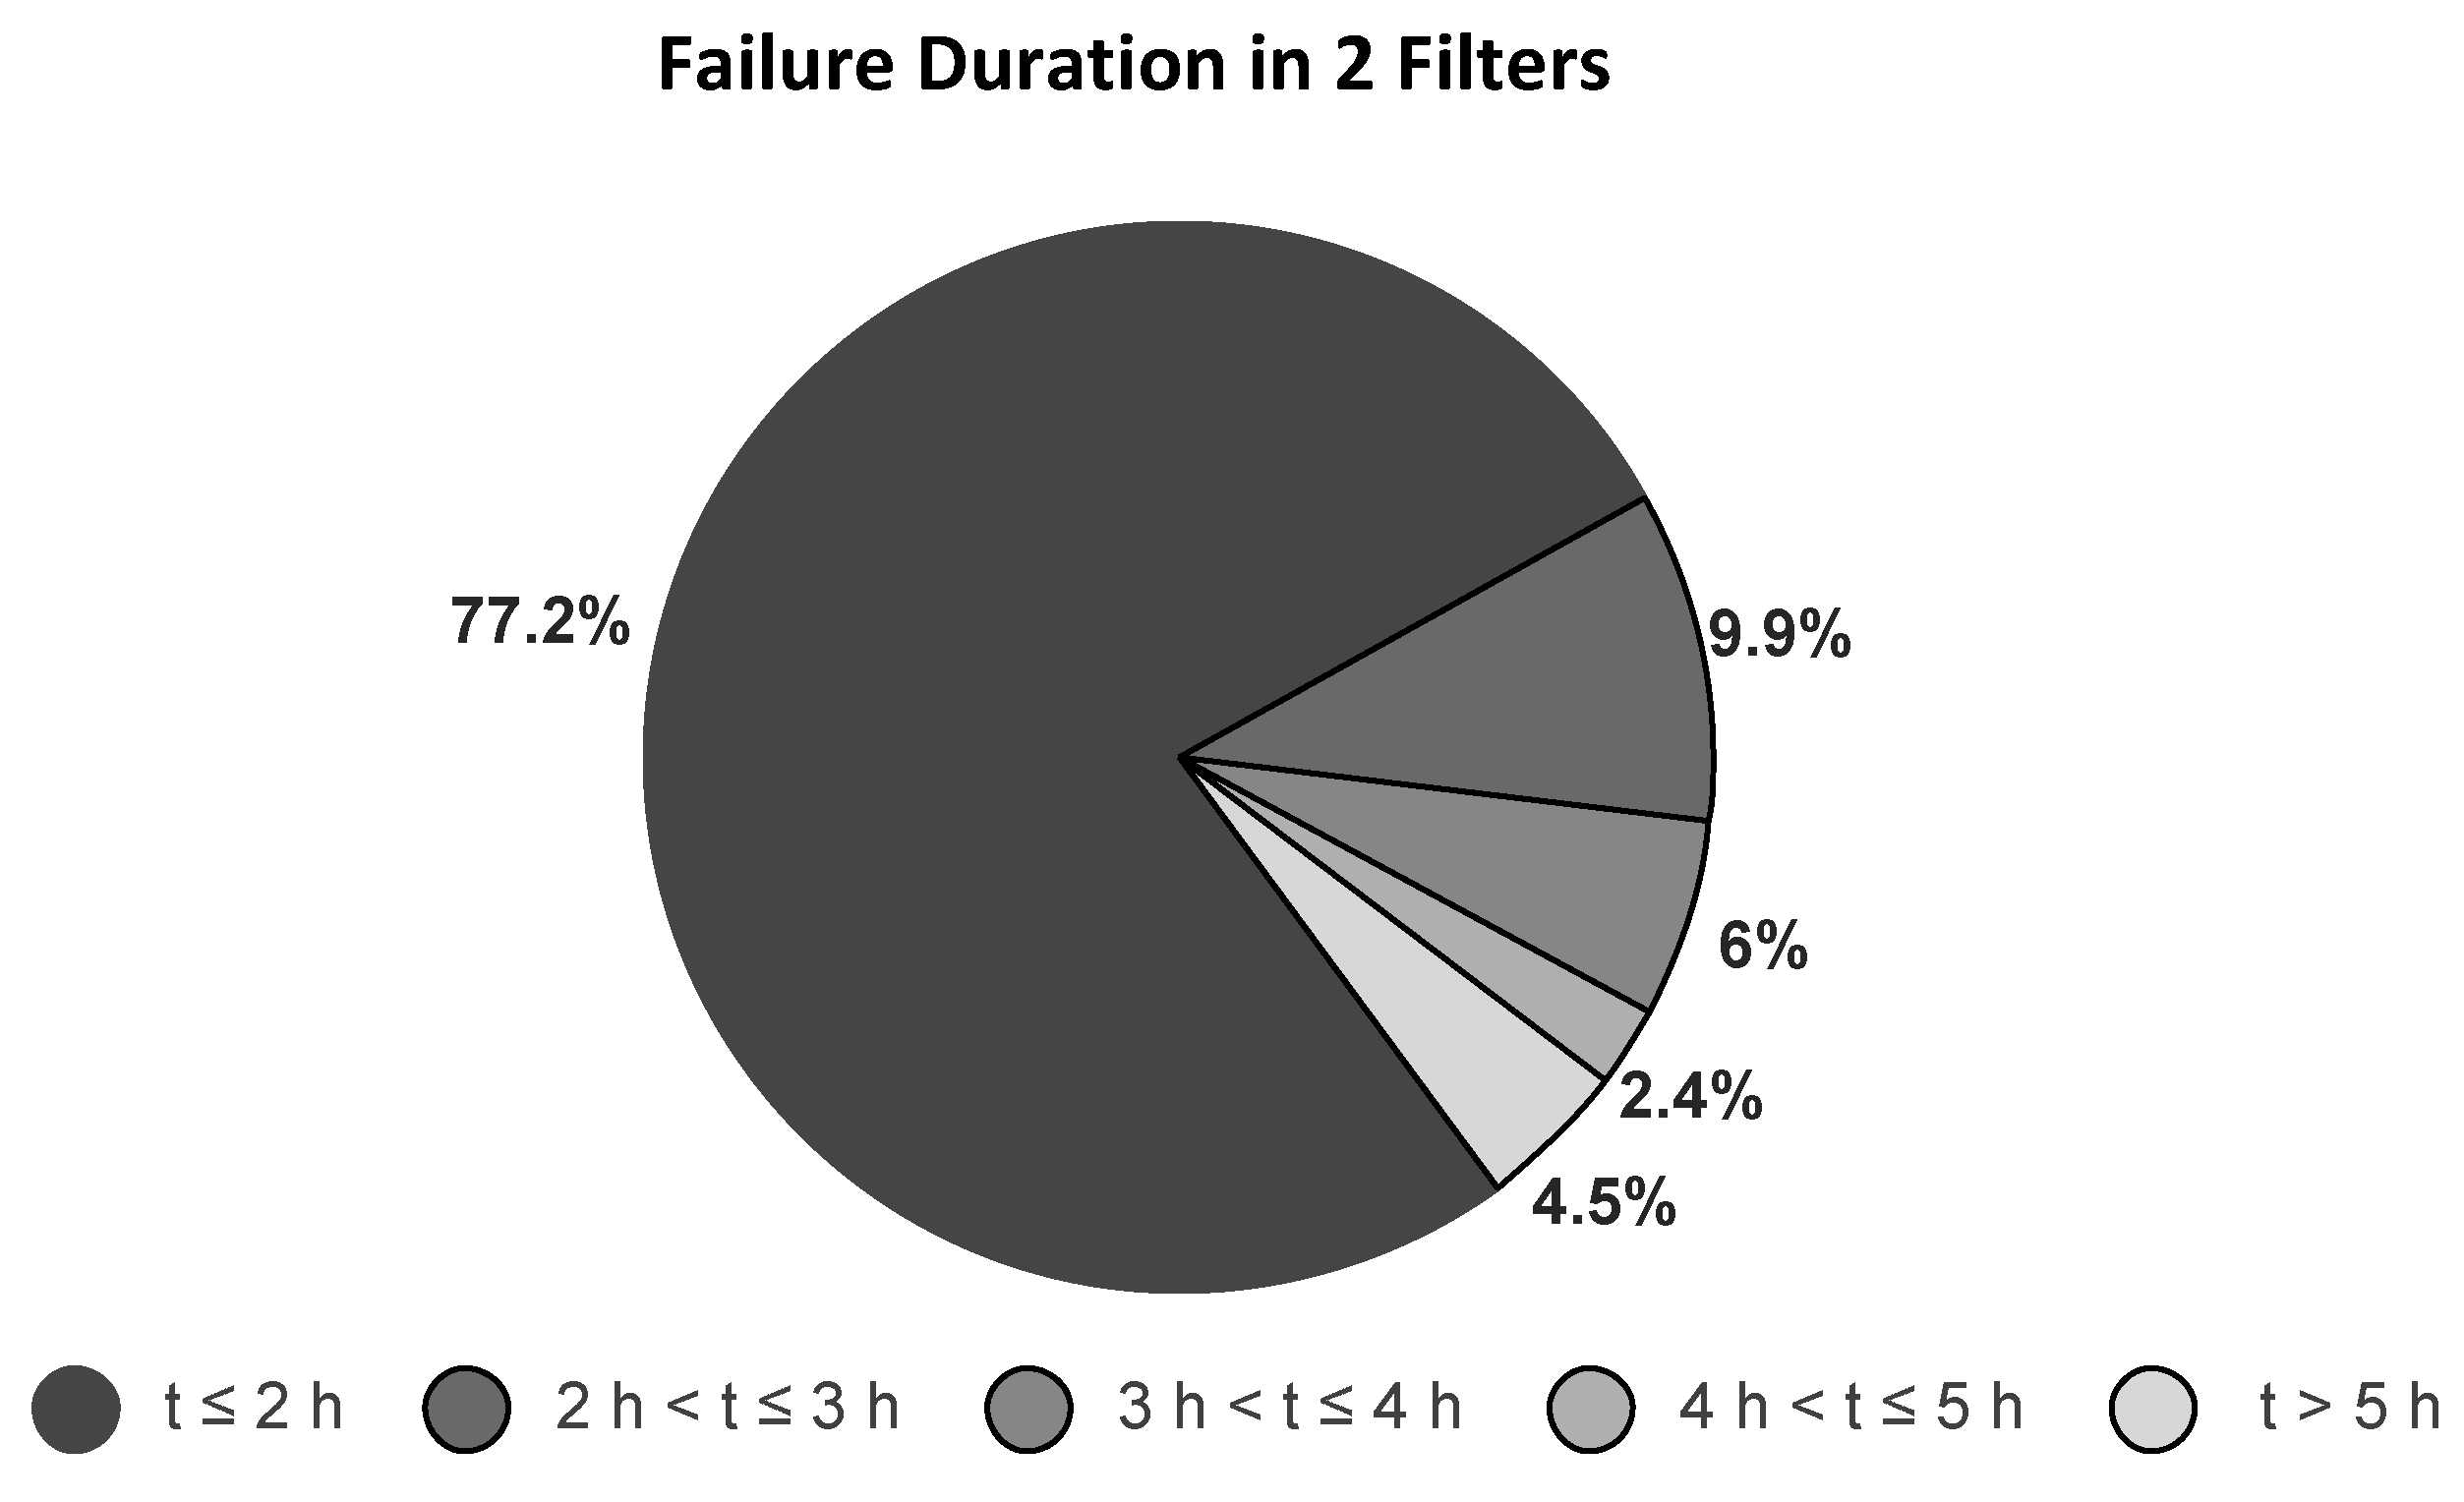
The main problem in the dewatering process under study is the frequent failure of the disc filters. To illustrate this problem, consider data from 2520 h of operation of the filter units. During this period, for a total of 1498 h, i.e., 59.4 % of the time, at least one filter was out of service due to a failure condition. For this period under failure, Figure 3 shows the percentage of the number of filters that had problems. Note that 64.6 % of the time, failure occurred in only one disc filter; 27.4 % of the time, the failure occurred in two filters simultaneously. The high frequency of failure has a direct impact on the productivity of the dewatering plant. In this way, the implementation of a control strategy capable of maintaining the operation of the process even in the event of disc filter failure becomes essential.
Upon failure of the disc filters, several variables can simultaneously affect the dewatering process. Thus, the human operator cannot act according to the overall context of the process. In this context, the operational problem is as follows: In the case of disc filter failure, the filter feed pump stops, and it is not possible to empty the pulp into the filters, causing the level of the T A tank to increase. This leads to overflow of tank T A , which causes tons of concentrated pulp to be lost to tailings dams every year.
To overcome this operational problem, the control system should consider the several variables of the dewatering process and their interactions. The control solutions proposed in this paper consist of an ARC strategy used to reduce the loss of iron ore concentrate into the tailings dam by keeping the level of the T A tank within its operational limits, especially under disc filter failure.

4. The Proposed Control Strategy

This section describes the proposed ARC strategy. Initially, the variables and loops used in the proposed control of the dewatering process are described. Then, the proposed control strategy is presented.

4.1. Variables and Loops of the Proposed Control Strategy

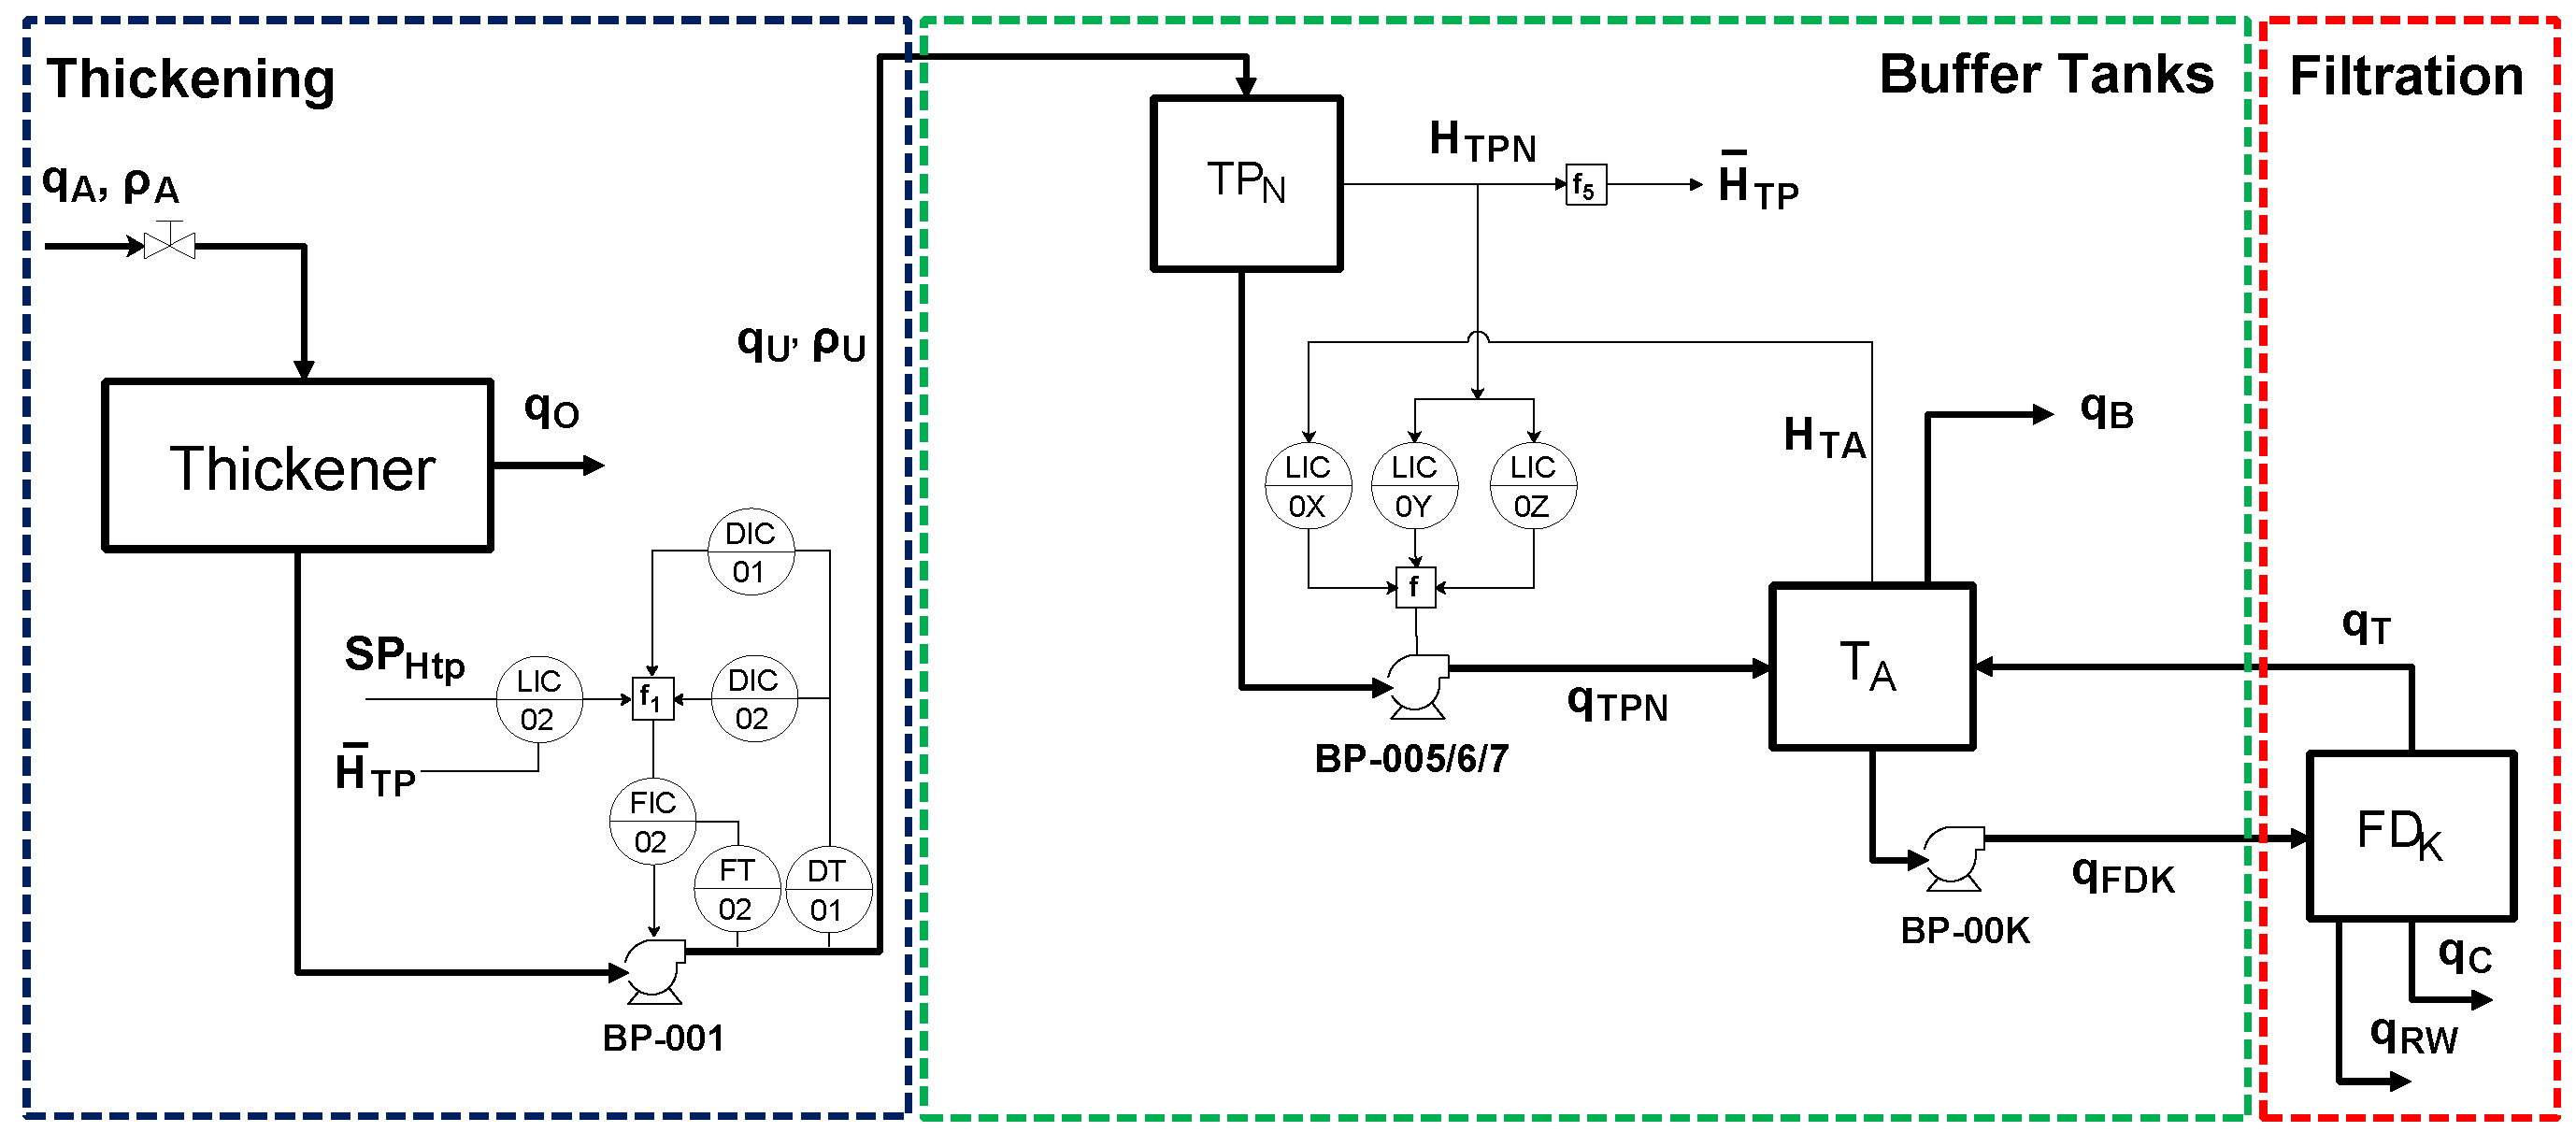
A simplified diagram of the dewatering process with the loops defined for the proposed control strategy is shown in Figure 4. For the sake of simplicity, the buffer tanks ( T P 1 , T P 2 , and T P 3 ) are represented by only one block ( T P N ). In the proposed control strategy, the outlet flow of the thickener ( q U ) comprises a slave loop of a cascading structure. The master loop of this structure is the result of an override control composed of the average level of the buffer tanks ( H ¯ T P ) and the minimum and maximum restrictions on the thickener underflow density ( ρ U ). In addition, according to Figure 4, the outlet flow of the buffer tanks is the result of the action of an override controller consisting of the storage tank level ( H T A ) and minimum and maximum restrictions on the level of each buffer tank ( H T P 1 , H T P 2 and H T P 3 ). For the sake of simplicity, in the simplified diagram shown in Figure 4, the level loops associated with the storage tank are represented by LIC0X, whereas the minimum and maximum restrictions on the level loops related to the buffer tanks are represented by LIC0Y and LIC0Z, respectively.
In this way, there are seven process variables that must be controlled: the thickener underflow density ( ρ U ), the flow rate of the thickener underflow ( q U ), the level of each buffer tank ( H T P 1 , H T P 2 and H T P 3 ), the average level of the buffer tanks ( H ¯ T P ) and the storage tank level ( H T A ). As manipulated variables (MVs), the following variables are initially considered: the thickener underflow pump frequency (BP-001), the setpoint of the thickener outlet flow, the frequency pump (BP-005/6/7) of each buffer tank, and the frequency of the export pumps (BP-00K). These MVs are analyzed below:
  • Thickener underflow pump frequency: This variable is coupled to the density of the underflow ( ρ U ), the level of the three buffer tanks and, consequently, the average level of these tanks ( H ¯ T P ).
  • Setpoint of the thickener outlet flow: This variable is the setpoint of the slave loop of the cascade structure and is the result of the override control between the average level of the buffer tanks ( H ¯ T P ) and the minimum and maximum restrictions on the thickener underflow density ( ρ U ).
  • Frequency of the buffer tank pumps: Each of the pumps is coupled with the respective level of the buffer tank ( H T P 1 , H T P 2 and H T P 3 ). In addition, the pumps are coupled to the storage tank level ( H T A ).
  • Frequency of the export pumps: Considering the increase in the storage tank level ( H T A ), it is necessary to increase the export flow ( q F D K ) and to pump more pulp into the filter. The filter has limited dewatering capacity, which means that pulp overfeed results in overflow of the filter; all overflowed material returns via overflow lines ( q T ), as illustrated in Figure 4. Therefore, the frequency of the export pumps is not considered an MV but rather a disturbance.
According to the analysis of the MVs, the degree of freedom of the system is reduced. Now, there are five MVs to control seven process variables (PVs). In this way, the correct assignment of MVs and PVs becomes essential for adequate operation of the process.
With the reduced degree of freedom, the proposed control approach uses a constraint-based strategy. This advanced regulatory controller is composed of PI controllers using override algorithms, connected in a cascade structure. In all cases, it is assumed that pumps are at the outlets of the buffer tanks.
Table 2 summarizes the input and output variables for the defined scope of the dewatering control system, as well as the respective loops associated with these variables. Note that the buffer tank loops have three MVs associated with the override controller. For example, for buffer tank T P 1 , the loops are LIC03, LIC06 and LIC09. These loops are associated with the storage tank ( u 5 ), the minimum ( u 6 ) and the maximum ( u 7 ) restrictions of the level of this tank, respectively. More details about the dewatering control system loops are presented below.

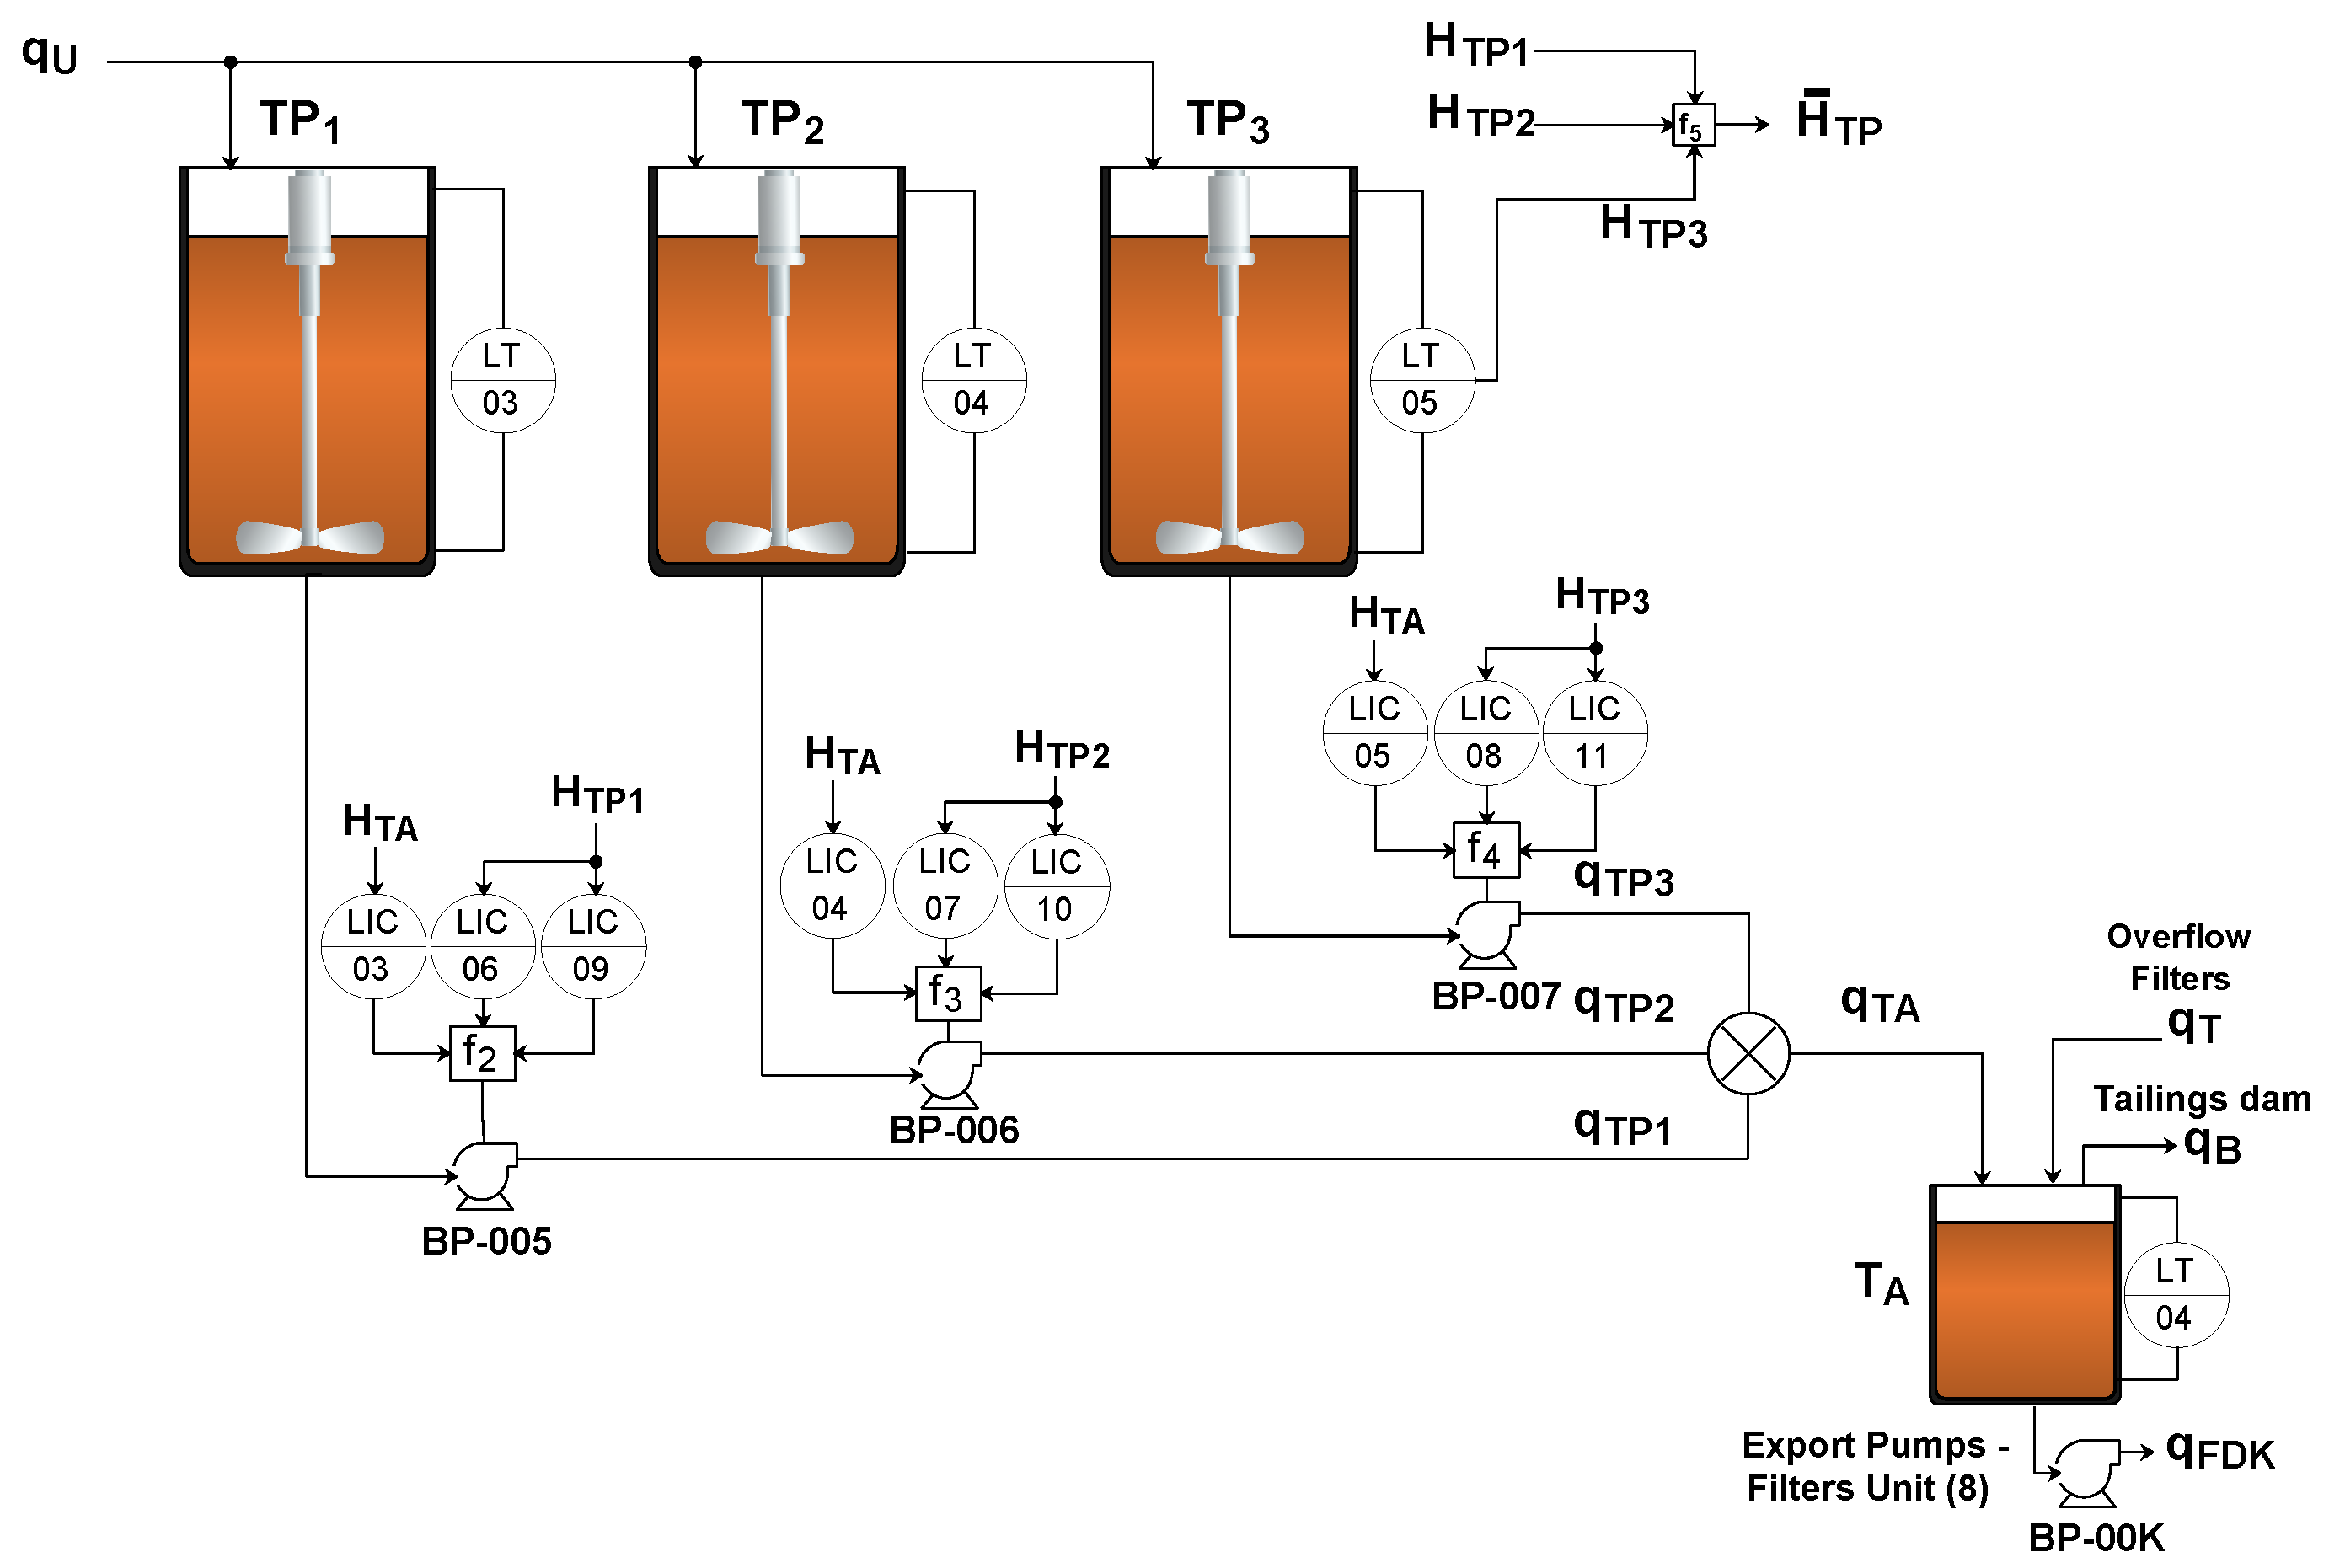
4.2. The Proposed Control Using Cascade and Override Structures

The storage tank level ( H T A ) is controlled by manipulating the flow rate through pumps BP-005, BP-006 and BP-007, as illustrated in Figure 5. In nontypical operating conditions, such as the shutdown of one export pump, BP-00K, there is an imbalance between the flows q F D K and q T A . In this way, the pumps BP-005, BP-006 and BP-007 decrease the flow rate q T A , keeping the storage tank level H T A close to the setpoint. Thus, with the flow through the pumps reduced, there is an imbalance between the flows q T A and q U , raising the levels of the buffer tanks T P 1 , T P 2 and T P 3 . In this case, the proposed control strategy uses maximum and minimum level restriction controllers to prevent the operating limits from being exceeded in each of the buffer tanks. According to Figure 5, for each buffer tank pump (BP-005, BP-006 and BP-007), there are three controllers whose outputs are connected by means of the selectors f 2 , f 3 and f 4 , respectively.
Algorithm 1 describes the operation of the selectors f 2 , f 3 and f 4 . To understand this algorithm, consider the control of pump BP-005: Under normal operation, the signal that controls the frequency of pump BP-005 is the output of controller LIC03 ( u 5 ), which controls the H T A level. If the buffer tank level, H T P 1 , reaches a maximum or minimum threshold, LIC03 will no longer control H T A and will be manipulated by controller LIC06 ( u 6 ) or LIC09 ( u 7 ) to keep the H T P 1 level at its maximum or minimum value, respectively. A similar operation occurs for the BP-006 and BP-007 pump controllers. Table 3 summarizes the control loops and their respective variables of the buffer tanks.
Algorithm 1 Override selector—pumps BP-005/6/7.
1:
if u 7 / 10 / 13 > u 5 / 8 / 11 then
2:
     u s e l e c t e d = u 7 / 10 / 13 ;
3:
else if u 6 / 9 / 12 < u 5 / 8 / 11 then
4:
     u s e l e c t e d = u 6 / 9 / 12
5:
else
6:
     u s e l e c t e d = u 5 / 8 / 11
7:
end if
Note that the control structure described provides selectivity to the system since only the pumps connected to buffer tanks operating under normal conditions control the storage tank level. Note also that the level control of the buffer tanks is carried out using pumps BP-005, BP-006 and BP-007. These controllers are activated only when the operational limits of the buffer tanks are reached. In this way, under normal operating conditions, the proposed control strategy uses the flow rate of the underflow of the thickener as the MV to control the buffer tank levels. This strategy is illustrated in Figure 6, where LIC02 controls the average level of the buffer tanks, H ¯ T P . In addition, loops DIC01 and DIC02 are related to the minimum and maximum density restriction controllers, respectively.
According to Figure 6, loops LIC02, DIC01, and DIC02 comprise an override control, which is the master loop of the cascade structure. Moreover, FIC02 is the slave loop of this cascade structure. The control action of the override control of loops LIC02, DIC01, and DIC02 is selected according to the selector f 1 , which is described in Algorithm 2. In this algorithm, signals u 4 and u 3 represent the MV of the maximum (DIC02) and minimum (DIC01) density restriction controllers, respectively. These controllers have direct action, and signal u 4 tends to saturate at its minimum value, while signal u 3 tends to saturate at its maximum value. The signal of the medium level controller of the buffer tanks u 2 has a reverse action and is the predominant signal as long as all restrictions are met. The buffer tanks, despite being decoupled from each other, are kept at very similar levels, as the loop LIC02 controls the medium level of these tanks. Table 4 summarizes the control loops and their respective variables of the thickener.
Algorithm 2 Override selector—pump BP-001
1:
if u 4 > u 2 then
2:
     u s e l e c t e d = u 4 ;
3:
else if u 3 < u 2 then
4:
     u s e l e c t e d = u 3 ;
5:
else
6:
     u s e l e c t e d = u 2
7:
end if
Under normal operating conditions, the density value of the underflow stays within the operating limits; thus, signal u 4 (DIC02) saturates at the minimum value and u 3 (DIC01) saturates at the maximum value. At the same time, signal u 2 (LIC02) remains within these limits, defining the flow rate of pump BP-001. For example, according to the override selector presented in Algorithm 2, if the maximum density limit is reached, control signal u 4 increases, and when the control signal becomes larger than signal u 2 , it becomes the signal effectively applied in FIC02.
Table 5 shows the PI controller parameters for all loops used in the proposed control strategy with the respective filter time constant ( λ ). All controllers were defined using the method proposed by [23]. Note that for density loops, the same PI controller is used for the minimum and maximum constraints of the override control. We use the same parameters for the controllers because the minimum and maximum density loops have similar dynamics and are independent of the operating point. The same is true for the buffer tank level and storage tank loops. Note also that for the proposed control strategy, the same parameters of the PI controllers of the current and nonintegrated strategy described in Section 2.2 (DIC01, FIC02, LIC03, LIC04 and LIC05) are used. As the control objective is the same, the same controller parameters are used in both strategies. Thus, the performance of the two control strategies presented are evaluated under the same controllers.

5. Results and Discussion

In this section, the results obtained with the proposed control strategy through dynamic simulations are presented. The proposed control was implemented in Simulink ®, and the simulation of the dewatering process was developed using the commercial simulator IDEAS ® (Andritz Automation). All elements of the dewatering process under study were modeled using the principles of mass and energy conservation and population balance.
The framework used to evaluate the control strategy works via an OPC (open platform communication) connection between Simulink (OPC client) and the IDEAS dynamic process simulator. In this framework, the OPC works as a bridge between IDEAS and Simulink. The OPC client uses the OPC server to obtain data from or send commands to the simulator. Figure 7 illustrates the framework of the control system with the simulator.
As presented in Section 3, data from 2520 h of operation of the filter units were analyzed and classified. According to Figure 3, for 92 % of the time under failure, at most 2 filters were stopped. Due to its relevance, the scenario with the simultaneous failure of two filters was chosen to evaluate the proposed control. In addition, the scenario with disturbances in the flow rate and density of the thickener was evaluated.

5.1. Case 1: Two Filters Fail

At time t = 0 h, the stopping of two filters of the dewatering process is simulated. The aim is to analyze how long the plant could operate without a complete shutdown due to the overflow of the storage tank ( T A ). Figure 8 shows the main process variables of the proposed and current control strategies. The MVs are illustrated in Figure 9. Because the outputs of the controllers are subject to selector override control, the variable u s is used to highlight the signal actually selected and applied to the actuators. For the sake of simplicity, the loops for tanks T P 2 ( u 8 , 9 , 10 ) and T P 3 ( u 11 , 12 , 13 ) are omitted in all cases since they present similar characteristics to the loop of tank T P 1 .
According to Figure 9c, under the failure of two filters, the LIC03/04/05 loop controllers of the proposed strategy quickly restrict the frequency of the pumps to keep the storage tank level at its setpoint. Because these pumps are also coupled to the buffer tanks, at the moment the pump frequency is reduced, the level of the buffer tanks tends to rise as shown in Figure 8d. In addition, the controller of loop LIC02 is tuned to maintain the average level of the buffer tanks at its setpoint; thus, the thickener underflow flow rate is quickly reduced, as shown in Figure 8b. Moreover, according to Figure 8a, with the reduction in the flow rate q U , the underflow density starts to rise toward the upper limit of restriction. When this limit is reached at t = 0.4 h, the master controller becomes the maximum density restriction loop (DIC02), signal u 4 . Thus, the DIC02 loop defines the setpoint for the underflow flow (slave) loop (FIC02), as shown in Figure 9a. In this case, the average level of the buffer tanks starts to rise.
When the level of the buffer tanks reaches the limit, at time t = 4.7 h, the maximum level restriction loops (LIC09/10/11) take control over the pumps (BP-005/6/7); see Figure 9c. At this moment, it can be seen that the density and level restrictions have been reached, and there is no MV capable of controlling the level of the storage tank, causing its level to rise until overflow occurs at time t = 5.1 h, as shown in Figure 9c.
Because the current control strategy consists of a nonintegrated operation, the storage tank level increases rapidly, as shown in Figure 8c. Note also that although the storage tank overflows, there is no action from the control system, as there is no integration to take into account the effects of unit operations in the other stages of the process. According to Figure 8a, there are no changes in the underflow density. However, because the overflow of storage tank T A occurs due to the failure of the filters, tons of products are destined for the tailings dam. Thus, in this case and from the practical point of view, maintaining the underflow density at the setpoint means that ore pulp will be wasted, which directly impacts the plant’s productivity. The nonalteration of the underflow flow rate and buffer tank levels, respectively, shown in Figure 8b,d, is also directly related to the waste of ore pulp into the tailings dam. Figure 9b shows the setpoint for the underflow flow (slave) loop (FIC02) for current control. As expected, there is no change in this flow rate because the control strategy is not integrated. For the same reason, a similar result is obtained at the pump frequency of BP-005, shown in Figure 9d.
For the period of operation analyzed, Figure 10 shows a duration of filter failure corresponding to 92 % of the time under the failure of up to two filters. Note that when two filters fail simultaneously, 87.1 % of the stoppages last less than three hours and 95.5 % of the failures last less than 5 h. Thus, the proposed control strategy is able to guarantee the continuity of operation in the majority of failure cases.
According to Figure 9d, in the current control strategy, the flow at the outlet of tank T P 1 is 72 m 3 /h. The same is obtained for the other T P 2 and T P 3 tanks. Therefore, the total flow to the storage tank ( T A ) is 216 m 3 /h. Assuming the ore pulp density equal to 2267 kg/m 3 and that the proposed control strategy took 5 h more to overflow, under these operating conditions, it can be concluded that it is possible to avoid the waste of approximately 2448.36 tons of ore pulp that would be sent to the tailings dam.

5.2. Case 2: Disturbances

The proposed control strategy is now evaluated under process disturbances. Disturbances in the flow rate and density of the fed material are illustrated in Figure 11. At time t = 0 h, an increase of 10 % in the thickener feed rate ( q A ) is introduced into the system. At t = 1 h, the feed flow returns to the initial value, and a 10 % decrease occurs at time t = 2 h. At t = 3 h, the feed flow returns to the initial value and remains there until the end of the simulation. At t = 4 h, the feed density ( ρ A ) increases by 4 % before returning to the initial value at t = 5 h.
Figure 12 shows the main process variables under the proposed control strategy and current control. The MVs are illustrated in Figure 13. The variable u s is used to highlight the signal actually selected and applied to the actuators. Again, for the sake of simplicity, the signals of the loops for tanks T P 2 ( u 8 , 9 , 10 ) and T P 3 ( u 11 , 12 , 13 ) are omitted for the same reasons already discussed.
Variations in the flow rate and density of the thickener cause disturbances in the density of the underflow. Because the density of the underflow is a constraint variable, for the proposed control strategy, the controllers of loops DIC01 and DIC02 are not used at any time, as the maximum and minimum density restrictions have not been reached (see Figure 12a). The maximum and minimum density limits are defined by specialists in the plant operation.
The underflow density presents an oscillatory characteristic due to the integrated control strategy. Even so, according to Figure 12c, storage tank T A does not overflow due to the disturbance. However, for the current and nonintegrated control, the storage tank level overflows according to the variation in the feed flow rate. According to Figure 12b, the underflow flow rate does not change under the proposed control strategy for any disturbances. For the current and nonintegrated control, it is observed that the flow rate varies by approximately 150 m 3 /h, which causes variations in the average level of the buffer tanks, as shown in Figure 12d.
The MVs for the process under disturbance are shown in Figure 13. Note that for the proposed control strategy, there are no significant variations in the frequency of pumps BP-001 and BP-005. On the other hand, despite the variations in these variables, the current and nonintegrated strategies are not able to avoid storage tank overflow.

6. Conclusions

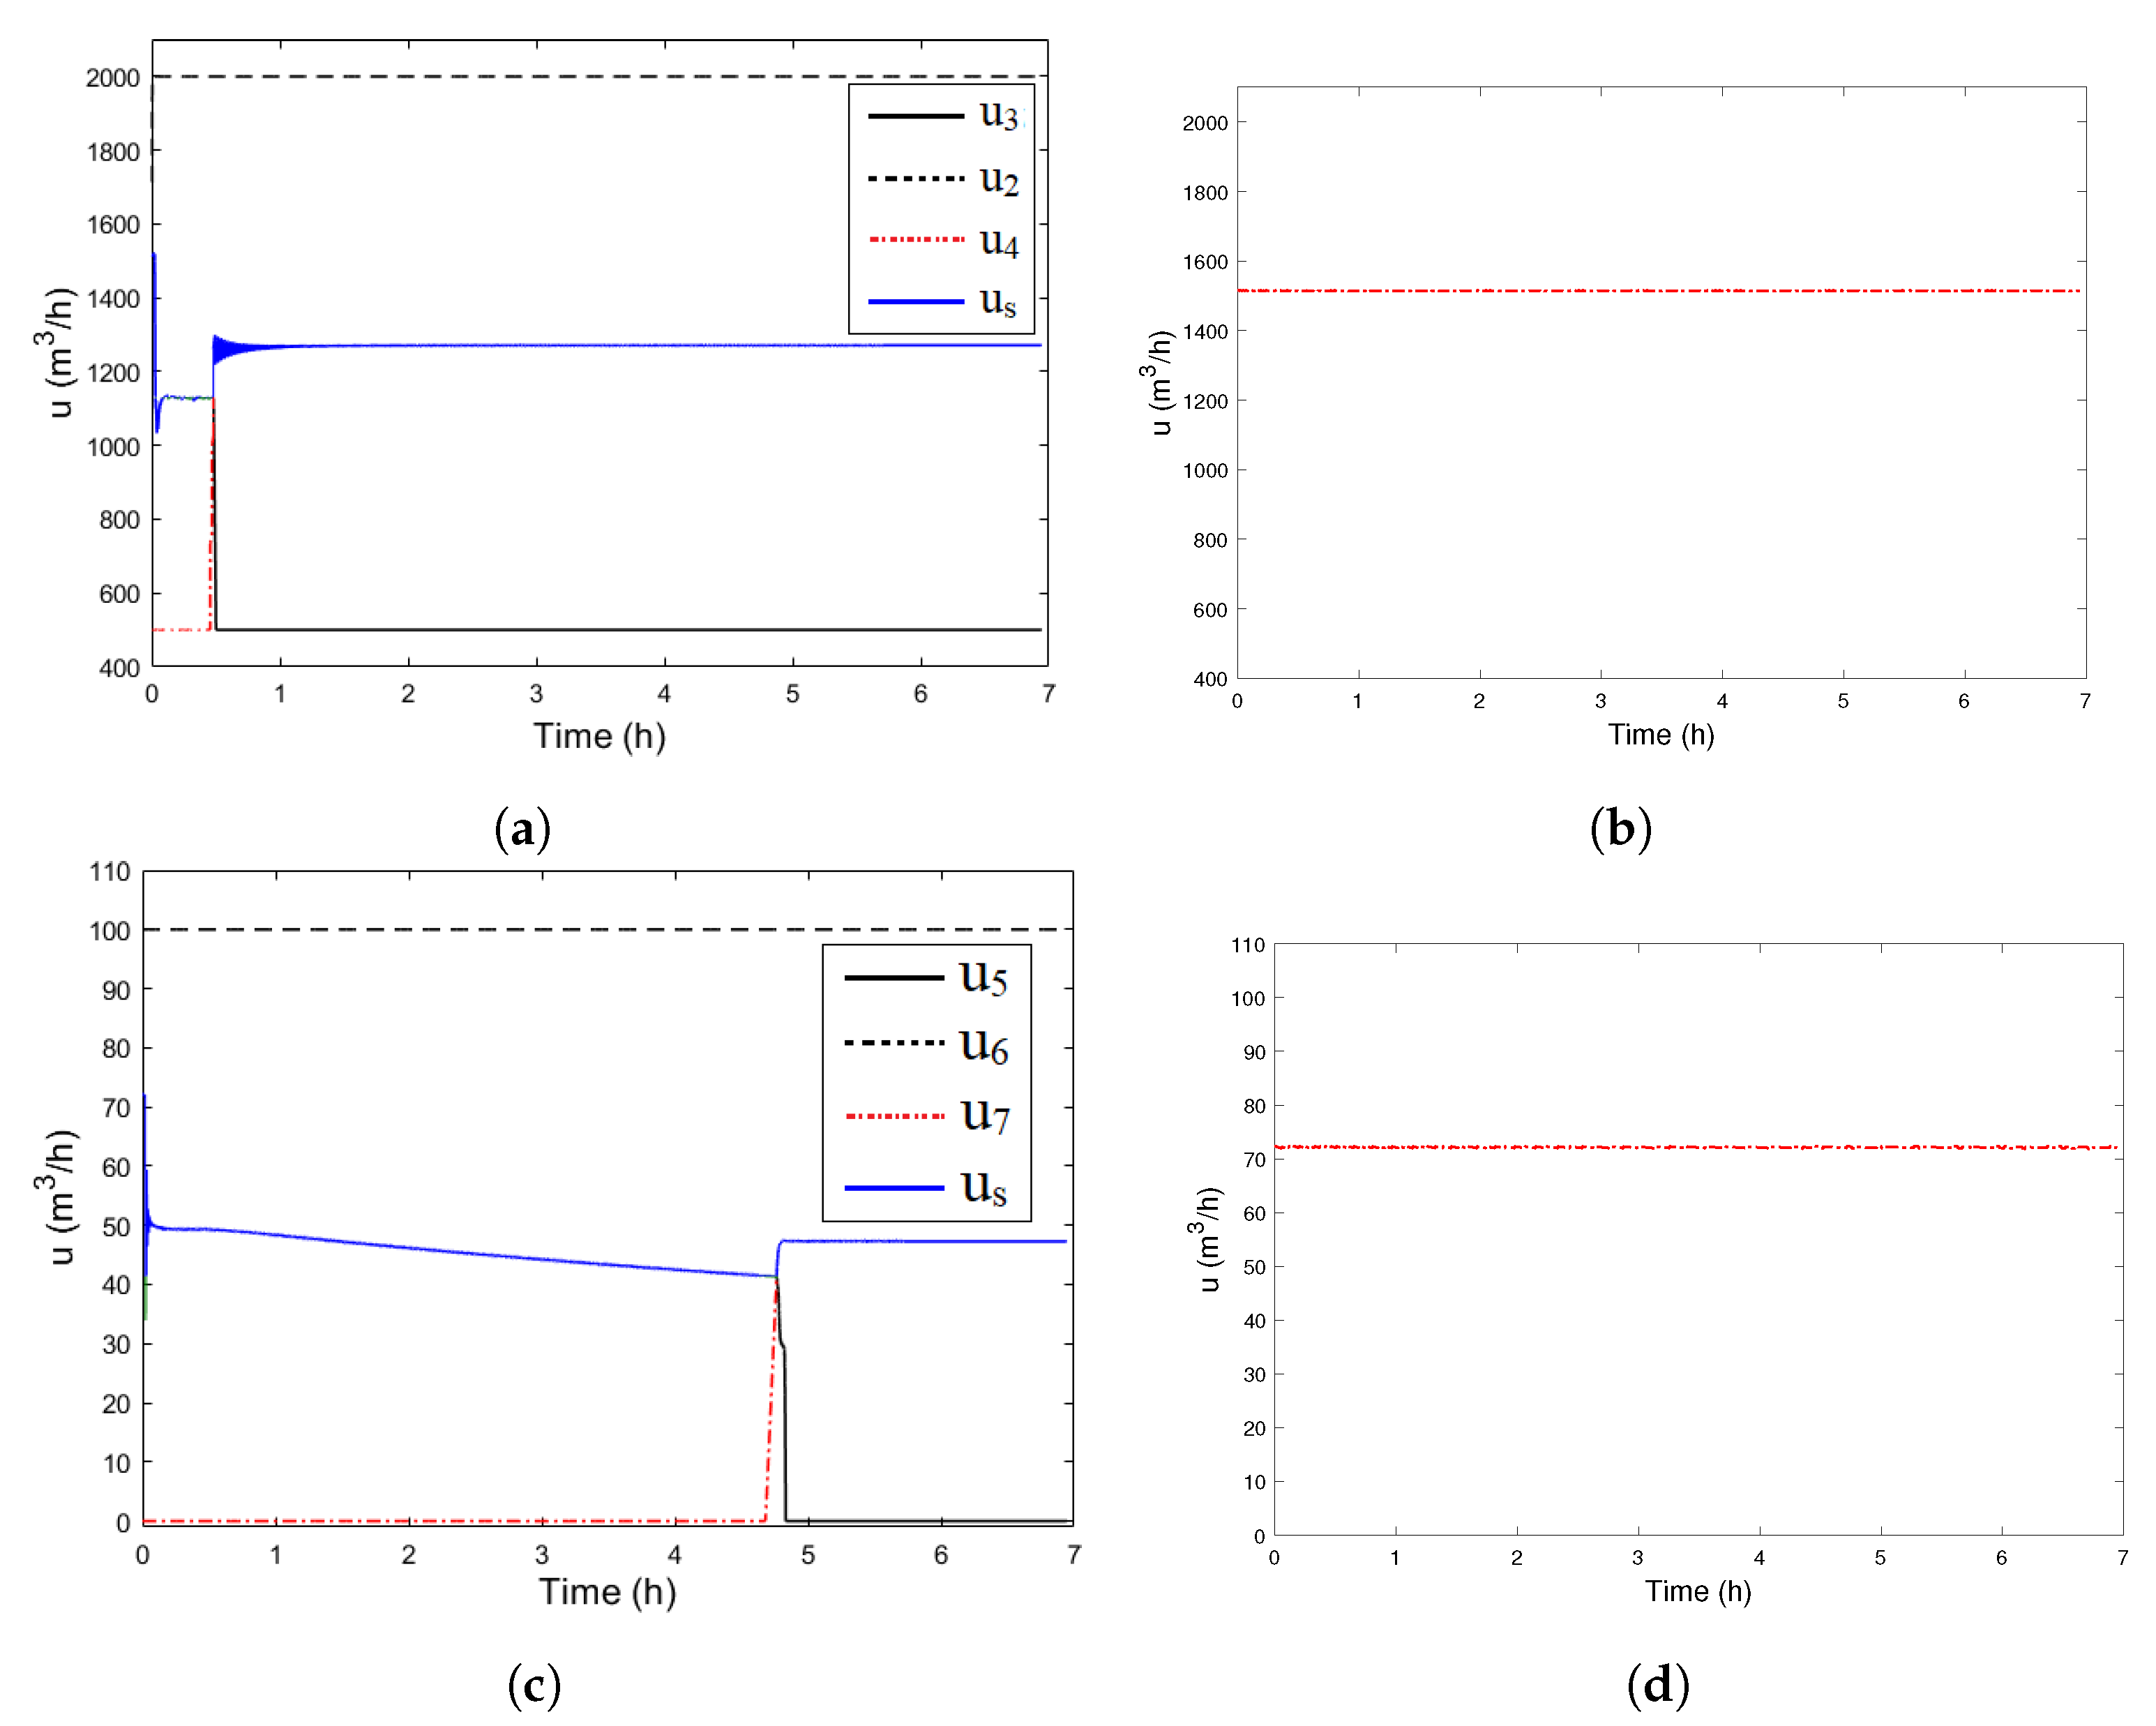
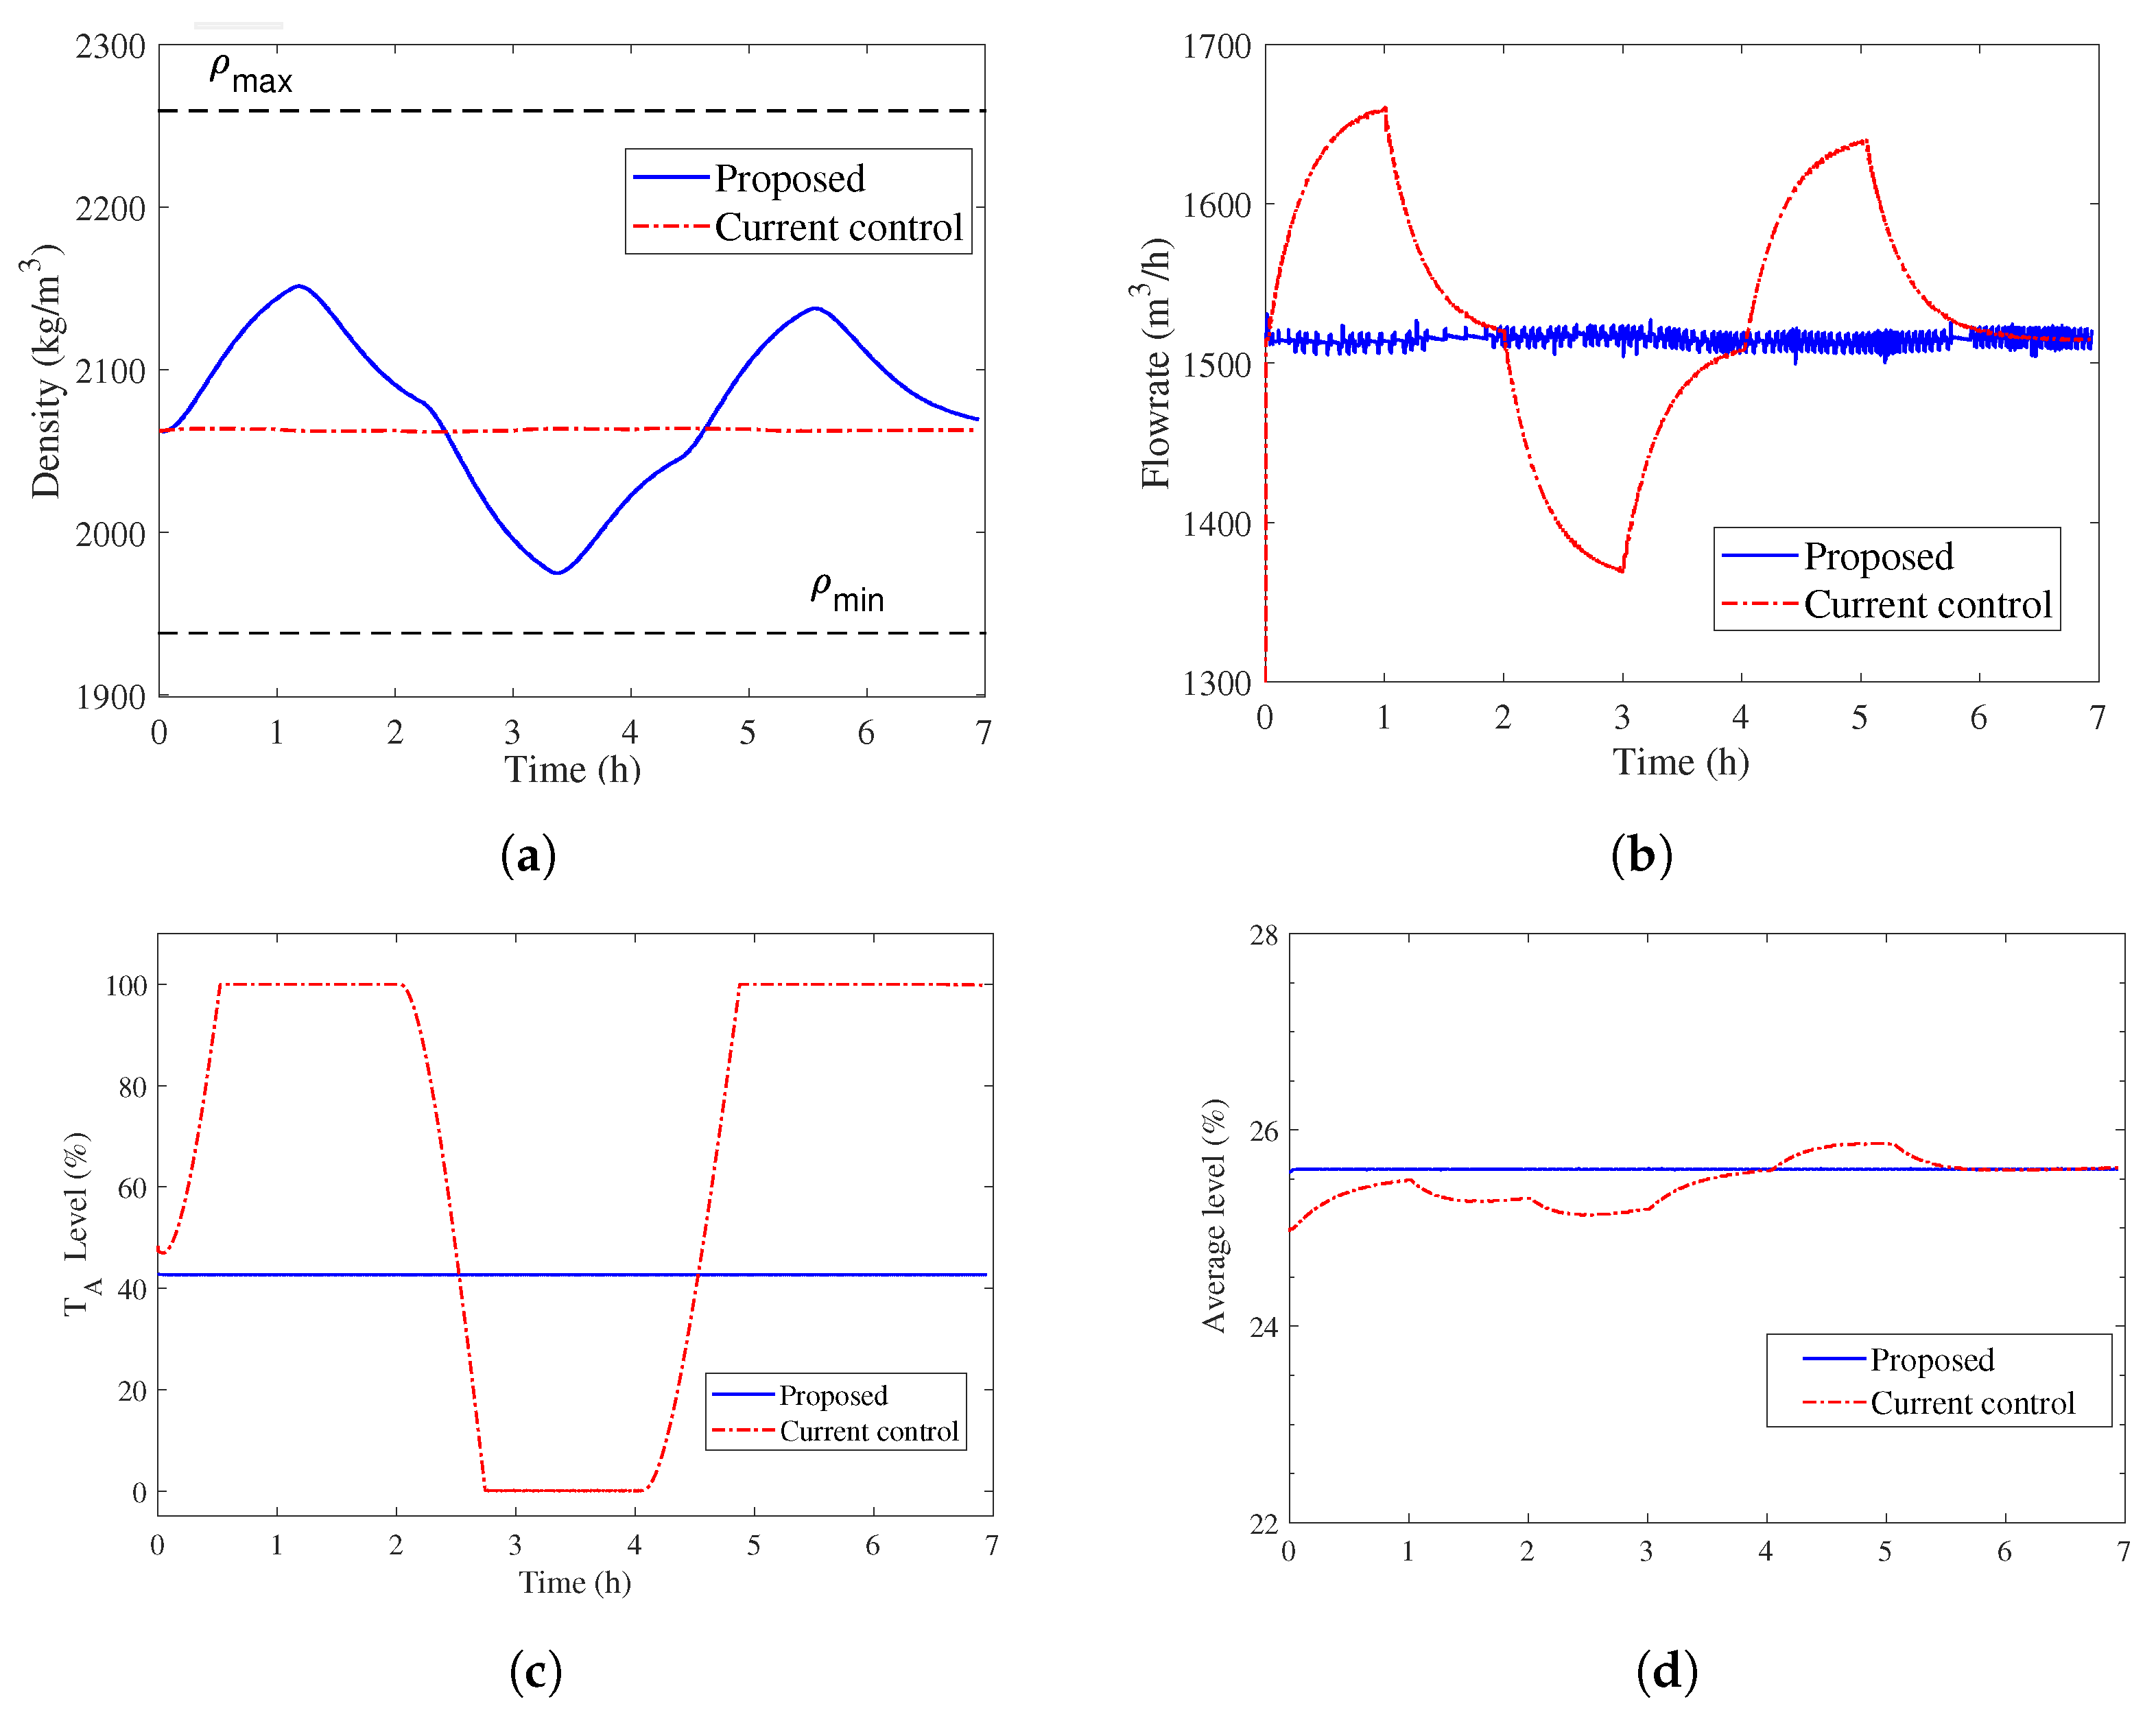
In this paper, a control strategy for an iron ore concentrate dewatering process was developed and evaluated by employing a dynamic model. The proposed strategy, based on ARC, could extend the operation period of the dewatering plant under disc filter failure. In the two-filter failure scenario, the time to storage tank overflow increases by approximately 5 h. This result indicates that the proposed control strategy has the potential to avoid material waste of approximately 2448.36 tons. In addition, the control strategy was also able to compensate for disturbances in the thickener feed rate and thickener feed density. Comparing the proposed strategy with the current and nonintegrated control strategies, it was observed that the proposed approach was able to control the average level of the buffer tanks by performing smoother manipulations in the underflow flow rate of the thickener. Smooth changes in the underflow flow rate allow for a more stable thickener operation, reducing the chance of low levels of the thicker layer and fewer variations in flocculant dosage. In addition, abrupt variations in density can impair the performance of filters that directly correlate to the density of the feed pulp. As demonstrated in the results, the proposed control strategy was able to reduce the amount of pulp that goes to the tailings dam. However, this control only postpones the overflow of the tanks, not completely eliminating material losses. This will only be achieved with physical changes to the process that require high investment. As future work, we intend to apply advanced control strategies based on artificial intelligence in order to anticipate the effect of filter failure. In addition, we will consider the effect of flocculant dosage on the thicker layer level.

Author Contributions

Conceptualization, Ê.L.J. and T.A.M.E.; methodology, Ê.L.J., M.T.d.S. and T.A.M.E.; software, Ê.L.J.; validation, Ê.L.J. and M.T.d.S.; formal analysis, M.T.d.S. and Ê.L.J.; investigation, Ê.L.J.; resources, M.T.d.S.; data curation, M.T.d.S.; writing—review and editing, M.T.d.S., T.A.M.E.; visualization, M.T.d.S.; supervision, T.A.M.E.; project administration, T.A.M.E.; funding acquisition, T.A.M.E. All authors have read and agreed to the published version of the manuscript.

Funding

This research was funded by the Brazilian agencies CAPES (Finance Code 001) and CNPq (grants 444425/2018-7 and 306394/2021-9).

Institutional Review Board Statement

Not applicable.

Informed Consent Statement

Not applicable.

Data Availability Statement

Not applicable.

Acknowledgments

The authors are grateful for the support provided by the Vale S.A and the Instituto Tecnológico Vale.

Conflicts of Interest

The authors declare no conflict of interest.

References

  1. Chaedir, B.A.; Kurnia, J.C.; Sasmito, A.P.; Mujumdar, A.S. Advances in dewatering and drying in mineral processing. Dry. Technol. 2021, 39, 1667–1684. [Google Scholar] [CrossRef]
  2. Gupta, A.; Yan, D.S. Mineral Processing Design and Operations: An Introduction; Elsevier: Amsterdam, The Netherlands, 2016. [Google Scholar]
  3. Tripathy, S.K.; Murthy, Y.R.; Farrokhpay, S.; Filippov, L.O. Design and analysis of dewatering circuits for a chromite processing plant tailing slurry. Miner. Process. Extr. Metall. Rev. 2021, 42, 102–114. [Google Scholar] [CrossRef]
  4. Michaux, B.; Hannula, J.; Rudolph, M.; Reuter, M.; van den Boogaart, K.; Möckel, R.; Kobylin, P.; Hultgren, M.; Peltomäki, M.; Roine, A.; et al. Water-saving strategies in the mining industry–the potential of mineral processing simulators as a tool for their implementation. J. Environ. Manag. 2019, 234, 546–553. [Google Scholar] [CrossRef] [PubMed]
  5. Diaz, P.; Salas, J.C.; Cipriano, A.; Núñez, F. Random forest model predictive control for paste thickening. Miner. Eng. 2021, 163, 106760. [Google Scholar] [CrossRef]
  6. Bergh, L.; Ojeda, P.; Torres, L. Expert Control Tuning of an Industrial Thickener. IFAC-PapersOnLine 2015, 48, 86–91. [Google Scholar] [CrossRef]
  7. Zhang, J.; Yin, X.; Liu, J. Economic MPC of deep cone thickeners in coal beneficiation. Can. J. Chem. Eng. 2016, 94, 498–505. [Google Scholar] [CrossRef]
  8. Jia, R.; Zhang, B.; He, D.; Mao, Z.; Chu, F. Data-driven-based self-healing control of abnormal feeding conditions in thickening–dewatering process. Miner. Eng. 2020, 146, 106141. [Google Scholar] [CrossRef]
  9. Magalhães, S.; Euzébio, T. Supervisory fuzzy controller for thickener underflow solids concentration on a simulated platform. In Proceedings of the 6th International Congress on Automation in Mining. GECAMIN, Santiago, Chile, 9–11 May 2018. [Google Scholar]
  10. Sbarbaro, D.; Ortega, R. Averaging level control: An approach based on mass balance. J. Process. Control. 2007, 17, 621–629. [Google Scholar] [CrossRef]
  11. Reyes-Lúa, A.; Backi, C.J.; Skogestad, S. Improved PI control for a surge tank satisfying level constraints. IFAC-PapersOnLine 2018, 51, 835–840. [Google Scholar] [CrossRef]
  12. Chai, T.; Li, H.; Wang, H. An intelligent switching control for the intervals of concentration and flow-rate of underflow slurry in a mixed separation thickener. IFAC Proc. Vol. 2014, 47, 338–345. [Google Scholar] [CrossRef] [Green Version]
  13. Zhao, D.; Chai, T.; Wang, H.; Fu, J. Hybrid intelligent control for regrinding process in hematite beneficiation. Control. Eng. Pract. 2014, 22, 217–230. [Google Scholar] [CrossRef]
  14. Lopes, E.; Ferreira, A.E.; Moreira, V.S.; Euzebio, T.A.M. Fuzzy Fault Tolerant Controller Applied in an Iron Ore Concentrate Dewatering Plant. In Proceedings of the 6th Congress on Automation in Mining; Congress on Automation in Mining, GECAMIN, Santiago, Chile, 9–11 May 2018. [Google Scholar]
  15. Olivier, L.E.; Craig, I.K. A survey on the degree of automation in the mineral processing industry. In Proceedings of the IEEE AFRICON, Cape Town, South Africa, 18–20 September 2017; pp. 404–409. [Google Scholar]
  16. Spitzer, D.W. Advanced Regulatory Control: Applications and Techniques; Momentum Press: New York, NY, USA, 2009. [Google Scholar]
  17. Muller, C.J.; Craig, I.K. Energy reduction for a dual circuit cooling water system using advanced regulatory control. Appl. Energy 2016, 171, 287–295. [Google Scholar] [CrossRef] [Green Version]
  18. Wiid, A.; le Roux, J.; Craig, I. Pressure buffering control to reduce pollution and improve flow stability in industrial gas headers. Control. Eng. Pract. 2021, 115, 104904. [Google Scholar] [CrossRef]
  19. Rajoria, A. Advanced process control for mineral processing operations. In Innovative Exploration Methods for Minerals, Oil, Gas, and Groundwater for Sustainable Development; Elsevier: Amsterdam, The Netherlands, 2022; pp. 357–369. [Google Scholar]
  20. Sbárbaro, D.; Del Villar, R. Advanced Control and Supervision of Mineral Processing Plants; Springer: Berlin/Heidelberg, Germany, 2010. [Google Scholar]
  21. Seborg, D.E.; Mellichamp, D.A.; Edgar, T.F.; Doyle III, F.J. Process Dynamics and Control; John Wiley & Sons: Hoboken, NJ, USA, 2010. [Google Scholar]
  22. Euzébio, T.A.M.; Silva, M.T.D.; Yamashita, A.S. Decentralized PID Controller Tuning Based on Nonlinear Optimization to Minimize the Disturbance Effects in Coupled Loops. IEEE Access 2021, 9, 156857–156867. [Google Scholar] [CrossRef]
  23. Skogestad, S. Simple analytic rules for model reduction and PID controller tuning. J. Process. Control. 2003, 13, 291–309. [Google Scholar] [CrossRef] [Green Version]
Figure 1. The dewatering process.
Sustainability 14 09347 g001
Figure 2. Closed-loop control system.
Sustainability 14 09347 g002
Figure 3. Percentage of filter failures.
Sustainability 14 09347 g003
Figure 4. Simplified diagram of the dewatering process.
Sustainability 14 09347 g004
Figure 5. Proposed control strategy—pulp storage and transportation.
Sustainability 14 09347 g005
Figure 6. Proposed control strategy—thickening.
Sustainability 14 09347 g006
Figure 7. Schematic diagram of the simulation framework.
Sustainability 14 09347 g007
Figure 8. Process variables—filter failure case, (a) density of the underflow, (b) flow rate of the underflow, (c) level—storage tank, (d) average level—buffer tanks.
Sustainability 14 09347 g008
Figure 9. Manipulated variables—filter failure case, (a) setpoint of loop FIC02—proposed control, (b) Setpoint of loop FIC02—current control, (c) BP-005 frequency ( T P 1 )—proposed control, (d) BP-005 frequency ( T P 1 )—current control.
Sustainability 14 09347 g009
Figure 10. Failure time of two filters.
Sustainability 14 09347 g010
Figure 11. Thickener feeding disturbance.
Sustainability 14 09347 g011
Figure 12. Process variables—thickener feeding disturbance, (a) density of the underflow, (b) flow rate of the underflow, (c) level—storage tank, (d) average level—buffer tanks.
Sustainability 14 09347 g012
Figure 13. Manipulated variables—thickener feeding disturbance, (a) setpoint of loop FIC02—proposed control, (b) setpoint of loop FIC02—current control, (c) BP-005 frequency ( T P 1 )—proposed control, (d) BP-005 frequency ( T P 1 )—current control.
Sustainability 14 09347 g013
Table 1. PI parameters of the current control strategy.
Loop K p T i λ
FIC020.072.251.88
DIC01−65.831382.3030.00
LIC03/04/0524.2466.0010.00
Table 2. Loops of the dewatering system.
LoopManipulated
Variables
Controlled
Variables
VariableNameVariableName
FIC02 u 1 BP-001
frequency
y 1 Thickened
flow
DIC01 u 2 SP thickener
outlet flow
y 2 Underflow
density
DIC02 u 3 y 2
LIC02 u 4 y 3 Average
level TPs
LIC03 u 5 BP-005
frequency
y 7 T A level
T P 1 level
LIC06 u 6 y 4
LIC09 u 7 y 4
LIC04 u 8 BP-006
frequency
y 7 T A level
T P 2 level
LIC07 u 9 y 5
LIC10 u 10 y 5
LIC05 u 11 BP-007
frequency
y 7 T A level
T P 3 level
LIC08 u 12 y 6
LIC11 u 13 y 6
Table 3. Control loops of the buffer tanks.
LoopDescriptionTankMVPV
LIC03Storage tank level controllers T A u 5 y 7
LIC04 u 8 y 7
LIC05 u 11 y 7
LIC06Minimum level restriction
controllers for each buffer tank
T P 1 u 6 y 4
LIC07 T P 2 u 9 y 5
LIC08 T P 3 u 12 y 6
LIC09Maximum level restriction
controllers for each buffer tank
T P 1 u 7 y 4
LIC10 T P 2 u 10 y 5
LIC11 T P 3 u 13 y 6
Table 4. Control loops of the thickening.
LoopDescriptionMVB
LIC02Buffer tank medium level controller (master) u 2 y 3
DIC01Minimum density restriction controller (master) u 3 y 2
DIC02Maximum density restriction controller (master) u 4 y 2
FIC02Underflow flow rate controller (slave) u 1 y 1
Table 5. PI parameters of the proposed control.
Loop K p T i λ
FIC020.072.251.88
DIC01/02−65.831382.3030.00
LIC021372.6086.0015.00
LIC06-11−29.559014.0050.00
LIC03/04/0524.2466.0010.00
Publisher’s Note: MDPI stays neutral with regard to jurisdictional claims in published maps and institutional affiliations.

