1. Introduction
Manufacturing is considered an important way for latecomers to catch up with developed countries. Since the reform and opening-up, the ratio of manufacturing output to GDP has been continuing to increase. According to China Statistical Yearbooks, the peak in China’s manufacturing value added as a share of GDP was in 2007, about 32.9%. Since then, the ratio of manufacturing output to GDP has been continuing to decline, dropping to 26.2% in 2020, down 6 percentage points, becoming the country with the biggest decline among the major manufacturing countries. The continuous decline in the share of manufacturing value added in GDP in China has caused a wide and long-lasting discussion in academia. Some scholars referred to the international experience and conducted comparative analyses based on the development stage corresponding to per capita GDP [
1,
2].
They showed that China’s manufacturing industry is still in the stage of shallow industrialization with volume expansion, low quality and competitiveness, and China is still a lower–middle-income country when the share of manufacturing value added in GDP declines, showing a premature de-industrialization trend. Huang [
3] believed that after China enters the upper–middle income stage, manufacturing will an important driver of economic growth, and the decline in its share of added value will increase the risk of China falling into the “middle-income trap”. China’s 14th Five-Year Plan also calls for keeping the share of manufacturing value added in GDP basically stable. Total factor productivity (TFP) is an important driving force for the sustainable development of the manufacturing industry. As the constraints of climate change and energy security gradually increase, green total factor productivity (GTFP) is also included in the meaning of the topic [
4,
5], that is, to take a green and low-carbon transformation road to achieve a win-win situation for industrial development and environmental protection. Therefore, it is necessary to measure green total factor productivity in China’s manufacturing industry and provide a basis for the relevant departments to understand the development status of the manufacturing industry.
At present, scholars mainly use data envelopment analysis (DEA) to measure green total factor productivity in China’s manufacturing industry, and the research mainly focuses on two aspects. First, one can measure green total factor productivity of the manufacturing industry in each province by using provincial panel data [
6,
7,
8,
9,
10,
11,
12,
13,
14]. Second, one can measure green total factor productivity of the manufacturing sub-sectors by using manufacturing panel data [
15,
16,
17,
18,
19]. In the research on green total factor productivity of the manufacturing sub-sectors, most scholars use labor, capital stock and energy consumption as input indicators, industrial output as desirable output, and pollutant emissions as undesirable output. As the industrial output data of China’s manufacturing sub-sectors have not been released since 2012, most studies could only measure green total factor productivity of the industrial sectors before 2013. This study uses the industrial added value rate (industrial added value/industrial output) to estimate the industrial output of China’s manufacturing sub-sectors, thus expanding the time range of the industrial output data. Based on the above data, we measure the green total factor productivity of 26 manufacturing sub-sectors in China from 2004 to 2017, which can better reflect the status quo of China’s manufacturing industry’s green total factor productivity in recent years. In addition, this study further divides the manufacturing industry into the equipment and high-tech manufacturing industry, consumer goods manufacturing industry and energy-intensive manufacturing industry, so as to analyze the green total factor productivity in various manufacturing industries. Methodologically, we combine the super-SBM model with the GML index and include undesirable outputs to measure GTFP in China’s manufacturing industry.
Compared with the existing literature, the main innovations of this paper are as follows: first, we estimate the industrial output for the manufacturing sub-sectors, extending the time range of this data. The estimated data allow us to measure China’s manufacturing industry green total factor productivity in recent years. Second, compared with the usual analysis of the manufacturing industry as a whole, we divide the manufacturing industry into the manufacturing industry into the equipment and high-tech manufacturing industry, consumer goods manufacturing and energy-intensive manufacturing industry, and analyze the green total factor productivity for the above the three sub-categories of manufacturing. Third, considering that there may be infeasible solutions or non-transferability in calculating green total factor productivity using the adjacent frontier reference, we use global references to measure green total factor productivity.
The rest of the paper is organized as follows:
Section 2 reviews the relevant literature.
Section 3 introduces the method and data.
Section 4 analyzes the empirical results.
Section 5 ends with the conclusions and implications.
2. Literature Review
Total factor productivity (TFP) is considered a source of economic growth. Sustainable economic growth depends on endogenous technological progress [
20,
21,
22]. The main methods to measure total factor productivity include Solow residual, stochastic frontier analysis and data envelopment analysis (DEA). Among them, Solow residual method is developed based on the work of Solow [
23]. Generally speaking, the Solow residual method is a “black box”. Therefore, at present, scholars mainly use stochastic frontier analysis and DEA to measure total factor productivity. Stochastic frontier analysis is a parametric method based on econometric regression analysis, which requires a deep understanding of specific economic operations. DEA is a non-parametric method, the weight does not need to be calculated and method is more objective and comprehensive. Therefore, DEA is the most common method used by scholars to measure total factor productivity. The actual production process is bound to be accompanied by pollutants, which will harm the ecological environment. Therefore, incorporating undesirable out into the framework of TFP analysis is important in order to better coordinate the relationships between energy, the environment, and economic growth. The TFP index that considers undesirable outputs usually refers to green total factor productivity (GTFP). Regarding GTFP measurement, based on the pioneering work of Chung et al. [
24], many researchers have employed the directional distance function (DDF), which can consider undesirable outputs to calculate the Malmquist–Luenberger (ML) productivity index. For example, Li and Lin [
25] measured the GTFP of twenty-eight of China’s two-digit manufacturing sectors during the 11th FYP (2006–2010). Chen et al. [
16] measured the green total factor productivity growth of China’s 36 industrial sectors from 2000 to 2014.
However, most of these studies were mostly limited to radial and oriented methods, and cannot effectively overcome the measurement bias caused by radial or oriented selection. Therefore, Fukuyama and Weber [
26] established a more general slack based measure (SBM) directional distance function, following the non-radial and non-oriented basis proposed by Tone [
27], which is highly favored by scholars. For example, Xie et al. [
28] evaluated the industrial “green” productivity growth rates of China’s 30 provinces. Based on the panel data of OECD countries’ industrial sectors, Wang et al. [
29] analyzed the stringency of environmental regulation policies and measured the green productivity growth using an extended SBM-DDF approach. Liu et al. [
30] used the super-SBM model to calculate China’s agricultural green total factor productivity based on carbon emissions.
In view of the fact that the ML index, usually calculated with the adjacent frontier, may have no feasible solution or the index is not transitive, Oh [
31] constructed a global production possibility set and presented the global Malmquist–Luenberger (GML) productivity index. Since then, several scholars have evaluated GTFP with the GML index. For example, Li and Wu [
32] measured green total factor productivity in 273 cities of China in 2003–2013. Yang et al. [
33] adopted the Luenberger indicator to estimate the GPP of China’s 36 industrial sub-sectors over 2001–2013. Zhu et al. [
8] combined the SBM model with the GML index to analyze the GTFP of China’s mining and quarrying industry for the period of 1991–2014. Liu and Xin [
34] used a GML index based on SBM directional distance function to evaluate provincial GTFP in China.
The current GTFP research is primarily based on calculations and analyses of the regional economy. A few studies have focused on the GTFP of the industrial sector. As the industrial output data of China’s manufacturing sub-sectors have not been released since 2012, most studies could only measure green total factor productivity of the industrial sectors before 2013. This study uses the industrial added value rate (industrial added value/industrial output) to estimate the industrial output of China’s manufacturing sub-sectors, thus expanding the time range of the industrial output data. Based on the above data, we measure the green total factor productivity of 26 manufacturing sub-sectors in China from 2004 to 2017, which can better reflect the status quo of China’s manufacturing industry’s green total factor productivity in recent years.
3. Methods and Data
3.1. Methods
In this study, we combine the super-SBM model with the GML index and include undesirable outputs to measure GTFP in China’s manufacturing industry. First, when applying the GML index to measure GTFP, it is necessary to construct a set of global production possibilities that includes desirable outputs and undesirable outputs. If one supposes that there are
decision making units (DMU), each uses
inputs and produces
desirable outputs and
undesirable outputs. The vectors of three factors for
are given by
,
and
, respectively. Therefore, the current production possibility set
can be expressed as the following:
where
represents the weight of each cross-section observation value. If
indicates constant returns to scale, then
,
indicates variable returns to scale. However, because technology retrogression may occur in
, Oh [
31] constructed the global production possibilities set
, which is as follows:
Second, this study draws on the research of Fukuyama and Weber [
26] to define the current SBM directional distance function that covers undesirable outputs as follows:
where
represents the direction vectors for decreasing inputs, increasing desirable outputs and decreasing undesirable outputs, respectively.
represents the slack vectors for redundant inputs, inadequate desirable outputs and redundant undesirable outputs, respectively. The global SBM directional distance function is as follows:
Third, referring to the work of Oh [
31], this study constructs a GML index based on SBM directional distance function, which can also be derived as the green technical efficiency change index GEC and the green technological progress change index GTC. GEC represents the improvement of management systems and resource allocation methods. GTC mainly represents the improvement of production technologies and manufacturing skills.
where
and
represent the current and global SBM directional distance functions. If the GML index is greater than 1, it represents GTFP growth. If it is less than 1, it represents GTFP decline. If it is equal to 1, the GTFP is in a stable state, as are the GEC and the GTC. We use MaxDEA software for calculation.
3.2. Data
Considering data availability and data statistical consistency, we use a panel dataset of annual data on twenty-six two-digit industrial sectors (
Table 1) between 2003 and 2017, classified according to the 2017 version of the National Standard of Industrial Classification (GB/T 4754-2017). With reference to [
15,
16], we set the input indicators as labor, capital stock and energy consumption, set the desirable output as the industrial output, and set the undesirable output as carbon dioxide emissions. The data sources and specific processing procedures are as follows.
Labor is measured by the average annual number of employees of industrial enterprises above a designated size in the manufacturing industry. Relevant data come from the China Industrial Statistics Yearbook.
For capital stock, the calculation method of capital stock adopts the method of Chen [
35]. Different capital depreciation rates are set for different industries in different years (depreciation in the current year/original value of fixed assets in the previous year). The initial capital stock in 2003 was directly taken from the research results of Chen [
35]. The price adopts the 2003 constant price. Relevant data come from the China Industrial Statistical Yearbook and China Fixed Asset Investment Statistical Yearbook.
Energy consumption is measured by the energy consumption of industrial enterprises above a designated size in the manufacturing industry. Relevant data come from the China Energy Statistical Yearbook.
Desirable output is measured by the industrial output of industrial enterprises above a designated size in the manufacturing industry. Since energy consumption is an obvious industrial intermediate input, industrial output is used as the desirable output. Since 2012, the industrial output data of China’s manufacturing sub-sectors have not been released. In this study, the industrial added value rate (industrial added value/total industrial output value) is used to estimate the industrial output of China’s manufacturing sub-sectors. First, we used the year-on-year growth rate of industrial added value to calculate the industrial added value of the manufacturing industry after 2007. Second, using the 2012 China Input-Output Table and 2017 China Input-Output Table to calculate the industrial added value rate of the manufacturing sub-sectors in 2012 and 2017, it is found that the average change in the value-added rate of the 26 manufacturing sub-sectors during the 5 years is 2.5%. It can be observed that the added value rate of the manufacturing industry is relatively stable in the short term, so it is reasonable to use the linear interpolation method to supplement the data from 2013 to 2016. Finally, the industrial output of the 26 manufacturing sub-sectors during this period are estimated by multiplying the industrial value added and the industrial added value rate. The price adopts the 2003 constant price. Relevant data come from the China Industrial Statistics Yearbook, 2012 China Input-Output Table and 2017 China Input-Output Table.
Undesirable output is measured using the CO2 emissions of the manufacturing sub-sectors. Relevant data come from China Emission Accounts and Datasets (CEADs).
To sum up, there are 390 observations in total and the descriptive statistics of the original data are portrayed in
Table 2.
Table 3 shows the Pearson correlation coefficients. It can be observed that the correlation coefficients between the input and output variables are all positive. We also use Pearson correlation analysis to test the correlation between the input and output variables. The test results show that there is a positive correlation between the input and output variables at the significance level of 1%. In other words, if input increases, output will increase accordingly. Therefore, the isotonicity property is satisfied.
4. Analysis of Measurement Results
4.1. Green Total Factor Productivity and Its Decomposition in China’s Manufacturing Industry
As shown in
Table 4, during the period from 2004 to 2017, the average annual growth rate of GTFP in China’s manufacturing industry is 1.67%, the average annual growth rate of GTC is 3.16% and the average annual growth rate of GEC is 1.44%. Overall, during the sample period, the GTFP of China’s manufacturing industry continues to improve, mainly driven by the GTC, while the overall GEC is declining.
According to the analysis by period, it can be observed that the growth rate of GTFP in China’s manufacturing industry and the growth rate of GTC are highest in the 10th Five-Year Plan. This is because China’s “late-mover advantage” is most obvious at the beginning of the sample period. According to the research of Barro and Sala-i-Martin [
36], latecomers can learn from the development experience of the developed countries and cross some necessary development stages in the developed countries, so as to realize the catch-up with the developed countries. The speed of catch-up is proportional to the technological gap [
37]. In addition, China was still in the early stage of industrialization during the 10th Five-Year Plan period [
38], and the industrial structure was not particularly robust. During the 10th Five-Year Plan period, China officially joined the World Trade Organization and carried out various reforms in its economic system, which made China enter a stage of rapid industrialization development in the 11th Five-Year Plan. The aggravation of the industrial structure and the weakening of the late-mover advantage have led to a significant slowdown in China’s GTFP growth rate and GTC. During the 12th Five-Year Plan period, China entered the late stage of industrialization, and China’s economy has entered a new normal. During this period, the report of the 18th National Congress of the Communist Party of China proposed an innovation-driven development strategy and incorporated the construction of ecological civilization into the overall layout of the cause of socialism with Chinese characteristics. Therefore, during the 12th Five-Year Plan period, the growth rate of China’s GTC began to accelerate, with an average annual growth rate of 3.14%, which is significantly higher than the 1.07% during the 12th Five-Year Plan period. However, it should be pointed out that with the economy entering a new normal, China’s economy and society have also entered a new period of reform, and the policy instability during the economic transition has also caused a certain loss of efficiency. During this period, the GEC in China’s manufacturing industry experienced a relatively large decline stage, with an average annual decline of 3.27%, which also led to a small decline in China’s manufacturing GTFP during the 12th Five-Year Plan period, with an average annual decline of 0.23%. During the 13th Five-Year Plan period, the growth rate of GTC in China’s manufacturing industry further accelerated, with an average annual growth rate of 3.83%. At the same time, after going through the painful period of economic reform, the growth rate of GEC also became greater than 1, with an average annual growth rate of 1.29%. The acceleration of green technology progress and the improvement of green technical efficiency have jointly driven the GTFP of China’s manufacturing industry to enter a rapid upward trajectory during the 13th Five-Year Plan period, with an average annual growth rate of 5.16%.
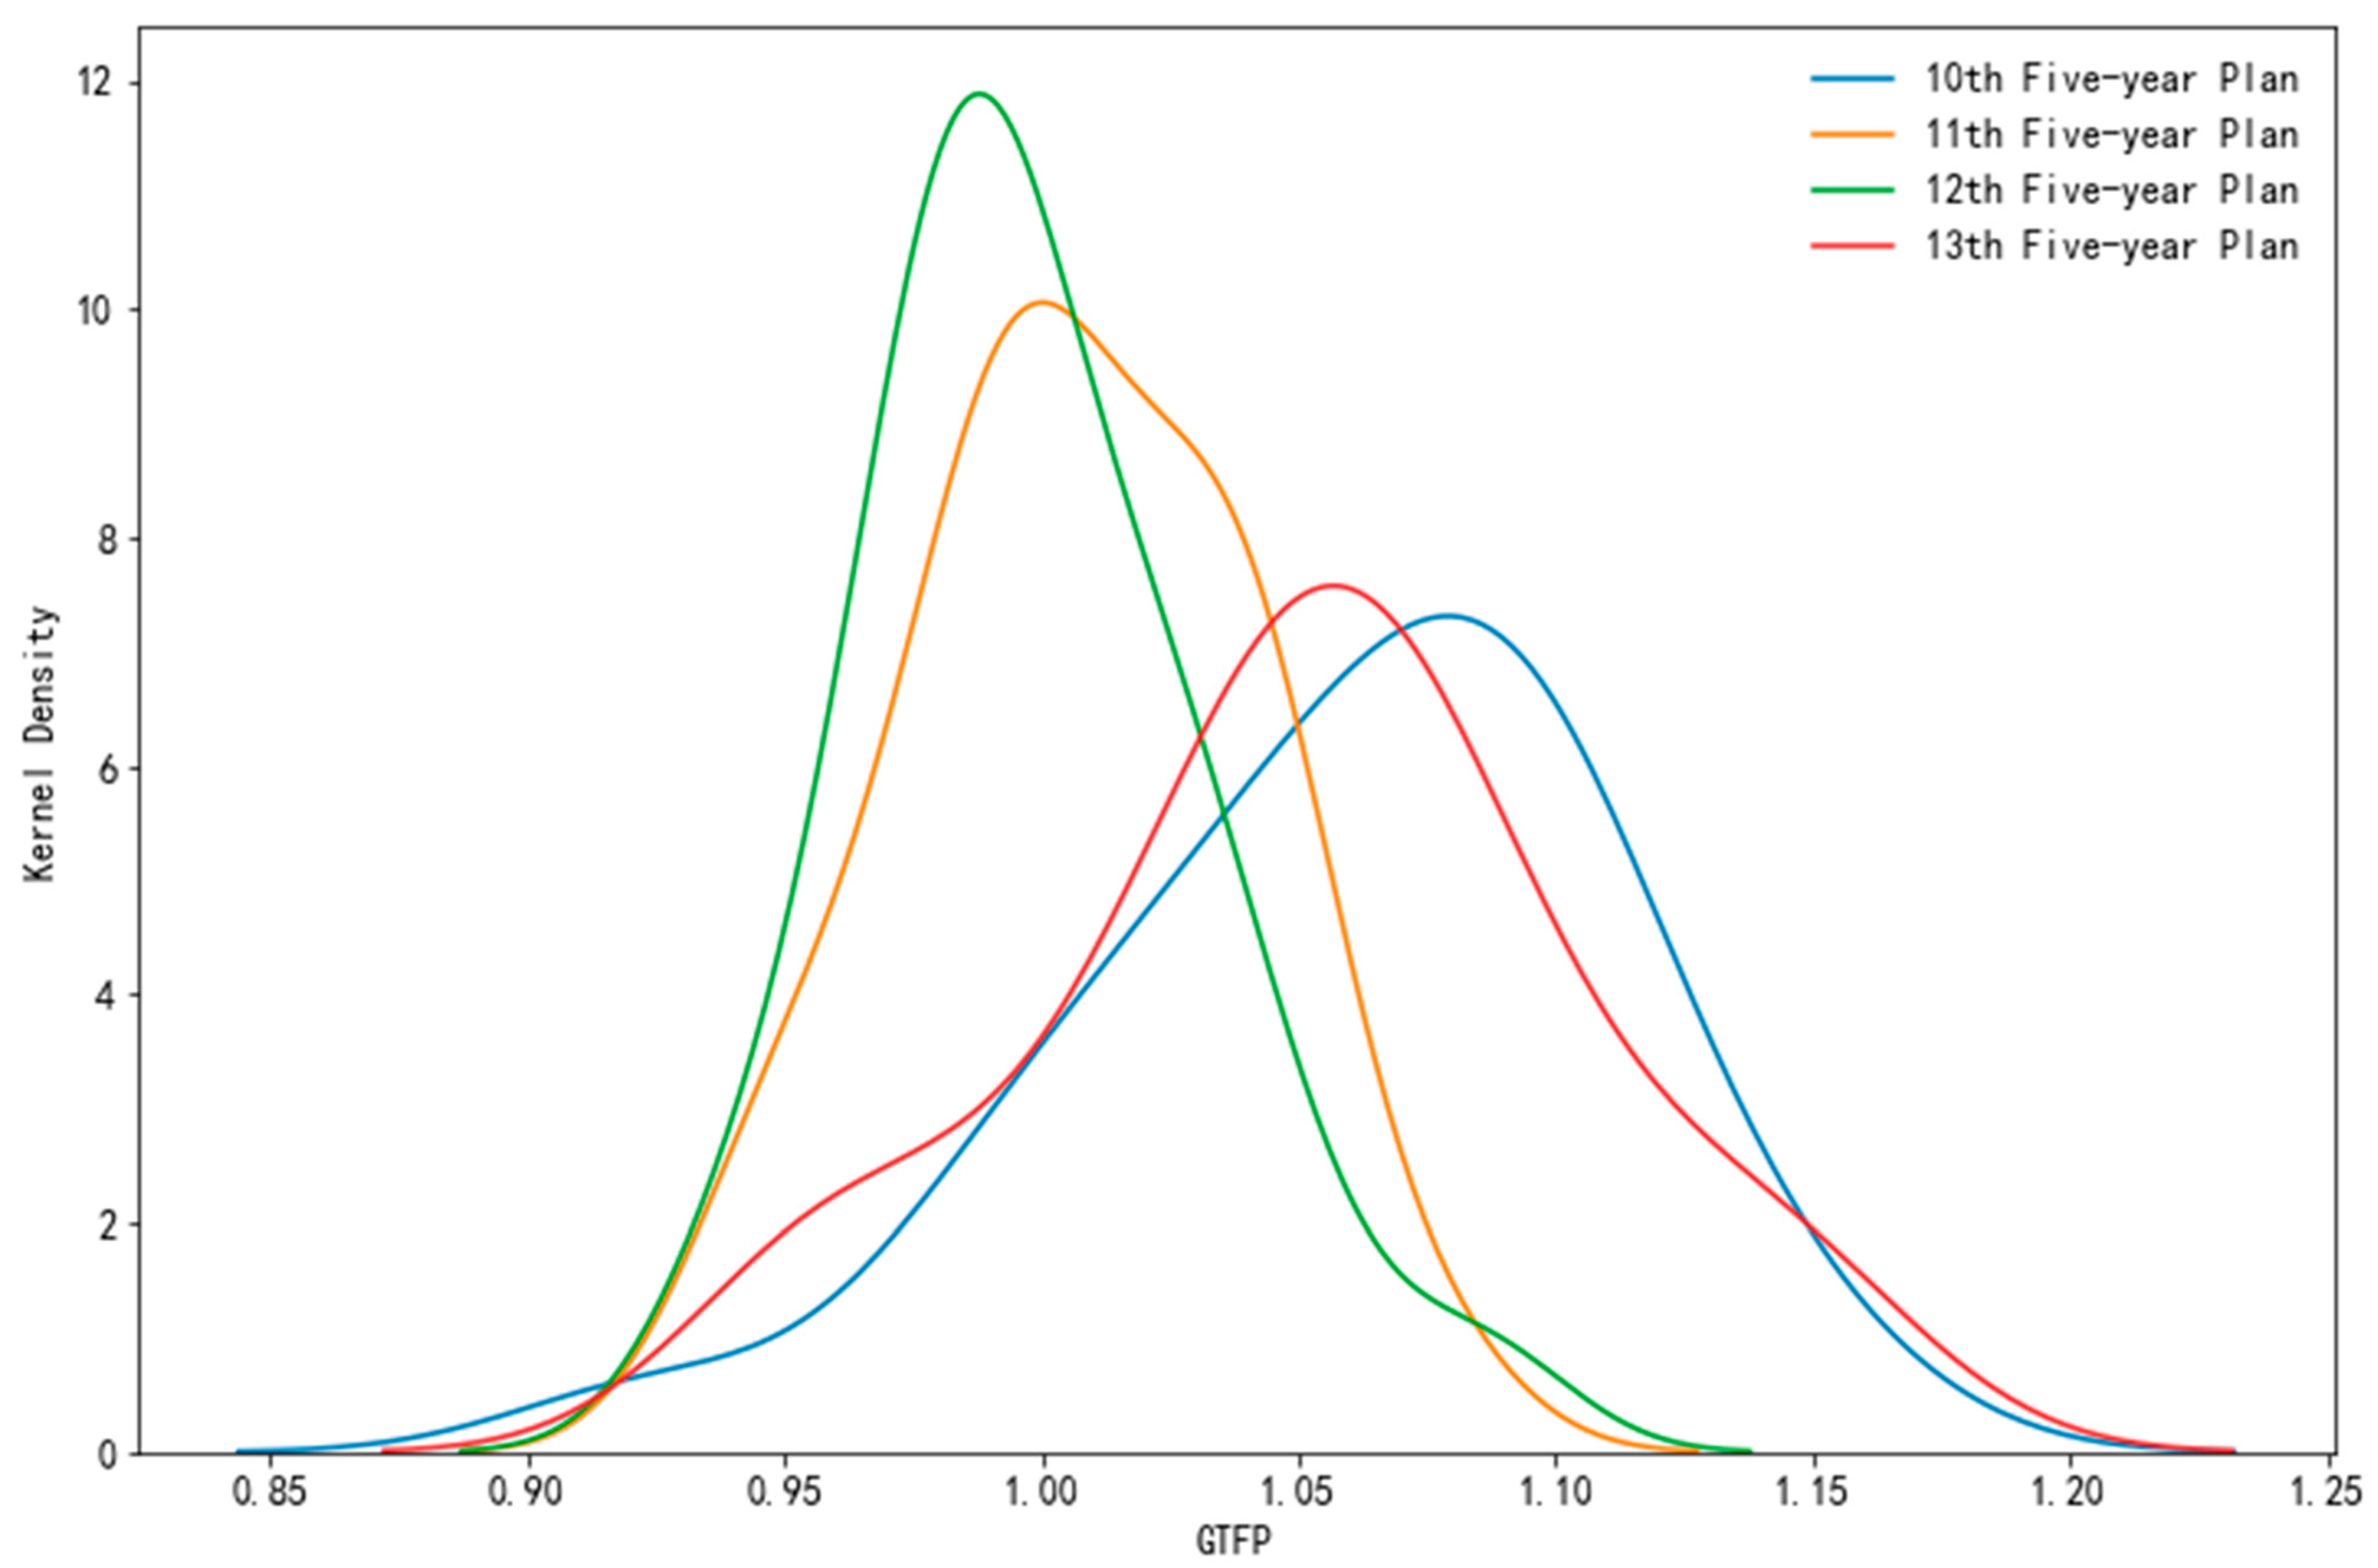
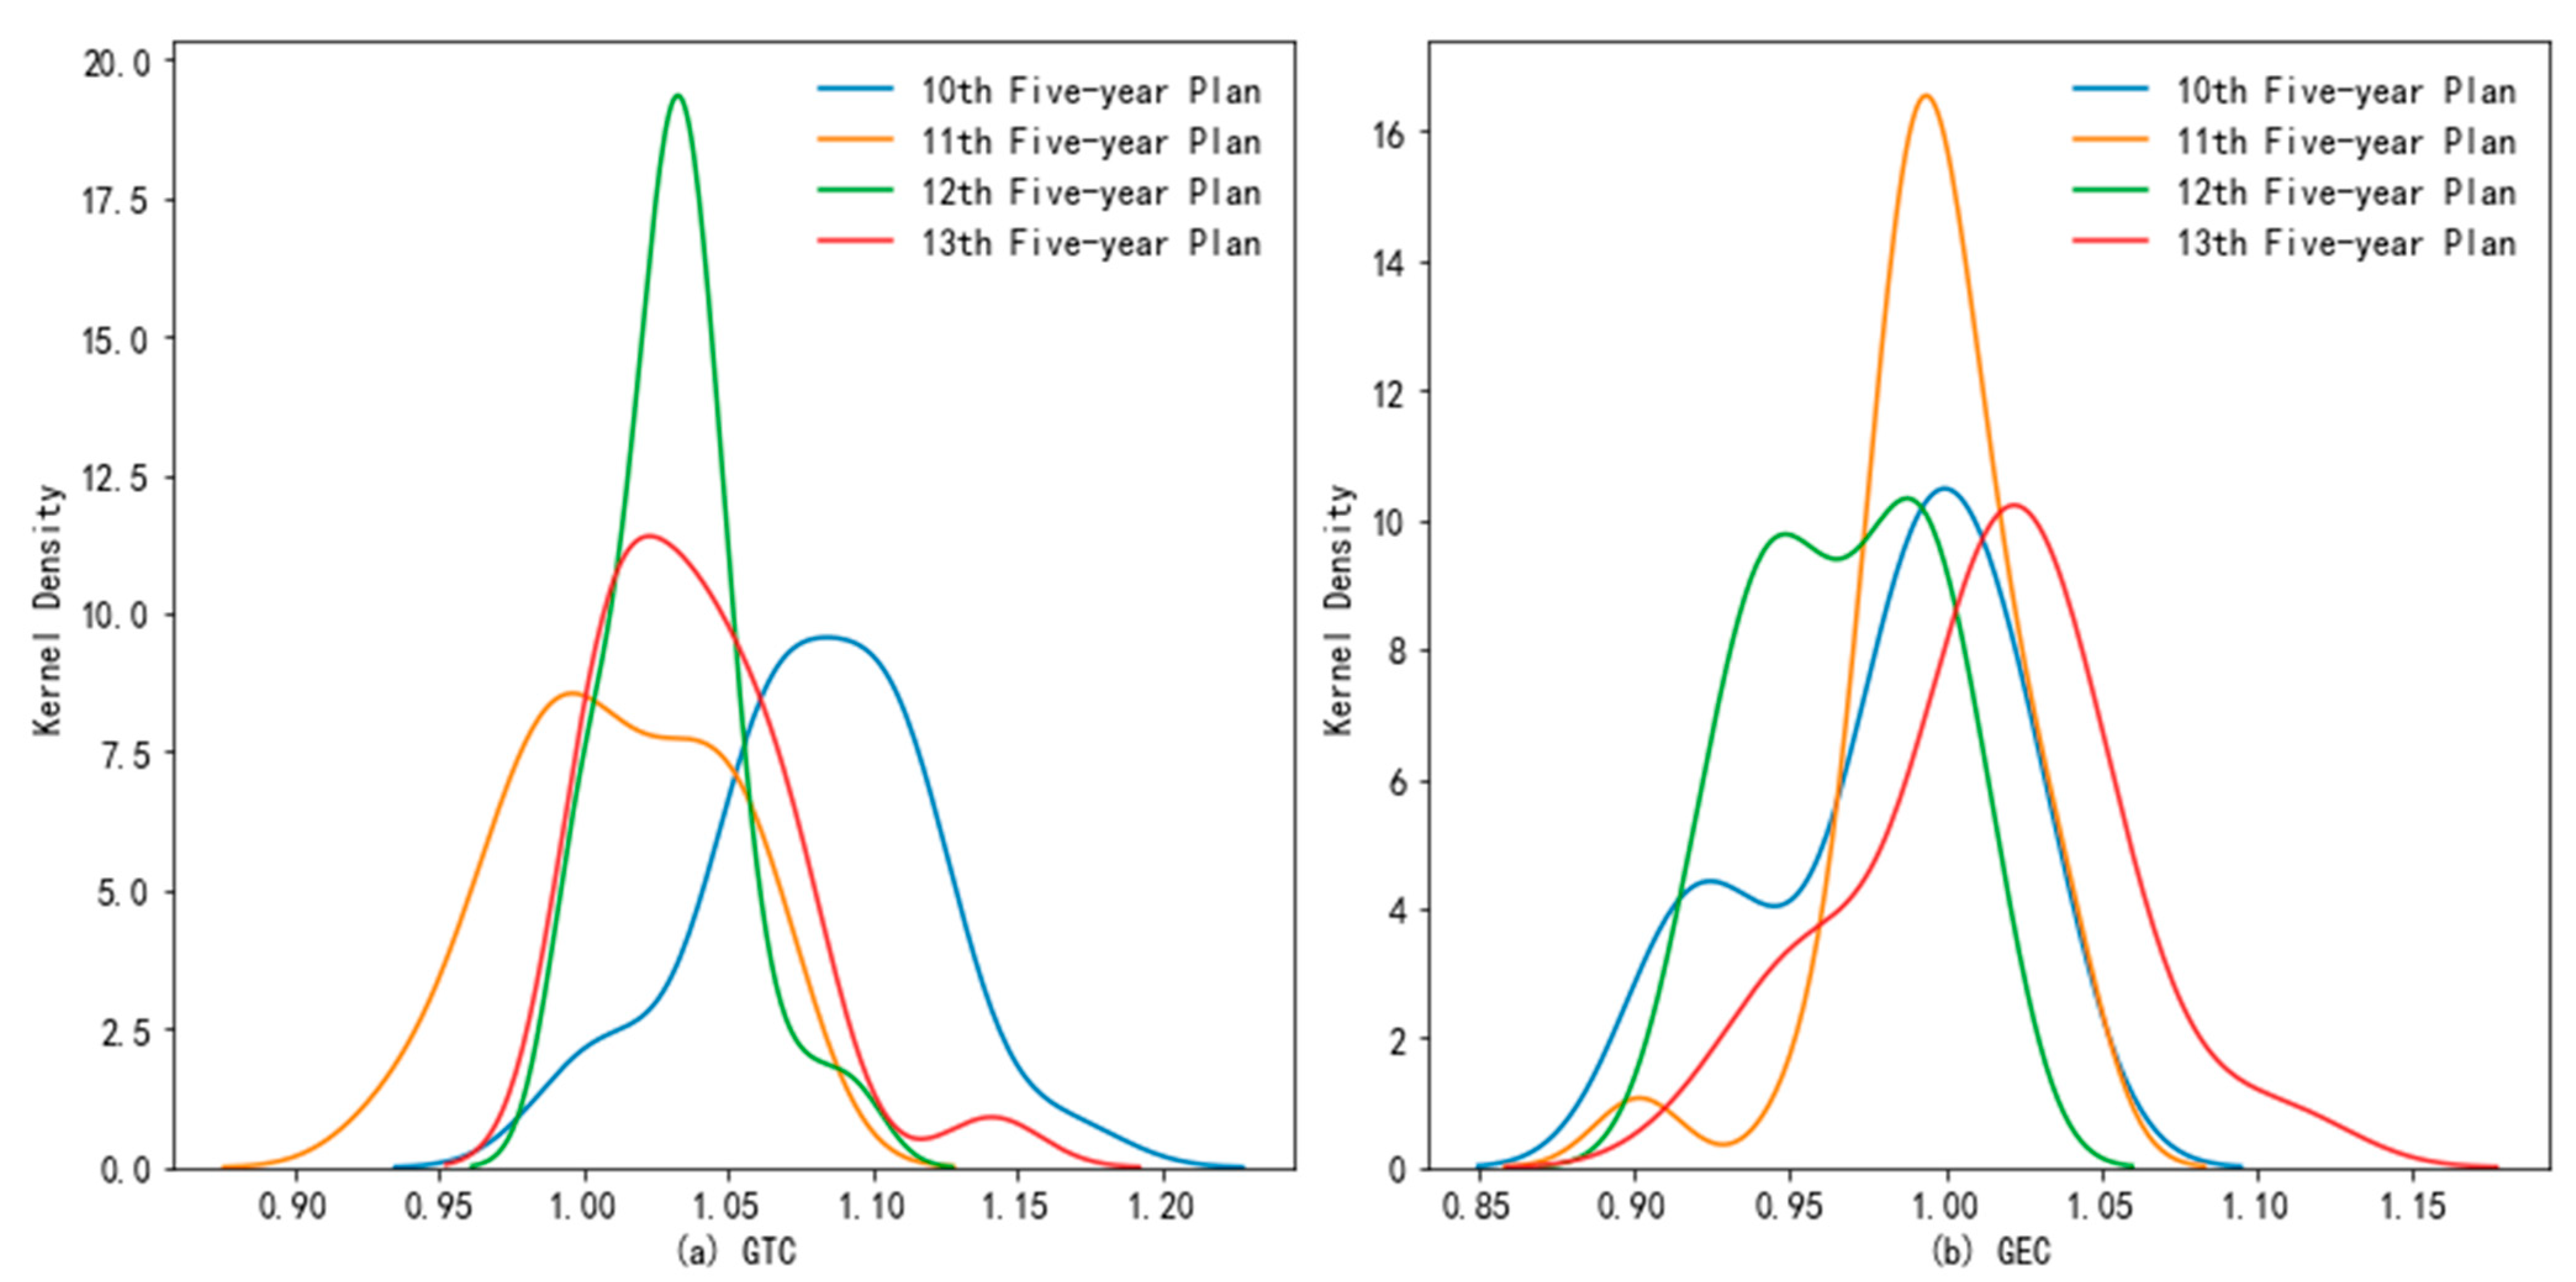
Figure 1 and
Figure 2 further use the kernel density map to show the distribution and trend of China’s manufacturing industry’s GTFP, GTC and GEC from 2004 to 2017. It can be observed that, during the 13th Five-Year Plan period, the GTFP of most industries in China’s manufacturing industry is greater than 1, that is, most industries are in a positive growth stage. However, the standard deviation of China’s manufacturing industry’s GTFP in the 13th Five-Year Plan is significantly larger than that during the 12th Five-Year Plan, which indicates that different categories of China’s manufacturing industry began to develop in a different manner. The above phenomenon is caused by the difference in the growth rate of GTC in China’s manufacturing industry.
4.2. Green Total Factor Productivity and Its Decomposition Trend by Industry
Generally, researchers only analyze the manufacturing industry as a whole, and cannot reflect the development status of different types of manufacturing industries. In this study, we divide the manufacturing industry into equipment industry and high-tech manufacturing industry, consumer goods manufacturing and energy-intensive manufacturing industry. Among them, equipment and high-tech manufacturing is an important driving force for China to adjust its structure, promote growth and stimulate new domestic demand. Its driving role in China’s manufacturing industry has continued to increase. In recent years, it has received strong support from the Chinese government. The consumer goods manufacturing sector is related to the improvement of the quality of industrial consumer goods and the upgrade of “Made in China”. Energy-intensive manufacturing is a key area for China to improve energy efficiency and reduce carbon emission intensity. Therefore, this section will analyze the GTFP, GTC, GEC of the equipment and high-tech manufacturing industry, consumer goods manufacturing industry, and energy-intensive manufacturing industry, respectively.
4.2.1. Comparison of Three Manufacturing Categories
Table 5 compares the input and output data of the three sub-categories of manufacturing. It can be observed that the equipment and high-tech manufacturing has the characteristics of high added value, high technology content and low pollution. Equipment and high-tech manufacturing only use 10% of energy consumption of the manufacturing industry, creating 54% of the manufacturing industrial output and about 43% of the manufacturing industrial added value, and absorbing nearly half of labor in the manufacturing industry. In addition, the equipment and high-tech manufacturing industry and consumer goods manufacturing industry are easy to replace with electric energy and can consume a high proportion of new energy. Therefore, although the above industries consume about 20% of the manufacturing energy consumption, carbon dioxide emissions are only 4% of manufacturing emissions. Energy-intensive manufacturing is characterized by high energy consumption, high pollution, and low added value. In 2019, its carbon dioxide emissions accounted for 96% of the total emissions of the whole manufacturing industry and 34% of national emissions.
According to the above analysis of
Figure 1 and
Figure 2, during the 13th Five-Year Plan period, the GTFP of most sub-sectors in China’s manufacturing industry is in a positive growth stage, but the standard deviation of the growth rate of GTFP within the manufacturing industry is rising rapidly. Different categories of China’s manufacturing industry began to develop in a different manner, which was mainly caused by the difference in the growth rate of GTC in the manufacturing industry.
Figure 3 further shows the internal structure of the above phenomenon. It can be observed that the GTFP growth rate of equipment and high-tech manufacturing is the highest, followed by consumer goods manufacturing and energy-intensive manufacturing. It can be concluded that due to the characteristics of high added value and high technology content, such as equipment and high-tech manufacturing, its green and low-carbon transformation is less difficult, followed by consumer goods manufacturing. Energy-intensive manufacturing is characterized by high energy consumption, high pollution, and low added value. In 2019, its carbon dioxide emissions accounted for 34% of China’s total emissions. Therefore, the green and low-carbon transformation of energy-intensive manufacturing is the most difficult, but also it is of great significance to achieve China’s carbon peak and carbon neutrality goals. The development of energy-intensive manufacturing cannot be simply restricted. On the one hand, energy-intensive manufacturing is also an important part of the national economy, and most products are upstream of the industrial chain, which is related to the supply of basic raw materials. On the other hand, the capital stock of energy-intensive manufacturing is large, accounting for 28% of the total capital stock of the manufacturing industry. The rapid withdrawal of assets will mean that energy-intensive manufacturing will face a high risk of stranded assets, which will be further transmitted to the financial system [
39,
40].
4.2.2. Equipment and High-Tech Manufacturing
As shown in
Table 6, during the period from 2004 to 2017, the GTFP of China’s equipment and high-tech manufacturing increased by an average of 2.18% annually, of which the average annual growth rate of GTC was 3.04%, and the average annual growth rate of GEC was 0.84%. On the whole, the GTFP of China’s equipment and high-tech manufacturing industries continues to improve, mainly driven by the GTC. Although the GEC is generally declining, it begins to increase in the 13th Five-Year Plan.
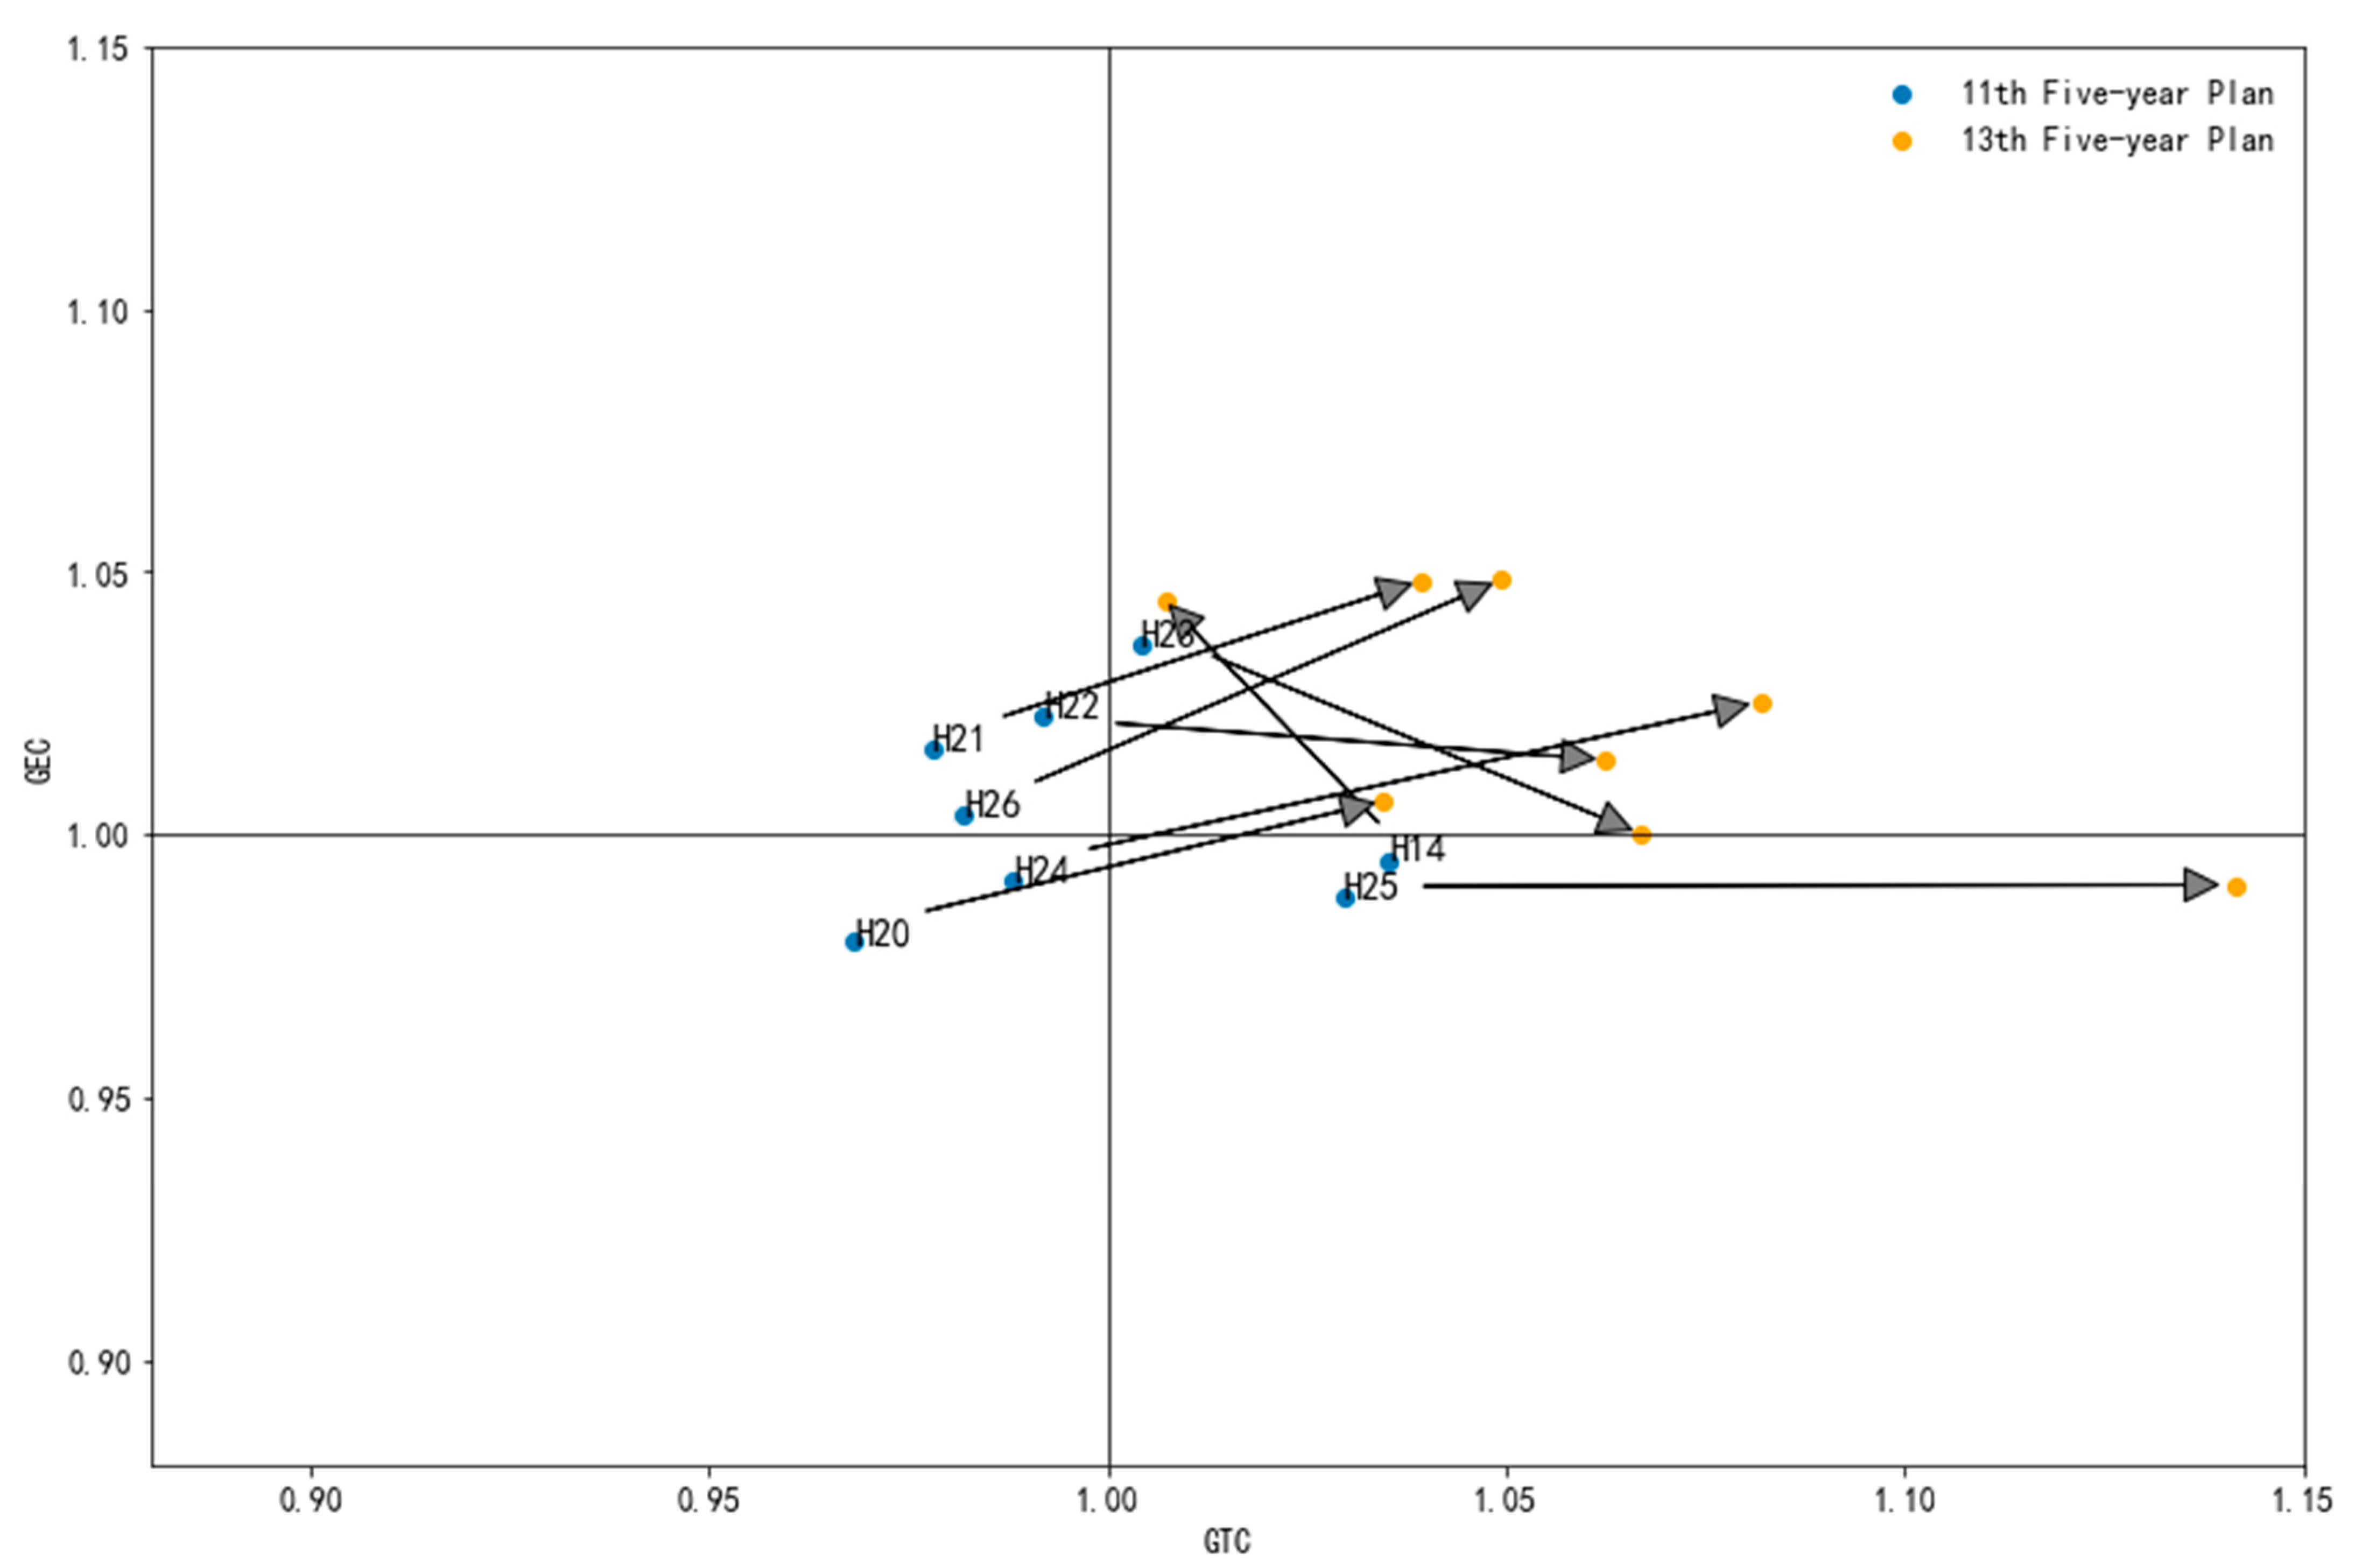
From the inside of the equipment and high-tech manufacturing industry (see
Figure 4), for GTC, from the 11th Five-Year to the 13th Five-Year Plan, except for medicine manufacturing (H14), all industries within equipment and high-tech manufacturing have achieved a rapid increase in the growth rate of GTC. Among them, electrical equipment manufacturing (H24) and electronic equipment manufacturing (H25) have the highest growth rate of GTC. Electronic equipment manufacturing’s growth rate of GTC rose from 2.96% to 14.14%, while the growth rate of GTC in electrical equipment manufacturing changed from an average annual decrease of 1.20% to an average annual increase of 8.21%. Electrical equipment manufacturing and electronic equipment manufacturing are the most technology-intensive fields, mainly including some basic components, so they have received strong support from the Chinese government. During the sample period, this field also achieved leapfrog development. Medicine manufacturing is the only industry whose growth rate of GTC has declined. Its GTC has dropped from an average annual growth rate of 3.52% to 0.72%. Medicine manufacturing is related to the national economy and people’s livelihood and the health of the general public, so one must still promote its rapid development.
As for GEC, from the 11th Five-Year to the 13th Five-Year Plan, except for transportation equipment manufacturing (H23) and electronic equipment manufacturing (H25), the GEC of equipment and high-tech manufacturing industries began to show a trend of accelerating improvement. The growth rate of GEC in transportation equipment manufacturing dropped from 3.61% to 0.006%. The GEC of electronic equipment manufacturing has been less than 1, indicating that its GEC has continued to decline. The reduction in GEC in the above-mentioned industries is mainly caused by the overheating of investment. In the past ten years, the Chinese government has begun to focus on supporting the fields of chips, new energy vehicles, and high-speed rail, and the influx of funds has accelerated. Although this has promoted the progress of green technology in these fields, it may also distort the allocation of resources to a certain extent, resulting in a decrease in efficiency.
4.2.3. Consumer Goods Manufacturing
As shown in
Table 7, during the period from 2004 to 2017, the GTFP of China’s equipment and consumer goods manufacturing increased by an average of 1.30 annually, of which the average annual growth rate of GTC was 3.86%, and the average annual growth rate of GEC was 2.46%. On the whole, the GTFP of China’s consumer goods manufacturing industries continues to improve, mainly driven by the GTC. Although the GEC is generally declining, it begins to increase in the 13th Five-Year Plan.
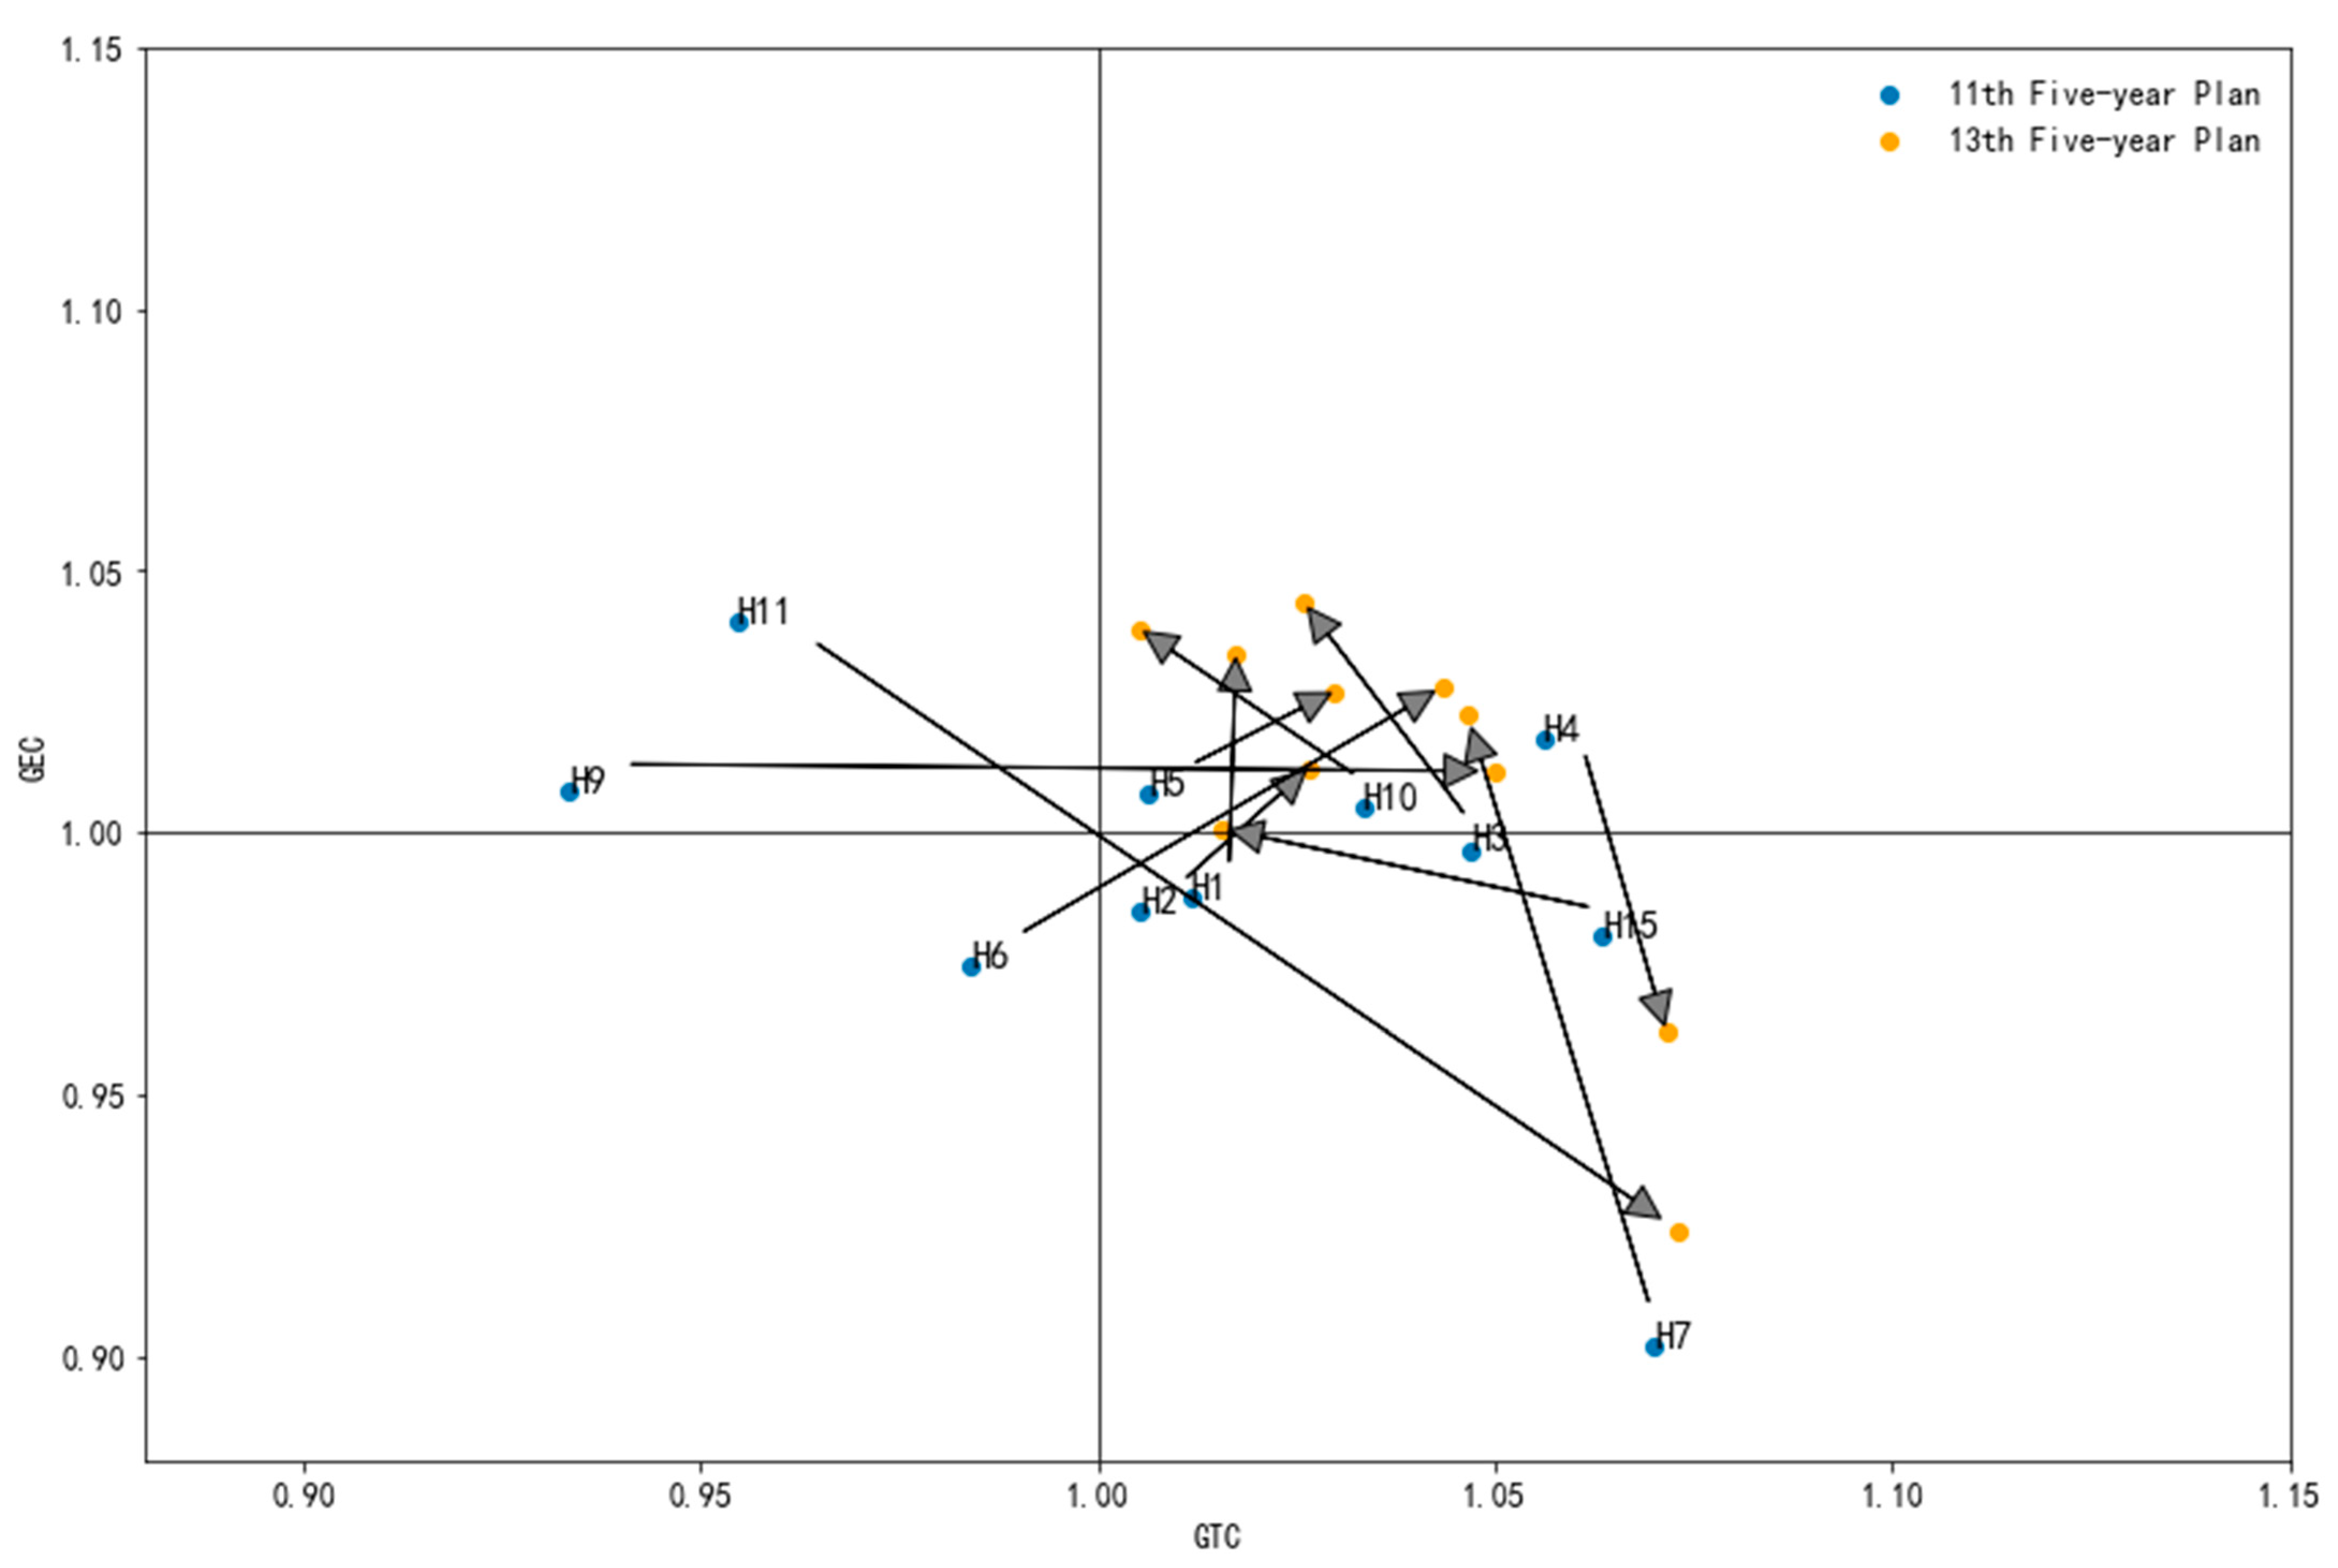
From the inside of consumer goods manufacturing (see
Figure 5), for GTC, from the 11th Five-Year to the 13th Five-Year Plan, seven industries have increased the growth rate of GTC. Among them, printing manufacturing (H11), furniture manufacturing (H9) and apparel manufacturing (H6) have the highest growth rate of GTC. The GTC of printing manufacturing has changed from an average annual decrease of 4.55% to an average annual increase of 7.31%. The growth rate of GTC in furniture manufacturing has changed from an average annual decrease of 6.65% to an average annual increase of 5.01%, and apparel manufacturing has changed from an average annual decrease of 1.59% to an average annual increase of 4.34%. The growth rate of GTC in four industries slowed down. For example, the growth rate of GTC in chemicals manufacturing (H5) dropped from an average annual growth rate of 6.34% to 1.56%.
As for GEC, from the 11th Five-Year to the 13th Five-Year Plan, the growth rate of GEC in tobacco manufacturing (H4) and printing manufacturing (H11) has changed from positive growth to negative growth, and other consumer goods manufacturing industries’ GEC growth rate are accelerating.
4.2.4. Energy-Intensive Manufacturing
As shown in
Table 8, during the period from 2004 to 2017, the GTFP of China’s energy-intensive manufacturing increased by an average of 2.43% annually, of which the average annual growth of GTC was 4.08%, and the growth rate of GEC decreased by 1.58% annually. Overall, the growth rate of GTC in China’s energy-intensive manufacturing continues to slow down, while the GEC continues to deteriorate.
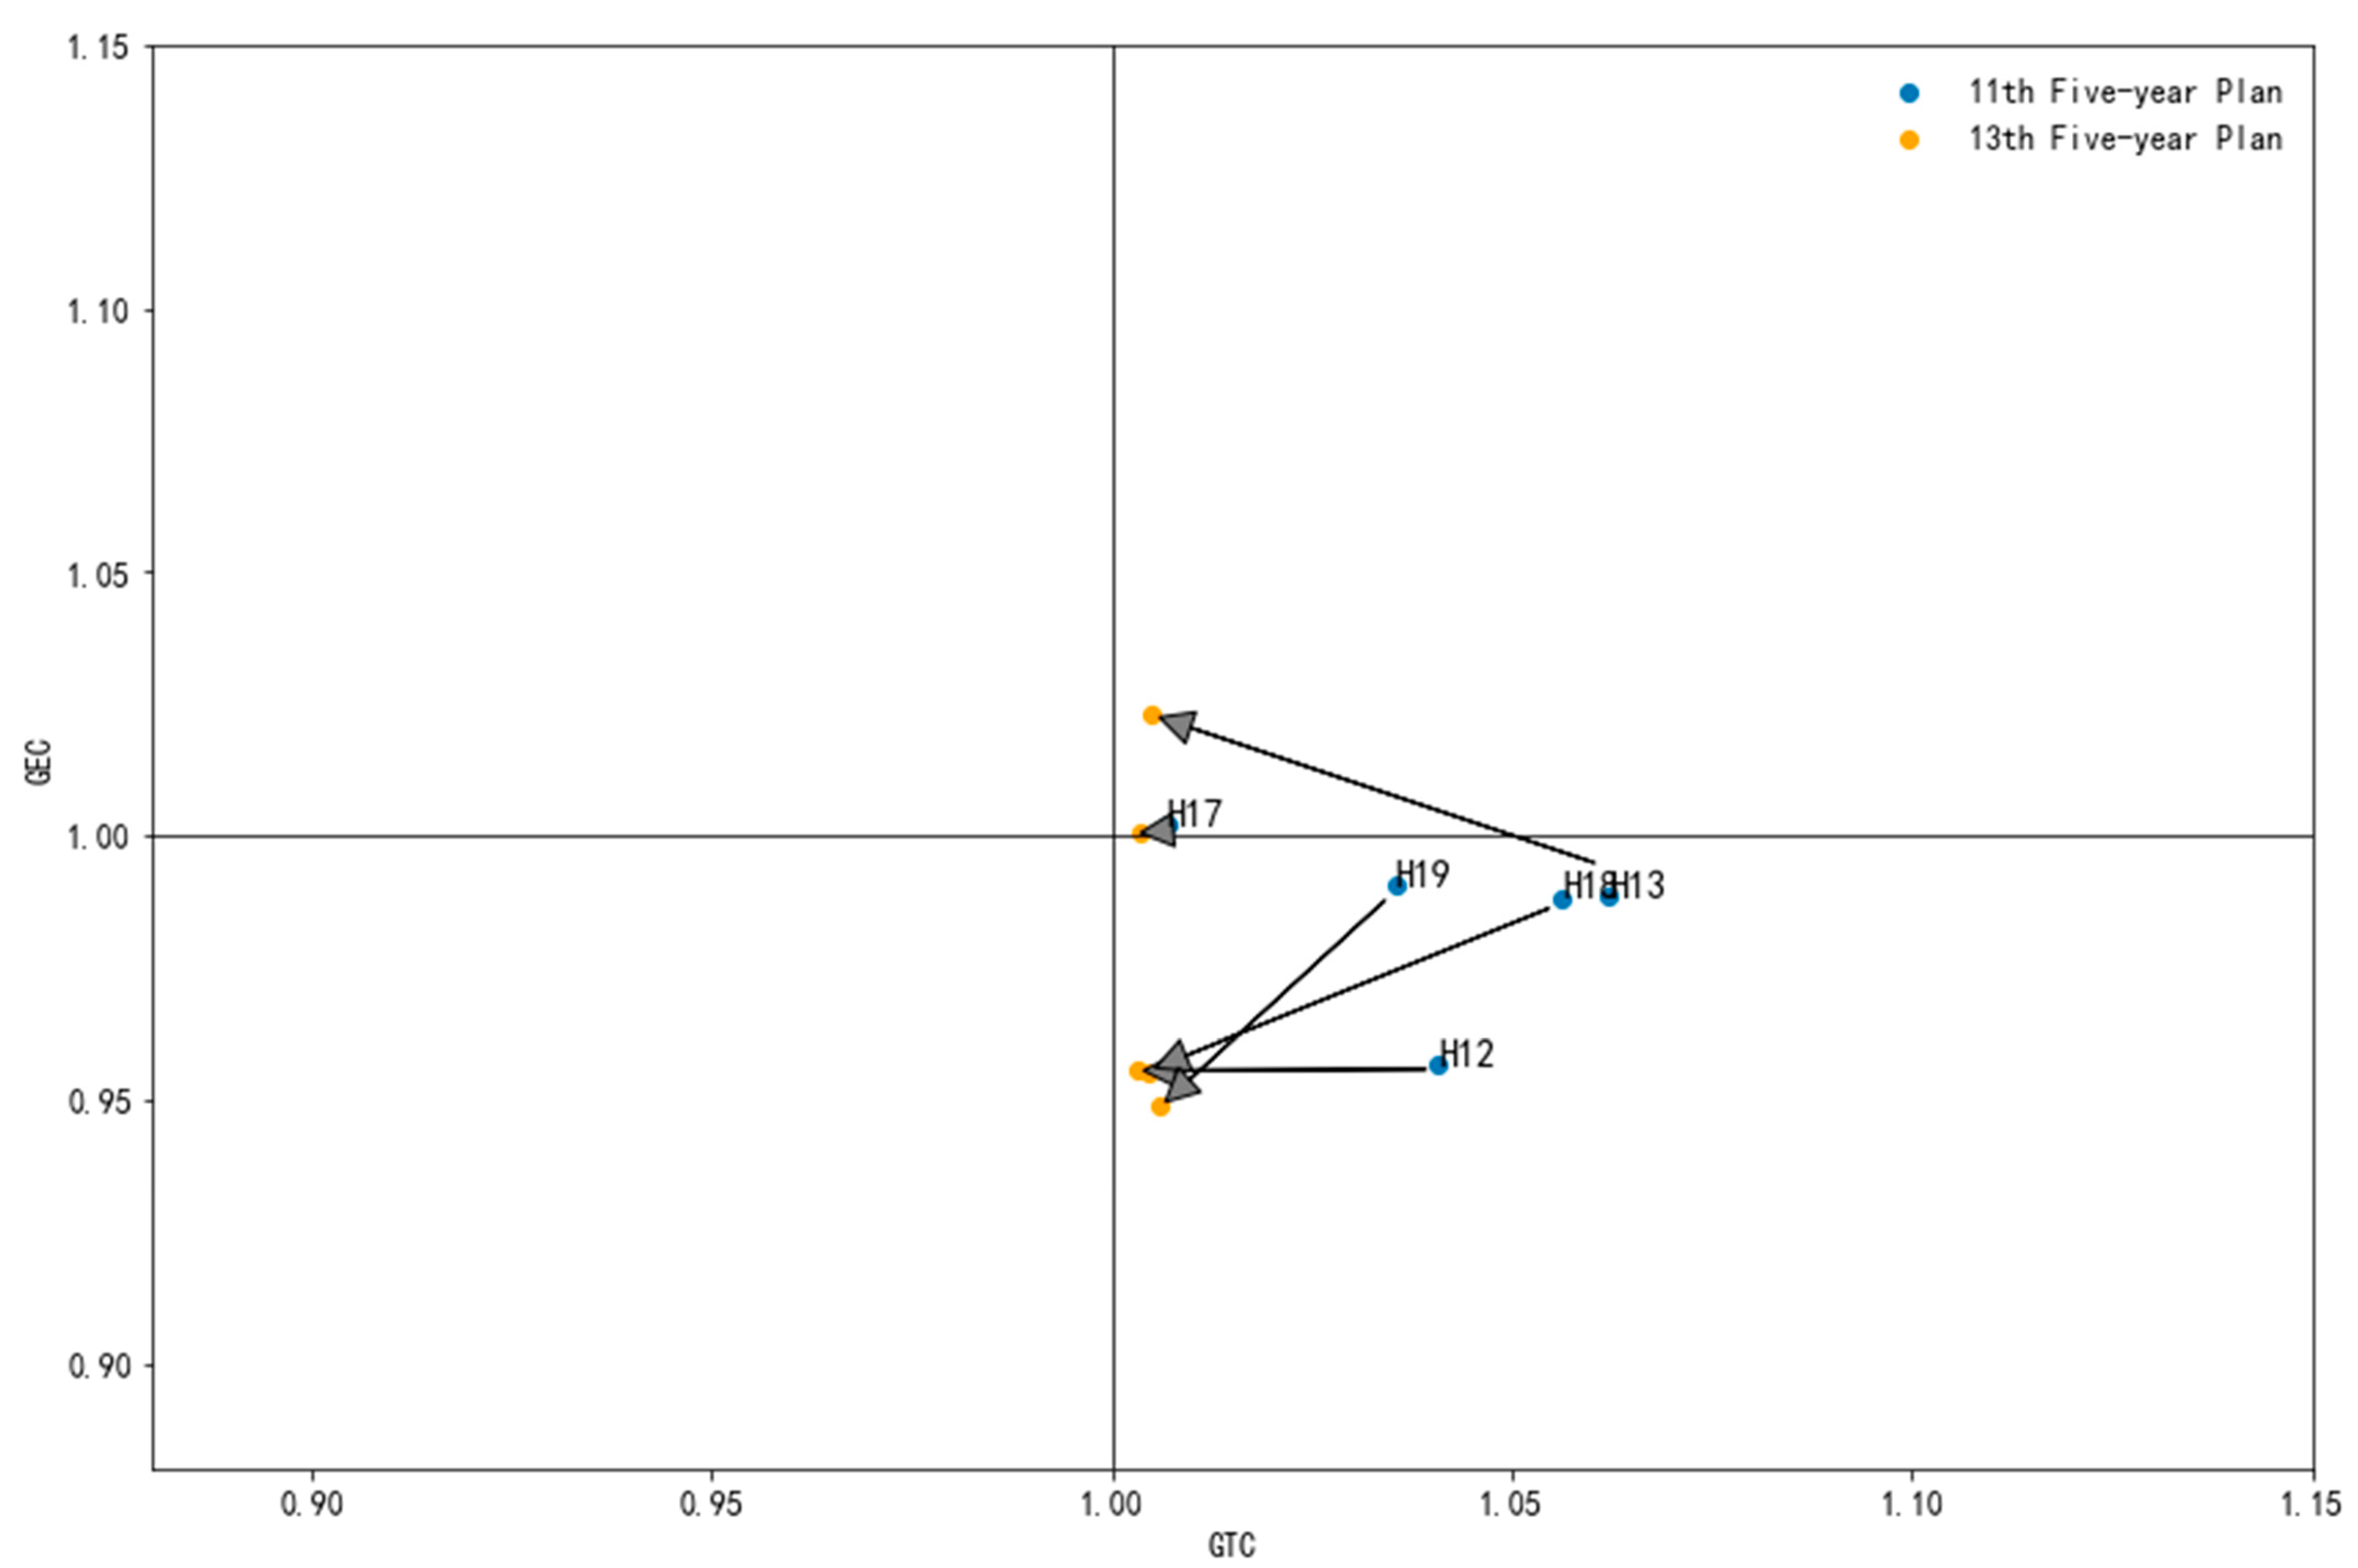
From the inside of energy-intensive manufacturing (see
Figure 6), for GTC, from the 11th Five-Year to the 13th Five-Year Plan, the growth rate of GTC in five energy-intensive manufacturing industries began to slow down. As for GEC, except for chemicals manufacturing (H13), the GEC of the other four energy-intensive manufacturing industries further deteriorates.
5. Conclusions and Implications
In this study, we combine the super-SBM model with the GML index and include undesirable outputs to measure the GTFP of 26 manufacturing sub-sectors in China from 2004 to 2017. The results show that during the sample period, the GTFP of China’s manufacturing industry continues to accelerate, and the driving force is mainly from green technological progress (GTC), while the green technical efficiency (GEC) generally declines. After entering the 13th Five-Year Plan period, GEC also began to show a growth trend. The acceleration of green technological progress and the improvement of green technical efficiency jointly drove the GTFP of China’s manufacturing industry to enter a rapid upward trajectory during the 13th Five-Year Plan period, with an average annual growth rate of 5.16%. In addition, different categories of China’s manufacturing industry have begun to develop in a different manner in recent years, which is mainly caused by the difference in the growth rate of green technological progress in the manufacturing industry. The GTFP growth rate of equipment and high-tech manufacturing is the highest, followed by consumer goods manufacturing and energy-intensive manufacturing. The equipment and high-tech manufacturing sector has the characteristics of high added value and high technology content and its green and low-carbon transformation is less difficult, followed by consumer goods manufacturing. Energy-intensive manufacturing is characterized by high energy consumption, high pollution, and low added value. In 2019, its carbon dioxide emissions accounted for 34% of China’s total emissions. Therefore, the green and low-carbon transformation of energy-intensive manufacturing is the most difficult, but also it is of great significance to achieve China’s carbon peak and carbon neutrality goals. Furthermore, the results of the analysis of variance show that the mean values of GTFP and its decomposition in China’s manufacturing industry are not the same in different periods, except for the mean values of GEC in the energy-intensive manufacturing industry.
Based on the aforementioned conclusions, the following policy implications are obtained: first, during the sample period, the driving force for the improvement of GTFP of China’s manufacturing industry mainly comes from the green technological progress, and green technical efficiency is generally declining. Therefore, relevant departments need to further formulate relevant policies, optimize resource allocation, and improve green technical efficiency in manufacturing. Second, the green and low-carbon transformation of the energy-intensive manufacturing is the most difficult, but it is also of great significance to achieve China’s carbon peak and carbon neutrality goals. Although the progress of green technology in energy-intensive manufacturing was in a stage of positive growth in the sample period, the progress rate is decreasing, while the green technical efficiency is declining at a steady rate. Therefore, the energy-intensive manufacturing industry needs to further improve the rate of green technological progress to prevent negative growth and improve the green technical efficiency.
Author Contributions
Contributions of all authors are presented below. Conceptualization, X.Z. and J.Z.; methodology, R.L.; software, R.L.; validation, X.Z., R.L. and J.Z.; formal analysis, X.Z., R.L. and J.Z.; investigation, R.L.; resources, R.L. and J.Z.; data curation, R.L. and J.Z.; writing—original draft preparation, R.L. and J.Z.; writing—review and editing, X.Z., R.L. and J.Z.; visualization, R.L.; supervision, X.Z.; project administration, X.Z.; funding acquisition, X.Z. All authors have read and agreed to the published version of the manuscript.
Funding
This research was funded by National Natural Science Foundation of China, grant number 72003009.
Institutional Review Board Statement
Not applicable.
Informed Consent Statement
Not applicable.
Data Availability Statement
Data available in a publicly accessible repository that does not issue DOIs.
Conflicts of Interest
The authors declare no conflict of interest.
Nomenclature
| DDF | Directional distance function | GTC | Green technological progress change |
| DEA | Data envelopment analysis | GTFP | Green total factor productivity |
| DMU | Decision making units | ML | Malmquist–Luenberger |
| GEC | Green technical efficiency change | TFP | Total factor productivity |
| GML | Global Malmquist–Luenberger | SBM | Slack-based measure |
References
- Wei, H.; Wang, S. Analysis of and theoretical reflections on China’s “Excessive De-industrialization” phenomenon. Chin. J. Urban Env. Stud. 2019, 7, 1950017. [Google Scholar] [CrossRef]
- Lin, J.Y.; Wang, Y. Structural change, industrial upgrading, and middle-income trap. J. Ind. Compet. Trade 2020, 20, 359–394. [Google Scholar] [CrossRef]
- Huang, Q.H.; He, J.; Ni, H.F. Research on the goal and strategy of China’s new industrialization in the two stages of the new journey. Nanjing J. Soc. Sci. 2021, 1, 1–14. [Google Scholar]
- Eizenberg, E.; Jabareen, Y.; Jabareen, Y. Social sustainability: A new conceptual framework. Sustainability 2017, 9, 68. [Google Scholar] [CrossRef] [Green Version]
- Fonseca, L.; Domingues, J.; Dima, A. Mapping the sustainable development goals relationships. Sustainability 2020, 12, 3359. [Google Scholar] [CrossRef] [Green Version]
- Wang, J.; Zhao, T. Regional energy-environmental performance and investment strategy for China’s non-ferrous metals industry: A non-radial DEA based analysis. J. Clean Prod. 2017, 163, 187–201. [Google Scholar] [CrossRef]
- Feng, C.; Huang, J.B.; Wang, M. Analysis of green total-factor productivity in China’s regional metal industry: A meta-frontier approach. Resour. Policy 2018, 58, 219–229. [Google Scholar] [CrossRef]
- Zhu, X.; Chen, Y.; Feng, C. Green total factor productivity of China’s mining and quarrying industry: A global data envelopment analysis. Resour. Policy 2018, 57, 1–9. [Google Scholar]
- Li, J.; See, K.F.; Chi, J. Water resources and water pollution emissions in China’s industrial sector: A green-biased technological progress analysis. J. Clean Prod. 2019, 229, 1412–1426. [Google Scholar] [CrossRef]
- Pei, Y.; Zhu, Y.; Liu, S.; Wang, X.; Cao, J. Environmental regulation and carbon emission: The mediation effect of technical efficiency. J. Clean Prod. 2019, 236, 117599. [Google Scholar] [CrossRef]
- Shen, N.; Liao, H.; Deng, R.; Wang, Q. Different types of environmental regulations and the heterogeneous influence on the environmental total factor productivity: Empirical analysis of China’s industry. J. Clean Prod. 2019, 211, 171–184. [Google Scholar] [CrossRef]
- Shi, X.; Li, L. Green total factor productivity and its decomposition of Chinese manufacturing based on the MML index:2003–2015. J. Clean Prod. 2019, 222, 998–1008. [Google Scholar] [CrossRef]
- Yang, Z.B.; Shao, S.; Fan, M.T.; Yang, L.L. Wage distortion and green technological progress: A directed technological progress perspective. Ecol Econ. 2021, 181, 106912. [Google Scholar] [CrossRef]
- Zhang, Y.; Wu, Z. Intelligence and Green Total Factor Productivity Based on China’s Province-Level Manufacturing Data. Sustainability 2021, 13, 4989. [Google Scholar] [CrossRef]
- Chen, S.; Golley, J. “Green” productivity growth in China’s industrial economy. Energy Econ. 2014, 44, 89–98. [Google Scholar] [CrossRef]
- Chen, C.; Lan, Q.; Gao, M.; Sun, Y. Green total factor productivity growth and its determinants in China’s industrial economy. Sustainability 2018, 10, 1052. [Google Scholar] [CrossRef] [Green Version]
- Yang, M.; Yang, F.; Sun, C. Factor market distortion correction, resource reallocation and potential productivity gains: An empirical study on China’s heavy industry sector. Energy Econ. 2018, 69, 270–279. [Google Scholar] [CrossRef]
- Qu, C.; Shao, J.; Cheng, Z. Can embedding in global value chain drive green growth in China’s manufacturing industry? J. Clean Prod. 2020, 268, 121962. [Google Scholar] [CrossRef]
- Wang, K.L.; Pang, S.Q.; Ding, L.L.; Miao, Z. Combining the biennial Malmquist-Luenberger index and panel quantile regression to analyze the green total factor productivity of the industrial sector in China. Sci. Total Environ. 2020, 739, 140280. [Google Scholar] [CrossRef]
- Aghion, P.; Harris, C.; Howitt, P.; John, V. Competition, imitation and growth with step-by-step innovation. Rev. Econ. Stud. 2001, 68, 467–492. [Google Scholar] [CrossRef]
- Grossman, G.M.; Helpman, E. Endogenous innovation in the theory of growth. J. Econ. Perspect. 1994, 8, 23–44. [Google Scholar] [CrossRef] [Green Version]
- Romer, P. Endogenous technological change. J. Polit. Econ. 1990, 98, 71–102. [Google Scholar] [CrossRef] [Green Version]
- Solow, R.M. Technical change and the aggregate production function. Rev. Econ. Stat. 1957, 39, 312. [Google Scholar] [CrossRef] [Green Version]
- Chung, Y.; Färe, R.; Grosskopf, S. Productivity and undesirable outputs: A directional distance function approach. J. Environ. Manag. 1997, 51, 229–240. [Google Scholar] [CrossRef] [Green Version]
- Li, K.; Lin, B. Impact of energy conservation policies on the green productivity in China’s manufacturing sector: Evidence from a three-stage DEA model. Appl. Energy 2016, 168, 351–363. [Google Scholar] [CrossRef]
- Fukuyama, H.; Weber, W.L. A directional slacks-based measure of technical inefficiency. Socio-Econ. Plan. Sci. 2009, 43, 274–287. [Google Scholar] [CrossRef]
- Tone, K. A slacks-based measure of efficiency in data envelopment analysis. Eur. J. Oper. Res. 2001, 130, 498–509. [Google Scholar] [CrossRef] [Green Version]
- Xie, R.H.; Yuan, Y.J.; Huang, J.J. Different types of environmental regulations and heterogeneous influence on “green” productivity: Evidence from China. Ecol. Econ. 2017, 132, 104–112. [Google Scholar] [CrossRef]
- Wang, Y.; Sun, X.; Guo, X. Environmental regulation and green productivity growth: Empirical evidence on the Porter Hypothesis from OECD industrial sectors. Energy Policy 2019, 132, 611–619. [Google Scholar] [CrossRef]
- Liu, D.; Zhu, X.; Wang, Y. China’s agricultural green total factor productivity based on carbon emission: An analysis of evolution trend and influencing factors. J. Clean Prod. 2021, 278, 123692. [Google Scholar] [CrossRef]
- Oh, D. A global Malmquist-Luenberger productivity index. J. Product. Anal. 2010, 34, 183–197. [Google Scholar] [CrossRef]
- Li, B.; Wu, S. Effects of local and civil environmental regulation on green total factor productivity in China: A spatial Durbin econometric analysis. J. Clean Prod. 2017, 153, 342–353. [Google Scholar] [CrossRef]
- Yang, Z.; Fan, M.; Shao, S.; Yang, L. Does carbon intensity constraint policy improve industrial green production performance in China? A quasi-DID analysis. Energy Econ. 2017, 68, 271–282. [Google Scholar] [CrossRef]
- Liu, Z.; Xin, L. Has China’s Belt and Road Initiative promoted its green total factor productivity? Evidence from primary provinces along the route. Energy Policy 2019, 129, 360–369. [Google Scholar] [CrossRef]
- Chen, S.S. Reconstruction of sub-industrial statistical data in China (1980–2008). China Econ. Q. 2011, 10, 735–776. [Google Scholar]
- Barro, R.; Sala-i-Martin, X. Technological diffusion, convergence, and growth. J. Econ. Growth. 1997, 2, 1–26. [Google Scholar] [CrossRef]
- Nelson, R.; Phelps, E. Investment in humans, technological diffusion, and economic growth. Am. Econ. Rev. 1966, 56, 69–75. [Google Scholar]
- Huang, Q.H. China basically realized industrialization in 2020: Great achievements in the centennial struggle of the communist party of China. Econ. Perspect. 2021, 11, 3–9. [Google Scholar]
- Cui, R.Y.; Hultman, N.; Cui, D.; Kang, J.; Lou, J.; Yang, F.; Yuan, J.; Zhang, W.; Zhu, M. A plant-by-plant strategy for high-ambition coal power phaseout in China. Nat. Commun. 2021, 12, 1468. [Google Scholar] [CrossRef] [PubMed]
- Welsby, D.; Price, J.; Pye, S.; Ekins, P. Unextractable fossil fuels in a 1.5 °C world. Nature 2021, 597, 230–234. [Google Scholar] [CrossRef] [PubMed]
Figure 1.
Kernel density map of GTFP in China’s manufacturing industry. The Five-Year Plans are a series of social and economic development initiatives that have been issued by the Chinese government since 1953. The 10th Five-Year Plan covers 2004–2005. The 11th Five-Year Plan covers 2006–2010. The 12th Five-Year Plan covers 2011–2015. The 13th Five-Year Plan covers 2016–2017. The same is shown below.
Figure 2.
(a) Kernel density map of GTC in China’s manufacturing industry; (b) kernel density map of GEC in China’s manufacturing industry.
Figure 2.
(a) Kernel density map of GTC in China’s manufacturing industry; (b) kernel density map of GEC in China’s manufacturing industry.
Figure 3.
Box chart of GTFP of three types of manufacturing industry in different periods.
Figure 3.
Box chart of GTFP of three types of manufacturing industry in different periods.
Figure 4.
Trends of GTC and GEC in equipment and high-tech manufacturing.
Figure 4.
Trends of GTC and GEC in equipment and high-tech manufacturing.
Figure 5.
Trends of GTC and GEC in consumer goods manufacturing.
Figure 5.
Trends of GTC and GEC in consumer goods manufacturing.
Figure 6.
Trends of GTC and GEC in energy-intensive manufacturing.
Figure 6.
Trends of GTC and GEC in energy-intensive manufacturing.
Table 1.
Code and classification of manufacturing sub-sectors. According to the Classification of Industries in the National Economy (GB/T4754-2017), there are 31 sub-sectors in China’s manufacturing industry. Automobile manufacturing and railway, ship, aerospace and other transportation equipment manufacturing are included in transport equipment manufacturing before 2012. Therefore, we only use transport equipment manufacturing in our research. The rubber and plastic products manufacturing is divided into rubber products manufacturing and plastic products manufacturing before 2012, so we only use rubber and plastic products manufacturing in our research. Culture and education, industrial and aesthetics, sports and entertainment manufacturing, other manufacturing, comprehensive utilization of waste resources, metal products, machinery and equipment repairs have experienced relatively large adjustments during the sample period, so they are discarded. Referring to the “National Economic Industry Classification (GB/T 4754-2017)”, “High-tech Industry (Manufacturing) Classification (2017)” and other materials, we divide the manufacturing industry into the manufacturing industry into the equipment and high-tech manufacturing industry, consumer goods manufacturing and energy-intensive manufacturing industry.
| Industry | Code | Equipment Manufacturing Industry | High-Tech Manufacturing Industry | Consumer Goods Manufacturing Industry | Energy-Intensive Manufacturing Industry |
|---|
| Food processing | H1 | 0 | 0 | 1 | 0 |
| Food manufacturing | H2 | 0 | 0 | 1 | 0 |
| Beverages | H3 | 0 | 0 | 1 | 0 |
| Tobacco | H4 | 0 | 0 | 1 | 0 |
| Textiles | H5 | 0 | 0 | 1 | 0 |
| Apparel | H6 | 0 | 0 | 1 | 0 |
| Leather | H7 | 0 | 0 | 1 | 0 |
| Wood processing | H8 | 0 | 0 | 0 | 0 |
| Furniture | H9 | 0 | 0 | 1 | 0 |
| Paper | H10 | 0 | 0 | 1 | 0 |
| Printing | H11 | 0 | 0 | 1 | 0 |
| Fuel processing | H12 | 0 | 0 | 0 | 1 |
| Chemicals | H13 | 0 | 0 | 0 | 1 |
| Medicine | H14 | 0 | 1 | 0 | 0 |
| Fibers | H15 | 0 | 0 | 1 | 0 |
| Rubber and plastic products | H16 | 0 | 0 | 0 | 0 |
| Nonmetal manufacturing | H17 | 0 | 0 | 0 | 1 |
| Ferrous smelt/press | H18 | 0 | 0 | 0 | 1 |
| Non-ferrous smelt/press | H19 | 0 | 0 | 0 | 1 |
| Metal products | H20 | 1 | 0 | 0 | 0 |
| General machines | H21 | 1 | 0 | 0 | 0 |
| Special machines | H22 | 1 | 1 | 0 | 0 |
| Transport equipment | H23 | 1 | 1 | 0 | 0 |
| Electrical equipment | H24 | 1 | 1 | 0 | 0 |
| Electronic equipment | H25 | 1 | 1 | 0 | 0 |
| Measuring instruments | H26 | 1 | 1 | 0 | 0 |
Table 2.
Descriptive statistics of the data.
Table 2.
Descriptive statistics of the data.
| | Variable | Unit | Mean | Std | Min | Max |
|---|
| Input | Labor | Ten thousand persons | 277.63 | 194.16 | 18.61 | 911.69 |
| Capital stock | 100 million RMB in 2005 prices | 9069.37 | 10,616.63 | 150.23 | 63,135.44 |
| Energy consumption | Ten thousand tce | 7133.23 | 12,987.89 | 110.94 | 69,342.00 |
| Desirable output | Industrial output | 100 million RMB in 2005 prices | 21,376.92 | 25,828.72 | 719.97 | 213,532.40 |
| Undesirable output | CO2 emission | Ten thousand tons | 11,951.46 | 33,072.21 | 58.37 | 180,283.90 |
Table 3.
Correlation coefficients.
Table 3.
Correlation coefficients.
| | Labor | Capital Stock | Energy Consumption | Industrial Output | CO2 Emission |
|---|
| Labor | 1.0000 | | | | |
| Capital stock | 0.5552 | 1.0000 | | | |
| Energy consumption | 0.2242 | 0.4418 | 1.0000 | | |
| Industrial output | 0.7596 | 0.6843 | 0.3100 | 1.0000 | |
| CO2 emission | 0.2156 | 0.3458 | 0.8596 | 0.2179 | 1.0000 |
Table 4.
GTFP and its decomposition in China’s manufacturing industry. The Five-Year Plans are a series of social and economic development initiatives that have been issued by the Chinese government since 1953. In this study, the 10th Five-Year Plan covers 2004–2005. The 11th Five-Year Plan covers 2006–2010. The 12th Five-Year Plan covers 2011–2015. The 13th Five-Year Plan covers 2016–2017. We also use analysis of variance to test whether the mean values of GTFP and its decomposition in China’s manufacturing industry are the same in different periods. The same is shown below.
| | Mean | 10th Five-Year Plan | 11th Five-Year Plan | 12th Five-Year Plan | 13th Five-Year Plan | Analysis of Variance (p Value) |
|---|
| GTFP | 1.0167 | 1.0584 | 1.0060 | 0.9977 | 1.0516 | 0.0000 |
| GTC | 1.0316 | 1.0794 | 1.0107 | 1.0314 | 1.0383 | 0.0000 |
| GEC | 0.9856 | 0.9805 | 0.9953 | 0.9673 | 1.0129 | 0.0001 |
Table 5.
Comparison of input-output data of three manufacturing categories.
Table 5.
Comparison of input-output data of three manufacturing categories.
| Proportion | Labor in Manufacturing (2019) | Capital Stock in Manufacturing (2017) | Energy Consumption in Manufacturing (2019) | Industrial Added Value in Manufacturing (2017) | Industrial Output in Manufacturing (2017) | Carbon Dioxide Emissions (2019) |
|---|
| In Manufacturing | In China |
|---|
| Equipment and high-tech manufacturing | 48.09% | 41.07% | 10.01% | 54.02% | 43.14% | 1.49% | 0.54% |
| Consumer goods manufacturing | 28.75% | 27.41% | 9.62% | 22.41% | 26.13% | 2.41% | 0.86% |
| Energy-intensive manufacturing | 18.26% | 28.07% | 77.87% | 20.18% | 27.59% | 95.84% | 34.35% |
Table 6.
GTFP and its decomposition in equipment and high-tech manufacturing.
Table 6.
GTFP and its decomposition in equipment and high-tech manufacturing.
| | Mean | 10th Five-Year Plan | 11th Five-Year Plan | 12th Five-Year Plan | 13th Five-Year Plan | Analysis of Variance (p Value) |
|---|
| GTFP | 1.0218 | 1.0508 | 1.0006 | 0.9994 | 1.0830 | 0.0000 |
| GTC | 1.0304 | 1.0717 | 0.9968 | 1.0245 | 1.0597 | 0.0001 |
| GEC | 0.9916 | 0.9805 | 1.0038 | 0.9755 | 1.0219 | 0.0072 |
Table 7.
GTFP and its decomposition in consumer goods manufacturing.
Table 7.
GTFP and its decomposition in consumer goods manufacturing.
| | Mean | 10th Five-Year Plan | 11th Five-Year Plan | 12th Five-Year Plan | 13th Five-Year Plan | Analysis of Variance (p Value) |
|---|
| GTFP | 1.0130 | 1.0489 | 1.0045 | 0.9897 | 1.0458 | 0.0070 |
| GTC | 1.0386 | 1.0734 | 1.0141 | 1.0348 | 1.0366 | 0.0064 |
| GEC | 0.9754 | 0.9771 | 0.9905 | 0.9564 | 1.0088 | 0.0096 |
Table 8.
GTFP and its decomposition in energy-intensive manufacturing.
Table 8.
GTFP and its decomposition in energy-intensive manufacturing.
| | Mean | 10th Five-Year Plan | 11th Five-Year Plan | 12th Five-Year Plan | 13th Five-Year Plan | Analysis of Variance (p Value) |
|---|
| GTFP | 1.0243 | 1.0842 | 1.0205 | 1.0117 | 0.9836 | 0.0000 |
| GTC | 1.0408 | 1.0756 | 1.0333 | 1.033 | 1.0036 | 0.0000 |
| GEC | 0.9842 | 1.008 | 0.9876 | 0.9794 | 0.9801 | 0.1925 |
| Publisher’s Note: MDPI stays neutral with regard to jurisdictional claims in published maps and institutional affiliations. |
© 2022 by the authors. Licensee MDPI, Basel, Switzerland. This article is an open access article distributed under the terms and conditions of the Creative Commons Attribution (CC BY) license (https://creativecommons.org/licenses/by/4.0/).


