Article

Can Green Finance Policies Stimulate Technological Innovation and Financial Performance? Evidence from Chinese Listed Green Enterprises

1
School of Accounting, Shandong Youth University of Political Science, Jinan 250103, China
2
Business School, Shandong Normal University, Jinan 250358, China
3
School of Economics and Management, China University of Petroleum, Qingdao 266555, China
*
Author to whom correspondence should be addressed.
Sustainability 2022, 14(15), 9287; https://doi.org/10.3390/su14159287
Submission received: 5 July 2022 / Revised: 20 July 2022 / Accepted: 26 July 2022 / Published: 28 July 2022
(This article belongs to the Special Issue Renewable Energy Investment, Comprehensive Impact and Policies)

Abstract

:
The impact of China’s green finance policies on renewable energy, clean energy, and other green companies is a hot topic of concern. This study uses the difference-in-differences (DID) model to examine the incentive effect of the Green Credit Guidelines (GCG) on the technological innovation and financial performance of Chinese listed green enterprises. The heterogeneity analysis is carried out from the level of digital finance, green development, and marketization. This study finds that: (1) Green finance is conducive to stimulating the technological innovation and financial performance of green enterprises. (2) Green enterprises in areas with high digital finance levels have a more significant incentive effect on green finance policies, compared to areas with less-developed digital finance. (3) Green enterprises in areas with high levels of green development are more significantly positively affected by green finance policies, compared to areas with less-developed digital finance. (4) The incentive effect of green credit policies on green enterprises in areas with a high degree of marketization is more significant, compared with regions with a lower level of green development. Finally, some policy implications are proposed to provide a reference for China to improve the green financial system to facilitate the financing of green enterprises.

1. Introduction

In recent decades, green development has become a common concern of governments around the world, and it is imperative to achieve high-quality development goals represented by green and low-carbon development. To achieve such goals, many countries have established sustainable development as their overall development strategies, and have begun to make efforts on promoting the development of green industries and green technological innovation [1,2,3]. However, the green technological innovation capacity of enterprises is limited by financing constraints [4,5,6].
For the financing constraints faced by enterprises in the process of green development, several green financial policies have been implemented, among which the Green Credit Guidelines (GCG) perform a crucial component in China [7,8]. In 2012, the China Banking Regulatory Commission (CBRC) issued the “Green Credit Guidelines (GCG)”, requiring banks and other financial institutions to strengthen credit incentives for green companies with environmental, social, and governance (ESG) as evaluation indicators, in accordance with national environmental protection and industrial policies [9]. Promoting the technological innovation and upgrading of enterprises through green finance is the future development direction of China’s finance [10]. Through the coordination of the traditional financial system and ecological protection, green finance is expected to lead to the emergence of new financial formats and new industrial formats [11].
The essence of green finance has always revolved around the relationship between finance and sustainable development, requiring banking financial institutions to pay close attention to the development of environmental protection and ecological industries, get rid of short-term interests, commit to long-term development, and ultimately realize a virtuous circle of finance and ecology [12,13]. Green finance is an effective means of implementing environmental protection regulation through financial leverage, and it is the embodiment of sustainable development goals in the financial field. The goals of high-quality development can be achieved by guiding the flow of funds to resource conservation and environmental protection industries, and guiding enterprises to engage in green production [14].
The development of green industries is the main force of economic sustainability. Green finance is responsible for the expansion of energy conservation and environmental protection industries, clean production industries, and clean energy industries. Green industry is an important engine to drive industrial upgrading and achieve high-quality development. It can not only provide strong support for the construction of ecological civilization, but also promote high-quality economic development. Accelerating the formation of green production methods and promoting win-win economic development and environmental protection are inseparable from the participation of enterprises. Green and low-carbon transformation and upgrading and sustainable development have become the only way for enterprises to develop high quality. However, in the process of implementing green production, enterprises often encounter resistance in terms of economy, technology, and management concepts. Therefore, to fundamentally eliminate the obstacles faced by green production, green financial support is urgently needed by guiding the optimal allocation of resources, promoting investment in green industries and technological innovation, and providing institutional guarantees for green development.
With the improvement of green finance systems, the impact of green credit policy has drawn much attention in recent years [15,16,17]. Scholars mainly hold two viewpoints on the impact of green credit policies on enterprise innovation: First, the “Porter Hypothesis” holds that the innovation compensation effect brought by green credit policies, giving green and environmental protection enterprises or projects the support of credit resources, has a significant impact on technological innovation incentives. Second, the “environmental cost theory” believes that green credit causes enterprises to invest too much capital in environmental responsibilities by setting environmental access thresholds, thereby crowding out enterprises’ green innovation investment. To sum up, the impact of green credit policy on corporate innovation output has not yet reached a consistent conclusion. Although the existing literature studies the green policy response of heavily pol-luting enterprises, few studies have conducted quasi-natural experiments on more micro-level indicators of green business, including technological innovation and financial performance. Moreover, there are still gaps in the heterogeneity analysis of the relationship between green credit policy and green enterprise technological innovation and financial performance from the digital finance level, green development level, and marketization level.
To fill these gaps, we intend to conduct a quasi-natural experiment on 422 enterprises listed on the Shanghai Stock Exchange and Shenzhen Stock Exchange in China spanning from 2007 to 2021. The contributions to the existing literature include the following aspects: (1) This paper uses the DID model to examine the impact of the “Green Credit Guidelines” on the technological innovation and financial performance of green enterprises. (2) The heterogeneity analysis is carried out from three aspects: the level of digital finance, the level of green development, and the level of marketization. (3) This study can provide a decision-making reference for the construction of China’s green credit system.
There are some important results drawn from the empirical analysis: (1) The implementation of green financial policies is conducive to stimulating the technological innovation of enterprises, bringing high growth to enterprises, and then realizing the improvement of business performance. (2) The “incentive” effect of green financial policy on the improvement of enterprise innovation and performance is affected by the heterogeneity of the development level of regional digital inclusive finance. (3) The “incentive” effect of green finance policy on the innovation and performance improvement of enterprises is affected by the heterogeneity of the regional green development level. (4) The “incentive” effect of green credit policies on green enterprises in areas with a high degree of marketization is more significant, compared with regions with a lower level of green development.
The remainder of this paper is organized as follows: Section 2 contains literature review and research hypotheses. Section 3 describes the data and introduces the difference-in-differences (DID) model. Section 4 presents the empirical results, the robustness tests, and heterogeneity analysis. The conclusion and policy recommendations are provided in Section 5.

2. Policy Background and Literature Review

2.1. Policy Background

Green credit refers to loans invested in green projects to support environmental improvement, and is a major component of China’s green finance. Since 2007, the China Banking Regulatory Commission (CBRC) has issued a series of policies to encourage financial institutions to actively develop green credit. The official implementation of the green credit policy was marked in 2012 when the CBRC submitted detailed documents explaining the relevant organization, process, policy terms, controlling, and supervision of green credit. These documents force local governments and commercial banks to focus directly on corporate environmental protection. In August 2016, the People’s Bank of China (PBC) issued the “Guiding Opinions on Building a Green Financial System”, which clearly put forward the strategy and top-level design for the establishment of China’s green financial system, including the development of green credit, environmental information disclosure, and nine other aspects. This is the first time that China has systematically put forward the definition of green finance, which has become a programmatic document for the development of green finance in China. With the strong support of various policies, China’s green finance practice has made some progress, especially the development of green credit and green bonds, which are at the forefront of the world. In 2020, the green loan balance of China’s 21 major banks exceeded CNY 12 trillion, while the combined green credit scale of major European countries was approximately CNY 700 billion.

2.2. Literature Review

With the expansion of the scale of green credit for enterprises, a large number of economic benefits and ecological dividends have been released. Existing literature mainly focuses on the impact of green credit on heavily polluting enterprises, including the financing mechanism of green credit [18,19] and its effect on environmental quality [20,21,22], debt-financing cost [6,15,23], R&D investment [24,25,26], and performance [17,27].
Huang et al. (2022) [18] used the panel threshold model to examine the mechanism of green finance on green innovation and found that there is a significant positive autocorrelation between green finance and green innovation. Through the double-threshold effect test, the paper also finds another mechanism; that is, the driving effect of green finance will be weakened with the improvement of environmental supervision, so it is suggested that the government should narrow the gap of sustainable development between regions. Tian et al. (2022) [19] used the propensity score match–difference-in-differences (PSM-DID) model to study the mechanism of action between China’s green finance policy and the green transformation of heavily polluting enterprises from 2009 to 2017. Research shows that the green credit policy had a significant positive effect on the green transformation of high-polluting enterprises by changing the debt financing constraints of enterprises, but the long-term sustainability of this positive effect is not high.
Kang et al. (2020) [20] used an optimal control model for South Korea’s Green Credit Policy (GCP) to study the impact of the GCP on reducing pollution in manufacturers’ supply chains. The results show that the Green Credit Policy (GCP) is an incentive for manufacturers to reduce pollution and create more added value for enterprises. Zhang et al. (2021) [21] took the introduction of the Green Credit Policy (GCP) as a quasi-natural experiment and used a difference-in-differences model to investigate China’s high-pollution listed companies from 2004 to 2017. It is found that green finance policy has an incentive effect on the short-term financing behavior of high-polluting enterprises, but has a punitive effect on the long-term financing of these enterprises. Nenavath (2022) [22] uses the semi-parametric difference-in-differences (SDID) approach to study the impact of India’s green finance policies on industrial carbon emissions and corporate strategic operations from 2010 to 2020. The results show that green finance policies can positively affect environmental security and business investment, and suggest that the government should encourage financial institutions to provide more green finance facilities to enterprises.
Shi et al. (2022) [6] used the DID method to explore the impact of green finance policies on the cost of debt financing of heavily polluting enterprises, and the results showed that the policy has a significant incentive effect; that is, the debt financing costs of heavily polluting enterprises are greatly reduced by the policy. Further mechanism analysis shows that green financial policies improve the reputation of enterprises through signal transmission, which is conducive to the sustainable development of enterprises. Xu and Li (2020) [15] examined the impact of green finance policies on corporate debt financing costs based on the Hausman test’s fixed-effect model and mediating effect analysis. The research shows that green credit policy increases the debt financing cost of high-polluting enterprises, and this effect has certain regional heterogeneity; that is, enterprises in economically developed areas are more significantly affected by green credit than in economically underdeveloped areas. Wu et al. (2022) [23] used the DID method to examine the impact of green credit policies on external financing for manufacturing enterprises from 2003 to 2016. The results show that the green credit policy has a significant negative impact on the external financing of the manufacturing industry. The green credit policy makes financial institutions tighten the credit funding support for high-polluting enterprises and overcapacity enterprises, improve the financing cost of such enterprises, and curb its blind expansion in order to achieve sustainable development goals and policy effects.
Chang et al. (2019) [24] used a dynamic panel generalized method of moments (GMM) to examine the impact of financial policies on R&D investment of enterprises, showing that the specific characteristics of enterprises, credit policies, and financial constraints have significant impacts on R&D investment. The enterprise’s size, short-term debt, financial leverage, and bank credit scale may have positive impacts on R&D investment. Chen et al. (2022) [25] constructed a difference-in-differences (DID) model to investigate and analyze the impact of green credit policies on corporate technological innovation by Chinese enterprises from 2004 to 2019. They found that green credit policies can not only vigorously promote low-carbon technological innovation, but also play a more significant role in promoting low-carbon technological innovation in state-owned enterprises and ESG-certified enterprises. Zhang and Kong (2022) [26] used the difference-in-differences method to investigate the impact of green credit policies on the R&D investment of high-polluting enterprises, but found that the implementation of green credit policies is not conducive to the R&D investment of high-polluting enterprises, and this inhibitory effect will also be affected by economic policy uncertainty.
Zhang et al. (2021) [17] used the fixed-effects model and grey relational analysis method to explore the impact mechanism of green finance policy on China’s environmental quality, corporate innovation vitality, and corporate performance. First, the green credit policy directly affects the internal resource allocation structure that determines corporate performance. The internal resources of the enterprise are concentrated in cleaner production activities, and the investment is inclined to clean equipment and technology, which further affects the company’s performance to a certain extent. Second, the green credit affects the financing and investment activities of enterprises by reducing the scale of bank credit to heavily polluting enterprises. This reduced financing could lead to higher financing costs for polluting companies, which in turn affects profitability and operating performance. Yao et al. (2021) [27] used a difference-in-differences (DID) model to explore the impact of green credit policies on the performance of Chinese listed companies, and found that the impact was significantly negative, which was determined by increasing financing constraints and lower investment levels. The above research does not provide a clear answer on whether the impact of green financial policies on enterprises is positive or negative. Some scholars support the government or relevant management authorities to increase green credit support to enhance the green innovation and green transformation of enterprises, while other scholars argue that the green credit policy does not have a positive policy incentive effect on enterprises. Although these scholars have conducted different studies on the impact of green credit on enterprises in various aspects, the existing literature still needs to be supplemented. The lack of empirical evidence on the micro-level effects of green credit policies on green enterprise technological innovation and financial performance is one of the current issues that needs to be addressed, and, thus, is the motivation for this study.

3. Research Design

3.1. Hypotheses

3.1.1. Green Finance and Green Enterprises’ Technological Innovation

A green enterprise refers to an enterprise that takes sustainable development as its own responsibility, incorporates environmental management into the whole process of enterprise operation and management, and achieves certain environmental performance. The main manifestations are: production of green products, use of green technology, and green marketing. From the comprehensive perspective of ecology and economy, green enterprises integrate environmental protection into their own development concepts, design, manufacture, and help the coordinated development of ecology and economy. Compared with other enterprises, green enterprises have a higher resource utilization rate and less resource consumption, and can recycle waste generated by other enterprises, so as to improve overall economic efficiency.
For the development of green enterprises, technological innovation is a key and important factor that cannot be ignored. For example, the fundamental driving force for the development of renewable energy is technological innovation, which can promote the progress of renewable energy technology, reduce costs, improve efficiency, and accelerate the cultivation of new technologies, new models, and new formats of renewable energy, continue to improve the modernization level of the renewable energy industry chain and supply chain, and consolidate and upgrade the renewable energy industry. However, the technological innovation of green enterprises requires financial support. Take the technological innovation of renewable energy companies as an example to illustrate the capital needs. The renewable energy sector will generate huge new investment needs due to its large-scale, market-oriented, high-quality new characteristics. Previous calculations by the China Industrial Bank’s research show that the scale of investment in renewable energy systems from 2021 to 2030 will reach CNY 6 trillion based on the carbon peaking action plan. Market-oriented development means that more social capital is needed, and financial support is essential in this.
In order to solve the financing problems faced by the above-mentioned renewable energy and other green enterprises’ technological innovation, two channels are needed: namely, internal financing and external financing. Internal financing uses the company’s own accumulated funds. In this case, investment behavior is not only determined by the capital needs of the enterprise, but also affected by the financial situation of the enterprise. When the gap between self-owned funds and corporate investment cash needs is too large, it often leads to serious underinvestment [28]. In contrast, external financing methods are diversified, including credit, stocks, bonds, etc., and it is the most common financing method. The financing constraints in modern financial management theory mainly refer to the external financial frictions faced by enterprises when seeking external financing support. Its financing cost is often higher than the internal financing cost, which is not easy to observe directly [21]. Therefore, enterprises will first consider the widest external financing channels, such as bank loans [29,30].
Among the wide range of external financing methods, green credit should be the preferred financing for green enterprises. The long-term effect of the policy is a favorable means for enterprises to change their development mode and adjust their production structure. The policy requires banking financial institutions to identify support targets and key areas, actively adjust the credit structure, and implement differentiated loans to enterprises. The purpose of this policy is to provide loan support for green projects that are beneficial to the ecological environment, and to impose loan constraints on projects with environmental risks. Green enterprises achieve sustainable development by incorporating environmental management into the whole process of enterprise management. They often improve green technology and produce green products through green technological innovation. Their daily activities and investment activities often meet environmental requirements. Most investment projects are green projects. Therefore, green credit policy will form a favorable tilt towards green enterprises. In this way, green companies will receive larger, longer-term, and lower-cost loans than other companies. The convenient loan channels will ease the financial pressure of green enterprises, and further enhance the technological innovation enthusiasm and technological innovation ability of green enterprises. Based on the above research mechanism analysis, Hypothesis 1 is put forward:
Hypothesis 1 (H1).
The green credit policy can stimulate the technological innovation of green enterprises.

3.1.2. Green Finance and Green Enterprises’ Financial Performance

The implementation of the green credit policy sends a signal to the market that the public supports the development of green enterprises. The public’s positive attitude towards green enterprises will change the competitive market structure, increase investment in green enterprises, and facilitate the financing channels to make green enterprises more capable of engaging in technological innovation activities. In addition, consumers will increase their consumption of green products, which will adjust the overall consumption structure of the market. The increasing demand for green products will play a guiding role in the production behavior of enterprises, prompting enterprises to actively expand their business scale and enhance financial performance [27].
Green credit policies enhance the competitiveness of green enterprises. After the implementation of the green credit policy, green enterprises will increase investment in research and development, enhance their own technological innovation capabilities, and produce more technological innovation results, such as improving production technology, reducing production costs, and developing new products. Therefore, green enterprises can quickly occupy a certain market share and gain market competitive advantages by virtue of technological advantages, cost advantages, product advantages, etc. In addition, under the protection of intellectual property rights, the competitive advantages obtained by green enterprises through technological innovation can be maintained for a long period of time, obtain a certain degree of market monopoly, create excess profits, and continuously improve their financial performance.
Green credit policies have a reputational effect on green companies. The implementation of the green credit policy shows that the public attaches great importance to green development and releases a signal that the development of green enterprises will be supported, and all sectors of society will give positive feedback to this. For example, investors will increase their confidence in investing in green enterprises, actively adjust their investment structure, and increase their investment in green enterprises. Consumers have a more favorable impression of companies that use green technologies and produce green products, and regard whether the products are environmentally friendly as an important indicator for evaluating companies. Government departments and other non-profit organizations are also optimistic about the development of green enterprises and increase cooperation with green enterprises to achieve public interests. Therefore, the implementation of green credit policies has a reputational effect on green enterprises, which can attract more funds and cooperation to green enterprises, improve their financial performance and create more profits. Based on the above research mechanism analysis, Hypothesis 2 is put forward:
Hypothesis 2 (H2).
The green credit policy can stimulate the financial performance of green enterprises.

3.1.3. The Heterogeneous Effect of Digital Financial Development

In recent decades, digital finance has emerged with the rapid development of emerging technologies such as big data, blockchain, and cloud computing. The advantages of digital finance lie in low cost, convenience, sharing, and high reliability. First, digital finance can reduce the information asymmetry in the credit market with the help of big data and cloud computing [31]. By accurately identifying companies with sustainable development potential, digital finance helps high-quality companies obtain more financial support. This alleviates the dilemma of high financing costs for companies to some extent [32]. Secondly, digital finance can help enterprises formulate reasonable production plans based on big data and identify technological innovations with the most potential, thereby promoting enterprise development and profitability [33]. Fintech plays an important role in the development of green finance by leveraging big data analytics (BDA) and artificial intelligence (AI) to enable green finance transition between clients and SMEs [34]. The digital financial development and Fintech accelerate the technological innovation of enterprises through more green financial support [35]. Based on the analysis of the above literature on the impact of digital finance and Fintech on green finance and technological innovation, we propose Hypothesis 3:
Hypothesis 3a (H3a).
For green enterprises in regions with a high degree of digital finance, technological innovation will be significantly improved by the impact of green credit guidelines.
Hypothesis 3b (H3b).
For green enterprises in regions with a high degree of digital finance, financial performance will be significantly improved by the impact of green credit guidelines.

3.1.4. The Heterogeneous Effect of Green Development

Since the registered areas of listed companies are at different levels of green development, this paper refers to the “China Green Development Index Report” and divides the samples into two sub-samples, high and low, according to the level of the green development index. Under the sustainable development strategy, the environmental protection and emission reduction tasks of local governments are very difficult to accomplish. In this context, it is necessary to increase the implementation of green credit and accelerate the promotion of green technological innovation of local enterprises [9]. Therefore, green credit may have a stronger role in promoting the investment and financing behavior of enterprises in areas with high green development indices. This will lead to higher technological innovation and financial performance. On the contrary, the impact on the investment and financing behavior of enterprises in areas with low green development index may be less significant. Based on the above research mechanism analysis, Hypothesis 4 is put forward:
Hypothesis 4a (H4a).
In areas with a high green development index, green credit policy may have a stronger role in promoting the technological innovation of enterprises.
Hypothesis 4b (H4b).
In areas with a high green development index, green credit policy may have a greater impact on corporate financial performance.

3.1.5. The Heterogeneous Effect of Marketization Level

As the degree of marketization intensifies, the degree of economic liberalization increases, and the factors and product liquidity of enterprises also increase accordingly. Under the premise that the degree of marketization is increasingly important, enterprises will consider the level of marketization more in their investment and production decisions. The existing literature [26,36,37] shows that differences in market environment, such as the degree of government subsidies, the degree of government intervention, and the degree of marketization faced by enterprises, may lead to the heterogeneous impact of green credit policies on enterprise R&D investment. Aiming at high-polluting and high-energy-consuming enterprises (“two highs”), Zhang and Kong (2022) [26] find that the green credit policy is not conducive to the R&D investment of enterprises with “two highs”, and this impact has heterogeneity in the market environment. Kong et al. (2021) [36] point out that the degree of marketization has a positive impact on R&D investment and innovation performance. Tan et al. (2022) [37] propose that the increased degree of marketization strengthens the role of green credit policy and promotes the peer effect of green innovation. Contrary to the research sample in this paper, we explore the heterogeneous impact of green credit policies on green enterprises and, thus, propose Hypothesis 5 as follows:
Hypothesis 5a (H5a).
In areas with a high degree of marketization, green credit policy may play a stronger role in promoting the technological innovation of enterprises.
Hypothesis 5b (H5b).
In areas with a high degree of marketization, green credit policy may have a greater impact on corporate financial performance.

3.2. Data

This paper explores the impact of the green finance on technological innovation and financial performance in green enterprises using the “Green Credit Guidelines” promulgated by the Chinese government in 2012 as a unique event of quasi-natural experiment. The observed data of green companies listed on the Shanghai Stock Exchange and Shenzhen Stock Exchange in China are selected as samples, and the sample period is from 2007 to 2021. The original samples are preprocessed as follows: (1) We exclude companies with abnormal financial conditions; that is, the net profit of the audited two consecutive fiscal years is negative, or the audited net assets per share in the most recent fiscal year is lower than the par value of the stock. (2) We exclude financial and insurance companies, which is due to the fact that the large amount of cash flow in financial companies does not create actual wealth, and it is easy to cause the bias of empirical testing if included. (3) The enterprises established before 2007 and listed after 2012 are excluded as they cannot be used to verify the hypothesis. (4) The enterprises with severely missing financial data were eliminated. Through the above methods of data preprocessing, 6345 observations of 422 enterprises were finally obtained as full samples.
This paper selects green enterprises according to the “Green Enterprise Evaluation Criteria” officially implemented on 5 January 2022 and considering the main business scope of the enterprise. Specific criteria for distinguishing green enterprises from non-green enterprises include: (1) whether they have labels such as new energy, clean energy, energy conservation and environmental protection, pollution control, and green; (2) whether they have been awarded the honors such as the most growing listed company in the carbon neutral industry, the top 100 new energy conservation and environmental protection enterprises, and the sustainable development value of A-share listed companies. In this paper, the heavily polluting enterprises are excluded, and the control group sample is defined according to the main business scope, mainly including software development, computer technology, medicine, manufacturing, and other enterprises that are less affected by the green credit policy. According to the above criteria, the research samples are divided into 231 green enterprises as samples in the treatment group, and 191 non-green enterprises as samples in the control group.
The data in this paper mainly include three types: (1) the number of patent applications of enterprises in each year, including the number of invention patent applications, the number of utility model patent applications, and the number of design patent applications; (2) the financial statement data of enterprises; (3) the digital financial index, green development index, and marketization index. The data come from the following three types of information databases: (1) the number of patent applications of enterprises are from the China Patent Information Center (CPIC); (2) the financial statements data of the enterprise comes from the China Stock Market Accounting Research Database (CSMAR); (3) the digital financial index, green development index, and marketization index are respectively derived from the Digital Finance Research Center of Peking University (DFRCPU), China Green Development Index Report (CGDIR), and China Marketization Index Database (CMID).

3.3. Model

The difference-in-differences (DID) model has become popular in the existing literature related to policy evaluation due to its relatively accurate identification of causality [38]. In this paper, the Green Credit Guidelines, as a purely exogenous event, will not be affected by the operations and risks of individual companies, and meet the preconditions of the DID model, and, thus, can be regarded as a quasi-natural experiment.
To examine the impact of green credit policies on the technological innovation and financial performance of green enterprises, the following DID model is constructed:
P a t i t = α 0 + α 1 P o s t t T r e a t i + α 2 P o s t t + α 3 T r e a t i + α 4 S i z e i t + α 5 A g e i t + α 6 S a l e i t + α 7 L i q u i d i t y i t +   α 8 L e v i t + α 9 C F i t + α 10 Q i t + α 11 G r o w t h i t + α 12 T a n g i b i l i t y i t + α 13 T o p 1 i t + δ i + λ t + ε i t
P r o f i t i t = β 0 + β 1 P o s t t T r e a t i + β 2 P o s t t + β 3 T r e a t i + β 4 S i z e i t + β 5 A g e i t + β 6 S a l e i t + β 7 L i q u i d i t y i t +   β 8 L e v i t + β 9 C F i t + β 10 Q i t + β 11 G r o w t h i t + β 12 T a n g i b i l i t y i t + β 13 T o p 1 i t + δ i + λ t + ε i t
where P a t i t and P r o f i t i t are the explained variables, representing the technological innovation and financial performance of the enterprise. According to Wang and Li (2022) [3], P a t i t is measured by the natural logarithm of the number of patent applications plus 1 to eliminate the problem of right-skewed distribution of patent application data. P r o f i t i t is measured by a firm’s operating profit margin. P o s t t T r e a t i is the explanatory variable; that is, the multiplication term of green credit policy and individual enterprise. If the coefficient of P o s t t T r e a t i is significantly positive, it indicates that the green credit policy has a significant role in promoting the technological innovation and financial performance of green enterprises, and vice versa. P o s t t is an event dummy variable before and after the implementation of the Green Credit Guidelines, while the value is 1 after 2012, otherwise it is 0. T r e a t i is a group dummy variable distinguishing the treatment group from the control group, while the value of the treatment group is 1 and otherwise is 0. α 0 and β 0 are the constants of models. δ i is an individual fixed effect. λ t is a time-fixed effect. ε i t is a random perturbation term. The remaining variables present in the model that are not introduced are control variables.
In order to control other economic indicators that affect the technological innovation and financial performance of green enterprises, this paper refers to the existing literature and introduces 10 variables as the control variables, including: enterprise scale S i z e i t , operating years A g e i t , asset turnover ratio S a l e i t , current ratio L i q u i d i t y i t , debt ratio L e v i t , net cash flow from operating activities C F i t , Tobin’s Q value Q i t , growth rate of operating income G r o w t h i t , asset structure T a n g i b i l i t y i t , and the largest shareholder’s shareholding ratio T o p 1 i t . This paper controls the firm-fixed effect and the time-fixed effect to make the regression results more robust. The specific definitions and calculation methods of variables are as follows in Table 1.

4. Results and Discussions

4.1. Descriptive Statistics

The descriptive statistics for the whole sample are shown in Table 2. The standard deviation of P a t i t is 1.797, and the minimum and maximum values are 0 and 9.572, respectively, indicating that the selected sample companies have great differences in the total number of patent applications. The standard deviation of P a t i t is 0.220, indicating that the difference in operating profit rate of the sample enterprises is small, and the financial performance of the selected sample enterprises is similar. The standard deviation of S i z e i t is 1.460, the minimum value is 16.160, and the maximum value is 28.270, indicating that there is a large difference in the scale of the selected sample enterprises. The standard deviations of L i q u i d i t y i t and L e v i t are 2.133 and 1.590, respectively, indicating that the selected enterprises have large differences in their ability to repay their debts. The standard deviation of T o p 1 i t is 14.950, and the minimum and maximum values are 3.620 and 95.100, respectively, indicating that the governance structures of sample companies are quite different.
We performed the Pearson correlation test on the variables of model (1) and model (2). The Pearson correlation coefficient is often used to roughly estimate the linear correlation between two variables. The results shown in Appendix A (Table A1 and Table A2) show that there is a certain correlation between the explained variables and the explanatory variables of model (1) and model (2), and further regression tests are needed to verify. For further analysis, the variance inflation factor (VIF) method is used to test the multicollinearity problem of the model. The variance inflation factor is the ratio of the variance in the presence of multicollinearity among the explanatory variables to the variance in the absence of multicollinearity. The closer the VIF value is to 1, the lighter the multicollinearity. The empirical judgment criterion shows that: when 0 < VIF < 10, there is no multicollinearity. The test results are shown in Appendix B. The VIF values of all explanatory variables are close to 1, indicating that the model does not have a multicollinearity problem.

4.2. The DID Regression Results

Table 3 shows the regression results of the DID model for testing the impact of the green credit policy on the technological innovation and financial performance of green enterprises. The regression results of columns (1) and (3) indicate the impact on the technological innovation ( P a t i t ), and the regression results of columns (2) and (4) indicate the impact on the financial performance ( P r o f i t i t ). To exclude the effect of multicollinearity, we performed regressions on the models without and with control variables, respectively. It can be seen that the regression coefficients of the core explanatory variable ( P o s t t T r e a t i ) are always significantly positive at the 1%, 5%, and 10% significance levels, indicating that the green credit policy has a significant role in promoting both technological innovation and financial performance. The regression results are further explained as follows:
First, the coefficients of the interaction term ( P o s t t T r e a t i ) in columns (1) and (2) without considering control variables are 0.439 and 0.043, and they are significant at the 1% and 5% levels, respectively. After adding control variables, the regression results are shown in columns (3) and (4). In column (3), the coefficient of the interaction term ( P o s t t T r e a t i ) is 0.364, which is significantly positive at the 1% level. It indicates that the implementation of the Green Credit Guidelines has significantly boosted the technological innovation output of green companies. The conclusion of “innovation effect” drawn in this paper is consistent with the existing literature [3,11,24,25], but contrary to the conclusion of [26]. Wang and Li (2022) [3] investigated the heterogeneous impact of green credit policies on various green technology innovations of different companies around the world and found that green technology innovations increased significantly for all companies after the release of the credit guidelines. The increase in green technology innovation is relatively large, so the investment efficiency has been significantly improved. The findings of Hu et al. (2021) suggested that green finance has a positive impact on green innovation in highly polluting firms. Chang et al. (2019) [24] indicate that the credit policies have significant positive impacts on R&D investment. Chen et al. (2022) [25] found that green credit policies can vigorously promote low-carbon technological innovation, especially in state-owned enterprises. On the contrary, Zhang and Kong (2022) [26] argued that the green credit policy is not conducive to R&D investment in the “two high and one leftover” enterprises because companies are often constrained by credit policies because they are forced to comply with environmental testing standards and lack the funds to carry out green innovation. After comparative analysis, we found that the reasonableness of the conclusions of this paper is that the research object of this paper is green enterprises who are supported by green credit policies, and, thus, can obtain more financial support for technological innovation. Moreover, our empirical result is consistent with Porter’s hypothesis that the innovation compensation effect brought by green credit policies has significantly stimulated the technological innovation of enterprises. In column (4), the coefficient of the interaction term ( P o s t t T r e a t i ) is 0.021, which is significant positive at the 10% level, indicating that the financial performance of green enterprises has been significantly improved after the implementation of the Green Credit Guidelines. This result is consistent with Shi et al. (2022) [6] and Zhang et al. (2021) [17]. Faced with green finance constraints, high-polluting enterprises make more green investments and improve production efficiency, which are conducive to better financial performance of enterprises (Shi et al., 2022) [6]. Holding the same view, Zhang et al. (2021) [17] insisted that green credit has a greater impact on the performance of investment and financing activities of enterprises. In contrast, Yao et al. (2021) [27] believe that the financing constraints of green credit leads to insufficient internal funds of enterprises, and business development is limited, which ultimately reduces the performance of enterprises, but it is only aimed at heavily polluting enterprises in order to force their transformation. To sum up, the financial performance of green enterprises will have an overall upward trend when they are affected by the green credit policy. This is also what policymakers want to achieve in order to promote the green transition.
Second, the enterprise scale ( S i z e i t ) has a significant effect on the total number of patent applications and operating profit margins of green enterprises, while the asset structure ( T a n g i b i l i t y i t ) and the current ratio ( L i q u i d i t y i t ) have no significant impact. In column (3), the coefficient of the growth rate of operating income growth is significantly negative at the level of 5%, indicating that the increase in the growth rate of operating income is not conducive to the improvement of the technological innovation quantity of green enterprises. In column (4), the coefficients of the asset turnover rate ( S a l e i t ), the operating income growth rate ( G r o w t h i t ), the largest shareholder’s shareholding ratio ( T o p 1 i t ), and the net cash flow from operating activities ( C F i t ) are all significantly positive, indicating that the higher the equity concentration of green companies, the stronger the operating ability, and, therefore, the greater the financial performance of the enterprise. The coefficients of operating years ( A g e i t ) and liabilities ( L e v i t ) are significantly negative, indicating that the increase in operating years is not conducive to the improvement of the financial performance of green enterprises.
Third, the coefficient of the debt ratio ( L e v i t ) in column (4) is −0.524 and is significant at the 1% level. This shows that after the implementation of the “Green Credit Guidelines”, the loans of green enterprises have increased, and the financial leverage has increased accordingly. Moreover, this indirectly shows that the convenience of green enterprises to obtain loans has been improved, and the enthusiasm of green enterprises to innovate has been improved. Furthermore, the coefficient of Tobin’s Q value ( Q i t ) in column (4) is 0.016 and is significant at the 1% level. This shows that after the implementation of the policy, the improvement of the technological innovation ability of green enterprises makes green enterprises have a higher growth potential, thereby promoting the financial performance of green enterprises.

4.3. Robustness Test

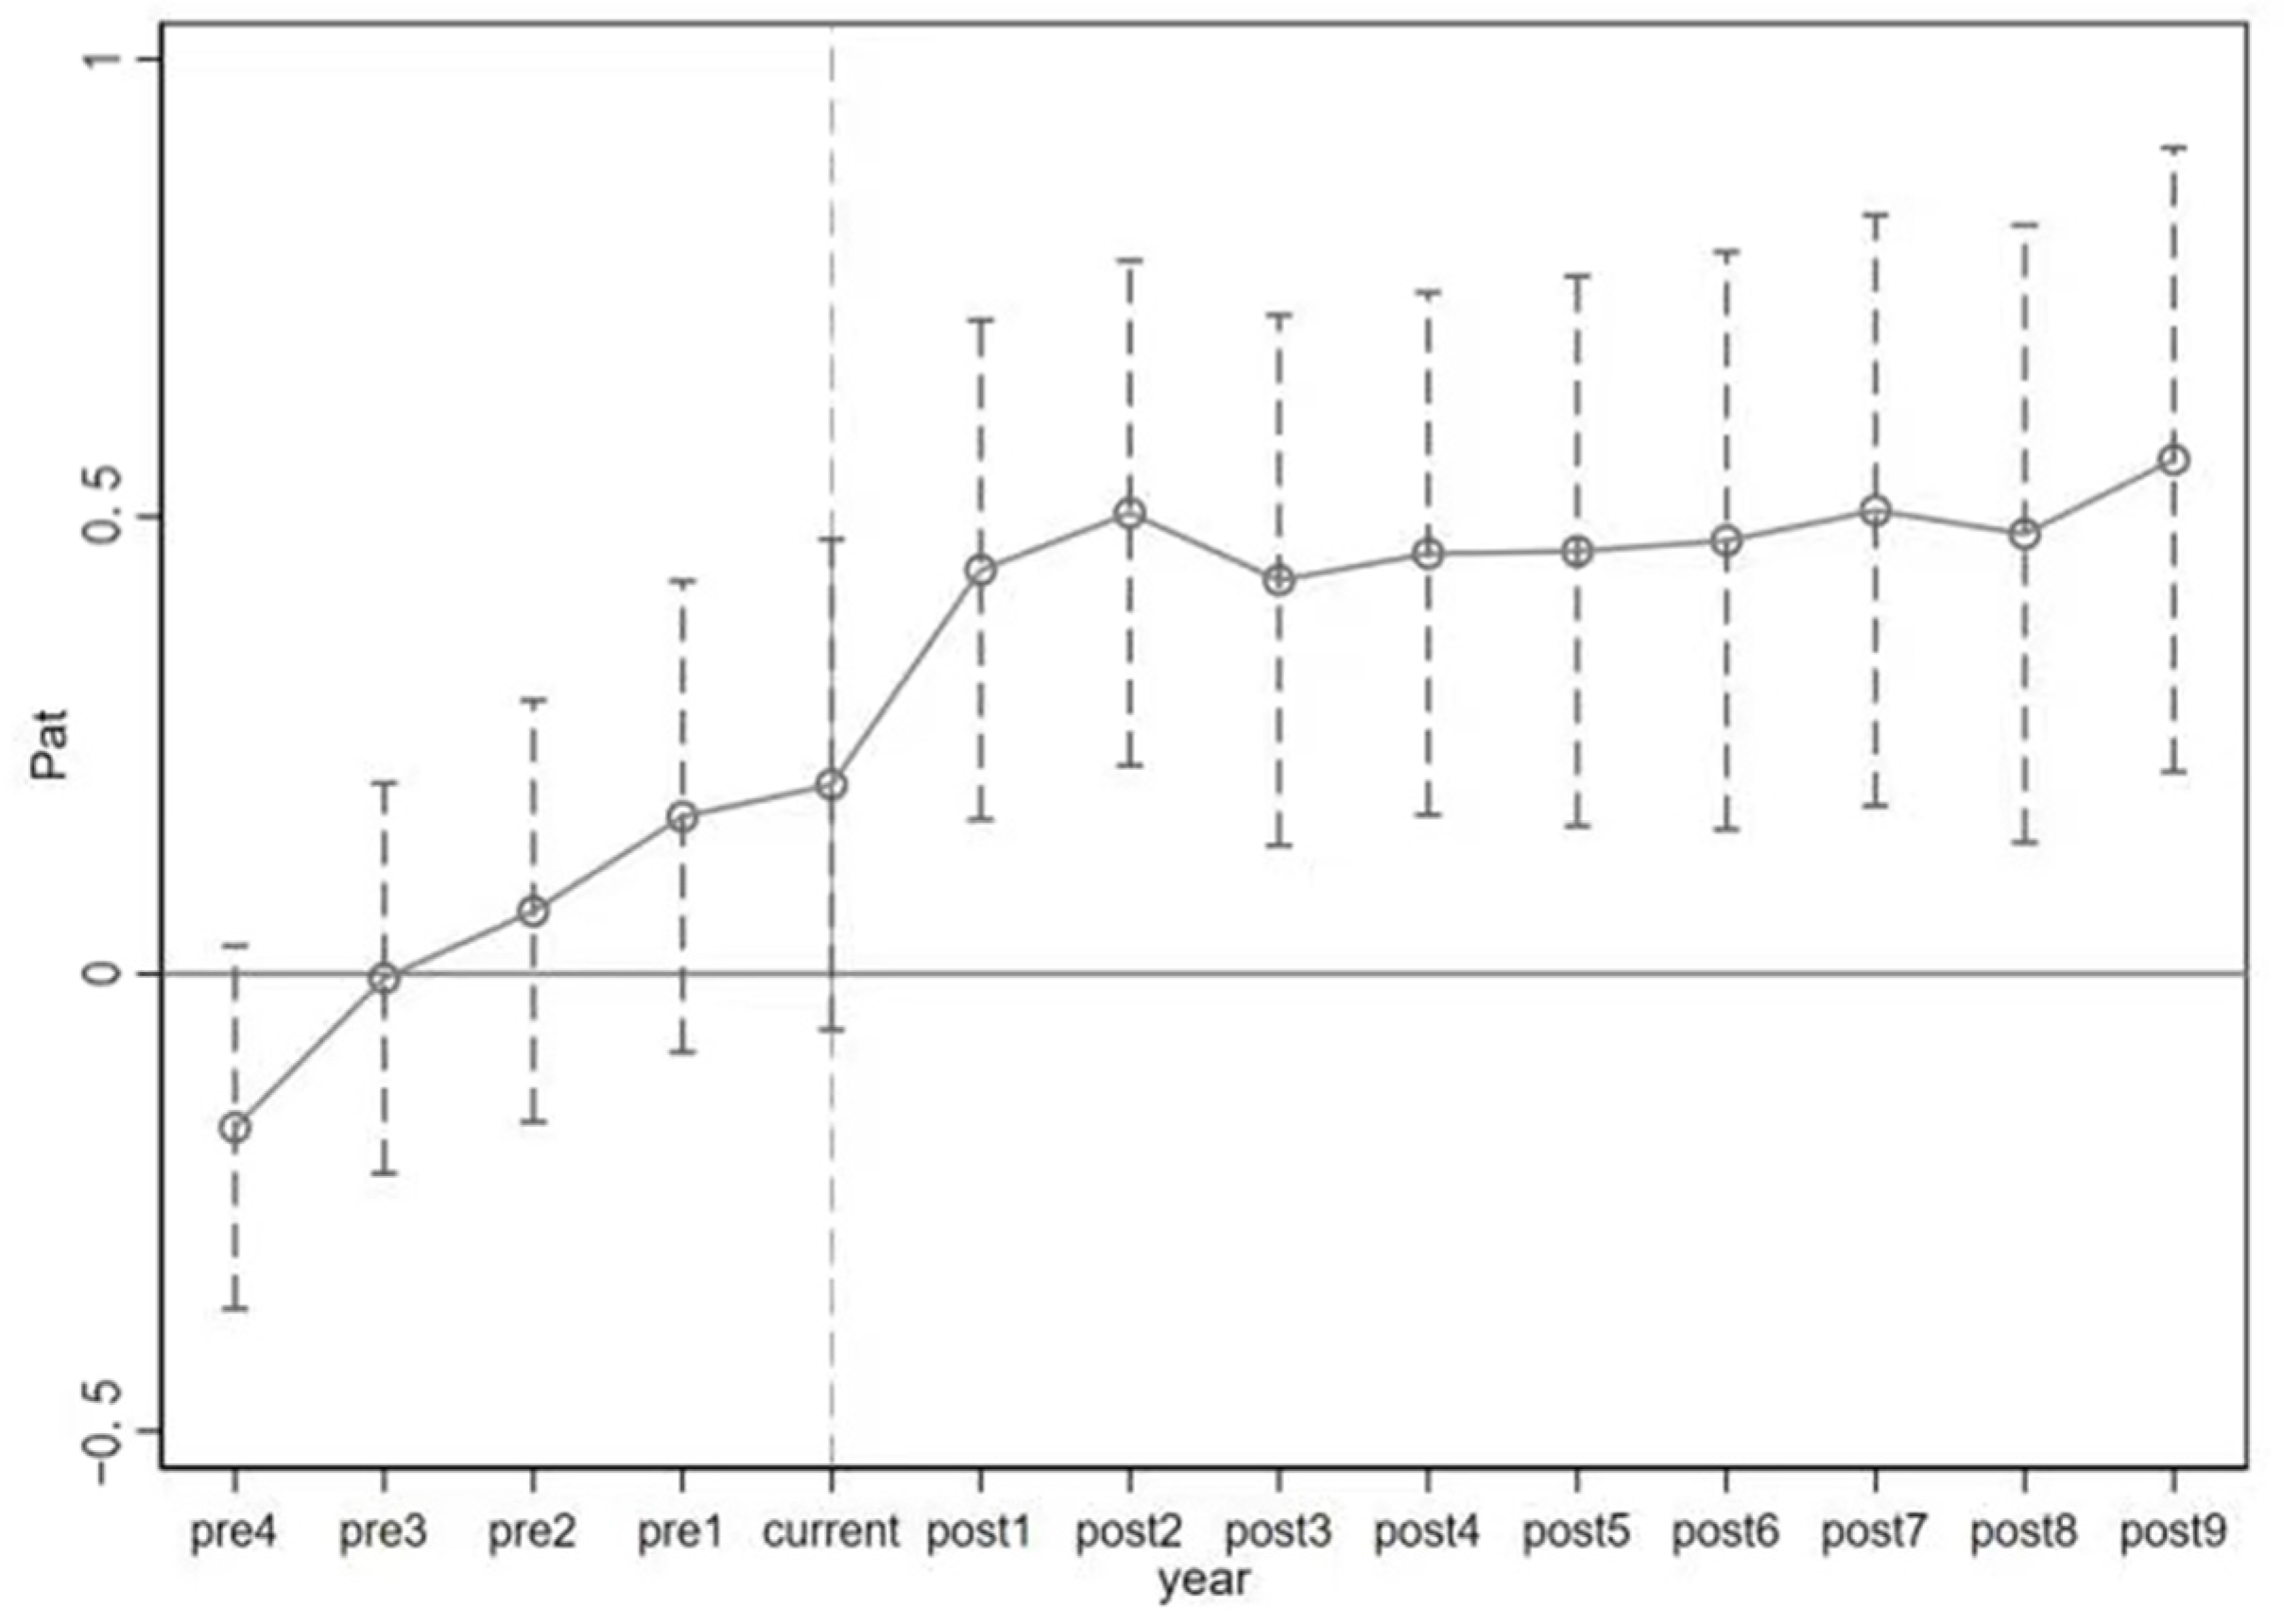
4.3.1. Parallel Trend Test

The effectiveness of the DID model depends on satisfying key identification assumptions. The parallel trends assumption requires a similar trend in technological innovation and financial performance between experimental and control groups prior to the 2012 guideline. In accordance with the popular parallel trend hypothesis testing method [39,40], this paper uses the event study method to further examine the changing trends of the treatment group and the control group. The following equations are constructed for dynamic effects analysis:
P a t i t = θ 0 + μ 4 T 4 + μ 3 T 3 + μ 2 T 2 + μ 1 T 1 + μ 0 T 0 + μ 1 T 1 + μ 2 T 2 + μ 3 T 3 + μ 4 T 4 + μ 5 T 5 +   μ 6 T 6 + μ 7 T 7 + μ 8 T 8 + μ 9 T 9 + δ i + λ t + ε i t
P r o f i t i t = ϑ 0 + ξ 4 T 4 + ξ 3 T 3 + ξ 2 T 2 + ξ 1 T 1 + ξ 0 T 0 + ξ 1 T 1 + ξ 2 T 2 + ξ 3 T 3 + ξ 4 T 4 + ξ 5 T 5 +   ξ 6 T 6 + ξ 7 T 7 + ξ 8 T 8 + ξ 9 T 9 + δ i + λ t + ε i t
where T0 indicates the year in which the Green Credit Guidelines are implemented, T−4 to T−1 are 4 to 1 years before the implementation of the Green Credit Guidelines, and T1 to T9 are the first to nine years after the implementation of the Green Credit Guidelines. The fifth year before the implementation of the Green Credit Guidelines is the base year.
Figure 1 and Figure 2 present the estimation results and confidence intervals of μt and ξt. The regression coefficients before the implementation of the Green Credit Guidelines are not significantly different from 0. This shows that before the implementation of the “Green Credit Guidelines”, there was no significant difference in the number of patent applications and financial performance of enterprises in the treatment group and the control group, and the parallel trend hypothesis was established. In Figure 1, after the implementation of the “Green Credit Guidelines”, the regression coefficients were all significantly positive, and the regression coefficients were the largest in 2013 and 2014, indicating that the “Green Credit Guidelines” had the strongest stimulating effect on corporate technological innovation, and then stabilized. Figure 2 shows that after the implementation of the policy, the regression coefficient was significantly positive from 2013 to 2015 and continued to rise, indicating that the Green Credit Guidelines have an increasing role in promoting corporate financial performance. Thus, the parallel trends assumption is satisfied and the DID model is valid.

4.3.2. Change the Sample

Since the outbreak of the COVID-19 pandemic in December 2019, the production and operation of enterprises were affected. The pandemic had a certain impact on the development of green industries and the promotion of green finance in some provinces and cities on the demand side and the supply side. In order to eliminate these influencing factors, the sample period is reduced to 2007–2019. The DID model is re-regressed according to the subsample and the results are shown in Table 4.
The regression results of column (1) indicate that the coefficient of the interaction term ( P o s t t T r e a t i ) is 0.360, and it is significantly positive at the 1% level, suggesting that the Green Credit Guidelines have a significant role in promoting the number of technological innovations of green enterprises. The regression results of column (2) show that the coefficient of the interaction term ( P o s t t T r e a t i ) is 0.020, and it is significant at the 10% level, indicating that after the implementation of the Green Credit Guidelines, the financial performance of green enterprises has increased by 1.9%. The regression results are the same as the previous baseline regression. Therefore, the DID model used in this paper has passed the robustness test, and the conclusions remain the same.

4.3.3. Alternative Proxies for Technological Innovation

To proxy for technological innovation, we first take the natural logarithm of total number of patent applications as the explained variable, following Wang and Li (2022) [3] and Yu et al. (2021) [5]. In order to verify the robustness of the model, we replace the explained variables and do the regression again. Chen et al. (2022) [25] argue that the Green Credit Guidelines can promote technological innovation by increasing R&D investment and the enhancement of enterprises’ independent R&D will improve their production capacity. Consistent with [25], the other scholars [11,33] also use R&D investment as a technological innovation indicator for their research. Therefore, this paper replaces the number of patents with the ratio of R&D investment as a new proxy variable to measure the technological innovation ability of enterprises, and conduct the DID regression test again. The results for new proxy variable of technological innovation are presented in Table 5, which are consistent with the main conclusion.

4.3.4. Alternative Proxies for Financial Performance

As Wang et al. (2022) [41] propose that financial performance of the enterprise is highly dependent on the enterprise’s operating cash flow, we first measure the financial performance of enterprises using total operating profit divided by operating income in the baseline regression model. In order to verify the robustness of the model, we replace the explained variables and do the regression again. According to Liu and Xiong (2022) [14], Wen et al. (2021) [16], and Zhang et al. (2022) [35], this paper replaces total operating profit with return of assets (ROA), and uses this indicator to verify the robustness of the empirical conclusion. The results are shown in Table 5, which are consistent with the main conclusion.

4.4. Heterogeneity Analysis

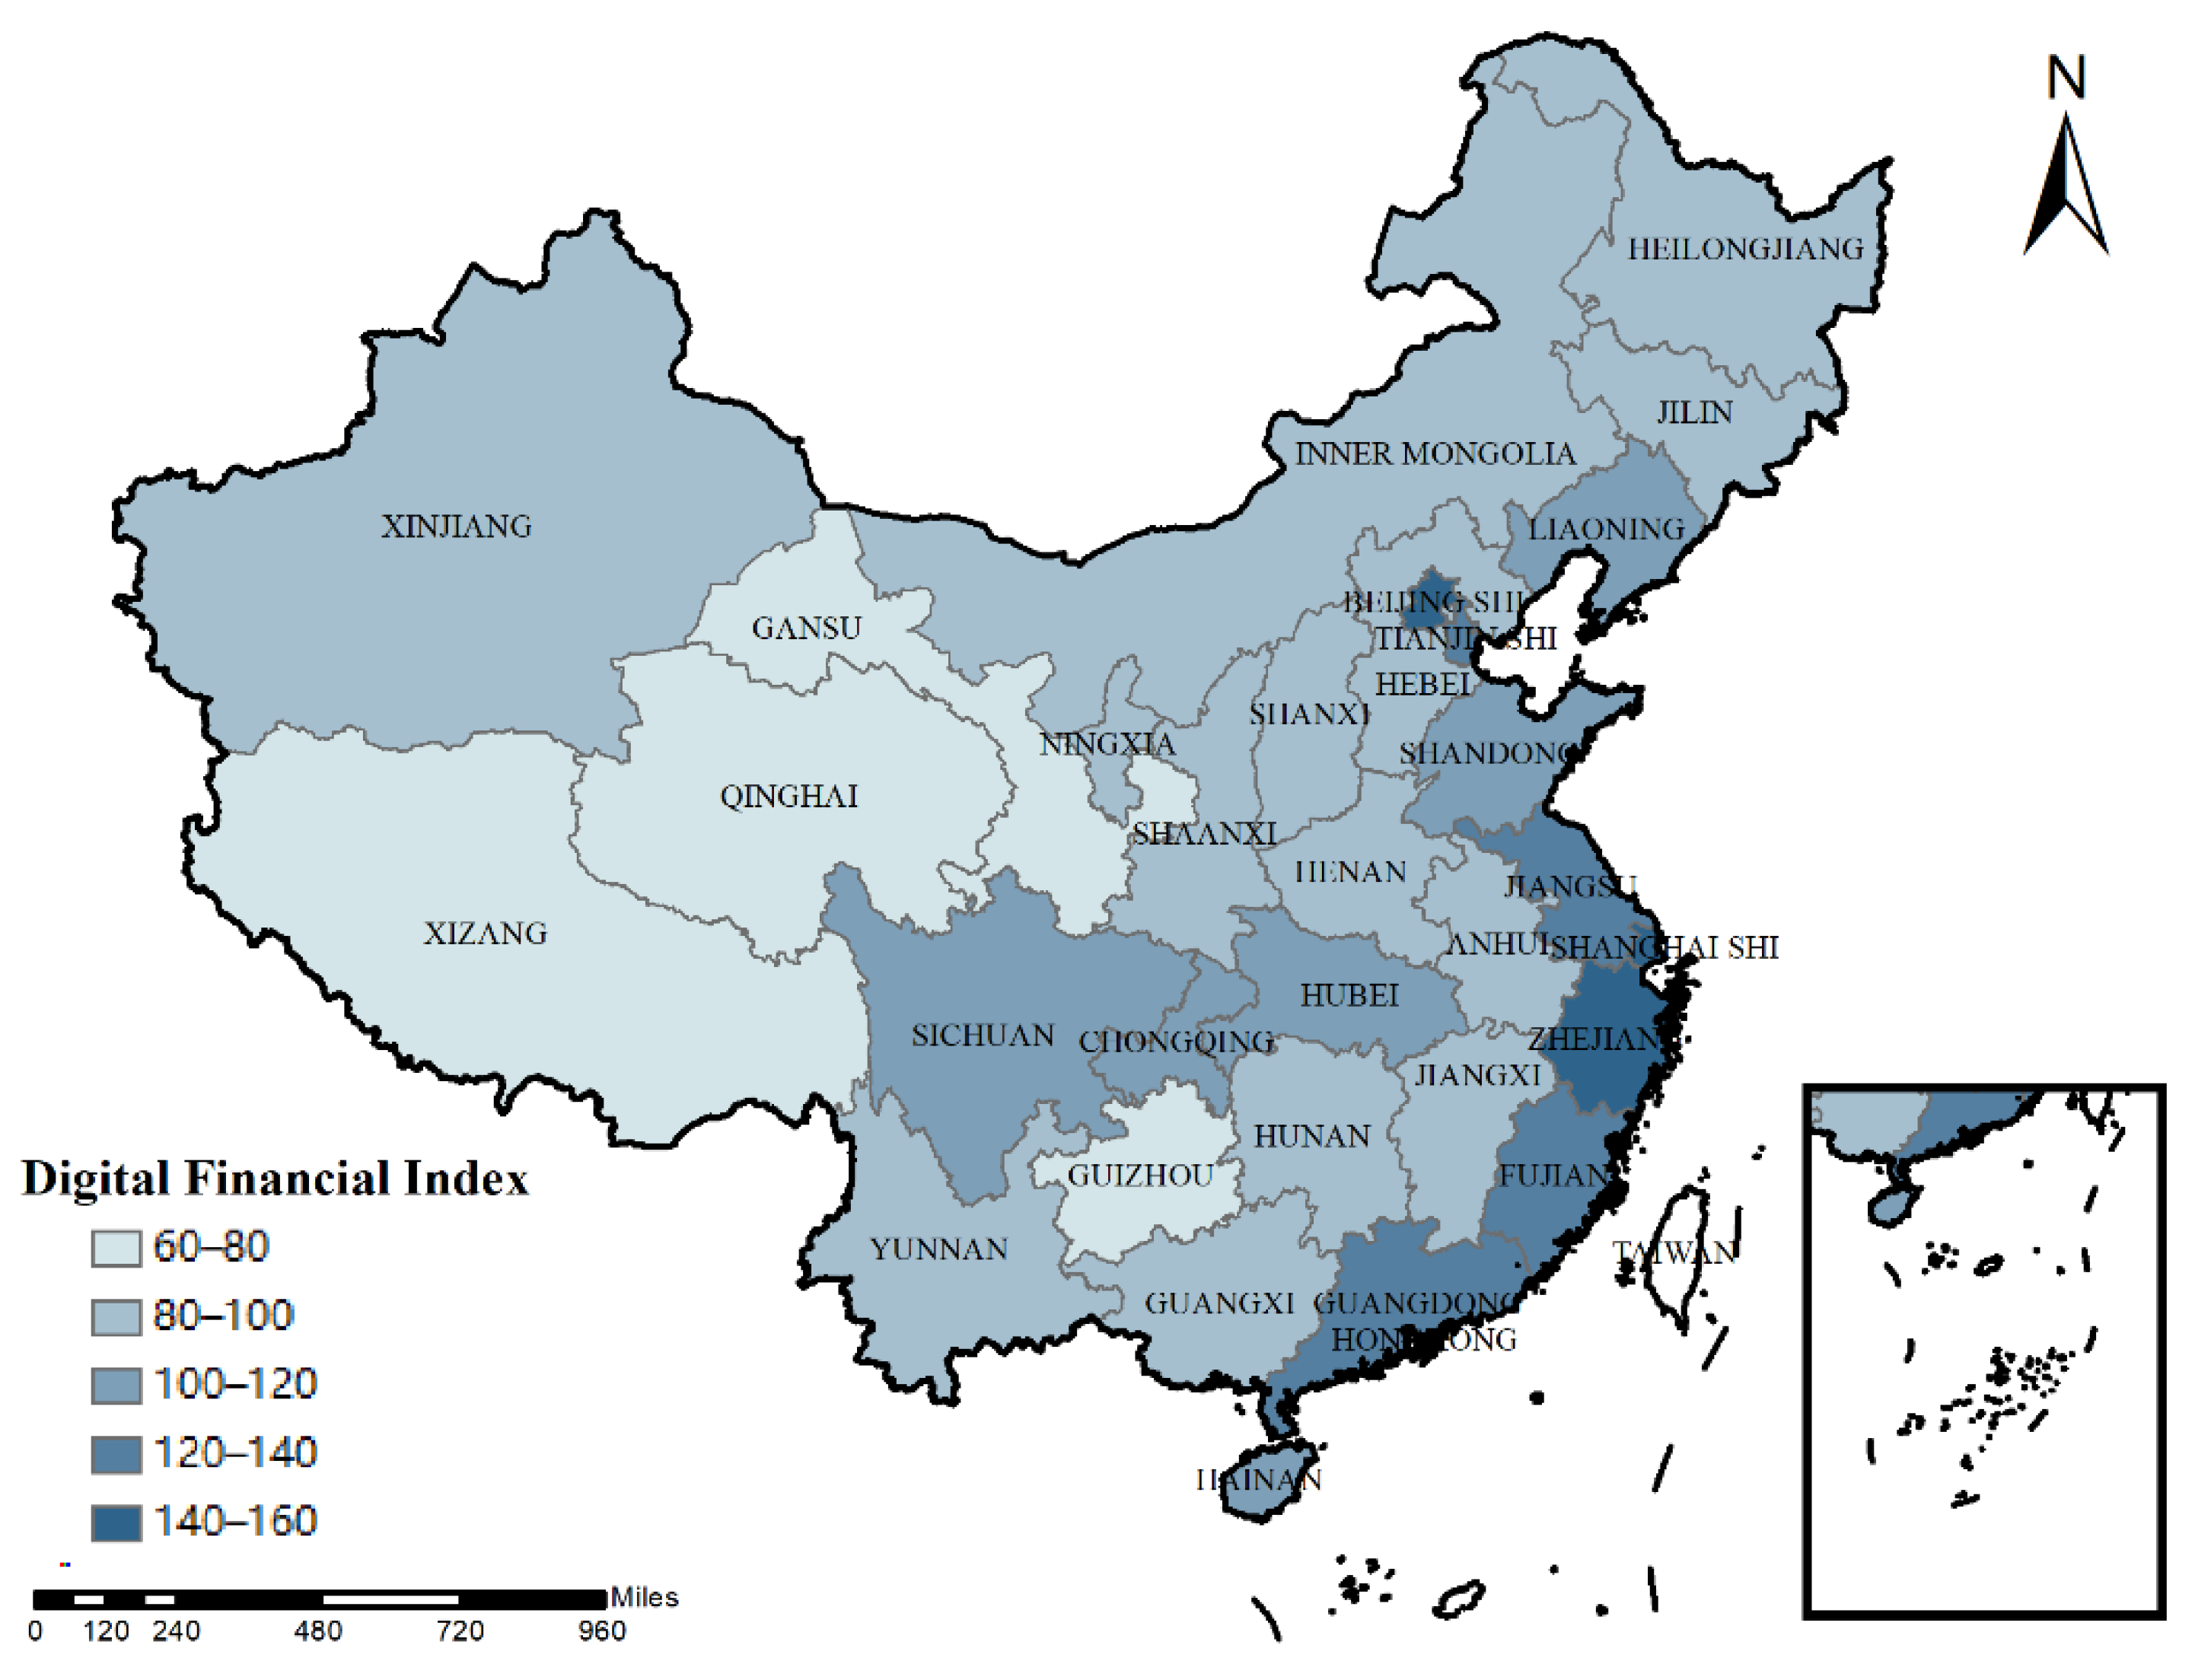
4.4.1. The Heterogeneity of Digital Financial Level

Due to the uneven level of digital financial index in the registered areas of the sample listed companies (Figure 3), the financing support policies of local financial institutions for each company are quite different, which results in different listed companies’ investment policy and operating efficiency to the green credit policy. Therefore, the impact of the spatial heterogeneity of China’s provinces’ digital financial index should not be underestimated.
According to the Digital Financial Inclusion Index published by the Digital Finance Research Center of Peking University (DFRCPU), the sample is divided into two types of companies in areas with high levels of digital financial development index and companies in areas with low levels of digital financial development index. The regression results in Table 6 show that green companies in areas with a high degree of digital financial index have significantly improved both the total number of patent applications and their financial performance. This conclusion is supported by viewpoints from two branches of the literature. One branch is from the literature on the impact of digital finance on green innovation, and the other is from the literature on the impact of digital finance on financial performance. As Cao et al. (2021) [42] found, digital finance can fill the shortcomings of traditional finance in promoting technological innovation, significantly improve green technology innovation capabilities, and improve environmental performance. Feng et al. (2022) [43] empirically studied the impact of digital finance on green technology innovation, and point out the following two points. First, digital finance has significantly promoted green technology innovation, which is attributable to the fact that digital finance brings financing convenience to enterprises to a greater extent and reduces constraints. Second, digital finance has a greater positive effect on the green technology innovation of small enterprises, especially in areas with severe pollution and strong local governance capabilities. In short, the development of digital finance can better promote green technology innovation. Wu and Huang (2022) [44] took the new energy enterprises in the green industry as the research object, and conducted an empirical study on the impact of digital finance and financial constraints on the financial performance of enterprises. The results show that digital finance can contribute to the financial performance of new energy companies, especially in small businesses and non-state-owned enterprises. Although the above studies have verified the role of digital finance, the impact of green credit on corporate technological innovation and financial performance in areas with less-developed digital finance is not significant.

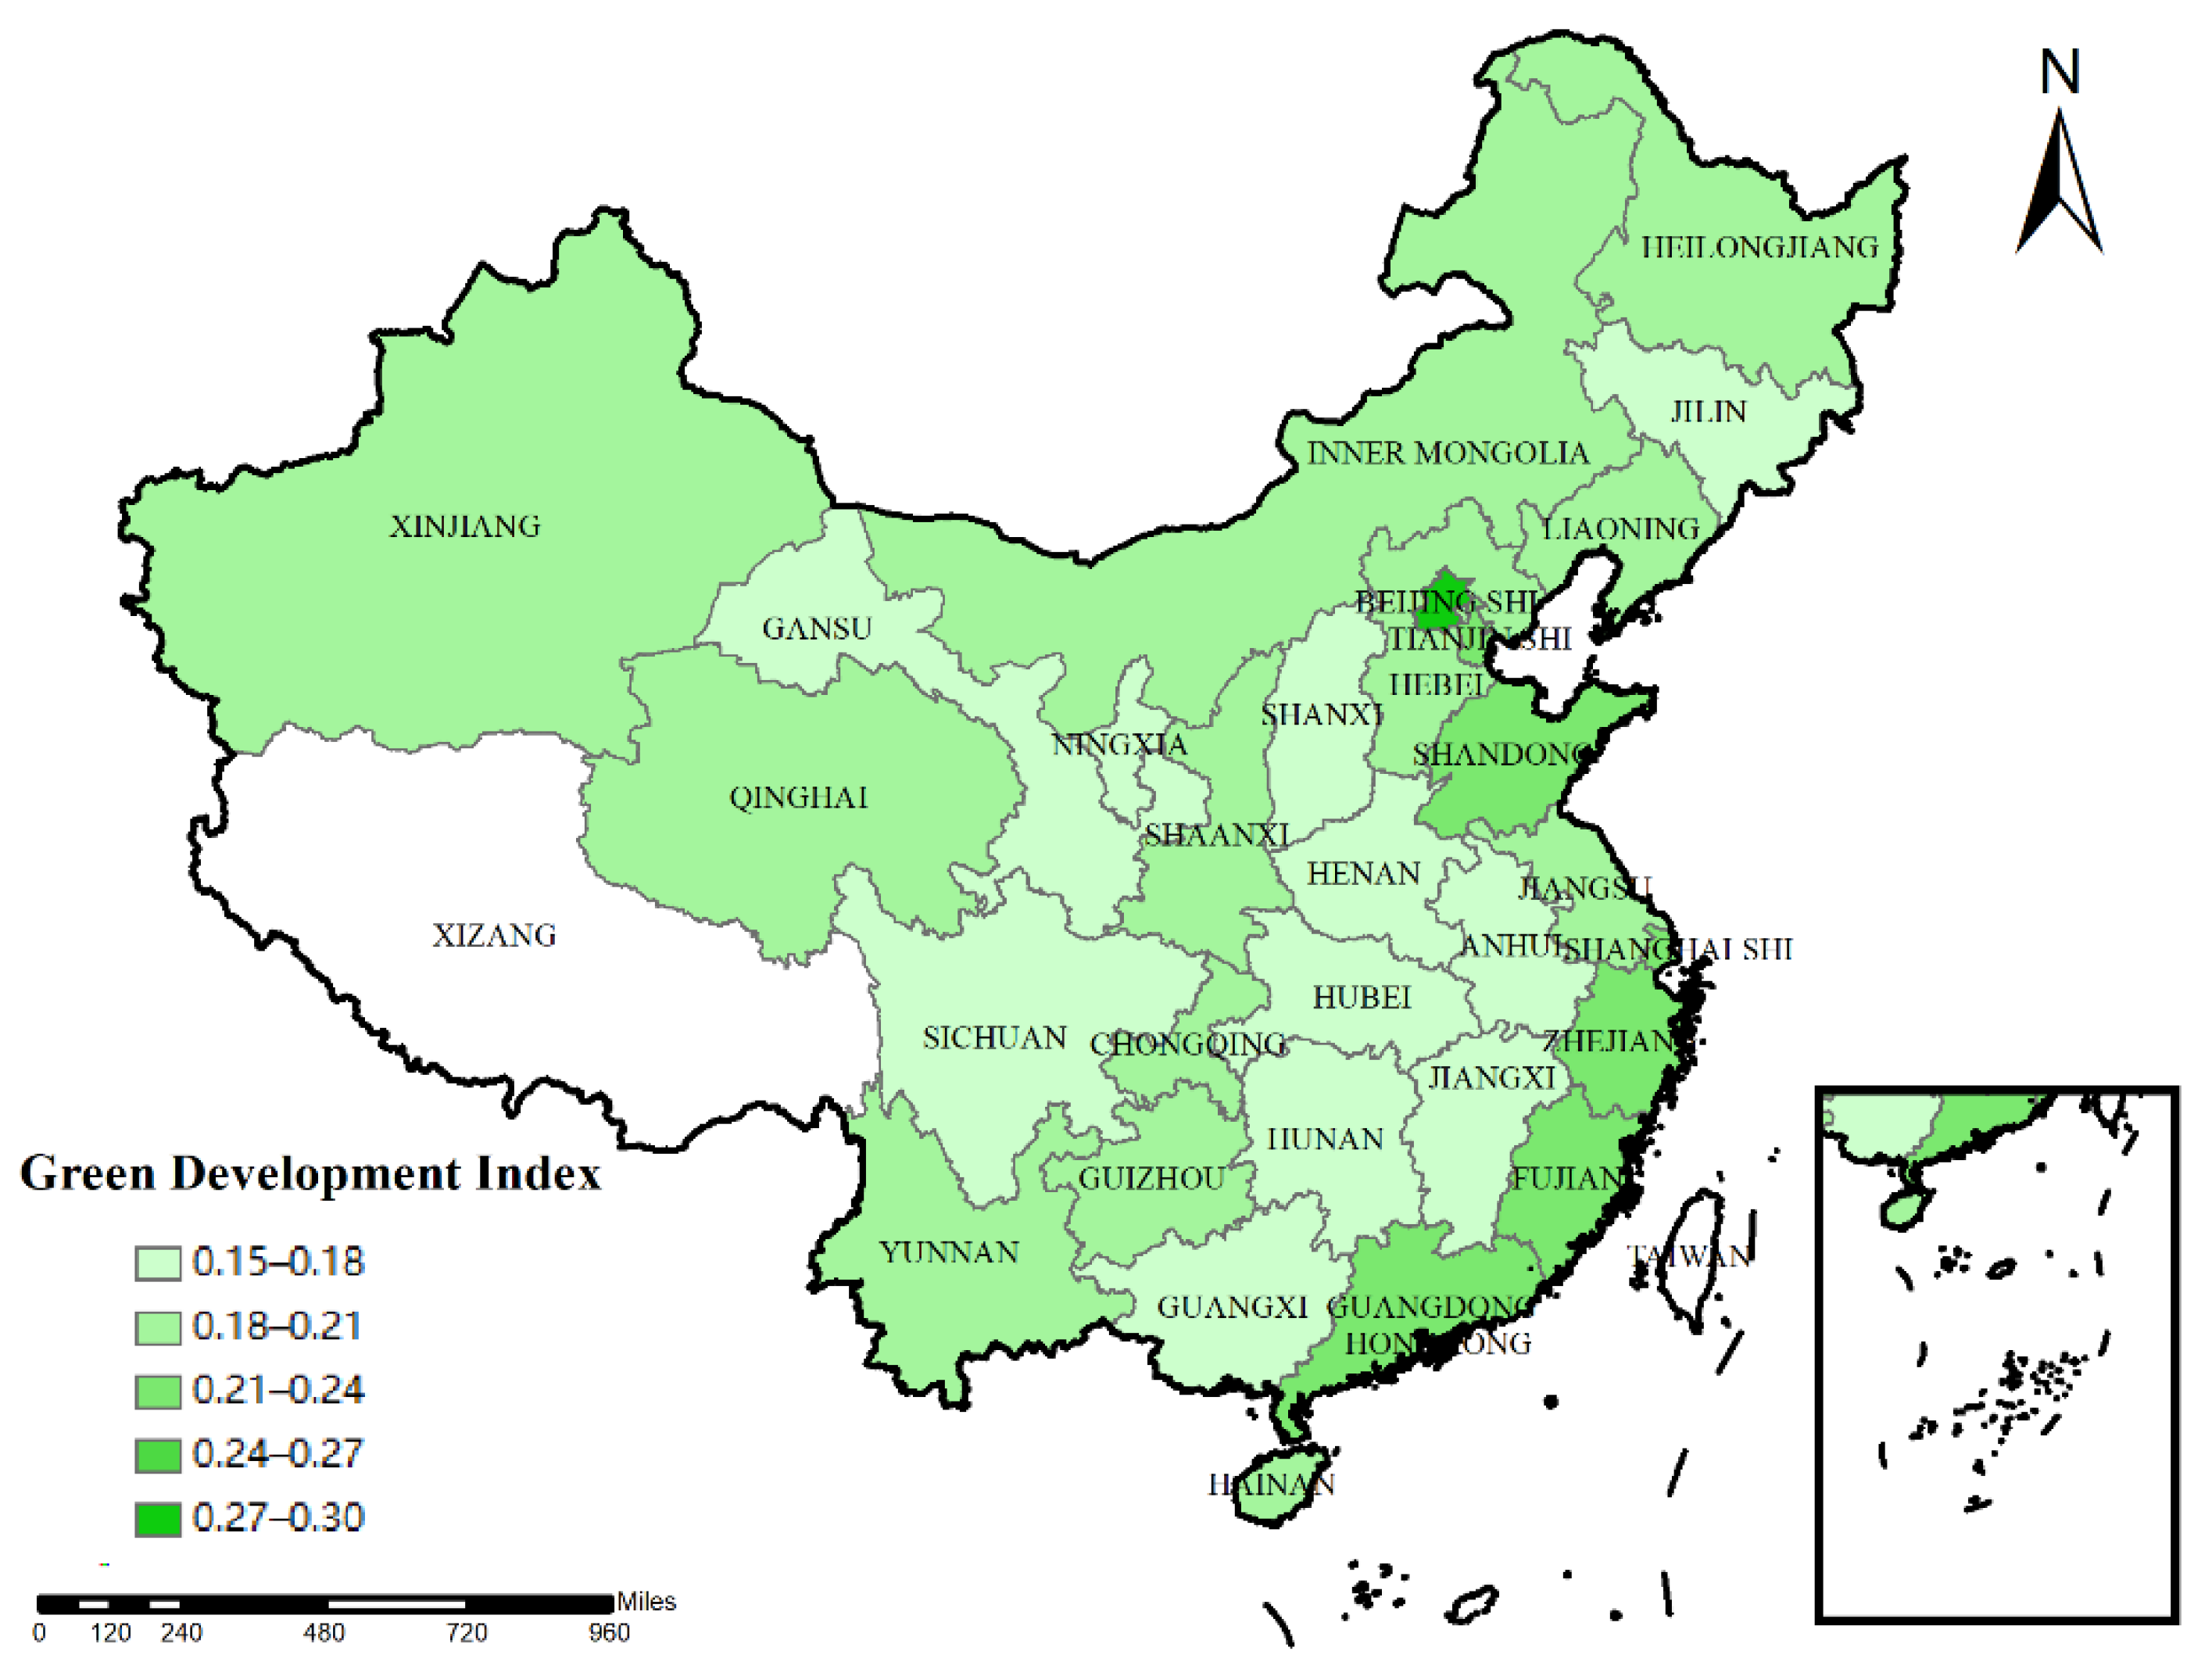
4.4.2. The Heterogeneity of Green Development Level

In this paper, the samples are divided into regions with high green development level and regions with low green development level according to the China Green Development Index Report (CGDIR). As can be seen from Figure 4, there are significant regional differences in the green development index, so it is necessary to analyze the heterogeneous impact of green development level on the relationship between green credit, corporate technological innovation, and financial performance.
The regression results in Table 7 show that after the implementation of the “Green Credit Guidelines” policy, green companies in areas with high green development levels have significantly improved both technological innovation and financial performance, while green companies in areas with low green development levels have not been significantly influenced by the Green Credit Guidelines. Different from Chai et al. (2022) [9]’s research on the policy impact of heavily polluting enterprises, this paper studies green enterprises, so the corresponding conclusions are opposite. The reason is that local governments in areas with a high level of green development have high requirements for environmental regulation, and implement green credit more vigorously. Green enterprises receive more financial support, which makes up for the lack of funds for green technology innovation, thereby improving the financial performance of enterprises.

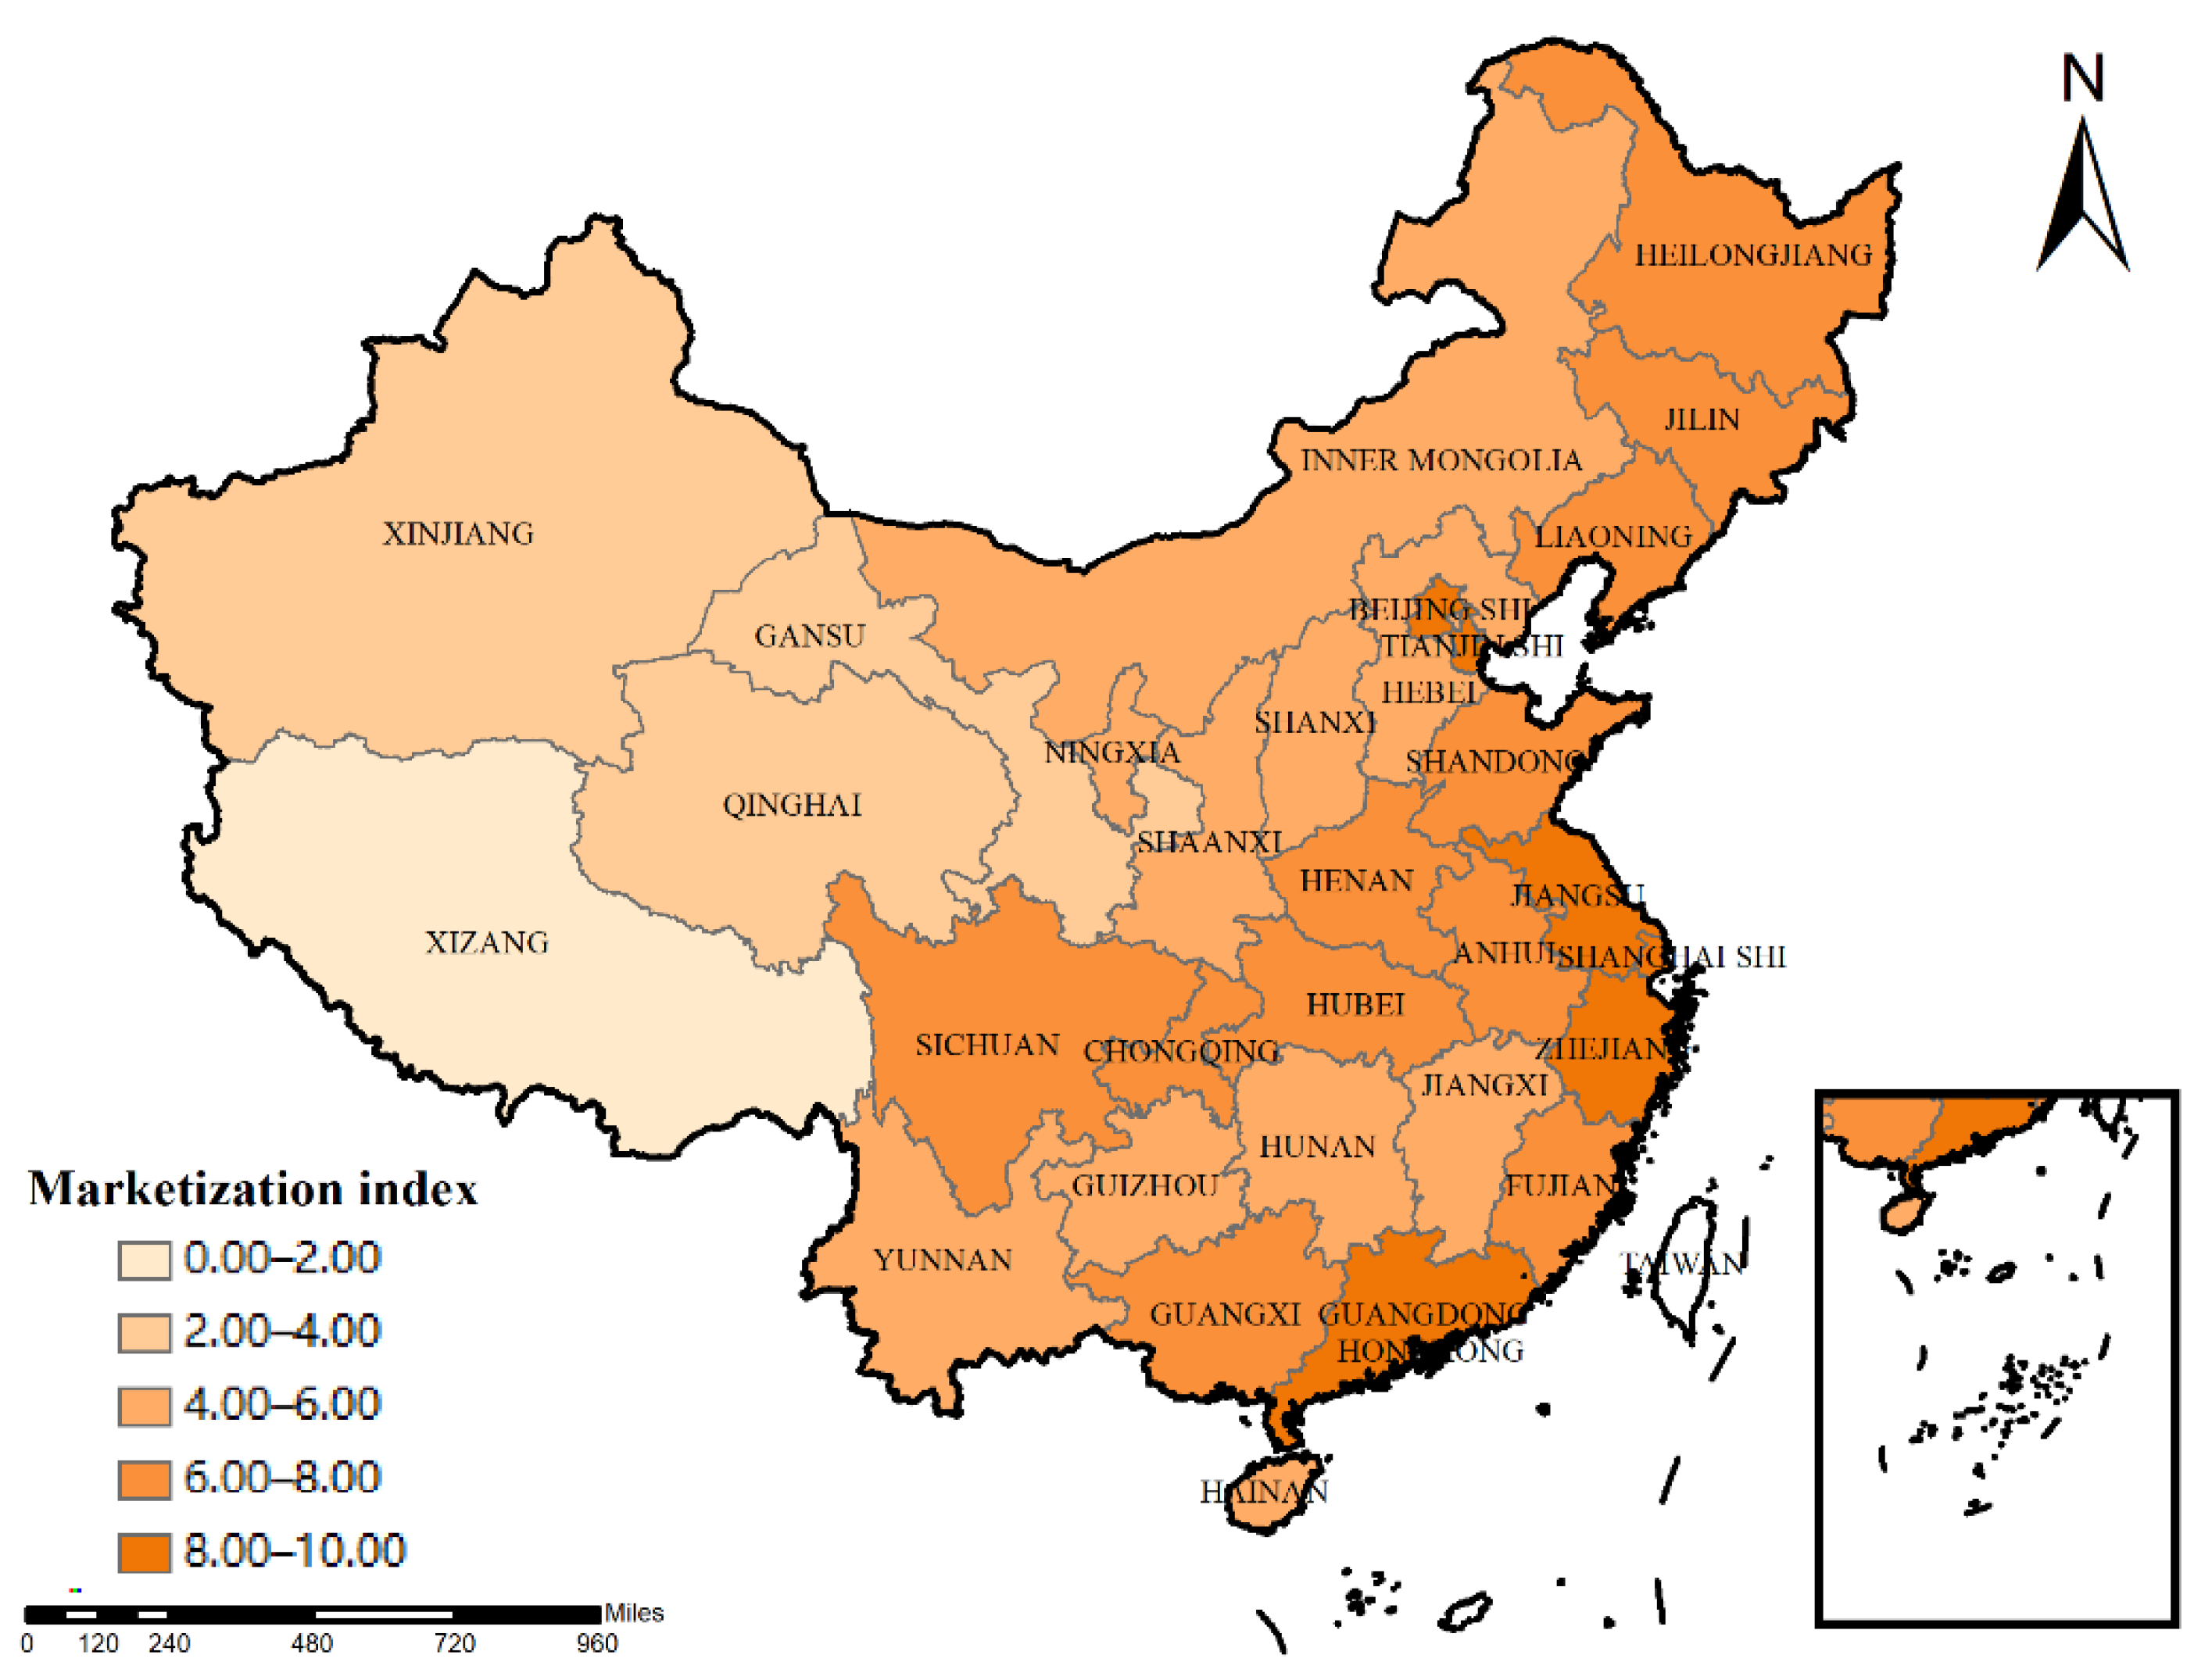
4.4.3. The Heterogeneity of Marketization Level

In this paper, the samples are divided into regions with a high degree of marketization and regions with a low degree of marketization according to the China Marketization Index Database (CMID). As can be seen from Figure 5, there are significant regional differences in the marketization level.
Taking the average value of the marketization index of each province in 2012 as the standard, the sample enterprises are divided into two groups with high and low marketization level for heterogeneity analysis. The regression results are shown in Table 8. The results show that the coefficients of the interaction term are 0.403 and 0.034, both of which are significant at the level of 1%. Consistent with Tan et al. (2022) [37], we find that the policy has a significant promoting effect on the innovation quantity and profitability of green enterprises in areas with a high marketization level. However, the Green Credit Guidelines have no significant effect on the innovations and profitability of green enterprises in areas with low levels of marketization. Tan et al. (2022) [37] pointed out that marketization may have a moderating effect on the relationship between green credit and green innovation. The higher the degree of marketization, the more significant the green innovation of enterprises. Further analyzing the mechanism of this effect, we find that heavily polluting enterprises tend to diversify in regions with a high degree of marketization, and green credit policies are more effective in these regions (Li and Chen, 2022) [45]. Therefore, the effect of green credit policy varies according to the degree of marketization in which enterprises are located.

5. Conclusions

5.1. Theoretical Implications

In the context of China’s increasingly severe sustainable development and green transition, it has important theoretical and practical significance to explore whether and how the promulgation of green financial policies affects the technological innovation capabilities and financial performance of green enterprises. To examine the impact of green credit policies on firms’ technological innovation and financial performance, this paper conducts a quasi-natural experiment on 6345 observations of 422 firms listed on China’s Shanghai and Shenzhen stock exchanges from 2007 to 2021. The theoretical implications are summarized as follows:
(1)
The impact of the Green Credit Guidelines on the technological innovation of green enterprises has been verified using the DID model, which supports the incentive effect proposed by Hypothesis 1. Green credit can adjust the investment and financing activities of enterprises through its role in resource allocation, and this incentive effect can be achieved through two channels. On the one hand, financial institutions restrict the issuance of new loans to high-polluting industries through credit terms, and increase the loan interest rate to enterprises in these industries, thus effectively curbing new investment in high-polluting enterprises and forcing these enterprises to carry out green innovation. On the other hand, financial institutions increase credit support for green companies and green projects, such as clean and environmental protection, promote investment and financing activities in green and clean industries, and guide green industries to attract more production factors for green development.
(2)
The financial performance of green enterprises has been significantly improved after the implementation of the Green Credit Guidelines, which is supportive for Hypothesis 2. Green credit encourages enterprises to increase investment in research and development, significantly alleviates the lack of investment for technological innovation, and forms a positive incentive for innovation activities. Through innovative technologies, companies make up for the additional costs caused by financing constraints, improve production efficiency, enhance corporate competitiveness, and ultimately bring about improved operating conditions and good financial performance. Moreover, the green credit policy guides the flow of funds from polluting industries to green industries by implementing differentiated interest rates for enterprises with different industrial structures. The effect of this policy is to promote the technological innovation of green and environmentally friendly enterprises such as high-tech industries and knowledge service industries, and bring about good financial performance of green enterprises.
(3)
Heterogeneity analysis is carried out from three aspects: the level of digital finance, the level of green development, and the level of marketization. We found that after the implementation of the “Green Credit Guidelines” policy, green companies in areas with high levels of digital finance have significantly improved their technological innovation and financial performance, while green companies in areas with low levels of digital finance have not been significantly affected by green credit policies. These findings support Hypothesis 3(a) but contradict Hypothesis 3(b). Green enterprises in areas with high levels of green development have significantly improved their technological innovation and financial performance. Conversely, green enterprises in areas with low levels of green development were not significantly affected by the policy. These findings are in favor of Hypothesis 4(a), but not in favor of Hypothesis 4(b). Green credit policies can significantly promote the innovation and financial performance of green enterprises in regions with a high degree of marketization, but have no significant impact on green enterprises in regions with a low degree of marketization. This conclusion is supportive for Hypothesis 5(a), but disapproval for Hypothesis 5(b).

5.2. Policy Implications

Based on the above analysis conclusions, we propose the following policy recommendations:
(1)
The government should bear the responsibility of enhancing the environmental protection awareness of all sectors of society, so that the whole society can establish the concept of green development and raise the concept of green development to a strategic level. The government should actively guide financial institutions to integrate the concept of green development into their own culture, system, and operation process, continuously improve the green credit system, and develop green finance in the long term. The government should actively encourage enterprises to carry out green transformation, establish the concept of sustainable development, and infiltrate the concept of green development into the entire production process of enterprises. The government should guide consumers to pay attention to environmental and ecological issues, improve their awareness of environmental protection, build a correct consumption outlook, and integrate green consumption into their consumption habits.
The government should play a supervisory role. On the one hand, the government should pay close attention to the implementation of the green credit policy, conduct timely analysis of the implementation effect of the policy, and provide guidance for the formulation and improvement of subsequent policies. On the other hand, the government should also track the dynamics of various organizations, such as banks and enterprises, and discover timely loopholes and potential improvement space in all aspects of policy implementation through dynamic supervision.
(2)
The relevant mechanism of financial institutions needs to be improved. First, a complete and efficient approval mechanism needs to be improved. According to the environmental performance and risk assessment of the enterprise, the enterprise is classified, and different approval channels are established to improve the efficiency of credit approval. Second, the approval of corporate loan motives needs to be strengthened to ensure the innovation quality of green enterprises from the source, and to realize the rational allocation and utilization of resources. Third, dynamic management of credit funds is implemented, and operational procedures and evaluation indicators are improved. In addition, differentiated management should be formed, and individualized credit management should be implemented for different enterprises and different stages of the same enterprise to improve the degree of adaptation of policies. Fourth, innovation is realized in green financial products, systems, and services. In response to the problems of green enterprises’ asset-light operation and lack of collateral, we have innovated new financing guarantee models such as carbon asset pledge financing and income right pledge loans. Fifth, the use of credit funds is closely monitored, and the withdrawal mechanism of credit funds is improved. When an investment project is found to deviate from the initial goal, it should communicate with the debtor in a timely manner, and give a warning if necessary. If the warning is invalid, the loan can be terminated according to the withdrawal mechanism.
(3)
Enterprises should seize opportunities to achieve high-level development. Enterprises should strengthen green governance, improve managers’ enthusiasm for green decision-making through incentive mechanisms, and promote green transformation of enterprises. In addition, the management has a lot of room to operate on environmental protection-related expenses. The management and control mechanism of the enterprise should be strengthened to prevent the management from misappropriating green credit funds and making inefficient environmental protection investments, so that the green credit funds can be used reasonably and efficiently.
Green enterprises should grasp the preferential policy of green credit and devote themselves to high-level innovation. Green enterprises should actively undertake the responsibility of raising employees’ awareness of environmental protection and establish a green development concept. Green enterprises should actively introduce high-level innovative talents and financial management talents to improve the use efficiency of credit funds. Green enterprises should actively conduct technical exchanges and cooperation with other enterprises to jointly improve the level of green technology. Green enterprises should actively follow up consumer demand and continuously produce green products.

5.3. Ideas for Future Research

As a preliminary study, this paper inevitably has some limitations. This study mainly examines the impact of green credit policies on the technological innovation and financial performance of green enterprises but does not deeply explore the environmental information disclosure that may bring mediating effects in the transmission of green credit mechanisms. In the context of green finance, this means whether environmental information disclosure can improve the effect of green credit policies by increasing bank credit support for enterprises and reducing debt financing costs. This neglected factor may inspire future research. If enterprises do not disclose their environmental information truthfully and accurately, it is difficult for banks to correctly assess the environmental risks of green enterprises or green projects, so it is easy to make adverse choices, which greatly reduces the effect of green credit policies. Therefore, the impact of green credit policies on technological innovation and financial performance requires in-depth research. In future research, considering the quality level of environmental information disclosure by green companies may deepen the understanding of the effects of green finance policy.

Author Contributions

Conceptualization, M.D. and S.C.; methodology, R.Z. and S.C.; software, R.Z.; validation, R.Z., Q.L. and R.S.; formal analysis, M.D.; investigation, R.Z. and W.C.; resources, M.D. and W.C.; data curation, R.Z.; writing—original draft preparation, M.D. and S.C.; writing—review and editing, S.C.; visualization, Q.L. and R.S.; supervision, M.D. and S.C.; project administration, S.C.; funding acquisition, M.D. and S.C. All authors have read and agreed to the published version of the manuscript.

Funding

This research was funded by National Natural Science Foundation of China, grant number 71704098, Key Program of Financial Application of Shandong Province, grant number 2021-JRZZ−25, Key Program of Philosophy and Social Science of Jinan City, grant number JNSK21B18, Statistical Research Project in Shandong Province in 2022, grant number KT069, General Project “Research on green finance boosting the development of clean energy industry in Shandong Province under the dual carbon goal” in the Shandong Youth University of Political Science, and the Academic Innovation Team of Shandong Normal University, “Green development and enterprise performance”.

Institutional Review Board Statement

Not applicable.

Informed Consent Statement

Not applicable.

Data Availability Statement

Not applicable.

Acknowledgments

Special thanks should be given to the editor and reviewers.

Conflicts of Interest

The authors declare no conflict of interest.

Appendix A

Table A1. Pearson Correlation Results between Variables of Model (1).
Variables1234567891011121314
1 P a t i t 1.000
2 P o s t t T r e a t i 0.263 ***1.000
3 P o s t t 0.210 ***0.535 ***1.000
4 T r e a t i 0.177 ***0.690 ***0.0001.000
5 S i z e i t 0.387 ***0.441 ***0.352 ***0.355 ***1.000
6 A g e i t 0.129 ***0.331 ***0.538 ***0.092 ***0.387 ***1.000
7 S a l e i t 0.097 ***−0.096 ***−0.157 ***−0.005−0.009−0.067 ***1.000
8 L i q u i d i t y i t −0.026 **−0.111 ***−0.064 ***−0.132 ***−0.259 ***−0.167 ***−0.120 ***1.000
9 L e v i t −0.0040.005−0.034 ***0.009−0.040 ***0.019−0.027 **−0.094 ***1.000
10 C F i t 0.033 ***−0.016−0.015−0.0180.099 ***−0.040 ***0.0170.007−0.0201.000
11 Q i t −0.071 ***−0.102 ***−0.050 ***−0.099 ***−0.319 ***−0.045 ***−0.0070.118 ***0.359 ***0.036 ***1.000
12 G r o w t h i t −0.023 *−0.010−0.083 ***0.042 ***−0.003−0.066 ***0.073 ***−0.0200.013−0.0140.025 *1.000
13 T a n g i b i l i t y i t −0.185 ***−0.054 ***−0.072 ***−0.028 **0.069 ***−0.0140.006−0.220 ***0.0100.100 ***−0.108 ***−0.062 ***1.000
14 T o p 1 i t −0.050 ***0.013−0.141 ***0.111 ***0.116 ***−0.214 ***0.082 ***−0.0020.039 ***0.067 ***−0.059 ***0.036 ***0.047 ***1.000
Note: *, **, and *** indicate that the estimated coefficients are significant at the levels of 10%, 5%, and 1%, respectively.
Table A2. Pearson Correlation Results between Variables of Model (2).
Variables1234567891011121314
1 P r o f i t i t 1
2 P o s t t T r e a t i 0.01101
3 P o s t t −0.028 **0.535 ***1
4 T r e a t i 0.003000.690 ***01
5 S i z e i t 0.061 ***0.441 ***0.352 ***0.355 ***1
6 A g e i t −0.090 ***0.331 ***0.538 ***0.092 ***0.387 ***1
7 S a l e i t −0.0120−0.096 ***−0.157 ***−0.00500−0.00900−0.067 ***1
8 L i q u i d i t y i t 0.160 ***−0.111 ***−0.064 ***−0.132 ***−0.259 ***−0.167 ***−0.120 ***1
9 L e v i t −0.339 ***0.00500−0.034 ***0.00900−0.040 ***0.0190−0.027 **−0.094 ***1
10 C F i t 0.090 ***−0.0160−0.0150−0.01800.099 ***−0.040 ***0.01700.00700−0.02001
11 Q i t 0.088 ***−0.102 ***−0.050 ***−0.099 ***−0.319 ***−0.045 ***−0.007000.118 ***0.359 ***0.036 ***1
12 G r o w t h i t 0.127 ***−0.0100−0.083 ***0.042 ***−0.00300−0.066 ***0.073 ***−0.02000.0130−0.01400.025 *1
13 T a n g i b i l i t y i t −0.029 **−0.054 ***−0.072 ***−0.028 **0.069 ***−0.01400.00600−0.220 ***0.01000.100 ***−0.108 ***−0.062 ***1
14 T o p 1 i t 0.100 ***0.0130−0.141 ***0.111 ***0.116 ***−0.214 ***0.082 ***−0.002000.039 ***0.067 ***−0.059 ***0.036 ***0.047 ***1
Note: *, **, and *** indicate that the estimated coefficients are significant at the levels of 10%, 5%, and 1%, respectively.

Appendix B

Table A3. Multicollinearity Test Results between Variables of Model (1) and (2).
VariablesVIF1/VIF
Panel A: model (1)
1 P o s t t T r e a t i 4.560.219326
2 P o s t t 2.720.368207
3 T r e a t i 3.520.284166
4 S i z e i t 1.700.588064
5 A g e i t 1.610.622769
6 S a l e i t 1.050.955054
7 L i q u i d i t y i t 1.220.818591
8 L e v i t 1.270.789663
9 C F i t 1.060.946906
10 Q i t 1.450.691883
11 G r o w t h i t 1.020.975746
12 T a n g i b i l i t y i t 1.100.905238
13 T o p 1 i t 1.120.896668
Panel B: model (2)
1 P o s t t T r e a t i 4.560.219317
2 P o s t t 2.750.363422
3 T r e a t i 3.530.282945
4 S i z e i t 1.760.566969
5 A g e i t 1.610.620853
6 S a l e i t 1.050.955222
7 L i q u i d i t y i t 1.600.624740
8 L e v i t 1.680.596258
9 C F i t 1.060.946333
10 Q i t 1.190.839444
11 G r o w t h i t 1.030.975275
12 T a n g i b i l i t y i t 1.110.898220
13 T o p 1 i t 1.120.889633

References

  1. Acemoglu, D.; Akcigit, U.; Hanley, D.; Kerr, W.R. Transition to clean technology. J. Political Econ. 2016, 124, 52–104. [Google Scholar] [CrossRef] [Green Version]
  2. Hong, M.; Li, Z.; Drakeford, B. Do the green credit guidelines affect corporate green technology innovation? Empirical research from China. Int. J. Environ. Res. Public Health 2021, 18, 1682. [Google Scholar] [CrossRef] [PubMed]
  3. Wang, Y.; Li, M. Credit policy and its heterogeneous effects on green innovations. J. Financ. Stab. 2022, 58, 100961. [Google Scholar] [CrossRef]
  4. Andersen, D.C. Do credit constraints favor dirty production? Theory and plant-level evidence. J. Environ. Econ. Manag. 2017, 84, 189–208. [Google Scholar] [CrossRef]
  5. Yu, C.H.; Wu, X.; Zhang, D.; Chen, S.; Zhao, J. Demand for green finance: Resolving financing constraints on green innovation in China. Energy Policy 2021, 153, 112255. [Google Scholar] [CrossRef]
  6. Shi, J.; Yu, C.; Wang, T. Does green financial policy affect debt-financing cost of heavy-polluting enterprises? An empirical evidence based on Chinese pilot zones for green finance reform and innovations. Technol. Forecast. Soc. Chang. 2022, 179, 121678. [Google Scholar] [CrossRef]
  7. Liu, X.; Wang, E.; Cai, D. Green credit policy, property rights and debt financing: Quasi-natural experimental evidence from China. Financ. Res. Lett. 2019, 29, 129–135. [Google Scholar] [CrossRef]
  8. Li, W.; Zheng, M.; Zhang, Y.; Cui, G. Green governance structure, ownership characteristics, and corporate financing constraints. J. Clean. Prod. 2020, 260, 121008. [Google Scholar] [CrossRef]
  9. Chai, S.L.; Zhang, K.; Wei, W.; Ma, W.; Abedin, M.Z. The impact of green credit policy on enterprises’ financing behavior: Evidence from Chinese heavily-polluting listed companies. J. Clean. Prod. 2022, 363, 132458. [Google Scholar] [CrossRef]
  10. Lv, C.; Bian, B.; Lee, C.C.; He, Z. Regional gap and the trend of green finance development in China. Energy Econ. 2021, 102, 105476. [Google Scholar] [CrossRef]
  11. Hu, G.; Wang, X.; Wang, Y. Can the green credit policy stimulate green innovation in heavily polluting enterprises? Evidence from a quasi-natural experiment in China. Energy Econ. 2021, 98, 105134. [Google Scholar] [CrossRef]
  12. Lee, C.C.; Lee, C.C. How does green finance affect green total factor productivity? Evidence from China. Energy Econ. 2022, 107, 105863. [Google Scholar] [CrossRef]
  13. Ngo, Q.T.; Tran, H.A.; Tran, H.T.T. The impact of green finance and Covid-19 on economic development: Capital formation and educational expenditure of ASEAN economies. China Financ. Rev. Int. 2022, 12, 261–279. [Google Scholar] [CrossRef]
  14. Liu, C.; Xiong, M. Green finance reform and corporate innovation: Evidence from China. Financ. Res. Lett. 2022, 48, 102993. [Google Scholar] [CrossRef]
  15. Xu, X.; Li, J. Asymmetric impacts of the policy and development of green credit on the debt financing cost and maturity of different types of enterprises in China. J. Clean. Prod. 2020, 264, 121574. [Google Scholar] [CrossRef]
  16. Wen, H.; Lee, C.C.; Zhou, F. Green credit policy, credit allocation efficiency, and upgrade of energy-intensive enterprises. Energy Econ. 2021, 94, 105099. [Google Scholar] [CrossRef]
  17. Zhang, K.; Li, Y.; Qi, Y.; Shao, S. Can green credit policy improve environmental quality? Evidence from China. J. Environ. Manag. 2021, 298, 113445. [Google Scholar] [CrossRef]
  18. Huang, Y.; Chen, C.; Lei, L.; Zhang, Y. Impacts of green finance on green innovation: A spatial and nonlinear perspective. J. Clean. Prod. 2022, 365, 132548. [Google Scholar] [CrossRef]
  19. Tian, C.; Li, X.; Xiao, L.; Zhu, B. Exploring the impact of green credit policy on green transformation of heavy polluting industries. J. Clean. Prod. 2022, 335, 130257. [Google Scholar] [CrossRef]
  20. Kang, H.; Jung, S.; Lee, H. The impact of Green Credit Policy on manufacturers’ efforts to reduce suppliers’ pollution. J. Clean. Prod. 2020, 248, 119271. [Google Scholar] [CrossRef]
  21. Zhang, S.; Wu, Z.; Wang, Y.; Hao, Y. Fostering green development with green finance: An empirical study on the environmental effect of green credit policy in China. J. Environ. Manag. 2021, 296, 113159. [Google Scholar] [CrossRef] [PubMed]
  22. Nenavath, S. Impact of fintech and green finance on environmental quality protection in India: By applying the semi-parametric difference-in-differences (SDID). Renew. Energy 2022, 193, 913–919. [Google Scholar] [CrossRef]
  23. Wu, S.; Wu, L.; Zhao, X. Impact of the green credit policy on external financing, economic growth and energy consumption of the manufacturing industry. Chin. J. Popul. Resour. Environ. 2022, 20, 59–68. [Google Scholar] [CrossRef]
  24. Chang, K.; Zeng, Y.; Wang, H.; Wu, X. The effects of credit policy and financial constraints on tangible and research development investment: Firm-level evidence from China’s renewable energy industry. Energy Policy 2019, 130, 438–447. [Google Scholar] [CrossRef]
  25. Chen, Z.; Zhang, Y.; Wang, H.; Ouyang, X.; Xie, Y. Can green credit policy promote low-carbon technology innovation? J. Clean. Prod. 2022, 359, 132061. [Google Scholar] [CrossRef]
  26. Zhang, D.; Kong, Q. Credit policy, uncertainty, and firm R&D investment: A quasi-natural experiment based on the Green Credit Guidelines. Pac.-Basin Financ. J. 2022, 73, 101751. [Google Scholar]
  27. Yao, S.; Pan, Y.; Sensoy, A.; Uddin, G.S.; Cheng, F. Green credit policy and firm performance: What we learn from China. Energy Econ. 2021, 101, 105415. [Google Scholar] [CrossRef]
  28. Richardson, S. Over-investment of free cash flow. Rev. Account. Stud. 2006, 11, 159–189. [Google Scholar] [CrossRef]
  29. Atanassov, J. Arm’s Length Financing and Innovation: Evidence from Publicly Traded Firms. Manag. Sci. 2016, 62, 128–155. [Google Scholar] [CrossRef]
  30. Chiu, Y.B.; Lee, C.C. Effects of financial development on energy consumption: The role of country risks. Energy Econ. 2020, 90, 104833. [Google Scholar] [CrossRef]
  31. Demertzis, M.; Merler, S.; Wolff, G.B. Capital Markets Union and the Fintech Opportunity. J. Financ. Regul. 2018, 4, 157–165. [Google Scholar] [CrossRef]
  32. Chen, S.Q.; Zhang, H. Does digital finance promote manufacturing servitization: Micro evidence from China. Int. Rev. Econ. Financ. 2021, 76, 856–869. [Google Scholar] [CrossRef]
  33. Tang, X.; Ding, S.; Gao, X.; Zhao, T. Can digital finance help increase the value of strategic emerging enterprises? Sustain. Cities Soc. 2022, 81, 103829. [Google Scholar] [CrossRef]
  34. Macchiavello, E.; Siri, M. Sustainable Finance and Fintech: Can Technology Contribute to Achieving Environmental Goals? A Preliminary Assessment of ‘Green Fintech’ and ‘Sustainable Digital Finance’. Eur. Co. Financ. Law Rev. 2022, 19, 128–174. [Google Scholar] [CrossRef]
  35. Zhang, M.; Liu, Y. Influence of digital finance and green technology innovation on China’s carbon emission efficiency: Empirical analysis based on spatial metrology. Sci. Total Environ. 2022, 838, 156463. [Google Scholar] [CrossRef]
  36. Kong, Q.X.; Li, R.R.; Peng, D.; Wong, Z. High-technology development zones and innovation in knowledge-intensive service firms: Evidence from Chinese a-share listed firms. Int. Rev. Financ. Anal. 2021, 78, 101883. [Google Scholar] [CrossRef]
  37. Tan, X.; Yan, Y.; Dong, Y. Peer effect in green credit induced green innovation: An empirical study from China’s Green Credit Guidelines. Resour. Policy 2022, 76, 102619. [Google Scholar] [CrossRef]
  38. Zhou, G.; Liu, C.; Luo, S. Resource Allocation Effect of Green Credit Policy: Based on DID Model. Mathematics 2021, 9, 159. [Google Scholar] [CrossRef]
  39. Jacobson, L.S.; LaLonde, R.J.; Sullivan, D.G. Earnings losses of displaced workers. Am. Econ. Rev. 1993, 83, 685–709. [Google Scholar]
  40. Bertrand, M.; Duflo, E.; Mullainathan, S. How much should we trust differences-in-differences estimates? Q. J. Econ. 2004, 119, 249–275. [Google Scholar] [CrossRef] [Green Version]
  41. Wang, X.; Liu, S.; Tao, Z.; Cao, Q. The impact of industrial policy and its combinations on the innovation quality of wind power enterprises: A study from the perspective of financing modes. Renew. Energy 2022, 188, 945–956. [Google Scholar] [CrossRef]
  42. Cao, S.; Nie, L.; Sun, H.; Sun, W.; Taghizadeh-Hesary, F. Digital finance, green technological innovation and energy-environmental performance: Evidence from China’s regional economies. J. Clean. Prod. 2021, 327, 129458. [Google Scholar] [CrossRef]
  43. Feng, S.; Zhang, R.; Li, G. Environmental decentralization, digital finance and green technology innovation. Struct. Chang. Econ. Dyn. 2022, 61, 70–83. [Google Scholar] [CrossRef]
  44. Wu, Y.; Huang, S. The effects of digital finance and financial constraint on financial performance: Firm-level evidence from China’s new energy enterprises. Energy Econ. 2022, 112, 106158. [Google Scholar] [CrossRef]
  45. Li, R.; Chen, Y. The influence of a green credit policy on the transformation and upgrading of heavily polluting enterprises: A diversification perspective. Econ. Anal. Policy 2022, 74, 539–552. [Google Scholar] [CrossRef]
Figure 1. Parallel trend test results for technological innovation.
Sustainability 14 09287 g001
Figure 2. Parallel trend test results for financial performance.
Sustainability 14 09287 g002
Figure 3. Regional differences of digital financial index.
Sustainability 14 09287 g003
Figure 4. Regional differences of green development index.
Sustainability 14 09287 g004
Figure 5. Regional differences of marketization index.
Sustainability 14 09287 g005
Table 1. Definition and description of variables.
CategoryVariable NamesVariable Definitions
Explained variable Technological   innovation   ( P a t i t )The natural logarithm of (total number of patent applications for the year + 1)
Financial   performance   ( P r o f i t i t )Total operating profit divided by operating income
Explanatory variable P o s t t T r e a t i The multiplication term of policy and enterprise
P o s t t Post = 1 (after 2012), otherwise Post = 0
T r e a t i Treat = 1 (green enterprise), otherwise Treat = 0
Control variable Enterprise   scale   ( S i z e i t )Natural logarithm of total assets
Operating   years   ( A g e i t )Natural logarithm of years since business started
Asset   turnover   ratio   ( S a l e i t )The total operating income of the enterprise for the year divided by the average total assets
Current   ratio   ( L i q u i d i t y i t )Current assets divided by current liabilities
Debt   ratio   ( L e v i t )Total liabilities divided by total assets
Net   cash   flow   from   operating   activities   ( C F i t )Natural logarithm of net cash flow from operating activities
Tobin s   Q   value   ( Q i t )Market capitalization divided by (total assets—net intangible assets—net goodwill)
Growth   rate   of   operating   income   G r o w t h i t (Operating income in period t minus operating income in period t − 1) divided by operating income in period t − 1
Asset   structure   ( T a n g i b i l i t y i t )Net fixed assets divided by total asset balance
The   largest   shareholder s   shareholding   ratio   ( T o p 1 i t ) Shareholding ratio of the largest shareholder
Table 2. Descriptive statistical results.
VariableMeanStd. Dev.MinimumMaximum
P a t i t 2.4701.7970.0009.572
P r o f i t i t 0.0770.220−6.2821.738
S i z e i t 22.3301.46016.16028.270
A g e i t 2.6990.512−2.4853.718
S a l e i t 0.6810.4280.0015.837
L i q u i d i t y i t 2.0332.133−5.13248.470
L e v i t 0.4991.590−0.19596.960
C F i t 0.0530.209−11.0600.558
Q i t 2.1831.7640.71569.240
G r o w t h i t 0.1930.542−0.95716.340
T a n g i b i l i t y i t 0.2350.1570.0000.954
T o p 1 i t 34.58014.9503.62095.100
Table 3. The DID regression results.
Variables(1)(2)(3)(4)
P a t i t P r o f i t i t P a t i t P r o f i t i t
P o s t t T r e a t i 0.439 ***0.043 **0.364 ***0.021 *
(4.62)(2.13)(3.69)(1.96)
S i z e i t 0.240 ***0.064 ***
(3.48)(3.69)
A g e i t −0.240−0.049 **
(−1.02)(−2.28)
S a l e i t 0.0790.039 **
(0.70)(2.01)
L i q u i d i t y i t 0.006−0.002
(0.54)(−0.44)
L e v i t 0.010−0.524 ***
(1.12)(−3.54)
C F i t −0.0810.019
(−1.08)(0.60)
Q i t −0.0130.016 ***
(−0.64)(4.81)
G r o w t h i t −0.049 *0.050 ***
(−1.66)(6.32)
T a n g i b i l i t y i t −0.191−0.063
(−0.61)(−0.94)
T o p 1 i t −0.0050.001 ***
(−1.43)(2.70)
Constant1.459 ***0.115 ***−2.830 *−1.028 ***
(26.62)(20.34)(−1.92)(−3.20)
Firm-FEYESYESYESYES
Year-FEYESYESYESYES
Observations6345629658935886
F27.995.82127.9513.08
R-squared0.2040.0090.1910.196
Note: *, **, and *** indicate that the estimated coefficients are significant at the levels of 10%, 5%, and 1%, respectively. Numbers in parentheses are t-statistics. The results of columns (1) and (2) refer to DID regression equations that do not consider control variables. The results of columns (3) and (4) refer to DID regression equations that take into account the control variables.
Table 4. The robustness test results of changing the sample.
Variables(1)(2)
P a t i t P r o f i t i t
P o s t t T r e a t i 0.360 ***0.020 *
(3.82)(1.89)
S i z e i t 0.220 ***0.064 ***
(3.00)(3.47)
A g e i t −0.099−0.067 ***
(−0.44)(−2.86)
S a l e i t 0.0300.036 *
(0.27)(1.86)
L i q u i d i t y i t 0.008−0.002
(0.91)(−0.56)
L e v i t 0.019 **−0.501 ***
(2.00)(−3.17)
C F i t −0.109 *−0.001
(−1.82)(−0.03)
Q i t −0.0290.014 ***
(−1.37)(3.59)
G r o w t h i t −0.047 *0.046 ***
(−1.70)(5.24)
T a n g i b i l i t y i t −0.150−0.048
(−0.52)(−0.66)
T o p 1 i t −0.007 *0.001 **
(−1.92)(1.98)
Constant−2.591 *−0.986 ***
(−1.69)(−2.85)
Firm-FEYESYES
Year-FEYESYES
Observations50515045
F28.3911.51
R-squared0.2060.187
Note: *, **, and *** indicate that the estimated coefficients are significant at the levels of 10%, 5%, and 1%, respectively. Numbers in parentheses are t-statistics.
Table 5. The robustness test results of alternative proxies for financial performance.
Variables(1)(2)
R & D i t R O A i t
P o s t t T r e a t i 0.647 *0.011 *
(1.94)(1.91)
S i z e i t −0.1420.005
(−0.66)(1.06)
A g e i t −0.679−0.015
(−0.94)(−1.07)
S a l e i t −1.418 ***0.052 ***
(−4.87)(3.95)
L i q u i d i t y i t −0.100 **0.002 **
(−2.06)(2.44)
L e v i t −1.028−0.035 ***
(−1.03)(−27.76)
C F i t −1.756 **−0.541 ***
(−2.09)(−4.77)
Q i t −0.143 ***0.009 ***
(−2.59)(3.74)
G r o w t h i t −0.337 ***0.018 ***
(−3.41)(4.31)
T a n g i b i l i t y i t −0.457−0.059 **
(−0.33)(−2.33)
T o p 1 i t −0.0080.001 ***
(−0.82)(2.86)
Constant8.048 **−0.063
(2.13)(−0.61)
Firm-FEYESYES
Year-FEYESYES
Observations46695893
F13.55174.0
R-squared0.1780.654
Note: *, **, and *** indicate that the estimated coefficients are significant at the levels of 10%, 5%, and 1%, respectively. Numbers in parentheses are t-statistics.
Table 6. The heterogeneity results of digital financial level.
HeterogeneityHigh Degree of Digital Financial IndexLow Degree of Digital Financial Index
Variables(1)(2)(3)(4)
P a t i t P r o f i t i t P a t i t P r o f i t i t
P o s t t T r e a t i 0.392 ***0.033 **0.261−0.004
(3.63)(2.57)(1.21)(−0.24)
S i z e i t 0.224 ***0.074 ***0.274 **0.033 ***
(2.81)(3.46)(2.14)(3.61)
A g e i t −0.100−0.041 *−0.906−0.096
(−0.39)(−1.77)(−1.53)(−1.54)
S a l e i t 0.0490.0380.1680.034
(0.32)(1.56)(1.23)(1.23)
L i q u i d i t y i t 0.009−0.005−0.0250.008 *
(0.79)(−1.11)(−0.82)(1.75)
L e v i t −0.081−0.610 ***0.011−0.287 ***
(−0.52)(−3.49)(0.67)(−3.19)
C F i t −0.0470.013−0.6500.348 ***
(−0.56)(0.97)(−1.53)(3.73)
Q i t −0.0120.017 ***−0.0080.009 ***
(−0.48)(4.95)(−0.25)(2.74)
G r o w t h i t −0.0430.045 ***−0.081 *0.058 ***
(−1.10)(5.64)(−1.71)(3.50)
T a n g i b i l i t y i t −0.116−0.130 *−0.3660.070
(−0.28)(−1.77)(−0.82)(0.55)
T o p 1 i t −0.008 *0.001 **0.0010.001
(−1.91)(2.36)(0.09)(1.54)
Constant−2.538−1.210 ***−2.541−0.431 **
(−1.52)(−2.99)(−0.85)(−2.21)
Firm-FEYESYESYESYES
Year-FEYESYESYESYES
Observations4284428116091605
F11.4311.5676.0210.97
R-squared0.1810.2440.2260.139
Note: *, **, and *** indicate that the estimated coefficients are significant at the levels of 10%, 5%, and 1%, respectively. Numbers in parentheses are t-statistics.
Table 7. The heterogeneity results of green development level.
HeterogeneityHigh Degree of Green Development IndexLow Degree of Green Development Index
Variables(1)(2)(3)(4)
P a t i t P r o f i t i t P a t i t P r o f i t i t
P o s t t T r e a t i 0.517 ***0.024 *0.1290.008
(4.76)(1.86)(0.72)(0.50)
S i z e i t 0.207 **0.076 ***0.306 ***0.039 ***
(2.57)(3.18)(2.68)(4.38)
A g e i t −0.042−0.051 **−0.829−0.023
(−0.16)(−2.25)(−1.51)(−0.50)
S a l e i t 0.0740.055 **0.0910.008
(0.53)(2.30)(0.53)(0.31)
L i q u i d i t y i t 0.005−0.002−0.0060.002
(0.37)(−0.59)(−0.25)(0.69)
L e v i t −0.199−0.542 ***0.007−0.442 ***
(−1.41)(−2.95)(0.44)(−6.34)
C F i t −0.0020.003−0.744 *0.392 ***
(−0.03)(0.22)(−1.69)(4.38)
Q i t −0.0220.019 ***0.0090.009 ***
(−0.93)(3.87)(0.29)(2.88)
G r o w t h i t −0.0370.049 ***−0.081 *0.051 ***
(−0.84)(5.61)(−1.83)(3.57)
T a n g i b i l i t y i t 0.258−0.142−0.7060.013
(0.76)(−1.64)(−1.32)(0.13)
T o p 1 i t −0.008 **0.001 **−0.0020.001 *
(−2.11)(2.29)(−0.24)(1.71)
Constant−2.222−1.265 ***−3.226−0.618 ***
(−1.27)(−2.80)(−1.31)(−3.39)
Firm-FEYESYESYESYES
Year-FEYESYESYESYES
Observations3934393119591955
F11.649.717115.414.03
R-squared0.1900.2360.2100.149
Note: *, **, and *** indicate that the estimated coefficients are significant at the levels of 10%, 5%, and 1%, respectively. Numbers in parentheses are t-statistics.
Table 8. The heterogeneity results of marketization level.
HeterogeneityHigh Degree of MarketizationLow Degree of Marketization
Variables(1)(2)(3)(4)
P a t i t P r o f i t i t P a t i t P r o f i t i t
P o s t t T r e a t i 0.403 ***0.034 ***0.122−0.034
(3.89)(2.74)(0.44)(−1.48)
S i z e i t 0.215 ***0.071 ***0.371 *0.012
(3.04)(3.84)(1.96)(0.96)
A g e i t −0.164−0.046 **−0.939−0.051
(−0.66)(−2.04)(−1.18)(−0.89)
S a l e i t 0.0420.042 *0.3100.032
(0.33)(1.87)(1.25)(1.44)
L i q u i d i t y i t 0.010−0.004−0.0510.011 *
(0.94)(−1.05)(−1.30)(1.73)
L e v i t 0.007−0.602 ***−0.163−0.236 ***
(0.70)(−3.75)(−0.50)(−3.39)
C F i t −0.0760.022−0.4430.280 ***
(−0.98)(1.01)(−0.92)(3.99)
Q i t −0.0090.015 ***−0.0180.009 *
(−0.41)(4.92)(−0.44)(1.81)
G r o w t h i t −0.0470.047 ***−0.0650.055 ***
(−1.40)(5.84)(−0.95)(3.58)
T a n g i b i l i t y i t −0.154−0.053−0.255−0.156 ***
(−0.44)(−0.71)(−0.42)(−2.74)
T o p 1 i t −0.0060.001 ***−0.0010.000
(−1.43)(2.75)(−0.06)(0.16)
Constant−2.372−1.151 ***−4.487−0.017
(−1.57)(−3.37)(−0.98)(−0.05)
Firm-FEYESYESYESYES
Year-FEYESYESYESYES
Observations49604953933933
F32.1710.604.13317.00
R-squared0.1880.2040.2200.310
Note: *, **, and *** indicate that the estimated coefficients are significant at the levels of 10%, 5%, and 1%, respectively. Numbers in parentheses are t-statistics.
Publisher’s Note: MDPI stays neutral with regard to jurisdictional claims in published maps and institutional affiliations.

