Article

Water Environment Quality Evaluation and Pollutant Source Analysis in Tuojiang River Basin, China

1
School of Chemistry and Environment, China University of Mining and Technology (Beijing), Beijing 100083, China
2
Xinjiang Energy Co., Ltd. of State Energy Group, Wulumuqi 830000, China
*
Author to whom correspondence should be addressed.
Sustainability 2022, 14(15), 9219; https://doi.org/10.3390/su14159219
Submission received: 1 July 2022 / Revised: 22 July 2022 / Accepted: 25 July 2022 / Published: 27 July 2022
(This article belongs to the Special Issue Environmental Interface Chemistry and Pollution Control)

Abstract

:
A water environment quality evaluation and pollution source analysis can quantitatively examine the relationship among water pollution, resources, and the economy, and investigate the main factors affecting water quality. This paper took COD, NH3-N, and TP of the Tuojiang River as the research objects. The water environment quality evaluation and pollution source analysis of the Tuojiang River Basin were conducted based on the grey water footprint, decoupling theoretical model, and correlation analysis method. The results showed that grey water footprint decreased, and the water environment quality improved. Among the pollution sources of the grey water footprint, TP accounted for the highest proportion. Moreover, the economic development level and the water environment were generally in a state of high-quality coordination. Farmland and stock breeding pollution accounted for the largest proportion of agricultural pollution and were thus the main source of the grey water footprint. The results of Pearson’s correlation analysis indicated that the source of the pollutants were the imported pollution from the tributaries and agricultural pollution (especially stock breeding and farmland irrigation). These results showed that the quality of the water environment was improving, and the main factors affecting the water environment were stock breeding and farmland pollution in agriculture. This study presents a decision-making basis for strengthening the ecological barrier in the Yangtze River.

Graphical Abstract

1. Introduction

Given that the Yangtze River is the largest river in China, the construction and development of the Yangtze River Basin plays an important role in the national sustainable development strategy [1,2]. Most areas of the Yangtze River discharge giant amounts of sewage, and environmental issues are becoming additionally apparent, particularly pollution and the deterioration of water quality [3]. As an important first-order tributary on the right bank of the upper reaches of the Yangtze River, the Tuojiang River is a vital ecological barrier in the upper reaches of the Yangtze River Basin and plays a highly critical role in maintaining the ecological security of the Yangtze River Economic Belt [4,5,6]. Therefore, the evaluation of the water environment quality and analysis of the pollution sources of cities along the Tuojiang River Basin are imperative, and timely and targeted measures ought to be taken for prevention. Such studies can provide a decision-making basis for strengthening the ecological barrier in the upper reaches of the Yangtze River.
Traditional water environment quality evaluation methods mainly include the pollution index evaluation method [7], single factor evaluation method [8], and artificial neural network analysis method [9,10]. However, these approaches mainly evaluate the pollution degree of polluted water bodies, and studies on the relationship between the quantity and quality of water resources are few. In recent years, a comprehensive analysis of water resources that mixes water quality and quantity has emerged. Tharme [11] used the science of environmental flow assessment to determine the quantity and quality of water needed for ecosystem conservation and resource conservation. Xia et al. [12] established a comprehensive evaluation method for water quantity and quality in a basin and proposed the integration concept of water resource functional capacity and water resource functional deficit. Wang et al. [13] took the Liaohe River as an example to establish a comprehensive evaluation method for ecological water demand that considers the natural and social water cycles, as well as the river water quantity and quality. However, the above methods still fail to quantitatively explain the effect of water pollution on the quantity of water resources. The concept of grey water footprint (GWF) provides a new idea for the quantitative evaluation of the relationship between water quantity and quality, and grey water footprint was used to measure water pollution levels [14]. Grey water footprint was defined as the amount of freshwater necessary for the pollutant load to be assimilated to reach the level of existing water quality standards [15,16]. Grey water footprint has been used to assess the influences of global human economic activities on water use and has been widely developed to assess water pollution levels in many fields, such as agricultural grey water footprint (GWFAgr) [16,17,18,19,20], industrial grey water footprint (GWFInd) [21,22,23], and domestic grey water footprint (GWFDom) [24]. Previous research directions have focused on the grey water footprint of specific pollutants (e.g., nitrogen-related or phosphorus-related grey water footprint) for developing control strategies [25,26,27,28,29]. Only a few studies have considered multiple pollutants to show the overall picture of pollution [30]. Previous analyses of the grey water footprint for multiple pollutants have focused on pollution levels, whereas studies on the dynamic changes of major water pollutants that lead to water pollution are rare [31]. In this paper, the grey water footprint of various pollutants in the Tuojiang River Basin (Neijiang City (NJC) section) was studied, and the sources of grey water footprint in agriculture, industry, and domestic areas were analyzed. The dynamic changes of the grey water footprint of various pollutants and their sources were also investigated. Some studies have introduced decoupling theoretical models based on investigating the grey water footprint to reveal the decoupling relationship between economic development and the water environment [32]. These studies have comprehensively evaluated the quality of the water environment. The present work studied the grey water footprint of various pollutants in the Tuojiang River Basin (NJC section) and analyzed the sources of grey water footprint in agricultural, industrial, and domestic areas. In addition, the dynamic changes of the grey water footprint of multiple pollutants and their sources were studied, and the water environment quality was comprehensively evaluated by combining grey water footprint and decoupling theory.
Identifying pollution sources and determining their contribution are the basis for the effective prevention of pollution [33,34,35]. Grey water footprint can show the overall level of water pollution but cannot trace the specific source of pollutants in the river. Many scholars have investigated the sources of pollutants using the correlation analysis method for qualitative source analysis [36,37,38]. For example, a correlation analysis in the Yangtze River Basin showed that the concentration of antibiotics in surface water and sediment is strongly correlated with total nitrogen and total phosphorus, which may have come from household and agricultural waste [39]. Zhang et al. [40] used a correlation analysis method to prove that the pollution sources of sulfate and fluoride in groundwater in a certain area in southwest China are highly similar and are greatly affected by the discharge of industrial parks. The source apportionment of pollutants was performed based on the correlation degree of the main pollutants in each section and the correlation degree of the main pollutants in the river with indicators of agriculture, forestry, animal husbandry, fishery, industry, and population economy.
This paper further evaluated the water environment quality and analyzed the pollution sources based on the grey water footprint, decoupling theoretical model, and correlation analysis method of the Tuojiang River. It also determined the status of the water environment quality and the main factors affecting the water environment. In addition, it provided a clear direction for reducing the grey water footprint and improving water quality. The main objectives of this study are to: (i) analyze the overall change in water environment quality and its decoupling from economic development, (ii) examine the main pollutants that affect the quality of the water environment, (iii) investigate the specific sources of water environmental quality, and (iv) provide recommendations for reducing the grey water footprint and improving the water quality of the Tuojiang River.

2. Materials and Methods

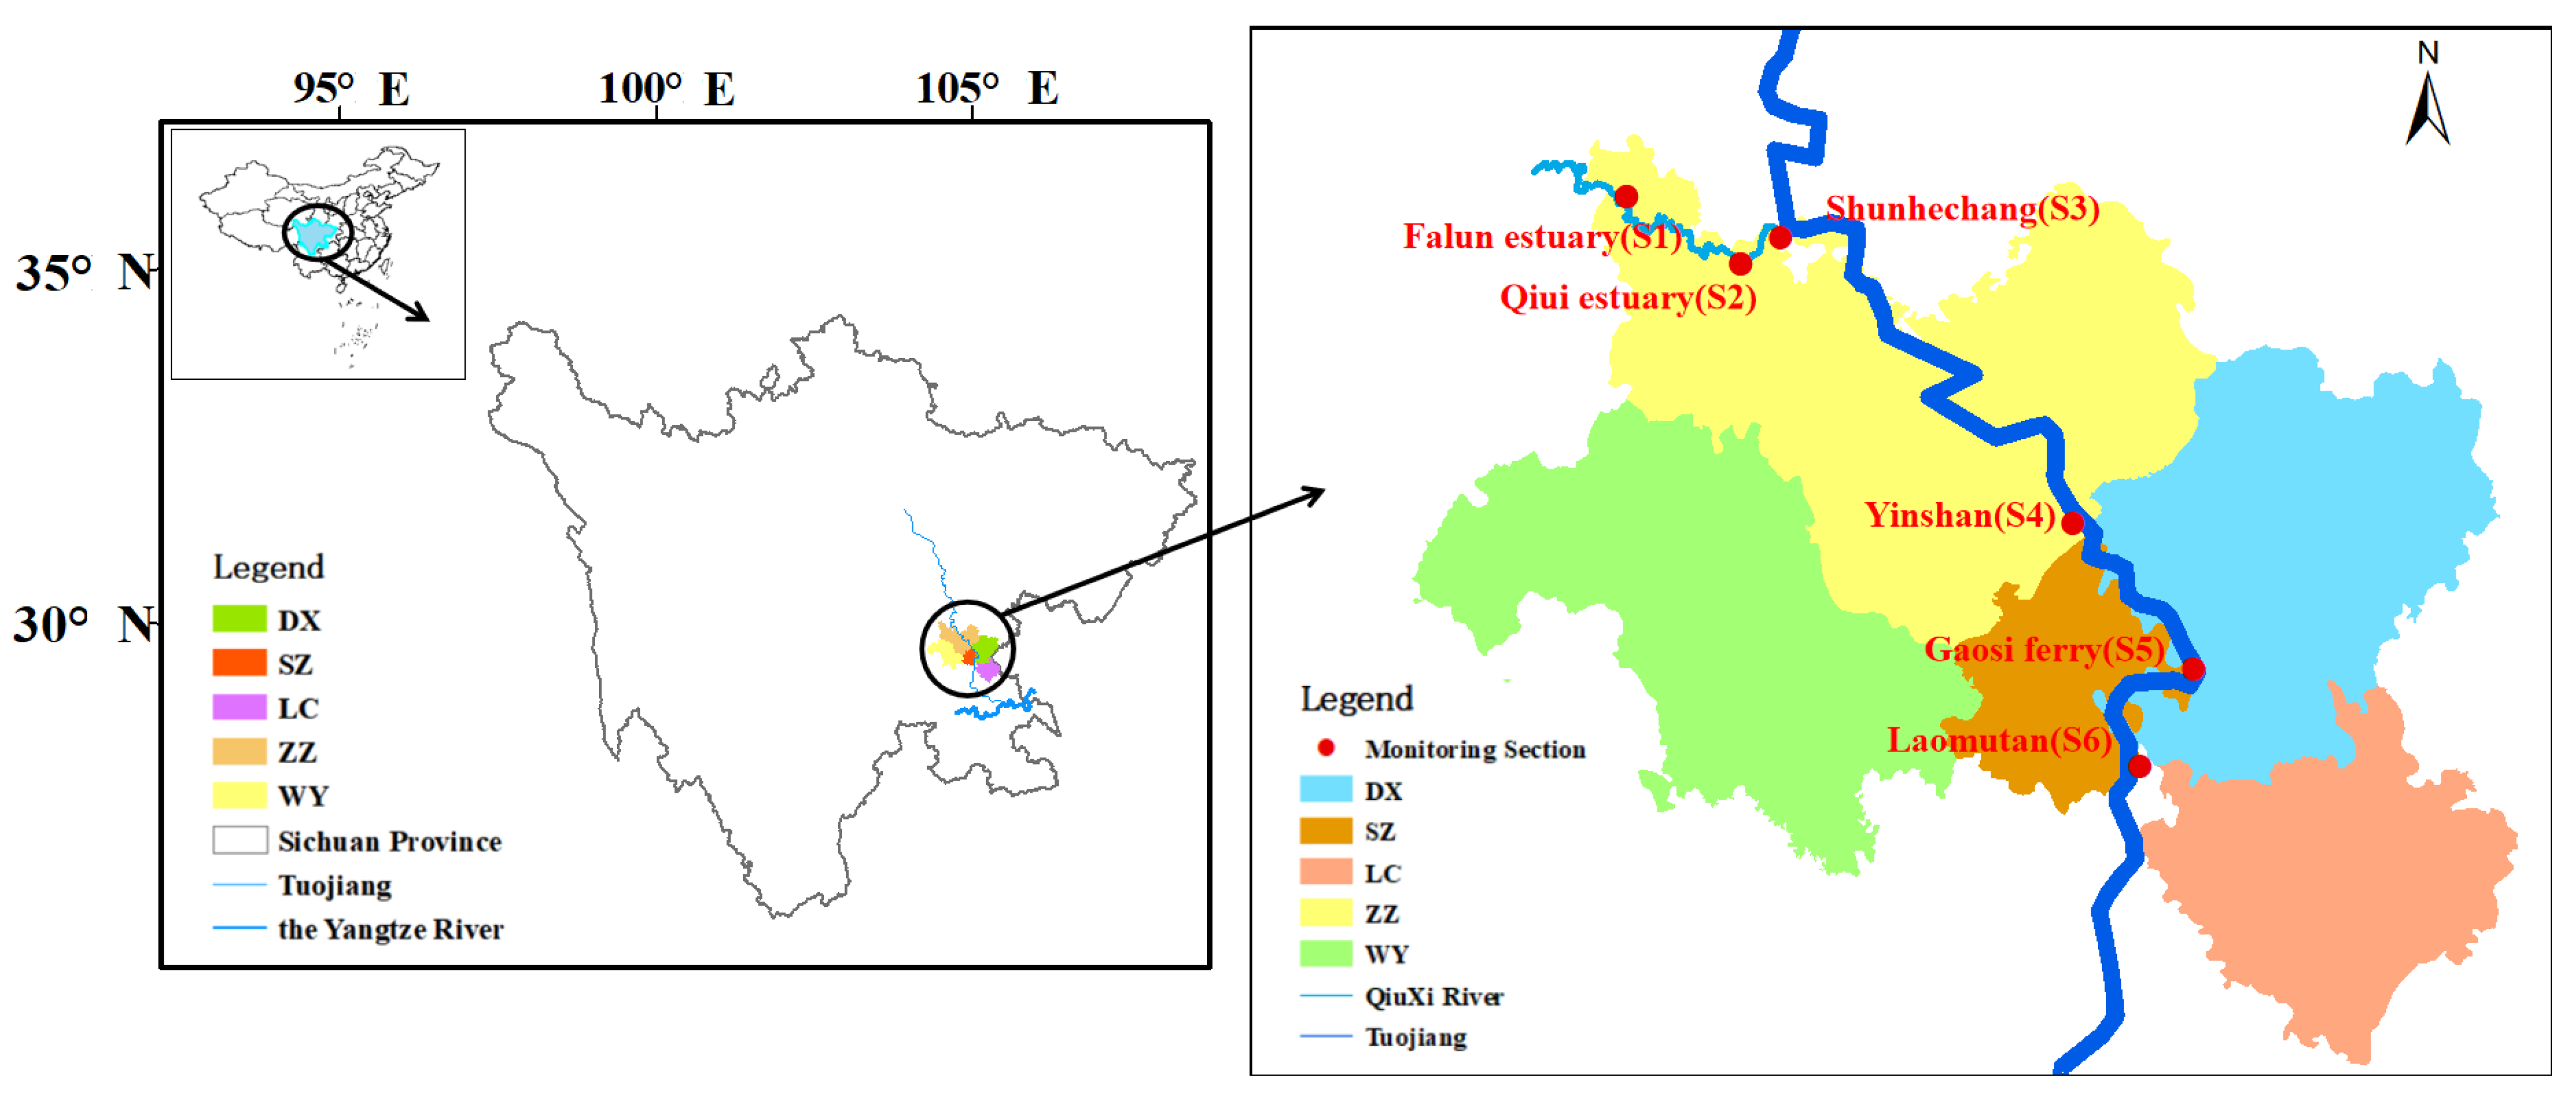
2.1. Study Areas and Data Sources

As shown in Figure 1, the Tuojiang River is a first-order tributary of the upper reaches of the Yangtze River and one of the more important rivers in the central area of Sichuan Province. NJC is located in the southeastern part of Sichuan Province and the middle part of the lower reaches of the Tuojiang River. The Tuojiang River Basin accounts for more than 95% of the city’s land area. NJC includes Shizhong District (SZ), Dongxing District, Weiyuan County, Zizhong County (ZZ), and Longchang County (LC) [41]. The results of the 2021 Neijiang National Economic and Social Development Statistical Bulletin indicated that the economy of NJC has developed rapidly. In 2021, the gross domestic product (GDP) of NJC increased by 8.5% compared to the previous year. Specifically, the primary, secondary, and tertiary industries increased by 6.9%, 6.5%, and 10.4%, respectively, with a ratio of close to 17:33:60. This finding showed that the service industry makes up most of NJC’s economy, whereas agriculture makes up the least.
The Tuojiang River enters the Neijiang River from Shunhechang and exits at Laomutan. The larger tributaries in the NJC section of the mainstream of the Tuojiang River mainly includes the Qiuxi, Mengxi, Xiaoqinglong, and Daqingliu Rivers. In the mainstream control unit of the Tuojiang River, the Qiuxi River is the first tributary of the Tuojiang River in the Neijiang River. The spatial and temporal distributions of the water resources in the Tuojiang River (NJC section) is uneven, and most of the precipitation is from June to September each year. In this paper, the monthly pollutant monitoring data of typical sections were selected to analyze the distribution characteristics of the main pollutants in the river (Table 1).
The agricultural, industrial, and domestic pollution data of each district and county in NJC are all from the Neijiang Statistical Yearbook (2015–2021). The data of the main pollutants in each section of the river came from the Neijiang Municipal Bureau of Ecology and Environment.

2.2. Major Pollutant Identification

In this study, the chemical oxygen demand (COD), ammonia nitrogen (NH3-N), and total phosphorus (TP) were selected to evaluate the grey water footprint and analyze the changes in the major pollutants in the Tuojiang River for three main reasons: (1) According to the China Ecological Environment State Bulletin, COD, NH3-N, and TP are the main pollutants causing surface water pollution in China; (2) according to the Sichuan Province news and documents, the main pollutants of rivers are COD, NH3-N, and TP; and (3) previous studies on the Tuojiang River have shown that the main pollutants include COD, NH3-N, and TP [42,43].

2.3. Grey Water Footprint

Grey water footprint can be interpreted as the dilution water demand [26]. When multiple pollutants are involved, the grey water footprint takes the maximum value of the grey water footprint of each pollutant [18,23,44]:
GWFj,i = Lj,i/(Cmax,j,i − Cnat,j,i),
GWFj = max{GWFj,1, GWFj,2,…, GWFj,i},
GWFTotal = ΣGWFj,
where GWFj,i is the grey water footprint of pollutant i released into the water at point j [volume/time], GWFj is the grey water footprint of the pollutant at point j [volume/time], GWFTotal is the grey water footprint of the system being studied [volume/time], Lj,i is the quantity of pollutant i being emitted into the water at point j [weight/volume], Cmax,j,i is the maximum permissible concentration of substance i in the receiving waters at point j [weight/time], Cnat,j,i is the natural concentration of substance i in the receiving waters at point j [weight/volume], and n is the number of discharge points.
The natural water body background concentration (Cnat) of pollutants is the original concentration of pollutants in the water body, which is often assumed to be 0.

2.4. Water Environment Decoupling Theory

Decoupling theory refers to a situation in which the relationship between two or more related variables decreases or ceases to exist [45,46]. The decoupling effect refers to reducing the burden on the environment while maintaining or increasing economic growth rates. This effect enables more efficient use of natural resources, especially water [47]. Decoupling can be divided into relative and absolute decoupling. The former refers to the increase of resource and environmental pressure at a lower rate during economic growth; the latter refers to the reduction of the growth rate of resource and environmental pressure during economic growth [48]. According to the decoupling index, the gross domestic product change rate, and the grey water footprint change rate, the relationship between economic development and the water environment is divided into high-quality coordination, preliminary coordination, and uncoordinated [49]. The decoupling index can be calculated as follows:
DF = VGDP − VF,
where DF is the decoupling index, VGDP is the average annual gross domestic product change rate, and VF is the average annual grey water footprint change rate. When VGDP > 0, VF < 0, and DF > 0, water resource utilization and economic growth are in a state of strong decoupling and high-quality coordinated development. When VGDP > 0, VF > 0, and DF > 0, water resource utilization and economic growth are in a weak decoupling and preliminary coordination state. When DF ≤ 0, water resource utilization and economic growth are not in a state of decoupling.

2.5. Correlation Analysis Method

A correlation analysis can indicate whether the variables are correlated, the direction of correlation, and the degree of closeness. Probability (P) reflects the probability of an event happening. Generally, p < 0.05 indicates a significant correlation; whereas p < 0.01 denotes an extremely significant correlation, which implies that the probability that the difference between samples is caused by a sampling error of less than 0.05 or 0.01. Pearson’s correlation coefficient (Cor) was used to measure the correlation between two variables, X and Y. Its value is between −1 and 1, and the greater the absolute value is, the greater the correlation will be. A positive correlation coefficient indicates a positive correlation; otherwise, it is a negative correlation [50,51]. The formula for calculating Cor is [52]:
Cor ( X , Y ) = Cov ( X , Y ) / Var ( X ) Var ( Y ) ,
where Cov(X, Y) denotes the co-variance of X and Y for any random variable Z, and Var (Z) denotes the variance of Z. On the basis of Cauchy–Schwarz inequality, Cor (X, Y) ∈ [−1, 1].

3. Results and Discussion

3.1. Water Environment Quality Evaluation

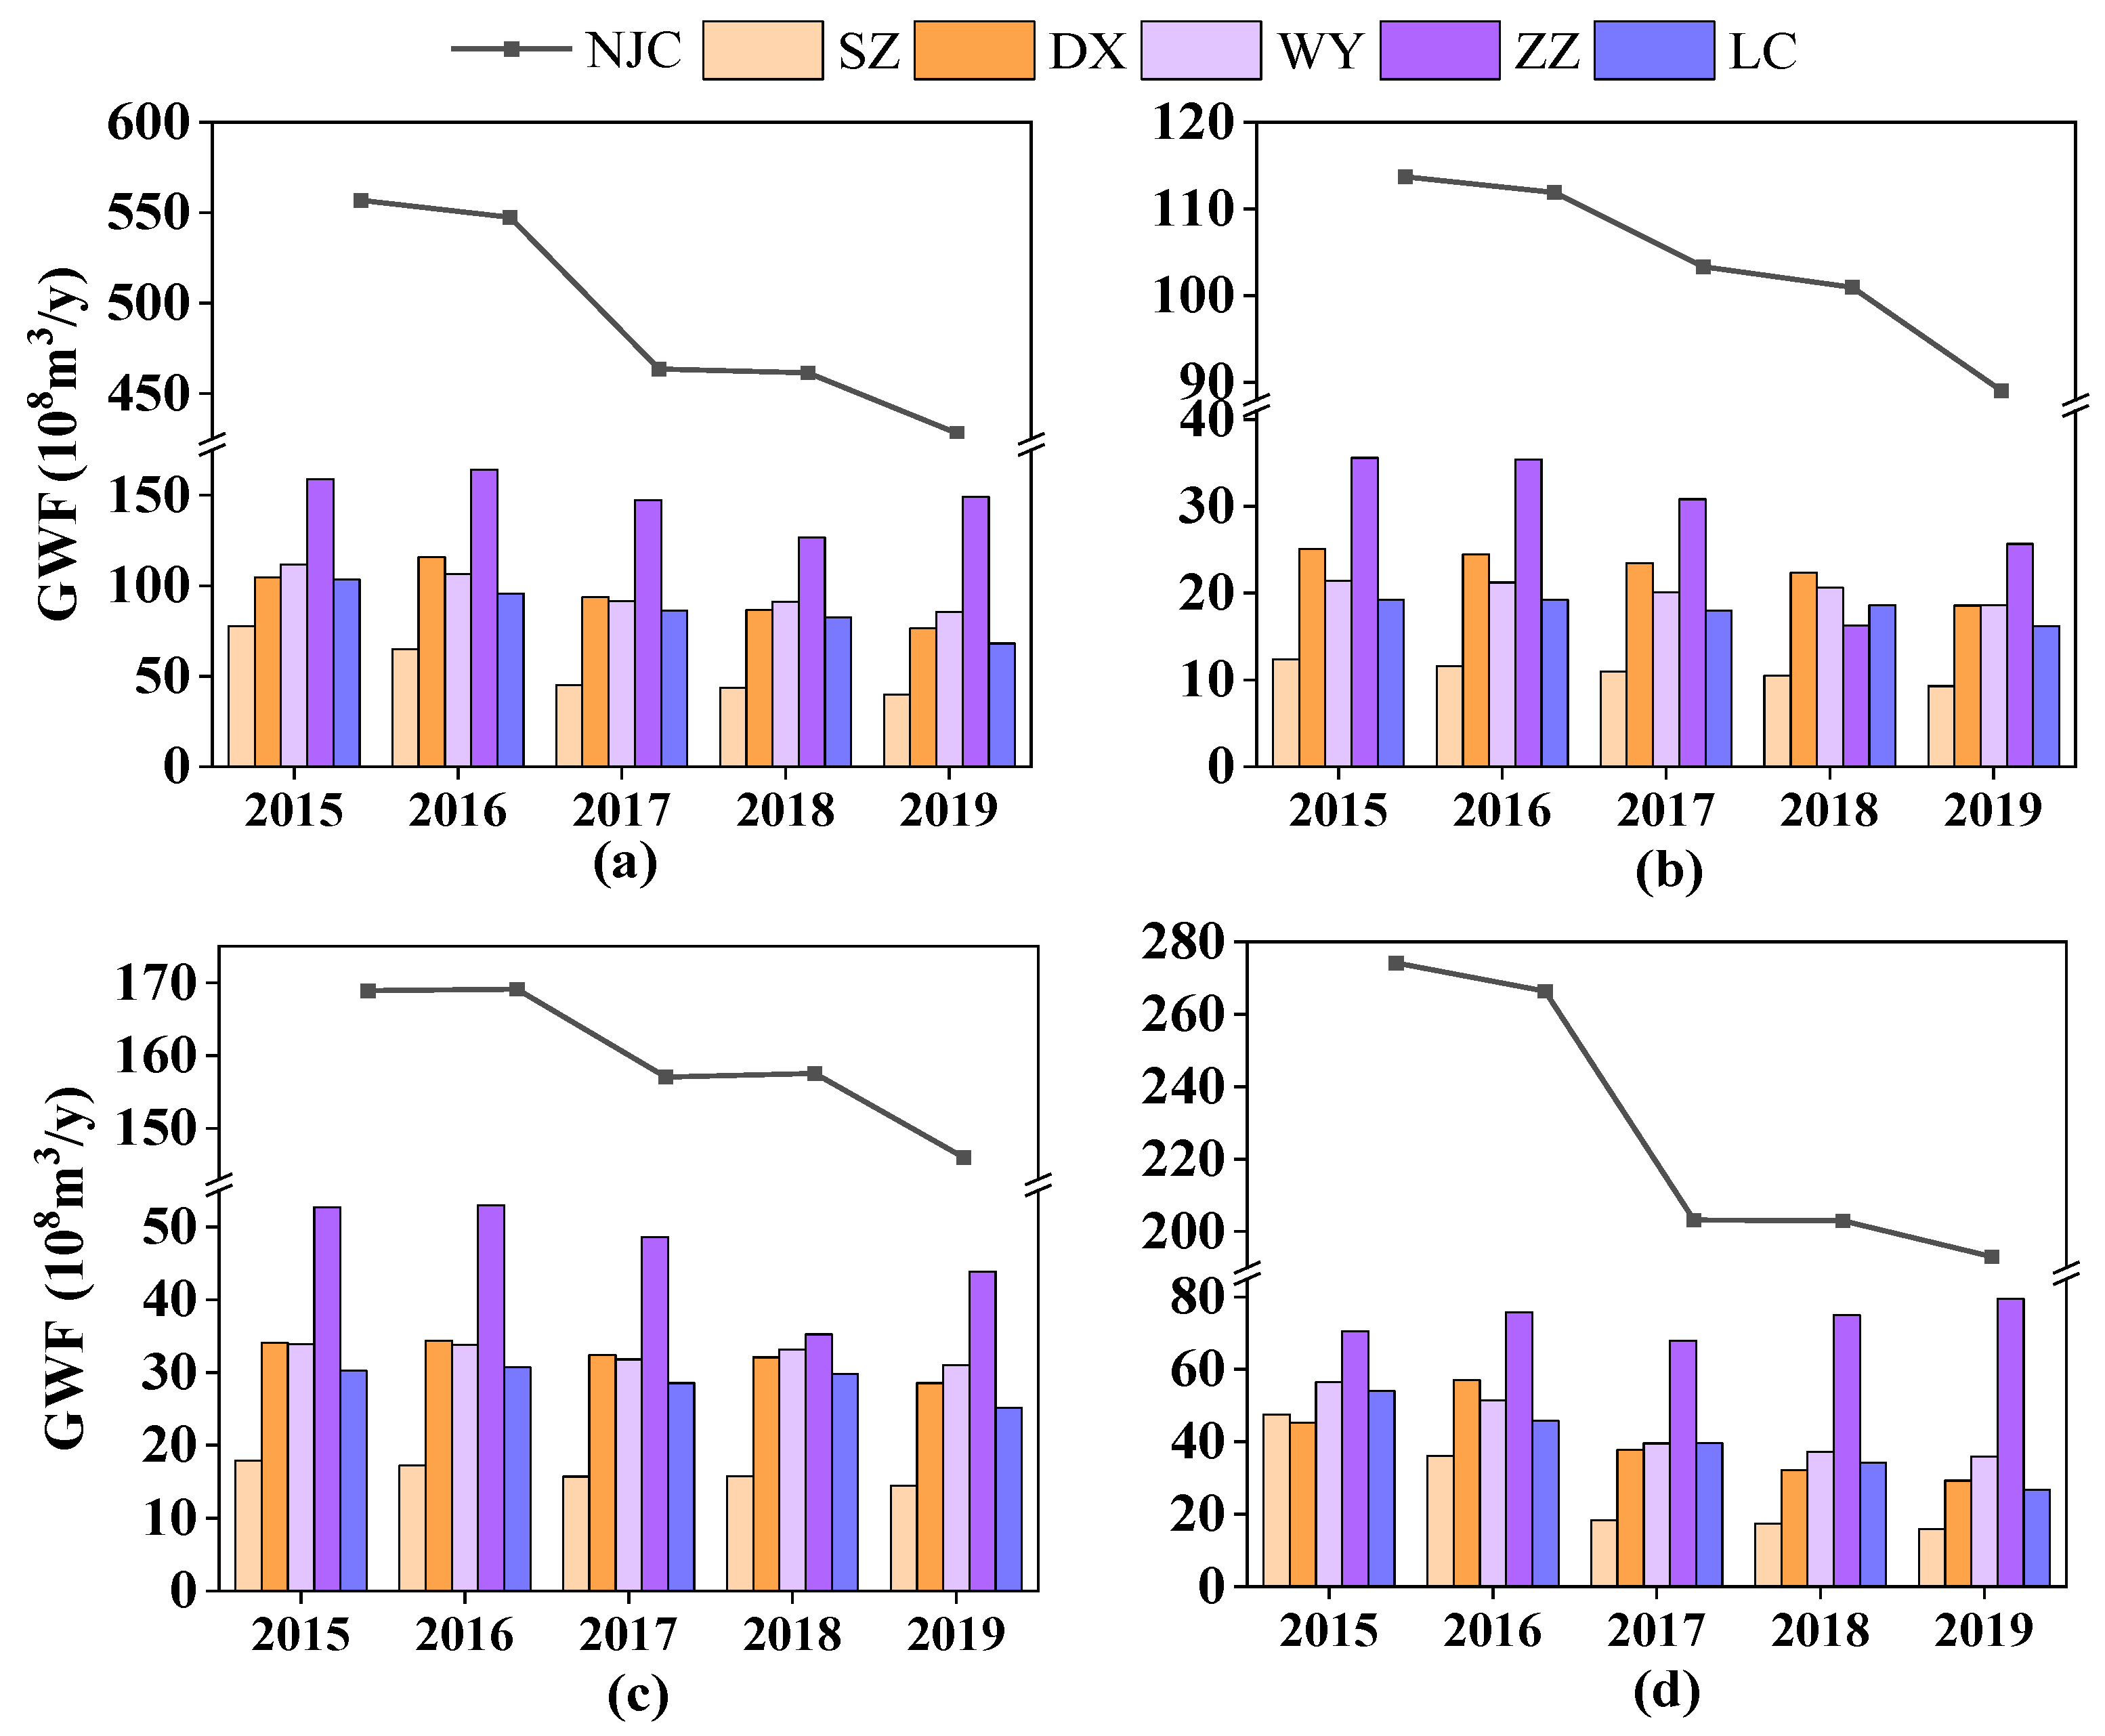
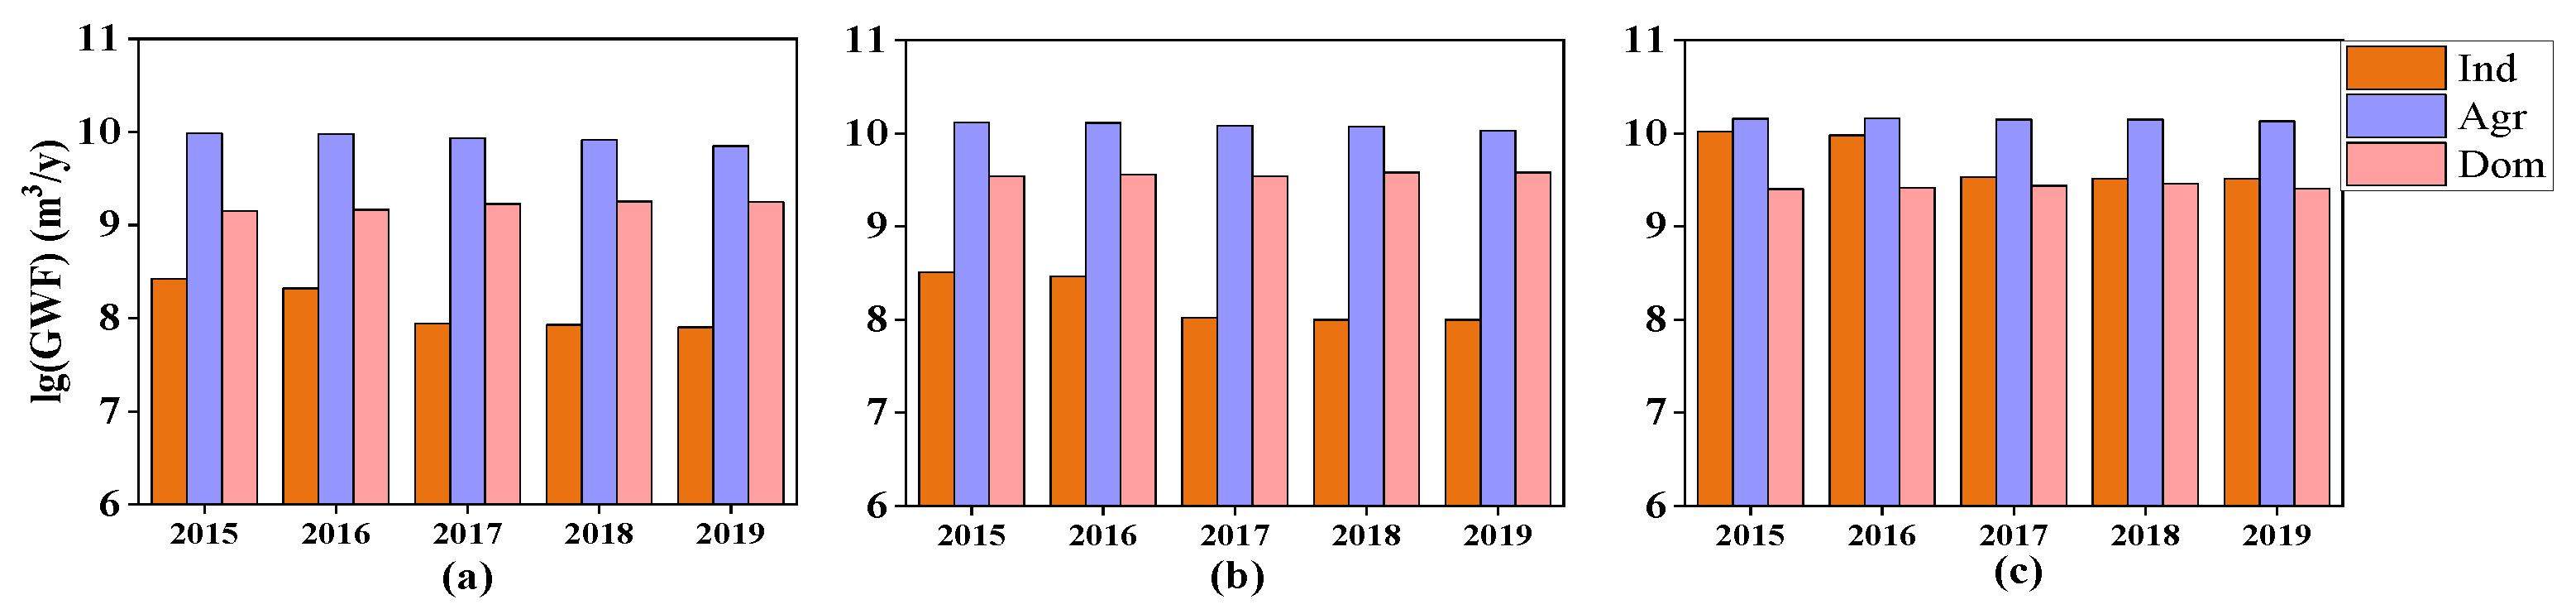
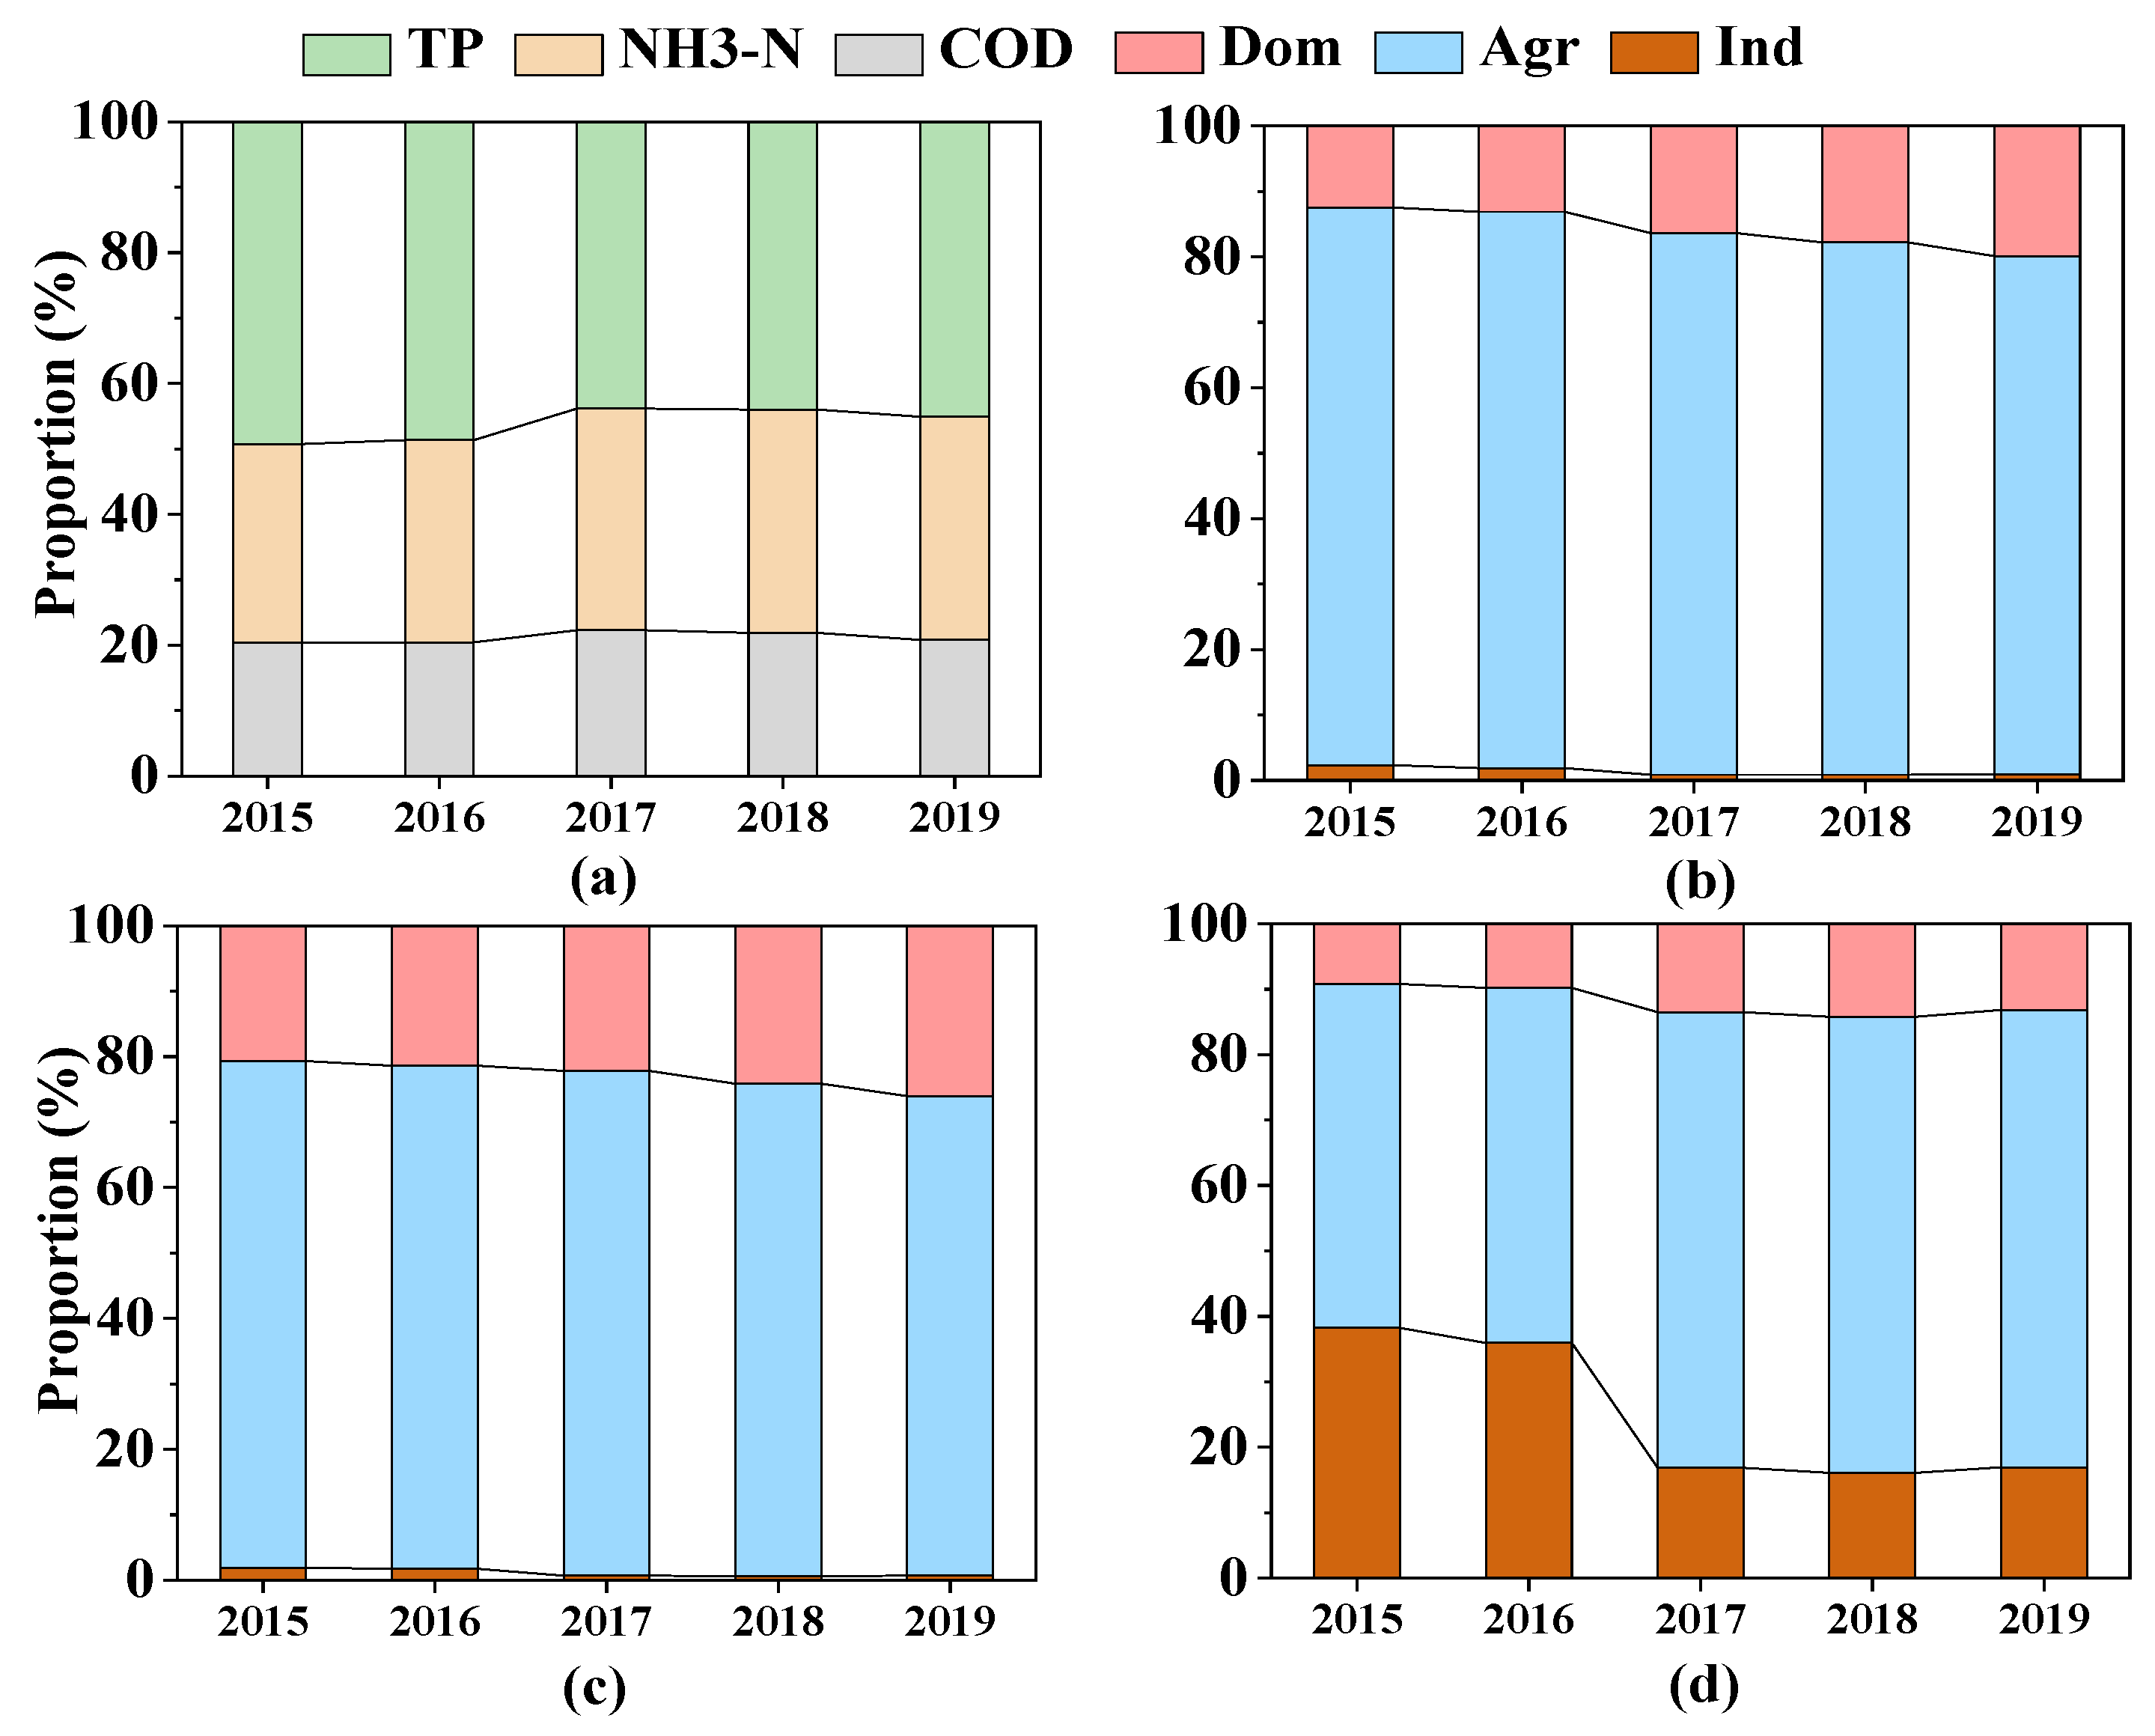
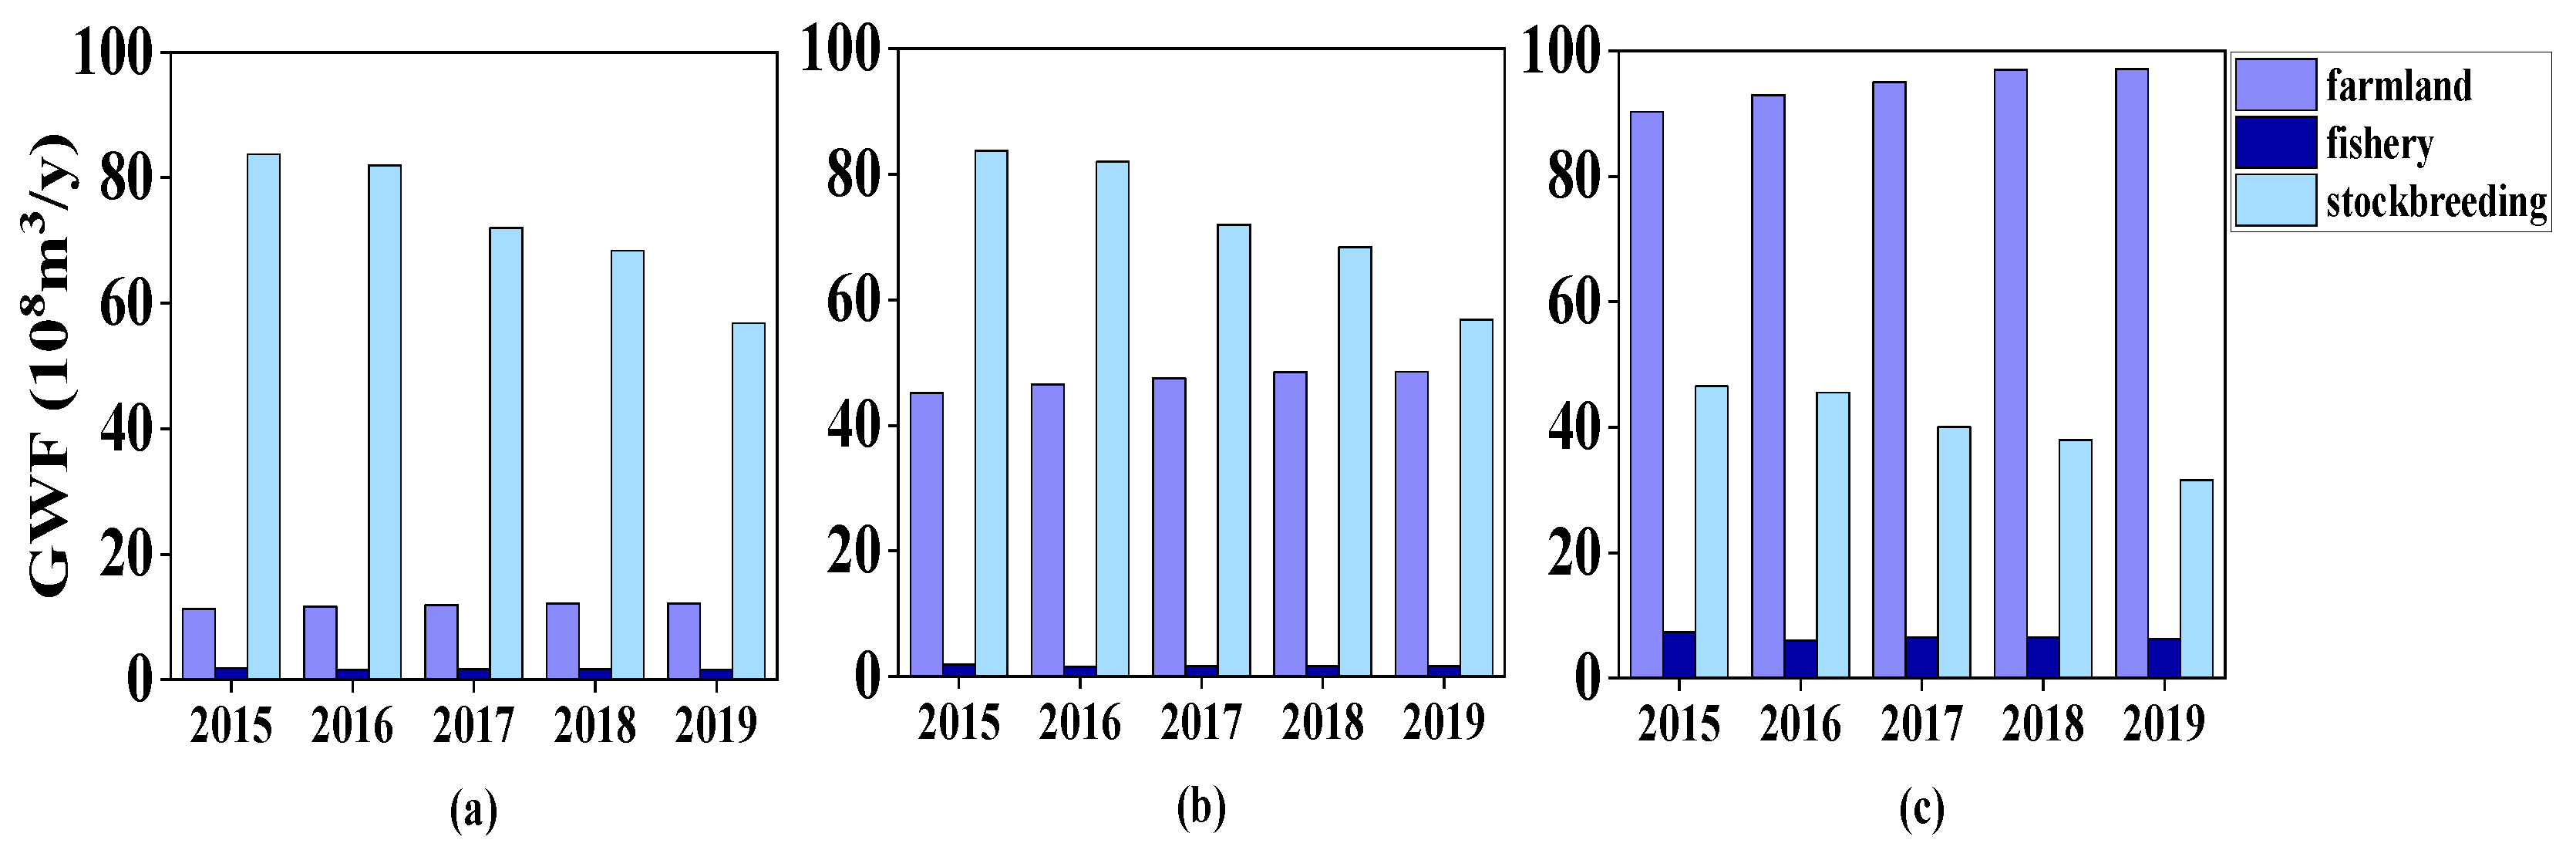
3.1.1. Distribution and Proportion of Grey Water Footprint

The GWFTotal, GWFCOD, GWFNH3-N, and GWFTP of NJC and its five districts and counties are shown in Figure 2. From 2015 to 2019, the grey water footprint data of pollutants showed that GWFTP was higher than GWFCOD and GWFNH3-N; thus, GWFTP was the grey water footprint, that is, the main pollutant was TP. The GWFTotal (Figure 2a) of NJC decreased from 556.82 × 10⁸ m3/y to 428.11 × 10⁸ m3/y, showing a decrease rate of 30.06%—and the GWFCOD (Figure 2b), GWFNH3-N (Figure 2c), and GWFTP (Figure 2d) decreased by 27.67%, 15.70%, and 42.04%, respectively. The grey water footprint of the five districts and counties generally showed a downward trend. Generally, the quality of the water environment is improving. The largest declines were in SZ and LC, which were 96.18% and 51.8%, respectively. The smallest decline was in ZZ at 6.63%. From the perspective of spatial distribution, the grey water footprint was significantly higher in ZZ and significantly lower in SZ. Thus, the water environment quality in the upper reaches of the Tuojiang River was slightly lower than that in the lower reaches. The phosphorus industry was a major factor leading to excessive pollutant concentrations in the environment. Several mining regions can be found in the upper reaches of the Tuojiang River, and their effects on water quality shouldn’t be underestimated. The development of the phosphorus industry in the upper reaches of the Tuojiang River could explain the high TP concentration throughout the whole basin [43].
The changes in the pollution sources of GWFCOD, GWFNH3-N, and GWFTP in NJC from 2015 to 2019 are shown in Figure 3. The results showed that in comparison with 2015, the GWFAgr in GWFCOD in 2019 decreased by 26.34 × 10⁸ m3, GWFInd decreased by 1.84 × 10⁸ m3, and GWFDom increased by 3.54 × 10⁸ m3; thus, the main reason for the decrease in GWFCOD was agricultural COD emissions (Figure 3a). The GWFAgr in GWFNH3-N decreased by 23.78 × 10⁸ m3, GWFInd decreased by 2.21 × 10⁸ m3, and GWFDom increased by 3.07 × 10⁸ m3; thus, the main reason for the decrease in GWFNH3-N was agricultural NH3-N emissions (Figure 3b). In GWFTP, GWFAgr decreased by 9.16 × 10⁸ m3, GWFInd decreased by 72.2 × 10⁸ m3, and GWFDom was almost unchanged as a whole. Hence, the main reason for the decline in GWFTP was the reduction in industrial TP emissions (Figure 3c).
The main reason for the decline of GWFInd was that in 2016, NJC was the opportunity for Neijiang to seize the “One Belt, One Road” strategy and vigorously implement the innovation-driven strategy, which achieved remarkable results. Subsequently, NJC was committed to the transformation and upgrade of traditional industries, which entailed adjusting the industrial structure, actively promoting the development of new industrialization, and accelerating the cultivation of high-end growth industries, such as energy conservation, environmental protection, and shale gas. Furthermore, it required adherence to the development of new materials, new equipment, new energy, and other related industries as the main direction of economic development.
The proportion of pollutants from the GWFTotal in NJC from 2015 to 2019 are shown in Figure 4a. The proportion of the main sources of GWFCOD, GWFNH3-N, and GWFTP is shown in Figure 4b–d, respectively. As shown in Figure 4a, from 2015 to 2019, significant differences were observed in the proportion of pollutants in the GWFTotal in NJC. The average proportions of GWFCOD, GWFNH3-N, and GWFTP were 21%, 33%, and 46%, respectively. The proportion was GWFTP > GWFNH3-N > GWFCOD; thus, GWFTP was the grey water footprint of NJC. The main sources of GWFCOD, GWFNH3-N, and GWFTP were agricultural pollution, with an average proportion of 83%, 76%, and 63%, respectively (Figure 4b–d). The second source of GWFCOD and GWFNH3-N was domestic pollution. However, the second source of GWFTP was mainly industrial pollution in 2015–2016, and the proportion of domestic and industrial pollution was approximately equal during 2017–2019. In recent years, relevant studies have been conducted on the driving force analysis of grey water footprint at the provincial scale in China, and agricultural activities have the highest contribution rate to the country’s grey water footprint [53,54]. Given the continuous improvement in the level of agricultural development, organic or inorganic pollutants, such as nitrogen, phosphorus, and pesticides, enter the surface water, groundwater, and soil environment through surface runoff.
The changes in the specific sources of agricultural pollution are shown in Figure 5. We found that the source of agricultural pollution in the Tuojiang River Basin mainly came from stock breeding and farmland pollution, which was consistent with the research results of Hu Yunyun [55]. The extensive agricultural production methods and the discharge of livestock and poultry breeding wastewater led to the development of production-type pollution in the Tuojiang River Basin, that is, stock breeding and farmland pollution [56]. From 2015 to 2019, the proportion of agricultural pollution in GWFCOD and GWFNH3-N decreased due to the reduction in livestock production (Figure 5a,b). According to the first national pollution source census, aquaculture accounted for a large proportion of agricultural water pollution. The grey water footprint source in aquaculture was wastewater pollution caused by animal urine and feces. COD and N were usually pollutants discharged from this wastewater [53]. Although the contribution of aquaculture was extremely low, the accumulation of discharged nutrients in aquatic systems could have a negative effect on water quality [57]. The deterioration of eutrophication caused by aquaculture and the resulting “red tide” problem could not be ignored [57,58]. In the agricultural production activities in the Tuojiang River Basin, excessive chemical fertilizers and irrigation cause agricultural planting pollution, and stock breeding produces a high pollution load. In recent years, the livestock and poultry breeding industry and the aquaculture industry have developed rapidly in townships and villages, and the wastewater from the aquaculture industry has surged. Therefore, to reduce the effect on river water quality, attention should be paid to the problem of direct discharge of wastewater from farms without treatment or if the treatment does not meet standards [59].
The proportion of agricultural pollution in the GWFTP increased due to the rise in the irrigated area of farmland (Figure 5c). Some studies have shown that the pollution load of agricultural irrigation return water is mainly phosphorus, and the pollutants from farmland irrigation return water enter small river channels and ponds in villages through field ditches, and finally enter rivers [60,61]. A large amount of cultivated land exists on both sides of the mainstream of the Tuojiang River. Rainfall and farmland irrigation flushes the chemical fertilizer residues in the farmland into the Tuojiang River with surface runoff, which directly affects the water quality of the Tuojiang River. Agricultural non-point source pollution should be controlled, the abuse of chemical fertilizers and pesticides in agricultural production should be avoided, and efficient fertilization and irrigation technology should be promoted.

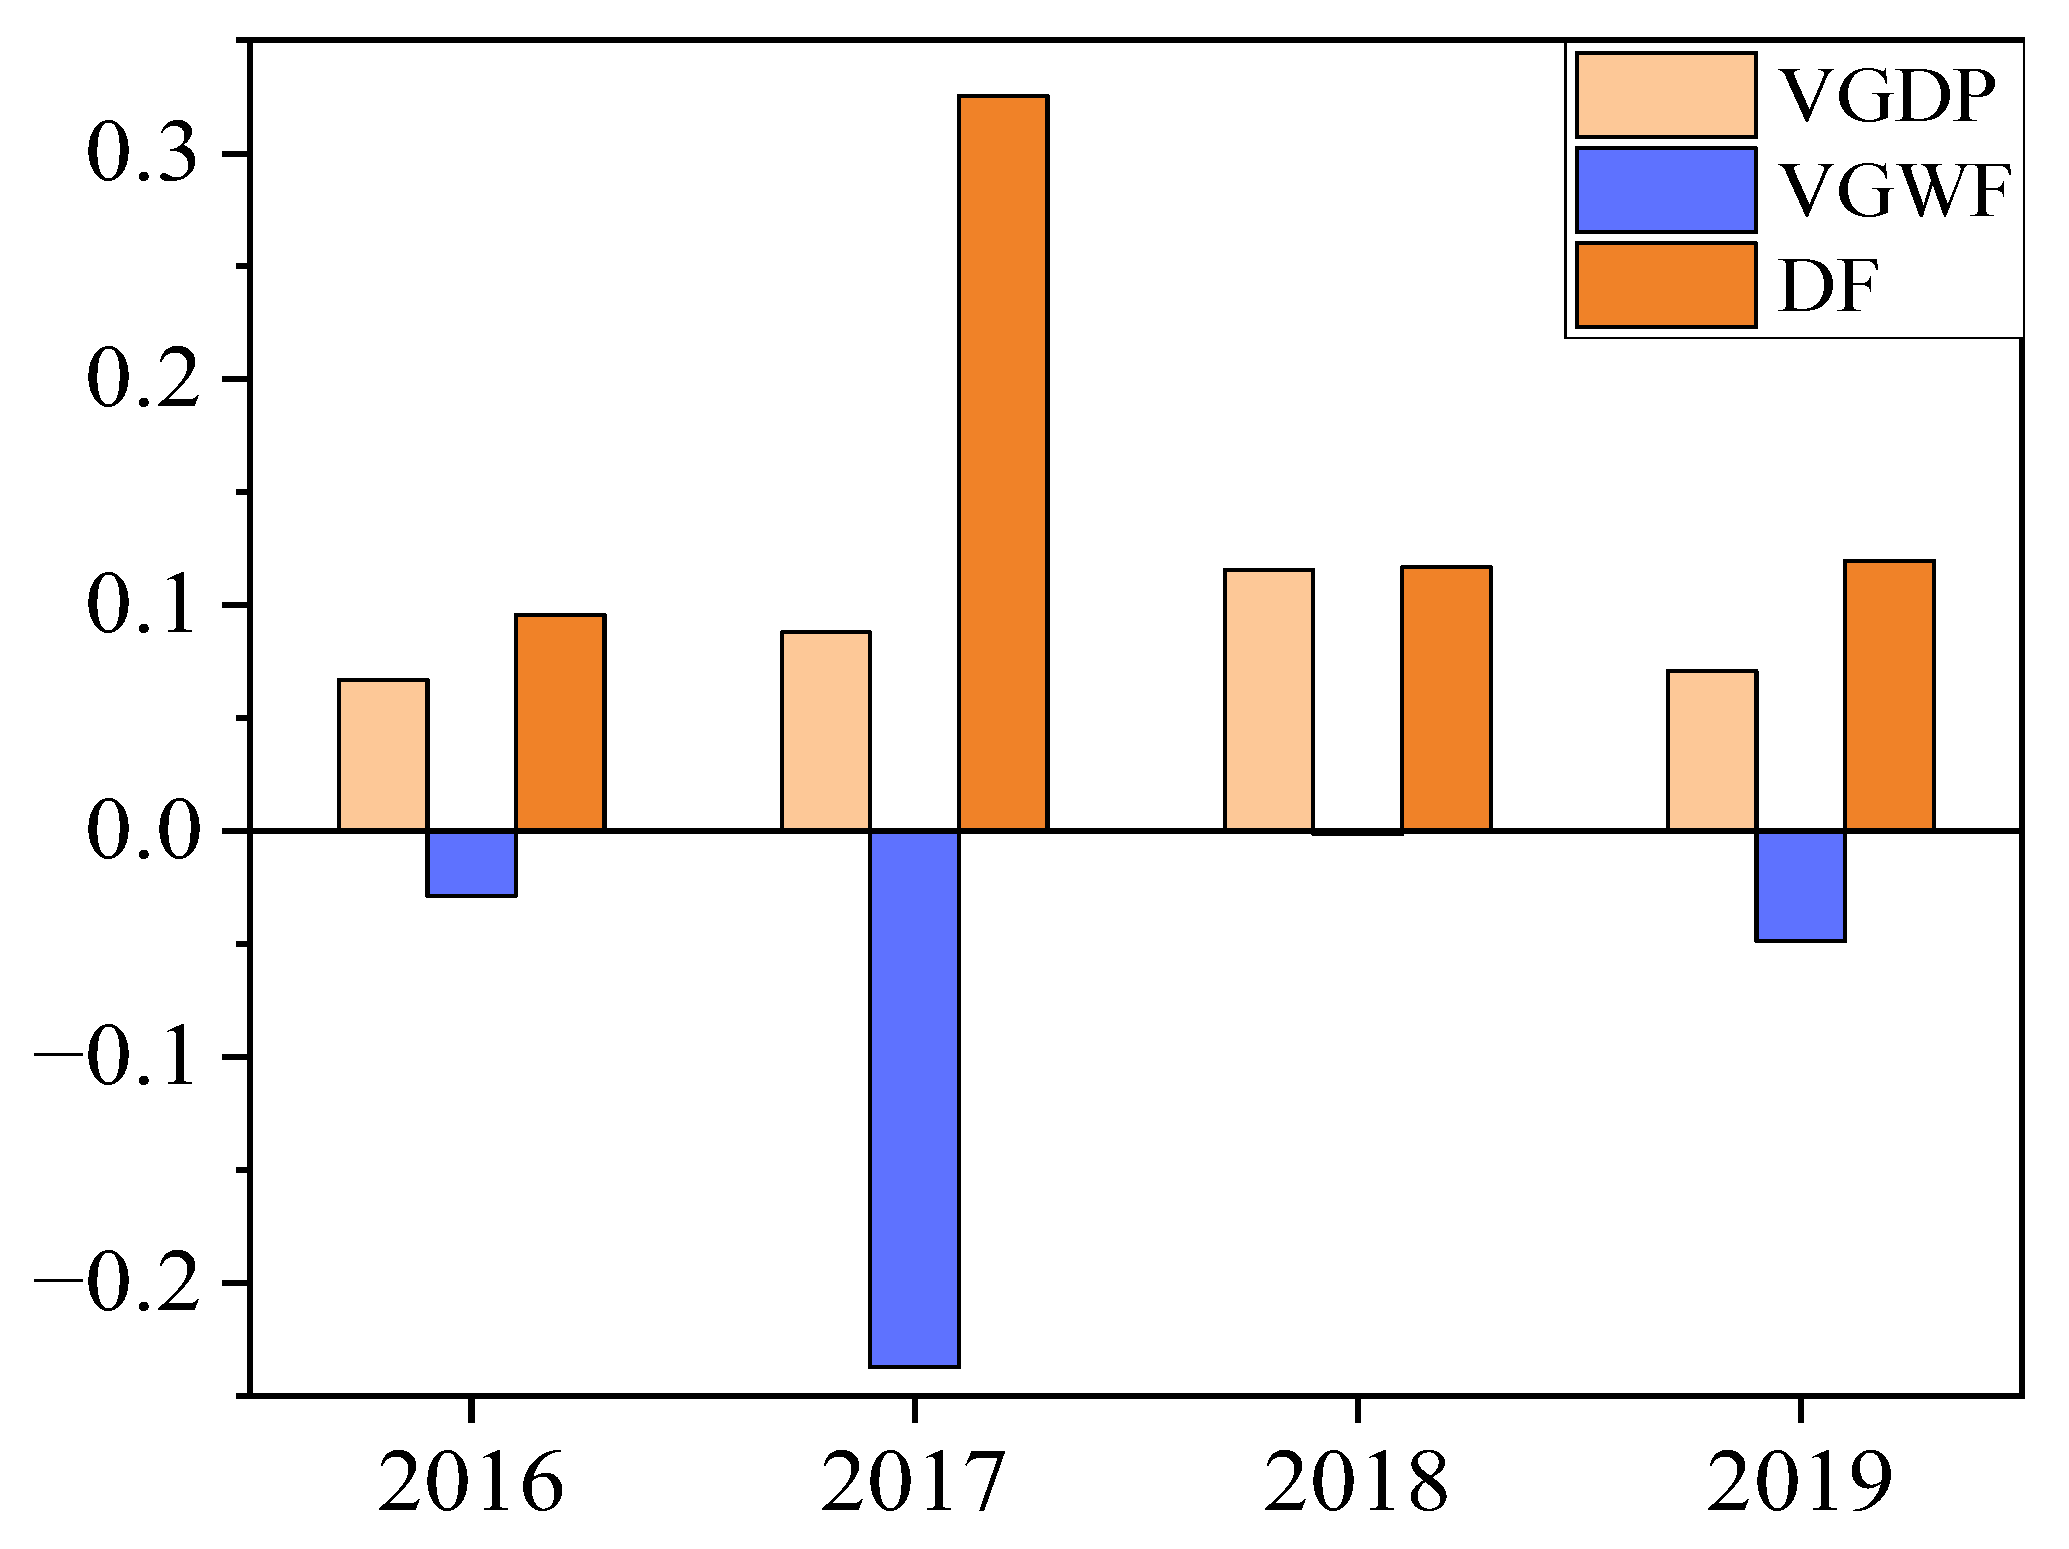
3.1.2. Decoupling of Economy and Water Environment

The decoupling of water environment quality and economic development in the Tuojiang River is shown in Figure 6. From 2016 to 2019, the decoupling index and the gross domestic product rate of change were positive, and the grey water footprint was negative. The order of the decoupling index was 2017 > 2019 > 2018 > 2016, with decoupling indices of 0.096, 0.325, 0.117, and 0.120, respectively. In recent years, the water resource environment and economic development have been in a state of absolute decoupling. The economic development level and water environment of the Tuojiang River were generally in a state of high-quality coordination. This phenomenon indicates that the economic development level was relatively high and the damage to the water environment was relatively low. The current economic development was in a growth trend, but the grey water footprint was gradually declining. The main reason for economic development was that the 13th Five-year Plan of the South Sichuan Economic Zone clearly proposed to accelerate the development of NJC. The development plan started to focus on the improvement of equipment manufacturing, advanced materials, electronic information, energy and chemical industries, and food and beverage industries, and was coordinated to build an important metropolitan area on the main axis of Chongqing’s development.
The economic development and water environment of the Tuojiang River Basin were in a state of high-quality coordination. Thanks to the transformation and upgrading of coal energy development, it had embarked on the road of green and low-carbon development. NJC had a solid foundation for the development of green and low-carbon industries. Shale gas, hydrogen energy, and other clean energy sources were abundant, and the advantages of resource endowment and industrial bases made it easy to form a good trend of industrial green development. In the context of industrial transformation, economic development has been improved and pollution emissions have decreased.

3.2. Pollution Source Analysis of River

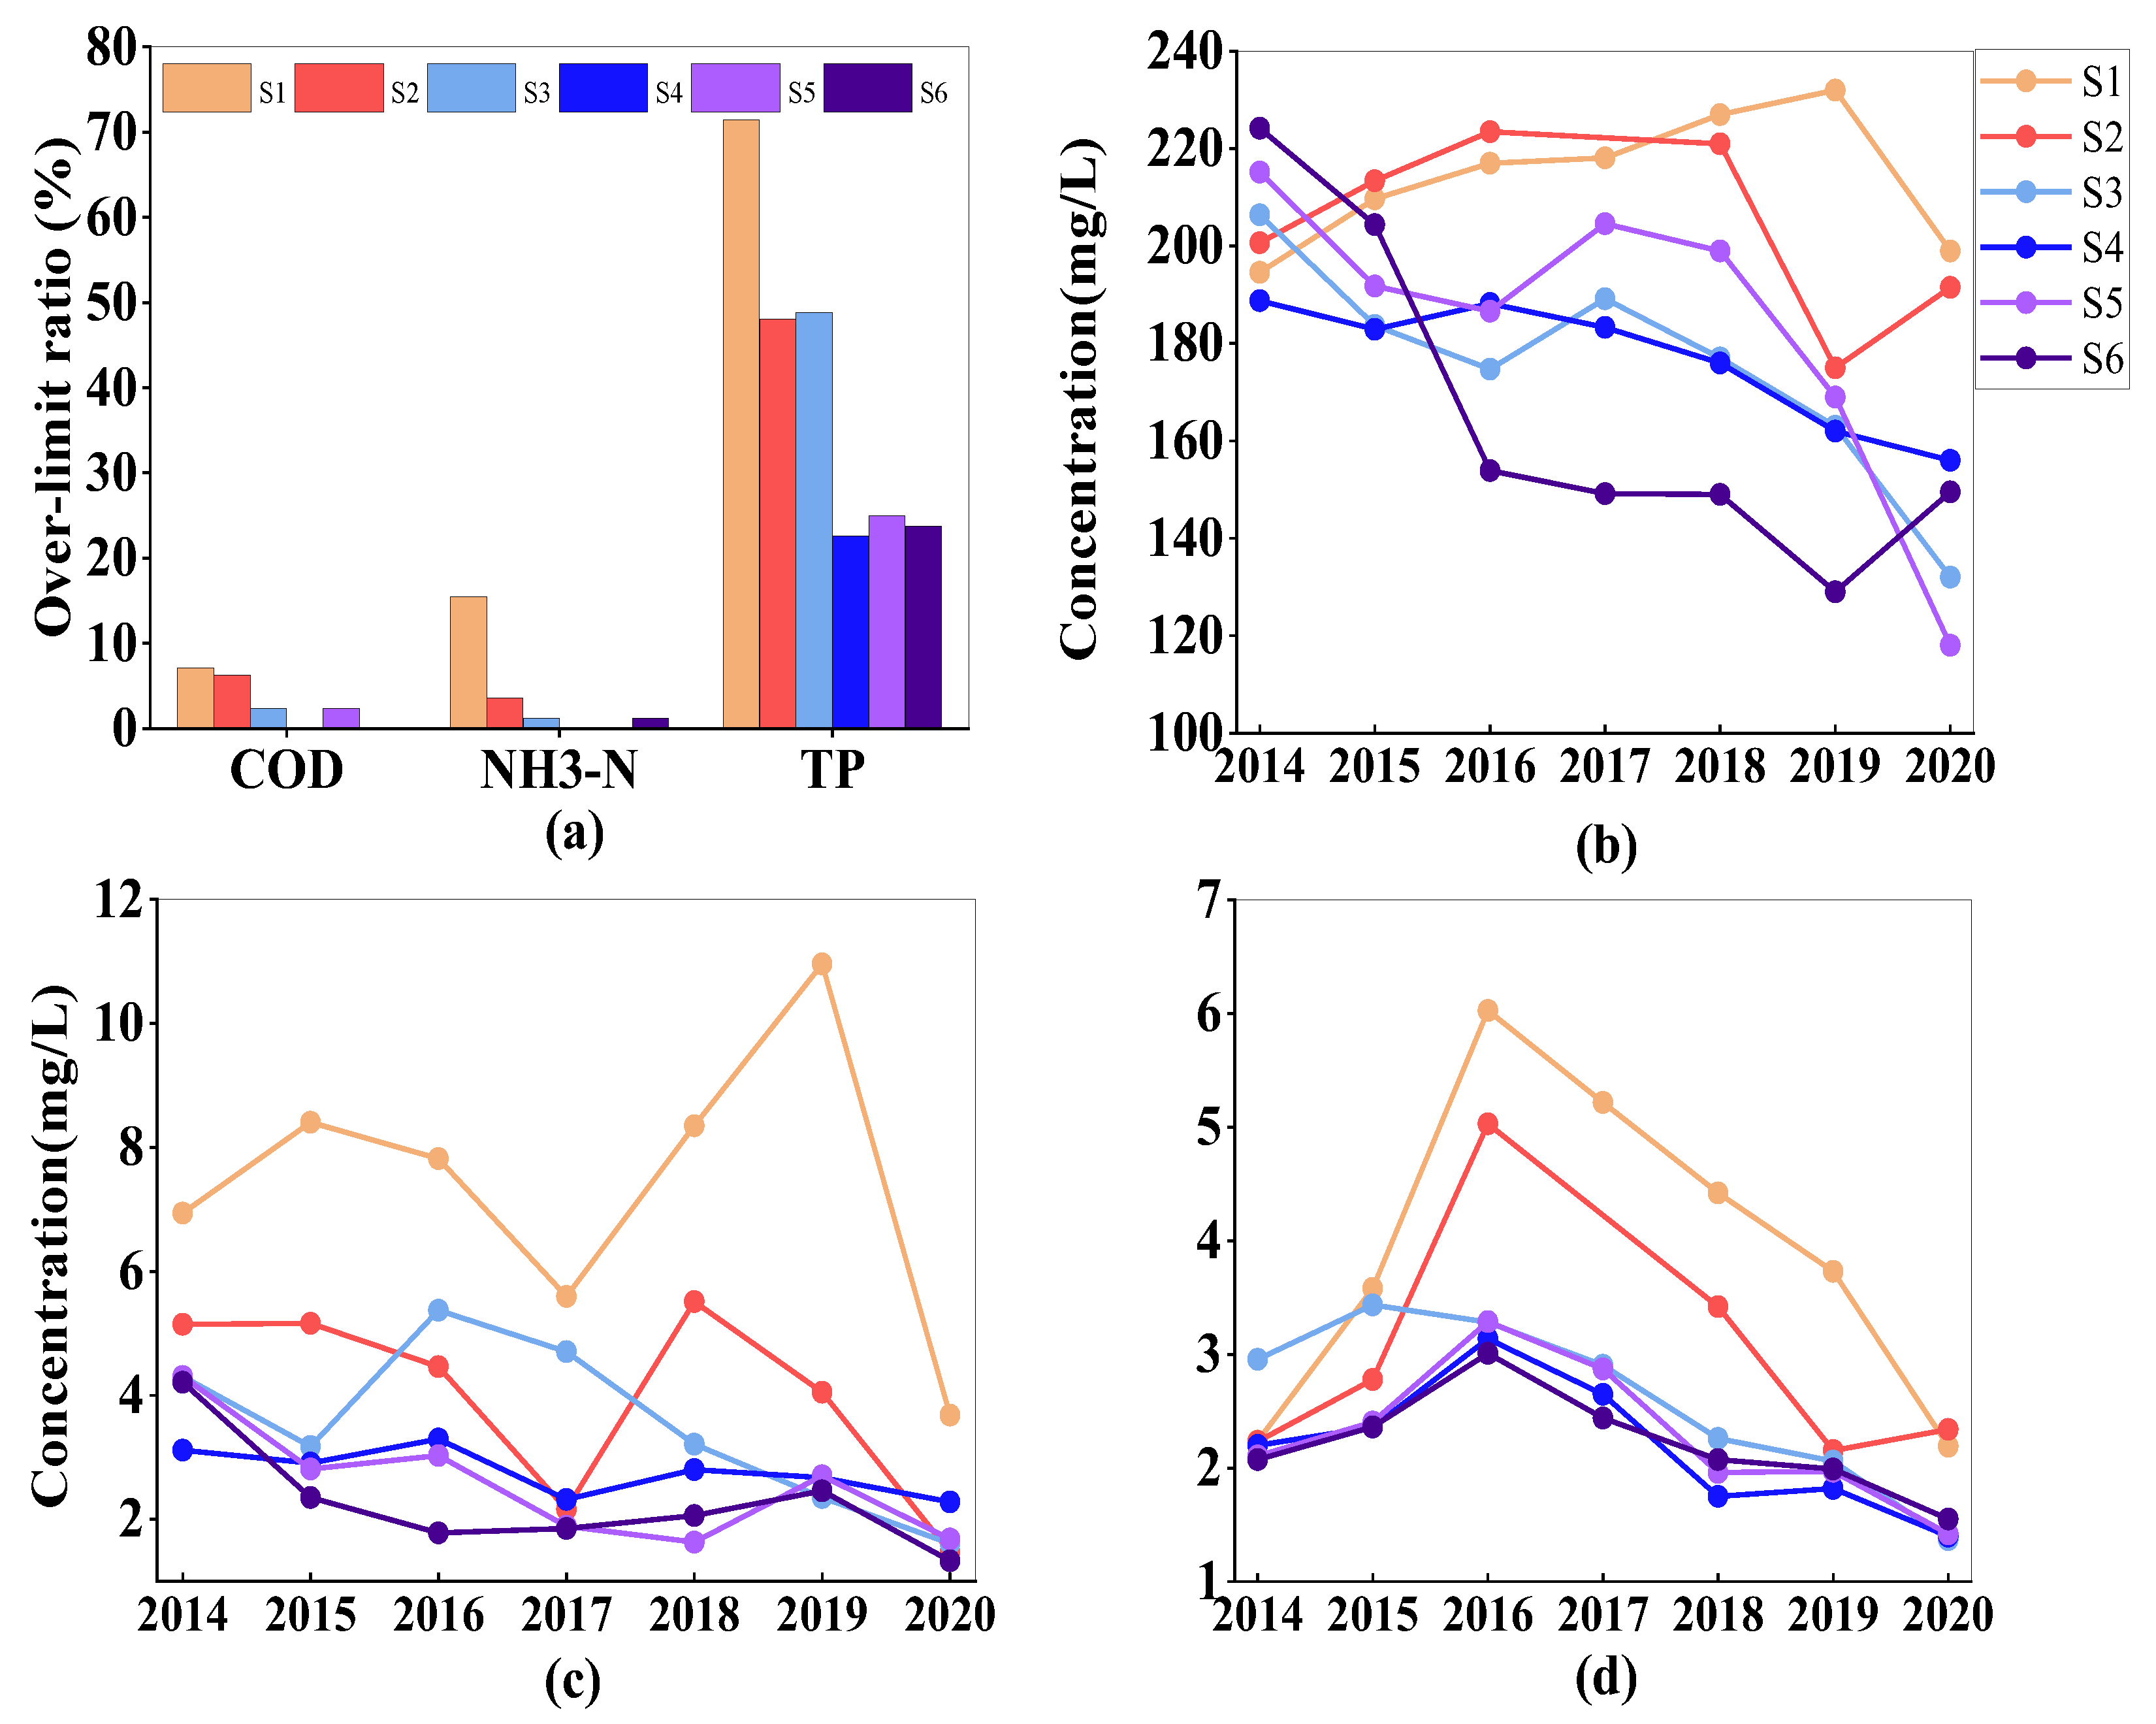
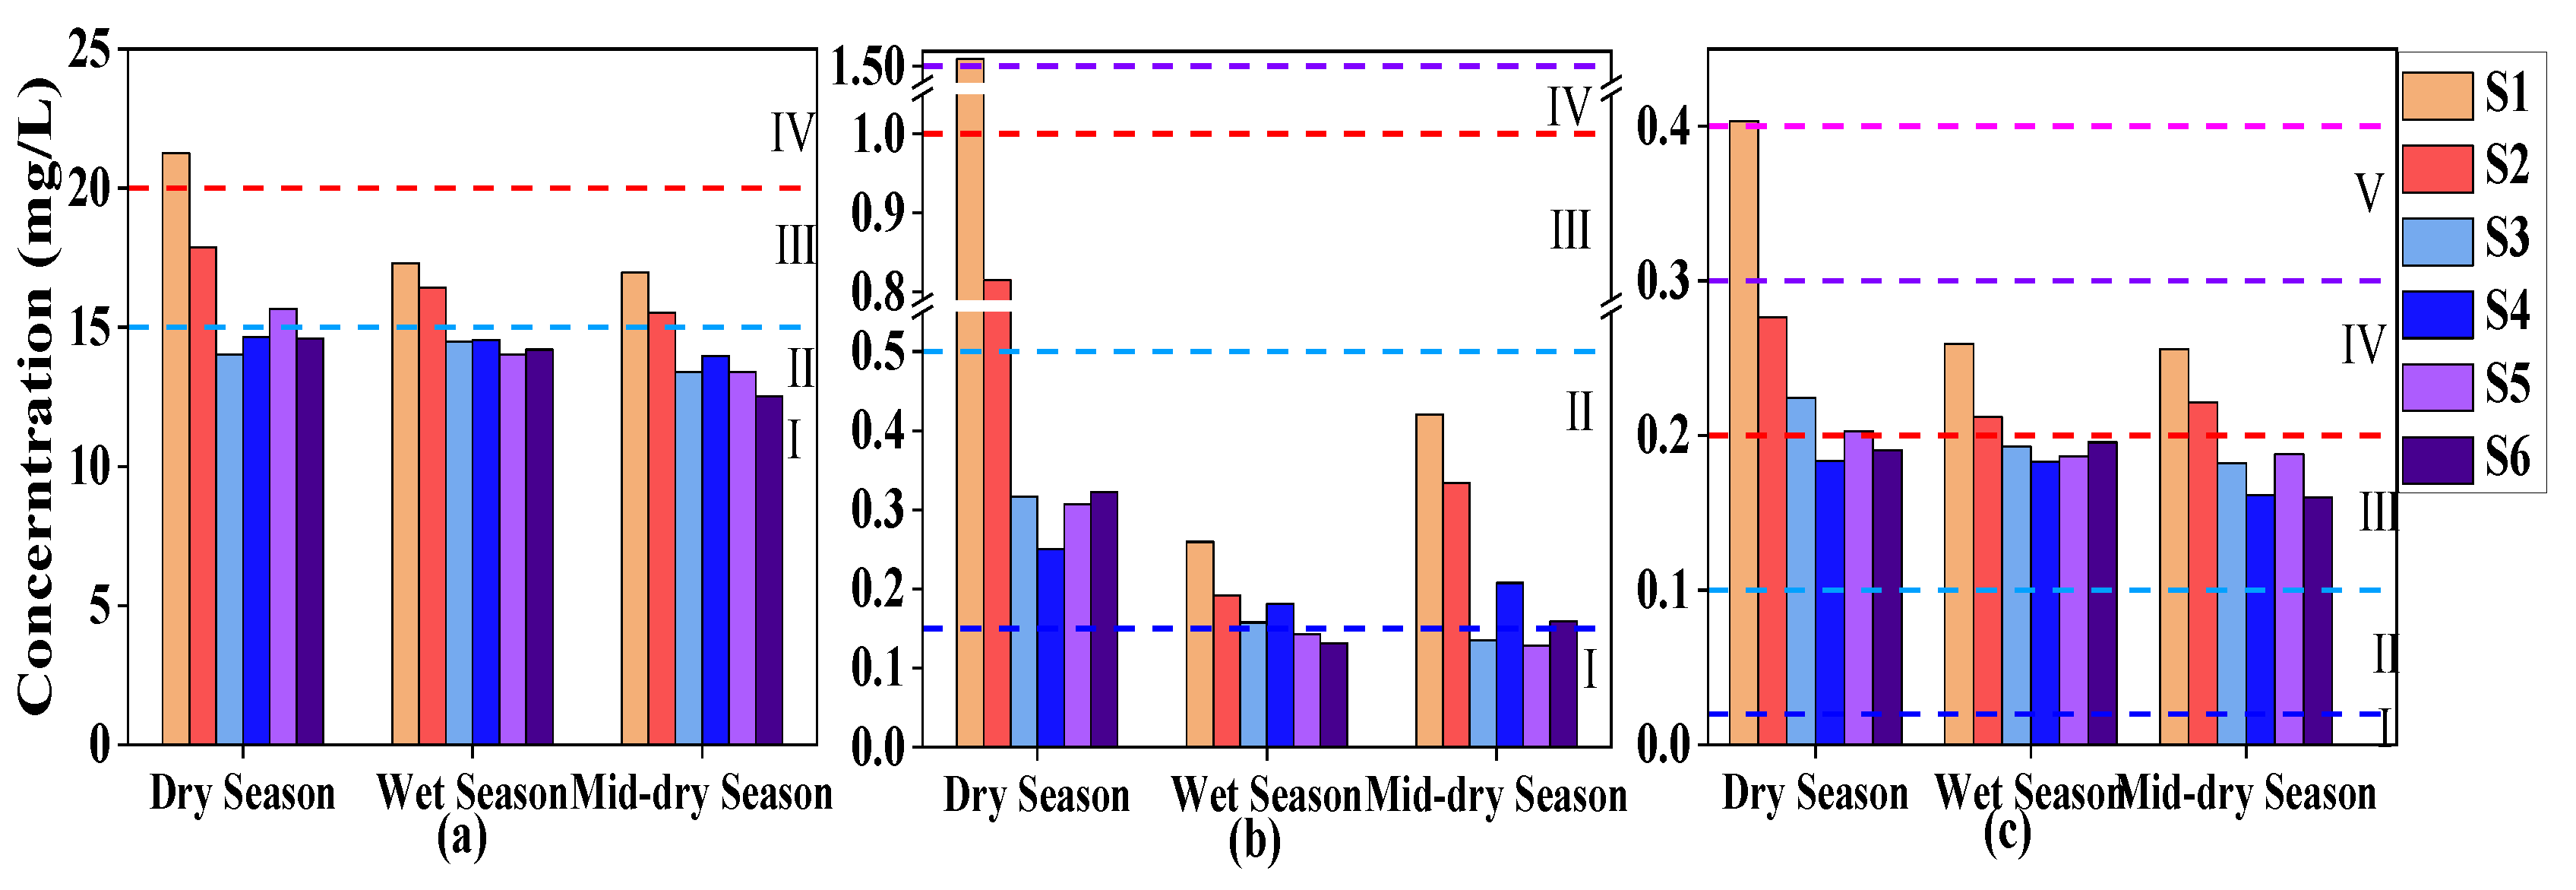
3.2.1. Distribution Characteristics of Pollutants in Sections

The seven-year average over-standard rate of pollutants is shown in Figure 7a. Exceeding the Class III water standard in the Environmental Quality Standard for Surface Water (GB3838-2002) is considered to exceed the standard—that is, COD > 20 mg/L, NH3-N > 1.0 mg/L, TP > 0.2 mg/L. The excess rate is the ratio of the number of months exceeded to the total number of months. The COD exceeding rates of S1–S6 were 7.14%, 6.33%, 2.38%, 0%, 2.38%, and 0%, respectively, and were ranked as S4 = S6 < S5 = S3 < S2 < S1. The NH3-N exceeding rates of S1–S6 were 15.48%, 3.57%, 1.19%, 0%, 0%, and 1.19%, respectively, and were ranked as S4 = S5 < S3 = S6 < S2 < S1. The TP exceeding rates of S1–S6 were 71.43%, 48.10%, 48.81%, 22.62%, 25%, and 23.81%, respectively, and were ranked as S4 < S6 < S5 < S2 < S3 < S1. Particularly, the COD of S4 and S6 and the NH3-N of S4 and S5 did not exceed the standard. Therefore, the quality of COD and NH3-N of S3–S6 was better, and the quality of COD and NH3-N of S1 and S2 was poor. From 2014 to 2020, the average value of COD, NH3-N, and TP of S1–S6 was 15.55 mg/L, 0.31 mg/L, and 0.23 mg/L, respectively. Therefore, the TP in the sections were more serious [5]. After the investigation, the reasons for the serious TP exceeding the standard were found as follows. The TP in the entry water quality was seriously exceeding the standard. A large amount of phosphogypsum was stored irregularly in some areas, and the source of phosphogypsum released a large amount of TP, which seriously polluted the water environment [42,62]. The phosphorus removal technology of urban sewage treatment facilities needed to be transformed and upgraded. After the transformation, the amount of TP pollutants entering the river could be further controlled and reduced.
The annual changes of pollutants in each section are shown in Figure 7b–d. From 2014 to 2020, the average annual total COD values of S1–S6 were 213.91, 204.18, 175.15, 176.74, 183.46, and 165.60 mg/L, respectively (Figure 7b). The average annual total NH3-N values were 7.39, 3.99, 3.53, 2.77, 2.58, and 2.29 mg/L, respectively (Figure 7c). The annual mean values of TP were 3.91, 2.99, 2.61, 2.19, 2.29, and 2.21 mg/L, respectively (Figure 7d). The annual total values of COD, NH3-N, and TP of S1 and S2 were obviously higher in the six sections, and the overall trend was roughly the same, which belonged to imported pollution. From the overall analysis, the annual total value of NH3-N of S1 and S2 was at a turning point in 2017, and the annual total value of TP was at a turning point in 2016. The total amount of major pollutants in S3–S6 generally increased initially and then decreased.
The water-period changes of pollutants in each section are shown in Figure 8. The average values of the pollutant concentrations of the six sections indicated that the COD, NH3-N, and TP concentrations were 16.34, 0.59, and 0.25 mg/L in a typical month of the dry season in March; 14.29, 0.23, and 0.19 mg/L in a typical month of the mid-dry season in November; and 15.16, 0.18, and 0.20 mg/L in a typical month of the wet season in August, respectively. Therefore, the average value of each pollutant in a typical month in the dry season was the highest, and the wet season was similar to the mid-dry season, which was lower than that in the dry season. This finding could be attributed to the increased precipitation within the wet season and the sturdy dilution of rain. In addition, the water temperature was high during the wet season, and the proliferation of microorganisms would degrade pollutants [63].

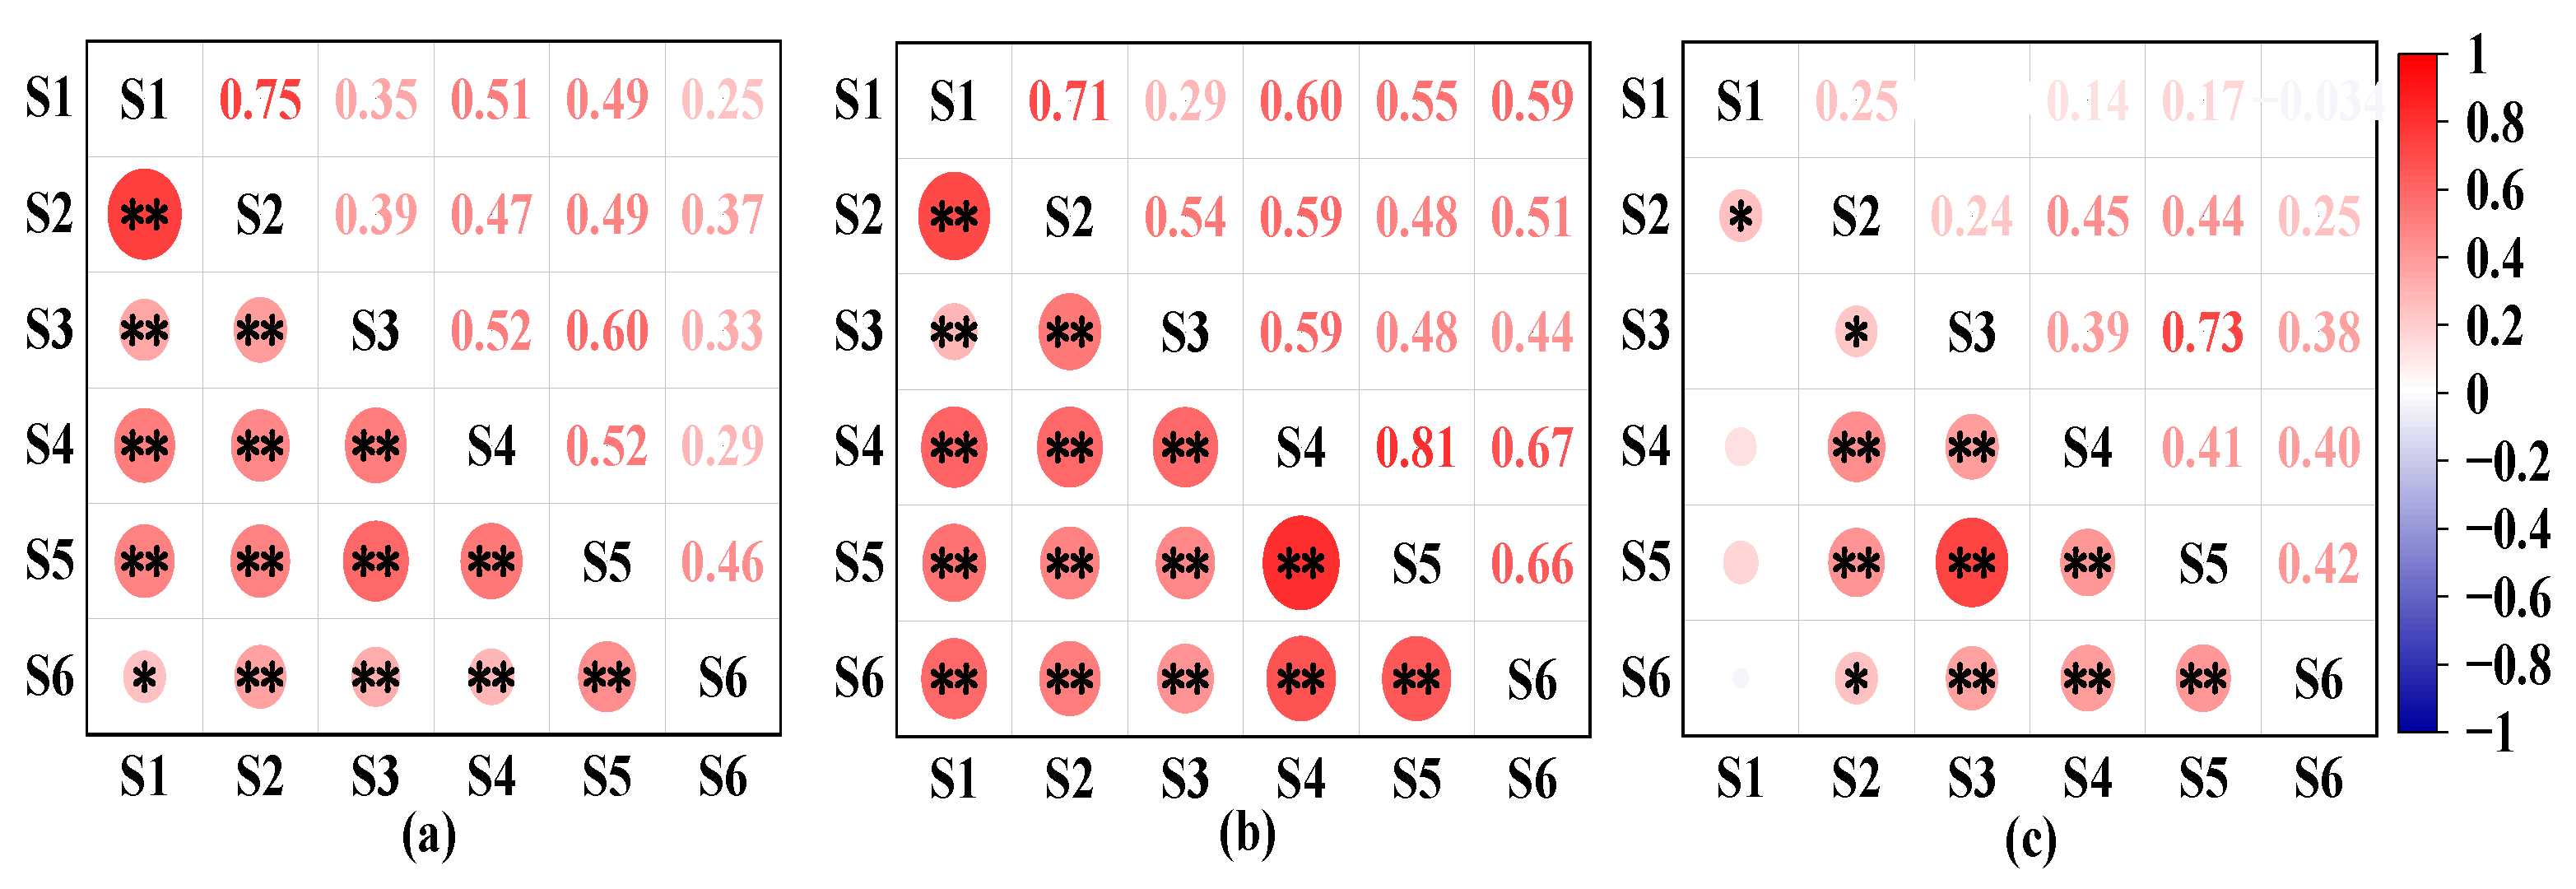
3.2.2. Relationship of Pollutants between Sections

The correlation analysis of pollutants in each section is shown in Figure 9. The NH3-N between the six sections showed significant or extremely significantly positive correlations (Figure 9a). Particularly, the positive correlation between S1 and S2 was the most significant. From the perspective of the flow direction of the river and the spatial distribution of the cross sections, S1 was the only cross-sectional upstream of S2 and was unaffected by other tributary cross sections. Given that the NH3-N of S1 was higher, the correlation degree between the Qiuxi and Falun estuaries was the highest, which also showed that the NH3-N pollution of S2 came from the imported pollution of S1. Extremely significant positive correlations existed between S4 and S3, S5 and S4, and S6 and S5. The correlation between the downstream section and the most adjacent upstream section was high, which indicated that the NH3-N downstream of the mainstream of the Tuojiang River (NJC section) was more susceptible to the upstream influence. In conclusion, the NH3-N pollution in the downstream of the Qiuxi River (NJC section) might have originated from the imported pollution upstream. The NH3-N pollution in the downstream of the mainstream of the Tuojiang River (NJC section) was easily affected by the upstream of the mainstream of the Qiuxi River.
A highly significantly positive correlation existed between the TP monitoring data of the six sections, and the correlation degree was generally higher than those of NH3-N and COD (Figure 9b). Particularly, the correlation degree of TP between S4 and S5 was the highest, and that between S1 and S2 was also higher. Thus, the TP pollution in the lower reaches of the Qiuxi River (NJC section) possibly originated from the imported pollution upstream, and the water quality of the mainstream of the Tuojiang River (NJC section) was greatly affected by the adjacent sections.
A significantly positive correlation of COD existed between S1 and S2 (Figure 9c). This result was consistent with the correlation analysis of NH3-N and TP, indicating that the COD pollution of S2 came from the input pollution of S1. S1 was significantly correlated with S2, but not significantly correlated with the COD of other sections; thus, the downstream section was mostly affected by the adjacent upstream section. A significant positive correlation existed among S2–S6, which indicated that the COD pollution downstream of the mainstream of the Tuojiang River (NJC section) was easily affected by the upstream water quality. Given the long distance between S2 and S6, the correlation strength was relatively weak. S3 is located at the intersection of the Qiuxi River and the mainstream of the Tuojiang River, and the water quality obviously fluctuates. Although S3 was similar to S2 in spatial distance, the correlation between S3 and S2 was not strong.

3.2.3. Correlation Analysis between Pollutants and Industry Indicators

The correlation analysis between pollutants and industry indicators is shown in Figure 10. As shown in Figure 10a, at the p < 0.05 level, NH3-N was positively correlated with indicators for agriculture and forestry. The range of the correlation coefficient was 0.827–0.881, and the order of the correlation degree from small to large was park, woodland, and grassland area (0.827) < cultivated area (0.828) < fertilizer application (0.856) < farm irrigation (0.874) < crop yield (0.881). Thus, the contribution of each pollution source to NH3-N emission was in the order of irrigation pollution > fertilizer pollution. The indicators that were significantly correlated with TP were farm irrigation, fertilizer application, and crop yield, and they all showed a strongly positive correlation. The range of the correlation coefficient was 0.592–0.684, and the correlation degree from small to large was as follows: fertilizer application (0.592) < crop yield (0.660) < farm irrigation (0.684). Hence, the contribution of each pollution source to TP emission was in the order of irrigation pollution > fertilizer pollution. COD had a significantly positive correlation with farm irrigation and crop yield. The range of the correlation coefficient was 0.546–0.576, and the correlation degree from small to large was crop yield (0.546) < farm irrigation (0.576). Thus, irrigation pollution had the greatest influence on COD emissions. Given the continuous improvement of the level of agricultural development, organic or inorganic pollutants, such as nitrogen, phosphorus, and pesticides, enter the surface water, groundwater, and soil environment through surface runoff. Therefore, the agricultural pollution load generated by the basin is also relatively high. All this pollution endangers the environment and the health of the inhabitants [64].
As shown in Figure 10b, at the p < 0.05 level, NH3-N was positively correlated with indicators for animal husbandry and fishery indicators. The range of the correlation coefficient was 0.734–0.940, and the order of the correlation degree from small to large was number of pigs (0.734) < fish breeding (0.811) < number of sheep (0.844) < eggs of poultry (0.849) < number of rabbits (0.916) < number of poultry (0.940). Thus, the contribution of each pollution source to NH3-N emissions was ranked as pollution from livestock and poultry stocks > pollution from fish breeding. Except for fish breeding, which was not significantly correlated with TP, all other indicators were significantly positively correlated with TP. The correlation coefficients ranged from 0.632 to 0.799, and the order of the correlation degree was number of pigs (0.632) < eggs of poultry (0.664) < number of poultry (0.689) < number of sheep (0.756) < number of rabbits (0.799). The number of sheep, poultry, and rabbits were significantly positively correlated with COD, and the correlation coefficient ranged from 0.677 to 0.769 and were ranked as number of sheep (0.677) < number of poultry (0.701) < number of rabbit (0.769).
As shown in Figure 10c, at the level of p < 0.05, NH3-N had a significantly positive correlation with metallurgical building materials, food and beverage, and electric energy in the industrial indicators. The correlation coefficient ranged from 0.536 to 0.680. The order of the correlation degree from small to large was electric energy (0.536) < food and beverage (0.643) < metallurgical building materials (0.680). Thus, the contribution of each pollution source to NH3-N emissions was ranked as metallurgical building materials pollution > food and beverage pollution > electric energy pollution. TP was significantly negatively correlated with electricity, heat, gas, and water production and supply. The correlation coefficient was 0.592. Hence, the metallurgical building materials industry had the greatest impact on TP emissions.
As shown in Figure 10d, at the p < 0.05 level, NH3-N had a highly significantly positive correlation with rural population (0.77), and a highly significantly negative correlation with urban population (−0.75) and per capita GDP (−0.88). TP was significantly negatively correlated with GDP per capita (−0.62). COD was significantly positively correlated with population growth rate (0.55) and extremely significantly negatively correlated with per capita GDP (−0.70). At present, domestic sewage has become one of the most important sources of water pollution in China. The population density of the Tuojiang River Basin is considerably higher than that of other basins; thus, the sewage load generated by urban residents in their lifetime is relatively large [4]. However, the construction of township sewage treatment facilities is not complete, and the collection rate of the pipe network is low. Therefore, sewage treatment facilities and supporting pipe networks in townships and rural gathering points should be improved; and domestic garbage collection, transfer, and treatment systems must be established and improved.
According to the correlation analysis between pollutants and industry indicators, in the order of correlation from strong to weak, NH3-N in the river was correlated with the number of poultry, number of rabbits, crop yield, farm irrigation, fertilizer application, eggs of poultry, number of sheep, cultivated area, park area, woodland area, grassland area, fish breeding, number of pigs, metallurgical building materials, food and beverages, and electric energy. The TP in the river was correlated with the number of rabbits; number of sheep; number of poultry; farm irrigation; eggs of poultry; crop yield; number of pigs; electricity, heat, gas, and water production and supply; and fertilizer application. The COD in the river was correlated with the number of rabbits, number of poultry, number of sheep, farm irrigation, and crop yield. In conclusion, the concentrations of NH3-N, TP, and COD in the river were mainly related to stock breeding and farmland irrigation.

4. Conclusions

This paper investigated the water environment quality evaluation and pollution source analysis in the Tuojiang River (NJC section) from 2015 to 2019. The results showed a general decline in grey water footprint and also the improvement of water environment quality. Significant variations were determined within the proportion of pollutants in GWFTotal, and GWFTP accounted for the largest proportion; thus, the grey water footprint was GWFTP. The main sources of GWFCOD, GWFNH3-N, and GWFTP were agricultural pollution. The proportion of agricultural pollution in GWFCOD and GWFNH3-N decreased mainly due to the reduction in livestock breeding. The proportion of agricultural pollution in GWFTP increased, which was mainly due to the increase in the area of farm irrigation. The economic development level and water environment of the Tuojiang River (NJC section) were generally in a high-quality coordination state, indicating that the economic development level was relatively high and the damage to the water environment was relatively low. The pollutants exceeding the standard in typical sections were concentrated in the dry season, and the highest rate of TP exceeded the standard. The correlation analysis of the main pollutants showed that the source of pollutants within the Tuojiang River were imported pollution, stock breeding pollution, and farmland irrigation pollution.
In response to the matter of water environment quality and pollution source, the main target is controlling agricultural pollution and upstream imported pollution. To control agricultural source pollution, attention should be given to the problem of direct discharge of wastewater from farms that do not meet the standards. Abuse of chemical fertilizers and pesticides in agricultural production should be avoided, and efficient fertilization and irrigation technology must be promoted. Sewage treatment facilities at township gathering points should also be improved. In view of the problem of upstream input pollution, the pollution discharge problem of upstream phosphogypsum factories should be given attention.

Author Contributions

Conceptualization, K.Z. and S.W.; methodology, K.Z., S.W. and S.L.; software, S.W.; validation, K.Z. and S.W.; formal analysis, S.W. and S.L.; investigation, K.L., J.Y. and X.L.; resources, K.Z. and S.W.; data curation, K.Z. and S.W.; writing—original draft preparation, K.Z. and S.W.; writing—review and editing, K.Z. and S.W.; visualization, K.L.; supervision, J.Y.; project administration, X.L.; funding acquisition, K.Z. All authors have read and agreed to the published version of the manuscript.

Funding

This research was funded by The Xinjiang Talent Introduction Program (2020), the National Natural Science Foundation of China, grant number 42177037, and the Science and Technology and Technology Innovation Projects of Shenhua Shendong Coal Group, grant number 202016000041.

Institutional Review Board Statement

Not applicable.

Informed Consent Statement

Not applicable.

Data Availability Statement

Publicly available datasets were analyzed in this study. This data can be found here: https://www.neijiang.gov.cn/.

Acknowledgments

We acknowledge all the authors for their contributions. We sincerely thank the anonymous reviewers and the editor for their effort to review this manuscript.

Conflicts of Interest

The authors declare no conflict of interest.

References

  1. Tian, Y.; Sun, C. Comprehensive carrying capacity, economic growth and the sustainable development of urban areas: A case study of the Yangtze River economic belt. J. Clean. Prod. 2018, 195, 486–496. [Google Scholar] [CrossRef]
  2. Que, S.S.; Luo, H.Y.; Wang, L.; Zhou, W.Q.; Yuan, S.C. Canonical correlation study on the relationship between shipping development and water environment of the Yangtze River. Sustainability 2020, 12, 3279. [Google Scholar] [CrossRef] [Green Version]
  3. Chen, Y.S.; Zhang, S.H.; Huang, D.S.; Li, B.L.; Liu, J.G.; Liu, W.J.; Ma, J.; Wang, F.; Wang, Y.; Wu, S.J.; et al. The development of China’s Yangtze River Economic Belt: How to make it in a green way? Sci. Bull. 2017, 62, 648–651. [Google Scholar] [CrossRef] [Green Version]
  4. Liu, D.D.; Bai, L.; Qiao, Q.; Zhang, Y. Anthropogenic total phosphorus emissions to the Tuojiang River Basin, China. J. Clean. Prod. 2021, 294, 126325. [Google Scholar] [CrossRef]
  5. Zhang, W.Q.; Jin, X.; Cao, H.M.; Zhao, Y.; Shan, B.Q. Water quality in representative Tuojiang river network in southwest China. Water 2018, 10, 864. [Google Scholar] [CrossRef] [Green Version]
  6. Zhou, G.Y.; Wang, Q.G.; Zhang, J.; Li, Q.S.; Wang, Y.Q.; Wang, M.J.; Huang, X. Distribution and characteristics of microplastics in urban waters of seven cities in the Tuojiang River basin, China. Environ. Res. 2020, 189, 109893. [Google Scholar] [CrossRef]
  7. Kumar, V.; Parihar, R.D.; Sharma, A.; Bakshi, P.; Sidhu, G.P.S.; Bali, A.S.; Karaouzas, L.; Bhardwaj, R.; Thukral, A.K.; Gyasi-Agyei, Y.; et al. Global evaluation of heavy metal content in surface water bodies: A meta-analysis using heavy metal pollution indices and multivariate statistical analyses. Chemosphere 2019, 236, 124364. [Google Scholar] [CrossRef] [PubMed]
  8. Fan, C.Z.; Liu, Y.B.; Liu, C.H.; Zhao, W.B.; Hao, N.X.; Guo, W.; Yuan, J.H.; Zhao, J.J. Water quality characteristics, sources, and assessment of surface water in an industrial mining city, southwest of China. Environ. Monit. Assess. 2022, 194, 259. [Google Scholar] [CrossRef]
  9. Maier, H.R.; Dandy, G.C. Neural networks for the prediction and forecasting of water resources variables a review of modelling issues and applications. Environ. Modell. Softw. 2000, 15, 101–124. [Google Scholar] [CrossRef]
  10. Jang, D.; Choi, G. Estimation of Non-Revenue Water Ratio for Sustainable Management Using Artificial Neural Network and Z-Score in Incheon, Republic of Korea. Sustainability 2017, 9, 1933. [Google Scholar] [CrossRef] [Green Version]
  11. Tharme, R.E. A global perspective on environmental flow assessment: Emerging trends in the development and application of environmental flow methodologies for rivers. River Res. Appl. 2003, 19, 397–441. [Google Scholar] [CrossRef]
  12. Xia, X.H.; Zhang, X.; Yang, Z.F.; Shen, Z.Y.; Dong, L.I. Integrated water quality and quantity evaluation of the Yellow River. J. Nat. Resour. 2004, 19, 293–299. [Google Scholar] [CrossRef]
  13. Wang, X.Q.; Liu, C.M.; Zhang, Y. Water quantity/quality combined evaluation method for rivers’ water requirements of the instream environmental flow in dualistic water cycle: A case study of Liaohe river basin. J. Geogr. Sci. 2007, 3, 304–316. [Google Scholar] [CrossRef]
  14. Hoekstra, A.Y.; Mekonnen, M.M. The water footprint of humanity. Proc. Nat. Acad. Sci. USA 2012, 109, 3232–3237. [Google Scholar]
  15. Ansorge, L.; Stejskalová, L.; Dlabal, J. Grey water footprint as a tool for implementing the Water Framework Directive-Temelín nuclear power station. J. Clean. Prod. 2020, 263, 121541. [Google Scholar] [CrossRef]
  16. Miglietta, P.P.; Toma, P.; Fanizzi, F.P.; De Donno, A.; Coluccia, B.; Migoni, D.; Bagordo, F.; Serio, F. A Grey Water Footprint Assessment of Groundwater Chemical Pollution: Case Study in Salento (Southern Italy). Sustainability 2017, 9, 799. [Google Scholar]
  17. Allocca, V.; Marzano, E.; Tramontano, M.; Celico, F. Environmental impact of cattle grazing on a karst aquifer in the southern Apennines (Italy): Quantification through the grey water footprint. Ecol. Indic. 2018, 93, 830–837. [Google Scholar]
  18. Hu, Y.C.; Huang, Y.F.; Tang, J.X.; Gao, B.; Yang, M.H. Evaluating agricultural grey water footprint with modeled nitrogen emission data. Resour. Conserv. Recycl. 2018, 138, 64–73. [Google Scholar]
  19. Muratoglu, A. Grey water footprint of agricultural production: An assessment based on nitrogen surplus and high-resolution leaching runoff fractions in Turkey. Sci. Total Environ. 2020, 742, 140553. [Google Scholar] [PubMed]
  20. Zhao, D.D.; Tang, Y.; Liu, J.G.; Tillotson, M.R. Water footprint of Jing-Jin-Ji urban agglomeration in China. J. Clean. Prod. 2017, 167, 919–928. [Google Scholar]
  21. Johnson, M.B.; Mehrvar, M. An assessment of the grey water footprint of winery wastewater in the Niagara region of Ontario, Canada. J. Clean. Prod. 2019, 214, 623–632. [Google Scholar] [CrossRef]
  22. Ma, X.T.; Yang, D.L.; Shen, X.X.; Zhai, Y.J.; Zhang, R.R.; Hong, J.L. How much water is required for coal power generation: An analysis of gray and blue water footprints. Sci. Total Environ. 2018, 636, 547–557. [Google Scholar] [CrossRef] [PubMed]
  23. Martinez-Alcala, I.; Pellicer-Martinez, F.; Fernandez-Lopez, C. Pharmaceutical grey water footprint: Accounting, influence of wastewater treatment plants and implications of the reuse. Water Res. 2018, 135, 278–287. [Google Scholar] [CrossRef] [PubMed]
  24. Cai, B.; Liu, B.; Zhang, B. Evolution of Chinese urban household’s water footprint. J. Clean. Prod. 2019, 208, 1–10. [Google Scholar] [CrossRef]
  25. Chukalla, A.D.; Krol, M.S.; Hoekstra, A.Y. Trade-off between blue and grey water footprint of crop production at different nitrogen application rates under various field management practices. Sci. Total Environ. 2018, 626, 962–970. [Google Scholar] [CrossRef] [Green Version]
  26. Mekonnen, M.M.; Hoekstra, A.Y. Global gray water footprint and water pollution levels related to anthropogenic nitrogen loads to fresh water. Environ. Sci. Technol. 2015, 49, 12860–12868. [Google Scholar] [CrossRef]
  27. Mekonnen, M.M.; Lutter, S.; Martinez, A. Anthropogenic nitrogen and phosphorus emissions and related grey water footprints caused by EU-27′s crop production and consumption. Water 2016, 8, 30. [Google Scholar] [CrossRef] [Green Version]
  28. Shrestha, S.; Pandey, V.P.; Chanamai, C.; Ghosh, D.K. Green, blue and grey water footprints of primary crops production in Nepal. Water Resour. Manag. 2014, 27, 5223–5243. [Google Scholar] [CrossRef]
  29. Wan, L.Y.; Cai, W.J.; Jiang, Y.K.; Wang, C. Impacts on quality-induced water scarcity: Drivers of nitrogen-related water pollution transfer under globalization from 1995 to 2009. Environ. Res. Lett. 2016, 11, 074017. [Google Scholar] [CrossRef]
  30. Li, H.; Liu, G.Y.; Yang, Z.F. Improved gray water footprint calculation method based on a mass-balance model and on fuzzy synthetic evaluation. J. Clean. Prod. 2019, 219, 377–390. [Google Scholar] [CrossRef]
  31. Feng, H.; Sun, F.; Liu, Y.; Zeng, P.; Che, Y. Mapping multiple water pollutants across China using the grey water footprint. Sci. Total Environ. 2021, 785, 147255. [Google Scholar] [CrossRef] [PubMed]
  32. Jiao, S.X.; Wang, A.Z.; Chen, L.F.; Chen, J.W.; Zhang, X.X.; Zhao, R.Q.; Zhang, C.C. Study on the decoupling relationship between the economic development and water environment in Henan province based on the grey water footprint theory. Innov. Sci. Technol. 2018, 18, 32–36. [Google Scholar]
  33. Lertpaitoonpan, W.; Ong, S.; Moorman, T. Effect of organic carbon and pH on soil sorption of sulfamethazine. Chemosphere 2009, 76, 558–564. [Google Scholar] [CrossRef]
  34. Zhang, K.; Gao, J.; Jiang, B.; Han, J.; Chen, M. Experimental study on the mechanism of water-rock interaction in the coal mine underground reservoir. Meitan Xuebao 2019, 44, 3760–3772. [Google Scholar]
  35. Guo, Y.Z.; Wang, X.Y.; Zhou, L.; Melching, C.; Li, Z.Q. Identification of Critical Source Areas of Nitrogen Load in the Miyun Reservoir Watershed under Different Hydrological Conditions. Sustainability 2020, 12, 964. [Google Scholar] [CrossRef] [Green Version]
  36. Zhang, K.; Li, X.N.; Song, Z.Y.; Yan, J.Y.; Chen, M.Y.; Yin, J.C. Human health risk distribution and safety threshold of Cadmium in soil of coal chemical industry area. Minerals 2021, 11, 678. [Google Scholar] [CrossRef]
  37. Li, J.; Zhang, H.; Chen, Y.; Luo, Y.; Zhang, H. Sources identification of antibiotic pollution combining land use information and multivariate statistics. Environ. Monit. Assess. 2016, 188, 430. [Google Scholar] [CrossRef] [PubMed]
  38. Ji, X.N.; Chen, J.H.; Guo, Y.L. A Multi-Dimensional Investigation on Water Quality of Urban Rivers with Emphasis on Implications for the Optimization of Monitoring Strategy. Sustainability 2022, 14, 4174. [Google Scholar] [CrossRef]
  39. Li, L.; Liu, D.; Zhang, Q.; Song, K.; Zhou, X. Occurrence and ecological risk assessment of selected antibiotics in the freshwater lakes along the middle and lower reaches of Yangtze River Basin. J. Environ. Manag. 2019, 249, 109396. [Google Scholar] [CrossRef]
  40. Zhang, K.; Zheng, X.H.; Li, X.N.; Li, J.H.; Ji, Y.N.; Gao, H. The pollution assessment and source analysis of groundwater in a region of southwest China. J. Henan Norm. Univ. (Nat. Sci. Ed.) 2020, 48, 64–73. [Google Scholar]
  41. Kang, W.; Lin, Z.; Zhang, R. Impact of phosphate mining and separation of mined materials on the hydrology and water environment of the Huangbai River basin, China. Sci. Total Environ. 2016, 543, 347–356. [Google Scholar]
  42. Zhang, M.; Chen, X.L.; Yang, S.H.; Song, Z.; Wang, Y.G.; Yu, Q. Basin-scale pollution loads analyzed based on coupled empirical models and numerical models. Int. J. Environ. Res. Public Health 2021, 18, 12481. [Google Scholar] [CrossRef] [PubMed]
  43. Zeng, Z.; Luo, W.G.; Wang, Z.; Yi, F.C. Water pollution and its causes in the Tuojiang river basin, China: An artificial neural network analysis. Sustainability 2021, 13, 792. [Google Scholar] [CrossRef]
  44. Wu, B.; Zeng, W.H.; Chen, H.H.; Zhao, Y. Grey water footprint combined with ecological network analysis for assessing regional water quality metabolism. J. Clean. Prod. 2016, 112, 3138–3151. [Google Scholar] [CrossRef]
  45. Ang, B.W. Decomposition analysis for policymaking in energy: Which is the preferred method? Energy Policy 2004, 32, 1131–1139. [Google Scholar] [CrossRef]
  46. Li, J.; Hou, L.P.; Wang, L.; Tang, L.N. Decoupling Analysis between Economic Growth and Air Pollution in Key Regions of Air Pollution Control in China. Sustainability 2021, 13, 6600. [Google Scholar] [CrossRef]
  47. Cahill, S.A. Calculating the rate of decoupling for crops under cap/oilseeds reform. J. Agric. Econ. 1997, 48, 349–378. [Google Scholar] [CrossRef]
  48. Tapio, P. Towards a theory of decoupling: Degrees of decoupling in the EU and the case of road traffic in Finland between 1970 and 2001. Transp. Policy 2005, 12, 137–151. [Google Scholar] [CrossRef] [Green Version]
  49. Vehmas, J.; Luukkanen, J.; Kaivo-Oja, J. Linking analyses and environmental Kuznets curves for aggregated material flows in the EU. J. Clean. Prod. 2007, 15, 1662–1673. [Google Scholar] [CrossRef]
  50. Her, Q.L.; Wong, J. Significant correlation versus strength of correlation. Am. J. Health-Syst. Pharm. 2020, 77, 73–75. [Google Scholar] [CrossRef] [Green Version]
  51. Schober, P.; Boer, C.; Schwarte, L.A. Correlation coefficients: Appropriate use and interpretation. Anesth. Analg. 2018, 126, 1763–1768. [Google Scholar] [CrossRef] [PubMed]
  52. Edelmann, D.; Mori, T.F.; Szekely, G.J. On relationships between the Pearson and the distance correlation coefficients. Stat. Probab. Lett. 2021, 169, 108960. [Google Scholar] [CrossRef]
  53. Cui, S.B.; Dong, H.J.; Wilson, J. Grey water footprint evaluation and driving force analysis of eight economic regions in China. Environ. Sci. Pollut. Res. 2020, 27, 20380–20391. [Google Scholar] [CrossRef] [PubMed]
  54. Jamshidi, S.; Imani, S.; Delavar, M. An approach to quantifying the grey water footprint of agricultural productions in basins with impaired environment. J. Hydrol. 2022, 606, 127458. [Google Scholar] [CrossRef]
  55. Hu, Y.Y.; Wang, Y.D.; Li, T.X.; Zheng, Z.C.; Pu, Y. Characteristics analysis of agricultural non-point source pollution on Tuojiang River basin. Sci. Agric. Sin. 2015, 48, 3654–3665. [Google Scholar]
  56. Yao, J.; Yang, L.J.; Xiao, Y.T.; Fan, M.; Zhan, S.; Liu, Y.F.; Wang, H.W.; Chen, W.; Deng, Y.; Wang, M.L. Spatial-temporal evolution of agricultural non-point sources of total phosphorus pollution loads in Tuojiang River watershed based on correction of social-economic factors. J. Agro-Environ. Sci. 2022, 41, 1022–1035. [Google Scholar]
  57. Meng, W.; Feagin, R.A. Mariculture is a double-edged sword in China. Estuar. Coast. Shelf Sci. 2019, 222, 147–150. [Google Scholar] [CrossRef]
  58. Cai, C.F.; Gu, X.H.; Ye, Y.T.; Yang, C.G.; Dai, X.Y.; Chen, D.X.; Yang, C. Assessment of pollutant loads discharged from aquaculture ponds around Taihu Lake, China. Aquac. Res. 2011, 44, 795–806. [Google Scholar] [CrossRef]
  59. Wang, H.; Xu, Y.L.; Zhang, Q.; Lin, C.W.; Zhai, L.M.; Liu, H.T.; Pu, B. Emission characteristics of nitrogen and phosphorus in a typical agricultural small watershed in Tuojiang river basin. Environ. Sci. 2020, 41, 4547–4554. [Google Scholar]
  60. Cao, Y. Analysis of water quality of backwater of farmland irrigation and its influence on examination section. Environ. Sci. Technol. 2021, 34, 67–71. [Google Scholar]
  61. Zhang, K.; Bai, L.; Wang, P.F.; Zhu, Z. Field measurement and numerical modelling study on mining-induced subsidence in a typical underground mining area of northwestern China. Adv. Civ. Eng. 2021, 2021, 5599925. [Google Scholar] [CrossRef]
  62. Zhang, K.; Gao, J.; Men, D.; Zhao, X.; Wu, S. Insight into the heavy metal binding properties of dissolved organic matter in mine water affected by water-rock interaction of coal seam goaf. Chemosphere 2021, 265, 129134. [Google Scholar] [CrossRef] [PubMed]
  63. Ma, Y.Q.; Qin, Y.W.; Zheng, B.H.; Zhang, L.; Zhao, Y.M. Seasonal variation of enrichment, accumulation and sources of heavy metals in suspended particulate matter and surface sediments in the Daliao river and Daliao river estuary, Northeast China. Environ. Earth Sci. 2015, 73, 5107–5117. [Google Scholar] [CrossRef]
  64. Li, S.P.; Gong, Q.X.; Yang, S.L. Analysis of the agricultural economy and agricultural pollution using the decoupling index in Chengdu, China. Int. J. Environ. Res. Public Health 2019, 16, 4233. [Google Scholar] [CrossRef] [PubMed] [Green Version]
Figure 1. Geographical location of study areas.
Sustainability 14 09219 g001
Figure 2. GWFTotal (a), GWFCOD (b), GWFNH3-N (c) and GWFTP (d) of cities and counties.
Sustainability 14 09219 g002
Figure 3. Pollution sources of GWFCOD (a), GWFNH3-N (b), and GWFTP (c).
Sustainability 14 09219 g003
Figure 4. The proportion of pollution sources of GWFTotal (a), GWFCOD (b), GWFNH3-N (c), and GWFTP (d).
Sustainability 14 09219 g004
Figure 5. Specific sources of agricultural pollution for GWFCOD (a), GWFNH3-N (b), and GWFTP (c).
Sustainability 14 09219 g005
Figure 6. The decoupling of water environment quality and economic development.
Sustainability 14 09219 g006
Figure 7. Average over-standard rate (a), annual changes of COD (b), NH3-N (c), and TP (d) in each section.
Sustainability 14 09219 g007
Figure 8. The water-period changes of COD (a), NH3-N (b), and TP (c) in each section (I–V represented the Class I–V water standard in the Environmental Quality Standard for Surface Water (GB3838-2002)).
Sustainability 14 09219 g008
Figure 9. The correlation analysis of NH3-N (a), TP (b), and COD (c) (* p ≤ 0.05, ** p ≤ 0.01).
Sustainability 14 09219 g009
Figure 10. The correlations between pollutants and industry indicators. Industry indicators include agriculture and forestry (a), animal husbandry and fishery (b), industry (c), and population economy (d). (* p ≤ 0.05, ** p ≤ 0.01).
Sustainability 14 09219 g010
Table 1. List of typical monitoring sections.
Monitoring Section NameNumberSection Properties
Falun estuaryS1Entry section
Qiuxi estuaryS2Section of the estuary entering the Tuojiang River
ShunhechangS3Entry section
Yinshan TownS4control section
Gaosi ferryS5control section
LaomutanS6Exit section
Publisher’s Note: MDPI stays neutral with regard to jurisdictional claims in published maps and institutional affiliations.

