Article

State-Level Urban Agglomeration and Enterprise Innovation: A Quasi-Natural Experiment

1
School of Economics, Qingdao University, Qingdao 266071, China
2
School of Statistics, Huaqiao University, Xiamen 361021, China
3
College of Architecture and Urban Planning, Qingdao University of Technology, Qingdao 266033, China
*
Author to whom correspondence should be addressed.
Sustainability 2022, 14(15), 9170; https://doi.org/10.3390/su14159170
Submission received: 25 June 2022 / Revised: 22 July 2022 / Accepted: 24 July 2022 / Published: 26 July 2022

Abstract

:
Based on the data of listed enterprises in China from 2007 to 2019, this study uses the quasi-natural experiment method (staggered DID) to explore the actual impact of the establishment of state-level urban agglomeration on the innovation activities of enterprises and the heterogeneous impact caused by regional differences. It is found that state-level urban agglomerations play the role of “incubator” for enterprise innovation, and the establishment of urban agglomerations can not only effectively encourage enterprises to increase R&D investment, but also greatly increase the quantity of innovation output of enterprises. It is worthwhile to note that the establishment of state-level urban agglomerations has no significant impact on R&D investment and the innovation output of enterprises in the eastern region. As far as the western region is concerned, the incentive effect of the establishment of urban agglomeration on the innovation output of enterprises is significantly positive at 1% significance level, while the incentive effect on the R&D investment of enterprises is positive but not statistically significant.

1. Introduction

Economic globalization and regional integration require countries to strengthen the development of urban agglomeration, which has become the most important modern economic development mode. The top 40% of the world’s urban agglomerations contribute 66% of the global economy and 85% of scientific and technological innovations. “First experimenting and then spreading” is the consistent thinking of China’s central and local governments to promote various reforms. As a creative achievement to promote China’s economic development and accelerate the urbanization process, the exploration and practice of urban agglomeration construction is surpassing the national and administrative boundaries and becoming a “node” connecting the global economy.
Under the background of economic globalization and regional integration, the importance of innovation is self-evident. No matter the country, region or even the enterprise, the economic competitive advantage comes from constantly improving innovation ability. Although some new global problems (i.e., epidemic of COVID-19, Sino-US trade friction) have changed the external environment in recent years, innovation is still the key to gain competitive advantage and promote high-quality development [1]. Enterprises are the main body of innovation and their innovation ability is often rooted in a specific innovation environment. The establishment of urban agglomeration provides the possibility for enterprises to gather innovation resources, improve innovation output and ameliorate innovation efficiency.
In recent years, China has successively promulgated a number of measures to promote the development of state-level urban agglomerations, realizing a new trend of economic growth driven by innovation. These measures emphasize the need to ameliorate the efficient allocation and strengthen innovation vitality by establishing the coordination mechanism of urban agglomeration development. As a regional unit participating in global competition and the international division of labor, the state-level urban agglomeration is an important carrier of China’s sustainable economic development [2]. Enterprise innovation, as a solid foundation of the innovation-driven strategy, is an indispensable element to promote China’s sustainable economic development. In the transitional period when China’s economy is changing from high-speed growth to high-quality development, it is of great importance to clarify the relationship between urban agglomeration construction and enterprise innovation, and to accurately evaluate the implementation effect of the policy “state-level urban agglomeration establishment” in promoting the R&D investment and innovation output of enterprises. This is not only beneficial to enrich the theory of spatial political economy [3], but also to construct the analysis framework and internal logic of the linkage between urban agglomeration construction and enterprise innovation, which has certain enlightenment to future regional high-quality development.
Since the establishment of China’s first state-level urban agglomeration in 2004, the State Council has successively approved 11 state-level urban agglomerations such as Pearl River Delta, Beijing-Tianjin-Hebei and Yangtze River Delta. The establishment of these urban agglomerations has played an important and positive role in promoting China’s regional coordinated development and industrial cluster radiation. However, the role in leading innovation, especially in promoting the R&D activities of enterprises, has not been clearly demonstrated.
The effect of state-level urban agglomeration establishment on enterprise innovation is not clear. On the one hand, there is a lack of discussion on the mechanism of urban agglomeration affecting enterprise innovation, due to insufficient academic attention; on the other hand, it is difficult to design a reasonable policy identification strategy, due to the different time and long span of the establishment of urban agglomerations. Therefore, we tried to build a quasi-natural experiment based on the policy event that the State Council approved the establishment of state-level urban agglomerations. Using the data of China’s listed companies from 2007 to 2019, we investigated the actual impact of state-level urban agglomeration establishment on enterprise activities from the perspective of R&D investment and innovation output and explored the regional heterogeneity of urban agglomeration.
This study is structured and organized as follows. Section 2 is a literature review. Section 3 discusses the research design. Section 4 describes the research data. Section 5 discusses the main findings and some validity tests. Section 6 conducts the discussion about the regional heterogeneity of urban agglomerations. Finally, conclusions are drawn in Section 7.

2. Literature Review

2.1. Urban Agglomeration

Urban agglomeration, which can break the barriers of administrative boundaries, is the most dynamic and potential growth pole of future economic development. The literature on urban agglomeration can be roughly divided into three stages: the initial stage, the developing stage, and the mature stage.
At the initial stage, scholars focus on the agglomeration form of “city-industry” and try to explore the geographical scope of external economic operation [4]. The related research in this stage is mainly to investigate the formation process, population flow patterns and industrial cluster types of urban agglomerations in the northeastern United States and Europe based on qualitative methods and case studies [5,6]. At the developing stage, scholars pay attention to the development of urban agglomeration caused by urban network and urban cooperation. It is confirmed that urban expansions not only lead to regional fragmentation, but also generate new regional associations, and the huge spatial scale will help to form new regional networks and spatial associations across metropolitan areas [7]. The study of urban agglomeration in this stage changes from qualitative to quantitative models, and the cellular automata simulation, the multiple linear regression and the gravity model become analytical tools to study the evolution of urban agglomeration [8,9,10]. In addition, the night-light data and the traffic data are more and more widely used in urban agglomeration studies [11,12]. With the development of urbanization and urban agglomeration, the evaluation and the mechanism analysis of the sustainable development of the economy and environment become the center of attention, and research on urban agglomeration enters a mature stage. Many empirical studies evaluate the development benefits of urban agglomerations from the perspective of economic efficiency. These studies mainly include building an empirical framework of spatial structure affecting the economic efficiency of urban agglomeration [13]; discussing the spatial scale conditions of urban agglomeration scale benefit [14], evaluating the policy performance of establishing urban agglomeration [15] and exploring the relationship between urban agglomeration spatial integration and industrial coordinated development [16]. Furthermore, the development of urban agglomeration inevitably involves resource consumption and environmental pollution. Therefore, in recent years, more and more scholars have paid attention to the environmental efficiency of urban agglomeration, trying to find a balance between the ecological environment and economic development to promote the green development of urban agglomeration. For example, to assess the spatial change and ecological risk of wetlands in the Beijing–Tianjin–Hebei urban agglomeration [17], reveal the pattern and mechanism of air pollution of urban agglomeration [18], and evaluate the intensity of energy consumption [19].
Research on China’s urban agglomeration mainly involves three aspects: first, the horizontal comparison of the development of urban agglomerations [20] and longitudinal spatio-temporal evolution analysis [21]; second, the scheme optimization and adjustment of urban agglomeration construction [22]; third, the impact of urban agglomeration on economic development, culture [23], ecological environment [24] and ecological efficiency [25]. Scholars mainly investigate the effects of China’s urban agglomeration from macro and meso perspectives. Firstly, from the macro perspective, Yu and Zhao [26] take the Yangtze River Delta, Beijing–Tianjin–Hebei and other urban agglomerations in China as examples and discuss the promoting effect of urban agglomeration construction on China’s regional development. Zhang et al. [27] focus on the Yangtze River Delta’s urban agglomeration and explore the actual impact of urban agglomeration on high-quality economic development. Secondly, from the meso perspective, Zhang et al. [28] confirm that the Yangtze River Delta urban agglomeration can promote regional labor productivity but inhibit regional market segmentation. Li et al. [29] found that the Yangtze River Delta urban agglomeration significantly promotes the efficiency change and the technology change of the Yangtze River Economic Belt; however, the impact of urban agglomeration on total factor productivity is not obvious.

2.2. Determinants of Enterprise Innovation

The determinants of enterprise innovation can be roughly divided into internal factors and external factors. The former mainly involves enterprise scale, ownership structure, and characteristics of executives; the latter involves policy environment, financial environment, and the legal environment.

2.2.1. Internal Factors

The relationship between enterprise innovation and enterprise scale can be roughly divided into positive [30], negative [31], and nonlinear views [32]. Enterprises with different ownership have differences in policy support, business environment and financing channels, which will lead to differences in innovation behaviors of enterprises [33]. Compared with state-owned enterprises, non-state-owned enterprises such as private enterprises, show stronger innovation power [34]. Executives are the decision makers and implementers of enterprise innovation, and the characteristics of executives have an obvious influence on enterprise innovation [35,36]. The existing research mainly examines the relationship between the characteristics of executives and enterprise innovation from the perspective of executive compensation [37], executive background [38], executive competence [39], executive change [40], gender of executives [41], and executive ownership structure [42].

2.2.2. External Factors

Enterprise innovation is not only influenced by internal factors, but also by external factors. There are many studies on the relationship between the R&D subsidy policy and enterprise innovation. On a theoretical basis, both an optimistic and skeptical view of the R&D subsidy can be supported [43]. Nevertheless, no consistent conclusions have been reached on an empirical basis [44]. The opinions held by scholars are mainly divided into “crowding-in effect” [45], “crowding-out effect” [46], “non-linear effect” [47], and “dynamic effect” [48]. Similar to the R&D subsidy, there is no consensus on the relationship between tax incentive and enterprise innovation, which can be roughly divided into three categories: “incentive effect” [49], “inhibiting effect” [50], and “moderate interval” [51]. Policy uncertainty is also an important factor affecting enterprise innovation [52,53]. Bhattacharya et al. [54] confirm that compared with the policy itself, policy uncertainty has a greater impact on enterprise innovation. In addition, financial environment and legal environment have great influence on enterprise innovation [55,56]. The good financial and legal environment can effectively maintain the stability of the capital market, promote the efficiency of capital allocation, and thus improve enterprise innovation [57,58].
To sum up, although scholars have made fruitful achievements in the field of urban agglomeration and determinants of enterprise innovation, there are still problems that need to be solved urgently. First, only a few scholars have investigated the effects of China’s urban agglomeration from a micro perspective: in particular, the impact of state-level urban agglomeration establishment on enterprise innovation. Second, according to the theory of innovation value chain [59], innovation activities include two stages: R&D investment and innovation output. However, the existing studies pay more attention to the single stage (input or output) of innovation, ignoring the close relationship between innovation process and innovation outcome. Third, existing studies mostly use OLS or traditional Difference-in-Difference (DID) methods to investigate the impact of location-oriented policies such as urban agglomeration, ignoring the selection bias and the fact that the establishment time of state-level urban agglomerations is different. Therefore, from the perspective of micro-enterprises, this study discusses in depth the actual effect of state-level urban agglomeration establishment on the R&D investment and innovation output of enterprises through the quasi-natural experimental method (Propensity Score Matching and Staggered DID).

3. Research Design

3.1. State-Level Urban Agglomerations

During the period 2007–2019, China has successively approved 11 state-level urban agglomeration development plans. Based on governmental planning documents, the state-level urban agglomerations are collected. The name, regional scope, government document and promulgation year of specific urban agglomeration are shown in Table 1, and the location and boundary information about urban agglomerations are illustrated in Figure 1.

3.2. Identification Strategy

State-level urban agglomerations integrate the cities in different provinces into a broader economic unit, breaking the segmentation of inter-provincial markets. Once a city or district is included in the state-level urban agglomeration, the innovation activities of enterprises in this region may change. This change mainly stems from three aspects: first, the “grouping effect” formed by enterprises’ own differences; second, the “time effect” caused by the inertia of enterprises with time or the economic development of China; third, the “policy treatment effect” formed by the influence of urban agglomeration policy. The Difference-In-Difference method (DID), as a kind of “quasi-random experiment”, can accurately identify the “policy treatment effect” and effectively evaluate the actual impact of the establishment of state-level urban agglomeration on enterprise innovation.
DID is a kind of quasi-experimental method that needs to satisfy some basic assumptions, such as randomization assumption and parallel trend assumption. Randomization assumption requires that enterprises influenced by the establishment of state-level urban agglomerations are random. As the “development plans” of state-level urban agglomeration are approved by the State Council, enterprises cannot predict in advance when and where state-level urban agglomerations will be established. In addition, the sample enterprises in this study are established earlier than the state-level urban agglomerations and there is no “relocation and change of address” during the window period. Thus, the choice of enterprise location has nothing to do with the establishment of state-level urban agglomeration. Parallel trend assumption requires that if the policy of urban agglomeration establishment was not implemented, the change trend of innovation of the enterprises inside the urban agglomeration (area) should be approximately parallel to that outside the urban agglomeration (area). These assumptions will be tested in the follow-up analysis.
Considering that the establishment time of state-level urban agglomerations is different, we follow the practice of Hoynes et al. [60] and adopt a generalized DID model (in other words, Staggered DID) to explore the impact of the establishment of state-level urban agglomerations on enterprise innovation, specifically as follows
Y i t = α 0 + α 1 U r b a n i t + X i t g + u i + λ t + ε i t
where i indexes the enterprise, t represents the year, Y is the outcome variable, which reflects the R&D investment or innovation output of the enterprise. X is a set of control variables (individual-level covariates) that change with time. u i is the individual effect, λ t is the time fixed effect, and ε i t is the random disturbance term. U r b a n i t represents the policy treatment variable. If the enterprise i is within the scope of the state-level urban agglomeration in t year, this enterprise will be in the treatment period, and the value U r b a n of the current year ( t ) and the subsequent period ( t + 1 , t + 2 , ) will be 1, otherwise 0. We take the following steps to determine whether the enterprise is within the scope of state-level urban agglomeration. First, the shape of the state-level urban agglomerations defined by the government is projected to the ArcGIS software to obtain the boundary information about urban agglomerations. Second, the geocoding technique, which is the process of converting addresses of enterprises into a coordinate system (typically latitude and longitude), is used to help us determine the precise location of enterprises.
Considering the large number of enterprises in China and their differences in scale, profitability, management and other enterprise characteristics, it is necessary to make the enterprises in the treatment group and the control group as similar as possible before using Staggered DID. Propensity score p ( x ) is the probability of taking treatment given a vector of observed variables, specifically
p ( x ) = Pr [ U r b a n = 1 | X = x ]
where X is a set of observable covariates which are not affected by treatment and potential outcomes. If we take enterprises with the same propensity score and divide them into two groups (those who were and were not treated), the groups will be approximately balanced on the variables predicting the propensity score. Propensity Score Matching (PSM) can screen the controlled enterprises for the treated enterprises according to their propensity scores, so that the enterprises with the same or similar propensity scores have the same characteristics, thus achieving the random grouping.

4. Data Source and Variable Definition

The research data of this study consist of two parts: the data of listed enterprises and the data of state-level urban agglomerations. The former stem from the China Stock Market and Accounting Research (CSMAR) database, and the latter were manually collected according to the planning documents of various urban agglomerations successively approved by the State Council. Specifically, the enterprise R&D investment data come from the “Patent and R&D Innovation Database of Listed Companies” in the CSMAR database, and the innovation output data (such as patent applications, invention patent applications and patent grants) of enterprises come from the “Patent Database of Listed Companies and Subsidiaries” in the CSMAR database. Considering that the R&D investment indicators in the CSMAR database changed the statistical caliber in 2007, we selected the sample data from 2007 to 2019 in order to ensure the consistency of data measurement. In addition, the control variables of enterprises are mainly derived from “Characteristics Research Database of Listed Companies” and “Financial Statement Database of Listed Companies” in the CSMAR database. The initial listed enterprise data were treated as follows: (1) we excluded observations of the listed enterprises with abnormal financial conditions, such as Special Treatment (ST) and Particular Treatment (PT), and observations of financial and insurance enterprises; (2) to ensure the comparability of samples before and after the policy of state-level urban agglomeration establishment, we deleted the enterprises listed after 2007 and delisted before 2019; (3) we deleted observations with negative values of the key variables, such as the observed values of insolvency at the end of the period; (4) we eliminated observations with many omitted variables. After the above processing, we finally obtained unbalanced panel data containing 18,436 observations. As far as the data of state-level urban agglomerations are concerned, the State Council successively approved 11 state-level urban agglomerations (see Table 1) during the research window 2007–2019. The definition of the variables involved in this study is presented in Table 2, and the descriptive statistics of theses variables are shown in Table 3.

5. Results and Discussion

5.1. Policy Effect Estimation
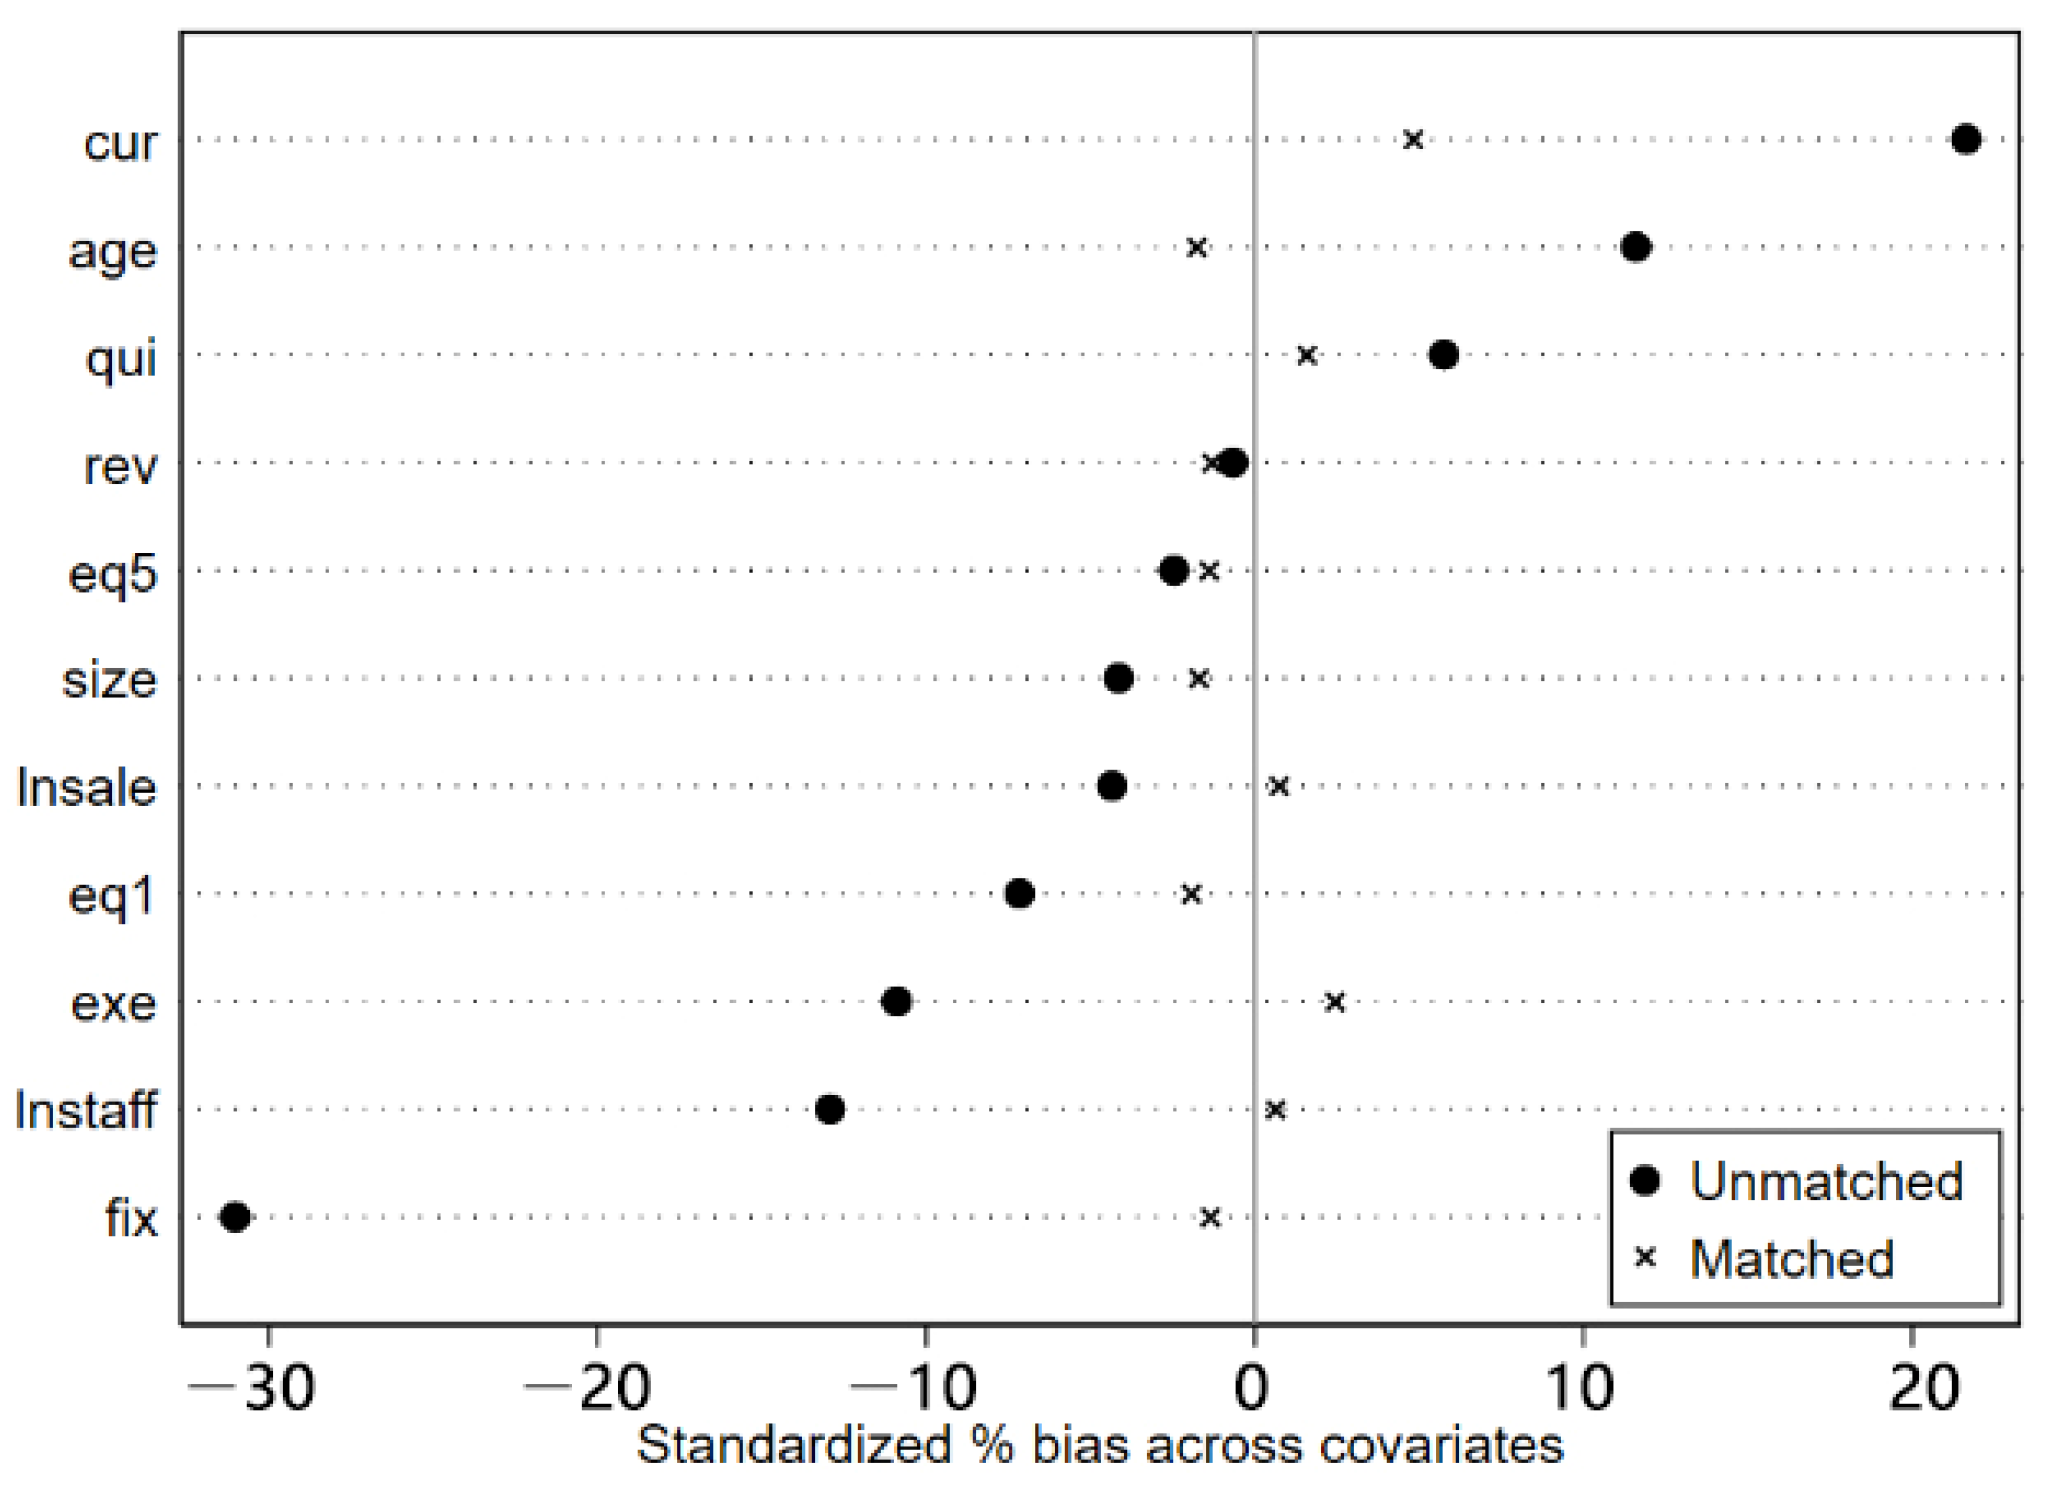
The area selection of state-level urban agglomeration establishment cannot be regarded as random in the strict sense. Thus, we cannot explore the impact of state-level urban agglomeration establishment directly by Staggered DID. To create conditions for random experiments, we refer to Becker and Ichino [61] and use PSM before Staggered DID. As PSM can only match cross-section data, this study makes cross-section matching for each year from 2007 to 2019, and then linearly adds the weights obtained to calculate the matching weight [62]. The nearest neighbor matching “one-to-one” method is used to match the data; Table 4 and Figure 2 show the matching results. Despite the balance test results in Table 4 or the comparison of standardized deviation before and after matching in Figure 2, the difference between the treatment group and the control group before matching is very obvious; it is confirmed that we cannot directly use Staggered DID for analysis. The imbalance of the matched control variables is significantly reduced, and the absolute value of the standardized deviation is less than 10%, which indicates that the matched treatment group is very similar to the control group, and basically has the same characteristics.
Based on the data processed by PSM, we used Staggered DID to evaluate the actual effect of state-level urban agglomeration establishment on R&D investment and innovation output of enterprises. The columns (1)–(3) of Table 5 show the estimated results with R&D investment as the outcome variable, and the columns (4)–(6) show the estimated results with innovation output as the outcome variable. It is found that the estimated coefficients of the policy treatment variable ( U r b a n ) are significantly positive at the level of 1%, indicating that the establishment of state-level urban agglomerations has significantly promoted the R&D investment and the innovation output of enterprises. Taking the findings in column (3) and column (6) as examples, the estimated coefficients of the policy treatment variable ( U r b a n ) are 0.2286 and 0.5805, respectively. This means that the establishment of state-level urban agglomerations increased the R&D investment and innovation output of enterprises within urban agglomeration by 22.86% and 58.05%, respectively. Thus, the state-level urban agglomerations play the role of “incubator” for enterprise innovation. The establishment of urban agglomerations can not only effectively encourage enterprises to increase R&D investment, but also greatly increase the quantity of innovation output of enterprises.

5.2. Validity Tests

The credibility of the previous empirical results depends on the validity of the Staggered DID method. Therefore, this subsection analyzes the validity of the model, including a parallel trend test and a placebo test.

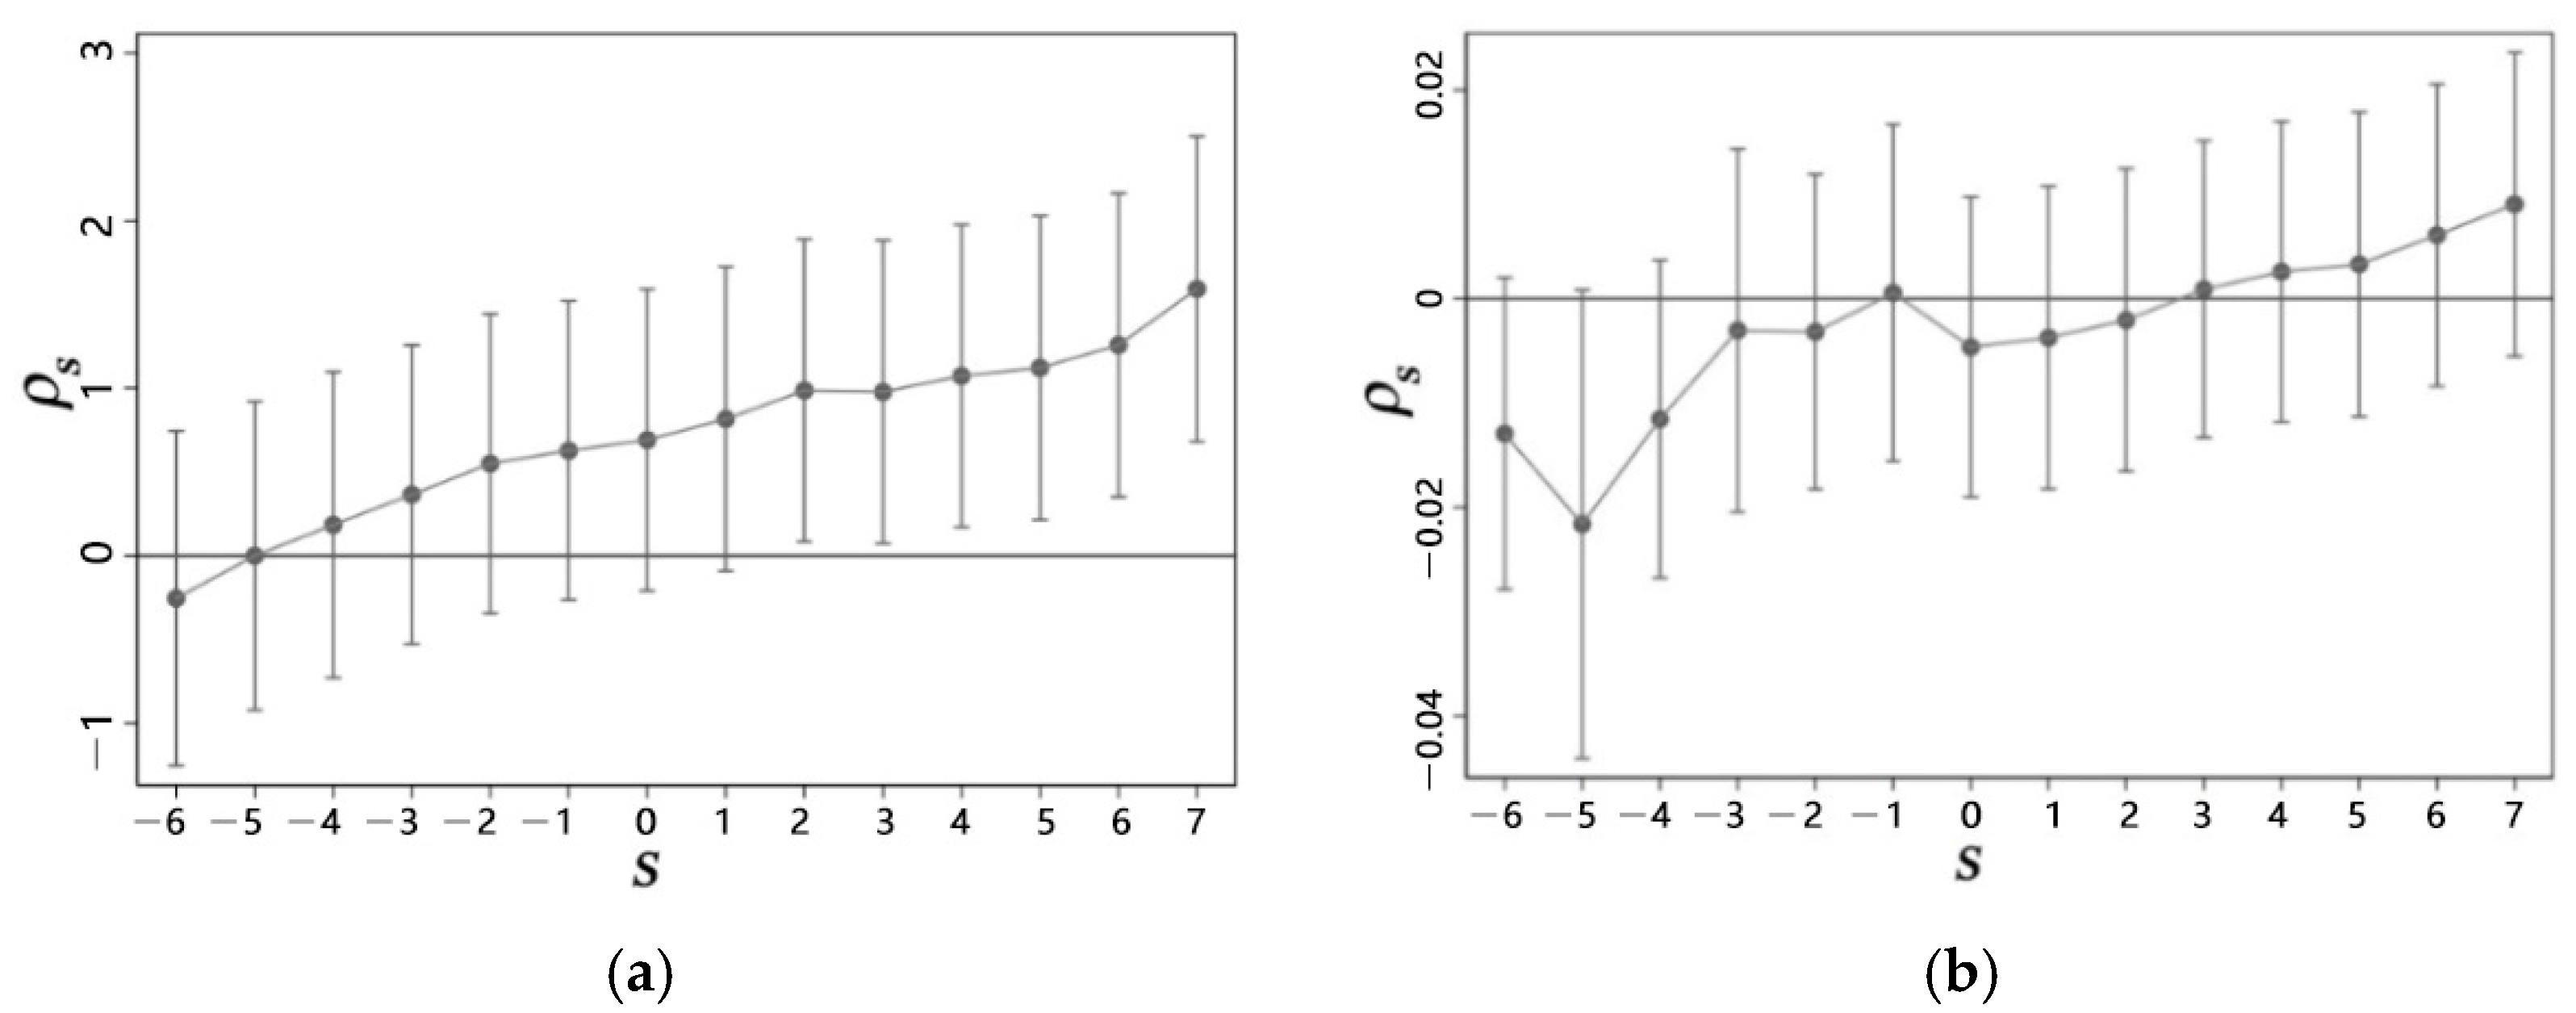
5.2.1. Parallel Trend Tests

The basic assumption of the Staggered DID method is that if there is no policy event, the change trend of the treatment group and the control group should be the same. We drew lessons from Li et al. [63] and examined the dynamic effect of the establishment of state-level urban agglomerations and tested the parallel trend assumption through the combination of Event Study Analysis (ESA) and DID. Specifically, the policy treatment variable ( U r b a n i t ) in Equation (1) is replaced by the newly created dummy variable ( D i t s ) that indicates the years before and after the establishment of a state-level urban agglomeration, and other variables remain unchanged. The estimation equation is as follows
y i t = s 7 7 ρ s D i t s + X i t g + β i + δ t + ε i t s ( 7 , 7 )
where D i t s is a dummy variable representing the s th year of urban agglomeration establishment. The positive value of s indicates the year after establishment, and s = 0 indicates the year when the urban agglomeration is established. Figure 3a,b, respectively, show the policy effect r s = { ρ 6 , ρ 5 , , ρ 7 } with R&D investment and innovation output as the outcome variables and their corresponding 95% confidence intervals. This figure reflects the dynamic change in innovation activities of enterprises affected by the establishment of urban agglomerations.
As can be seen from Figure 3a, the estimated coefficients before the establishment of state-level urban agglomerations are not statistically significant; at the year of establishment of urban agglomerations, the estimated coefficients are positive; the estimated coefficients after the establishment of urban agglomerations show a gradual upward trend. As far as Figure 3b is concerned, the estimated coefficients are negative and insignificant before the establishment of urban agglomerations, and from the third year after the establishment of urban agglomerations, the incentive effect on the innovation output of enterprises is gradually revealed. Generally speaking, the trend of policy effect shown in Figure 3 can confirm that the identification strategy of this study satisfies the parallel trend assumption, and the estimated results are effective.

5.2.2. Placebo Tests

In view of the fact that the State Council issued documents on the establishment of state-level urban agglomerations after 2010, this subsection refers to the practice of Topalova [64] and provides details on the placebo test we carried out by setting the pseudo-time of the policy before 2010 (specifically 2008 and 2009). The premise of the Staggered DID method is that there is no obvious difference in the change in R&D investment and/or innovation output of enterprises before the policy of state-level urban agglomeration establishment. Therefore, if the policy event is set in a certain period before the establishment of urban agglomeration, it can be expected that the estimated coefficient of the policy treatment variable ( U r b a n ) will not be significant. If the actual estimated result is not in line with the expectation, it means that there are other potential unobservable factors that will affect the innovation activities of enterprises. Table 6 reports the results of placebo tests with R&D investment (columns 1–2) and innovation output (columns 3–4) as outcome variables. The results show that the estimated coefficients of the policy treatment variable are not statistically significant, indicating that the estimation models with R&D input and innovation output as outcome variables passed the placebo test, and the estimated results are effective.

6. Regional Heterogeneity

China has a vast territory under the comprehensive influence of a series of natural, social and economic factors; there are great differences in urbanization level, industrialization processes and economic development among the eastern, central and western regions. The state-level urban agglomerations in the eastern region are mainly distributed in the strategic core areas of China’s economic development and are the important growth poles of the national economy, while the development of state-level urban agglomerations in the central and western regions is obviously insufficient and relatively backward. To investigate the influence of regional heterogeneity on the estimation results of the model, we divided the samples into three sub-samples according to the geographical location of enterprises: eastern (area_e), central (area_m) and western (area_w) regions.
From Table 7, it can be seen that in the eastern region group, the estimated coefficients of the policy treatment variable ( U r b a n ) are not statistically significant, indicating that state-level urban agglomeration establishment cannot obviously promote the R&D investment and innovation output of enterprises. The reason may be that the eastern region in China is superior to the relatively backward central and western regions in terms of infrastructure and policy environment, and it is closer to the policy environment in urban agglomerations [65]. This will make the marginal effect of the same preferential policy on enterprise innovation in developed areas (eastern region) less obvious. From the sub-sample of the central region, it is found that the establishment of state-level urban agglomerations can effectively promote the R&D investment and innovation output of enterprises located in the central region. From the sub-sample of the western region, the impact of the policy treatment variable ( U r b a n ) on the R&D investment of enterprises is positive but not statistically significant, while the impact on the innovation output of enterprises is significantly positive at 1% significance level, which indicates that the establishment of state-level urban agglomerations is beneficial to improving the innovation output of enterprises within western urban agglomeration. For the underdeveloped western region, on the one hand, the government’s financial support brought by urban agglomeration can crowd out the R&D investment of enterprises to a certain extent; on the other hand, the marginal effect of the preferential policy and environmental improvement provided by the state-level urban agglomeration will be greater, which makes the establishment of urban agglomerations have a significant impact on the innovation output of enterprises.

7. Conclusions and Policy Implications

The establishment of urban agglomerations is a strategic plan put forward by the government according to the current economic development situation, and it is the comprehensive product of the regional economic situation and administrative planning. Investigating the impact of state-level urban agglomeration establishment across administrative divisions on micro-enterprise innovation provides a beneficial supplement for China’s location-oriented policy evaluation. Selection and endogeneity are often key threats to inference in social science [66]. In this paper, we take the impact of “spatial layout” and “policy events” into account and use the quasi-natural experiment method (Staggered DID) to explore the actual impact of state-level urban agglomeration establishment on the innovation activities of enterprises and the heterogeneous impact caused by regional differences. It was found that the average treatment effects of state-level urban agglomeration establishment on R&D investment and innovation output of enterprises are 0.2286 and 0.5805, respectively, which indicates that the innovation activities of enterprises within urban agglomerations have been significantly improved, in terms of both R&D investment and innovation output. It is worthwhile to note that the establishment of state-level urban agglomerations has no significant impact on R&D investment and the innovation output of enterprises in the eastern region. This is because the eastern region is superior to the relatively backward central and western regions in infrastructure and policy environment and is closer to the policy environment in urban agglomeration. The marginal effect of setting up urban agglomerations in the eastern region on enterprise innovation is not obvious. Moreover, as far as the western region is concerned, the incentive effect of urban agglomeration establishment on the innovation output of enterprises is significantly positive at 1% significance level, while the incentive effect on the R&D investment of enterprises is positive but not statistically significant, which indicates that the government’s financial support brought by urban agglomeration can crowd out the R&D investment of enterprises to a certain extent.
This paper puts forward the following policy suggestions based on the abovementioned findings. First, relevant government departments should attach importance to the coordinated development strategy with urban agglomerations as regional units, extend the innovation-driven development of urban agglomerations, and create a new growth pole of economic development. Second, how to realize the free circulation of innovation resources among cities in urban agglomeration is the key to promote enterprise innovation. On the one hand, relevant government departments should encourage cooperation among enterprises, universities and scientific research institutions, and improve the efficiency of the regional circulation of innovation resources and the cross-industry spillovers through technical alliances [67]; on the other hand, they should further ameliorate the transportation network between the node cities of urban agglomeration and promote the transformation of urban agglomeration from single-center spatial structure to polycentric development [68], so as to speed up the circulation of innovation resources. Third, due to the obvious regional heterogeneity of the effect of urban agglomeration establishment in stimulating enterprise innovation, the relevant government departments should formulate the development strategy of urban agglomeration according to local conditions and choose a reasonable and effective planning scheme. For example, promoting the construction of urban agglomerations in western China. Furthermore, from the perspective of enterprises, while making effective use of the incentive effect brought by urban agglomeration, business managers should strengthen the risk control, provide sufficient capital reserve and a sound financial situation for enterprise innovation, and realize the maximization of enterprise value and long-term sustainable development.
It is unavoidable that some shortcomings remain in this study. First, the measurement of enterprise innovation is rather rough, without considering the differences in patents (for example, a patent for Invention, a patent for Utility Model and a patent for Industrial Design). Future research should establish a more detailed division of enterprise innovation according to Chinese patent classification standards in order to reflect the differences in quantity and quality of enterprise innovation. Second, this study pays attention to the R&D input and innovation output of enterprises. However, profitability, social responsibility and environmental responsibility are also the foundations of the sustainable development of enterprises. Based on the Triple Bottom Line (TBL) pillars, future research could divide the variables into economic, social, and environmental pillars, and re-explore the impact of urban agglomeration on enterprises from multiple perspectives, in order to ensure that the findings are more general.

Author Contributions

Conceptualization, K.Z. and W.W.; methodology, K.Z. and H.H.; software, H.H.; formal analysis, H.H. and W.W.; writing—original draft preparation, H.H. and K.Z.; writing—review and editing, K.Z. and W.W.; visualization, H.H. and W.W.; project administration, K.Z.; funding acquisition, K.Z. All authors have read and agreed to the published version of the manuscript.

Funding

This research was funded by The National Social Science Fund of China: 20FJYB017.

Institutional Review Board Statement

Not applicable.

Informed Consent Statement

Not applicable.

Data Availability Statement

The data are available from the corresponding author upon request.

Acknowledgments

The authors would like to thank anonymous reviewers and the editors for helpful comments and suggestions.

Conflicts of Interest

The authors declare no conflict of interest.

References

  1. Zhang, Q.F.; Mou, S.B. Research on innovation and development strategy of China’s five urban agglomerations under the new development pattern. Reg. Econ. Rev. 2021, 2, 97–105. [Google Scholar]
  2. Zhai, S.Y.; Gu, P.; An, Y. Under cluster and enterprise innovation: Correlation effect and path analysis. Sci. Sci. Manag. S. T 2019, 40, 31–42. [Google Scholar]
  3. Obeng-Odoom, F. Spatial political economy: The case of metropolitan industrial policy. Rev. Evol. Political Econ. 2022, 1–27. [Google Scholar] [CrossRef]
  4. Phelps, N.A.; Ozawa, T. Contrasts in agglomeration: Proto-industrial, industrial and post-industrial forms compared. Prog. Hum. Geogr. 2003, 27, 583–604. [Google Scholar] [CrossRef]
  5. Alonso-Villar, O. Urban agglomeration: Knowledge spillovers and product diversity. Ann. Reg. Sci. 2002, 36, 551–573. [Google Scholar] [CrossRef]
  6. Musterd, S.; Bontje, M.; Ostendorf, W. The changing role of old and new urban centers: The case of Amsterdam region. Urban Geogr. 2006, 27, 360–387. [Google Scholar] [CrossRef]
  7. Lang, R.; Knox, P.K. The new metropolis: Rethinking megalopolis. Reg. Stud. 2009, 43, 789–802. [Google Scholar] [CrossRef]
  8. Lagarias, A. Urban sprawl simulation linking macro-scale processes to micro-dynamics through cellular automata, an application in Thessaloniki, Greece. Appl. Geogr. 2012, 34, 146–160. [Google Scholar] [CrossRef]
  9. Marull, J.; Galletto, V.; Domene, E.; Trullen, J. Emerging megaregions: A new spatial scale to explore urban sustainability. Land Use Policy 2013, 34, 353–366. [Google Scholar] [CrossRef]
  10. Wang, K.Y.; Deng, Y.; Sun, D.W.; Song, T. Evolution and spatial patterns of spheres of urban influence in China. Chin. Geogr. Sci. 2014, 24, 126–136. [Google Scholar] [CrossRef] [Green Version]
  11. Florida, R.; Gulden, T.; Mellander, C. The rise of the mega-region. Camb. J. Reg. Econ. Soc. 2008, 1, 469–476. [Google Scholar] [CrossRef]
  12. De Goei, B.; Burger, M.J.; Van Oort, F.G.; Kitson, M. Functional polycentrism and urban network development in the Greater South East, United Kingdom: Evidence from commuting patterns, 1981–2001. Reg. Stud. 2010, 44, 1149–1170. [Google Scholar] [CrossRef]
  13. Huang, X.L.; Li, G.P.; Liu, J.G. The impact of spatial structure on economic efficiency of Beijing-Tianjin-Hebei megalopolis in China. Complexity 2020, 18, 6038270. [Google Scholar] [CrossRef]
  14. Meijers, E.J.; Burger, M.J. Stretching the concept of “Borrowed Size”. Urban Stud. 2017, 54, 269–291. [Google Scholar] [CrossRef]
  15. Zhang, X.C.; Guo, Q.E.; Cheung, D.M.W.; Zhang, T.Y. Evaluating the institutional performance of the Pearl River Delta integration policy through intercity cooperation network analysis. Cities 2018, 81, 131–144. [Google Scholar] [CrossRef]
  16. Liu, Y.L.; Zhang, X.H.; Pan, X.Y.; Ma, X.X.; Tang, M.Y. The spatial integration and coordinated industrial development of urban agglomerations in Yangtze River Economic Belt, China. Cities 2020, 104, 102801. [Google Scholar] [CrossRef]
  17. Li, Z.; Jiang, W.G.; Wang, W.J.; Chen, Z.; Ling, Z.Y.; Lv, J.X. Ecological risk assessment of the wetlands in Beijing-Tianjin-Hebei urban agglomeration. Ecol. Indic. 2020, 117, 106677. [Google Scholar] [CrossRef]
  18. Chen, M.X.; Guo, S.S.; Hu, M.G.; Zhang, X.P. The spatiotemporal evolution of population exposure to PM2.5 within the Beijing-Tianjin-Hebei urban agglomeration, China. J. Clean. Prod. 2020, 265, 121708. [Google Scholar] [CrossRef]
  19. Tian, Z.Z.; Fang, D.L.; Chen, B. Three-scale input-output analysis for energy and water consumption in urban agglomeration. J. Clean. Prod. 2020, 268, 122148. [Google Scholar] [CrossRef]
  20. Ouyang, X.; Zhu, X. Spatio-temporal characteristics of urban land expansion in Chinese urban agglomerations. Acta Geogr. Sin. 2020, 75, 571–588. [Google Scholar]
  21. Lu, C.Y.; Xu, Y.T.; Lin, X.Q.; Zhong, L.X.; Su, Y. Study of spatio-temporal evolution of circum-Bohai urban agglomeration based on DMSP/OLS night-time light data. Remote Sens. Land Resour. 2019, 31, 218–226. [Google Scholar]
  22. Fang, C.L.; Mao, Q.Z.; Ni, P.F. Discussion on the scientific selection and development of China’s urban agglomerations. Acta Geogr. Sin. 2015, 70, 515–527. [Google Scholar]
  23. Xie, C.Y.; Hu, H.H.; Zhou, H.B. Principles and paths of the city-industry integration development against the background of a new kind of urbanization. J. Financ. Econ. 2016, 42, 72–82. [Google Scholar]
  24. Zeng, H.; Yan, C.H.; Huang, W.B.; Lin, Q.Y.; Yu, L.Y.; Qiu, G.Y. A case study on the relationship between urbanization level and water use efficiency in the Pearl River Delta urban agglomeration. Acta Sci. Nat. Univ. Pekin. 2020, 56, 561–570. [Google Scholar]
  25. Chen, L.T.; Li, J.L.; Ye, C.H.; Xu, L.Z. Research on the impact of industrial structure change on eco-efficiency in Yangtze River economic zone urban agglomeration: 2006–2014. J. Appl. Stat. Manag. 2020, 39, 206–222. [Google Scholar]
  26. Yu, J.W.; Zhao, D.L. The rise of urban cluster, economic performance and regional income disparity based on the metropolitan area of Jing-Jin-Ji, Yangtze River Delta and Pearl River Delta. J. Zhongnan Univ. Econ. Law 2010, 181, 15–20. [Google Scholar]
  27. Zhang, Y.; Liu, L.; Huang, S.J. Does regional integration promote the high-quality development of urban agglomeration economy: A quasi-natural experiment based on the Yangtze River Delta urban economic coordination commission. Stud. Sci. Sci. 2021, 39, 63–72. [Google Scholar]
  28. Zhang, X.L.; Li, P.X.; Li, L.X. Government cooperation, market integration and economic performance of city cluster: Evidence from the Yangtze River Delta urban economic coordination committee. China Econ. Q. 2017, 16, 1563–1582. [Google Scholar]
  29. Li, X.S.; Zhang, Y.D.; Sun, B.W. Does regional integration promote the efficiency of economic growth? An empirical analysis of Yangtze River Economic Belt. China Popul. Resour. Environ. 2017, 27, 10–19. [Google Scholar]
  30. Hirschey, M.; Skiba, H.; Wintoki, M.B. The size, concentration and evolution of corporate R&D spending in US firms from 1976 to 2010: Evidence and implications. J. Corp. Financ. 2012, 18, 496–518. [Google Scholar]
  31. Laforet, S. Organizational innovation outcomes in SMEs: Effects of age, size and sector. J. World Bus. 2013, 48, 490–502. [Google Scholar] [CrossRef]
  32. Soete, L.L.G. Firm size and incentive activity: The evidence reconsidered. Eur. Econ. Rev. 1979, 12, 319–324. [Google Scholar] [CrossRef]
  33. Lin, C.; Lin, P.; Song, F. Property rights protection and corporate R&D: Evidence from China. J. Dev. Econ. 2010, 93, 49–62. [Google Scholar]
  34. Hu, A.G.; Jefferson, G.H. A great wall of patents: What is behind China’s recent patent explosion? J. Dev. Econ. 2009, 90, 57–68. [Google Scholar] [CrossRef]
  35. Hou, Q.; Hu, M.; Yuan, Y. Corporate innovation and political connections in Chinese listed firms. Pac. Basin Financ. J. 2017, 46, 158–176. [Google Scholar] [CrossRef]
  36. Yuan, R.; Wen, W. Managerial foreign experience and corporate innovation. J. Corp. Financ. 2018, 48, 752–770. [Google Scholar] [CrossRef]
  37. Mazouz, K.; Zhao, Y. CEO incentives, takeover protection and corporate innovation. Br. J. Manag. 2019, 30, 494–515. [Google Scholar] [CrossRef] [Green Version]
  38. Li, P.Y. The impact of the top management teams’ knowledge and experience on strategic decisions and performance. J. Manag. Organ. 2017, 23, 504–523. [Google Scholar] [CrossRef]
  39. Chen, Y.; Podolski, E.J.; Veeraraghavan, M. Does managerial ability facilitate corporate innovative success? J. Empir. Financ. 2015, 34, 313–326. [Google Scholar] [CrossRef]
  40. Bereskin, F.L.; Cicero, D.C. CEO compensation contagion: Evidence from an exogenous shock. J. Financ. Econ. 2013, 107, 477–493. [Google Scholar] [CrossRef]
  41. Han, S.; Cui, W.J.; Chen, J.; Fu, Y. Female CEOs and corporate innovation behaviors—Research on the regulating effect of gender culture. Sustainability 2019, 11, 682. [Google Scholar] [CrossRef] [Green Version]
  42. Wan, W.; Zhou, F.; Liu, L.; Fang, L.; Chen, X. Ownership structure and R&D: The role of regional governance environment. Int. Rev. Econ. Financ. 2021, 72, 45–58. [Google Scholar]
  43. Michael, S.C.; Pearce, J.A. The need for innovation as a rationale for government involvement in entrepreneurship. Entrep. Reg. Dev. 2009, 21, 285–302. [Google Scholar] [CrossRef]
  44. Deng, K.; Ding, Z.; Xu, M. Population agglomeration and the effectiveness of enterprise subsidies: A Chinese analysis. Reg. Stud. 2020, 54, 1136–1148. [Google Scholar] [CrossRef]
  45. Bronzini, R.; Piselli, P. The impact of R&D subsidies on firm innovation. Res. Policy 2016, 45, 442–457. [Google Scholar]
  46. Wallsten, S.J. The effects of government-industry R&D programs on private R&D: The case of the small business innovation research program. RAND J. Econ. 2000, 31, 82–100. [Google Scholar]
  47. Shang, H.T.; Huang, X.S. A research on the performance of government innovation subsidies for pharmaceutical companies in China. Sci. Res. Manag. 2019, 40, 32–42. [Google Scholar]
  48. Jaklic, A.; Burger, A.; Rojec, M. The quest for more efficient R&D subsidies. East. Eur. Econ. 2013, 51, 5–25. [Google Scholar]
  49. Crespi, G.; Giuliodori, D.; Giuliodori, R.; Rodriguez, A. The effectiveness of tax incentives for R&D+i in developing countries: The case of Argentina. Res. Policy 2016, 45, 2023–2035. [Google Scholar]
  50. Tassey, G. Tax incentives for innovation: Time to restructure the R&E tax credit. J. Technol. Transf. 2007, 32, 605–615. [Google Scholar]
  51. Zheng, T.T.; Wang, H.; Gan, S.D. Tax incentives and innovation quality improvement: Based on the perspective of quantity growth and structural optimization. Mod. Financ. Econ.-J. Tianjin Univ. Financ. Econ. 2020, 360, 29–40. [Google Scholar]
  52. Atanassov, J.; Liu, X.D. Can corporate income tax cuts stimulate innovation? J. Financ. Quant. Anal. 2020, 55, 1415–1465. [Google Scholar] [CrossRef] [Green Version]
  53. Pertuze, J.A.; Reyes, T.; Vassolo, R.S.; Olivares, N. Political uncertainty and innovation: The relative effects of national leaders’ education levels and regime systems on firm-level patent applications. Res. Policy 2019, 48, 103808. [Google Scholar] [CrossRef]
  54. Bhattacharya, U.; Hsu, P.H.; Tian, X.; Xu, Y. What affects innovation more: Policy or policy uncertainty? J. Financ. Quant. Anal. 2017, 52, 1869–1901. [Google Scholar] [CrossRef] [Green Version]
  55. Amore, M.D.; Schneider, C.; Alminas, Z. Credit supply and corporate innovation. J. Financ. Econ. 2013, 109, 835–855. [Google Scholar] [CrossRef]
  56. Hsu, P.H.; Xuan, T.; Yan, X. Financial development and innovation: Cross-country evidence. J. Financ. Econ. 2014, 112, 116–135. [Google Scholar] [CrossRef] [Green Version]
  57. Maskus, K.E.; Milani, S.; Neumann, R. The impact of patent protection and financial development on industrial R&D. Res. Policy 2019, 48, 355–370. [Google Scholar]
  58. Mnnasoo, K.; Merikull, J. Credit constraints and R&D over the boom and bust: Firm-level evidence from central and eastern Europe. Econ. Syst. 2020, 44, 100747. [Google Scholar]
  59. Roper, S.; Du, J.; Love, J.H. Modelling the innovation value chain. Res. Policy 2008, 37, 961–977. [Google Scholar] [CrossRef] [Green Version]
  60. Hoynes, H.W.; Schanzenbach, D.W.; Douglas, A. Long-run impacts of childhood access to the safety net. Am. Econ. Rev. 2016, 106, 903–934. [Google Scholar] [CrossRef] [Green Version]
  61. Becker, S.O.; Ichino, A. Estimation of average treatment effects based on propensity scores. Stata J. 2002, 2, 358–377. [Google Scholar] [CrossRef] [Green Version]
  62. Jia, Z.J.; Wen, S.Y.; Zhu, R.Q. Carbon emission trading and total factor carbon efficiency: Evidence from China’s pilot carbon trading. J. Xiamen Univ. 2022, 270, 21–34. [Google Scholar]
  63. Li, P.; Lu, Y.; Wang, J. Does flattening government improve economic performance? Evidence from China. J. Dev. Econ. 2016, 123, 18–37. [Google Scholar] [CrossRef]
  64. Topalova, P. Factor immobility and regional impacts of trade liberalization: Evidence on poverty from India. Am. Econ. J. Appl. Econ. 2010, 2, 1–41. [Google Scholar] [CrossRef] [Green Version]
  65. Tan, J.; Zhang, J.H. Special economic zones and firm productivity—Empirical evidence from Chinese listed companies. Econ. Perspect. 2019, 1, 43–59. [Google Scholar]
  66. Keele, L.J.; Titiunik, R. Geographic boundaries as regression discontinuities. Political Anal. 2015, 23, 127–155. [Google Scholar] [CrossRef]
  67. Pan, H.Z.; Yang, T.R.; Jin, Y.; Dall’Erba, S.; Hewings, G. Understanding heterogeneous spatial production externalities as a missing link between land-use planning and urban economic futures. Reg. Stud. 2021, 55, 90–100. [Google Scholar] [CrossRef]
  68. Yang, T.R.; Jin, Y.; Yan, L.X.; Pei, P. Aspirations and realities of polycentric development: Insights from multisource data into the emerging urban form of Shanghai. Environ. Plan. B Urban Anal. City Sci. 2019, 46, 1264–1280. [Google Scholar] [CrossRef]
Figure 1. Location and boundary of Urban agglomerations.
Sustainability 14 09170 g001
Figure 2. Comparison of standardized deviation before and after matching.
Sustainability 14 09170 g002
Figure 3. Parallel trend tests. (a) R&D investment (b) Innovation output.
Sustainability 14 09170 g003
Table 1. State-level urban agglomerations.
NoNameScopeGovernment DocumentYear
1Yangtze river delta Urban AgglomerationShanghai, Nanjing, Suzhou, Wuxi, Changzhou, Zhenjiang, Yangzhou, Taizhou, Nantong, Hangzhou, Ningbo, Huzhou, Jiaxing, Shaoxing, Zhoushan and Taizhou.“Regional Planning of the Yangtze River Delta Region”2010
2Pearl River Delta Urban AgglomerationGuangzhou, Shenzhen, Zhuhai, Foshan, Jiangmen, Dongguan, Zhongshan, Huizhou, Huidong, Boluo, Zhaoqing, Gaoyao and Sihui.“Planning for Coordinated Development of Urban Agglomerations in Pearl River Delta”2004
3Beijing-Tianjin-Hebei Urban AgglomerationBeijing, Tianjin, Baoding, Langfang, Tangshan, Qinhuangdao, Cangzhou, Zhangjiakou, Chengde, Shijiazhuang, Handan, Xingtai and Hengshui“Regional Planning of Beijing-Tianjin-Hebei Metropolitan Area”2011
4Harbin-Changchun Urban AgglomerationHarbin, Daqing, Qiqihar, Suihua and Mudanjiang in Heilongjiang Province, Changchun, Jilin, Siping, Liaoyuan, Songyuan and Yanbian Korean Autonomous Prefecture in Jilin Province.“Development Plan of Harbin-Changchun Urban Agglomeration”2016
5Triangle of Central China Urban AgglomerationWuhan, Huangshi, Ezhou, Huanggang, Xiaogan, Xianning, Xiantao, Qianjiang, Tianmen, Xiangyang, Yichang, Jingzhou and Jingmen in Hubei, Changsha, Zhuzhou, Xiangtan, Yueyang, Yiyang, Changde, Hengyang and Loudi in Hunan, Nanchang, Jiujiang and Jingdezhen in Jiangxi.“Development Plan of Urban Agglomeration in the Middle Reaches of the Yangtze River”2015
6Beibu Gulf Urban AgglomerationNanning, Beihai, Qinzhou, Fangchenggang, Yulin and Chongzuo in Guangxi Zhuang Autonomous Region, Zhanjiang, Maoming and Yangjiang in Guangdong Province, Haikou, Danzhou, Dongfang, Chengmai, Lingao and Changjiang counties in Hainan Province“Beibu Gulf Urban Agglomeration Development Plan”2017
7Huhehaote-Baotou-Ordos-Yulin Urban AgglomerationHohhot, Baotou and Erdos in Inner Mongolia Autonomous Region and Yulin in Shaanxi Province.“Huhehaote-Baotou-Ordos-Yulin Urban Agglomeration Development Plan”2018
8Central Plains Urban AgglomerationZhengzhou, Luoyang, Kaifeng, Xinxiang, Jiaozuo, Xuchang, Pingdingshan, Luohe, Jiyuan, Hebi, Shangqiu, Zhoukou, Jincheng and Bozhou.“Central Plains Urban Agglomeration Development Plan”2016
9Cheng-Yu Urban AgglomerationChongqiong, Chengdu, Zigong, Luzhou, Deyang, Mianyang, Suining, Neijiang, Leshan, Nanchong, Meishan, Yibin, Guang’an, Dazhou (except Wanyuan City), Ya’an (except tianquan county and Baoxing County) and Ziyang in Sichuan Province.“Cheng-Yu Urban Agglomeration Development Plan”2016
10Guanzhong plain Urban AgglomerationXi’an, Baoji, Xianyang, Tongchuan and Weinan in Shaanxi Province, Shangzhou District, Luonan County, Danfeng County and Zhashui County in yangling district and Shangluo City, Yuncheng City (except Pinglu County and Yuanqu County) in Shanxi Province, Yaodu District, houma city, Xiangfen County, huozhou city, Quwo County, Yicheng County, Hongdong County and Fushan County in Linfen City and Tianshui City in Gansu Province.“Guanzhong plain Urban Agglomeration Development Plan”2017
11Lanxi Urban AgglomerationLanzhou, Gansu Province, Baiyin District, Pingchuan District, Jingyuan, Jingtai, Dingxi, anding district, Longxi, Weiyuan, Lintao, Linxia Hui Autonomous Prefecture, Dongxiang Autonomous County, Yongjing, Jishishan Bao’an Dongxiang Salar Autonomous County, Xining, Haidong, Haibei Tibetan Autonomous Prefecture, Hainan Tibetan Autonomous Prefecture, Gonghe, Guide.“Lanzhou-Xining Urban Agglomeration Development Plan”2018
Note: Policy documents originated from official website of the State Council (http://www.gov.cn/zhengce/xxgk/index.htm) (accessed on 30 May 2022).
Table 2. Definition of variables.
TypeNameSymbolDefinition
Outcome variableR&D investmentRDNatural logarithm of enterprise R&D investment amount plus 1
Innovation outputInnovationNatural logarithm of total patent application plus 1
Policy treatment variableEstablishment of state-level urban agglomerationUrbanDummy variable. If the enterprise within state-level urban agglomeration, urban = 1; otherwise, 0
Control variableEnterprise incomelnsaleNatural logarithm of enterprise operating income plus 1
Enterprise ageageCurrent year minus enterprise establishment year
Profitabilityroa(Total profit)/(Average total assets)
Fixed assets ratiofix(Fixed assets)/(Total assets)
Staff sizelnstaffNatural logarithm of number of employees
R&D background of executivesfunbackynDummy variable. If executives have R&D background, funbackyn = 1, otherwise 0
State-owned enterpriseSOEDummy variable. If state-owned enterprise, SOE = 1, otherwise 0
Enterprise managementexeNatural logarithm of number of directors and supervisors in enterprises
Enterprise growth rev(Growth of operating income)/(Total operating income of the previous year)
Quick ratioqui(Current assets)/(Current liabilities)
Ownership concentration Aeq1Shareholding ratio of the largest shareholder of enterprise
Ownership concentration Beq5Sum of the shareholding ratios of the top five major shareholders
Current assets ratiocur(Current assets)/(Owner’s equity)
Enterprise scalesizeNatural logarithm of enterprise total assets
Grouping variableEastern regionarea_eDummy variable. If the location of the enterprise belongs to the eastern region, area_e = 1, otherwise 0
Central regionarea_mDummy variable. If the location of the enterprise belongs to the central region, area_m = 1, otherwise 0
Western regionarea_wDummy variable. If the location of the enterprise belongs to the central region, area_w = 1, otherwise 0
Table 3. Descriptive statistics.
VariableMeanMedianStandard DeviationMinMaxObs.
RD17.790017.94001.8980025.03008296
Innovation3.60603.80702.2720011.21004952
Urban0.611210.4875019377
lnsale22.010021.88001.493016.350028.72009326
age14.2900155.83700299377
roa0.00030.00030.0009−0.03910.01139377
fix0.00250.00220.00172.06 × 10-60.00959377
lnstaff8.19208.14101.23203.135013.21009373
funbackyn0.613410.4870019377
SOE0.212900.4094019377
exe17.5700174.06203407572
rev0.01630.00100.5916−0.0268459353
qui0.01390.00970.01920.00040.52149332
eq135.120033.340014.90002.197089.09009377
eq547.080046.370015.35002.672098.29009377
cur0.00540.00550.002000.00999350
size22.560022.40001.431019.080031.04009377
area_e0.628110.4833019377
area_m0.210500.4077019377
area_w0.161400.3679019377
Table 4. Balance test results.
VariableBefore/AfterMeanStandardized Deviation (%)t Statistics
TreatedControl
exeBefore17.413017.8410−10.9−3.91 ***
After17.397017.30202.41.33
fixBefore0.00230.0029−31−11.46 ***
After0.00230.0023−1.4−0.77
revBefore0.01810.0228−0.7−0.25
After0.01810.0273−1.3−0.66
eq5Before46.410046.7850−2.5−0.89
After46.382046.5970−1.4−0.75
quiBefore0.01420.01325.71.99 **
After0.01420.01391.60.81
ageBefore16.005015.443011.64.13 ***
After16.015016.1010−1.8−0.93
eq1Before34.498035.5750−7.2−2.62 ***
After34.456034.7490−1.9−1.05
curBefore0.00550.005021.67.81 ***
After0.00550.00544.82.53 **
lnsaleBefore22.126022.1880−4.3−1.54
After22.123022.11300.70.38
lnstaffBefore8.21838.3672−12.9−4.53 ***
After8.21458.20740.60.32
sizeBefore22.692022.7460−4.1−1.45
After22.689022.7110−1.7−0.91
Note: *** and ** represent the significance levels at 1% and 5%, respectively.
Table 5. Estimated results of the impact of state-level urban agglomeration establishment.
R&D InvestmentInnovation Output
(1)(2)(3)(4)(5)(6)
Urban0.2132 ***0.2145 ***0.2286 ***0.5796 ***0.5910 ***0.5805 ***
(3.14)(3.20)(3.52)(3.66)(3.74)(3.60)
lnsale0.8217 ***0.8290 ***0.6955 ***0.4691 ***0.4834 ***0.4342 ***
(20.54)(20.24)(14.73)(4.28)(4.45)(3.19)
roa −27.5088 *−20.6942 −68.0485−65.5941
(−1.73)(−1.22) (−1.47)(−1.39)
fix 12.2551−0.4945 44.628440.6335
(0.43)(−0.02) (0.78)(0.70)
SOE 0.0298 −0.2164
(0.63) (−1.59)
lnstaff 0.2512 *** 0.0974
(4.12) (0.59)
funbackyn −0.0567 −0.0897
(−1.41) (−0.99)
Constant−0.4276−0.61200.3204−8.3555 ***−8.7704 ***−8.3741 ***
(−0.49)(−0.67)(0.35)(−3.48)(−3.68)(−3.45)
Obs.728972897289332133213321
Goodness of fit0.83900.83910.84070.52490.52570.5264
Note: *** and * represent the significance levels at 1% and 10%, respectively.
Table 6. Placebo tests.
R&D InvestmentInnovation Output
(1)(2)(3)(4)
Pseudo-policy-year2008200920082009
Urban0.09270.07170.1010−0.0823
(1.13)(1.35)(0.79)(−0.52)
Controlyesyesyesyes
Obs.435587773889
Goodness of fit0.76550.84450.55980.5898
Note: t statistics are in parentheses.
Table 7. Regional heterogeneity.
R&D InvestmentInnovation Output
(1)(2)(3)(4)(5)(6)
Eastern regionCentral regionWestern regionEastern regionCentral regionWestern region
Urban0.37220.2103 ***0.1979−0.25960.5753 ***0.8073 ***
(1.46)(3.51)(1.45)(−0.47)(2.82)(2.85)
Controlyesyesyesyesyesyes
Obs.4473160812082115689517
Goodness of fit0.83950.88570.79190.54120.40590.5813
Note: *** represent the significance level at 1%; t statistics are in parentheses.
Publisher’s Note: MDPI stays neutral with regard to jurisdictional claims in published maps and institutional affiliations.

