1. Introduction
Energy is essential for human development; however, the economic growth model that predominates in the world is based on the consumption of fossil fuels, which is the main cause of climate change [
1,
2]. Beyond different technological solutions that have been proposed to improve energy efficiency, decrease greenhouse gas (GHG) emissions, and contribute to climate change mitigation [
3,
4], the reduction in the consumption of energy resources and the direct use of renewable energies are fundamental for true sustainable development [
5]
One of the main challenges facing humanity is to ensure food security and equity in the context of the growth of its demography, with serious emerging environmental issues, decreasing energy supplies, and finite natural resources [
6,
7]. The progressive global demand for food has caused agricultural intensification, generating a significant increase in the use of inputs such as fertilizers, pesticides, herbicides, machines, and mechanization of processes, many of which are derived from non-renewable natural resources (i.e., fossil energy) [
8]. This type of intensive production causes environmental problems such as erosion and reductions in soil fertility, the contamination of water resources, and the loss of biodiversity. All of the above can negatively influence the future of agricultural production [
9,
10].
To face these challenges, it is important to evaluate the sustainability and energy footprint of agricultural production processes and to identify energy flows, as well as the use and percentage of renewable and non-renewable sources within the systems [
11,
12,
13]. Agriculture operates via the interaction of natural resources and economic inputs. For this reason, it is necessary to have tools that provide a valuation in equivalent terms when comparing the use of resources (environmental and economic) [
14]. The above facilitates the finding of structural and functional failures in these systems, helping to guide decision-making and to seek adequate accounting for environmental inputs in relation to economic ones, thus achieving an optimal use of resources and a complete and integral management of the agricultural productive system [
15,
16,
17].
In recent years, different environmental assessment tools have been developed and applied in agricultural contexts, such as ecological footprint [
18], material flow analysis [
19], ecological network analysis [
20], life cycle analysis [
21], exergy [
22] and emergy [
23]. Rodríguez et al. (2019) [
13] identified that the emergy method stands out for the analysis of efficiency and sustainability in agricultural systems from a holistic perspective.
In the literature, there are several works that have applied the emergy technique in agricultural contexts. For example, [
24] determined the best model of green coffee production in a farm located in the Cerrado region (Brazil), through the evaluation of different emergy flows, with the objective of contributing to sustainable development (environmental–economic). [
25] performed a comparative analysis of emergy in five corn field systems in Guyana, which applied different by-products to generate benefit to soil properties. In Iran, 193 wheat and maize farmers were chosen, and the sustainability of their production systems were evaluated using emergy, analyzing the environmental and ecological performance of these two systems [
26]. Cuadra and Rydberg (2006) [
27] conducted an emergy analysis for the production, processing and export of coffee in Nicaragua, identifying that sales of roasted coffee and instant coffee generate greater benefits for Nicaragua in relation to fair trade, compared to sales of green coffee.
The emergy method is based on concepts from thermodynamics and ecology, providing a comprehensive view of the measurement of environmental resources and economic inputs [
28,
29]. However, for the case where a suitable recording of the inputs and outputs of the agricultural system is not carried out, or the processes, stages, components, variables, flows and equipment, involved in production are not clear, it is essential to articulate tools such as emergy with process modeling techniques. It is also necessary to be able to relate the indicators calculated in emergy with energy and environmental management tools to improve decision-making processes. Precisely, this research aims to propose a multidisciplinary approach that integrates emergy analysis, process modeling (using the ANSI/ISA-88 Standard) [
30], and the basis for proposing an energy management system considering the ISO 50001—Energy Management Systems standard. The proposed approach is validated in a coffee production system, at the Experimental Farm (Los Naranjos) in Supracafé (Supracafé, 2021), Cajibío, Cauca, Colombia (21°35′08″ N, 76°32′53″ W) [
31]. The data taken for the analysis correspond to the years 2018, 2019, and 2020.
3. Results
3.1. Phase 1: Production System Modeling of the “Los Naranjos” Farm (Planting–Harvesting Stage)
Figure 4 shows the operations and flows of the plantation and harvesting stages by-products, starting with the coffee seed, up to its transformation into coffee cherries. The activities carried out in these stages are undertaken manually (human labor). A process flow diagram (PFD) is developed for the stages of the wet processing of coffee and the pre-processing or threshing of coffee, where there are several equipment modules, and it is necessary to register them in order for them to be included in the system’s energy flows analysis.
The energy flows identified in the plantation stage start from items 1 to 16, and for the harvesting stage are between items 17 and 20 (Table 3). This modeling process allows for a correct inventory of the different energy flows that intervene in the coffee-producing farm, and thus, to carry out an emergy analysis that reflects the system’s reality. In addition, for these first two stages it is necessary to define the procedural control model, which helps to determine the system’s structure and behavior in relation to the actions executed in chronological order. This model is composed of a five-unit procedure and 17 operations (
Figure 4 and
Table 2).
3.2. Phase 2: Energy Description of the Agricultural System Using Emergy Analysis
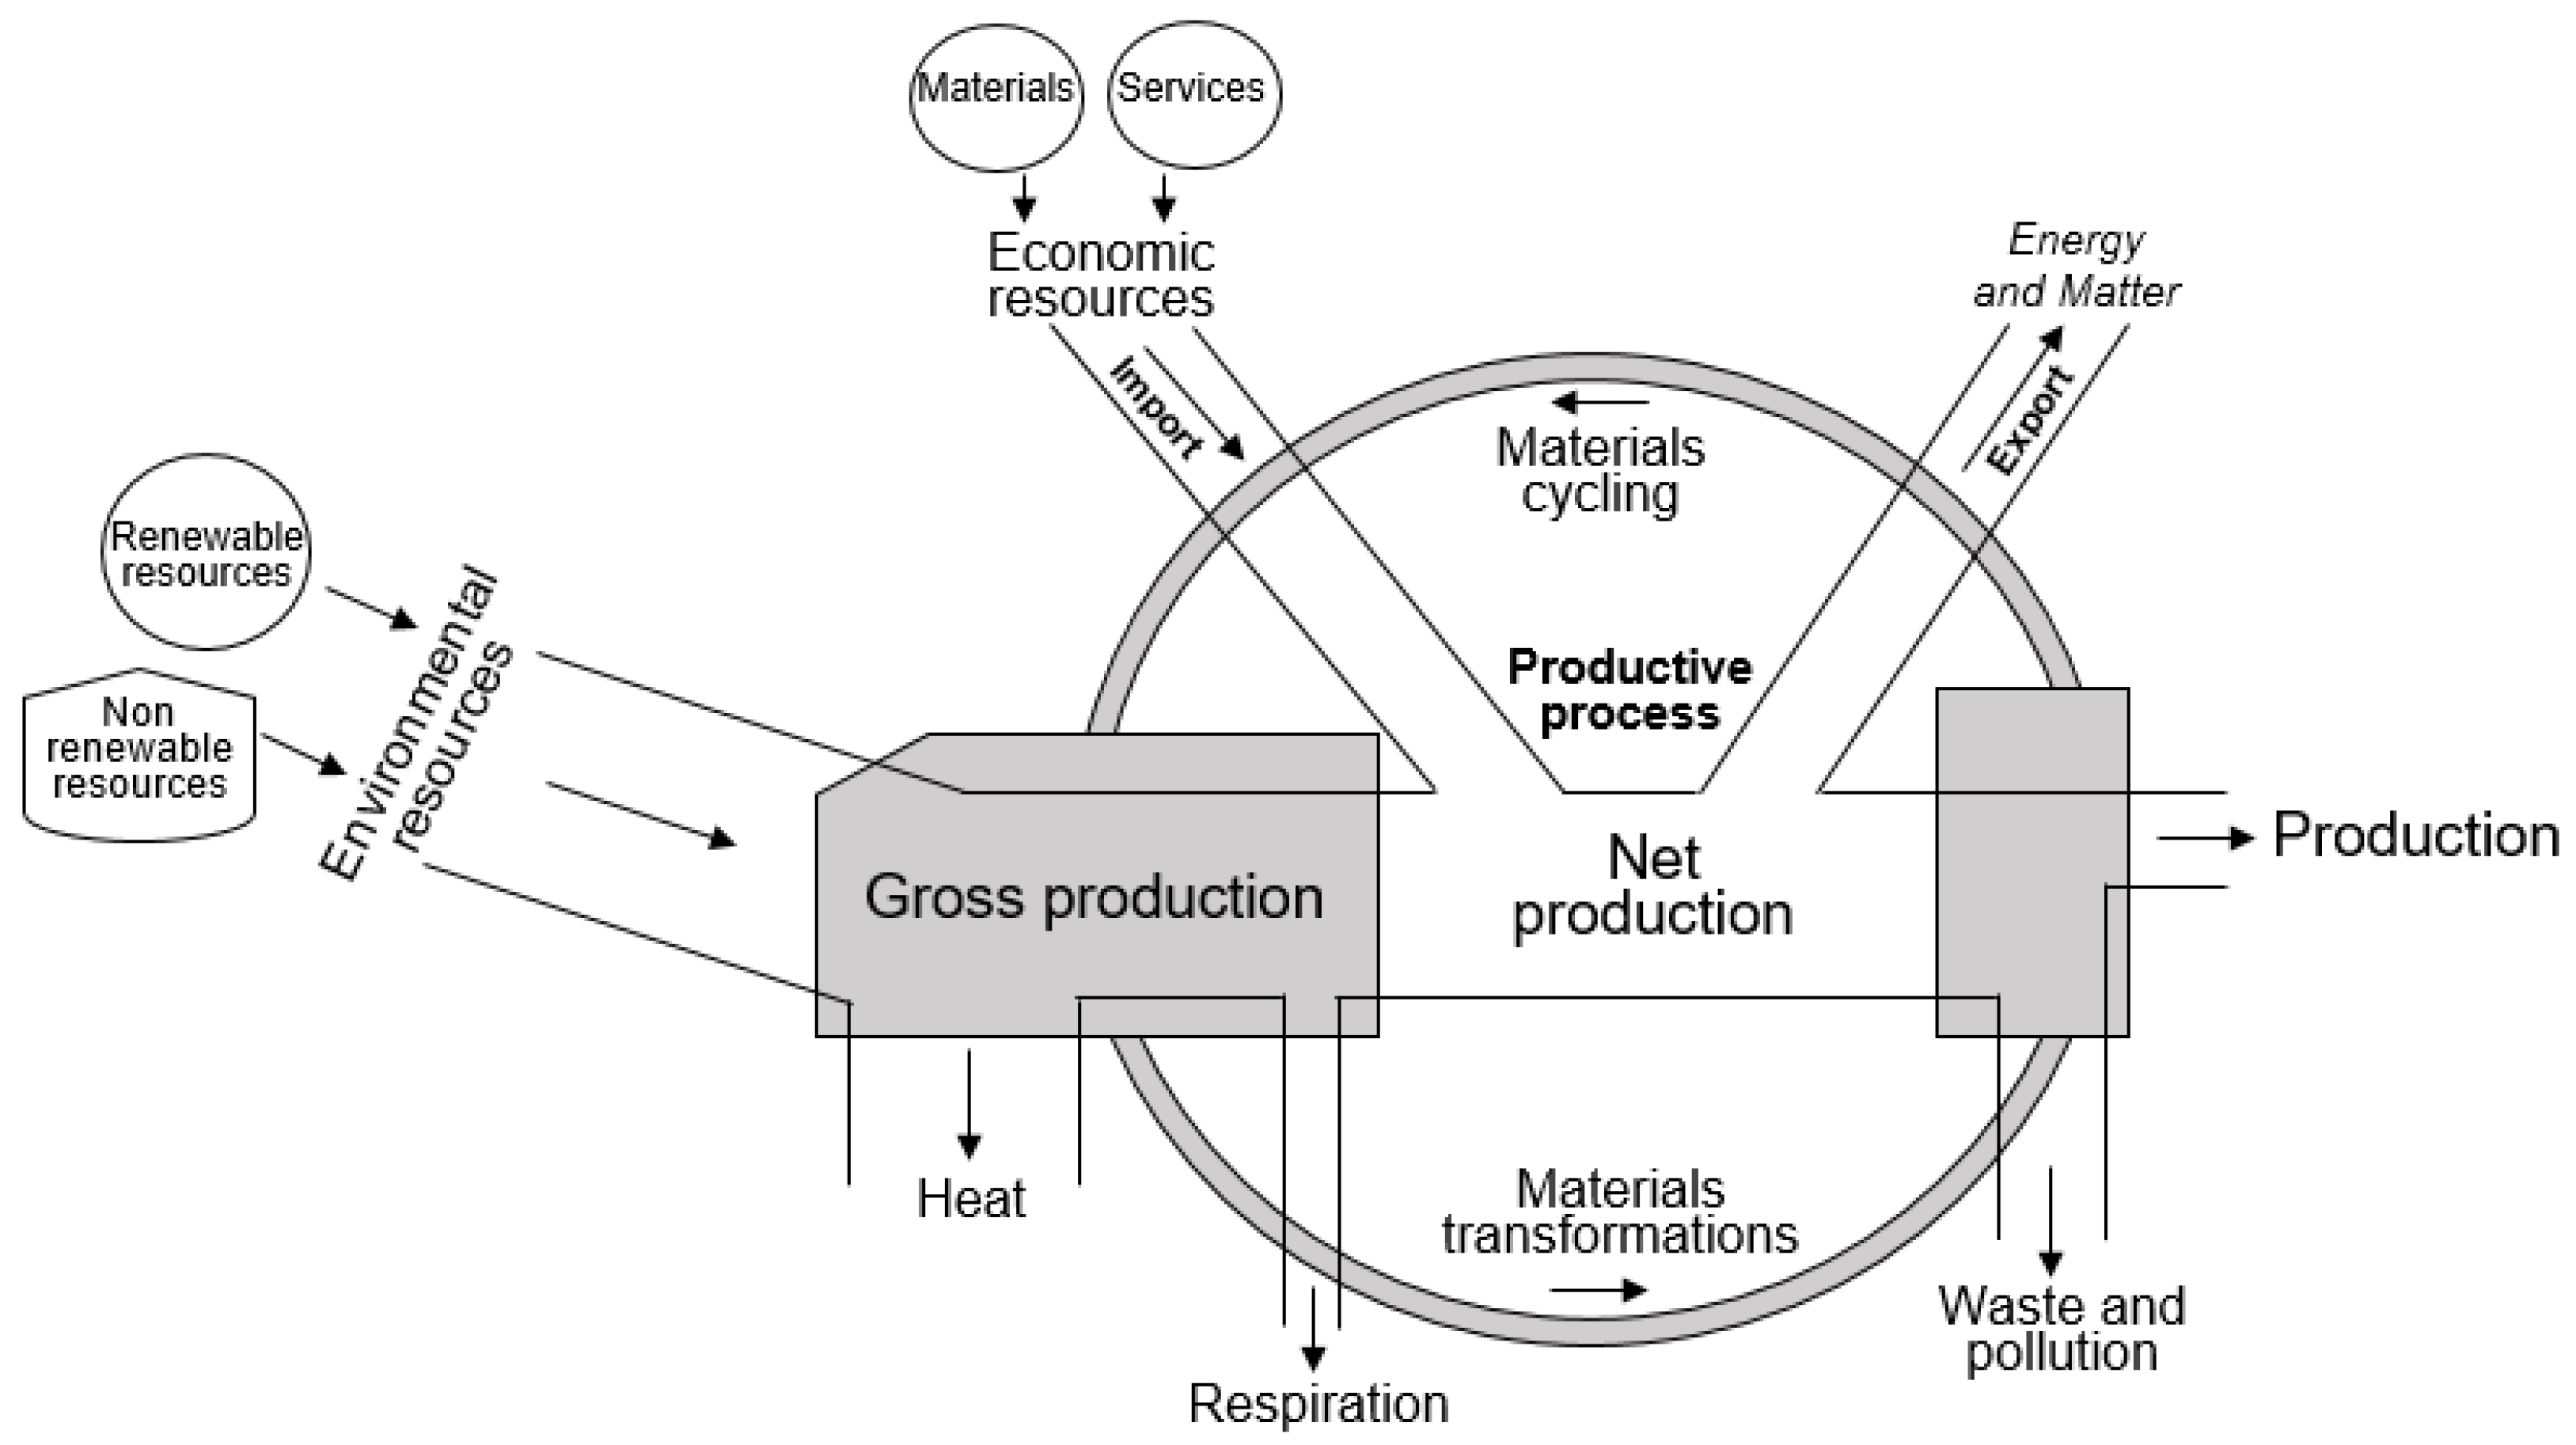
Figure 5 presents the coffee production model of the “Los Naranjos” farm using the energy systems symbology. The diagram shows the system boundaries and the energy sources that drive the processes. On the left side of the diagram are energies from nature (I = R + N, where R—renewables, and N—nonrenewables); on the top are resources from the economy, such as fuels, chemicals, electricity, labor, machinery, etc. (F = Materials + Services), and on the right side is the yield or total emergy (Y = R+ N + F). The farm’s production system modeling, performed in phase 1, provides a complete inventory of energy flows involved in each system’s stage. The energy flow accounting and analysis involved in the production system of the “Los Naranjos” farm was performed for the years 2018, 2019, and 2020.
Table 3 shows the emergy analysis for the year 2018, when the age of the crop was 9 years (other evaluation tables are available
Appendix A).
According to previous studies [
48], 90% of human labor is produced by nonrenewable resources (product of F), while 10% is obtained by renewable natural resources and is counted as an
FR input, and 80% of organic fertilizer is produced by renewable natural resources.
For the green coffee production system (
Table 3), inputs from the economy (F) contribute 75% of the total emergy, of which 70% are energies of non-renewable origin (FN), and 5% are renewable energies (FR). Energy from nature (I) represents 25% of the total emergy needed to produce green coffee, of which 15% is from non-renewable sources (IN) and 10% from renewable sources (IR). The production of coffee cherries for 2018 was 8765 kg/ha; applying a ratio of 0.18 [
57] to calculate the amount of green coffee, 1578 kg/ha are obtained. The energy equivalence of 1 kg of green coffee is 2.45 × 10
7 Joules [
24]); thus, the calculated UEV for the system is 1.29 × 10
6 seJ/J.
Two previous studies have performed emergy analysis in a coffee productive farm, one in Brazil [
24] and the other in Nicaragua [
27]. Regarding these investigations, the green coffee production of the “Los Naranjos” farm, Cauca, Colombia is 37% more energy efficient than that reported in Nicaragua, which was 1.77 × 10
6 seJ/J [
27]. On the other hand, the Brazilian system [
24], whose transformity was 4.25 × 10
5 seJ/J, is approximately 3 times more efficient than the Colombian system, and 4 times more than Nicaragua’s.
The system studied has standardized processes; as a result, there are no considerable variations in the percentages of energy contributions for the three years analyzed (
Table 4). For the years 2019 and 2020, inputs from nature (I) contributed 27%, and inputs from the economy (F) contributed 73%. The value of emergy, i.e., the useful energy used directly or indirectly to generate a product (green coffee), is gradually decreasing each year. Therefore, it is possible to indicate that the system was 15% more energy efficient in 2020 compared to 2018, with a UEV of 1.12 × 10
6 seJ/J, due to the reduction in the system’s emergy and the increase in production.
Analysis of the input and output energy flows of the system allows the determination of the driving factors that can impact the agricultural production process sustainability. The contribution of renewable and non-renewable sources for each stage of the coffee production process studied must be known (see
Table 5), in order to propose strategies that lead to the use of renewable and environmentally friendly energy.
Referring to the emergy invested in each stage of the production process (see
Figure 6), the planting stage is the one with the highest emergy demand, with an average of 46.1% for the 3 years analyzed of the total emergy of the system, wherein soil erosion and the human labor are the highest contribution flows. The harvesting stage contributes an average of 28.3% of energy demand, and human labor is the largest flow. The wet processing of coffee contributes 15.6%, and the pre-processing stage 10%. In these last two stages, the highest contribution flows are human labor, machinery and equipment.
The above is explained by the fact that the “Los Naranjos” farm’s objective is to produce high-quality export-type coffee, requiring, mainly in the two first stages, human labor to carry out the planting, fertilization, selection and harvesting of coffee cherries in optimal conditions, and in the final stages, the use of special equipment in different operations to guarantee the final product quality.
Figure 6 also shows that there is an emergy reduction of 0.328 × 10
16 seJ/year ha in 2020 compared to 2018. Contrary to this, the production of green coffee was higher in 2020 (115 kg/ha) than in 2018.
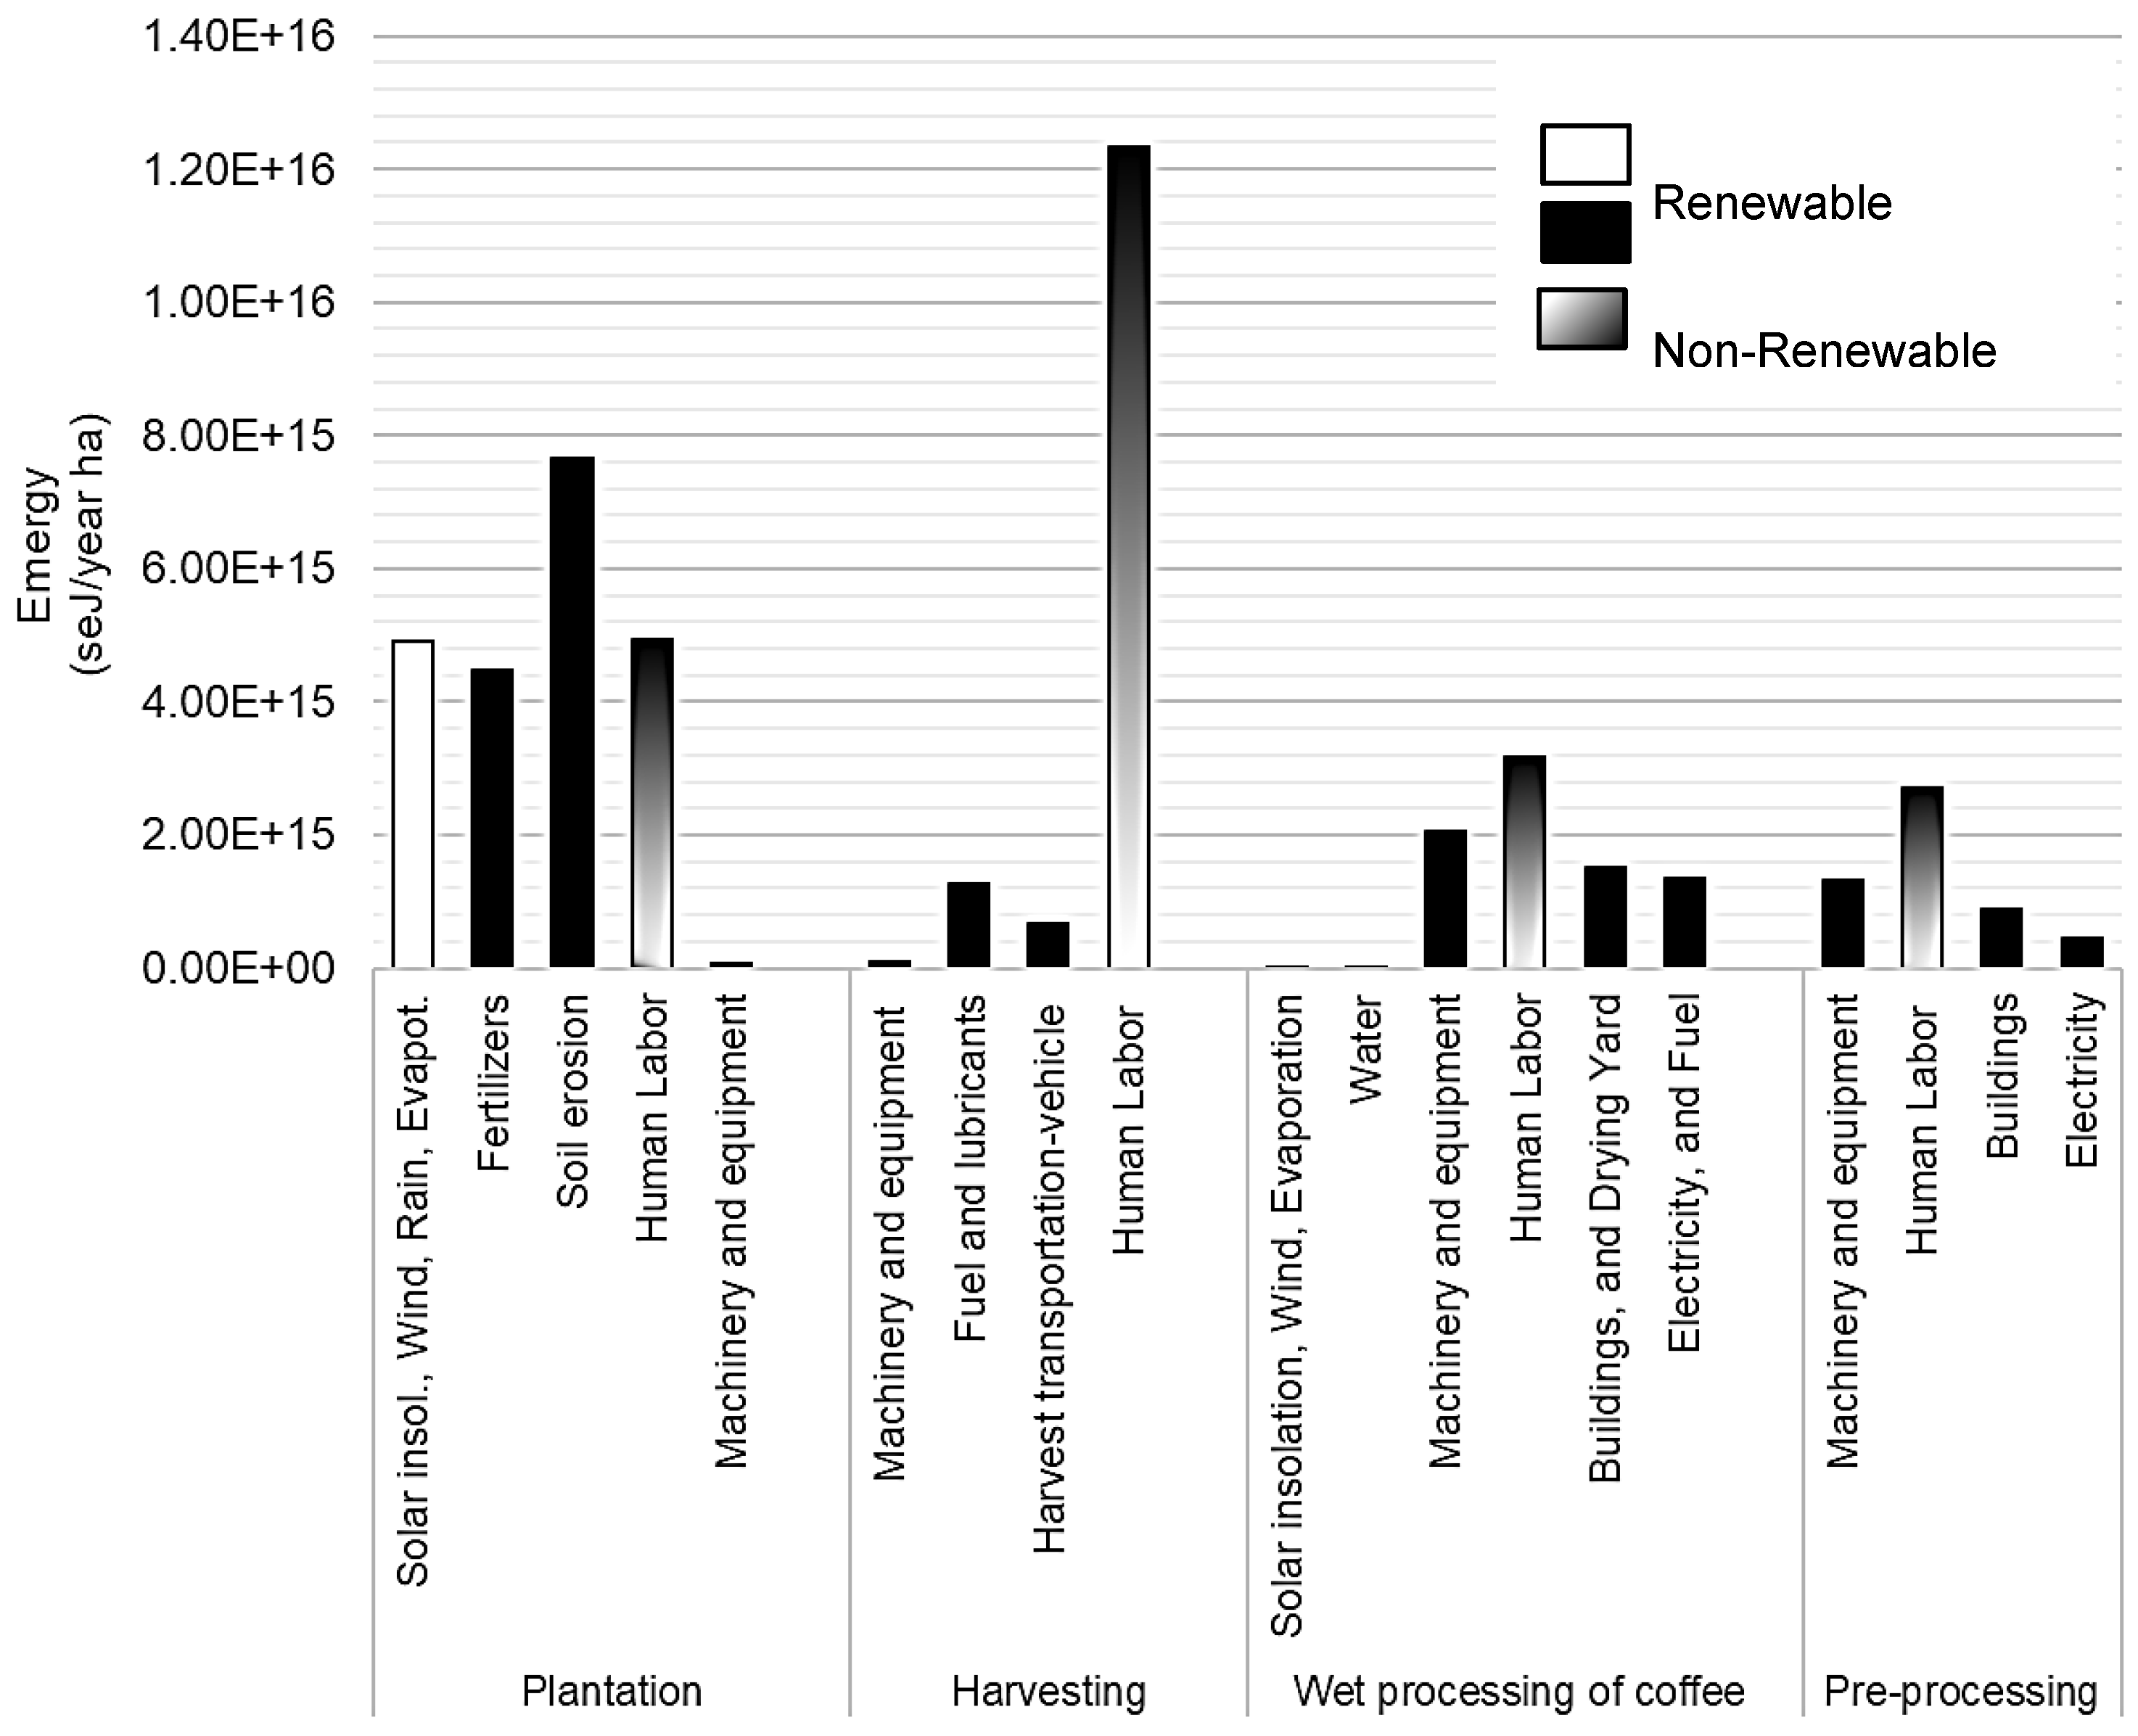
Figure 7 shows the main emergy flows in production stages of the “Los Naranjos” farm in 2018, as follows: (i) During plantation the emergy’s value was 2.21 × 10
16 (seJ/year ha), which corresponds to 44.2% of total emergy, of which 15% is from soil erosion, 9.9% from human labor, 9.8% from renewable natural resources (solar insolation, wind, rain, evapotranspiration), and 9% from fertilizers (nitrogen, phosphate, potassium, urea, lime). (ii) The emergy during the harvesting stage was 1.44 × 10
16 (seJ/year ha), which is equivalent to 28.8% of total emergy, of which human labor contributed 24.7%, fuel and lubricants 2.5%, and harvest transportation vehicle 1.4%. (iii) For the wet processing stage of coffee, the emergy was 8.09 × 10
15 (seJ/year ha), corresponding to 16.2% of the system’s emergy. Here, human labor contributed 6.4%, the machinery and equipment 4.1%, the buildings and drying yard 3%, and electricity and fuel 2.7%. (iv) The emergy during the pre-processing stage was 5.38 × 10
15 (seJ/year ha), equivalent to 10.8% of the total emergy, of which the human labor contributed 5.4%, the machinery and equipment 2.6%, the buildings 1.8%, and the electricity 0.9%. In all green coffee production, human labor is the activity that contributes the most emergy, 2.32 × 10
16 (seJ/year ha), which is equivalent to 46.4% of the required system’s emergy.
3.3. Phase 3: Basis for the Energy Management Systems—EMS (ISO 50001)
In addition to the modeling and energy performance of the systems, it is important to obtain the environmental performance indicators, which offer key information for the decision-making process and are the basis for an energy management system (EMS). An emergy index summary for green coffee production for the 3 years analyzed is presented in
Figure 8.
The Emergy Yield Ratio (EYR) does not vary greatly in the three years studied, with values of 1.34 for 2018 and 1.35 in 2020, indicating little capacity to exploit local resources, and that the emergy of the system is largely based on economic resources. However, it should be noted that the system’s productivity increased considerably, from 1578 kg/ha of green coffee in 2018 to 1693 kg/ha in 2020, showing that the productivity increase does not require a higher percentage of energy purchased in the system balance.
The Environmental Loading Ratio (ELR) in 2018 was 5.9, and it was 5.7 in 2020, indicating a reduction in the pressure exerted by the system on the environment. The ELR is closely linked to the “% Emergy Renewability” used by the system, since a low value of renewable emergy generates greater environmental pressure. At “Los Naranjos” farm, the % Emergy Renewability was 14.4% in 2018, and 14.8% in 2020. Thus, the ELR values indicate that the system generates a moderate environmental impact, depending to a high degree on the emergy provided by external resources (purchased). Finally, it is interesting to highlight the reduction in the ELR (lower environmental impact) in these 2 years, in relation to the increase in productivity, showing that the system is able to produce more without increasing the negative impacts on the environment when processes are well adapted.
The Emergy Investment Ratio (EIR) in 2018 was 2.98, and was 2.71 in 2020. These values indicate that the emergy derived from local resources is low, compared to the emergy derived from economic resources. Despite this, it is important to consider that in addition to the increase in productivity, there was an improvement in the EIR, which means an increase in the efficiency in the use of local resources for the year 2020.
Finally, the Emergy Sustainability Index (ESI) had a slight increase over the 3 years studied, going from 0.22 in 2018 to 0.24 in 2020, indicating that the system improved in relation to its sustainability. This indicator is composite and relates the EYR and ELR. For a system to be sustainable, it must obtain the highest ratio of yield and the lowest environmental load. The above is explained by the small increase in EYR from 2018 to 2020, and by the decrease in ELR in this time period. Comparing this indicator with the result obtained in Brazil [
24], which was 0.14, and in Nicaragua [
27], which was 0.13, it is possible to say that the farm studied in Colombia is a more sustainable system.
According to [
15], in a natural system, transformities reach a theoretical lower limit, i.e., the highest possible energy efficiency. On the other hand, coffee production is an intervening, man-made system, which is driven by energy resources from nature and the economy, depending on market demands, and the socio-ecological conditions surrounding the production process. Relating ESI, the UEV and production (
Figure 9) provides an idea about the “optimal” production system of the “Los Naranjos” farm, which allows for obtaining a low UEV (efficient) and a high ESI (sustainable).
Comparing the three years analyzed, the “Los Naranjos” farm had its best environmental and energy performance in 2020, with a production of 1693 kg/ha of green coffee, where the UEV was the lowest, 1.12 × 10⁶ seJ/J, and the Emergy Sustainability Index (ESI) increased. This indicates that the decisions taken in recent years have led to a notable improvement in the efficiency and sustainability of the system.
The emergy analysis here conducted (2018–2020) offers a report on agricultural production practices commonly adopted by the Los Naranjos farm. The most representative emergy flow in the three years analyzed is the “human labor” flow; in 2018 it contributed 46.49% of the total emergy of the system, in 2019 it was 43.35%, and in 2020 it was 42.63%. In recent years, according to information from the Los Naranjos farm managers, educational programs have been implemented for employees, and time and movement studies have been carried out to optimize the practices of employees in the different stages of the production process. These programs have contributed to improinge the system’s sustainability and efficiency, mainly in the harvesting and wet processing stages.
This system’s improvement in relation to energy performance is the basis for structuring an energy management system (EMS) in an organization. According to ISO 50001, in the first stage (Plan) of the PDCA continuous improvement cycle, an energy review should be performed to understand the current state of the organization, identifying energy flows and significant energy uses. In this way, the process and energy modeling performed in this study generate a baseline of energy and environmental performance indicators, which could be very useful in the decision-making process, and in the definition of objectives, goals, action plans, and policies, which guide the organization to continuously improve.
4. Conclusions
Global population growth has necessitated more food production, generating agricultural intensification, which results in the greater use of agricultural supplies as well as causing environmental problems. Agriculture combines natural resources and economic inputs to produce food. This socio-ecological interaction requires a comprehensive assessment that contributes to the sustainable development and energy efficiency of these systems.
Through this research, a multidisciplinary assessment approach is proposed that integrates process modeling, emergy analysis, and the basis of an energy management system (EMS). This approach was validated in a coffee production system, in “Los Naranjos” farm, Cajibío, in the department of Cauca, Colombia, during the time period from 2018 to 2022. This proposal makes it possible to: (i) have a comprehensive inventory of energy flows from nature and the economy, (ii) identify the significant uses of energy in the different production system stages, and (iii) obtain environmental sustainability indicators that help in the decision-making process and establish an EMS basis.
In the validation of the coffee production system, it was observed that the highest Emergy Renewability percentage was achieved in the year 2020, with a value of 14.8%. The EYR did not change considerably during the period studied, with values between 1.34 and 1.35, indicating that most of the system’s output came from economic resources. The EIR performed better in 2020 with a 2.71 value, indicating a slight improvement over emergy from local resources. The ESI increased in the analyzed period, from 0.22 to 0.24, improving the sustainability of the farm. Along with these indicators, the increase in the system’s productivity should be highlighted, as it went from 1578 kg/ha of green coffee in 2018 to 1693 kg/ha in 2020. The emergy value gradually decreased each year, indicating a 15% more energy efficient system in 2020 compared to 2018. Finally, it can be inferred that the farm achieved its best energy performance and was more sustainable in 2020, producing 1693 kg/ha of green coffee, with the lowest UEV (1.12 × 10⁶ seJ/J) and the highest Emergy Sustainability Index (ESI) (0.24).
On average for the three years analyzed, the stage with the highest emergy demand was the plantation stage with a 46.1% share of total emergy. The harvesting stage contributed 28.3%, the wet coffee processing stage 15.6%, and the pre-processing stage 10%. Throughout the entire production process, the activity that contributed the most emergy was human labor, with approximately 46% of the total emergy. The system has a large part of its processes standardized in order to guarantee the quality of its export product. In addition, according to information reported on the farm, there has been continuity in the employee training processes, generating an important installed human capacity that fulfills operational and administrative functions, but which also generates added value in the products through research, innovation, and entrepreneurship processes, which are related to the regional coffee sector.
Emergy flows such as solar insolation, wind, rain, and evapotranspiration, which depend on local climatic variations that influence the production process, are incorporated in the analysis of emergy carried out from 2018 to 2020. However, the climatic conditions of the area during the three years analyzed did not show significant variations that would considerably affect the farm’s productivity. Rainfall (m) was the variable showing the greatest variation, with values of 0.159 in 2018, 0.142 in 2019, and 0.165 in 2020. Notably, the seasonal regime is bimodal, and there are two rainy seasons (from April to June and from August to November, and two summer periods) in most of the country. Climate data were obtained from national databases (
http://www.ideam.gov.co (accessed on 25 May 2022), and from
https://agroclima.com (accessed on 25 May 2022)). Furthermore, due to the standardized production of the farm under study, there is no evidence of serious biological effects such as rust and fungi.
The annual emergy analysis helps to diagnose significant energy consumption at each stage of the agricultural production process. From this perspective, sustainable alternatives can be analyzed, e.g., shading, renewable energy sources, agro-ecological systems, recycling, optimization of human labor, etc., to help mitigate possible scenarios of change (climatic, economic, market and political). This systemic approach enables decision-makers to find more efficient and sustainable options for each particular system.
To improve the studied system, it is recommended that the farm make use of alternative sources of electrical energy, such as photovoltaic. It would be useful to implement this type of technology mainly in the wet processing and pre-processing stages. In addition, we suggest looking for alternatives that help to optimize the harvesting stage, and it would also be helpful to consider the loss of coffee beans in the transportation from the crop to the collection center.
The proposed multidisciplinary approach allows for an integral analysis of the energy flows involved at the coffee production farm, determining the significant energy uses and the energy sources at each process stage. This information is essential to decision-making in any agricultural system, and for establishing the basis for an Energy Management System (EMS). Ultimately, it would be beneficial if the multidisciplinary approach could be implemented in other agricultural production systems, which would help to enrich the discussion on this topic.


 ,
, 

