Article

Enhancement of Solar PV Hosting Capacity in a Remote Industrial Microgrid: A Methodical Techno-Economic Approach

1
Department of Electrical and Electronic Engineering, Ahsanullah University of Science and Technology, Dhaka 1208, Bangladesh
2
Energrid Engineers Ltd., Dhaka 1212, Bangladesh
3
Department of Electrical and Electronic Engineering, Green University of Bangladesh, Dhaka 1207, Bangladesh
4
Institute of IR 4.0, Universiti Kebangsaan Malaysia, Bangi 43600, Malaysia
5
Department of Electrical Engineering, Bahauddin Zakariya University, Multan 60000, Pakistan
6
Department of Electrical Engineering, College of Engineering, Qassim University, P.O Box 6677, Buraydah 51452, Qassim, Saudi Arabia
7
Department of Electrical and Electronic Engineering, University of South Wales, Pontypirdd CF37 1DL, UK
*
Authors to whom correspondence should be addressed.
Sustainability 2022, 14(14), 8921; https://doi.org/10.3390/su14148921
Submission received: 23 May 2022 / Revised: 30 June 2022 / Accepted: 1 July 2022 / Published: 21 July 2022
(This article belongs to the Special Issue Sustainable Development and Optimisation of Energy Systems)

Abstract

:
To meet the zero-carbon electricity generation target as part of the sustainable development goals (SDG7), remote industrial microgrids worldwide are considering the uptake of more and more renewable energy resources, especially solar PV systems. Estimating the grid PV hosting capacity plays an essential role in designing and planning such microgrids. PV hosting capacity assessment determines the maximum PV capacity suitable for the grid and the appropriate electrical location for PV placement. This research reveals that conventional static criteria to assess the PV hosting capacity fail to ensure the grid’s operational robustness. It hence demands a reduction in the theoretical hosting capacity estimation to ensure grid compatible post-fault voltage and frequency recovery. Energy storage technologies, particularly fast-responsive batteries, can potentially prevent such undesirable scenarios; nevertheless, careful integration is required to ensure an affordable cost of energy. This study proposes a novel methodical techno-economic approach for an off-grid remote industrial microgrid to enhance the PV hosting capacity by integrating battery energy storage considering grid disturbance and recovery scenarios. The method has been validated in an industrial microgrid with a 2.6 MW peak demand in a ready-made garment (RMG) factory having a distinctive demand pattern and unique constraints in remote Bangladesh. According to the analysis, integrating 2.5 MW of PV capacity and a 1.2 MVA battery bank to offset existing diesel and grid consumption would result in an energy cost of BDT 14.60 per kWh (USD 0.1719 per kWh). For high PV penetration scenarios, the application of this method offers higher system robustness, and the financial analysis indicates that the industries would not only benefit from positive environmental impact but also make an economic profit.

1. Introduction

Rapid industrialization has resulted in a dramatic increase in product demand for various sectors throughout the world. In every country, large and medium-sized industries are expanding at a faster rate than ever before. These space-consuming industries locate their technology, machinery, and office spaces mostly in remote regional locations based on the availability of land-area, energy resources, workforce, transportation, and logistics. It may be mentioned that a large number of these distant regions are off-grid, and extension of the central electric grid to those regions is not conceivable owing to techno-economic issues in developing countries. As a result, there is always a concern about ensuring a dependable and high-quality power supply to build sustainable growth. This influences respective countries’ ability to achieve their sustainable development goals by 2030.
Being one of the developing countries, Bangladesh is also reaping the benefits of fast industrialization. Due to the rapid expansion of related industries, the once agro-based economy has shifted to an industrial economy. The ready-made garments (RMG) business plays a considerable role in its economy among all other local industries. In 2021, Bangladesh’s textile sector was the world’s second-largest exporter, hosting more than 4000 RMG factories [1]. Bangladesh has the highest number of LEED (Leadership in Energy and Environmental Design) platinum-rated garment factories globally, owing to industry owners’ emphasis on a dependable and sustainable power supply system for their businesses [2]. According to the PV magazine, more than 500 enterprises have recently registered to make their production facilities more environment friendly by utilizing the net-metering facility offered by the utility [3]. According to some government bodies, these factories consume almost one-sixth of the country’s energy consumption, and through the low-cost financing mechanism, the adoption of net-metered solar PV systems would significantly offer better energy efficiency and industry performance.
In the maximum of these RMG industries, the manufacturers opt to control their power supply on their own in addition to the grid supply. Many of these RMG manufacturers are located in remote or off-grid/isolated areas where grid electricity is either of poor quality or non-existent. Traditionally, diesel-powered systems have primarily been prioritized to the electrification of the industry as a result of their dispatchable nature, along with trouble-free installation features and lower initial costs [4]. However, fluctuating prices, the fuel supply uncertainty and the dependent supply chain mechanisms tend to obstruct the availability of fuel and fuel trade. As an alternative, solar PV and wind energy systems offer significantly less environmental impact than diesel-based energy systems and offer an affordable and reliable energy supply. However, considering the local context, the only available source is the solar PV in this case. This has opened the door to incorporating locally exploitable clean energy resources into the generation mix. Integrating these systems can help save money by reducing the dependency on the grid and taking advantage of government rebates and facilities. The regular operation and maintenance costs and the initial investment of the solar PV systems have been decreasing in recent years. Hence, in many regions, solar PV incorporated hybrid energy systems provide a cost-effective and technically reliable solution to the demand; global studies conducted by Jamal et al., and El-houari et al., suggest this finding [4,5,6]. To incorporate such hybrid energy system, a microgrid is a well-accepted concept in remote regions and is becoming more popular day by day [7,8].
The entire capacity of the PV systems that may be integrated into a particular microgrid without exceeding steady-state operating constraints is referred to as the hosting capacity (HC) of PV. The HC of the PV system in a network gives an indication of the theoretical maximum level of total PV system capacity that is allowed in the network. The HC estimation needs to consider the network demand profile, generator dispatch profile, operating reserve, PV system’s diversity and fluctuation factors, step load capacities of generators, and generator startup and minimum run time etc. [9]. Hence, the majority of HC evaluations presented in the literature are based on steady-state analyses. HC can alter depending on the reference parameter, network conditions, topology, location, and PV deployment scenario. HC is, therefore, not a unique value, and it greatly depends on the appropriate selection of the mentioned performance indices and their limits [10]. According to [11], some of the notable challenges for remote PV-diesel electricity networks include maintaining supply quality, legacy infrastructure, spinning (i.e., operating) reserve policy, etc. With an increased share of PV, various switching operations play influential roles in the network [12]. Studies in [13] show that operation may become unstable with diesel generators turned off in a diesel-PV based microgrid. Ismael et al. also stated that HC should be calculated regularly based on various performance indices such as voltage and frequency variations, power quality, etc. [10]. In references [14,15,16,17,18,19,20,21,22,23,24,25], the energy systems are designed and analyzed through various techno-economic studies. Calculating the HC gives the assessment of PV capacity to be integrated into the grid without violating the grid code. A few studies, including [26,27,28] identified the necessity of considering critical technical scenarios along with the investigation of the economic feasibility of industry operations. However, to the best of the authors’ knowledge, the existing literature did not carry out detailed studies taking the issues of varying operation scenarios under system disturbances. The comparison between this work and other similar works is given in Table 1.
This study showcases that HC determination using only static parameters is merely a theoretical capacity, and this capacity has to be sacrificed under extreme operation scenarios. A step by step methodology is thus proposed whereas battery energy storage system (BESS) is integrated to stabilize the system dynamics and enhance the PV HC of the system. Adopting this strategy evades the risk of sacrificing potential PV capacity. An economic feasibility study followed by a literature evaluation with earlier studies shows the eminence of the proposed method. The cautionary planning approach proposed in this work is expected to be helpful in the future development of PV integrated industries operating in the off-grid mode in remote areas. The proposed methodology is globally applicable; however, the simulation and the method’s efficacy have been validated using an RMG factory grid information from Bangladesh. Due to network information intellectual property issues, data scaling has been employed wherever necessary.
The core novelty and contribution offered in this study can be summarized as follows:
  • Developing a methodological approach for evaluating the PV hosting capacity for an industrial microgrid considering operational issues
  • Validating the method by assessing the robustness against significant disturbances in an industrial microgrid
  • Evaluating the techno-economic feasibility of high penetration of PV scenarios for a test case scenario (industrial microgrid)
  • Demonstrating a systematic pathway to introduce sustainable energy technologies for ready-made garment industries to address the requirements for a green factory, which would, in the long run, attract more buyers and investors
  • To the best of the authors’ knowledge, this methodological approach is one of its kind, found in the literature regarding the hybridization of the unique electrical power system network of the ready-made garment industry in a developing country like Bangladesh
The article is organized as follows: Section 2 discusses the concept of HC of PV systems in the grid and presents the issues of an industrial microgrid that need particular attention while determining the HC. Section 2 also presents the step-wise methodology to determine the ultimate HC of a microgrid. Results and discussions are presented in Section 3, and Section 4 draws conclusions highlighting the findings.

2. Materials and Methods

2.1. Solar PV Hosting: Performance Indices and Challenges in Remote Industrial Microgrids

Uncertainties in solar PV generation impose challenges on the control of a microgrid (MG). Due to the intermittent nature of solar PV and wind, different issues such as voltage flicker and voltage fluctuations occur in an MG. Poor connectivity with the grid in a remote power system raises several technical issues, including voltage drops, low power quality, and high line losses. These issues make the MG less economically feasible in remote areas for grid-connected operations [29]. Due to different characteristics and types of loads and PV uncertainties, a remote MG’s key challenges are maintaining the voltage and frequency within a permissible range. The PV HC of a network gives an indication of the allowed level of total PV systems’ capacity in the network. The technical issues that are considered by PV HC calculation are based on the static and dynamic system performance [12].
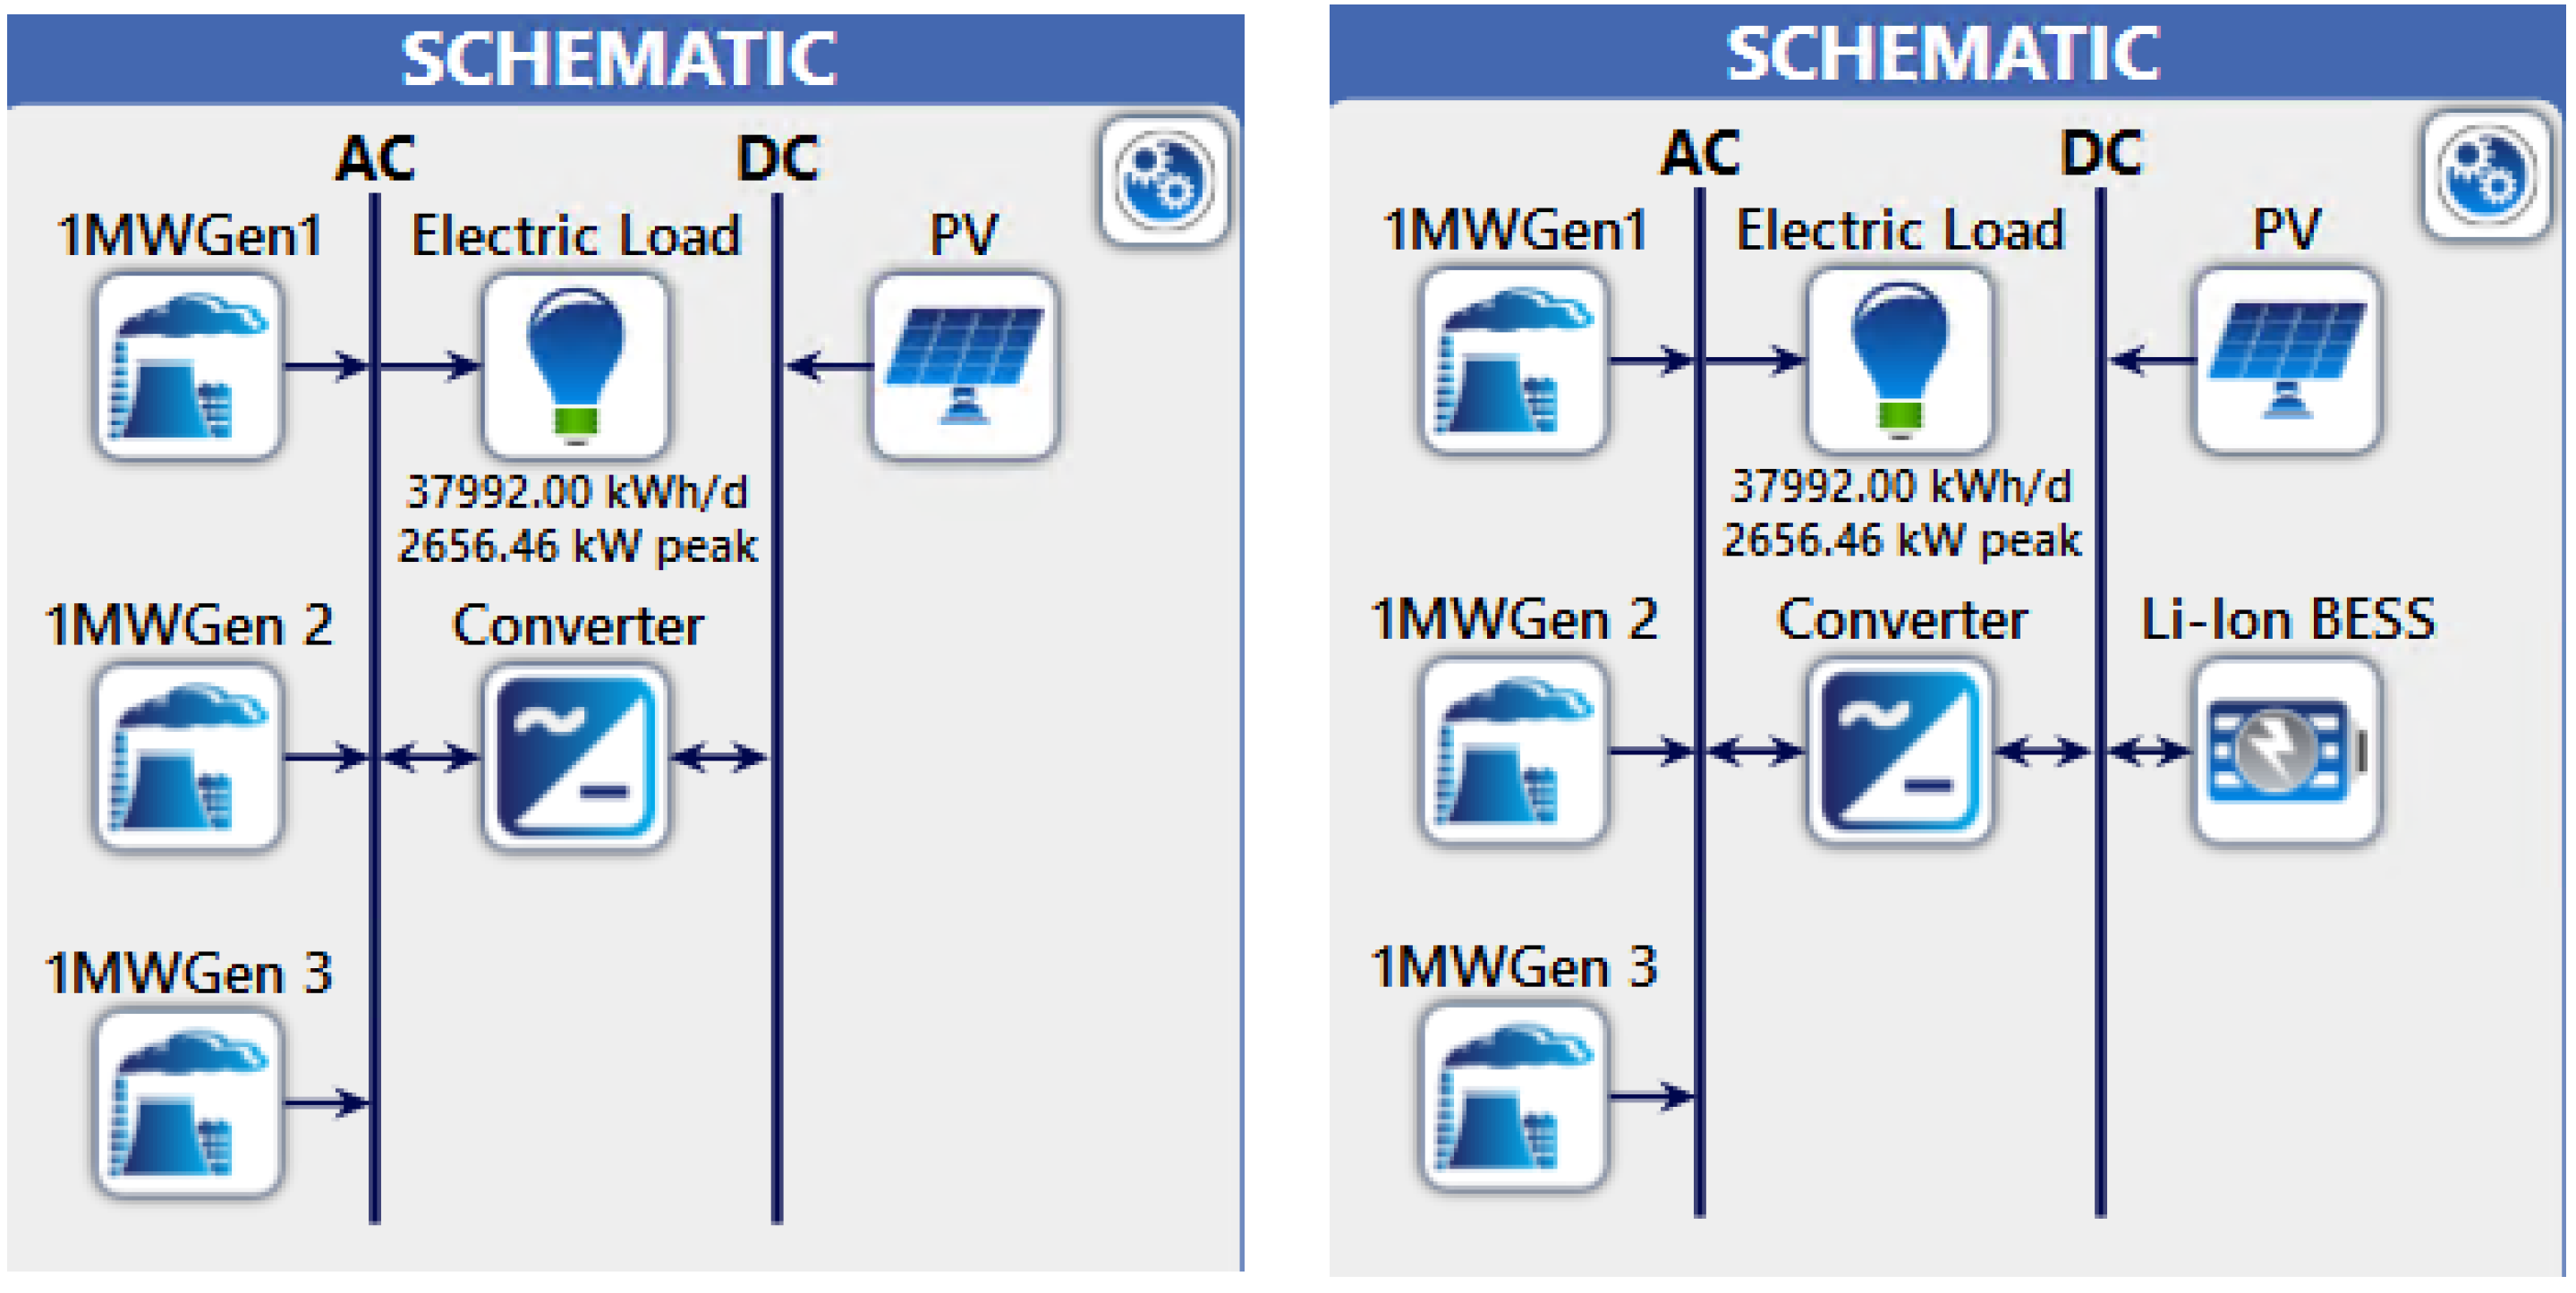
The key components of the industrial microgrid considered in this work are portrayed in Figure 1. BESS has been used increasingly along with solar PV in an MG due to its ability to facilitate the MG to operate in the off-grid mode by providing synthetic inertia. In addition to that, BESS is also helpful in a power system to smooth the supply and demand differences, which is hampered by the intermittent nature of solar PV or fluctuation of loads [30]. The application of BESS has also demonstrated superior system performance in terms of restoring a system during post fault scenarios. Thus, BESS has become a proven technology to enhance system resiliency. However, regarding the integration and operation of BESS in microgrids, consideration of economic factors play a critical role in determining the system configuration and levelized cost of energy (LCOE) [31]. Hence, economic analysis of the whole procedure is recommended to investigate the techno-economic feasibility of a microgrid consisting of PV-BESS systems [32].
As mentioned earlier, the HC of PV system for a specific power system can be defined as the amount of PV generation capacity (usually for distributed generation) integrated into the power system, above which the system’s operating conditions are violated [10,33,34,35]. The HC of PV in a network can be determined by an iterative method considering the system power factor, voltage regulation and equipment loading [33]. HC of the respective network also depends on the characteristics of the network, load and generation stream [36]. Remote networks have lower estimated HC values than urban networks due to the topological and electrical characteristics of the weak network and voltage rise difficulties at the end of lengthy feeders [37]. An extensive literature review reveals a few standard criteria for determining the HC, based on analyzing the overvoltage, thermal overloading, electrical power loss, power quality and protection problems [10]. Some of these static performance issues are briefly described as follows:
(1)
Voltage limits violations
The major voltage issues due to a high PV penetration include overvoltage at the end of the feeder, flicker, voltage sag and swell. Among these, overvoltage is the dominant issue. Fatima et al. have discussed five commonly used voltage standards such as the European standard (±10% of nominal voltage, VN), German standard (+3% of VN), American standard (±5% of VN), Australian standard (−6%/+10% of VN) and Canadian standard (±6% of VN) [37]. Increasing PV penetration without proper technical estimation violates the overvoltage range in the respective network, and thus, an upper limit on the aggregated PV capacity is required. Another issue is flickering, which originates due to the excessive amount of renewables in the system and propagates to the distribution feeder [38]. The variability characteristics of PV output and lack of system inertia due to high PV penetration in an MG leads to frequent flickering, voltage sag and swell problems [39].
(2)
Ampacity and thermal limits
The current capacity of cables and transformers impose a limit in integrating a higher amount of PV. Several countries and regions have different overload limits to incorporate PVs in an industrial MG. Fatima et al. have discussed several overload limits for transformers and cables, including 85%, 100%, 150% and 187.5% of nominal values across different countries [37].
(3)
Unbalance
The negative sequence unbalance is another challenge while integrating more PV generation in an MG. The limit of this unbalance is being set to 2% by IES standards [37], and [37] have addressed different negative sequence unbalance limits such as 1%, 1.3%, 2% and 3% of VN [37].
(4)
Harmonics
The authors in [40] investigated a rural low voltage residential distribution network for maximal PV penetration using harmonics as a limiting factor. The operation of a renewable integrated MG is adversely affected by harmonics generated by power electronics converter interfaced with solar PV. Harmonics are also generated due to the non-linearity of loads in an MG. The operators must limit these harmonics by limiting the third harmonic distortion (THD) to ensure power quality. Several studies have taken maximum THD as 6.1% and 5%. Harmonics reduces energy transfer capability as well as increases system loss [37].
The indices discussed above primarily play a significant role in determining solar PV hosting capacity in a large network as well as in microgrids strongly connected to a grid. In large power systems, a large number of conventional generators take part in primary control with sufficient droop characteristics. This strategy mitigates any sudden imbalance between load and generation and keeps the frequency within the permissible range. When an MG is strongly connected to the grid, it gets high inertia support to mitigate any frequency issue caused by sudden disturbances such as faults, large load or generation change. However, the inertia support is insufficient in off-grid operation due to small-sized conventional generators, and the high shares of power electronic converter interfaced PVs. As a result, sudden frequency issues due to any disturbance are hard to mitigate. This eventually causes cascading failure and tripping of DGs according to various interconnection policies in practice across utilities [41].
In the off-grid operation of industrial MG, motor starting events may lead to generator swing [42]. Reference [43] have analyzed the effect of motor starting in a weak grid having a mix of conventional and inverter-based generation. The large currents caused by the starting motors may easily exceed the current limit of inverter-based generation. Large disturbance scenarios, i.e., faults or loss of generation or significant load increment, may cause a severe impact on MG operations [44]. Hence, wide integration of solar PV (unlimited HC) might not always ensure grid-compatible operation, especially under post-fault conditions. The next section presents a methodological development of a unique approach that showcases the limitations of theoretical HC under post-fault scenarios and proposes the enhancement of HC of PV system with integration of BESS.

2.2. Proposed Methodology Considering Techno-Economic Issues

The proposed methodology finds out technically feasible HC of solar PV in an industrial microgrid through two principal steps.
Step 1: Evaluate HC of test system considering static operational issues and find its robustness against significant disturbances
Step 2: Overcoming technical obstacles to reach target HC
These two steps are followed by a feasibility study to assess the economic validity of the newly determined HC. A necessary flowchart to understand the methodology is shown in Figure 2. The steps can be described as follows:

2.2.1. Step 1: Evaluate HC of Test System Considering Static Operational Issues and Find Its Robustness against Significant Disturbances

There are various ways to determine the HC of the PV system in a network mentioned earlier in Section 2.1. There are different criteria, on which the HC calculation is based, such as voltage and frequency variations, overvoltage, thermal overloading, electrical power loss, power quality and protection problems. The first step of this methodology is to find out the HC of PV of this industrial MG considering some static criteria and then find the system’s robustness against a significant disturbance in the presence of PV. Calculation of PV HC is an iterative method that is based on the binomial search method [45]. The algorithm continues until convergence is obtained without violations within the maximum number of iterations. This value can be said to be the maximum HC for that bus in the system. After getting the maximum HC value for one bus, the maximum HC for the rest of the buses in the system is obtained by the same algorithm. The bus with maximum PV HC will be sorted after completing the above process. With this analysis, it will be easier to decide the location and the maximum allowable size of PV that does not violate the considered criteria. To calculate the PV HC, the formulations are given below:
Objective   function :   Maximize ,   P P V i
Subject   to ,   P i = k = 1 n | V i | | V k | ( G i k c o s θ i k + B i k s i n θ i k )
Constraints :   V m i n V i V m a x
I i k I i k m a x
where,
  • P P V i = Active power injection by solar PV at bus i
  • P i = Total active power of bus i
  • G i k = line conductance between bus i and bus k.
  • B i k = line susceptance between bus i and bus k.
  • V m i n = Lower voltage magnitude boundary of bus i
  • V i = Voltage magnitude of bus i
  • V m a x = Upper voltage magnitude boundary of bus i
  • I i k = Line current between bus i and bus k
  • I i k m a x = Maximum allowable line current between bus i and bus k (thermal constraint)
Now to observe whether this sizing is technically robust or not, a system disturbance is introduced. In this study, a 3-phase short circuit fault is placed at the bus having the maximum load with successive clearance after 0.2 s. If the system can withstand the fault, i.e., the post fault voltage and current are within the allowable limit set by IEEE std. 1547-2018 [46], it only can be said that the system is technically robust; otherwise, not. Details of the regulations stated in IEEE std. 1547-2018 have been listed in the section: Grid Rules:. If the system fails to maintain post fault voltage and frequency within the permissible range, the size of PV is reduced gradually until the system is capable of maintaining allowable post fault voltage and frequency. This reduced size of PV is called the uncontrolled HC (achieved HC without the support of BESS) for this system.

2.2.2. Step 2: Overcoming Technical Obstacles to Reach Target HC

To further increase the share of PV in the system, a BESS is introduced. Now, the system goes through a resiliency test. If the post fault voltage and frequency stay within the permissible limit (according to IEEE std. 1547-2018), more PV generation is injected until the system fails to stay within the allowable post fault voltage and frequency barrier when the fault condition is simulated in the system during the resiliency test. Then the size of BESS is increased to incorporate more PV in the system until the PV size reaches the maximum (with the support of BESS).
Grid Rules:
The interconnection policy plays an important role in MG operation and control. According to IEEE std. 1547-2018, any distributed generation (DG), or PV systems in this study are subjected to mandatory tripping in case of any voltage and frequency deviation from its nominal values after a specific ride through time [46]. The mandatory trip setting due to voltage and frequency violations are given in Table 2. The ranges of allowable settings given in the tables do not require the DG to ride through this magnitude and duration of voltage and frequency. The local DG operators can set the voltage and frequency threshold with a specific clearing time for DG tripping due to abnormal voltage and frequency within the specified limits. It can be seen that the continuous operational voltage range is 0.88 p.u. ≤ V ≤ 1.10 p.u. and the continuous operational frequency range is 0.975 p.u. ≤ f ≤ 1.02 p.u.

2.3. Evaluating Economic Feasibility of Proposed HC

Following the completion of the technical study, the techno-economic analysis is performed to assess the economic feasibility of the technical solution proposed in the flowchart of Figure 2. The techno-economic analysis takes into account the initial investment of the system, generators, PV and BESS plants; their operational and maintenance cost; fuel supply cost, etc. Among all feasible technical solutions obtained in steps 1 and 2, the one with the lowest levelized cost of energy (LCOE) may be designated as the PV’s techno economically viable HC.
The first part of the analysis optimizes the size of system components, such as PV systems, batteries and inverters. As PV-battery systems are integrated into the reference case, the system economic dispatch can be formulated as:
Objective Functions: Minimize [OMC (Pgi, PVi, BESS, OR)]
Minimize [F(Pgi)]
Minimize [Excess Electricity] and
Maximize   i N P V i
Subject to constraints:
L(t) = OR (t) + P(t)
i M P g i + i N P V i + B E S S   L ( t )
α L ( t ) + β P V i = O R ( t )
P g i m i n     P g i     P g i r a t e d
P g i m i n   ( t )     γ P g i r a t e d
S O C m i n   S O C ( t )   S O C m a x
t P g i m i n     30   min
where,
  • OMC = combined operation and maintenance costs of conventional generators, PV systems, battery bank and operating reserve;
  • F = fuel usage;
  • Pgi = power generation from the i-th conventional generator;
  • PVi = power generation from the i-th PV system;
  • OR = operating reserve;
  • P(t) = power generation capacity at any time ‘t’;
  • L(t) = load plus losses at any time ‘t’;
  • α = percentage of the load at any time ‘t’;
  • β = percentage of PV output at any time ‘t’;
  • M = total number of conventional generators;
  • N = total number of PV systems;
  • γ = minimum loading of the i-th conventional generator;
  • SOC = battery bank state of charge;
  • t P g i m i n   = minimum runtime (minute) of the i-th conventional generator.
The “load following” controller has been deployed to address the economic dispatch problem [47]. The least cost-optimal combination in both techniques allows dispatchable sources to generate and fulfil load demand and reserve needs. The fixed and marginal costs of dispatchable sources were considered while determining the cost.

3. Results

3.1. Test System

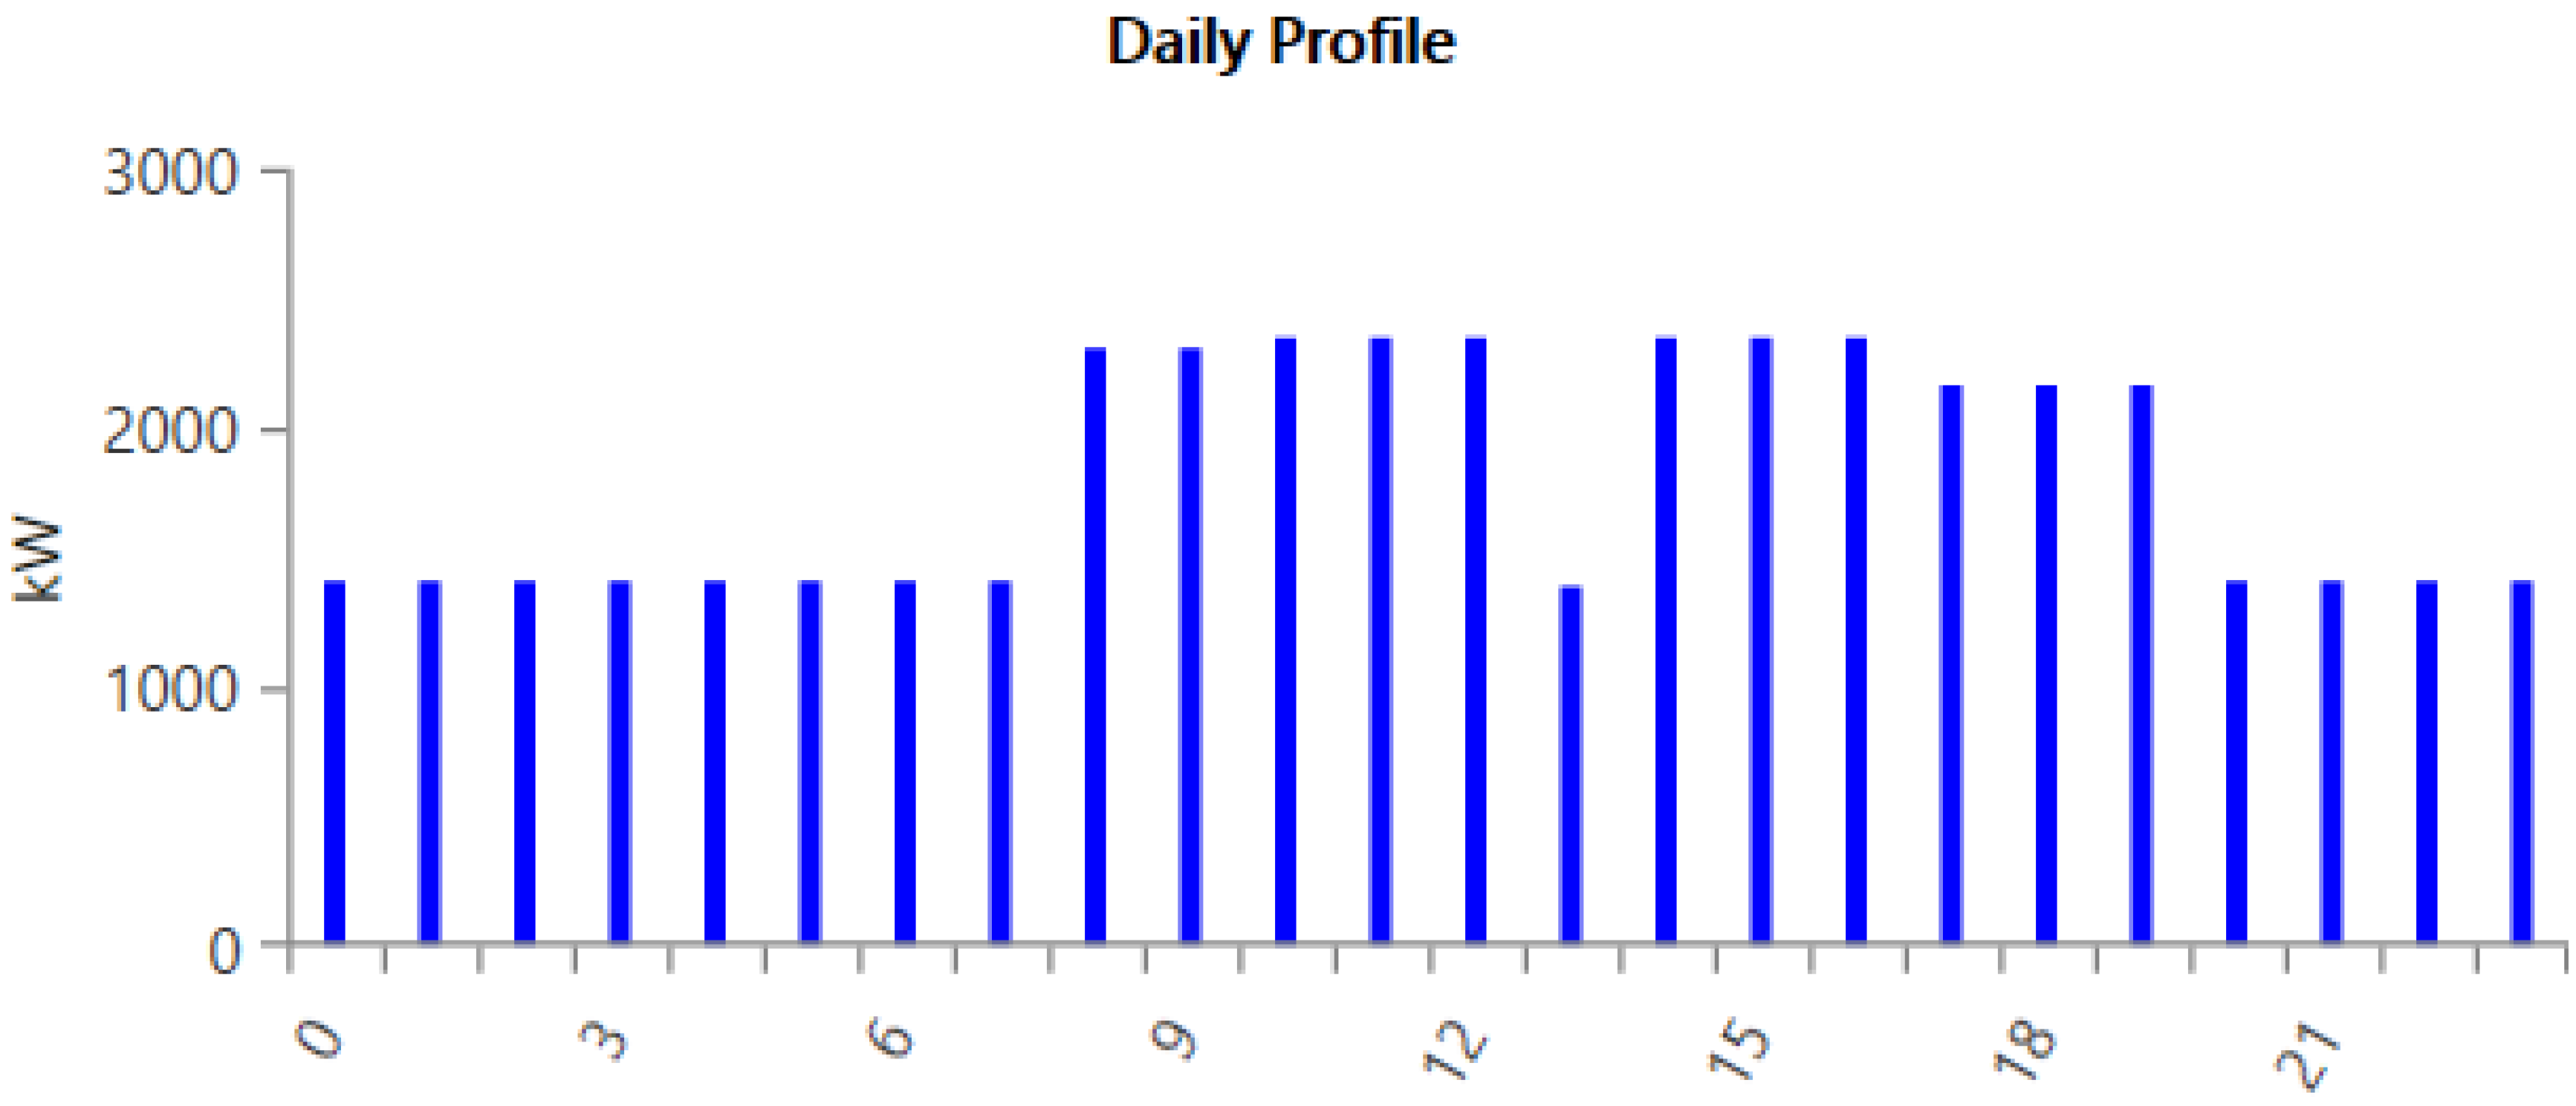
An RMG factory located in Gazipur, Bangladesh, has been chosen to validate the methodology. The factory is a modern one having all the necessary machines for producing RMG products for exports. Based on the collected feeder information and load consumption data, the daily load profile is plotted in Figure 3 and is used for techno-economic analysis. The daily peak load is 2656.46 kW, and the minimum load is 1402.52 kW. The factory runs in three shifts per day that starts at 8.00 a.m. and ends at 8.00 p.m. Most machines such as sewing machines, manual linking machines and iron tables run in between these hours. From 1.00 p.m. to 2.00 p.m., the factory workers get a lunch break. The knitting machines run 24 h a day continuously. Other essential appliances such as water treatment plants and effluent treatment plants run six hours a day starting from 10.00 a.m. The washing machines and dryers run eight hours a day starting from 8.00 a.m. Apart from these main loads, some small loads such as ceiling fans and lights are ON for 24 h in different parts of the factory. During the weekend, the significant loads are the knitting machines, along with a few light and ceiling fan loads in use. The operation of knitting machines is supported through four 250 kVA uninterruptable power supply (UPS) units so that during any power interruption, the machines can operate continuously, until the problem is resolved within the shortest possible time.
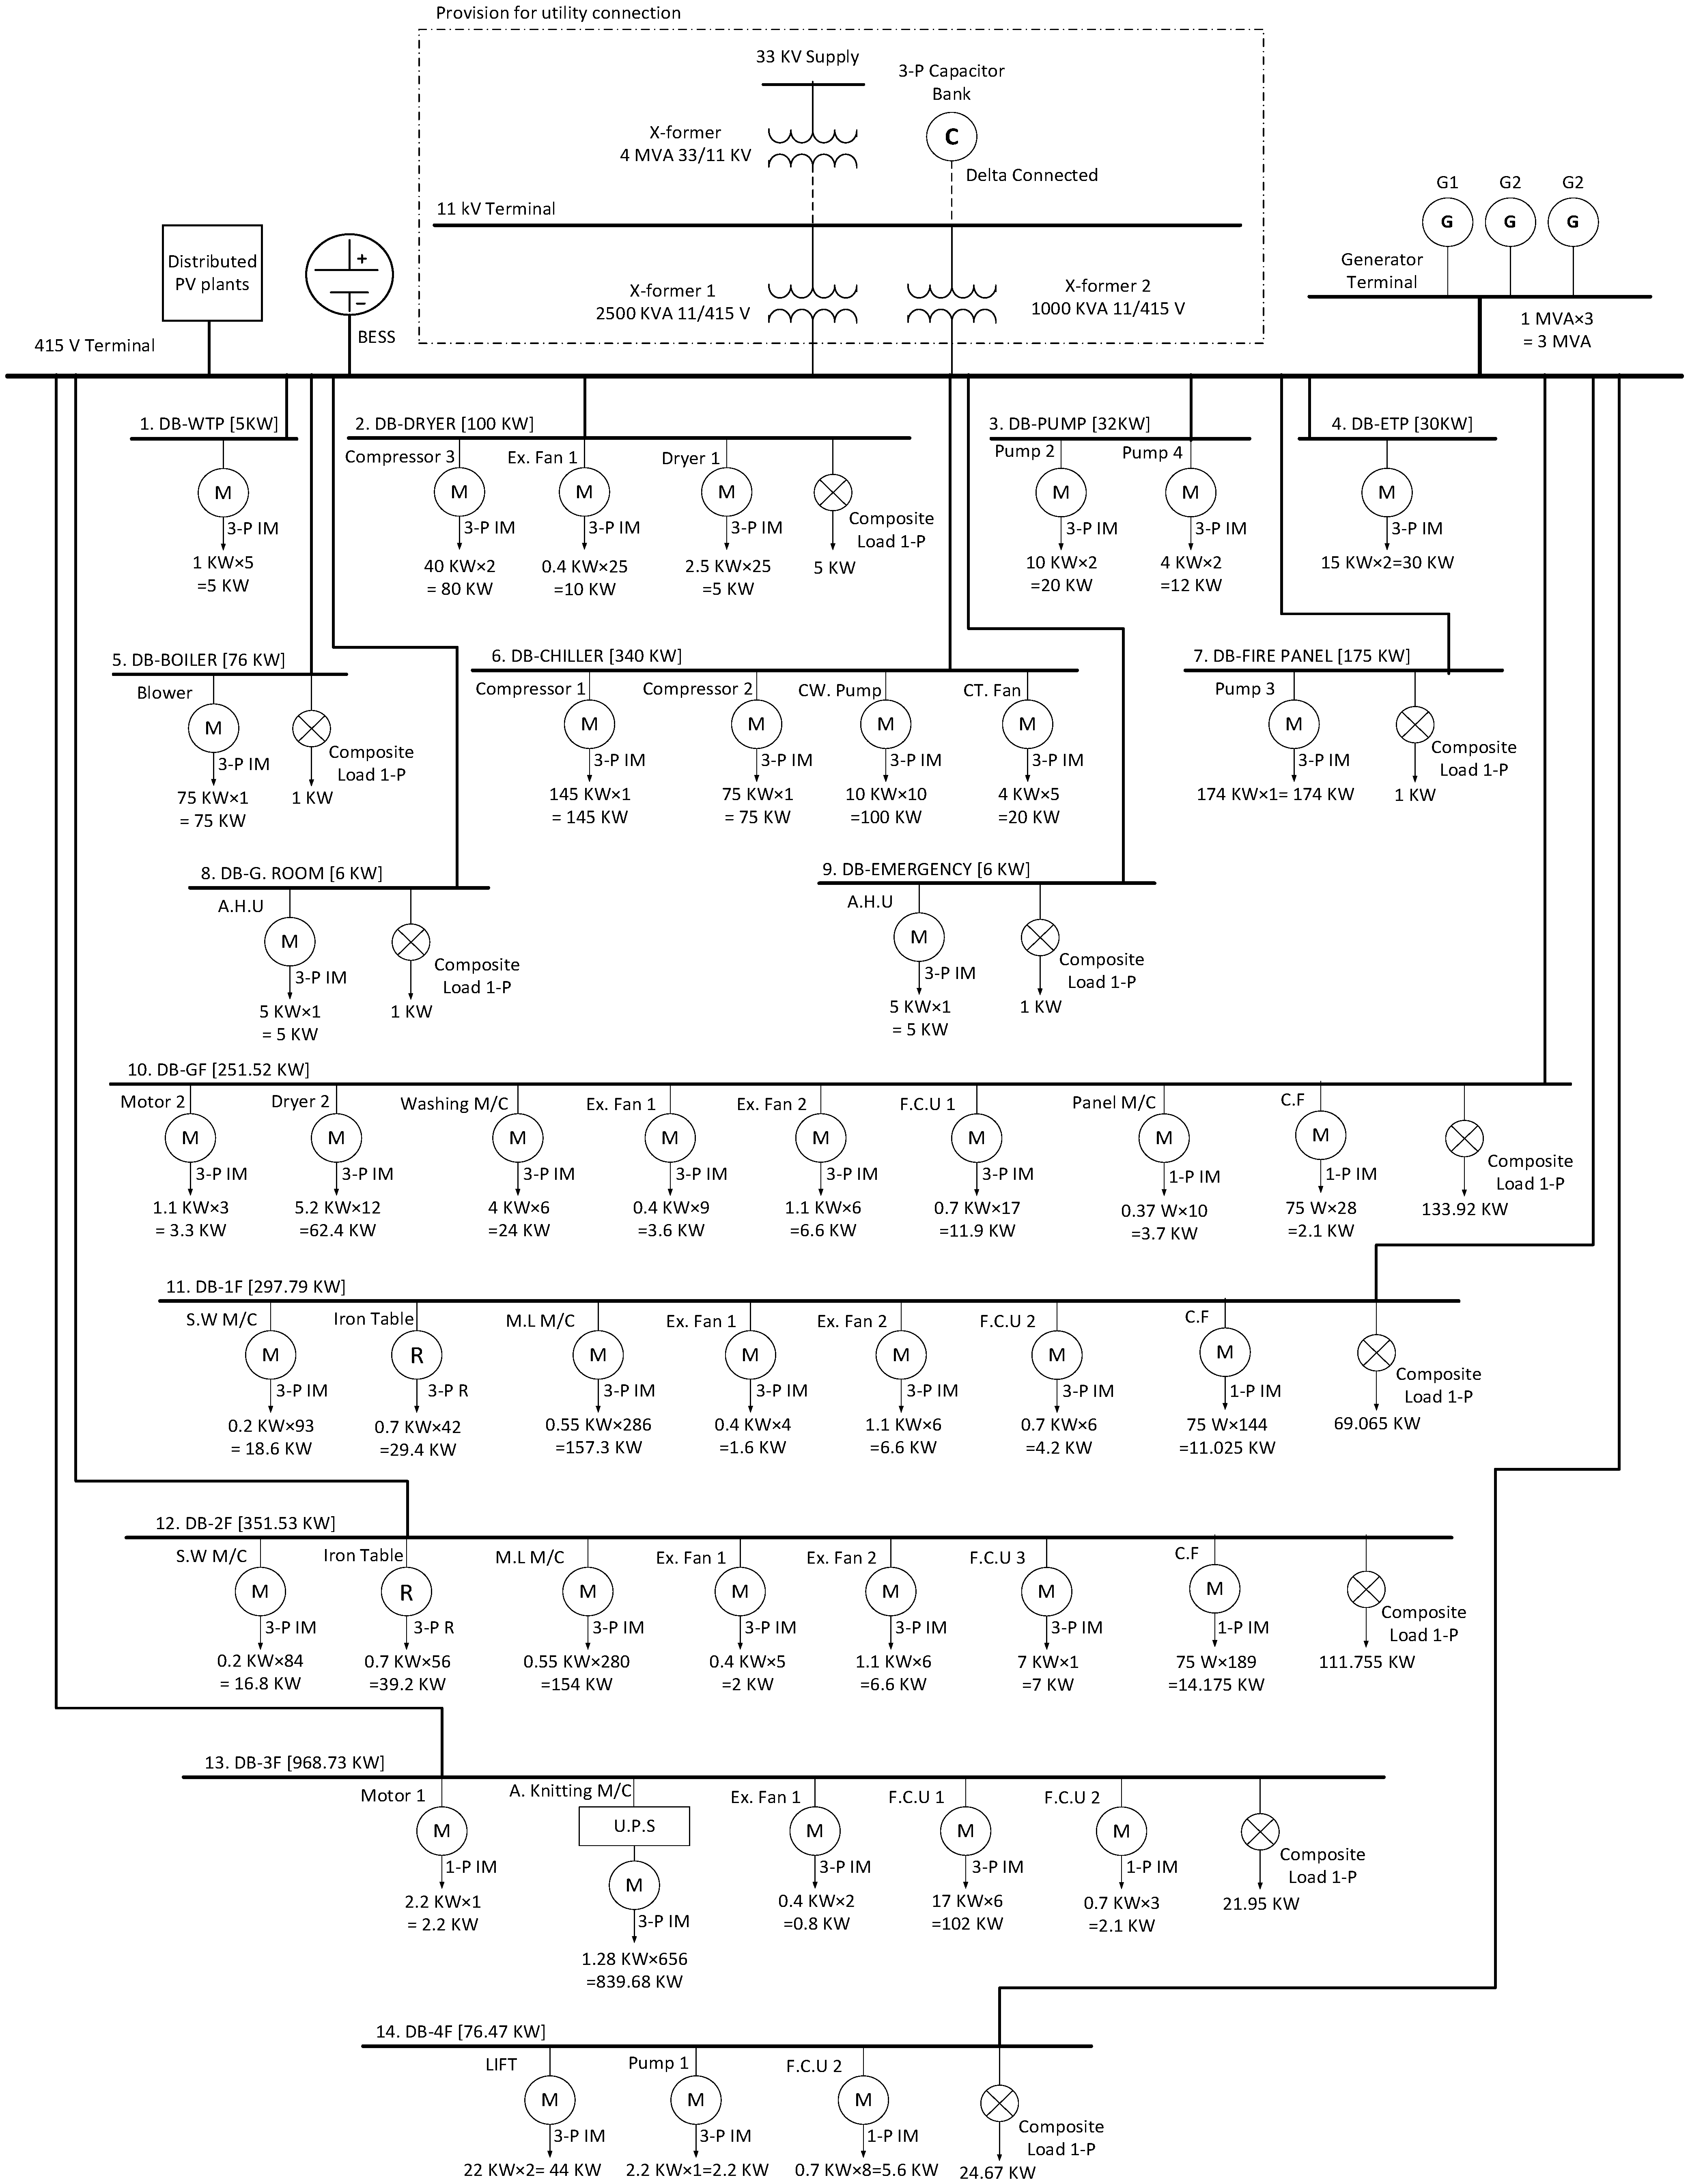
The power system in the factory is modelled as an industrial MG that operates in off-grid mode. There is a provision to connect this industrial MG to the nearby centralized grid. The loads with their maximum power consumption are given in Table 3 and the single line diagram (SLD) is given in Figure 4. Most of the loads in this factory are induction motors resulting in large reactive power consumption. The total system loss found from simulation is 0.05 MW and 0.17 MVAR. The factory has three generators having a total capacity of three MVA to supply the loads during off-grid operation. The control modes of the generators are voltage-Q droop control. The description of the machines inside this facility has been collected by field inspection and then modelled following available dynamic models given in [48].

3.2. Simulation Results

To simulate the methodologies outlined in Section 2.2, tools used include DIgSILENT Power Factory 2020 for technical analysis and HOMER PRO for techno-economic analysis.

3.2.1. Step 1: Evaluate HC of Test System Considering Static Operational Issues and Find Its Robustness against Significant Disturbances

Once the system has been modelled in DIgSILENT Power Factory 2020 using data obtained from field inspection, the first step is to find the HC of different buses in the system. The bus that can host the maximum PV generation is identified as the location for future power injection from PV generators. The crucial criteria considered for calculating the HC are—the thermal limits, voltage limits, protection limits and short-circuit limits. The thermal limit was set for each component (lines, bus bars) to 100% loading. The voltage limit is set according to IEEE 1547-2018. The protection limit is set to take into account all necessary protection measures such as reverse power flow, relay tripping and total fault contribution (10% max). The short-circuit contribution limit was set by setting the fault clearing time to 0.2 s.
The busbar (bb) numbers, with their corresponding HC values, are presented in Table 4. Table 4 indicates that the 415 V bus has the maximum PV HC value of 5572 kW. Hence, PV generators can be planned to place at the 415 V terminal (see Figure 4).
According to the HC analysis, the maximum PV HC value in the system under the static conditions given above is 5572 kW. However, the spatial area of the RMG factory for installing the distributed solar PV panels around the rooftops of the buildings and free space on the ground is limited. From the visual observations and considering the factor of 1000 kW capacity solar arrays may require around three hectares (i.e., 7.41 acres/30,000 square meters) of space, it is estimated that combined installation area in the specific RMG factory would accommodate about 2500 kW capacity of PV arrays. Therefore, the power system’s area-constrained PV HC is set at 2500 kW, which is assigned as the target HC value. Now, to initiate further analysis, at the 415 V terminal, a PV system with a minimum size of 550 kW is deployed. In this step, the minimum size of the PV is taken as 550 kW as the off-grid MG is designed to have the solar PV output as much as possible, and with this, 550 kW of PV, along with the three generators, can meet the peak demand. To test the system dynamics, a time-domain RMS/EMT simulation has been executed for a time span of 20 s. In the simulation study, after the system is initialized at zero second, a disturbance (three phase fault) at the maximum load bus (bb14 3F) is initiated at five seconds, which is cleared at 5.2 s. In the presence of newly added PV, the system is deemed to be resilient if the post fault voltage and frequency remain within the IEEE std.1547-2018 allowed range.
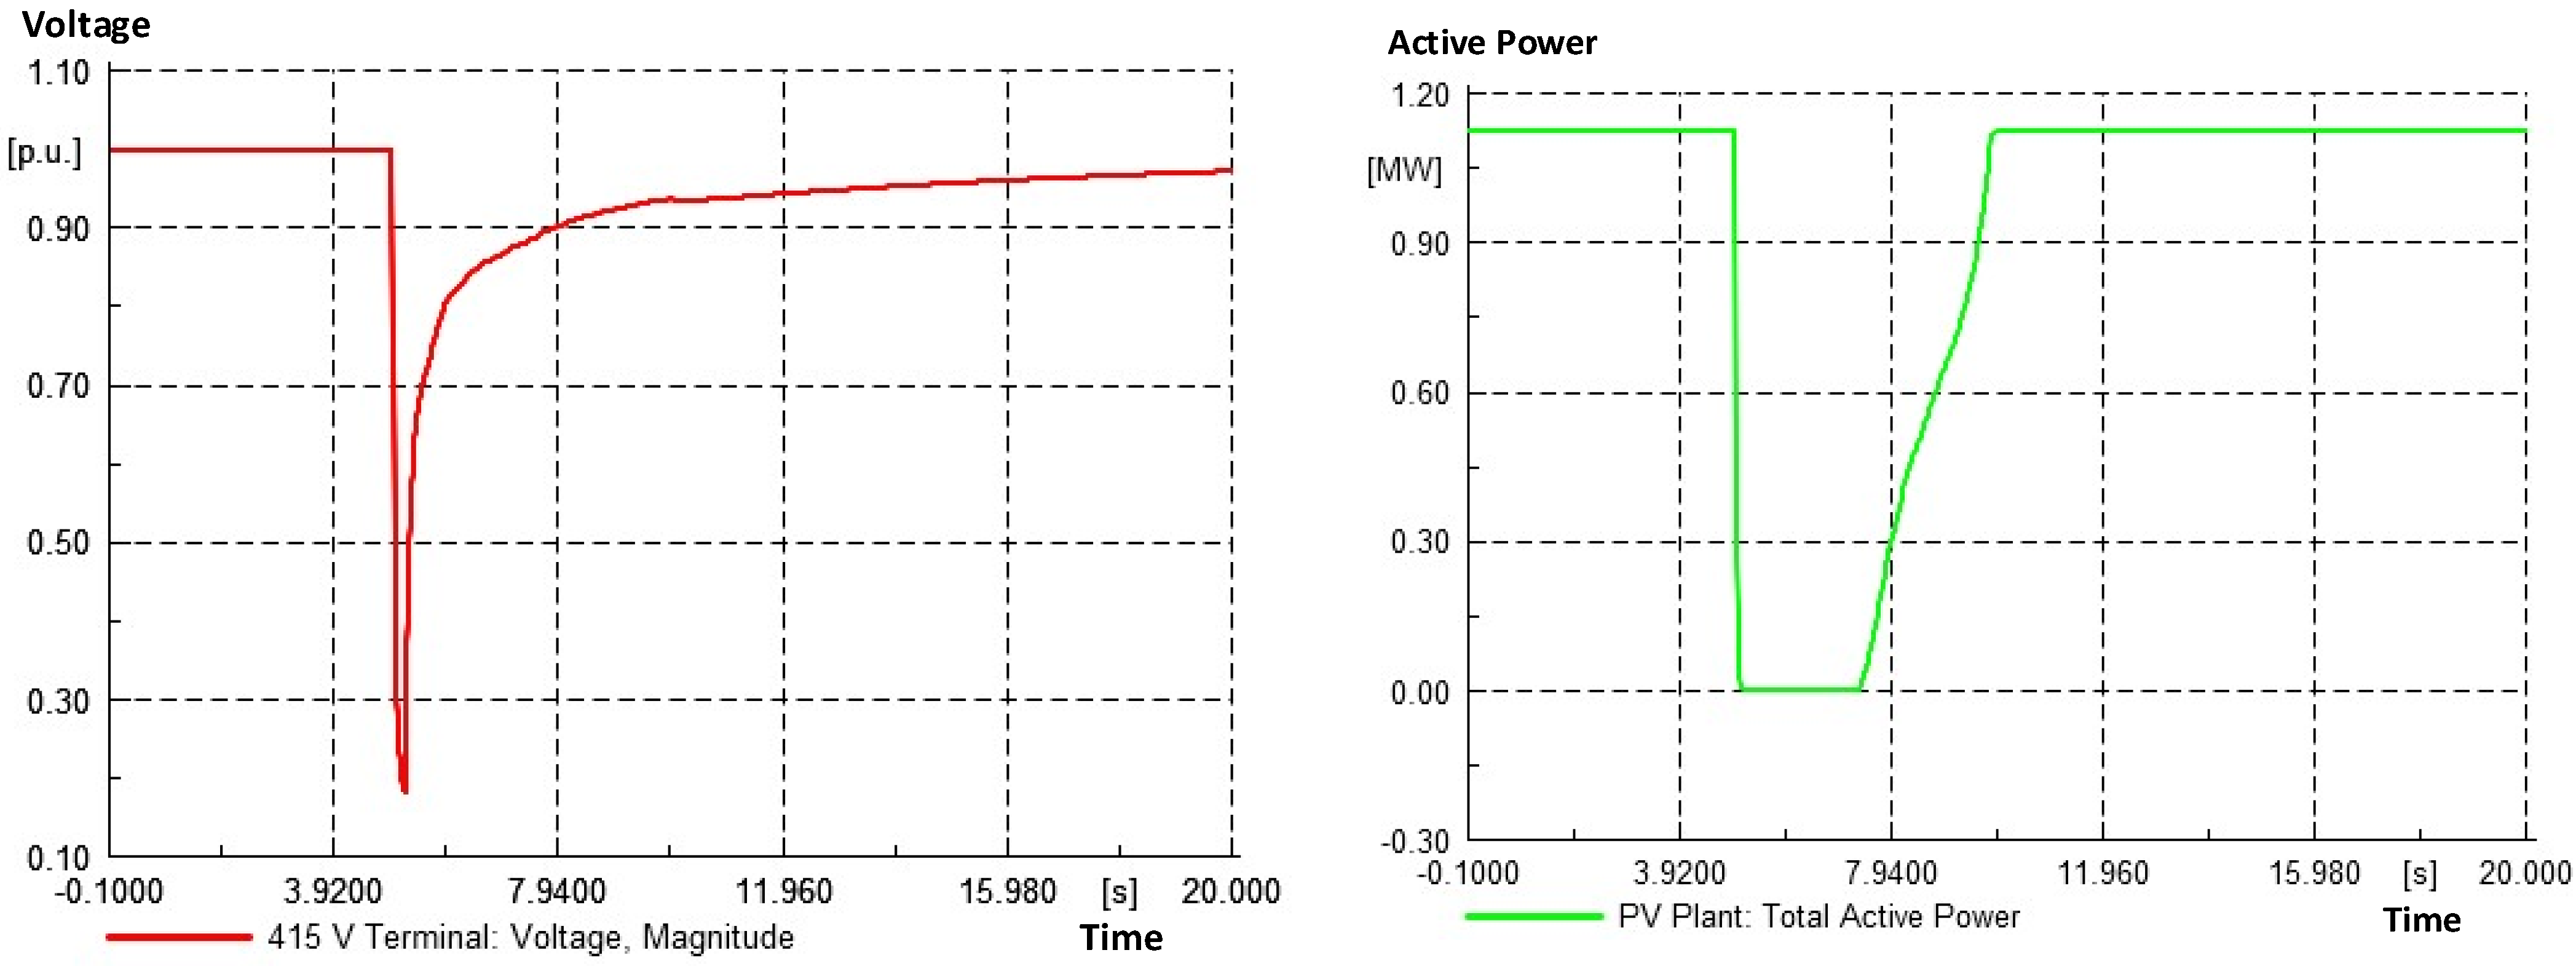
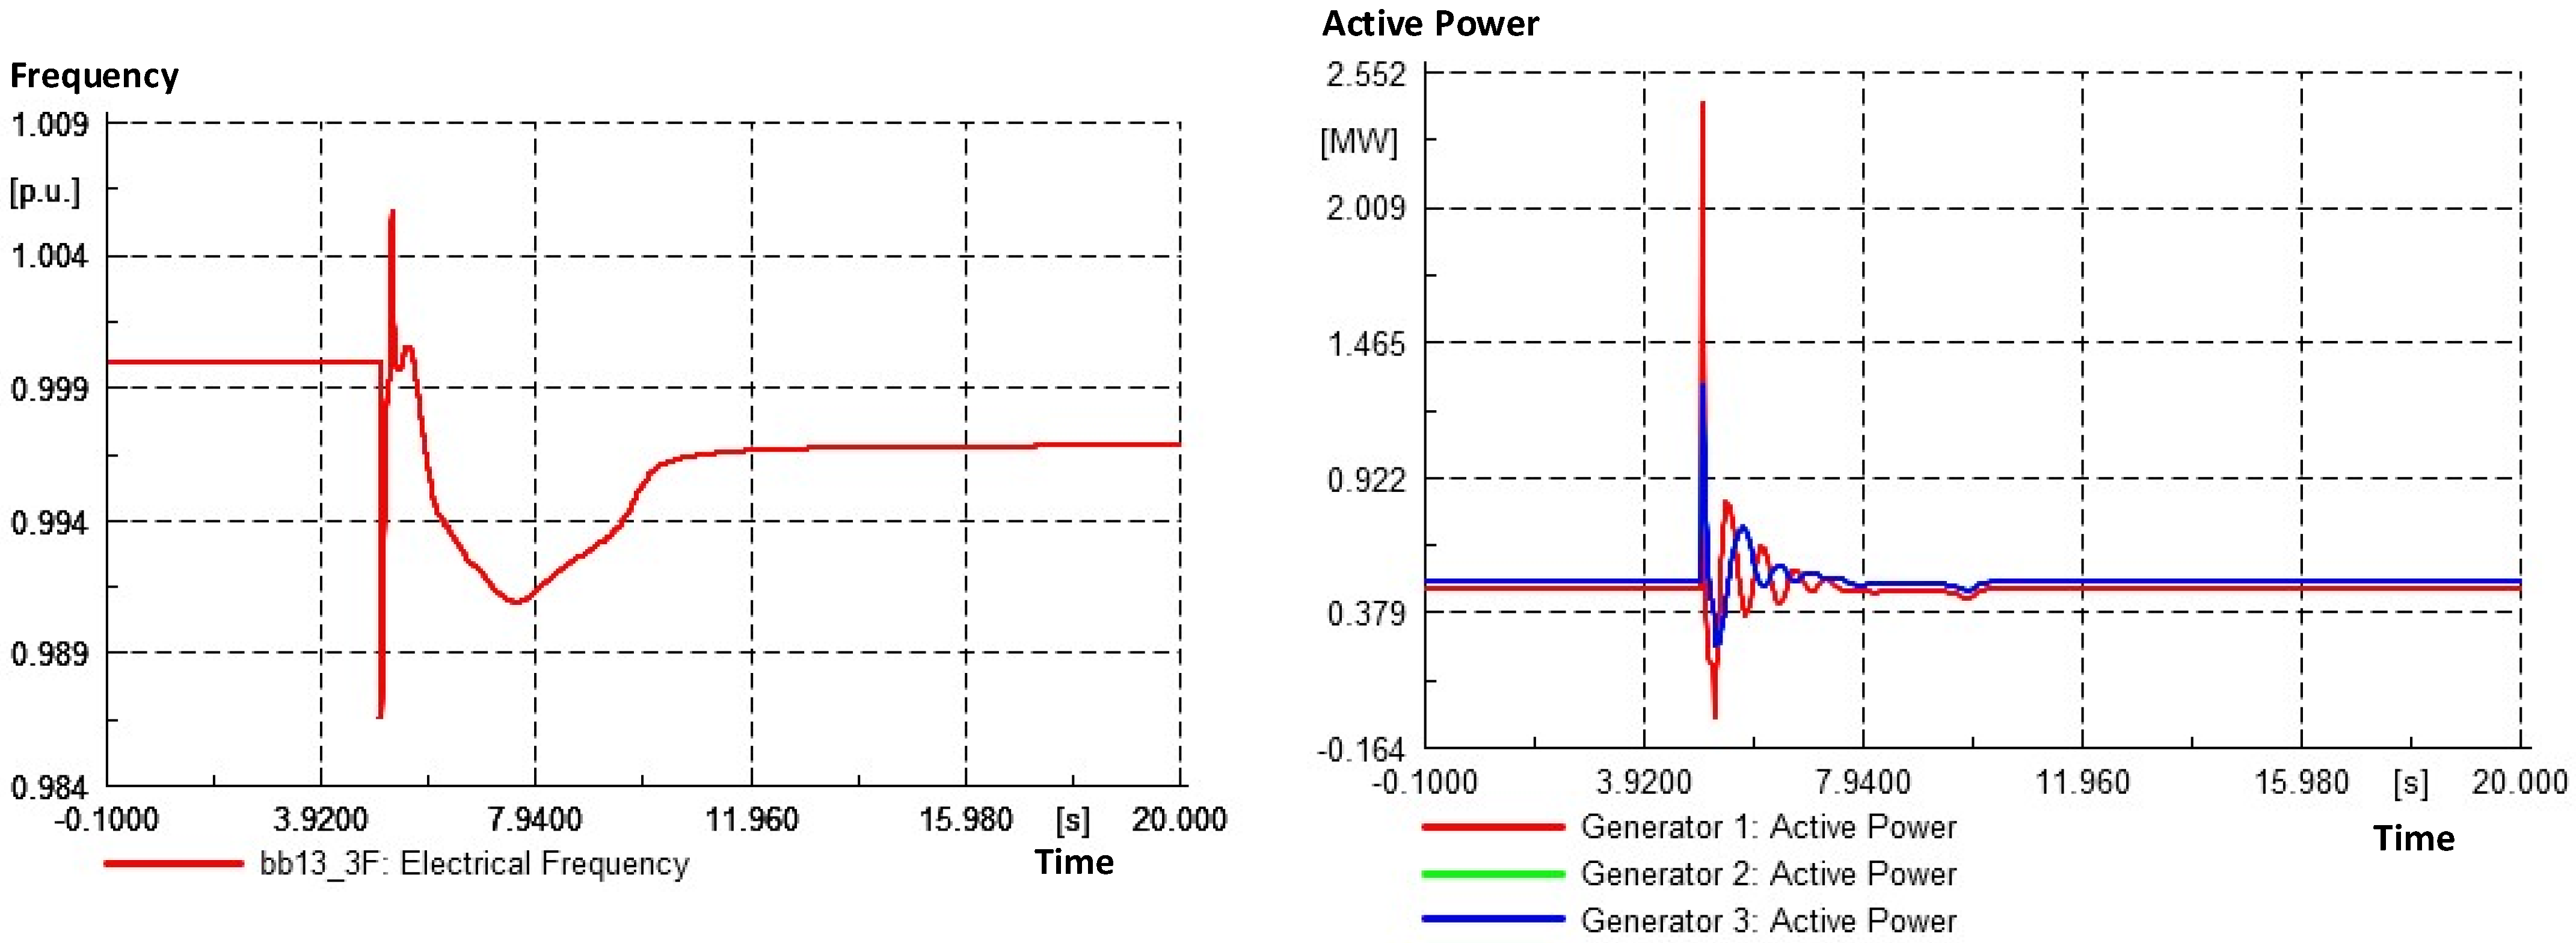
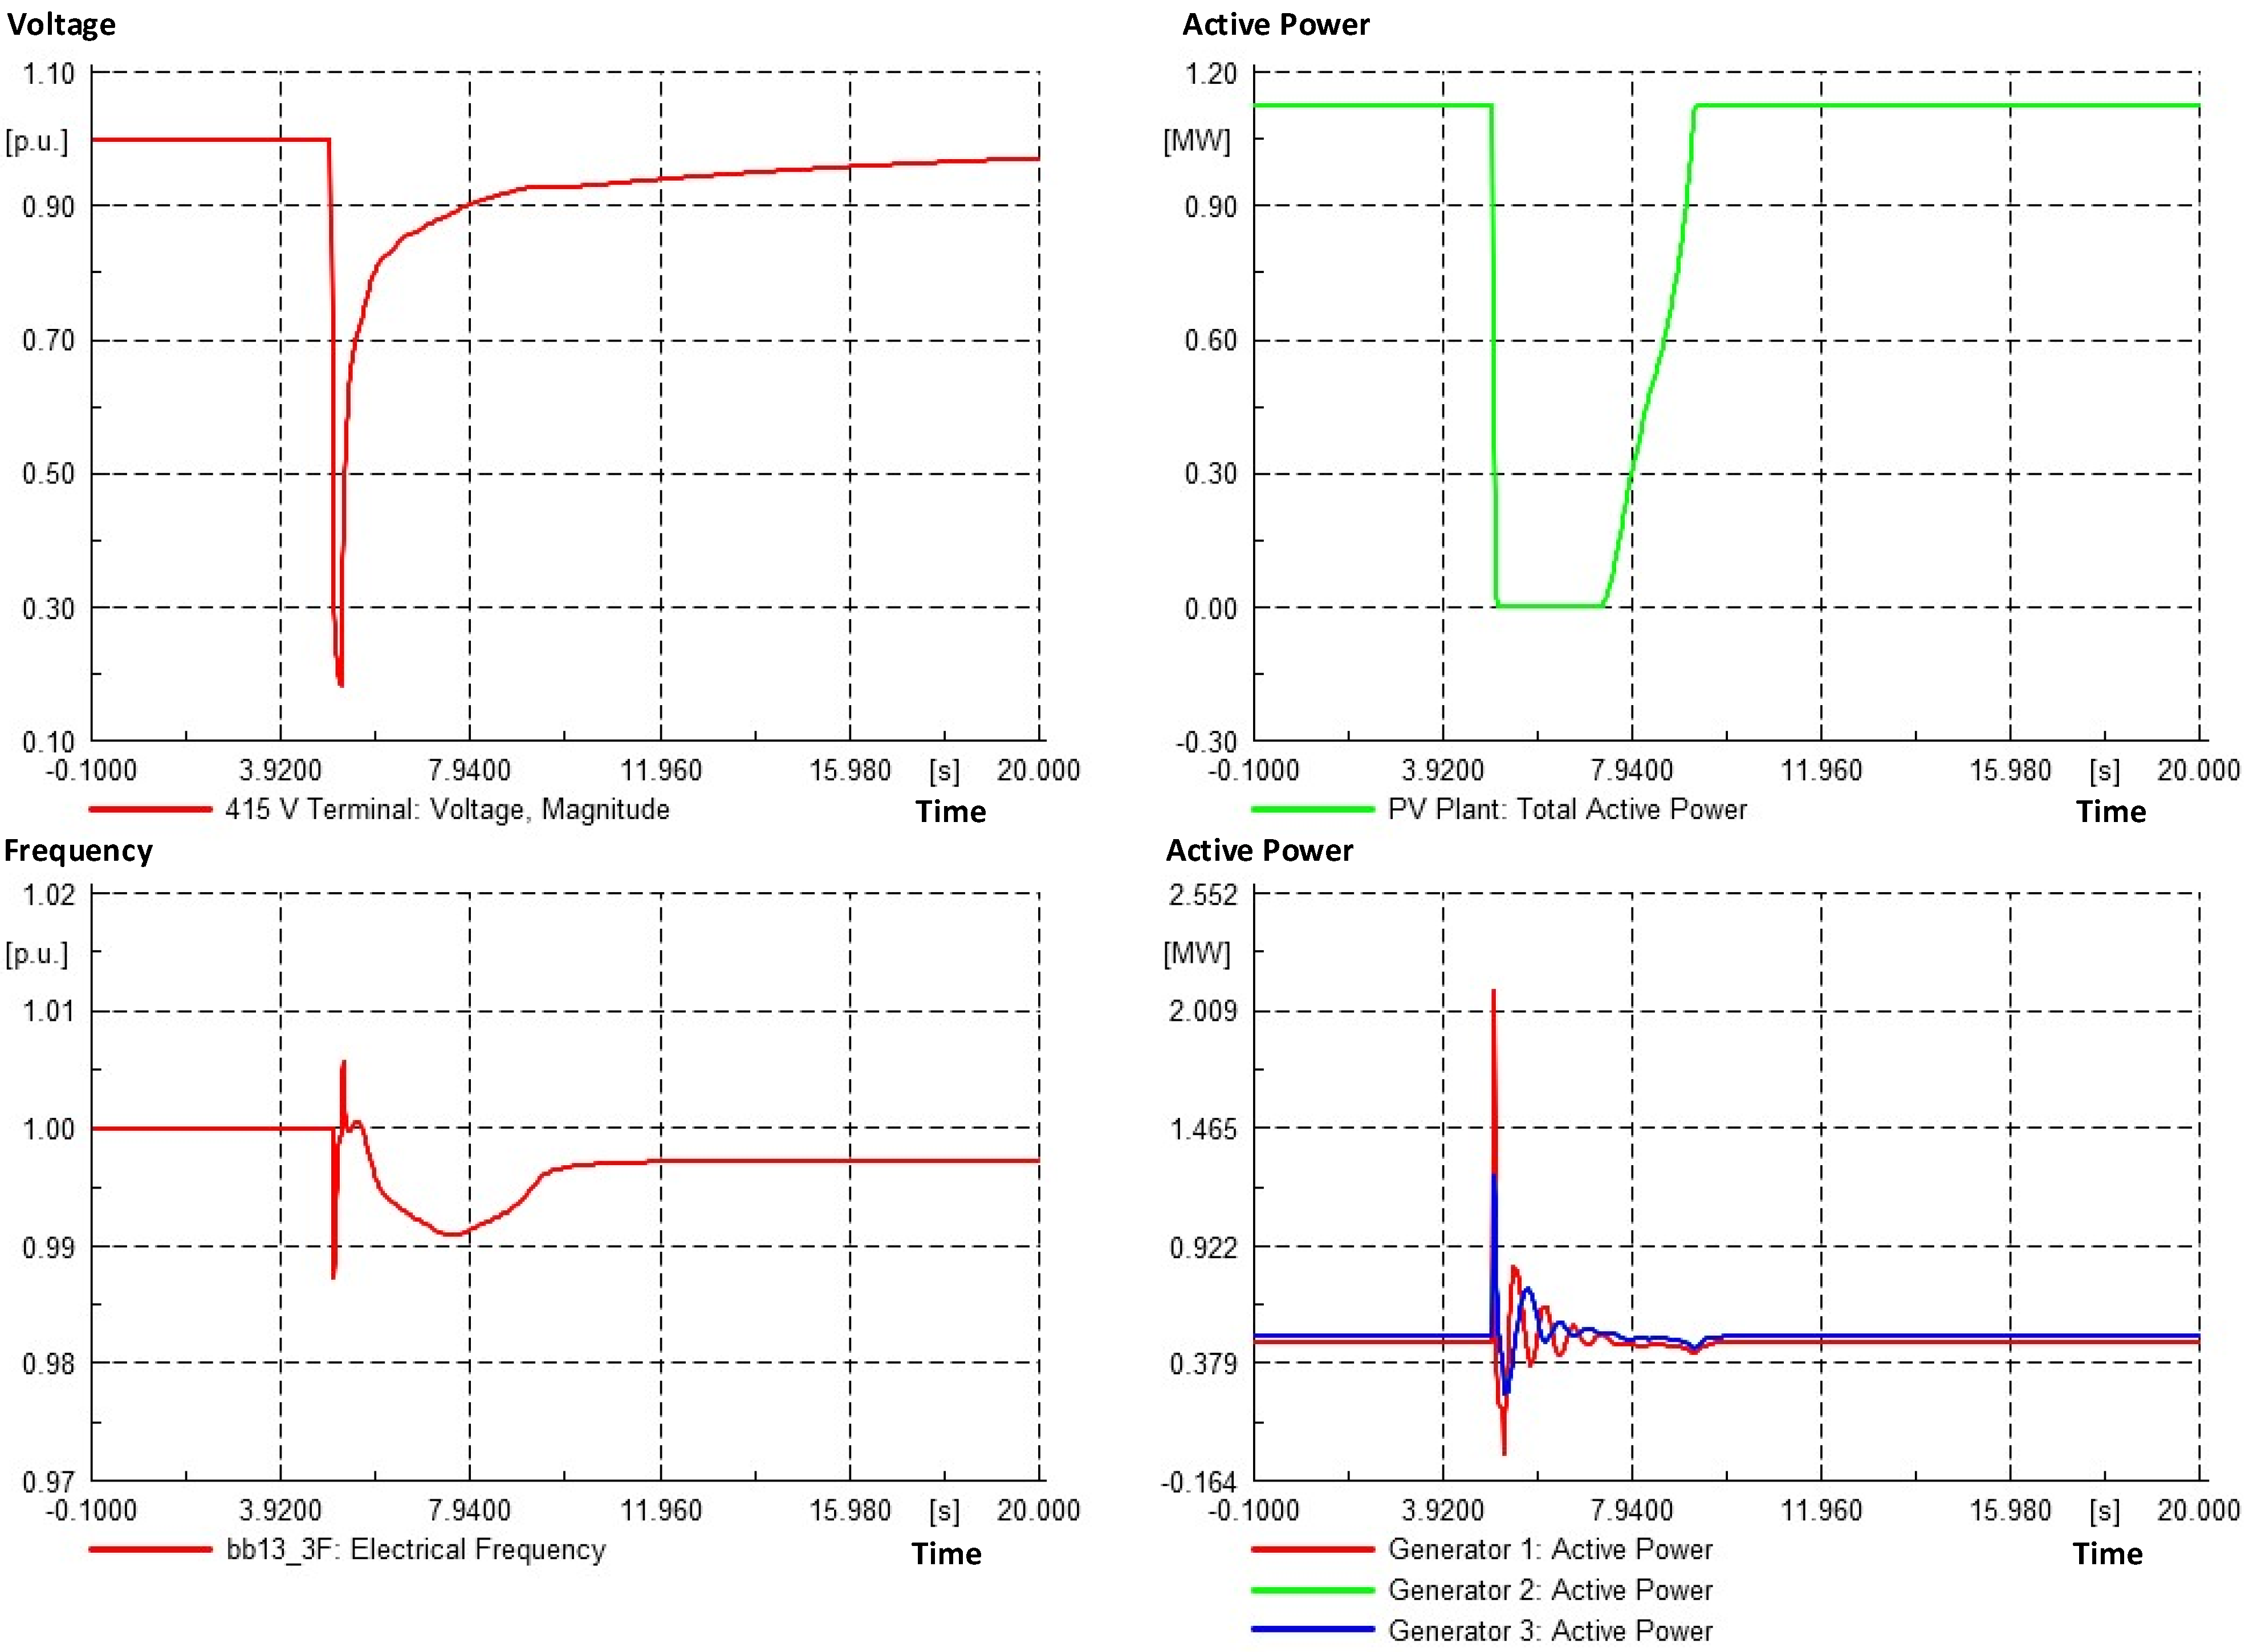
After that, the size of the PV is steadily raised, with the post-fault voltage and frequency being measured each time. Figure 5 shows that when the PV capacity exceeds 1125 kW, the post-fault voltage and frequency exceed the permitted limits. As a consequence, the PV system is disconnected from the system since the PV controller is designed in such a manner that it can trip off the PV system in the event of a voltage or frequency threshold violation, according to IEEE standard. 1547-2018. As a result, the 1125 kW PV in this system can not sustain, and the rating of the PV system must be reduced. Lowering the PV system to a rating of 1124 kW results in grid compatible post-fault voltage and frequency recovery, and hence can continue operation without tripping, as shown in Figure 6. As a result, the uncontrolled HC of this system may be determined as 1124 kW of PV, which keeps the system fault-resistant.

3.2.2. Step 2: Overcoming Technical Obstacles to Reach Target HC with BESS

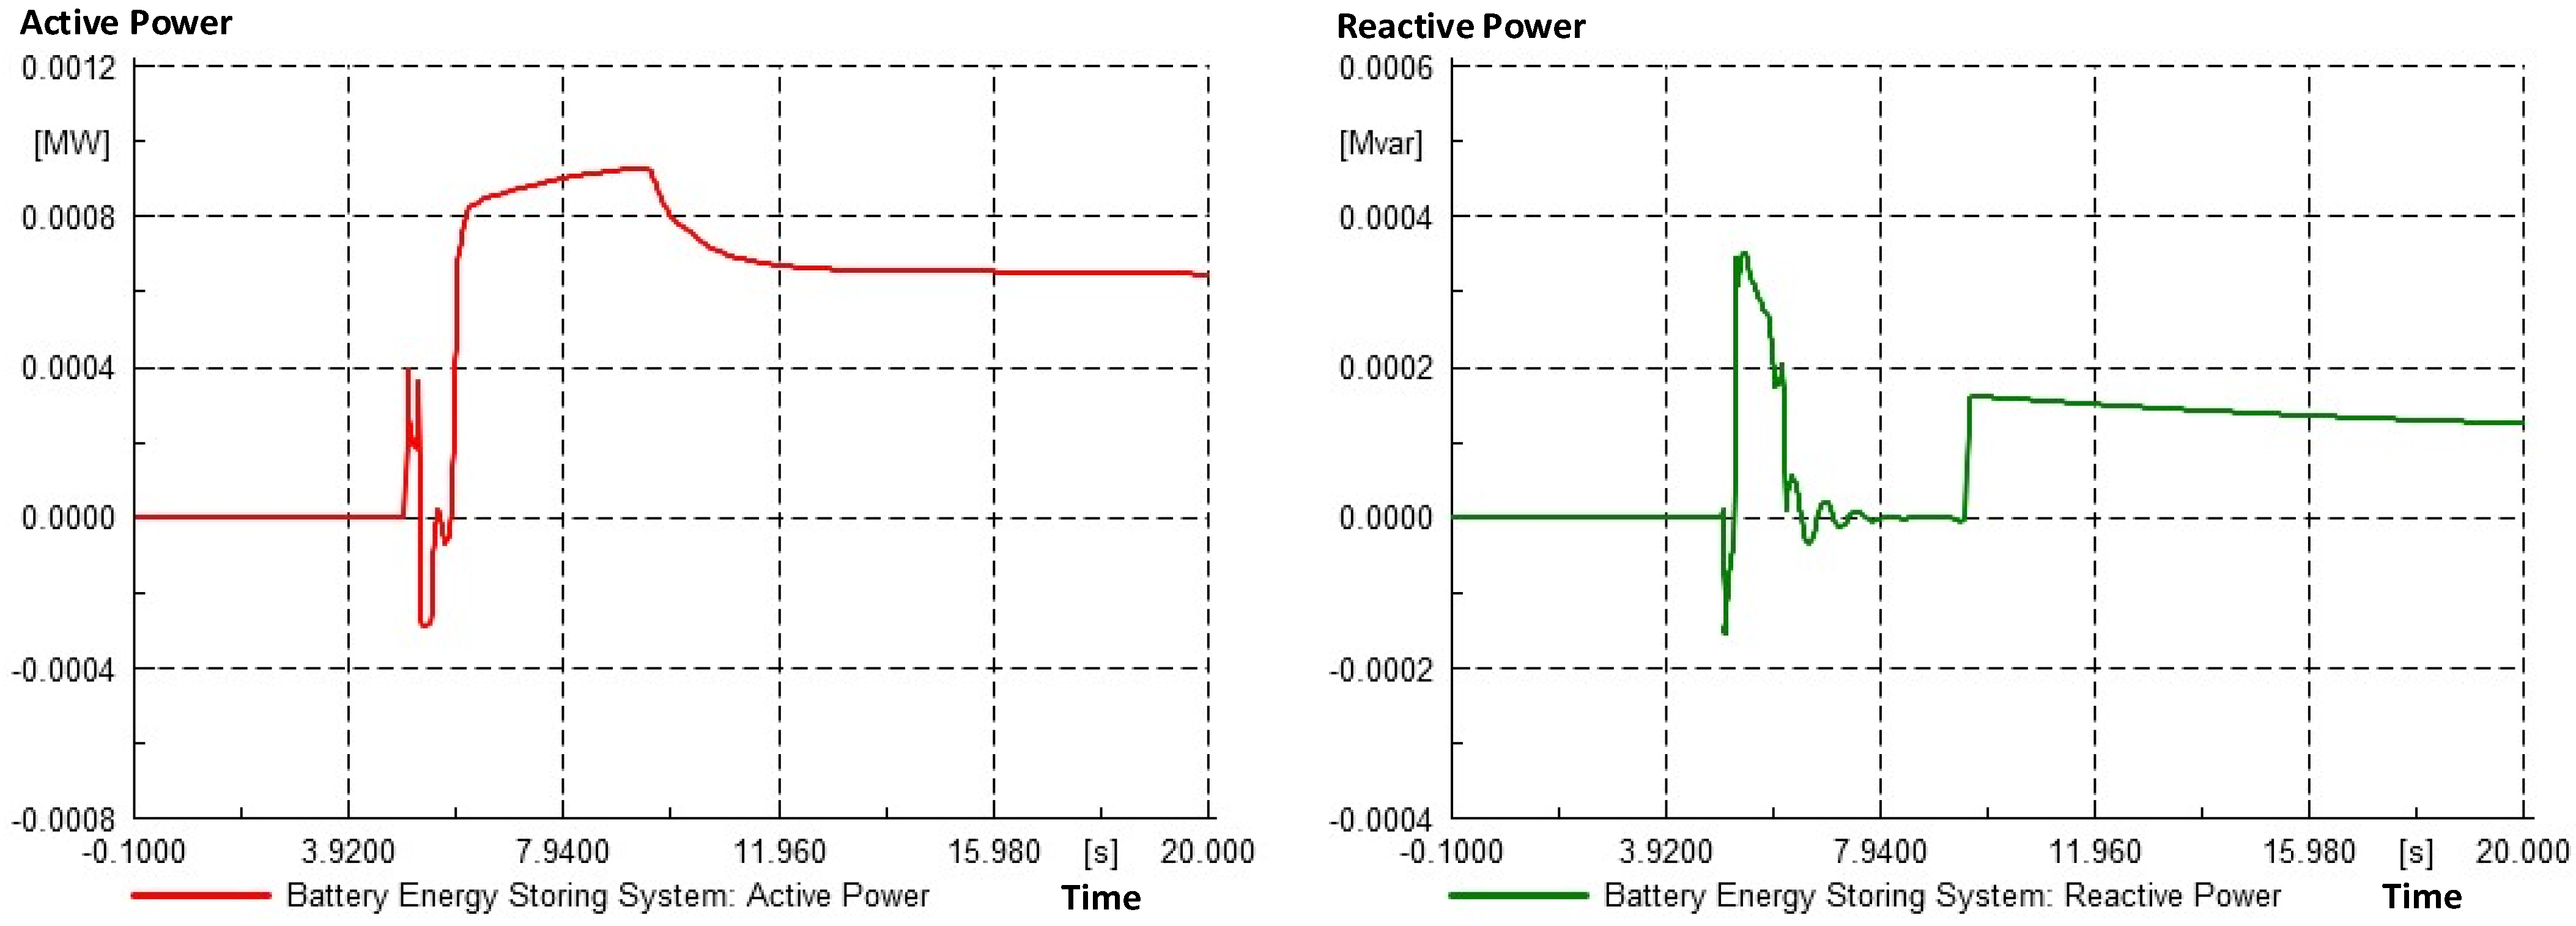
To overcome the technical obstacles and reach the target HC of 2500 kW, a BESS is placed at the same bus of the PV system. As shown in Figure 7, 1125 kW of PV, which failed previously to support satisfactory operation, can sustain acceptable post-fault voltage and frequency by integrating 1.0 kVA of BESS. This indicates that placing a BESS can improve PV HC in terms of post-fault voltage and frequency. Now, PV and BESS size is increased step by step to reach the target PV HC.
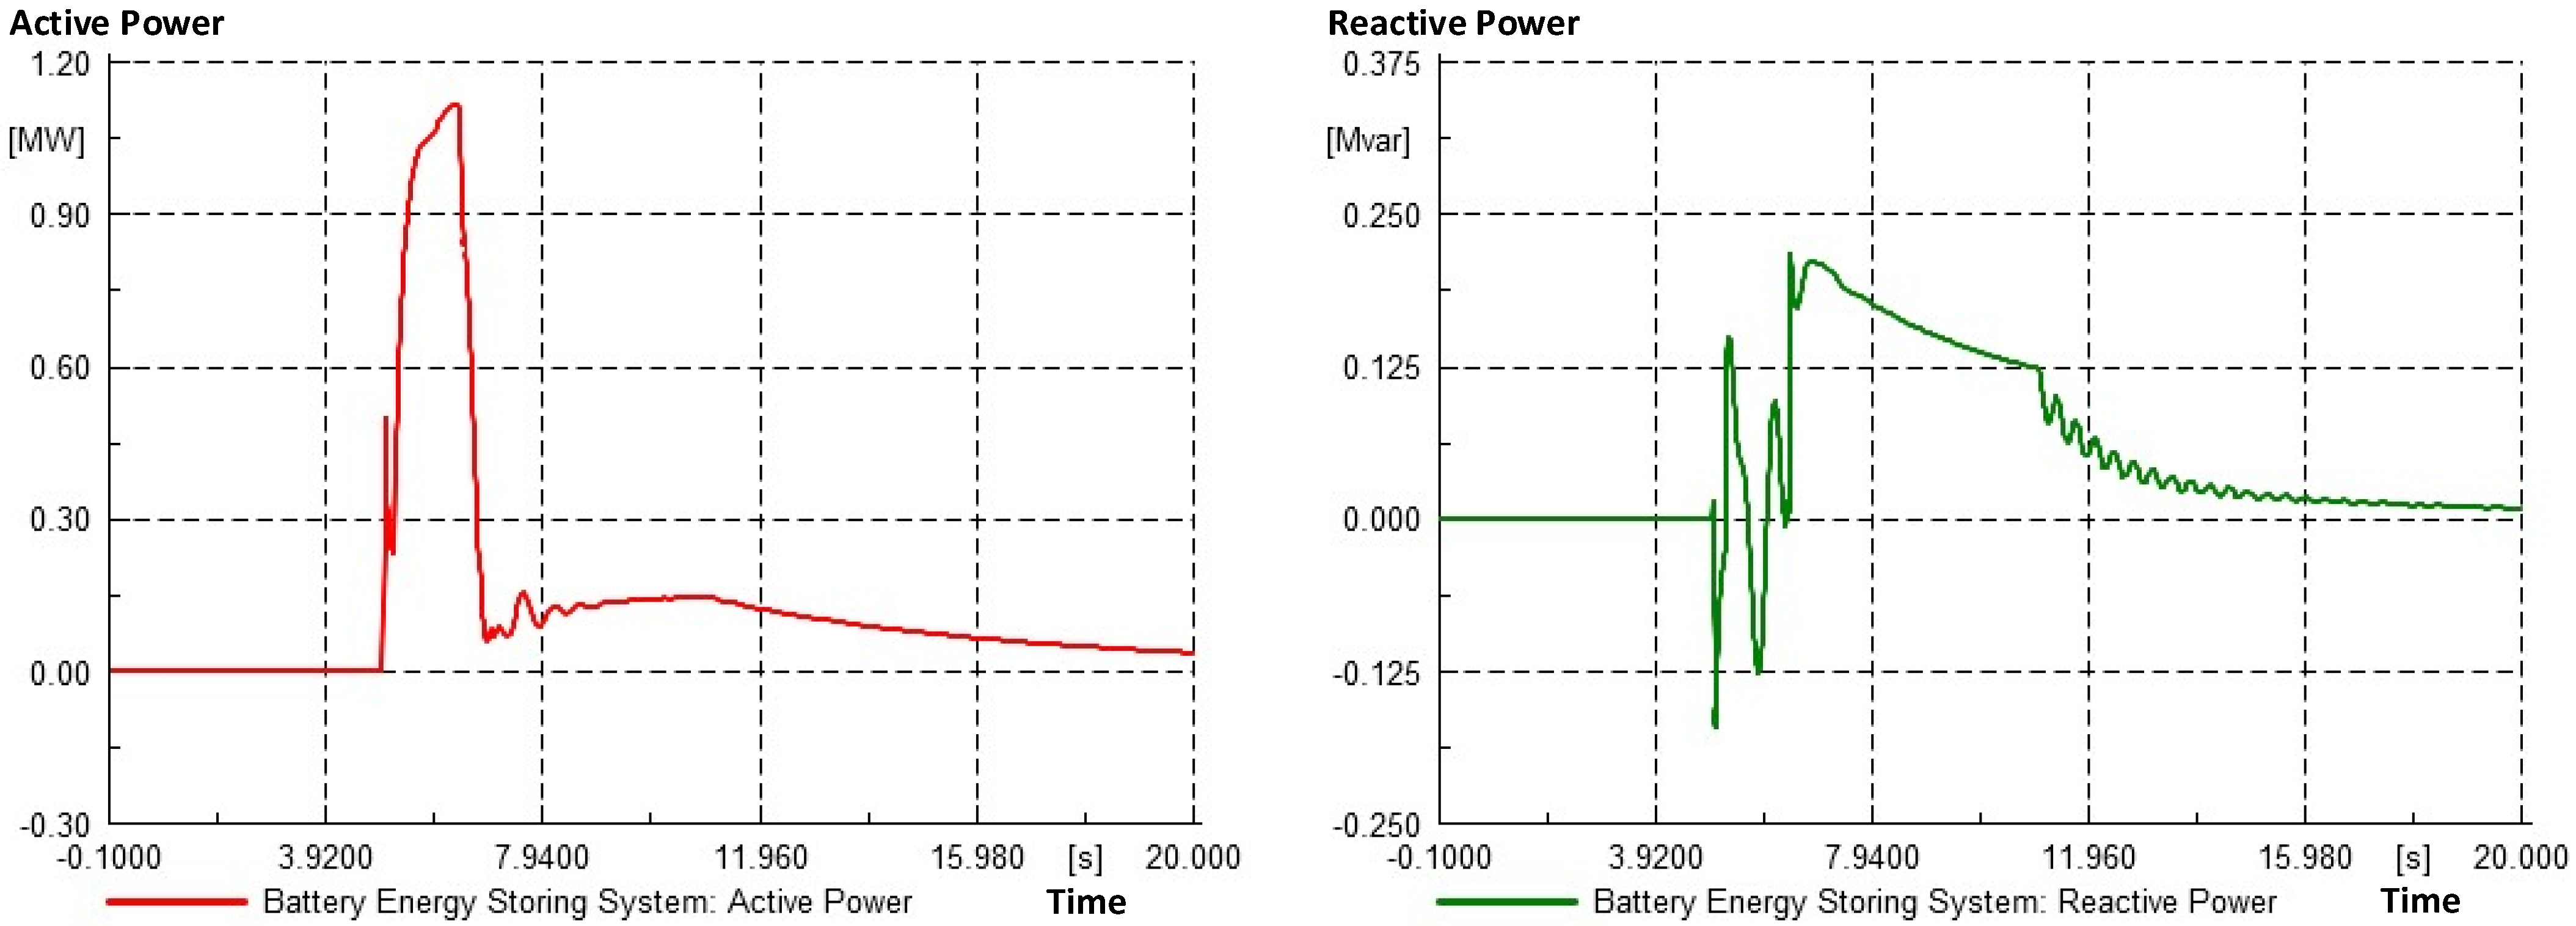
When the PV size is gradually increased up to the target HC, i.e., 2500 kW, from Figure 8, it can be seen that the system can withstand the fault with 1237 kVA of BESS. Therefore, it can be said that the enhanced HC in the presence of 1237 kVA BESS is 2500 kW. More PV can be integrated with the increasing size of BESS if installation area expansion is possible in future. Zero shows the relationship between BESS size and managed HC of PV. From Figure 9, it is evident that the enhanced HC of PV increases with the increment of BESS size.

3.2.3. Economic Feasibility Study of HC Considering Techno-Economic Issues

HOMER Pro 3.14.4 is used to conduct the system optimization study and techno-economic analysis of the system. The schematic diagram of the energy system is presented in Figure 10. The drive of the techno-economic analysis is to realize if incorporating PV and BESS into the base system addressing the system technical constraints offers any financial benefits. Integrating renewables into either diesel-based or primarily grid-connected base power systems incurs a high initial cost. The energy storage system installation and maintenance costs also impact the levelized energy cost. However, integrating renewable energy resources incurs no fuel cost and a low operational and maintenance cost; and the life span of renewable energy systems is much longer. Taking these factors into account, a long-term computer-aided techno-economic analysis can indicate if installing PV-storage systems reduces the levelized cost of energy (LCOE). In this analysis, different system configurations are simulated during the optimization process to find the best system configuration satisfying the technical constraints at the lowest life-cycle cost. Recent cost information from the local market and relevant other information for the techno-economic analysis are provided in Table 5.
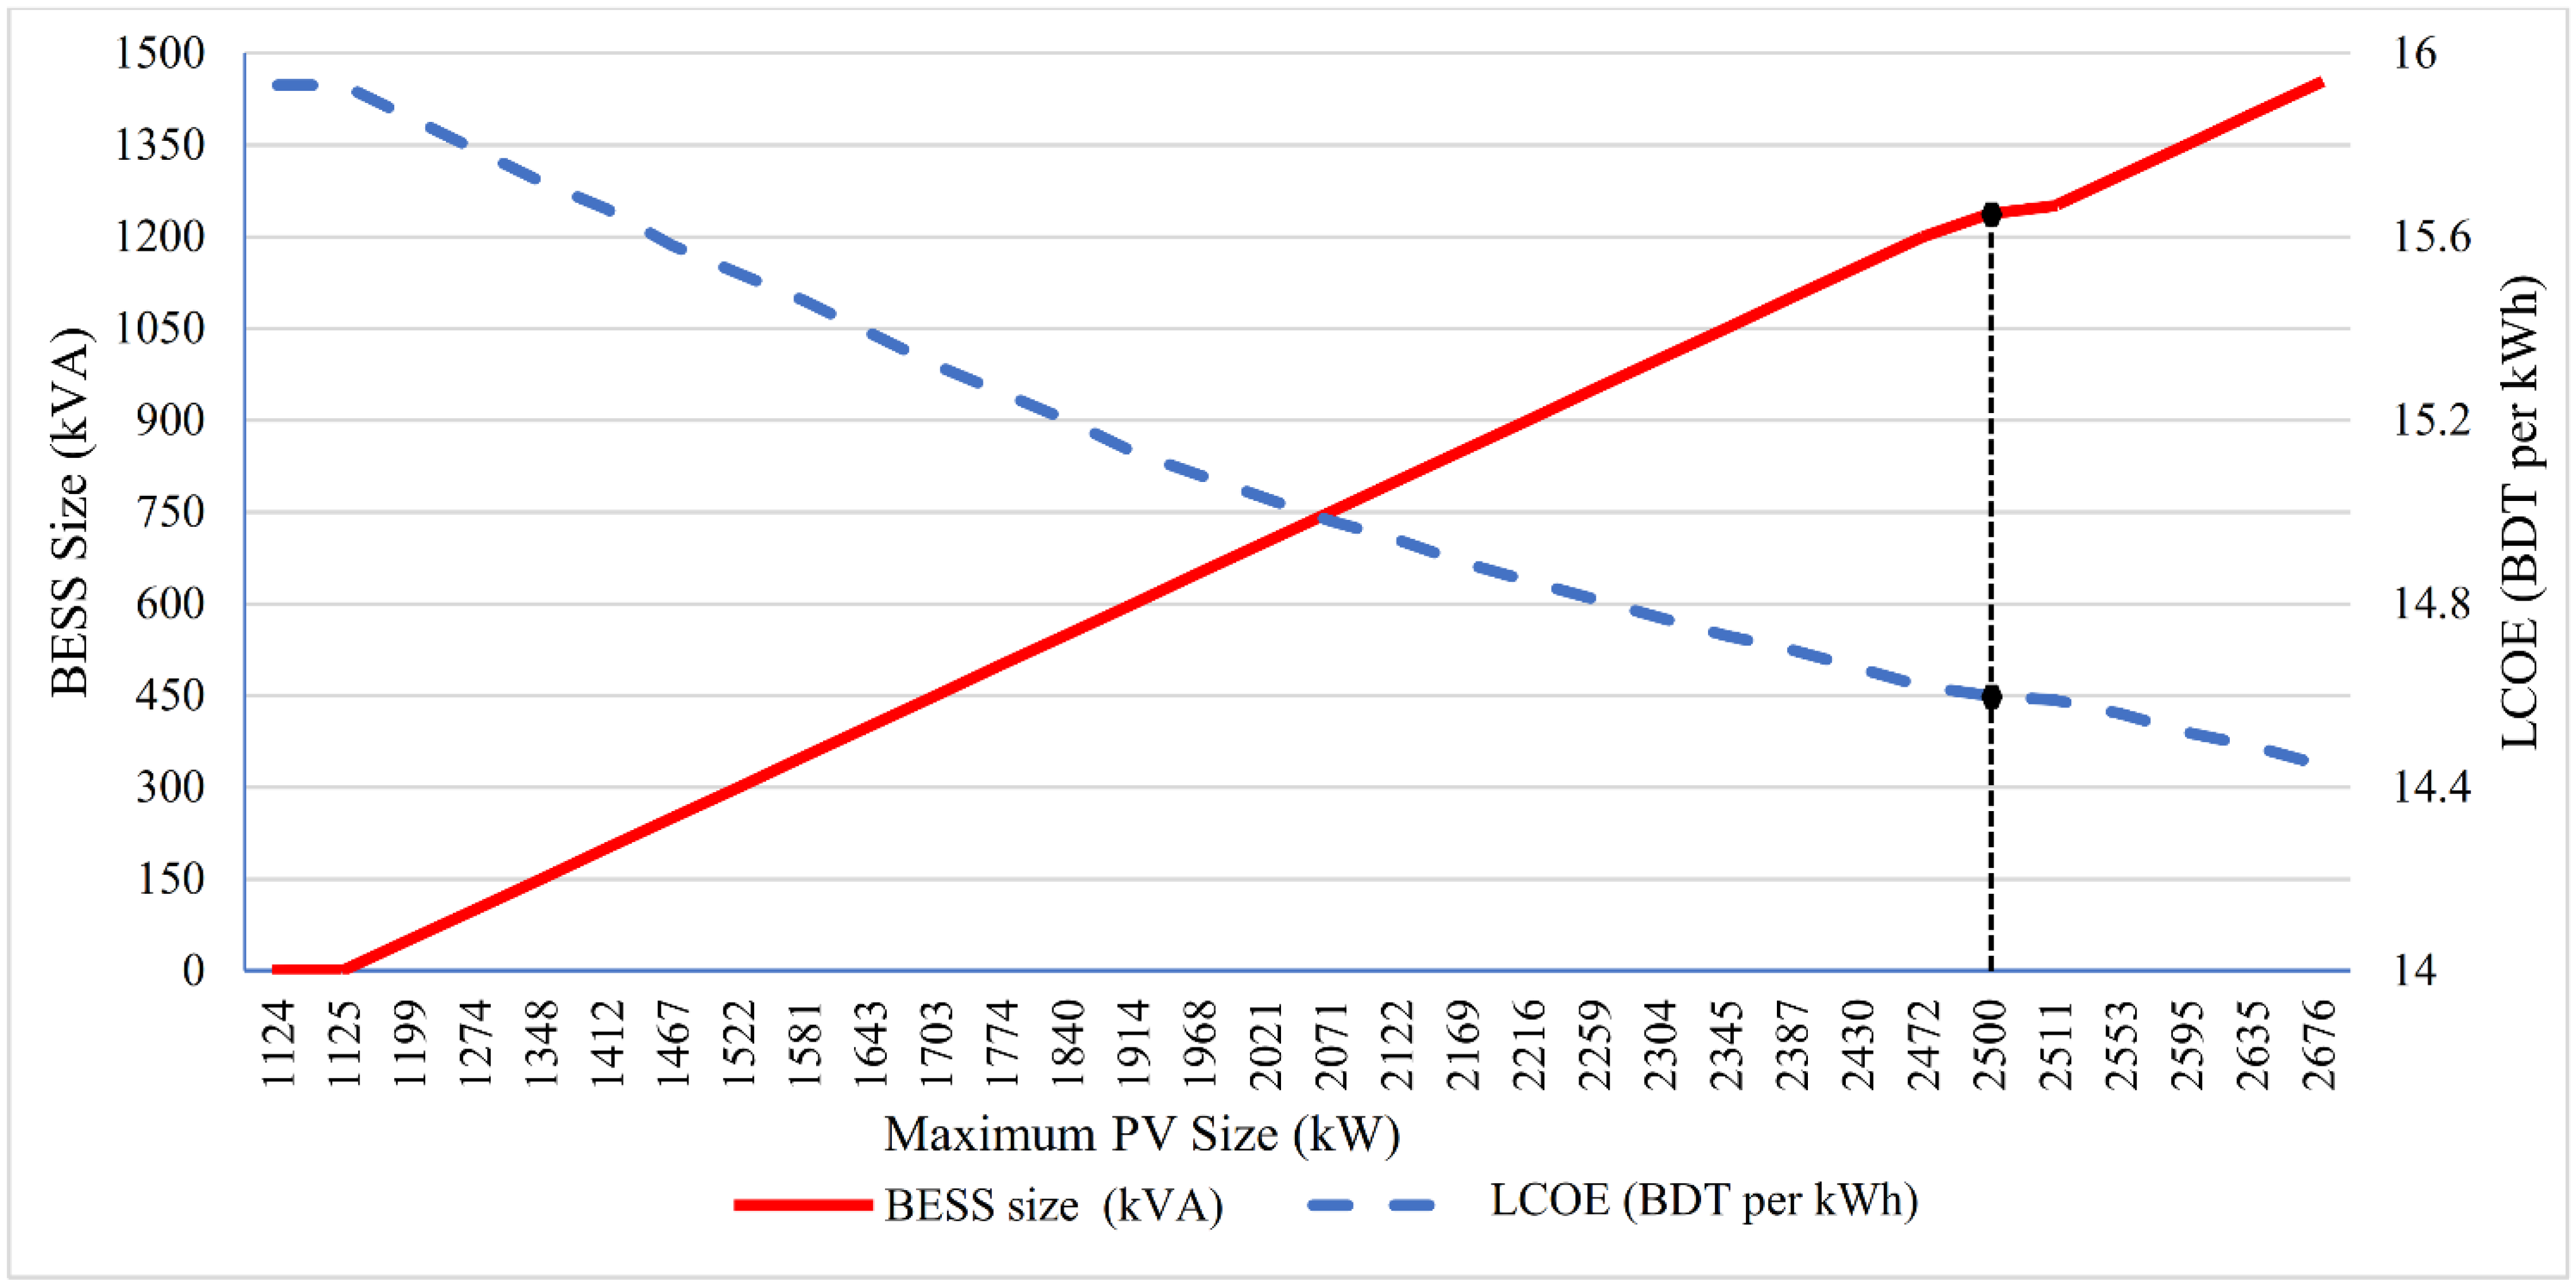
Enhanced BESS size allows the system to incorporate an enhanced PV generation while maintaining system robustness (as seen in step 2). The LCOE with different BESS sizes and corresponding maximum PV sizes are brought together and plotted in Figure 11 to understand better the economic scenarios where each scenario is fault-tolerant. Without the support from BESS, the power system not only faces resiliency (fault tolerance) issues but also has the highest LCOE for all the entries in the long term simulation. It appears that when the BESS size is increased, the LCOE should shoot as well. However, the study outcome has demonstrated in Figure 11 that increasing BESS size reduces the LCOE primarily due to the enhancement in the hosting capacity of PV in the system.
Even if the change in LCOE from one situation to the next is not substantial, different configuration sets have different operating costs. From Figure 11, it can be observed that the highest LCOE (BDT 15.93/kWh) is reached with 1124 kW PV and no BESS. On the other hand, the lowest COE (BDT 14.60/kWh) is achieved with 2500 kW PV and 1237 kVA BESS in the conceivable scenario. Another potential scenario exists where the LCOE is BDT 15.03/kWh for having 2021 kW of PV and 700 kVA of BESS. Table 6 provides a comparison of these three possibilities. In contrast to the highest LCOE scenario, the yearly operating cost is lowered by BDT 18 million, equal to around USD 212,000 (1 BDT = 0.012 USD) per year in the lowest LCOE scenario. The resultant LCOE found in the study offers a promising outcome as another study conducted in 2021 by Islam et al., for an off-grid community in Bangladesh revealed that the LCOE for the 331 kW annual peak demand is BDT 21.39 per kW for a hybrid diesel-PV-Hydrogen-battery-based microgrid [38].
Figure 12 and Figure 13 present the results of the optimization surface plot. These illustrations present a concrete relation among PV capacity, battery capacity, fuel usage, CO2 emission and the renewable share in the system design. It can be observed that the diesel usage abruptly drops when the system is integrated with more than 1000 kW capacity of the PV system. Up to 1000 kW of PV capacity, diesel has been the primary source of supply as PV capacity was small. Due to the PV output variability, operating reserve limits and the diesel engine’s technical constraints (minimum run time and minimum loading), diesel generators had to be kept ON for the maximum time. Consequently, fuel consumption did not decrease much. When more and more PV got installed beyond 1000 kW, the engine technical issues did not hit the barrier limits due to more PV output in the system. Thus, the system dynamics and dispatch algorithm allowed the PV to overtake the diesel generators as the primary supply source during the sunshine hours. So, the more the PV and battery capacity are integrated, the more the amount of diesel consumption dropped and consequentially, the COE improved. These situations can be observed in Figure 12. In this figure, a different color denotes a different amount of diesel consumption in liters.
Similarly, when more PV and battery capacity are integrated, the amount of CO2 emission decreases. Along with Figure 12, from Figure 13, we can also observe that when the PV capacity goes above 1000 kW, the emission of CO2 starts decreasing abruptly. As the renewable fraction/share (PV hosting capacity) increased, significant emissions decreased as diesel consumption decreased. These two figures validate the basic understanding of the research conducted.
A comparison is given in Table 7 for a better understanding of the contribution of this work with other similar techno-economic analyses presented in the literature. Other than the references [20,21,22,23,24,25], most of the sites of the studies chosen are identical to the present study, i.e., are in the off-grid areas. It can also be seen that none of the studies have checked the system robustness, i.e., fault tolerance as a limiting factor for the PV hosting capacity determination. Some studies given in Table 7 show lower LCOE than the COE obtained in this study as the optimization algorithm used in those studies addressed different objective functions and more relaxed system constraints, such as flexible PV and BESS sizing. The straightforward comparison of the LCOEs obtained in different studies can not be considered as the decisive parameter for judging the design excellence of systems. As the economic parameters of any system are very much case and location-specific, it would be unwise to compare the LCOEs of different systems for different countries having a different market structures. Hence, based on the authors’ expertise of the local market and socio-economic condition, it can be stated that the LCOE obtained in this study is a reasonable one for the intended customer, which is remote industries.

4. Conclusions

Solar PV systems are rising day by day, particularly in industrial microgrids, as a result of their cost-effectiveness and environmental friendliness. As part of the commitment to carbon-free emissions, various industries worldwide are ramping up their use of green energy. PV hosting capacity evaluation is thus required for better integration and performance of solar PV systems before integrating them into a power system. A conventional theoretical hosting capacity mechanism cannot meet the necessity to provide system resilience against any disruption. Hence, this study proposed a unique method and attempted in computing both the controlled and uncontrolled hosting capacity of PV systems by introducing system disturbance in the means of electrical faults (three-phase short circuits). A system techno-economic analysis has also been conducted along with the technical study. The research realized that incorporating battery energy storage systems (BESS) into the microgrid enhanced PV hosting capacity for the system. These unique PV generation enhancement and systematic strategy studies have been applied for the industrial electrical network in a ready-made garment (RMG) factory in Bangladesh, having a distinctive demand pattern and space constraints to uptake a high PV generation facility.
The unique study conducted a detailed technical and long-term techno-economic analysis and found that extending the size of the battery energy storage system not only enhanced the PV hosting capacity in the industrial microgrid but also reduced the levelized cost of energy. According to the study’s findings, integrating 2500 kW of PV along with a 1237 kVA battery bank incurs an energy cost of nearly USD 0.1719 per kWh for an off-grid Bangladeshi RMG factory having a daily peak load of 2656.46 kW. Considering the local socio-economic and geographical context and constraints, the revealed energy cost offers a promising outcome.
The study has been able to successfully demonstrate that by taking the suitable amount of PV-BESS systems to offset diesel consumption in a less reliable grid-connected system, the industrial establishments, like RMG factories, would not only benefit from the environmental and social advantages offered by the renewable energy-based systems but also make a financial profit. This would not only help the RMG factories individually but would also assist any country like Bangladesh in promoting the green RMG factories to the world to attract more investment and, side-by-side, address one of the UN SDG goals such as SDG7. Future studies would focus on analyzing system dynamics with more complicated technical issues, which may disrupt system resiliency in the presence of high PV penetration in an industrial microgrid operating in off-grid mode. The economic viability of any improvement approach for preserving system resilience while boosting the PV share will also be examined in future research.

Author Contributions

Conceptualization, S.A., A.E.R., T.J. and T.A. (Tareq Aziz); methodology, A.E.R., T.J. and T.A. (Tareq Aziz); software, S.A. and A.E.R.; validation, S.A., A.E.R., T.J. and T.A. (Tareq Aziz); formal analysis, S.A., A.E.R., T.J. and T.A. (Tareq Aziz); investigation, S.A., A.E.R., T.J. and T.A. (Tareq Aziz); resources, S.A. and S.U.A.; data curation, S.U.A.; writing—original draft preparation, A.E.R. and T.J.; writing—review and editing, S.A., A.E.R., M.S.H.L., T.J., T.A. (Tareq Aziz), M.R.S., A.R., T.A (Talal Alharbi). and M.M.H.; visualization, S.A., A.E.R. and T.J.; supervision, T.A. (Tareq Aziz); project administration, M.S.H.L., T.J., T.A. (Tareq Aziz), M.R.S., A.R., T.A. (Talal Alharbi). and M.M.H.; funding acquisition, M.S.H.L., T.J., M.R.S., A.R., T.A. (Talal Alharbi) and M.M.H. All authors have read and agreed to the published version of the manuscript.

Funding

The researchers would like to thank the Deanship of Scientific Research, Qassim University, Saudi Arabia for funding the publication of this project.

Institutional Review Board Statement

Not applicable.

Informed Consent Statement

Not applicable.

Data Availability Statement

Not applicable.

Acknowledgments

The researchers would like to thank the Deanship of Scientific Research, Qassim University, Saudi Arabia for funding the publication of this project.

Conflicts of Interest

The authors declare no conflict of interest.

Abbreviations

Summary of the notations and symbols.
Notations/SymbolsMeaning
SDGSustainable development goals
RMGReady-made garment
PV Photovoltaics
HCHosting capacity
MGMicrogrid
BESSBattery energy storage system
LCOELevelized cost of energy
IESIlluminating engineering society
THDThird harmonic distortion
DGDistributed generation
DBDistribution board
bbBusbar

References

  1. Tabassum, M. Top 10 Garments Exporting Countries of the World in 2020| Top Textiles Exporting Countries. Texfiles BD, 28 November 2021. Available online: https://www.texfilesbd.com/factories/top-10-garments-exporting-countries-of-the-world-in-2021/ (accessed on 22 May 2022).
  2. Desk Report. Bangladesh Has Highest Number of LEED Platinum-Rated Garment Factories. TextileToday, 19 September 2021. Available online: https://www.textiletoday.com.bd/bangladesh-highest-number-leed-platinum-rated-garment-factories/ (accessed on 22 May 2022).
  3. Islam, S. Bangladeshi apparel makers opt for rooftop solar. PV Magazine, 4 January 2021. Available online: https://www.pv-magazine.com/2021/01/04/bangladeshi-apparel-makers-opt-for-rooftop-solar/ (accessed on 22 May 2022).
  4. Jamal, T.; Urmee, T.; Shafiullah, G.M.; Shahnia, F. Using Experts’ Opinions and Multi-Criteria Decision Analysis to Determine the Weighing of Criteria Employed in Planning Remote Area Microgrids. In Proceedings of the 2018 International Conference and Utility Exhibition on Green Energy for Sustainable Development (ICUE), Phuket, Thailand, 24–26 October 2018; pp. 1–7. [Google Scholar] [CrossRef]
  5. Jamal, T.; Urmee, T.; Shafiullah, G.M. Planning of Off-Grid Power Supply Systems in Remote Areas Using Multi-Criteria Decision Analysis. Energy 2020, 201, 117580. [Google Scholar] [CrossRef]
  6. El-houari, H.; Allouhi, A.; Salameh, T.; Kousksou, T.; Jamil, A.; El Amrani, B. Energy, Economic, Environment (3E) Analysis of WT-PV-Battery Autonomous Hybrid Power Plants in Climatically Varying Regions. Sustain. Energy Technol. Assess. 2021, 43, 100961. [Google Scholar] [CrossRef]
  7. Vella, H. Microgrids—The Key to Providing Electricity in Rural Communities? Available online: https://www.power-technology.com/features/featuremicrogrids-the-key-to-providing-electricity-to-the-energy-poor-4314517/ (accessed on 13 July 2021).
  8. Ali, L.; Shahnia, F. Impact of Annual Load Growth on Selecting the Suitable Sustainable Standalone System for an Off-Grid Town in Western Australia. In Proceedings of the 2016 IEEE International Conference on Power System Technology POWERCON 2016, Wollongong, NSW, Australia, 28 September–1 October 2016; pp. 2–6. [Google Scholar] [CrossRef]
  9. Jamal, T.; Shoeb, M.A.; Shafiullah, G.M.; Carter, C.E.; Urmee, T. A Design Consideration for Solar PV-Diesel Remote Electricity Network: Australia Perspective. In Proceedings of the IEEE PES Innovative Smart Grid Technologies Conference Europe, Ljubljana, Slovenia, 9–12 October 2016; IEEE Computer Society: Washington, DC, USA, 2016; pp. 821–826. [Google Scholar]
  10. Ismael, S.M.; Abdel Aleem, S.H.E.; Abdelaziz, A.Y.; Zobaa, A.F. State-of-the-Art of Hosting Capacity in Modern Power Systems with Distributed Generation. Renew. Energy 2019, 130, 1002–1020. [Google Scholar] [CrossRef]
  11. Power and Water Corporation. Solar/Diesel Mini-Grid Handbook; Australian Government, Australian Renewable Energy Agency: Canberra City, ACT, Australia, 2019. [Google Scholar]
  12. Jamal, T.; Urmee, T.; Calais, M.; Shafiullah, G.M.; Carter, C. Technical Challenges of PV Deployment into Remote Australian Electricity Networks: A Review. Renew. Sustain. Energy Rev. 2017, 77, 1309–1325. [Google Scholar] [CrossRef]
  13. Hosseini, Z.S.; Khodaei, A. Dynamic Solar Hosting Capacity Calculations in Microgrids. In Proceedings of the CIGRE US National Committee 2018 Grid of the Future Symposium, Schipol, The Netherlands, 28–31 October 2018. [Google Scholar]
  14. Salehin, S.; Rahman, M.M.; Islam, A.K.M.S. Techno-Economic Feasibility Study of a Solar PV-Diesel System for Applications in Northern Part of Bangladesh. Int. J. Renew. Energy Res. 2015, 5, 1220–1229. [Google Scholar] [CrossRef]
  15. Das, B.K.; Alotaibi, M.A.; Das, P.; Islam, M.S.; Das, S.K.; Hossain, M.A. Feasibility and Techno-Economic Analysis of Stand-Alone and Grid-Connected PV/Wind/Diesel/Batt Hybrid Energy System: A Case Study. Energy Strateg. Rev. 2021, 37, 100673. [Google Scholar] [CrossRef]
  16. Chandel, M.; Agrawal, G.D.; Mathur, S.; Mathur, A. Techno-Economic Analysis of Solar Photovoltaic Power Plant for Garment Zone of Jaipur City. Case Stud. Therm. Eng. 2014, 2, 1–7. [Google Scholar] [CrossRef] [Green Version]
  17. Shah, S.A.A.; Das Valasai, G.; Memon, A.A.; Laghari, A.N.; Jalbani, N.B.; Strait, J.L. Techno-Economic Analysis of Solar PV Electricity Supply to Rural Areas of Balochistan, Pakistan. Energies 2018, 11, 1777. [Google Scholar] [CrossRef] [Green Version]
  18. Al-Ghussain, L.; Samu, R.; Taylan, O.; Fahrioglu, M. Techno-Economic Comparative Analysis of Renewable Energy Systems: Case Study in Zimbabwe. Inventions 2020, 5, 27. [Google Scholar] [CrossRef]
  19. Bhagavathy, S.M.; Pillai, G. PV Microgrid Design for Rural Electrification. Designs 2018, 2, 33. [Google Scholar] [CrossRef] [Green Version]
  20. Poudyal, R.; Loskot, P.; Parajuli, R. Techno-Economic Feasibility Analysis of a 3-KW PV System Installation in Nepal. Renew. Wind. Water Sol. 2021, 8, 5. [Google Scholar] [CrossRef]
  21. Mekonnen, T.; Bhandari, R.; Ramayya, V. Modeling, Analysis and Optimization of Grid-integrated and Islanded Solar Pv Systems for the Ethiopian Residential Sector: Considering an Emerging Utility Tariff Plan for 2021 and Beyond. Energies 2021, 14, 3360. [Google Scholar] [CrossRef]
  22. Husain, A.A.F.; Phesal, M.H.A.; Ab Kadir, M.Z.A.; Ungku Amirulddin, U.A. Techno-Economic Analysis of Commercial Size Grid-Connected Rooftop Solar Pv Systems in Malaysia under the Nem 3.0 Scheme. Appl. Sci. 2021, 11, 10118. [Google Scholar] [CrossRef]
  23. Rawa, M.; Abusorrah, A.; Al-Turki, Y.; Mekhilef, S.; Mostafa, M.H.; Ali, Z.M.; Aleem, S.H.E.A. Optimal Allocation and Economic Analysis of Battery Energy Storage Systems: Self-Consumption Rate and Hosting Capacity Enhancement for Microgrids with High Renewable Penetration. Sustainability 2020, 12, 10144. [Google Scholar] [CrossRef]
  24. Arshad, A.; Lindner, M.; Lehtonen, M. An Analysis of Photo-Voltaic Hosting Capacity in Finnish Low Voltage Distribution Networks. Energies 2017, 10, 1702. [Google Scholar] [CrossRef] [Green Version]
  25. Tazay, A. Techno-Economic Feasibility Analysis of a Hybrid Renewable Energy Supply Options for University Buildings in Saudi Arabia. Open Eng. 2020, 11, 39–55. [Google Scholar] [CrossRef]
  26. Fachrizal, R.; Ramadhani, U.H.; Munkhammar, J.; Widén, J. Combined PV–EV Hosting Capacity Assessment for a Residential LV Distribution Grid with Smart EV Charging and PV Curtailment. Sustain. Energy Grids Netw. 2021, 26, 100445. [Google Scholar] [CrossRef]
  27. Christiaanse, T.V.; Loonen, R.C.G.M.; Evins, R. Techno-Economic Optimization for Grid-Friendly Rooftop PV Systems—A Case Study of Commercial Buildings in British Columbia. Sustain. Energy Technol. Assess. 2021, 47, 101320. [Google Scholar] [CrossRef]
  28. Sanwar Hossain, M.; Islam, K.Z.; Alharbi, A.G.; Shafiullah, M.; Islam, M.R.; Fekih, A. Optimal Design of a Hybrid Solar PV/BG-Powered Heterogeneous Network. Sustainability 2022, 14, 2201. [Google Scholar] [CrossRef]
  29. Badal, F.R.; Das, P.; Sarker, S.K.; Das, S.K. A Survey on Control Issues in Renewable Energy Integration and Microgrid. Prot. Control. Mod. Power Syst. 2019, 4, 8. [Google Scholar] [CrossRef] [Green Version]
  30. Ding, K.; Li, W.; Qian, Y.; Hu, P.; Huang, Z. Application of User Side Energy Storage System for Power Quality Enhancement of Premium Power Park. Sustainability 2022, 14, 3668. [Google Scholar] [CrossRef]
  31. Mukhopadhyay, B.; Das, D. Optimal Multi-Objective Long-Term Sizing of Distributed Energy Resources and Hourly Power Scheduling in a Grid-Tied Microgrid. Sustain. Energy Grids Netw. 2022, 30, 100632. [Google Scholar] [CrossRef]
  32. Zhou, J.; Tsianikas, S.; Birnie, D.P.; Coit, D.W. Economic and Resilience Benefit Analysis of Incorporating Battery Storage to Photovoltaic Array Generation. Renew. Energy 2019, 135, 652–662. [Google Scholar] [CrossRef]
  33. Tumiran; Nafis, A.S.T.; Sarjiya; Putranto, L.M.; Indrawan, H. Determination of PV Hosting Capacity in Rural Distribution Network: A Study Case for Bantul Area. Int. J. Renew. Energy Res. 2019, 9, 1116–1124. [Google Scholar]
  34. Arif, S.; Rabbi, A.E.; Jamal, T.; Aziz, T. Behavioural Study of a Remote Power System with High PV Penetration during a State of Emergency. In Proceedings of the 2020 International Conference on Smart Grids and Energy Systems (SGES), Perth, Australia, 23–26 November 2020; Institute of Electrical and Electronics Engineers Inc.: Piscataway, NJ, USA, 2020; pp. 590–595. [Google Scholar]
  35. Bajaj, M.; Kumar Singh, A. Hosting Capacity Enhancement of Renewable-Based Distributed Generation in Harmonically Polluted Distribution Systems Using Passive Harmonic Filtering. Sustain. Energy Technol. Assess. 2021, 44, 101030. [Google Scholar] [CrossRef]
  36. Liu, D.; Wang, C.; Tang, F.; Zhou, Y. Probabilistic Assessment of Hybridwind-Pv Hosting Capacity in Distribution Systems. Sustainability 2020, 12, 2183. [Google Scholar] [CrossRef] [Green Version]
  37. Fatima, S.; Püvi, V.; Lehtonen, M. Review on the PV Hosting Capacity in Distribution Networks. Energies 2020, 13, 4756. [Google Scholar] [CrossRef]
  38. Mohammadi, P.; Mehraeen, S. Challenges of PV Integration in Low-Voltage Secondary Networks. IEEE Trans. Power Deliv. 2017, 32, 525–535. [Google Scholar] [CrossRef]
  39. Iqbal, A.; Ayoub, A.; Waqar, A.; Ul-Haq, A.; Zahid, M.; Haider, S. Voltage Stability Enhancement in Grid-Connected Microgrid Using Enhanced Dynamic Voltage Restorer (EDVR). AIMS Energy 2021, 9, 150–177. [Google Scholar] [CrossRef]
  40. Essackjee, I.A.; Ah King, R.T.F. Maximum Rooftop Photovoltaic Hosting Capacity with Harmonics as Limiting Factor—Case Study for Mauritius. In Proceedings of the 2019 International Conference on Advances in Big Data, Computing and Data Communication Systems (icABCD), Winterton, South Africa, 5–6 August 2019; Institute of Electrical and Electronics Engineers Inc.: Winterton, South Africa, 2019; pp. 1–6. [Google Scholar]
  41. Akinyele, D.; Belikov, J.; Levron, Y. Challenges of Microgrids in Remote Communities: A STEEP Model Application. Energies 2018, 11, 432. [Google Scholar] [CrossRef] [Green Version]
  42. Cetinkaya, H.B.; Kucuk, S.; Unaldi, M.; Gokce, G.B. A Case Study of a Successful Industrial Microgrid Operation. In Proceedings of the 2017 4th International Conference on Electrical and Electronic Engineering (ICEEE), Ankara, Turkey, 8–10 August 2017; pp. 95–98. [Google Scholar]
  43. Haesen, E.; Minne, F.; Driesen, J.; Bollen, M. Hosting Capacity for Motor Starting in Weak Grids. In Proceedings of the 2005 International Conference on Future Power Systems, Amsterdam, The Netherlands, 16–18 November 2005; Volume 6. [Google Scholar] [CrossRef]
  44. Aziz, T.; Al Masood, N.; Deeba, S.R.; Tushar, W.; Yuen, C. A Methodology to Prevent Cascading Contingencies Using BESS in a Renewable Integrated Microgrid. Int. J. Electr. Power Energy Syst. 2019, 110, 737–746. [Google Scholar] [CrossRef]
  45. DIgSILENT GmbH. PowerFactory 2020 SP3 User Manual; DIgSILENT GmbH: Gomaringen, Germany, 2020. [Google Scholar]
  46. IEEE Std. 1547-2018; IEEE Standard for Interconnection and Interoperability of Distributed Energy Resources with Associated Electric Power Systems Interfaces. Institute of Electrical and Electronics Engineers (IEEE): Piscataway, NJ, USA, 2018; ISBN 9781504446396.
  47. HOMER Pro 3.14. Available online: https://www.homerenergy.com/products/pro/docs/latest/index.html (accessed on 18 August 2021).
  48. Kundur, P.; Balu, N.J.; Lauby, M.G. Power System Stability and Control; McGraw-Hill: New York, NY, USA, 1994; ISBN 0070635153. [Google Scholar]
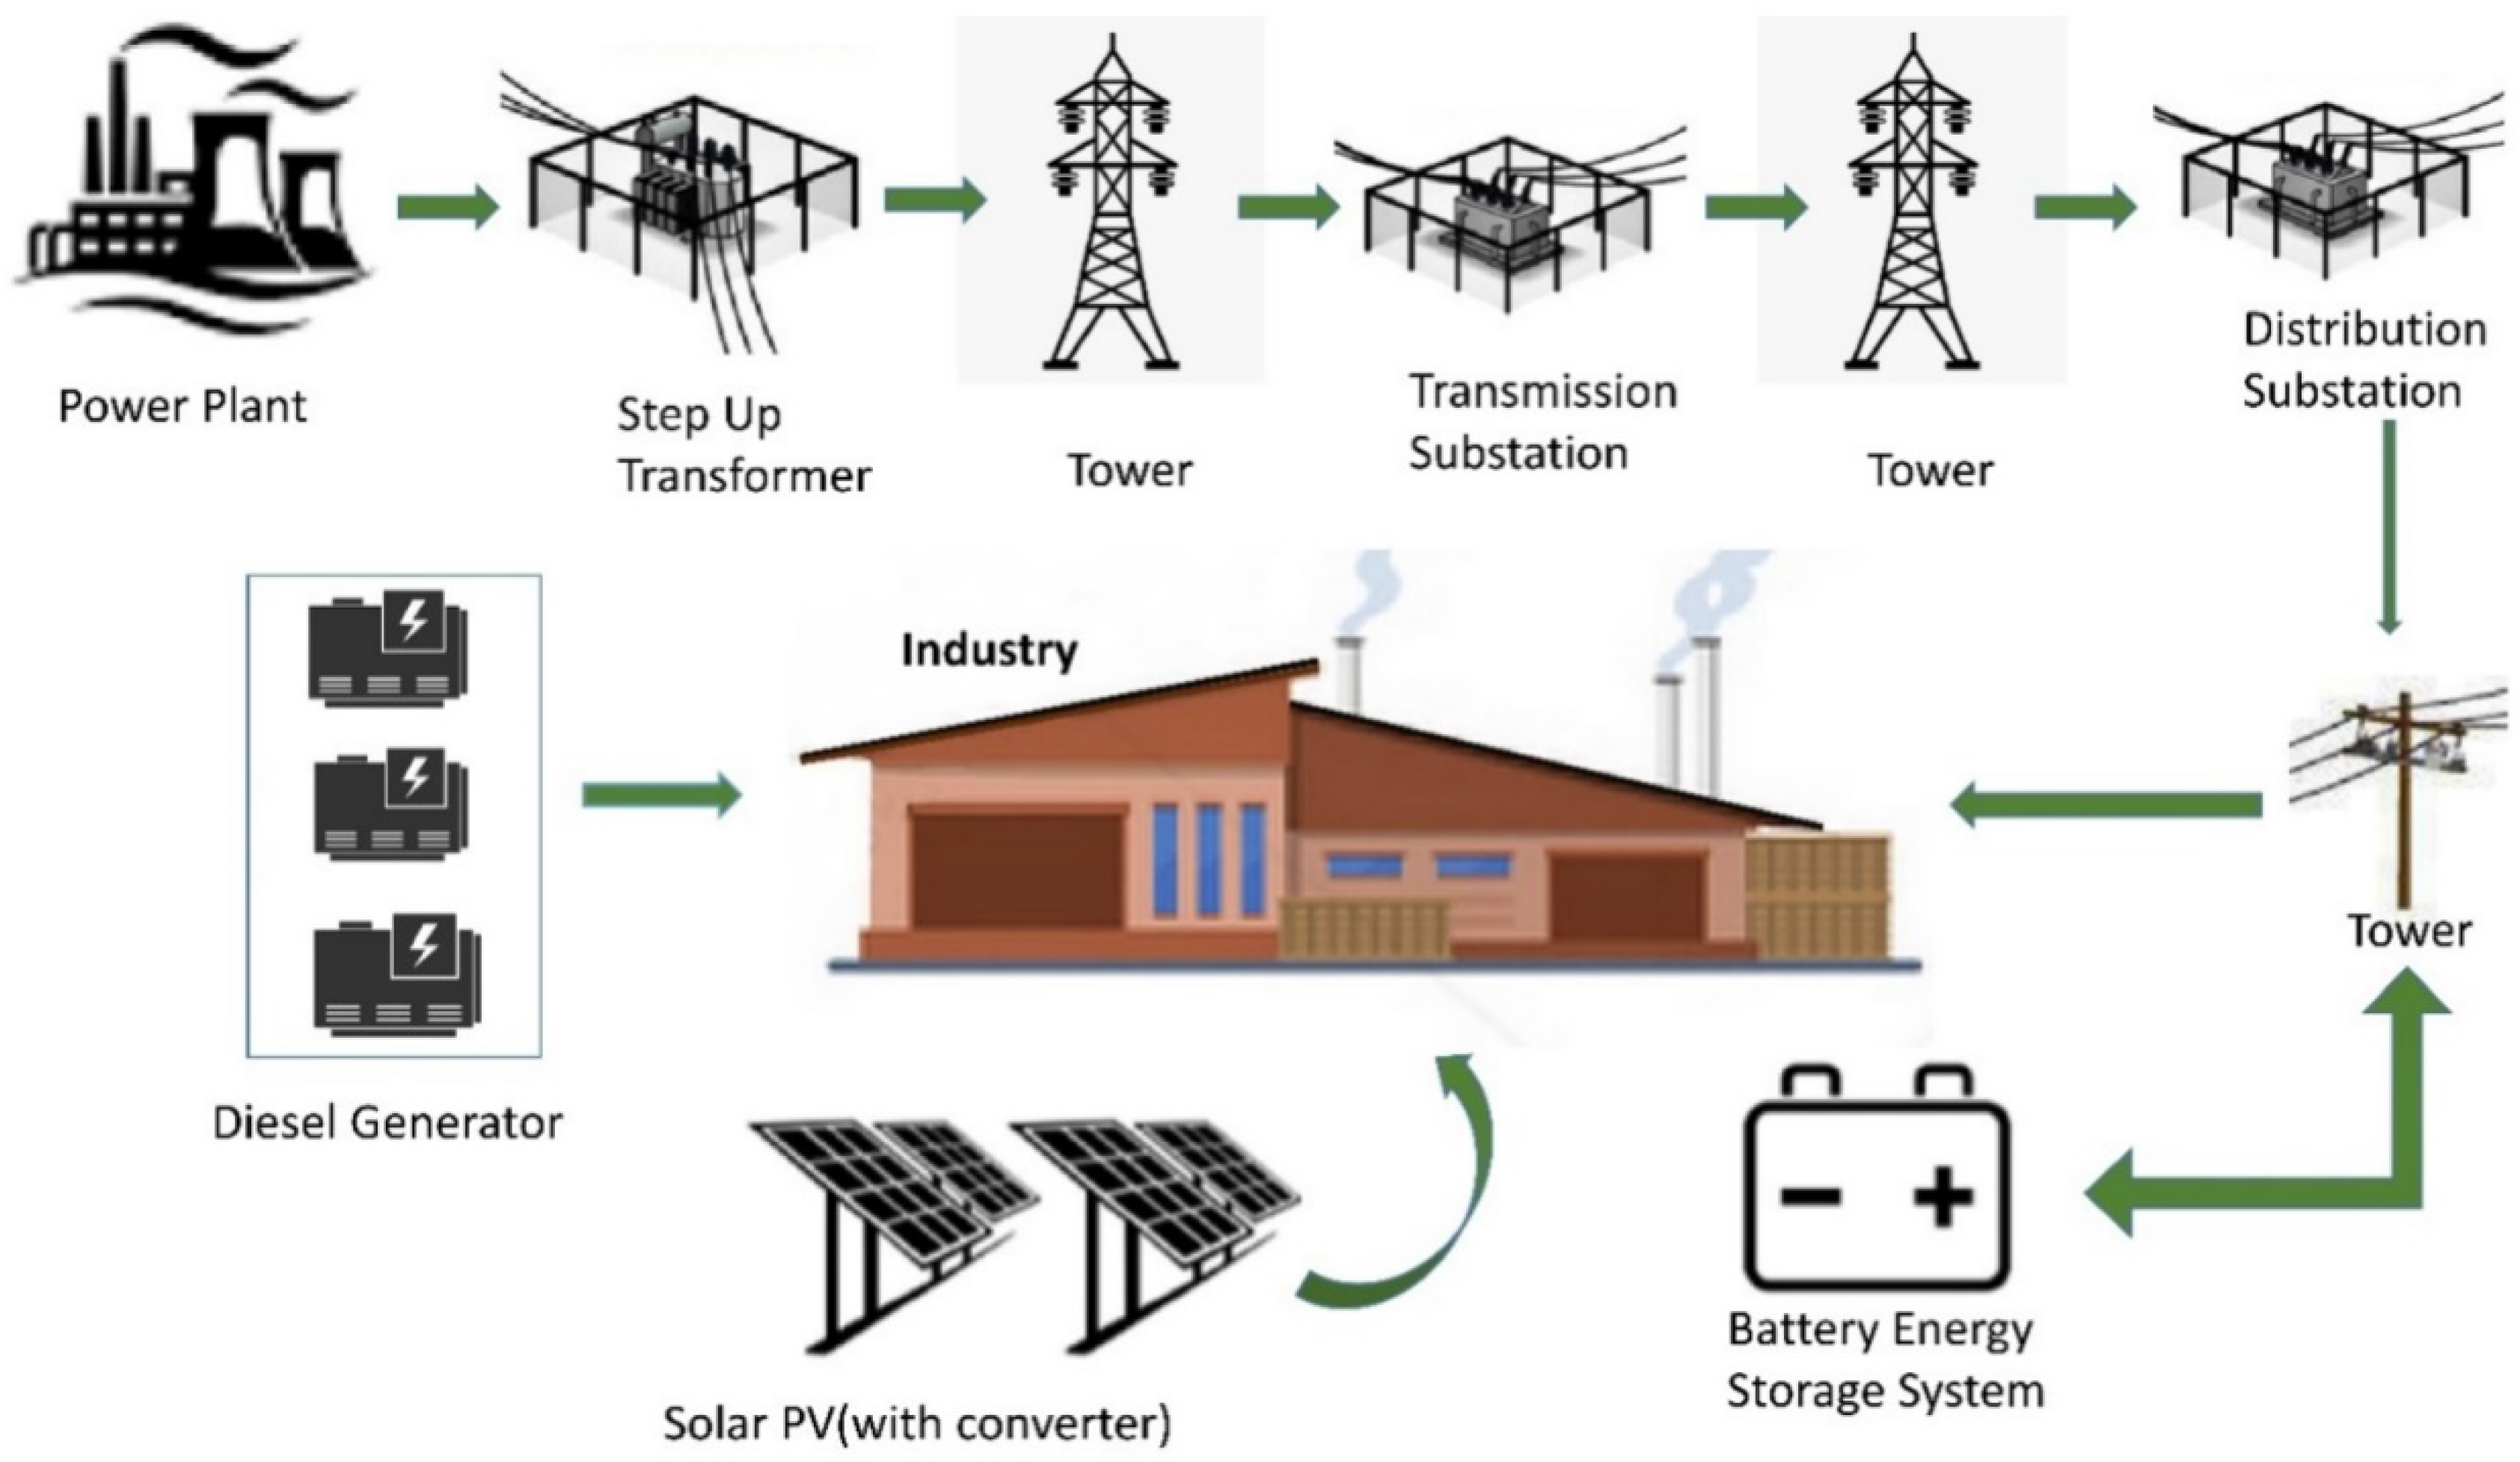
Figure 1. Schematic diagram of the major components of the industrial system.
Sustainability 14 08921 g001
Figure 2. Flowchart of the methodology to incorporate maximum PV in an industrial MG with fault tolerance.
Sustainability 14 08921 g002
Figure 3. Daily load profile of the system.
Sustainability 14 08921 g003
Figure 4. Power system single line diagram of the microgrid for RMG factory.
Sustainability 14 08921 g004
Figure 5. 415 V Terminal voltage (top left), system frequency (bottom left), PV Active power while PV size is at 1125 kW (top right) and active power of generators observed in step 1 (bottom right).
Sustainability 14 08921 g005
Figure 6. 415 V Terminal voltage (top left), system frequency (bottom left), PV Active power while PV size is 1124 kW (top right) and active power of generators observed in step 1 (bottom right).
Sustainability 14 08921 g006aSustainability 14 08921 g006b
Figure 7. 415 V Terminal voltage (top left), PV Active power while the PV size is 1125 kW (top right), system frequency (mid left), Generator active power (mid right) and BESS active power (bottom left) and reactive power (bottom right) while the BESS size is 1.0 kVA in step 2.
Sustainability 14 08921 g007aSustainability 14 08921 g007b
Figure 8. 415 V Terminal voltage (top left), PV Active power while the PV size is 2500 kW (top right), system frequency (mid left), Generator active power (mid right) and BESS active power (bottom left) and reactive power (bottom right) while the BESS size is 1237 kVA in step 2.
Sustainability 14 08921 g008aSustainability 14 08921 g008b
Figure 9. Enchanced HC with different sizes of BESS.
Sustainability 14 08921 g009
Figure 10. Schematic diagram of the energy system.
Sustainability 14 08921 g010
Figure 11. LCOE for different PV sizes with different BESS sizes.
Sustainability 14 08921 g011
Figure 12. Optimization surface plot with total fuel and COE superimposed.
Sustainability 14 08921 g012
Figure 13. Optimization surface plot with CO2 emission and renewable fraction superimposed.
Sustainability 14 08921 g013
Table 1. Comparison between this work with other similar studies.
Reference NoGrid ConnectivityEnergy SystemHC AnalysisSystem Robustness CheckOptimization
[14]Off-gridDiesel, PV + Diesel, PV + Diesel + Battery, Wind + Diesel, Wind + Diesel + Battery, Diesel + Battery, PV + Wind + Diesel, PV + Wind + Diesel + BatteryNoNoYes
[15]Off-gridPV + Diesel + Battery, PV + Wind + Diesel + Battery, PV + Battery, Wind + Diesel + Battery, DieselNoNoYes
[16]Off-gridPV, PV + BatteryNoNoNo
[17]Off-gridPVNoNoNo
[18]Off-gridPV, Wind, PV + WindNoNoYes
[19]Off-gridPVNoNoYes
[20]On-grid and off-gridGrid + PV, PV + BatteryNoNoYes
[21]On-grid and off-gridGrid + PV, Grid + PV + Battery, PV + BatteryNoNoYes
[22]On-gridPVNoNoYes
[23]On-gridGrid + PV + Wind + BatteryYesNoYes
[24]On-gridGrid + PVYesNoNo
[25]On-gridGrid + PV, Grid + Wind, Grid + PV + WindNoNoYes
This paperOff-gridDiesel + PV + BatteryYesYesYes
Table 2. DER Response (shall trip) to Abnormal Voltages and Frequencies.
Default SettingRange of Allowable Settings
Shall Trip
Function
Voltage
(p.u. of Nominal Voltage)
Clearing Time (s)Voltage
(p.u. of Nominal Voltage)
Clearing Time (s)
Over voltage, OV21.200.16fixed at 1.20fixed at 0.16
Over voltage, OV11.102.01.10–1.201.0–13.0
Under voltage, UV10.702.00.0–0.882.0–21.0
Under voltage, UV20.450.160.0–0.500.16–2.0
Frequency
(p.u)
Clearing time (s)Frequency
(p.u)
Clearing time (s)
Over frequency, OF21.0330.161.03–1.10.16–1000.0
Over frequency, OF11.02300.01.017–1.1180.0–1000.0
Under frequency, UF10.975300.00.833–0.983180.0–1000
Under frequency, UF20.9420.160.833–0.950.16–1000
Table 3. Loads in the RMG factory.
Serial No.Machine TypeMaximum Power Per Unit (kW)Number of UnitsBus Location
1Auto knitting machine1.28656DB-3F
2Sewing machine0.2177DB-1F, DB-2F
3Manual linking machine0.55566DB-1F, DB-2F
4Iron table0.798DB-1F, DB-2F
5Washing machine46DB-GF
6Water treatment plant15DB-WTP
7Effluent treatment plant 152DB-ETP
8Blower751DB-BOILER
9Dryer 12.525DB-DRYER
10Dryer 25.212DB-GF
11Compressor 11451DB-CHILLER
12Compressor 2751DB-CHILLER
13Compressor 3402DB-DRYER
14Panel machine0.3710DB-GF
15Fan coil unit 1176DB-3F
16Fan coil unit 20.734DB-GF, DB-1F, DB-3F, DB-4F
17Fan coil unit 371DB-2F
18Exhaust fan 10.445DB-DRYER, DB-GF, DB-1F, DB-2F, DB-3F
19Exhaust fan 21.118DB-GF, DB-1F, DB-2F
20Celling fan0.075361DB-GF, DB-1F, DB-2F
21Air handling unit52DB-G.ROOM, DB-EMERGENCY
22Cooling tower fan45DB-CHILLER
23Lift222DB-4F
24Pump 12.21DB-4F
25Pump 2102DB-PUMP
26Pump 31741DB-FIRE PANEL
27Pump 443DB-PUMP
28Cooling water pump1010DB-CHILLER
29Motor 12.21DB-3F
30Motor 21.13DB-GF
31Total composite load (lights and others)370.36
Table 4. PV HC of different buses in the system.
Bus No11 kV Terminal415 V Terminalbb1_WTPbb2_ DRYERbb3_PUMPbb4_ETPbb5_ BOILERbb6_CHILLER
PV HC (kW)281055722005272242222611077
Bus Nobb7_Fire panelbb8_G.roombb9_Emergencybb10_GFbb11_1Fbb12_2Fbb13_3Fbb14_4F
PV HC (kW)1962012015508461340533397389
Table 5. Data for Techno-Economic Analysis.
DieselGeneratorSolar PVBattery
System ParameterValue/InformationSystem ParameterValue/InformationSystem ParameterValue/Information
Number of Operating Generators03CapitalCost (BDT */kWp)50,000.00TechnologyLi-IonBatterybank
CapacityofIdenticalGenerators (kW)1000ReplacementCost (BDT/kWp)50,000.00NominalCapacity (kWh/unit)1.00
MinimumLoading Ratio (%)25Operation andMaintenanceCost (BDT/Year)5000.00CapitalCost (BDT/unit)3500.00
Minimum Run Time (Minute)30Lifetime (Years)25.00ReplacementCost (BDT/unit)3500.00
CapitalCost (BDT/kW)300,000.00DeratingFactor (%)90.00Operation andMaintenanceCost (BDT/Year)0.00
ReplacementCost (BDT/kW)300,000.00Inverter
(bi-directionalandgrid-tied)
MinimumState of Charge (%)20.00
Operation andMaintenanceCost (BDT/hour)10.000CapitalCost (BDT/kW)45,000.00Minimum storage life (Years)2.00
LifetimeRunninghours15,000.00ReplacementCost (BDT/kW)45,000.00
Diesel Price(BDT/Litre)65Operation andMaintenanceCost (BDT/Year)0.0
Efficiency (%)98.00
Lifetime (Years)15.00
Project Information
ExpectedInflationRate (%)6.70ExpectedNominal DiscountRate (%)7.00ProjectLifetime (Years)20.00
* Conversion rate: 1 BDT = 0.012 USD.
Table 6. Comparison between scenarios with lowest and highest COEs.
PV (kW)BESS (kVA)LCOE (BDT/kWh)LCOE (USD/kWh)Operating Cost (Million BDT/yr)Operating Cost (Million USD/yr)Renewable Fraction (%)Total Fuel (L/yr)PV Production (kWh/yr)
1124015.930.18752162.5411.83,228,6981,693,984
202170015.030.17692002.3520.62,910,5313,045,856
2500123714.600.17191922.2624.82,759,0283,767,759
Table 7. Comparison between this work with other similar studies.
Reference NoGrid ConnectivityEnergy SystemHC AnalysisSystem Robustness CheckOptimizationLowest Levelized Cost of Energy (LCOE)
[14]Off-gridDiesel, PV + Diesel, PV + Diesel + Battery, Wind + Diesel, Wind + Diesel + Battery, Diesel + Battery, PV + Wind + Diesel, PV + Wind + Diesel + BatteryNoNoYes0.246 USD/kWh
[15]Off-gridPV + Diesel + Battery, PV + Wind + Diesel + Battery, PV + Battery, Wind + Diesel + Battery, DieselNoNoYes0.29 USD/kWh
[16]Off-gridPV, PV + BatteryNoNoNo0.15 USD/kWh
[17]Off-gridPVNoNoNo0.045 USD/kWh
[18]Off-gridPV, Wind, PV + WindNoNoYes
[19]Off-gridPVNoNoYes
[20]On-grid and off-gridGrid + PV, PV + BatteryNoNoYes0.060 USD/kWh
[21]On-grid and off-gridGrid + PV, Grid + PV + Battery, PV + BatteryNoNoYes0.0581 USD/kWh
[22]On-gridPVNoNoYes0.031 USD/kWh
[23]On-gridGrid + PV + Wind + BatteryYesNoYes
[24]On-gridGrid + PVYesNoNo
[25]On-gridGrid + PV, Grid + Wind, Grid + PV + WindNoNoYes0.0702 USD/kWh
This paperOff-gridDiesel + PV + BatteryYesYesYes0.1719 USD/kWh
Publisher’s Note: MDPI stays neutral with regard to jurisdictional claims in published maps and institutional affiliations.