
Eye-SCOR: A Supply Chain Operations Reference-Based Framework for Smart Eye Status Monitoring Using System Dynamics Modeling


Abstract
:1. Introduction
1.1. Background Literature and Motivation
1.2. Contribution
1.3. Paper Organization
2. Methodology
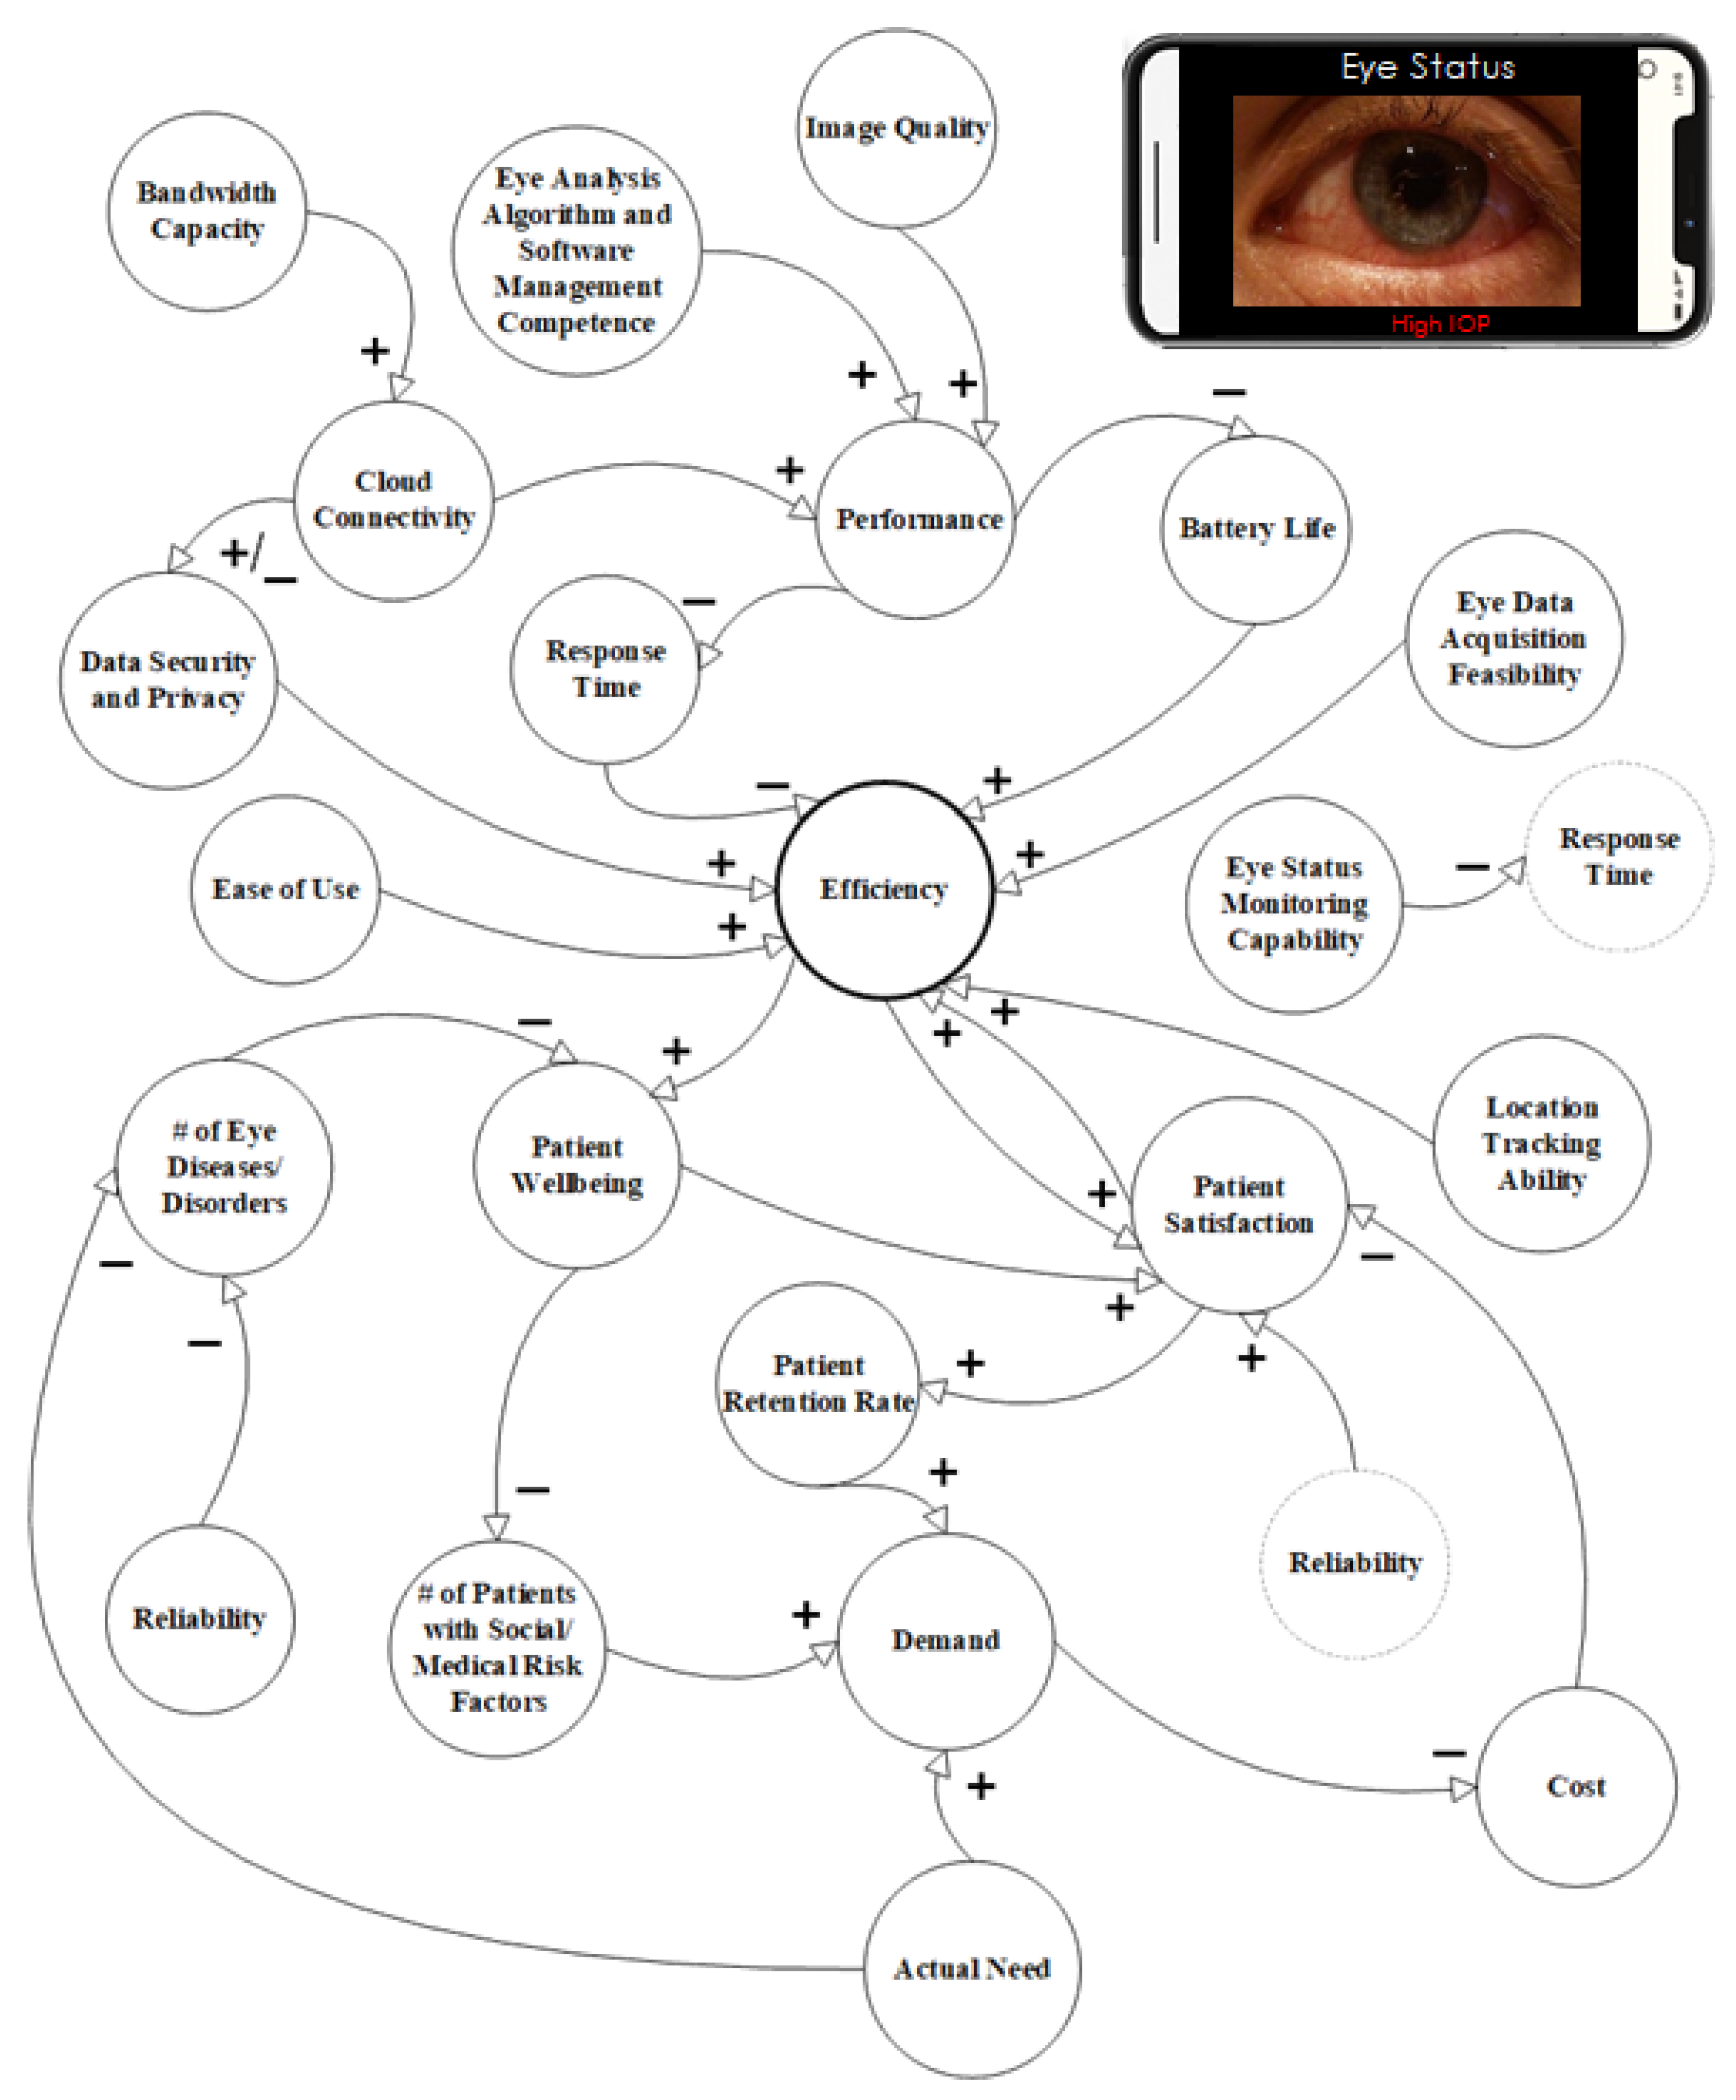
2.1. Causal Model
2.2. System Dynamics Model


3. Simulation Results
3.1. Testing Scenarios
3.1.1. Baseline
3.1.2. Scenario 1
3.1.3. Scenario 2
3.1.4. Scenario 3
3.1.5. Scenario 4
3.1.6. Scenario 5
3.1.7. Scenario 6
4. Discussion
5. Conclusions
Author Contributions
Funding
Institutional Review Board Statement
Informed Consent Statement
Data Availability Statement
Conflicts of Interest
Abbreviations
| IOP | Intraocular pressure |
| SCOR | Supply chain operations reference |
References
- Ansah, J.P.; Koh, V.; De Korne, D.; Jayabaskar, T.; Matchar, D.B.; Quek, D. Modeling manpower requirement for a changing population health needs: The case of ophthalmic nurses and allied health ophthalmic professionals. Health Policy Technol. 2019, 8, 282–295. [Google Scholar] [CrossRef]
- Klein, R.; Klein, B.E. The prevalence of age-related eye diseases and visual impairment in aging: Current estimates. Investig. Ophthalmol. Vis. Sci. 2013, 54, ORSF5–ORSF13. [Google Scholar] [CrossRef] [PubMed] [Green Version]
- Yoon, K.C.; Mun, G.H.; Kim, S.D.; Kim, S.H.; Kim, C.Y.; Park, K.H.; Park, Y.J.; Baek, S.H.; Song, S.J.; Shin, J.P.; et al. Prevalence of eye diseases in South Korea: Data from the Korea national health and nutrition examination survey 2008-2009. Korean J. Ophthalmol. 2011, 25, 421–433. [Google Scholar] [CrossRef] [PubMed]
- Kempen, J.H.; Mitchell, P.; Lee, K.; Tielsch, J.; Broman, A.; Taylor, H.; Ikram, M.; Congdon, N.; O’Colmain, B.; Eye Diseases Prevalence Research Group. The prevalence of refractive errors among adults in the United States, Western Europe, and Australia. Arch. Ophthalmol. 2004, 122, 495–505. [Google Scholar]
- Congdon, N.; Vingerling, J.R.; Klein, B.; West, S.; Friedman, D.S.; Kempen, J.; O’Colmain, B.; Wu, S.Y.; Taylor, H.R. Prevalence of cataract and pseudophakia/aphakia among adults in the United States. Arch. Ophthalmol. 2004, 122, 487–494. [Google Scholar]
- Varma, R.; Ying-Lai, M.; Francis, B.A.; Nguyen, B.B.T.; Deneen, J.; Wilson, M.R.; Azen, S.P.; Los Angeles Latino Eye Study Group. Prevalence of open-angle glaucoma and ocular hypertension in Latinos: The Los Angeles Latino Eye Study. Ophthalmology 2004, 111, 1439–1448. [Google Scholar] [CrossRef]
- Hogarty, D.T.; Hogarty, J.P.; Hewitt, A.W. Smartphone use in ophthalmology: What is their place in clinical practice? Surv. Ophthalmol. 2020, 65, 250–262. [Google Scholar] [CrossRef] [PubMed]
- Tugal-Tutkun, I.; Herbort Jr, C.P.; Mantovani, A.; Neri, P.; Khairallah, M. Advances and potential new developments in imaging techniques for posterior uveitis. Part 1: Noninvasive imaging methods. Eye 2021, 35, 33–51. [Google Scholar] [CrossRef]
- Faezipour, M.; Faezipour, M. Smart healthcare monitoring apps with a flavor of systems engineering. In Advances in Computer Vision and Computational Biology, Transactions on Computational Science and Computational Intelligence; Springer: Nature, Switzerland, 2021; pp. 611–616. [Google Scholar]
- Vinay, K.; Vishal, K. Smartphone applications for medical students and professionals. Nitte Univ. J. Health Sci. 2013, 3, 59. [Google Scholar]
- Kratzke, C.; Cox, C. Smartphone technology and apps: Rapidly changing health promotion. Glob. J. Health Educ. Promot. 2012, 15, 72–82. [Google Scholar]
- Wasimuddin, M.; Elleithy, K.; Abuzneid, A.; Faezipour, M.; Abuzaghleh, O. Multiclass ECG Signal Analysis Using Global Average-Based 2-D Convolutional Neural Network Modeling. Electronics 2021, 10, 170. [Google Scholar] [CrossRef]
- Mosadeghi-Nik, M.; Askari, M.S.; Fatehi, F. Mobile health (mHealth) for headache disorders: A review of the evidence base. J. Telemed. Telecare 2016, 22, 472–477. [Google Scholar] [CrossRef] [PubMed]
- NeuroSky Store. EEG App—Brain Wave App. Available online: https://store.neurosky.com/collections/developer-tools (accessed on 24 May 2022).
- Abushakra, A.; Faezipour, M. Augmenting breath regulation using a mobile driven virtual reality therapy framework. IEEE J. Biomed. Health Informatics 2014, 18, 746–752. [Google Scholar] [CrossRef]
- Brown, C.; Chauhan, J.; Grammenos, A.; Han, J.; Hasthanasombat, A.; Spathis, D.; Xia, T.; Cicuta, P.; Mascolo, C. Exploring automatic diagnosis of covid-19 from crowdsourced respiratory sound data. arXiv 2020, arXiv:2006.05919. [Google Scholar]
- Faezipour, M.; Abuzneid, A. Smartphone-Based Self-Testing of COVID-19 Using Breathing Sounds. Telemed. e-Health 2020, 26, 1202–1205. [Google Scholar] [CrossRef]
- Han, J.; Brown, C.; Chauhan, J.; Grammenos, A.; Hasthanasombat, A.; Spathis, D.; Xia, T.; Cicuta, P.; Mascolo, C. Exploring Automatic COVID-19 Diagnosis via voice and symptoms from Crowdsourced Data. In Proceedings of the IEEE International Conference on Acoustics, Speech and Signal Processing (ICASSP), Toronto, ON, Canada, 6–11 June 2021; pp. 8328–8332. [Google Scholar]
- Freeman, K.; Dinnes, J.; Chuchu, N.; Takwoingi, Y.; Bayliss, S.E.; Matin, R.N.; Jain, A.; Walter, F.M.; Williams, H.C.; Deeks, J.J. Algorithm based smartphone apps to assess risk of skin cancer in adults: Systematic review of diagnostic accuracy studies. BMJ 2020, 368. [Google Scholar] [CrossRef] [PubMed] [Green Version]
- Aloudat, M.; Faezipour, M.; El-Sayed, A. Automated Vision-Based High Intraocular Pressure Detection Using Frontal Eye Images. IEEE J. Transl. Eng. Health Med. 2019, 7, 3800113. [Google Scholar] [CrossRef]
- Al-Oudat, M.; Faezipour, M.; El-Sayed, A. A smart intraocular pressure risk assessment framework using frontal eye image analysis. Eurasip J. Image Video Process. 2018, 2018, 90. [Google Scholar] [CrossRef]
- Majaumder, S.; Elloumi, Y.; Akil, M.; Kachouri, R.; Kehtarnavaz, N. A deep learning-based smartphone app for real-time detection of five stages of diabetic retinopathy. Real-Time Image Process. Deep. Learn. 2020, 11401, 1140106. [Google Scholar]
- Pundlik, S.; Tomasi, M.; Liu, R.; Houston, K.; Luo, G. Development and preliminary evaluation of a smartphone app for measuring eye alignment. Transl. Vis. Sci. Technol. 2019, 8, 19. [Google Scholar] [CrossRef] [Green Version]
- Mariakakis, A.; Wang, E.; Patel, S.; Wen, J.C. A smartphone-based system for assessing intraocular pressure. In Proceedings of the 2016 38th Annual International Conference of the IEEE Engineering in Medicine and Biology Society (EMBC), Orlando, FL, USA, 16–20 August 2016; pp. 4353–4356. [Google Scholar]
- Alsos, O.A.; Das, A.; Svanæs, D. Mobile health IT: The effect of user interface and form factor on doctor–patient communication. Int. J. Med. Inform. 2012, 81, 12–28. [Google Scholar] [CrossRef] [PubMed]
- Sundarakani, B.; Abdul Razzak, H.; Manikandan, S. Creating a competitive advantage in the global flight catering supply chain: A case study using SCOR model. Int. J. Logist. Res. Appl. 2018, 21, 481–501. [Google Scholar] [CrossRef] [Green Version]
- APICS Supply Chain Operations Reference Model SCOR Version 12.0. Available online: http://apics.org/scor (accessed on 24 May 2022).
- Ayyildiz, E.; Gumus, A.T. Interval-valued Pythagorean fuzzy AHP method-based supply chain performance evaluation by a new extension of SCOR model: SCOR 4.0. Complex Intell. Syst. 2021, 7, 559–576. [Google Scholar] [CrossRef]
- Zhou, H.; Benton Jr, W.; Schilling, D.A.; Milligan, G.W. Supply chain integration and the SCOR model. J. Bus. Logist. 2011, 32, 332–344. [Google Scholar] [CrossRef]
- Lockamy, A.; McCormack, K. Linking SCOR planning practices to supply chain performance: An exploratory study. Int. J. Oper. Prod. Manag. 2004, 24, 1192–1218. [Google Scholar] [CrossRef] [Green Version]
- Stewart, G. Supply-chain operations reference model (SCOR): The first cross-industry framework for integrated supply-chain management. Logist. Inf. Manag. 1997, 10, 62–67. [Google Scholar] [CrossRef]
- Georgise, F.B.; Thoben, K.D.; Seifert, M. Adapting the SCOR model to suit the different scenarios: A literature review & research agenda. Int. J. Bus. Manag. 2012, 7, 2. [Google Scholar]
- Ellram, L.M.; Tate, W.L.; Billington, C. Understanding and managing the services supply chain. J. Supply Chain. Manag. 2004, 40, 17–32. [Google Scholar] [CrossRef]
- Rotaru, K.; Wilkin, C.; Ceglowski, A. Analysis of SCOR’s approach to supply chain risk management. Int. J. Oper. Prod. Manag. 2014, 34, 1246–1268. [Google Scholar] [CrossRef]
- Miller, J.; Burton, D.J. Driving Supply Chain Resiliency Via Strategic Alignment; Supply Chain Brain Contributors (SCB), Keller International Publishing Corp.: Peconic, NY, USA, 2019; pp. 1–6. [Google Scholar]
- Baltacioglu, T.; Ada, E.; Kaplan, M.D.; Yurt And, O.; Cem Kaplan, Y. A new framework for service supply chains. Serv. Ind. J. 2007, 27, 105–124. [Google Scholar] [CrossRef]
- Birta, L.G.; Arbez, G. Modelling and Simulation; Springer: Berlin/Heidelberg, Germany, 2013. [Google Scholar]
- Sterman, J. System Dynamics: Systems Thinking and Modeling for a Complex World; Working Paper Series: ESD Internal Symposium; Massachusetts Institute of Technology Engineering Systems Division: Cambridge, MA, USA, 2002. [Google Scholar]
- Merrill, J.A.; Deegan, M.; Wilson, R.V.; Kaushal, R.; Fredericks, K. A system dynamics evaluation model: Implementation of health information exchange for public health reporting. J. Am. Med Informatics Assoc. 2013, 20, e131–e138. [Google Scholar] [CrossRef] [Green Version]
- Sterman, J. System Dynamics: Systems Thinking and Modeling for a Complex World; Irwin/McGraw-Hill: Boston, MA, USA, 2000. [Google Scholar]
- Forrester, J.W. System dynamics, systems thinking, and soft OR. Syst. Dyn. Rev. 1994, 10, 245–256. [Google Scholar] [CrossRef]
- Darabi, N.; Hosseinichimeh, N. System Dynamics Modeling in Health and Medicine: A Systematic Literature Review. Syst. Dyn. Rev. 2020, 36, 29–73. [Google Scholar] [CrossRef] [Green Version]
- Hirsch, G.B.; Homer, J. System dynamics applications to health care in the United States. System Dynamics: Theory and Applications; Springer: New York, NY, USA, 2020; pp. 209–227. [Google Scholar]
- Wolstenholme, E.; McKelvie, D. The Dynamics of Care: Understanding People Flows in Health and Social Care; Springer: Berlin/Heidelberg, Germany, 2019. [Google Scholar] [CrossRef]
- Faezipour, M.; Ferreira, S. A System Dynamics Perspective of Patient Satisfaction in Healthcare. Procedia Comput. Sci. 2013, 16, 148–156. [Google Scholar] [CrossRef] [Green Version]
- Faezipour, M.; Ferreira, S. A system dynamics approach for sustainable water management in hospitals. IEEE Syst. J. 2018, 12, 1278–1285. [Google Scholar] [CrossRef]
- Leung, L.W.; Roudsari, A.V.; Kuo, A.; Courtney, K.L. System Dynamics in Remote Monitoring Service for Cardiovascular Implantable Electronic Devices. In Proceedings of the Information Technology and Communications in Health Conference (ITCH), Victoria, BC, Canada, 14–17 February 2019; pp. 277–282. [Google Scholar]
- De Andrade, L.; Lynch, C.; Carvalho, E.; Rodrigues, C.G.; Vissoci, J.R.N.; Passos, G.F.; Pietrobon, R.; Nihei, O.K.; de Barros Carvalho, M.D. System dynamics modeling in the evaluation of delays of care in ST-segment elevation myocardial infarction patients within a tiered health system. PLoS ONE 2014, 9, e103577. [Google Scholar] [CrossRef] [Green Version]
- Kunc, M.; Kazakov, R. Competitive dynamics in pharmaceutical markets: A case study in the chronic cardiac disease market. J. Oper. Res. Soc. 2013, 64, 1790–1799. [Google Scholar] [CrossRef]
- Ghaffarzadegan, N. Simulation-based what-if analysis for controlling the spread of Covid-19 in universities. PLoS ONE 2021, 16, e0246323. [Google Scholar] [CrossRef]
- Faezipour, M.; Faezipour, M. System dynamics modeling for smartphone-based healthcare tools: Case study on ECG monitoring. IEEE Syst. J. 2021, 15, 3036–3045. [Google Scholar] [CrossRef]
- Faezipour, M.; Faezipour, M. Sustainable smartphone-based healthcare systems: A systems engineering approach to assess the efficacy of respiratory monitoring apps. Sustainability 2020, 12, 5061. [Google Scholar] [CrossRef]
- Faezipour, M.; Faezipour, M. Efficacy of Smart EEG Monitoring Amidst the COVID-19 Pandemic. Electronics 2021, 10, 1001. [Google Scholar] [CrossRef]
- Ikasari, N.; Yuniaristanto; Sutopo, W. Supply Chain Performance Measurement using Hybrid SCOR Model and System Dynamics. In Proceedings of the 2019 1st International Conference on Engineering and Management in Industrial System (ICOEMIS 2019), Malang, Indonesia, 8–9 August 2019; pp. 237–244. [Google Scholar]
- Immawan, T.; Marimin; Arkeman, Y.; Maulana, A. Hybrid SCOR-SD Performance Measurement MTS-MTO Production Typology for Batik Industry. Adv. Sci. Lett. 2015, 21, 3214–3218. [Google Scholar] [CrossRef]
- Bam, L.; McLaren, Z.; Coetzee, E.; Von Leipzig, K. Reducing stock-outs of essential tuberculosis medicines: A system dynamics modelling approach to supply chain management. Health Policy Plan. 2017, 32, 1127–1134. [Google Scholar] [CrossRef]
- Diaz, R.; Behr, J.G.; Longo, F.; Padovano, A. Supply Chain Modeling in the Aftermath of a Disaster: A System Dynamics Approach in Housing Recovery. IEEE Trans. Eng. Manag. 2019, 67, 531–544. [Google Scholar] [CrossRef]
- Allahi, F.; Taheri, S.; Kian, R.; Sabet, E. Cash-based interventions to enhance dignity in persistent humanitarian refugee crises: A system dynamics approach. IEEE Trans. Eng. Manag. 2020. [Google Scholar] [CrossRef]
- Divsalar, M.; Ahmadi, M.; Nemati, Y. A SCOR-Based model to evaluate LARG supply chain performance using a Hybrid MADM method. IEEE Trans. Eng. Manag. 2020, 69, 1101–1120. [Google Scholar] [CrossRef]
- Dissanayake, C.K.; Cross, J.A. Systematic mechanism for identifying the relative impact of supply chain performance areas on the overall supply chain performance using SCOR model and SEM. Int. J. Prod. Econ. 2018, 201, 102–115. [Google Scholar] [CrossRef]
- Rwashana, A.S.; Williams, D.W.; Neema, S. System dynamics approach to immunization healthcare issues in developing countries: A case study of Uganda. Health Informa. J. 2009, 15, 95–107. [Google Scholar] [CrossRef]
- Ware, J.; Kosinski, M.; Gandek, B. SF-36 health survey: Manual and interpretation guide Lincoln. In RI: QualityMetric Incorporated; England Medical Center: London, UK, 2000. [Google Scholar]
- APICS Council, Version 12.0. APICS Supply Chain Operations Reference Model, SCOR. APICS: Chicago, IL, USA, 2017; pp. 1–23.
- Ntabe, E.N.; LeBel, L.; Munson, A.D.; Santa-Eulalia, L.A. A systematic literature review of the supply chain operations reference (SCOR) model application with special attention to environmental issues. Int. J. Prod. Econ. 2015, 169, 310–332. [Google Scholar] [CrossRef]
- Fawcett, S.E.; Wallin, C.; Allred, C.; Fawcett, A.M.; Magnan, G.M. Information technology as an enabler of supply chain collaboration: A dynamic-capabilities perspective. J. Supply Chain. Manag. 2011, 47, 38–59. [Google Scholar] [CrossRef]
- Carr, A.S.; Pearson, J.N. Strategically managed buyer–supplier relationships and performance outcomes. J. Oper. Manag. 1999, 17, 497–519. [Google Scholar] [CrossRef]
- Goldsby, T.J.; Stank, T.P. World class logistics performance and environmentally responsible logistics practices. J. Bus. Logist. 2000, 21, 187. [Google Scholar]
- Li, L.; Su, Q.; Chen, X. Ensuring supply chain quality performance through applying the SCOR model. Int. J. Prod. Res. 2011, 49, 33–57. [Google Scholar] [CrossRef]
- Choudhury, A.; Asan, O. Impact of using wearable devices on psychological Distress: Analysis of the health information national Trends survey. Int. J. Med Informatics 2021, 156, 104612. [Google Scholar] [CrossRef]
- Patel, M.S.; Asch, D.A.; Volpp, K.G. Wearable devices as facilitators, not drivers, of health behavior change. JAMA 2015, 313, 459–460. [Google Scholar] [CrossRef]
- Stella Architect Software. From isee systems. Available online: https://www.iseesystems.com/store/products/stella-architect.aspx (accessed on 24 May 2022). (sourced from Murfreesboro, IN, USA).
- Ferreira, S. Measuring the Effects of Requirements Volatility on Software Development Projects. Ph.D. Thesis, Arizona State University, Tempe, AZ, USA, 2002. [Google Scholar]
- Hosseinichimeh, N.; Rahmandad, H.; Jalali, M.S.; Wittenborn, A.K. Estimating the parameters of system dynamics models using indirect inference. Syst. Dyn. Rev. 2016, 32, 156–180. [Google Scholar] [CrossRef]
- Cardiac Rehabilitation. Available online: https://www.mayoclinic.org/tests-procedures/cardiac-rehabilitation/about/pac-20385192 (accessed on 24 May 2022).
- What to Expect: Follow Up Care After a Heart Attack. Available online: https://share.upmc.com/2019/07/follow-up-after-heart-attack/ (accessed on 24 May 2022).
- Kim, S.C.; Yoon, D.; Han, E.K. Antecedents of mobile app usage among smartphone users. J. Mark. Commun. 2016, 22, 653–670. [Google Scholar] [CrossRef]
- Andrawis, J.P.; Muzykewicz, D.A.; Franko, O.I. Mobile device trends in orthopedic surgery: Rapid change and future implications. Orthopedics 2016, 39, e51–e56. [Google Scholar] [CrossRef] [Green Version]
- Forrester, J.W.; Senge, P.M. Tests for building confidence in system dynamics models. Syst. Dyn. TIMS Stud. Manag. Sci. 1980, 14, 209–228. [Google Scholar]
- Richardson, G.P.; Pugh, A.I., III. Introduction to System Dynamics Modeling with DYNAMO; Productivity Press Inc.: New York, NY, USA, 1981. [Google Scholar]
- Barlas, Y. Formal aspects of model validity and validation in system dynamics. Syst. Dyn. Rev. J. Syst. Dyn. Soc. 1996, 12, 183–210. [Google Scholar] [CrossRef]


| SCOR Attributes | Definition | Causal Model Metrics/Factors |
|---|---|---|
| Reliability | The ability to perform tasks as expected. Reliability focuses on the predictability of the outcome of the process. Reliability is a customer-focused attribute. | Patient satisfaction, bandwidth capacity, cloud connectivity, patient well-being, patient retention rate |
| Responsiveness | The speed at which the tasks are performed. Responsiveness is a customer-focused attribute. | Performance, response time, ease of use |
| Agility | The ability to respond to external influence and the ability to change, for example, increase or decrease in demand, and cybersecurity threats. Agility is a customer-focused attribute. | Data security and privacy, eye data acquisition feasibility |
| Cost | The cost of operating the process. It includes engineering costs and software/app costs. Cost is an internally focused attribute. | Eye status monitoring, app cost |
| Asset Management | Captures the ability to efficiently utilize assets. This is an internally focused attribute. | Eye analysis algorithm and software management competence, licensing |
Publisher’s Note: MDPI stays neutral with regard to jurisdictional claims in published maps and institutional affiliations. |
© 2022 by the authors. Licensee MDPI, Basel, Switzerland. This article is an open access article distributed under the terms and conditions of the Creative Commons Attribution (CC BY) license (https://creativecommons.org/licenses/by/4.0/).
Share and Cite
Pourreza, S.; Faezipour, M.; Faezipour, M. Eye-SCOR: A Supply Chain Operations Reference-Based Framework for Smart Eye Status Monitoring Using System Dynamics Modeling. Sustainability 2022, 14, 8876. https://doi.org/10.3390/su14148876
Pourreza S, Faezipour M, Faezipour M. Eye-SCOR: A Supply Chain Operations Reference-Based Framework for Smart Eye Status Monitoring Using System Dynamics Modeling. Sustainability. 2022; 14(14):8876. https://doi.org/10.3390/su14148876
Chicago/Turabian StylePourreza, Saba, Misagh Faezipour, and Miad Faezipour. 2022. "Eye-SCOR: A Supply Chain Operations Reference-Based Framework for Smart Eye Status Monitoring Using System Dynamics Modeling" Sustainability 14, no. 14: 8876. https://doi.org/10.3390/su14148876
APA StylePourreza, S., Faezipour, M., & Faezipour, M. (2022). Eye-SCOR: A Supply Chain Operations Reference-Based Framework for Smart Eye Status Monitoring Using System Dynamics Modeling. Sustainability, 14(14), 8876. https://doi.org/10.3390/su14148876