Article

Food Culture and Sustainable Development: Evidence from Firm-Level Sustainable Total Factor Productivity in China

1
School of Business, Renmin University of China, Beijing 100872, China
2
School of Resource and Environmental Sciences, Wuhan University, Wuhan 430079, China
*
Author to whom correspondence should be addressed.
Sustainability 2022, 14(14), 8835; https://doi.org/10.3390/su14148835
Submission received: 20 June 2022 / Revised: 12 July 2022 / Accepted: 17 July 2022 / Published: 19 July 2022
(This article belongs to the Special Issue Sustainability in Enterprise Productivity and Innovation)

Abstract

:
This article studied whether food culture plays an important role in affecting the firm-level sustainable development. We linked firm-level sustainable total factor productivity to spicy-taste related food culture in China and found that firms in regions in which spicy culture plays a more prominent role showed higher sustainable productivity. Tests using the regional sunshine as an instrument suggested a causal interpretation. Moreover, firms more exposed to spicy culture showed more frequent equity incentive behavior, higher equity incentive intensity, and higher proportion of female executives, which suggests that the more proactive management behavior can be led by regional spicy culture. We also found that, compared with small-size firms, non-state-owned firms, and non-export firms, regional spicy culture has a stronger impact on large firms, state-owned firms, and export firms. Our results reveal the impact of food culture on the firm-level sustainable development.

1. Introduction

Since the introduction of cultural factors into finance, the idea that regional culture affects modern economic development and the governance behavior, strategic development, and operational strategies of micro firms has been supported by a large body of literature [1,2,3,4]. Although research has shown that culture can influence many aspects of the economy, the study of food culture on firm-level sustainable development has never been addressed. As a necessary and most frequent practice in our daily lives, food has always played an important role in the development of human society and human–earth interactions. Activities around food production have almost constructed the whole content of social sustainable development, which can be seen from the names of “hunting age” and “farming age” in the early human history. With the progress of civilization and the abundance of food, diet has been endowed with a rich cultural connotation. Eating behavior, including what to eat, how to eat, where to eat, when to eat, and with whom to eat, etc., has become an important part of human society. Food provides energy for people to maintain sustainable physiological activities, and forms unique food culture across regions. This culture, in the form of dietary attitudes and concepts etc., imprints regional features on people, becoming an indispensable part of individual identity [5,6,7]. Therefore, can differences in food culture between regions explain the heterogeneity in firm-level sustainable development? In the context of sustainable development, the issue of “culture and sustainability” has attracted increasing attention [1,8,9,10].
This paper aimed to fill this research gap by investigating the impact of food culture—i.e., social norms involving dietary taste—on sustainable total factor productivity. As an important issue and strategic goal, sustainable development can promote the stable and healthy development of the national economy, which is a kind of development with equal opportunities and benefits, aiming to promote economic development and condition and to improve the quality of human life [11]. Since 2020, the COVID-19 pandemic has brought a huge negative impact on the global economy; in this context, sustainable development is crucial for the survival of firms. At the firm level, sustainable development has become more important for firms to go beyond short-term profitability, and towards economic, environmental, and social sustainability [12]. At present, firms are striving to secure core competencies for maximizing firm value through sustainable growth [13]. Therefore, we tried to explore how culture, an important informal institution, affects the sustainable development of firms.
We chose China as the research scenario because China is a country with a rich and diverse natural and geographical environment, which has resulted in social development trajectories and cultural traits with regional characteristics, making it an ideal research scenario for culture and sustainable development [3]. The rich natural demographic features and ethnic customs have contributed to the very different styles of food culture in different regions of China, and China is internationally renowned for its unique food culture, which attracts many foreign travelers [14]. One of the most important criteria for distinguishing factions is the taste of the food, of which “spicy” is often seen as the most important feature in distinguishing different cuisines. The regional spicy culture has played an important role in the development and evolution of food culture and has further marked social change and regional economic sustainable development with a distinctive food culture imprint [5,15]. With this in mind, we focused on how regional spicy culture, which represents food culture, influences business sustainability.
We focused on firm-level total factor productivity, which is a comprehensive indicator for evaluating the efficiency of firm development and is widely used in studies to assess the sustainable development of firms [16,17,18,19,20]. Our sample contains A-share listed firms in China. We constructed quantitative values of “spicy” through web crawler and text analysis, and we found that firms in regions in which spicy culture plays a more prominent role showed higher sustainable total factor productivity. Heterogeneity analysis showed that large firms, state-owned firms, and firms with export operations are more significantly influenced by regional spicy culture. The mechanism analysis showed that regional spicy culture can enhance the sustainable productivity by promoting proactive management behavior. The empirical results remained robust when we used alternative indicators, double-fixed effects, and replacement clustering robust standard errors. In addition, we addressed potential endogeneity and validated the causal relationship between regional spicy culture and sustainable productivity by using regional sunshine as an instrumental variable.
Our study may contribute to the emerging literature on cultural finance and sustainability, where current research perspectives on culture and sustainable finance focus on the implications of language, religion, and gambling [2,3,21,22,23]. This paper used web crawlers and textual analysis to construct a regional spicy culture index and then investigated its impact on the sustainable total factor productivity. To the best of our knowledge, we are the first to report a prevailing impact of food culture on corporate finance. Our unique contribution is demonstrating that food culture is a fundamental factor in explaining sustainable development. Moreover, our paper reinforces the micro foundations about the impact of culture on the firm-level sustainable total factor productivity. While current scholarship on total factor productivity pays more attention on the macroeconomic level, this paper examined the factors influencing sustainable productivity from a micro perspective based on culture, making it the first study to directly analyze the relationship between food culture and sustainable productivity. Again, this paper examined the underlying mechanism of regional spicy culture in affecting firms and empirically verified the positive governance of firms is an influencing channel, providing a plausible explanation for food culture. In addition, we extended and deepened the research related to informal institution and firm development. Our study explored how culture as an informal institution contributes to firm development in different regions from the perspective of food culture, which helps academics and practitioners analyze the informal institutional reasons behind firm development from a new perspective and provides a new perspective for the formulation of regional economic development policies. Finally, our article extended the research on health economics. Current health economics research focuses on the interaction between human health behavior and economics, and studies have confirmed the impact of health behavior on health and macroeconomics [24,25] as well as the impact of economic policies on human health [26,27]. We further prove the impact of food culture closely related to health on corporate finance.
The rest of this paper is organized as follows. Section 2 presents the theoretical analysis and research hypotheses. Section 3 introduces the data sources, processing, and main variables. Section 4 reports empirical results, including the relationship between food culture and sustainable productivity, potential endogeneity issue, and robustness tests. Section 5 discusses the mechanism analysis and heterogeneity analysis. Section 6 reports the conclusion and contribution.

2. Theoretical Analysis and Research Hypothesis

According to institutional economics theory, on the one hand, firm behavior is constrained and limited by formal institutions; on the other hand, it is also influenced implicitly by informal institutions such as culture and religion [28]. In traditional Chinese culture, which is characterized by Confucianism and a strong clan culture, formal institutions such as laws and regulations are less strongly held in the minds of the Chinese people than in Western countries. In contrast, informal institutions are more socially accepted and have a strong binding effect on corporate behavior, complementing formal institutions [29]. Different regions have different cultural antecedents that are deeply rooted in individuals and groups, fundamentally altering individual preferences and attitudes as well as resulting in significant differences in behavioral decisions [30]. Regional culture as an informal institution plays an important role in the cognitive and behavioral development of economic agents, and has been shown to homogeneously influence the management of local firms and further map onto the business management of firms [1,2,3]. Thus, food culture as an explicit regional culture may play an extremely important role in corporate decisions.
Modern cuisines regard taste as an important criterion for differentiation, and regional differences in food culture are still evident, especially in terms of the “spicy” taste of the food, which has led to the formation of a distinctive regional spicy culture. Regional spicy cultures has played a significant role in the development and evolution of food culture and has further marked social change and regional economic development with a distinctive food culture imprint [15,31].
Regional spicy culture may significantly influence corporate behavior; on the one hand, regional spicy culture represents a positive, enthusiastic, proactive, and aggressive spirit [31], which also tends to develop more reward-sensitive personality traits with a greater sense of accomplishment after achieving results [32,33,34]. This implies that the mapping of regional spicy culture at the firm level may facilitate active management and increase the sense of achievement of executives who have been successful through active and proactive management, thus creating a virtuous circle that contributes to corporate sustainable development.
On the other hand, capsaicin can biologically enhance the body’s energy expenditure (for example, energy expenditure is significantly increased 10 kcal over 270 min on average after capsaicin diet) [35,36], resulting in the promotion of negative energy balance and fat oxidation (for example, respiratory quotient is significantly decreased 0.15 over 270 min on average after capsaicin consumption) [35,36], body temperature increase (for example, core body temperature is increased 0.02 °C on average after capsaicin consumption) [35,36], and peripheral and central fatigue reduction. The physiological mechanism of capsaicin is regulating tissue glycogen utilization and increasing plasma adrenaline concentration, enhancing the body’s excitement and positive emotion [35,36,37]. Thus, in areas with a strong spicy culture, individuals themselves may be more likely to develop proactive and positive personality traits, which may further be reflected in positive management behaviors of corporate management and positive work attitudes of employees.
From a psychological perspective, the theory of benign self-mutilation can be used to explain the euphoria associated with spicy food. Benign self-mutilation refers to the individual’s feeling of negative experiences that the body or brain incorrectly interprets as threatening. The difference in cognitive and physical responses leads to pleasurable euphoria once the individual realizes that the real danger does not exist [37,38]. From the perspective of benign self-mutilation, the burning sensation caused by spicy food guides the body to falsely report danger and react defensively (e.g., sweating, tears). However, the individual realizes there is no danger, resulting in the burning, sweating, and tears caused by spicy food, which transform into a stimulating pleasure and develop more positive and aggressive emotions.
Overall, we infer that firms more affected by regional spicy culture are more likely to show proactive management, resulting in the promotion of sustainable productivity. Thus, we have:
Hypothesis 1.
Regional spicy culture can enhance proactive management behavior to promote firm-level sustainable productivity.

3. Data and Variable Construction

3.1. Data Sources

We collected data from multiple sources. First, we obtained recipe data in August 2017 from the “Meishijie” website (http://www.meishij.net/, accessed on 15 August 2017). “Meishijie” divides Chinese cuisines into 20 sub categories according to their origins, including “Xiang” cuisine, “Hui” cuisine, “Hubei” cuisine, and so on. The information of excipients and condiments in the menu of each dish (for example, the excipients and condiments used in Xiang cuisine “home cooked Steamed Chicken with Chili Sauce” include onions, ginger, garlic, sesame, peanuts, prickly ash, cooking wine, chicken soup, salt, chicken powder, sugar, balsamic vinegar, chili oil, etc.) was used as the main data source for extracting dietary tastes [15]. More specifically, we obtained the recipe information of the 20 cuisines on “Meishijie” by web crawling. Considering that there is no unified measurement for the use of ingredients in recipes provided by “Meishijie”, we quantified the spicy taste of dishes by text analysis according to the frequency of auxiliary ingredients and seasonings in recipes. Specifically, we used text analysis to distinguish whether each ingredient of the dish can correspond to the spicy flavor. For example, “chili oil” was labeled as “spicy” while “salt” was not labeled as “spicy”. Through summarizing all the dishes of each cuisine and taking the average of spicy taste’s frequency of use in every dish, spicy taste quantitative index for each cuisine could be obtained.
The number of recipes and spicy value of 20 cuisines are shown in Table 1. By comparing the spicy value in the 20 categories of cuisine, our results showed that the usage of the spicy taste is the most frequent in “Chuan” cuisine, followed by “Yungui” cuisine and “Xiang” cuisine. These results are basically in line with people’s general perception.
Next, we collected restaurant data from Amap (
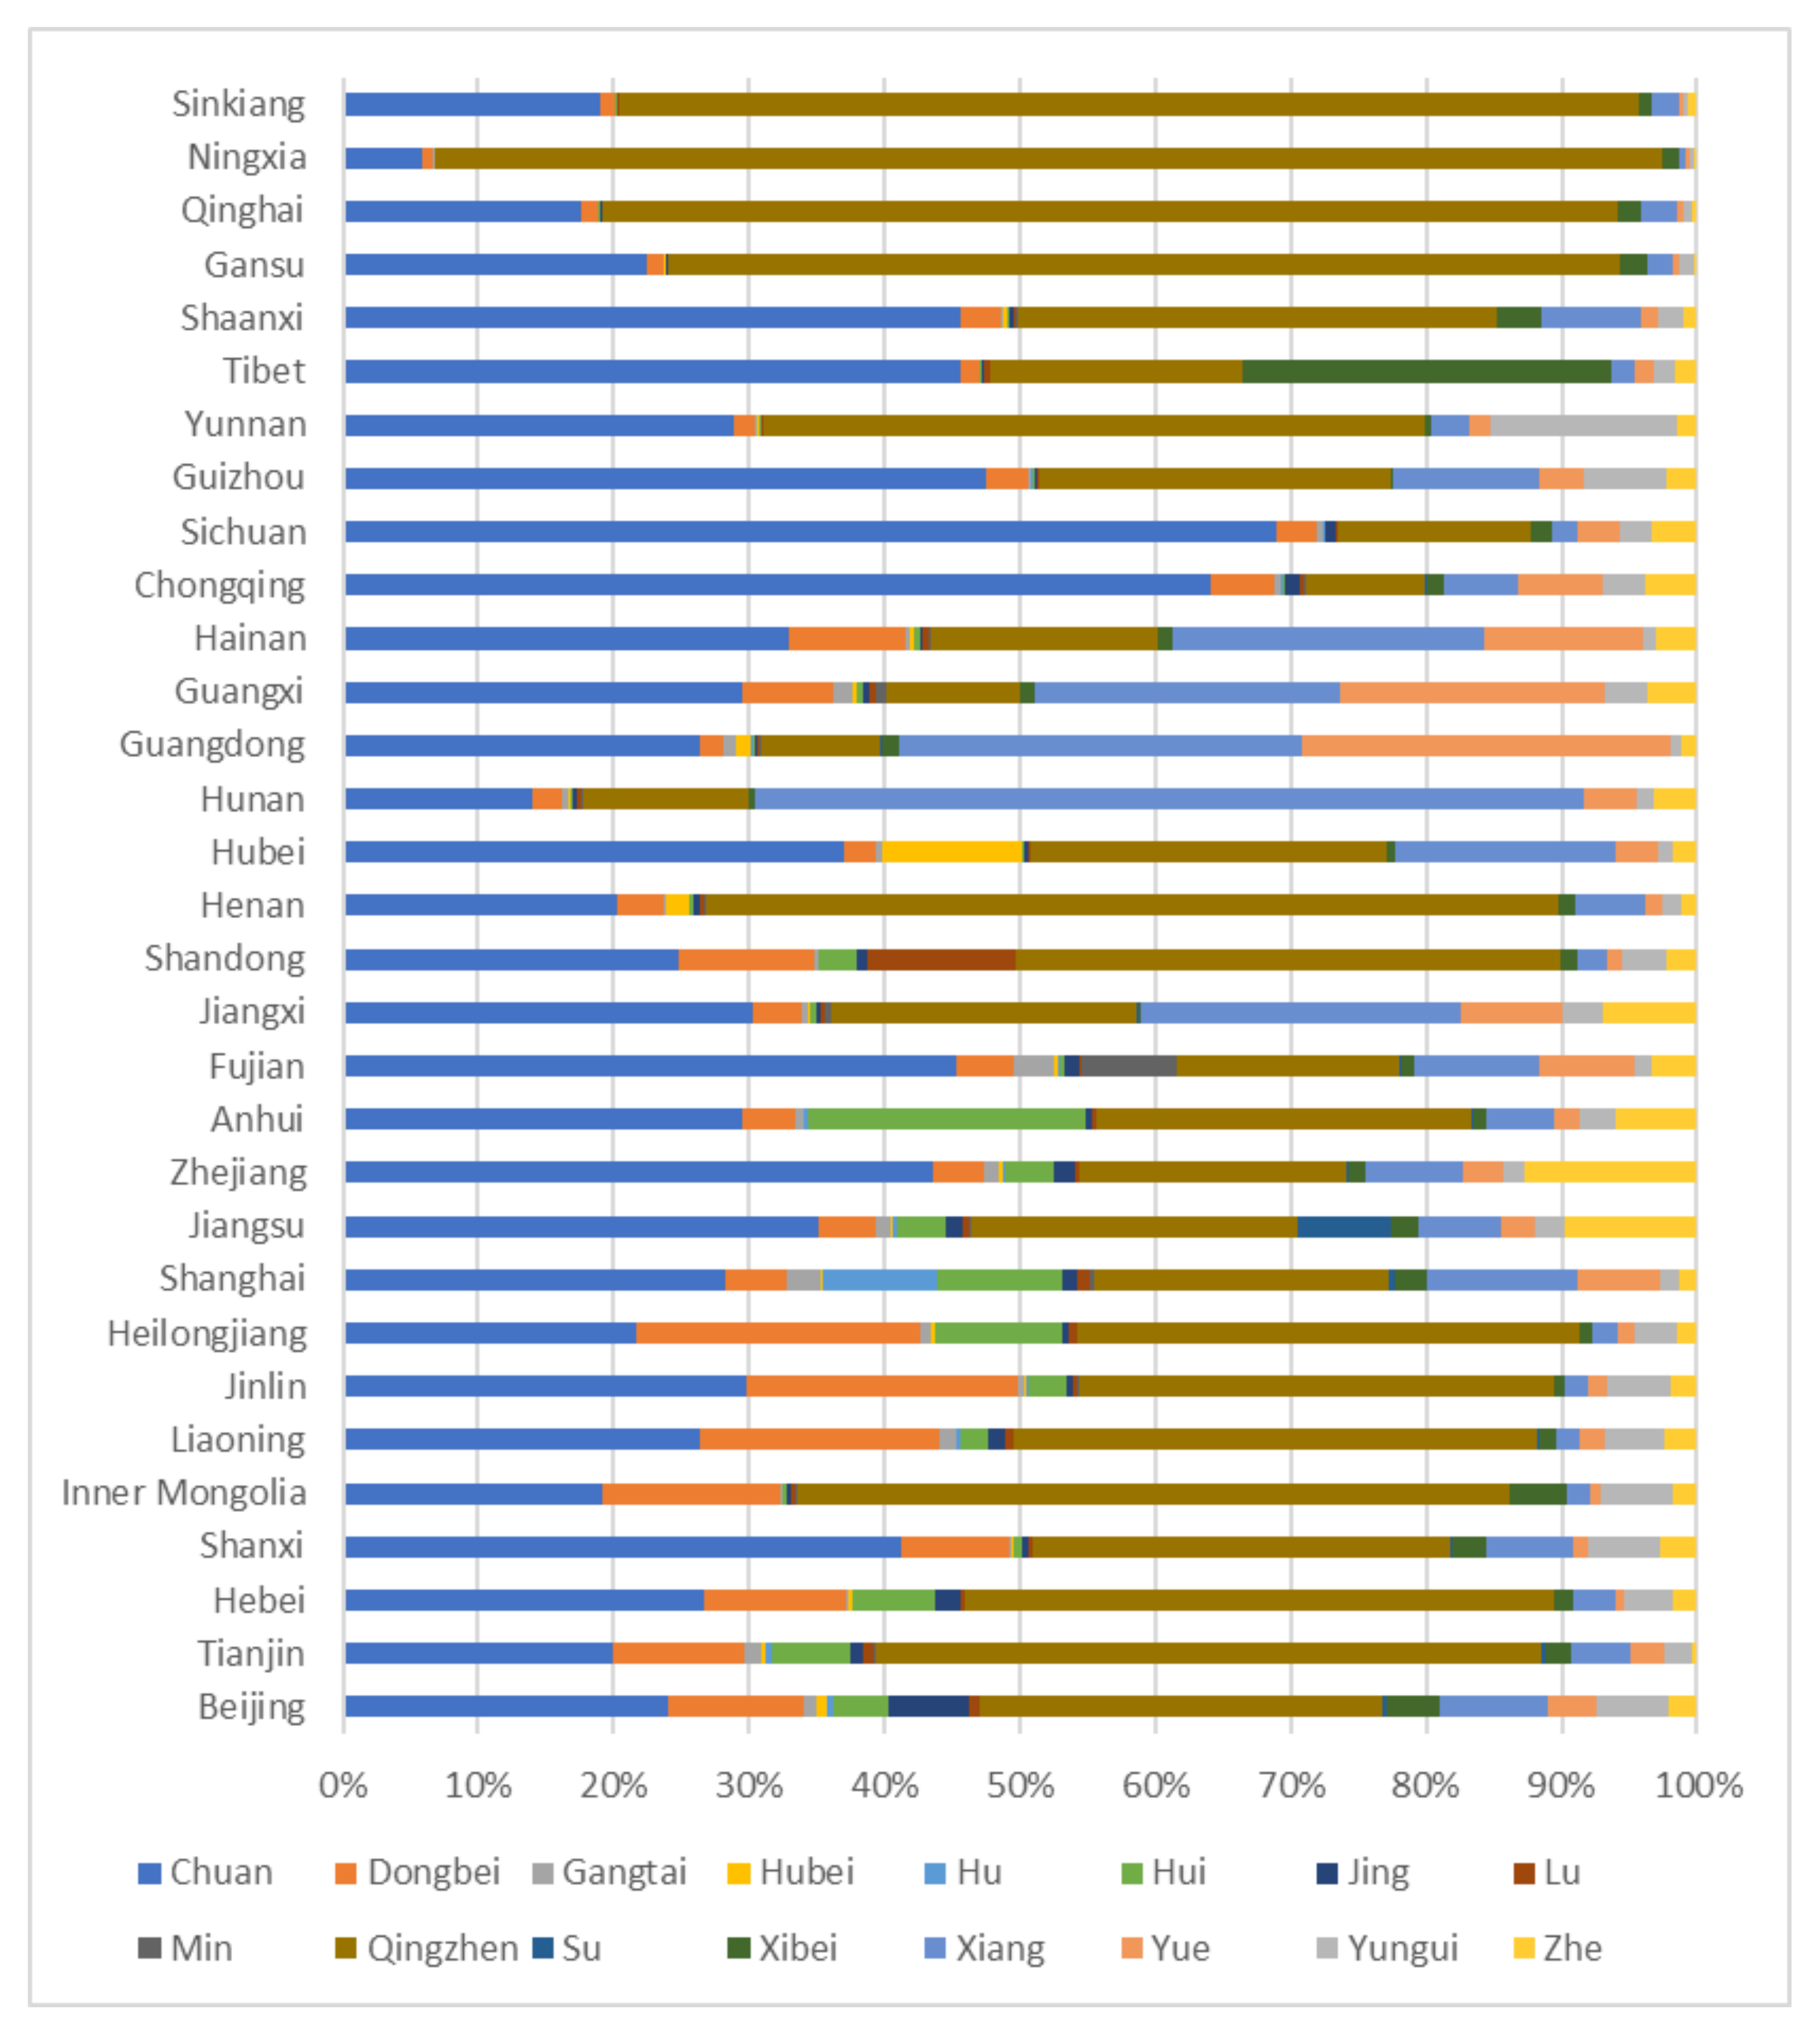
https://www.amap.com/, accessed on 15 August 2017), an electronic map website, in August 2017. We obtained data of more than 7 million restaurants in 31 provincial administrative regions in China, except Hong Kong, Macao, and Taiwan. Each piece of restaurant data may contain information of name, location, and cuisine. Such data were used to identify the proportion of each cuisine in each province. The 16 categories of cuisines used to classify restaurants all fell within the 20 categories of recipe data, and the data of restaurants corresponding to the 16 categories of cuisine common to both types of data were used to extract regional tastes. A total of 385,493 valid restaurants corresponding to the 16 categories of cuisines were distributed, as shown in Figure 1, with Guangdong Province having the highest number of valid restaurants (63,411) and Chongqing the lowest (2442). The proportions of the restaurants of our 16 cuisines to the total valid restaurants in each provincial region were calculated, and the spicy taste indexes of each provincial region were calculated according to the spicy taste value of each cuisine. Taking the spicy index in Anhui Province as an example, we first calculated the proportion of “Hui” cuisine restaurants in Anhui Province. We then multiplied this proportion by the spicy value of “Hui” cuisine (Table 1) as the contribution value of “Hui” cuisine to Anhui Province. We obtained the spicy index in Anhui Province by adding up the contribution value of 16 cuisines.
Based on the geographical origin of spicy culture, we collected data of sunshine hours from China Meteorological Administration for each provincial administrative region. We also obtained development-related indicators from China Statistical Yearbooks, such as GDP per capita, GDP growth, population growth, and consumption per capita.
Firm-level data were obtained from CSMAR and matched to regional information. The final examining period ranged from 2010 to 2019. We took A-share listed companies on Shanghai and Shenzhen Stock Exchange as samples. We then excluded ST and PT companies, as well as the financial industry and real estate industry. The final sample included 10,180 firm-year observations with 2127 firms in 31 Chinese provincial regions.

3.2. Main Variables

Our dependent variable (TFP_lp) was firm-level sustainable total factor productivity calculated by the LP semi-parametric method [18]. Alternate independent variable (TFP_op) was calculated based on the OP semi-parametric method [17].
The main proxy variable of regional spicy culture (Spicy_PC) related to food culture in this paper comes from the spicy culture index calculated by using recipe tastes and restaurant data mentioned above. 
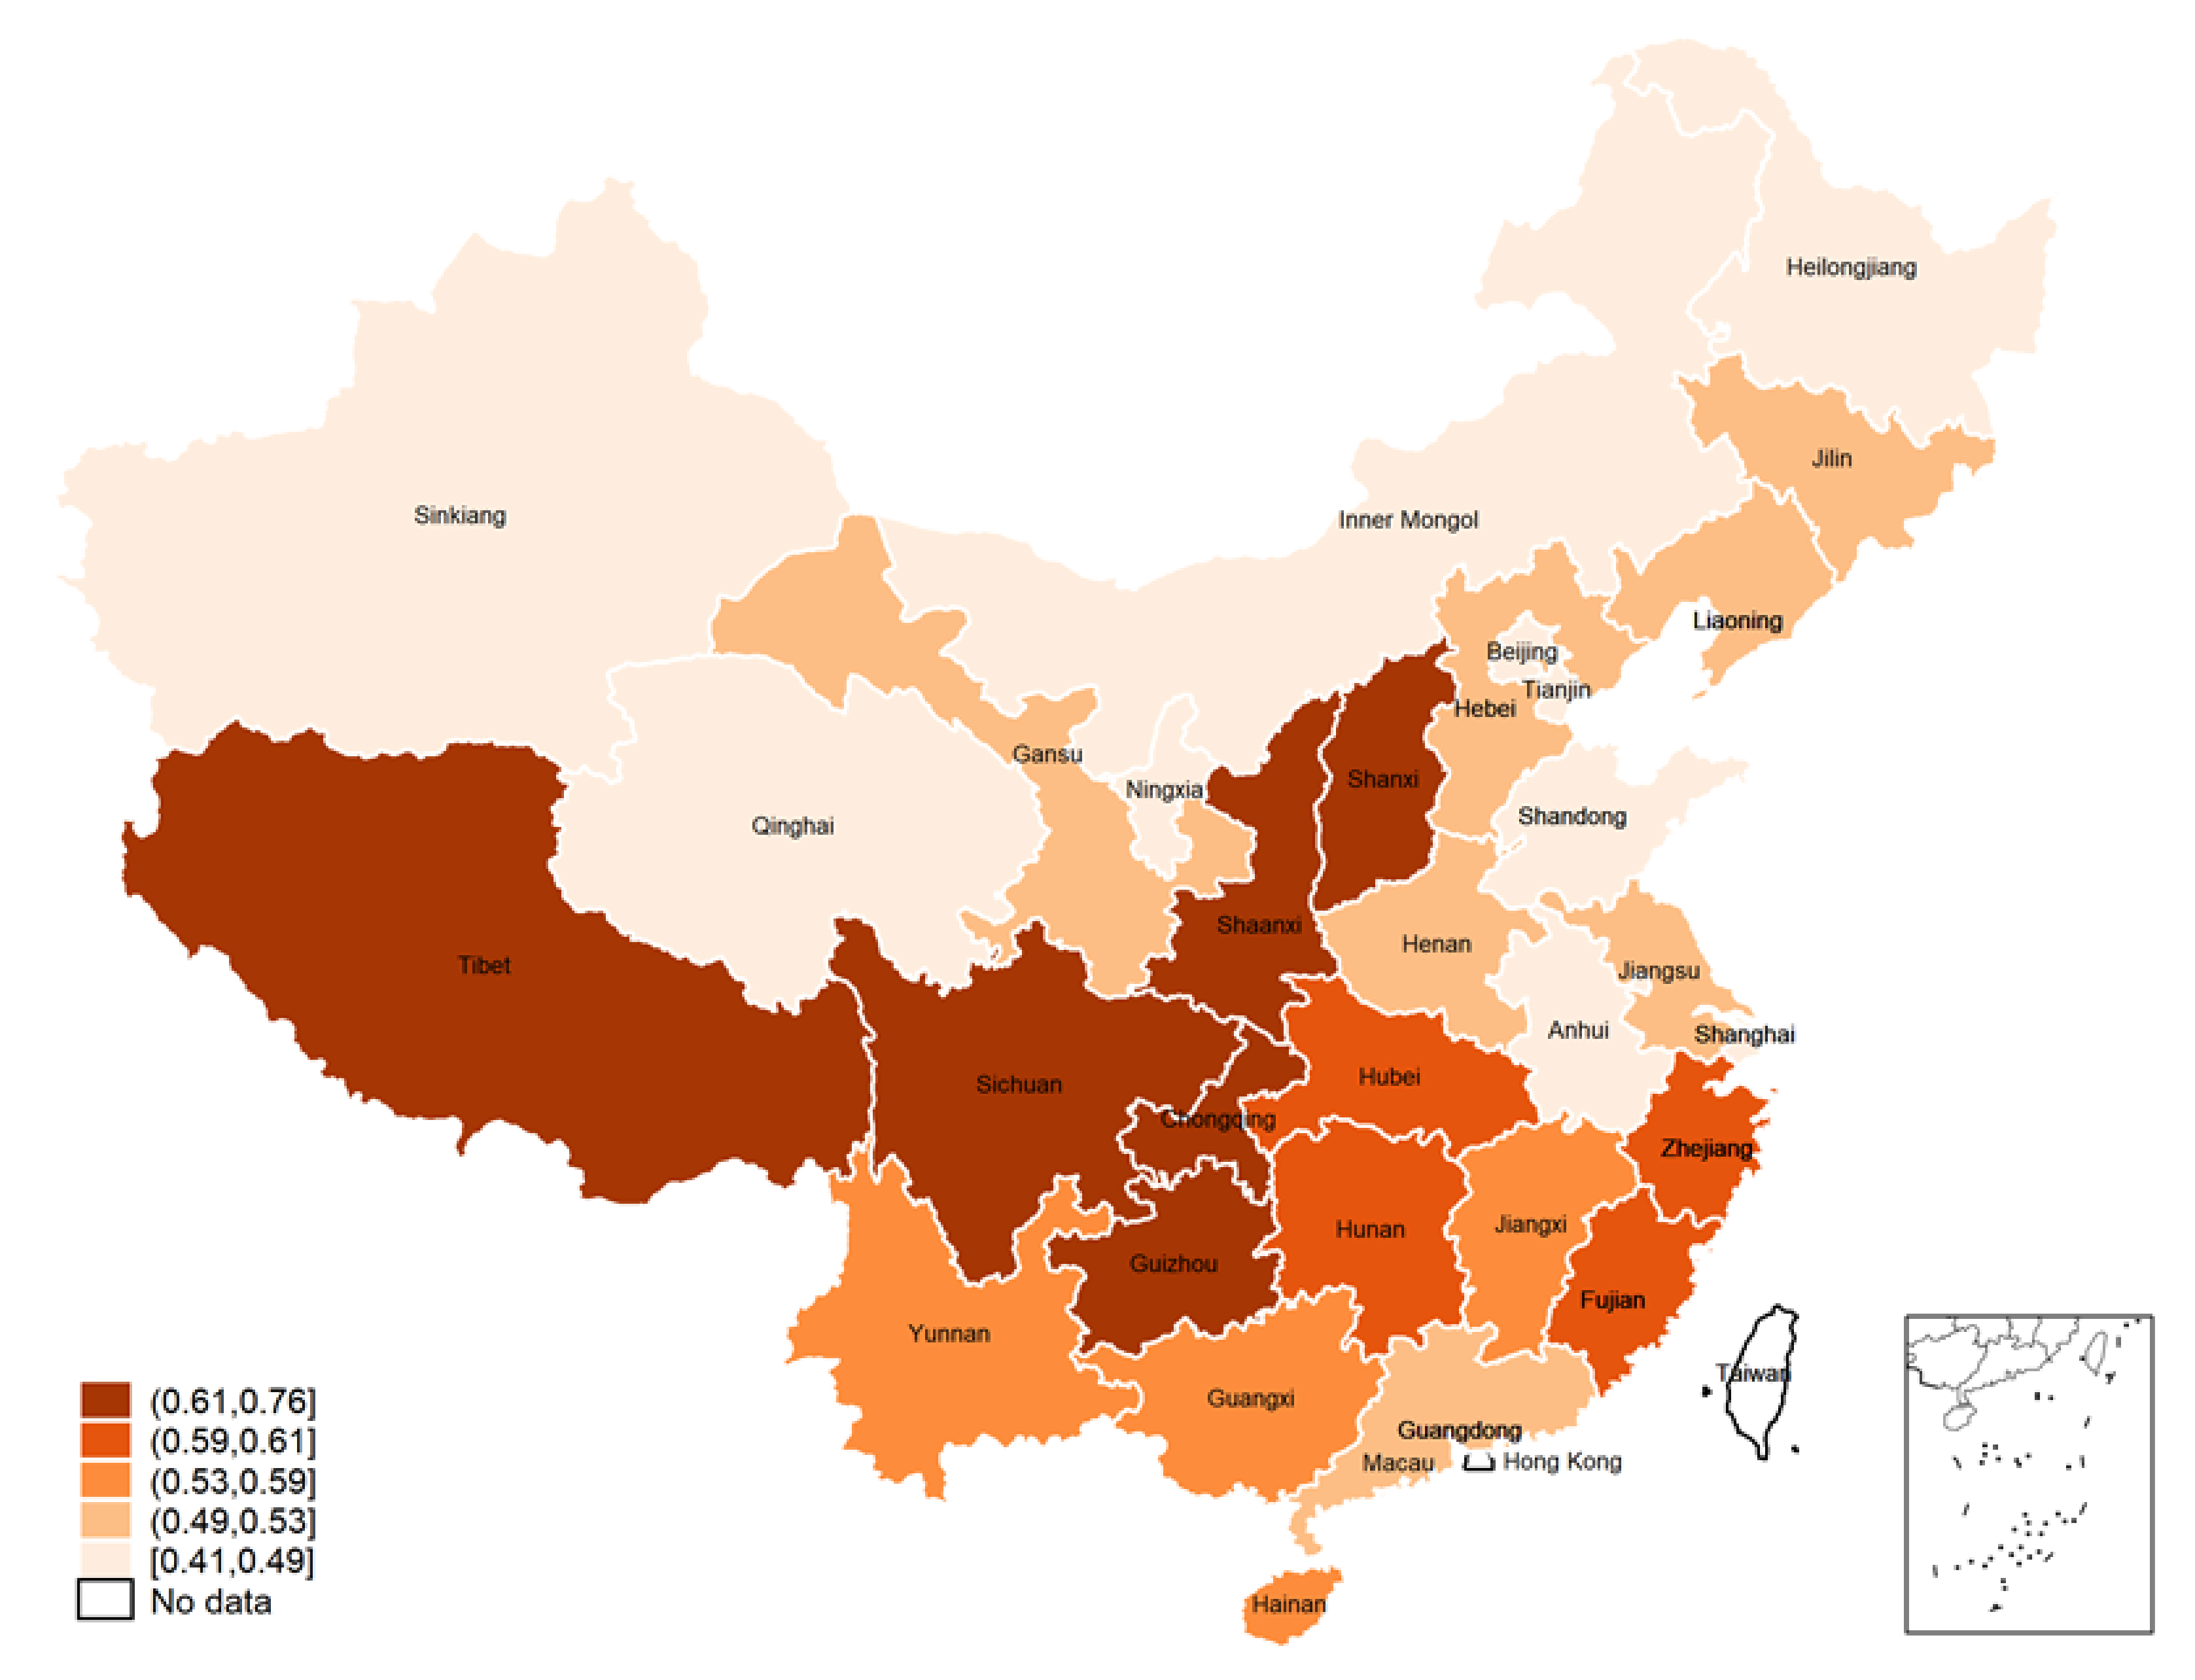
Figure 2 shows the regional spicy culture map based on Spicy_PC. Alternative variables for regional spicy culture were also constructed in this paper, aiming to capture the influence of spicy culture from the place of origin of the dish. Customers may have different perceptions of the same food business operating across locations [39]. Specifically, this paper considered that in regions with lighter tastes, even restaurants with a higher number of heavier taste cuisines, the presence of spicy flavors may be reduced by the influence of the overall local culinary environment, i.e., the tastes of the cuisine of the region where the cuisine originated may dominate locally. Therefore, this paper used the spicy taste index of locally originated cuisines as a proxy variable for local spicy culture (Spicy_diet), and the proxy variable provides a reasonable robustness test for the main results.
Firm-level control variables include the logarithm of the firm size (Size), leverage (Lev), return on assets (ROA), book-to-market ratio (BM), analyst attention (Attention), annual stock return (RET), turnover ratio (Turnover), shareholding ratio of the largest shareholder (Top_1), shareholding ratio of top ten shareholders (Top_10), board size (Boardsize), proportion of independent directors (Indeboard), the logarithm of management compensation (Lncom), separation rate of management right and ownership (Separation), dual role for the board chairman (CO_CEO), and a dummy variable of state-owned enterprises (SOE).
Region-level control variables contain GDP per capita (GDP_per), the logarithm of consumption per capita (Consume_per), GDP growth rate (GDP_growth), and population growth (POP_Growth). We winsorized all continuous variables at the 1% level to avoid extreme values (our results are robust to this threshold).
Table 2 shows the summary statistical data of our sample, and lists the distribution of main variables. On average, the regional spicy culture index (Spicy_PC) was 0.541 and the standard deviation was 6.54%, indicating that there are significant differences among regions. In fact, regions in the 75th percentile (0.586) had a 19.35% higher spicy culture index than regions in the 25th percentile (0.491), and Figure 2 shows a map of regional spicy culture in different provincial administrative regions in China. Similarly, the mean value of the spicy culture index (Spicy_diet) based on cuisine origin was 0.206 with a standard deviation of 0.217. The distribution of this variable suggests that the geographical distribution of spicy culture measured by cuisine origin is not uniform in China and provides side evidence that China can be a good scenario for studying regional spicy culture, with significant differences in the spicy culture index at the provincial level of the country.
In addition, the main dependent variable (TFP_lp) showed significant cross-sectional variation (the standard deviation was 0.998). The sustainable productivity located in the 75th percentile of the distribution (8.697) was 17.15 percent higher than that of firms located in the 25th percentile of the distribution (7.424), indicating significant differences in total factor productivity between firms.

4. Results

4.1. Baseline Regression

We examine the relationship between regional spicy culture and sustainable total factor productivity in this section. We mainly rely on the following regression as a baseline model:
T F P _ l p i , p , t = α + β S p i c y P C p , t + γ C o n t r o l i , p , t 1 + ϵ i , p , t
where, T F P _ l p i , p , t is the total factor productivity calculated based on LP semi-parametric method of firm i located in Province p in year t , and S p i c y _ P C p , t is the spicy culture index calculated by using recipe taste and restaurant data in province p. Because the calculated spicy culture index is a provincial level datum that does not change over time, there is no need to lag. C o n t r o l i , p , t 1 are the control variables with a lag of one year. We also controlled the firm and year fixed effects to further solve the endogenous problem, and we used the double-clustering robust standard errors at the firm and year levels.
The results are shown in Table 3. Column (1) provides the main regression results of all firms, and column (3) further controls the regional development indicators, including per-capita GDP (GDP_per), GDP growth (GDP_growth), population growth (Pop_growth), and logarithm of per-capita consumption (Consume_per). We can clearly see a positive correlation between regional spicy culture and sustainable productivity. For example, in column (4), a one-standard-deviation increase in spicy culture is associated with 9.53% standard deviation more of total factor productivity.
Columns (2) and (4) investigate the relationship between spicy culture and sustainable total factor productivity by using Spicy_diet, indicating our result does not change. In fact, by using the origin of spicy culture, the economic scale is even higher. For example, in column (4), a one-standard-deviation increase in spicy culture is associated with 11.38% greater standard deviation of total factor productivity. Overall, our results suggest regional spicy culture will improve the sustainable productivity.

4.2. Endogenous Treatment: Instrumental Variable Method

Although this paper explicitly controlled for many variables in the main regression, there are still possible problems of endogeneity and spurious correlations. To solve these issues, an instrumental variable (IV) approach based on geographical “shock” was used. It has been shown that social capital can be affected by geographical/climatic conditions [40,41]. Intake of spicy food is associated with removing dampness and strengthening the spleen, making it easier for dampness to escape, and the formation of a regional spicy culture is associated with at least two natural factors, one being the number of hours of sunshine and the other being air humidity and winter temperature [32,33,34]. The findings suggest that low sunshine counts and wet and cold winters are the main environmental factors shaping regional spicy cultures and that differences in winter sunshine hours can often lead to differences in wet and cold winters across different regions [42].
Therefore, this paper argues that sunshine hours, as an important geographical “shock”, can significantly affect the formation of spicy culture without directly affecting business activity. Specifically, our article used the annual sunshine hours in each province as an instrumental variable and uses the winter sunshine hours in each province as a robustness check, given that the weather in winter (astronomy divides winter into January, February, and December) is likely to be the coldest and wettest time of the year.
This paper expects sunshine hours as an instrumental variable unrelated to firm-level sustainable total factor productivity, as sunshine hours are purely a geographical “shock”. Therefore, the instrumental variable in this paper can be introduced as an exogenous natural geographical variation in the sustainable productivity. In other words, sunshine is a reasonable instrument because it satisfies both the inclusion and exclusion restrictions [43].
Based on the instrumental variable of sunshine hours, this paper used the two-stage least squares method:
S p i c y _ P C p , t = a + b × I V p , t + r × C o n t r o l i , p , t 1 + δ p , t
T F P _ l p i , p , t = α + β S p i c y _ P C ^ p , t + γ C o n t r o l i , p , t 1 + ϵ i , p , t
where, I V p , t is the instrumental variable of the first stage regression, s p i c y _ p c ^ p , t is the predicted value of spicy culture obtained by the first stage regression, and the other variables are as described above.
The results of IV regression are shown in Table 4. First, this paper used regional annual sunshine hours (Sunshine) as the main instrumental variable, and reports the results of the first and second stages in columns (1) and (2) respectively. Our results showed less sunshine hours significantly strengthen spicy culture in the first stage, and in the second stage, instrumented spicy culture significantly promotes sustainable total factor productivity. We further conducted a series of examinations to check the effectiveness of IV regression. More specifically, our paper used Kleibergen–Paap rk LM statistics to test whether IV (Sunshine) is related to the independent variable (Spicy_PC). As we can see from Table 4, two F-tests all confirmed that Sunshine is not a weak instrumental variable.
In columns (3) to (4), we used the sunshine hours in winter (Sunshine_win) to test the robustness of IV regression. Specifically, total sunshine hours in January, February, and December each year were used to identify robustness. The results are similar to the above, and the F-tests showed that Sunshine_win is effective. Combined with the results of columns (1) and (2), our results support the causal relationship between regional spicy culture and sustainable total factor productivity.
We further applied our instrumental variables (Sunshine and Sunshine_win) to the alternative independent variable (Spicy_diet) in Table 5. Our results are similar to the above and further confirmed the geographical origins of spicy culture.
Overall, the analysis in this section supports the causal explanation of the relationship between regional spicy culture and sustainable total factor productivity. This causal explanation can be applied not only to the main relationship between regional spicy culture and sustainable total factor productivity in this paper, but can also be extended to proxy variables for regional spicy culture. Taken together, these results from the previous section suggest that regional spicy culture may play an important role in influencing sustainable productivity.

4.3. Robustness Test: Substitution of Dependent Variable

We further calculated the total factor productivity (TFP_op) of China’s listed firms by using the OP semi-parametric method so as to replace the dependent variable TFP_lp as robustness test [17]. We took the above two spicy culture indexes as the main proxy variables of regional spicy culture. In Table 6, columns (1) and (2) control firm characteristics, while columns (3) and (4) further control regional characteristics. Across all these different specifications, this paper found that the relationship between regional spicy culture and sustainable total factor productivity remained very positive. Overall, these results suggested that there is a fairly general relationship between regional spicy culture and sustainable total factor productivity, and the main regression results in this paper are robust.

4.4. Robustness Test: Changing Clustering Mode

Previously, we used the robust standard errors of double clustering at the firm and year levels. To further verify the robustness of our findings, the regression results in this section were verified as robust to the use of double-clustering robust standard errors at the firm and year levels (Table 7), province and year (Table 8).

5. Further Analysis

5.1. Mechanism

In the previous study, we demonstrated the impact of regional spicy culture on sustainable development. We now examine the mechanisms of the impact of spicy culture. In China, regional spicy culture may significantly influence firm behavior. On the one hand, spicy culture represents a positive, enthusiastic, and proactive spirit [31] and tends to foster the development of personality traits that are more sensitive to rewards, as well as a greater sense of achievement after achieving results [32,33,34]. This also implies that regional spicy culture mapping on firms may lead to more positive management behaviors and increase the sense of accomplishment executives receive when positive management is successful. It is theorized that firms that are more influenced by spicy culture are more likely to exhibit proactive management and thus contribute to the firm-level sustainable total factor productivity (proactive management hypothesis).
We examine the proactive management hypothesis from two perspectives: one is equity incentives, and the other is executive gender ratio. Equity incentives, as an important form of agent incentive, bind the personal income of executives with the long-term business performance of firms, making it possible for executives to maximize interests of shareholders, resulting in realizing the high-quality development of firms [44,45,46]. Thus, this hypothesis suggests more equity incentive behavior in firms exposed to stronger spicy culture. We then verified our proactive management hypothesis by conducting a series of empirical examinations. More specifically, we set a dummy variable Option as equal to 1 for firms with equity incentive behavior, and otherwise 0. In addition, we used the amount of shares held by executives to define the intensity of equity incentive (option). We then examined the mechanism of equity incentive by using two-stage least squares method [47]. Our two mediators (Option and option) regressed spicy culture (Spicy_PC) in the first stage respectively, and their predicted values were obtained. Furthermore, on the second stage, we used our dependent variable (TFP_lp) to regress the predicted value of mediators. The empirical results of the mechanism test are shown in Table 9.
Our results of the equity incentive mechanism are shown in Columns (1)–(4) in Table 9. Equity incentive behavior (Option) was set as a mediator in columns (1) and (2). Our results suggest, in column (1), firms are more tend to conduct equity incentive in regions with stronger spicy culture. We can see a significantly positive correlation between Option fitted by spicy culture and sustainable total factor productivity in column (2). We obtained similar results in columns (3) and (4), setting equity incentive intensity (option) as a mediator. These results suggest a mechanism of proactive management, specifically in that spicy culture has a positive impact on firm equity incentive behavior, resulting in promoting total factor productivity.
In addition to executive ownership, we further used executive gender ratio to test the proactive management hypothesis of this paper. Hillman and Cannella used resource dependence theory to explain the advantages of women executives on the board of directors [48]. First, gender diversity in the executive team is conducive to improve decision-making and corporate governance. Diverse teams are better informed and have a broader perspective than homogeneous teams. As a result, they are able to propose more alternative solutions to problems. Gender diversity in teams, on the other hand, facilitates team creativity, as gender differences in cognitive factors such as norms, attitudes, and beliefs align with the cognitive basis of executives’ decision-making processes. Second, women’s participation in the executive team enhances the legitimacy of firms. There is pressure from the external environment and society to increase the diversity of the executive team, and some institutional investors may even consider diversity as a requirement [49]. From this perspective, increasing the proportion of women on the executive team can help firms gain the support of the external environment and investors. Finally, the involvement of women executives can help companies gain external consumer support and greater commitment from internal employees. Women executives are better able to understand the psychology and behavior of women consumers, which helps firms to develop the right business strategies for this specific consumer group. For employees, the presence of women executives on the management team sends a positive signal to female employees that there is room for growth and advancement in the firm, thus reducing the cost of staff turnover. In addition, women managers have a less bureaucratic and more interactive management style. These characteristics are conducive to team building, employee motivation, and team creativity [49]. This is consistent with the hypothesis of positive corporate management based on a spicy culture. In other words, the positive corporate management behavior brought about by spicy culture may also be reflected in the increase in the proportion of women executives in firms in regions with a strong spicy culture, which has a positive impact on the sustainable productivity.
As shown in columns (5) and (6) in Table 9, proportion of women executives (FR) was set as a mediator. Our results suggest, in column (5), firms tend to improve the proportion of women executives in regions with stronger spicy culture. We could see a significant positive correlation between FR fitted by spicy culture and sustainable productivity in column (6). Our results suggest that regional spicy culture contributes to total factor productivity through increasing women executive proportion of firms, reflecting proactive managerial behavior of firms. Overall, our mechanism analysis validates the proactive management hypothesis of spicy culture.
Spicy culture may also represent an aggressive spirit, leading firms to be more sensitive to R&D investment and more eager to seize R&D opportunities, thereby promoting firm-level sustainable total factor productivity, which is referred to as the aggressive R&D hypothesis. The technological innovation ability of firms is related to their own development and national technological competitiveness. To examine the aggressive R&D hypothesis, we now investigate whether spicy culture improve the R&D intensity and R&D output of firms. We used the ratio of R&D investment to firm size to define the firm R&D intensity (RD), and the number of patent authorizations to define firm R&D output (Patent). Our results are shown in columns (1) and (2) of Table 10. We could see no significant relationship between spicy culture and firm R&D, excluding the aggressive R&D hypothesis. In addition, regional spicy culture may increase the risk-taking spirit of firms, making firms more eager to undertake high-risk projects for better development (risk preference hypothesis). We used firm leverage (lev, LEV in the control variables is the lag term of lev) to define firm risk taking. We found no significant correlation between spicy culture and lev in column (3), excluding the risk preference hypothesis.

5.2. Heterogeneity Analysis

Different types of firms may be affected differently by regional spicy culture, and the costs of conducting corporate governance vary. This section explores the heterogeneity of the impact of regional spicy culture on sustainable total factor productivity from three perspectives: firm size, nature of state ownership, and whether they are exporters.
In China, state-owned firms are at the center of the economic system reform, and their role is reflected in the macro level promotion of the establishment and improvement of the socialist market economy system, ensuring the stable operation of economic development and enhancing the international competitiveness of the overall economy [50,51], providing the necessary conditions and strong support for economic development. With the support of Chinese government, state-owned firms have easier access to political resources and face less financing constraints, which provides the prerequisite for the proactive management of state-owned firms. In addition, state-owned firms undertake more requirements of government, resulting in more motivated to manage actively for better development. Based on proactive management hypothesis, we now investigate whether spicy culture has more impact on state-owned firms. The interaction term (Spicy_PC_SOE) of spicy culture (Spicy_PC) and state-owned dummy variable (SOE) were added to our baseline model. Our results are shown in columns (1) and (2) of Table 11, suggesting spicy culture has heterogeneous effects in state-owned firms (coefficient of Spicy_PC_SOE is positive at the significance level of 1%).
Large firms with better resource allocation and utilization ability may have greater financial foundations for proactive management. However, small firms have higher financing cost and lower financing efficiency, resulting in the lack of capacity for proactive management [52,53]. Based on these reasons, the proactive management hypothesis of spicy culture may be closely related to firm size. We set a dummy variable (Scale) equal to 1 for firms with sizes larger than the median, and otherwise 0. We added the interaction term (Spicy_PC_Scale) of spicy culture (Spicy_PC) and firm size dummy variable (Scale) to our baseline model. These results are shown in columns (3) and (4) of Table 11, indicating spicy culture has heterogeneous effects in firm size (coefficient of Spicy_PC_Scale is positive at the significance level of 1%). Specifically, spicy culture has a stronger proactive management effect on large firms.
Compared with non-export firms, export firms usually have higher market positions and more competitive advantages. First, knowledge spillover from abroad may reduce the cost of learning of export firms. Second, export firms may use the knowledge resources of foreign social networks and distribution channels to improve their operating ability. Third, foreign markets may help export firms learn new technical knowledge and advanced management experience, as well as provide firms with more resources, information, and opportunities. The above learning effects may promote the development of firms [54]. Based on the proactive management hypothesis, spicy culture may further strengthen the learning effect of firms, resulting in the formation of more competitive advantages. We set a dummy variable Export equal to 1 for firms with export business, and otherwise 0. We added the interaction term (Spicy_PC_Export) of spicy culture (Spicy_PC) and export dummy variable (Export) to our baseline model. Our results are shown in columns (3) and (4) of Table 11, showing spicy culture has heterogeneous effects in export firms (coefficient of Spicy_PC_Export is positive at the significance level of 1%).

5.3. Cases

We introduce three cases to further prove that firms located in regions more affected by spicy culture show more positive governance behavior and higher sustainable productivity. The first case is relevant to TL (Tianqi Lithium, http://www.tianqilithium.com/, accessed on 15 October 2021). TL, located in Sichuan Province (as shown in Figure 1, Sichuan Province is one of the provinces most affected by spicy culture), is a leading new energy firm in China. TL takes the initiative to strategically locate lithium resources in China, Australia, and Chile, and actively establishes partnerships with international customers by advantages of its industrial chain. TL is committed to the long-term sustainable development of lithium ion battery technology. In addition, TL pursues efficiency and excellence and strives to become an excellent firm. Its average sustainable productivity from 2017 to 2019 is as high as 8.72, which is in the forefront of the sample. TL is committed to improving human life through “lithium”, continuously contributing value to the sustainable use of energy and the improvement of the ecological environment.
The second case is relevant to CXDG (China XD Group Co., Ltd., Xi’an, China, http://www.xd.com.cn/, accessed on 15 October 2021). CXDG, located in Shaanxi Province (one of the provinces most affected by spicy Culture), is a large firm group integrating scientific research, development, manufacturing, trade, and finance. CXDG is the first electric firm in China and has won 23 national science and technology progress awards. CXDG attaches great importance to sustainable development, and its average sustainable productivity from 2017 to 2019 is as high as 9.18, ranking in the forefront of the sample. CXDG actively promotes the transformation and upgrading of firms and continuously promotes the sustainable development of the group.
The third case is related to SDMT (Swan Cotton Machinery, Jinan, China, http://www.sdmj.com.cn/, accessed on 15 October 2021). SDMT, located in Shandong Province (one of the provinces least affected by spicy Culture), still needs to make great efforts to achieve sustainable development. In recent years, the net profit SDMT has continued to decline. Moreover, a large number of its managers resign, and the performance of its acquired subsidiaries has also been extremely poor. The average sustainable productivity of SDMT in 2017–2019 is 6.79, which is at the bottom of the sample. From these three cases, it is not difficult to find that firms located in areas more affected by spicy culture show more positive governance behavior and higher sustainable productivity. These cases further prove the impact of spicy culture on the sustainable development of firms.

6. Conclusions and Contribution

6.1. Research Conclusions

This article examined the impact of food culture, represented primarily by regional spicy culture, on firm-level sustainable total factor productivity. To control for country-level effects, we used China as the research sample. As China is a country with significant regional differences in food culture, we used a web crawler approach to obtain data on the food taste index and restaurants as well as construct a regional spicy culture index using text analysis. We found that firms in regions with stronger spicy culture are generally more motivated to proactively manage their total factor productivity, and the results were significant even after controlling for firm-level and year-level fixed effects as well as using double-clustering robust standard errors at the firm and year levels. Our results were still robust when using proxies for region spicy culture and sustainable productivity as well as clustering with replacement standard errors.
As the formation of spicy culture is influenced by geographical shocks, this paper used annual sunshine hours and winter sunshine hours as instrumental variables to address potential endogeneity. Tests based on these instrumental variables show a causal relationship between regional spicy culture and sustainable productivity. We further verified that regional spicy culture guides a proactive management mechanism that contributes to sustainable productivity by influencing the firm’s equity incentive behavior and executive gender ratio, which is in line with the “proactive management hypothesis”. We also used R&D intensity and patent output as well as corporate leverage to rule out the alternative “active R&D hypothesis” and the “aggressive risk-taking hypothesis”. Furthermore, we demonstrated that spicy culture has a heterogeneous effect on firms of different sizes, natures of ownership, and export behavior.
Overall, the findings of this paper provide new evidence on how culture influences the sustainable development of firms in the real economy and therefore have important normative implications. To the best of our knowledge, this article is the first study to suggest that food culture influences corporate sustainable development, confirming the positive impact of food culture, which reflects sideways that culture can be the basis of the economy.

6.2. Theoretical and Practical Contribution

Our article can serve as a useful supplement to previous firm-level sustainable development studies, in which scholars focus on formal institutions such as corporate governance and regulations. We can also promote the transformation of the firm-level sustainable productivity research paradigm from formal institutions-driven to informal institutions-driven. Our major conclusion is that food culture plays an important role in affecting local firms, improving their sustainable productivity. Our research indicates that spicy culture plays a vital role in explaining corporate governance. These findings may make contributions to institutional theory by identifying the role of spicy culture and how it affects corporate behavior. Our research is also conducive to understanding the determinants of firm-level sustainable productivity. Because firm-level sustainable development has a material impact on the social sustainability, especially facing the increasing economic and social uncertainty under the COVID-19 background, firms need to achieve sustainable development. Our research is helpful for understanding the important role that food culture plays in influencing corporate proactive management behavior. This article would enable scholars to more explicitly and comprehensively comprehend the relationship between food culture and firm-level sustainable development, thus promoting the research in theory and practice.
Thus far, our study is the earliest research to confirm that food culture is the external driving force behind firms achieving their sustainable development with significant implications for firms, regulators, and market participants.
For firms, our results could guide them in regions more affected by spicy culture to engage in corporate proactive management behavior that benefit corporate sustainable development and restrain negative management behavior that can harm the interests of firms, as firms affected by regional culture show the homogeneous cultural characteristics. For regulators, our findings imply that firms in regions less exposed to spicy culture generally perform less well in terms of proactive management. It is suggested that government regulators should develop relative policies to encourage firms in these regions to adopt more proactive management strategies. Besides, our findings remind the government to promote the communication of food culture in regions and even across the country in guiding firms to achieve their sustainable development. For market participants, our research indicates that interaction of food culture can help firms to achieve better sustainable development. Based on these results, customers and suppliers of firms should consider the food cultural environment in which firms operate when planning to conduct business cooperation with firms. Similarly, investors and creditors should take advantage of information on food culture environment to evaluate the sustainable operation of firms when making investment or lending decisions.
Finally, it is a research trend that the influencing factors of firm-level sustainable development are transitioning from formal to informal institutional research. Our article starts this shift from the realm of food culture, an important factor of informal institutions, as a first attempt. In the future, we can conduct more in-depth studies of informal institutions from other perspectives of food culture, such as food behavior or food connotation and so on.

Author Contributions

Conceptualization, G.S.; methodology, G.S.; software, G.S.; validation, G.S., X.C., J.C. and H.L.; formal analysis, G.S.; investigation, G.S., X.C. and J.C.; data curation, G.S. and H.L.; writing—original draft preparation, G.S.; writing—review and editing, G.S. and X.C.; project administration, G.S. All authors have read and agreed to the published version of the manuscript.

Funding

This research received no external funding.

Institutional Review Board Statement

Ethical review and approval were waived for this study, as it did not involve personally identifiable or sensitive data.

Informed Consent Statement

This study did not involve human or sensitive data.

Data Availability Statement

The data presented in this study are available on request from the corresponding author.

Conflicts of Interest

The authors declare no conflict of interest.

References

  1. Guiso, L.; Sapienza, P.; Zingales, L. Cultural Biases in Economic Exchange? Q. J. Econ. 2009, 124, 1095–1131. [Google Scholar] [CrossRef] [Green Version]
  2. Rhee, S.G.; Podolski, E.J.; Chen, Y.; Veeraraghavan, M. Local Gambling Preferences and Corporate Innovative Success. J. Financ. Quant. Anal. 2014, 49, 77–106. [Google Scholar]
  3. Lei, G.; Wang, W.; Yu, J.; Chan, K.C. Cultural Diversity and Corporate Tax Avoidance: Evidence from Chinese Private Enterprises. J. Bus. Ethics. 2021, 176, 357–379. [Google Scholar] [CrossRef]
  4. Aleksi, A.; Braje, I.N.; Jelavi, S.R. Creating Sustainable Work Environments by Developing Cultures that Diminish Deviance. Sustainability 2019, 11, 7031. [Google Scholar] [CrossRef] [Green Version]
  5. Chang, R.; Kivela, J.; Mak, A. Food preferences of Chinese tourists. Ann. Tourism. Res. 2010, 37, 989–1011. [Google Scholar] [CrossRef]
  6. Zeng, G.; Zhao, Y.; Sun, S. Sustainable Development Mechanism of Food Culture’s Translocal Production Based on Authenticity. Sustainability 2014, 6, 7030–7047. [Google Scholar] [CrossRef] [Green Version]
  7. Elshaer, I.; Sobaih, A.; Alyahya, M.; Elnasr, A.A. The Impact of Religiosity and Food Consumption Culture on Food Waste Intention in Saudi Arabia. Sustainability 2021, 13, 6473. [Google Scholar] [CrossRef]
  8. Kantabutra, S. Exploring Relationships among Sustainability Organizational Culture Components at an Asian Industrial Conglomerate. Sustainability 2021, 13, 1733. [Google Scholar] [CrossRef]
  9. Park, S.O.; Choi, S.U.; Kim, S.T.; Na, H.J. The Relationship between Corporate Culture and Value at Different Life Cycle Stages. Sustainability 2021, 13, 2334. [Google Scholar] [CrossRef]
  10. Shen, D.; Guo, H.; Yu, L.; Ying, J.; Shen, J.; Ying, S.; Bao, D.; Wang, Y. Sound Design of Guqin Culture: Interactive Art Promotes the Sustainable Development of Traditional Culture. Sustainability 2022, 14, 2356. [Google Scholar] [CrossRef]
  11. Cao, S.; Tian, D.; Zhang, X.; Hou, Y. Sustainable Development of Food Processing Enterprises in China. Sustainability 2019, 11, 1318. [Google Scholar] [CrossRef] [Green Version]
  12. Phan, T.; Tran, H.X.; Le, T.T.; Nguyen, N.; Pervan, S.; Tran, M. The Relationship between Sustainable Development Practices and Financial Performance: A Case Study of Textile Firms in Vietnam. Sustainability 2020, 13, 6473. [Google Scholar] [CrossRef]
  13. Yoo, J.; Lee, S.; Park, S. The Effect of Firm Life Cycle on the Relationship between R&D Expenditures and Future Performance, Earnings Uncertainty, and Sustainable Growth. Sustainability 2019, 11, 2371. [Google Scholar]
  14. Liu, R.; Pieniak, Z.; Verbeke, W. Consumers’ attitudes and behaviour towards safe food in China: A review. Food Control. 2013, 33, 93–104. [Google Scholar] [CrossRef]
  15. Li, H.; Jia, P.; Fei, T. Associations between taste preferences and chronic diseases: A population-based exploratory study in China. Public Health Nutr. 2020, 24, 2021–2032. [Google Scholar] [CrossRef] [PubMed]
  16. Miao, J.; Wang, P. Bubbles and Total Factor Productivity. Am. Econ. Rev. 2012, 102, 82–87. [Google Scholar] [CrossRef] [Green Version]
  17. Olley, G.S.; Pakes, A. The Dynamics of Productivity in the Telecommunications Equipment Industry. Econometrica 1996, 64, 1263. [Google Scholar] [CrossRef]
  18. Petrin, L. Estimating Production Functions Using Inputs to Control for Unobservables. Rev. Econ. Stud. 2003, 70, 317–341. [Google Scholar]
  19. Liu, T.; Kou, F.; Liu, X.; Elahi, E. Cluster Commercial Credit and Total Factor Productivity of the Manufacturing Sector. Sustainability 2022, 14, 3601. [Google Scholar] [CrossRef]
  20. Ding, C.; Zhang, R. The Measurement and Influencing Factors of Total Factor Productivity in the Chinese Rural Distribution Industry. Sustainability 2021, 13, 8581. [Google Scholar] [CrossRef]
  21. Miller, A.S.; Hoffmann, J.P. Risk and Religion: An Explanation of Gender Differences in Religiosity. J. Sci. Stud. Relig. 1995, 34, 63–75. [Google Scholar] [CrossRef]
  22. He, Y.; Wang, J.N.; Choi, B.R. Religious Participation: Does It Matter for Sustainable Culture and Entertainment Consumption? Sustainability 2021, 13, 7999. [Google Scholar] [CrossRef]
  23. Ono, S.; Yuktadatta, P.; Taniguchi, T.; Iitsuka, T.; Noguchi, M.; Tanaka, S.; Ito, H.; Nakamura, K.; Yasuhara, N.; Miyawaki, C.; et al. Financial Literacy and Exercise Behavior: Evidence from Japan. Sustainability 2021, 13, 4189. [Google Scholar] [CrossRef]
  24. Balia, S.; Jones, A.M. Mortality, lifestyle and socio-economic status. J. Health. Econ. 2008, 27, 1–26. [Google Scholar] [CrossRef] [PubMed] [Green Version]
  25. McGinnis, J.M.; Foege, W.H. Actual causes of death in the United States. JAMA-J. Am. Med. Assoc. 1993, 270, 2207–2212. [Google Scholar] [CrossRef]
  26. Cawley, J.; Dragone, D.; Stephanie, V. The Demand for Cigarettes as Derived from the Demand for Weight Loss: A Theoretical and Empirical Investigation. Health Econ. 2014, 25, 8–23. [Google Scholar] [CrossRef]
  27. Mellor, J.M. Do cigarette taxes affect children’s body mass index? The effect of household environment on health. Health Econ. 2011, 20, 417–431. [Google Scholar] [CrossRef]
  28. North, D.C. Institutions. J. Econ. Perspect. 1991, 5, 97–112. [Google Scholar] [CrossRef]
  29. Allen, F.; Qian, J.; Qian, M. Law, finance, and economic growth in China. J. Financ. Econ. 2005, 77, 57–116. [Google Scholar] [CrossRef] [Green Version]
  30. Guiso, L.; Sapienza, P.; Zingales, L. Does Culture Affect Economic Outcomes? J. Econ. Perspect. 2006, 20, 23–48. [Google Scholar] [CrossRef] [Green Version]
  31. Batra, R.K.; Ghoshal, T.; Raghunathan, R. You are what you eat: An empirical investigation of the relationship between spicy food and aggressive cognition. J. Exp. Soc. Psychol. 2017, 71, 42–48. [Google Scholar] [CrossRef]
  32. Byrnes, N.K.; Hayes, J.E. Personality factors predict spicy food liking and intake. Food Qual. Prefer. 2013, 28, 213–221. [Google Scholar] [CrossRef] [PubMed] [Green Version]
  33. BByrnes, N.K.; Loss, C.R.; Hayes, J.E. Perception of chemesthetic stimuli in groups who differ by food involvement and culinary experience. Food Qual. Prefer. 2015, 46, 142–150. [Google Scholar] [CrossRef] [PubMed] [Green Version]
  34. Byrnes, N.K.; Hayes, J.E. Behavioral measures of risk tasking, sensation seeking and sensitivity to reward may reflect different motivations for spicy food liking and consumption. Appetite 2016, 103, 411–422. [Google Scholar] [CrossRef] [Green Version]
  35. Ludy, M.J.; Mattes, R.D. Comparison of sensory, physiological, personality, and cultural attributes in regular spicy food users and non-users. Appetite 2012, 58, 19–27. [Google Scholar] [CrossRef]
  36. Meier, B.P.; Moeller, S.K.; Riemer-Peltz, M.; Robinson, M.D. Sweet taste preferences and experiences predict prosocial inferences, personalities, and behaviors. J. Pers. Soc. Psychol. 2012, 102, 163–174. [Google Scholar] [CrossRef] [PubMed]
  37. Rozin, P.; Schiller, D. The nature and acquisition of a preference for chili pepper by humans. Motiv. Emotion. 1980, 4, 77–101. [Google Scholar] [CrossRef]
  38. Rozin, P.; Guillot, L.; Fincher, K.; Rozin, A.; Tsukayama, E. Glad to be sad, and other examples of benign masochism. Judgm. Decis. Mak. 2013, 8, 439–447. [Google Scholar]
  39. Zeng, G.; Go, F.; Vries, H. Paradox of Authenticity versus Standardization: Expansion Strategies of Restaurant Groups in China. Int. J. Hosp. Manag. 2014, 31, 1090–1100. [Google Scholar] [CrossRef]
  40. Liang, H.; Renneboog, L. On the Foundations of Corporate Social Responsibility. J. Financ. 2017, 72, 853–910. [Google Scholar] [CrossRef]
  41. Huang, Q.; Li, Y.; Lin, M.; Mcbrayer, G.A. Natural disasters, risk salience, and corporate ESG disclosure. J. Corp. Financ. 2022, 72, 102152. [Google Scholar] [CrossRef]
  42. Ali, S.; Liu, Y.; Ishaq, M.; Shah, T.; Ilyas, A.; Din, I.U. Climate Change and Its Impact on the Yield of Major Food Crops: Evidence from Pakistan. Foods 2017, 6, 39. [Google Scholar] [CrossRef] [PubMed]
  43. Lai, S.; Li, Z.; Yang, Y.G. East, West, Home’s Best: Do Local CEOs Behave Less Myopically? Account. Rev. 2019, 95, 227–255. [Google Scholar] [CrossRef]
  44. Jensen, M.C.; Meckling, W.H. Theory of the Firm: Managerial Behavior, Agency Costs, and Ownership Structure. J. Financ. Econ. 1976, 3, 305–360. [Google Scholar] [CrossRef]
  45. Kim, J.B.; Li, Y.; Zhang, L. CFOs versus CEOs: Equity incentives and crashes. J. Financ. Econ. 2011, 101, 713–730. [Google Scholar] [CrossRef]
  46. Rego, S.O.; Wilson, R. Equity Risk Incentives and Corporate Tax Aggressiveness. J. Account. Res. 2012, 50, 775–810. [Google Scholar] [CrossRef]
  47. Griffin, D.; Guedhami, O.; Li, K.; Lu, G. National Culture and the Value Implications of Corporate Environmental and Social Performance. J. Corp. Financ. 2021, 71, 102123. [Google Scholar] [CrossRef]
  48. Hillman, A.J.; Shropshire, C.; Cannella, A. Organizational Predictors of Women on Corporate Boards. Acad. Manag. J. 2007, 50, 941–952. [Google Scholar] [CrossRef] [Green Version]
  49. Yu, L.; Wei, Z.; Xie, F. Do women directors improve firm performance in China? J. Corp. Financ. 2014, 28, 169–184. [Google Scholar]
  50. Meyer, K.E.; Yuan, D.; Jing, L.; Hua, Z. Overcoming distrust: How state-owned enterprises adapt their foreign entries to institutional pressures abroad. J. Int. Bus. Stud. 2014, 45, 1005–1028. [Google Scholar] [CrossRef]
  51. An, H.; Chen, Y.; Luo, D.; Zhang, T. Political uncertainty and corporate investment: Evidence from China. J. Corp. Financ. 2016, 36, 174–189. [Google Scholar] [CrossRef]
  52. Akcigit, U.; Kerr, W.R. Growth Through Heterogeneous Innovations. J. Polit. Econ. 2018, 126, 1374–1443. [Google Scholar] [CrossRef] [Green Version]
  53. Coles, J.L.; Li, Z.; Wang, A.Y. Industry Tournament Incentives. Rev. Financ. Stud. 2018, 31, 1418–1459. [Google Scholar] [CrossRef]
  54. Aw, B.Y.; Roberts, M.J.; Xu, D. R&D Investment, Exporting, and Productivity Dynamics. Am. Econ. Rev. 2011, 101, 1312–1344. [Google Scholar]
Figure 1. Proportion of various restaurants at the provincial level in China (each restaurant has its own cuisine).
Sustainability 14 08835 g001
Figure 2. Regional spicy culture map. Note. The darker the color of a region, the more it is affected by spicy culture.
Sustainability 14 08835 g002
Table 1. Number of recipes and spicy index.
Serial NumberUsageCuisine TypeNumber of RecipesSpicy
116 cuisines contained in both recipes and PC dataChuan10080.95
2Dongbei8960.26
3Gangtai670.34
4Hubei2330.26
5Hu3280.06
6Hui3270.13
7Jing3600.11
8Lu7570.16
9Min6610.10
10Qingzhen1410.38
11Su4490.09
12Xibei3390.34
13Xiang7200.63
14Yue10070.12
15Yungui1870.66
16Zhe5700.09
17Only 4 cuisines contained in recipesGuangxi980.39
18Jiangxi870.59
19Shanxi1750.19
20Yu1670.17
Note. Data come from the “Meishijie” website (http://www.meishij.net/).
Table 2. Descriptive statistics.
VariablesNMeanSd25%Median75%MinMax
TFP_lp10,1808.2800.9987.5638.1738.8876.20910.809
Spicy_PC10,1800.5410.0650.4910.5250.5860.4680.760
Spicy_diet10,1470.2040.2160.0900.1200.1700.0600.950
LEV10,1800.3980.1920.2420.3930.5450.0500.823
Size10,18022.2451.27521.32722.04822.94520.07926.207
BM10,1800.5990.2350.4150.5950.7770.1431.135
ROA10,1800.0510.0460.0230.0460.074−0.1550.187
Attention10,18010.7279.9603.0007.00016.0001.00046.000
RET10,1800.0830.513−0.273−0.0540.291−0.5752.088
Turnover10,180589.242471.394258.407452.986774.76651.7282688.277
TOP_110,18035.75414.66724.09034.16045.5259.23073.660
TOP_1010,18060.13214.25950.17061.11070.79025.14090.560
SOE10,1800.3710.4830.0000.0001.0000.0001.000
Boardsize10,1808.7661.7298.0009.0009.0005.00015.000
Indeboard10,1800.3730.0530.3330.3330.4290.3330.571
Separation10,1804.6267.5300.0000.0007.5270.00028.283
Lncom10,18015.5110.67015.06215.47615.95113.84617.332
CO_CEO10,1800.2740.4460.0000.0001.0000.0001.000
GDP_per10,1807.0083.1744.4676.3818.9432.12315.310
GDP_growth10,180108.5131.942107.300108.000109.400103.500114.600
Pop_growth10,1805.1022.2803.1405.0106.600−0.44010.840
Consume_per10,1809.8240.4269.5279.84210.1278.88810.677
Note: N: number of observation; Sd: standard deviation.
Table 3. The influence of regional spicy culture on sustainable total factor productivity.
TFP_lp(1)(2)(3)(4)
Spicy_PC1.308 ** 1.463 **
(2.306) (2.379)
Spicy_diet 0.456 ** 0.526 **
(2.224) (2.386)
Size0.382 ***0.383 ***0.379 ***0.380 ***
(26.605)(26.644)(26.559)(26.558)
ROA1.294 ***1.297 ***1.283 ***1.285 ***
(11.887)(11.900)(11.753)(11.759)
LEV0.527 ***0.528 ***0.529 ***0.530 ***
(12.400)(12.441)(12.553)(12.588)
BM−0.234 ***−0.235 ***−0.231 ***−0.232 ***
(−7.642)(−7.648)(−7.527)(−7.529)
Attention0.002 ***0.002 ***0.002 ***0.002 ***
(3.834)(3.722)(3.892)(3.777)
RET0.038 ***0.037 ***0.037 ***0.036 ***
(5.104)(4.931)(5.052)(4.881)
Turnover−0.000−0.000−0.000−0.000
(−1.495)(−1.293)(−1.551)(−1.340)
TOP_1−0.000−0.000−0.000−0.000
(−0.496)(−0.535)(−0.635)(−0.684)
TOP_100.0000.0000.0000.000
(0.271)(0.329)(0.515)(0.573)
Boardsize0.013 ***0.014 ***0.013 ***0.014 ***
(3.743)(3.877)(3.751)(3.883)
Indeboard0.208 **0.205 **0.212 **0.209 **
(2.182)(2.157)(2.230)(2.204)
Lncom0.019 *0.019 *0.017 *0.017 *
(1.835)(1.793)(1.698)(1.652)
Separation0.0000.0000.0000.000
(0.339)(0.354)(0.299)(0.298)
CO_CEO−0.017−0.017−0.017−0.018
(−1.392)(−1.398)(−1.415)(−1.438)
SOE−0.082 *−0.076−0.081 *−0.074
(−1.731)(−1.623)(−1.706)(−1.574)
GDP_per_ −0.000−0.000
(−0.871)(−0.842)
GDP_growth 0.014 ***0.014 ***
(3.686)(3.584)
Pop_growth 0.0050.005
(1.278)(1.314)
Consume_per 0.181 **0.193 ***
(2.451)(2.605)
Constant−1.545 ***−0.951 ***−4.812 ***−4.220 ***
(−3.486)(−2.879)(−4.551)(−4.432)
Year FEYesYesYesYes
Firm FEYesYesYesYes
Observations10,18010,14710,18010,147
R-squared0.4790.4800.4800.481
Note: time period is from 2010 to 2019. Variables are winsorized at the 1% level. Robust t-statistics values are presented in (). Robust standard errors clustered at the double degree of firm and year levels. Significance: *** p < 0.01, ** p < 0.05, * p < 0.1.
Table 4. Regional spicy culture and sustainable total factor productivity: instrumental variable method.
(1)(2)(3)(4)
Stage1Stage2Stage1Stage2
VariablesSpicy_PCTFP_lpSpicy_PCTFP_lp
Sunshine−0.003 ***
(−36.140)
Sunshine_win −0.005 ***
(−24.557)
Spicy_PC 3.399 *** 3.120 **
(3.843) (2.494)
Size−0.001 **0.381 ***−0.001 **0.381 ***
(−2.374)(33.374)(−2.528)(33.256)
ROA−0.0041.291 ***−0.0041.290 ***
(−1.162)(13.291)(−1.276)(13.279)
LEV0.0010.526 ***0.0010.527 ***
(1.212)(14.100)(1.196)(14.111)
BM0.001−0.232 ***0.000−0.232 ***
(0.784)(−7.863)(0.382)(−7.861)
Attention−0.0000.002 ***−0.0000.002 ***
(−1.227)(3.682)(−0.887)(3.674)
RET−0.0000.038 ***−0.0000.038 ***
(−0.554)(4.851)(−0.277)(4.851)
Turnover−0.000−0.000−0.000−0.000
(−1.534)(−1.366)(−1.231)(−1.384)
TOP_10.000 **−0.0010.000 **−0.001
(2.398)(−0.866)(2.158)(−0.844)
TOP_10−0.000 ***0.000−0.000 ***0.000
(−3.975)(0.804)(−3.906)(0.764)
Boardsize0.001 ***0.012 ***0.001 ***0.012 ***
(5.441)(3.106)(5.358)(3.116)
Indeboard0.011 ***0.183 *0.012 ***0.187 *
(3.505)(1.875)(3.916)(1.901)
Lncom−0.0000.017 *−0.0000.017 *
(−0.978)(1.774)(−0.541)(1.775)
Separation0.000 ***−0.0000.000 ***0.000
(5.130)(−0.011)(5.804)(0.040)
CO_CEO−0.000−0.017−0.000−0.017
(−0.240)(−1.567)(−0.240)(−1.573)
SOE0.003 **−0.087 **0.003 **−0.087 **
(2.244)(−2.138)(2.123)(−2.113)
GDP_per−0.000 ***0.000−0.000 ***0.000
(−15.493)(0.156)(−18.342)(0.006)
GDP_growth0.001 ***0.012 ***0.001 ***0.012 ***
(7.546)(2.923)(8.504)(2.924)
Pop_growth−0.001 ***0.006 *−0.001 ***0.006
(−10.405)(1.697)(−8.265)(1.614)
Consume_per−0.038 ***0.262 ***−0.039 ***0.250 ***
(−21.981)(3.946)(−21.673)(3.300)
Constant0.883 ***−6.446 ***0.835 ***−6.211 ***
(34.756)(−5.845)(31.634)(−4.664)
Year FEYesYesYesYes
Firm FEYesYesYesYes
Observations10,18010,18010,18010,180
R-squared0.2720.4780.2120.479
Cragg-Donald Wald F statistic1306.099603.031
Kleibergen-Paap rk Wald F statistic29.00132.657
Note: time period is from 2010 to 2019. Variables are winsorized at the 1% level. Robust t-statistics values are presented in (). Robust standard errors clustered at the double degree of firm and year levels. Significance: *** p < 0.01, ** p < 0.05, * p < 0.1.
Table 5. Alternative proxy variables of regional spicy culture and sustainable total factor productivity: instrumental variable regression.
(1)(2)(3)(4)
Stage1Stage2Stage1Stage2
VariablesSpicy_dietTFP_lpSpicy_dietTFP_lp
Sunshine−0.008 ***
(−30.169)
Sunshine_win −0.015 ***
(−22.488)
Spicy_diet 1.338 *** 1.121 **
(3.792) (2.428)
Size−0.003 **0.382 ***−0.003 **0.382 ***
(−2.425)(33.413)(−2.551)(33.296)
ROA−0.0061.291 ***−0.0071.289 ***
(−0.620)(13.278)(−0.783)(13.280)
LEV0.006 *0.526 ***0.0060.527 ***
(1.678)(14.043)(1.629)(14.083)
BM0.002−0.233 ***0.001−0.233 ***
(0.654)(−7.878)(0.305)(−7.880)
Attention0.0000.002 ***0.000 *0.002 ***
(1.408)(3.379)(1.650)(3.412)
RET0.0000.036 ***0.0000.036 ***
(0.281)(4.612)(0.552)(4.629)
Turnover−0.000 **−0.000−0.000 **−0.000
(−2.343)(−1.068)(−2.046)(−1.124)
TOP_0.000 ***−0.0010.000 ***−0.001
(4.639)(−1.117)(4.381)(−1.016)
TOP_10−0.000 ***0.001−0.000 ***0.000
(−4.973)(0.999)(−4.958)(0.887)
Boardsize0.002 ***0.012 ***0.002 ***0.012 ***
(6.146)(3.015)(6.032)(3.102)
Indeboard0.033 ***0.174 *0.036 ***0.183 *
(3.586)(1.773)(3.915)(1.855)
Lncom−0.002 *0.018 *−0.0010.018 *
(−1.908)(1.813)(−1.533)(1.793)
Separation0.000 ***−0.0000.001 ***0.000
(5.241)(−0.104)(5.872)(0.016)
CO_CEO0.002 **−0.019 *0.002 **−0.019 *
(2.044)(−1.757)(1.977)(−1.723)
SOE−0.005−0.071 *−0.006−0.072 *
(−1.412)(−1.726)(−1.423)(−1.752)
GDP_per−0.000 ***0.000−0.000 ***0.000
(−15.458)(0.406)(−18.035)(0.074)
GDP_growth0.003 ***0.011 ***0.003 ***0.012 ***
(8.099)(2.630)(9.056)(2.730)
Pop_growth−0.003 ***0.007 *−0.003 ***0.006 *
(−10.402)(1.872)(−8.792)(1.696)
Consume_per−0.130 ***0.306 ***−0.132 ***0.276 ***
(−25.002)(4.149)(−24.763)(3.268)
Constant1.341 ***−5.228 ***1.215 ***−4.959 ***
(17.560)(−5.666)(15.562)(−4.994)
Year FEYesYesYesYes
Firm FEYesYesYesYes
Observations10,14710,14710,14710,147
R-squared0.2590.4780.2230.480
Cragg-Donald Wald F statistic910.140505.694
Kleibergen-Paap rk Wald F statistic22.81626.377
Note: time period is from 2010 to 2019. Variables are winsorized at the 1% level. Robust t-statistics values are presented in (). Robust standard errors clustered at the double degree of firm and year levels. Significance: *** p < 0.01, ** p < 0.05, * p < 0.1.
Table 6. The influence of regional spicy culture on sustainable total factor productivity (OP semi-parametric method).
TFP_op(1)(2)(3)(4)
Spicy_PC0.625 ** 0.581 *
(2.194) (1.902)
Spicy_diet 0.221 ** 0.216 **
(2.307) (2.074)
Size0.104 ***0.105 ***0.104 ***0.104 ***
(9.961)(10.037)(9.863)(9.939)
ROA1.047 ***1.056 ***1.032 ***1.041 ***
(11.693)(11.796)(11.517)(11.619)
LEV0.476 ***0.479 ***0.475 ***0.478 ***
(13.835)(13.894)(13.792)(13.860)
BM−0.085 ***−0.086 ***−0.085 ***−0.086 ***
(−3.142)(−3.175)(−3.112)(−3.146)
Attention0.001 *0.001 *0.001 **0.001 *
(1.957)(1.861)(2.022)(1.935)
RET0.035 ***0.034 ***0.034 ***0.033 ***
(4.919)(4.715)(4.816)(4.617)
Turnover0.0000.0000.0000.000
(0.954)(1.203)(0.912)(1.165)
TOP_1−0.002 ***−0.002 ***−0.002 ***−0.002 ***
(−2.608)(−2.637)(−2.804)(−2.829)
TOP_100.001 ***0.001 ***0.001 ***0.001 ***
(2.831)(2.892)(3.057)(3.111)
Boardsize0.010 ***0.010 ***0.010 ***0.011 ***
(2.919)(2.986)(2.970)(3.037)
Indeboard0.150 *0.1440.152 *0.147
(1.673)(1.610)(1.704)(1.641)
Lncom−0.034 ***−0.035 ***−0.035 ***−0.036 ***
(−3.784)(−3.846)(−3.889)(−3.959)
Separation−0.000−0.000−0.000−0.000
(−0.126)(−0.121)(−0.168)(−0.177)
CO_CEO−0.015−0.014−0.015−0.014
(−1.513)(−1.419)(−1.524)(−1.430)
SOE−0.063 *−0.060−0.065 *−0.062 *
(−1.678)(−1.606)(−1.722)(−1.653)
GDP_percapita −0.000 **−0.000 **
(−2.294)(−2.264)
GDP_growth 0.011 ***0.010 ***
(2.870)(2.762)
Pop_growth 0.0040.004
(1.316)(1.356)
Consume_percapita 0.108 **0.113 **
(2.050)(2.140)
Constant1.236 ***1.516 ***−0.894−0.645
(4.327)(6.464)(−1.128)(−0.848)
Year FEYesYesYesYes
Firm FEYesYesYesYes
Observations10,18010,14710,18010,147
R-squared0.1150.1160.1170.117
Note: time period is from 2010 to 2019. Variables are winsorized at the 1% level. Robust t-statistics values are presented in (). Robust standard errors clustered at the double degree of firm and year levels. Significance: *** p < 0.01, ** p < 0.05, * p < 0.1.
Table 7. The influence of regional spicy culture on sustainable total factor productivity (double clustering robust standard error at industry and year levels).
TFP_lp(1)(2)(3)(4)
Spicy_PC1.308 ** 1.463 ***
(2.438) (2.591)
Spicy_diet 0.456 ** 0.526 **
(2.268) (2.504)
Size0.382 ***0.383 ***0.379 ***0.380 ***
(21.106)(21.217)(21.259)(21.293)
ROA1.294 ***1.297 ***1.283 ***1.285 ***
(11.301)(11.327)(11.176)(11.191)
LEV0.527 ***0.528 ***0.529 ***0.530 ***
(12.155)(12.275)(12.139)(12.261)
BM−0.234 ***−0.235 ***−0.231 ***−0.232 ***
(−7.270)(−7.267)(−7.152)(−7.141)
Attention0.002 ***0.002 ***0.002 ***0.002 ***
(3.626)(3.504)(3.670)(3.546)
RET0.038 ***0.037 ***0.037 ***0.036 ***
(4.896)(4.722)(4.863)(4.690)
Turnover−0.000−0.000−0.000−0.000
(−1.465)(−1.260)(−1.530)(−1.315)
TOP_1−0.000−0.000−0.000−0.000
(−0.504)(−0.542)(−0.645)(−0.693)
TOP_100.0000.0000.0000.000
(0.245)(0.296)(0.469)(0.520)
Boardsize0.013 ***0.014 ***0.013 ***0.014 ***
(3.843)(3.955)(3.865)(3.978)
Indeboard0.208 **0.205 **0.212 **0.209 **
(1.995)(1.969)(2.034)(2.009)
Lncom0.019 *0.019 *0.0170.017
(1.698)(1.657)(1.565)(1.522)
Separation0.0000.0000.0000.000
(0.298)(0.311)(0.263)(0.262)
CO_CEO−0.017−0.017−0.017−0.018
(−1.466)(−1.471)(−1.492)(−1.515)
SOE−0.082 *−0.076 *−0.081 *−0.074
(−1.766)(−1.659)(−1.748)(−1.618)
GDP_per −0.000−0.000
(−0.849)(−0.826)
GDP_growth 0.014 ***0.014 ***
(3.716)(3.625)
Pop_growth 0.0050.005
(1.240)(1.282)
Consume_per 0.181 ***0.193 ***
(2.622)(2.773)
Constant−1.545 ***−0.951 **−4.812 ***−4.220 ***
(−3.397)(−2.380)(−4.575)(−4.330)
Year FEYesYesYesYes
Firm FEYesYesYesYes
Observations10,18010,14710,18010,147
R-squared0.4790.4800.4800.481
Note: time period is from 2010 to 2019. Variables are winsorized at the 1% level. Robust t-statistics values are presented in (). Robust standard errors clustered at the double degree of industry and year levels. Significance: *** p < 0.01, ** p < 0.05, * p < 0.1.
Table 8. The influence of regional spicy culture on sustainable total factor productivity (double clustering robust standard error at province and year levels).
TFP_lp(1)(2)(3)(4)
Spicy_PC1.308 ** 1.463 **
(2.440) (2.333)
Spicy_diet 0.456 ** 0.526 **
(2.298) (2.290)
Size0.382 ***0.383 ***0.379 ***0.380 ***
(22.767)(22.845)(22.788)(22.820)
ROA1.294 ***1.297 ***1.283 ***1.285 ***
(12.466)(12.455)(12.427)(12.401)
LEV0.527 ***0.528 ***0.529 ***0.530 ***
(11.913)(11.851)(12.123)(12.072)
BM−0.234 ***−0.235 ***−0.231 ***−0.232 ***
(−8.092)(−8.096)(−7.934)(−7.931)
Attention0.002 ***0.002 ***0.002 ***0.002 ***
(3.765)(3.691)(3.824)(3.739)
RET0.038 ***0.037 ***0.037 ***0.036 ***
(4.483)(4.339)(4.485)(4.337)
Turnover−0.000−0.000−0.000−0.000
(−1.567)(−1.350)(−1.637)(−1.404)
TOP_1−0.000−0.000−0.000−0.000
(−0.494)(−0.538)(−0.627)(−0.682)
TOP_100.0000.0000.0000.000
(0.262)(0.317)(0.501)(0.555)
Boardsize0.013 ***0.014 ***0.013 ***0.014 ***
(3.827)(3.970)(3.890)(4.034)
Indeboard0.208 **0.205 **0.212 **0.209 **
(2.117)(2.084)(2.163)(2.129)
Lncom0.019 *0.019 *0.017 *0.017 *
(1.847)(1.783)(1.726)(1.656)
Separation0.0000.0000.0000.000
(0.304)(0.317)(0.270)(0.267)
CO_CEO−0.017−0.017−0.017 *−0.018 *
(−1.647)(−1.636)(−1.676)(−1.681)
SOE−0.082 *−0.076−0.081 *−0.074
(−1.682)(−1.601)(−1.684)(−1.587)
GDP_per −0.000−0.000
(−0.715)(−0.678)
GDP_growth 0.014 ***0.014 ***
(3.338)(3.191)
Pop_growth 0.0050.005
(1.491)(1.540)
Consume_per 0.181 ***0.193 ***
(2.639)(2.752)
Constant−1.545 ***−0.951 **−4.812 ***−4.220 ***
(−3.064)(−2.346)(−4.357)(−4.229)
Year FEYesYesYesYes
Firm FEYesYesYesYes
Observations10,18010,14710,18010,147
R-squared0.4790.4800.4800.481
Note: time period is from 2010 to 2019. Variables are winsorized at the 1% level. Robust t-statistics values are presented in (). Robust standard errors clustered at the double degree of province and year levels. Significance: *** p < 0.01, ** p < 0.05, * p < 0.1.
Table 9. Mechanism influence of regional spicy culture on sustainable total factor productivity.
(1)(2)(3)(4)(5)(6)
Stage1Stage2Stage1Stage2Stage1Stage2
VariablesOptionTFP_lpoptionTFP_lpFRTFP_lp
Spicy_PC0.655 ** 0.190 ** 0.201 ***
(2.186) (2.308) (2.980)
Option 2.233 **
(1.962)
option 7.694 **
(2.035)
FR 7.719 **
(2.469)
Size0.0130.349 ***−0.040 ***0.684 ***−0.0030.404 ***
(1.289)(11.895)(−14.002)(4.479)(−1.260)(17.063)
ROA0.176 **0.891 ***0.120 ***0.3620.0241.123 ***
(2.000)(3.026)(4.954)(0.730)(1.215)(5.679)
LEV−0.0490.637 ***−0.0060.577 ***0.014 *0.431 ***
(−1.441)(6.366)(−0.684)(6.855)(1.838)(5.159)
BM−0.004−0.222 ***0.076 ***−0.813 ***−0.015 **−0.107
(−0.152)(−3.331)(10.302)(−2.770)(−2.540)(−1.455)
Attention0.001 ***−0.0010.001 ***−0.0020.0000.002
(3.101)(−0.681)(4.468)(−1.048)(0.426)(1.611)
RET0.0070.0230.0030.014−0.0020.055 ***
(0.953)(1.184)(1.612)(0.660)(−1.317)(3.407)
Turnover−0.000 *0.0000.000 ***−0.000 **−0.000−0.000
(−1.652)(0.644)(6.652)(−2.165)(−0.876)(−0.142)
TOP_1−0.001 **0.003−0.0000.0010.000−0.001
(−2.333)(1.229)(−1.468)(0.822)(0.944)(−1.097)
TOP_10−0.001 **0.0020.002 ***−0.016 **−0.001 ***0.007 **
(−2.059)(1.494)(16.956)(−1.993)(−8.732)(2.424)
Boardsize0.009 ***−0.0070.0000.012−0.0010.021 ***
(2.696)(−0.522)(0.114)(1.516)(−1.231)(2.736)
Indeboard0.137−0.093−0.0220.382 *0.028−0.004
(1.555)(−0.338)(−0.918)(1.718)(1.420)(−0.019)
Lncom0.010−0.0050.0000.014−0.0030.041 *
(1.147)(−0.214)(0.171)(0.664)(−1.579)(1.944)
Separation0.000−0.000−0.002 ***0.016 **−0.0000.001
(0.276)(−0.089)(−8.497)(2.039)(−0.367)(0.377)
CO_CEO0.001−0.020−0.0030.0070.002−0.041 *
(0.145)(−0.841)(−1.160)(0.253)(1.114)(−1.892)
SOE−0.082 **0.102−0.061 ***0.386−0.003−0.055
(−2.225)(0.791)(−5.983)(1.583)(−0.348)(−0.708)
GDP_per0.000 *−0.000 *−0.000−0.0000.000 **−0.000 *
(1.720)(−1.729)(−0.399)(−0.094)(2.422)(−1.844)
GDP_growth−0.0040.022 **−0.0000.015 *−0.002 ***0.033 ***
(−0.995)(2.292)(−0.118)(1.710)(−3.047)(3.175)
Pop_growth0.006 *−0.008−0.002 **0.017 *−0.0010.011
(1.826)(−0.839)(−1.966)(1.723)(−1.193)(1.539)
Consume_per0.083−0.0050.0180.041−0.0110.255 **
(1.615)(−0.032)(1.283)(0.329)(−0.988)(2.103)
Constant−0.428−3.856 **0.623 ***−9.608 ***0.598 ***−9.399 ***
(−0.551)(−2.103)(2.918)(−2.786)(3.422)(−3.300)
Year FEYesYesYesYesYesYes
Firm FEYesYesYesYesYesYes
Observations10,18010,18010,18010,18010,18010,180
R-squared0.0270.1630.2140.0460.0610.117
Note: time period is from 2010 to 2019. Variables are winsorized at the 1% level. Robust t-statistics values are presented in (). Robust standard errors clustered at the double degree of firm and year levels. Significance: *** p < 0.01, ** p < 0.05, * p < 0.1.
Table 10. Mechanism exclusion test.
(1)(2)(3)
VariablesRDPatentlev
Spicy_PC−0.0041476.1070.073
(−0.277)(0.721)(0.826)
Size−0.002 ***−70.900 ***0.023 ***
(−4.826)(−3.946)(7.044)
ROA0.00112.816−0.119 ***
(0.263)(0.082)(−3.934)
LEV0.001−19.5110.527 ***
(0.989)(−0.325)(40.314)
BM−0.002 **81.947 *−0.036 ***
(−2.013)(1.932)(−4.727)
Attention0.000 ***2.471 ***−0.000 ***
(4.279)(3.672)(−3.103)
RET−0.001 **−8.748−0.002
(−2.037)(−0.814)(−0.969)
Turnover0.000 *0.014−0.000
(1.681)(0.983)(−1.335)
TOP_1−0.000 ***0.2330.000
(−4.291)(0.258)(0.639)
TOP_100.000 **0.984−0.001 ***
(2.157)(1.217)(−5.772)
Boardsize0.000−12.544 **−0.000
(0.096)(−2.068)(−0.090)
Indeboard−0.003−653.253 ***−0.071 ***
(−0.690)(−4.704)(−3.274)
Lncom0.003 ***−8.3560.000
(7.149)(−0.528)(0.090)
Separation0.000−0.7010.000
(1.045)(−0.473)(0.973)
CO_CEO0.000−3.485−0.002
(0.405)(−0.204)(−0.743)
SOE0.0016.8110.034 ***
(0.693)(0.101)(3.039)
GDP_per−0.0000.003 ***−0.000
(−0.588)(3.599)(−0.071)
GDP_growth0.00011.795 *0.002 **
(0.033)(1.922)(2.222)
Pop_growth0.000 **−6.785−0.000
(1.981)(−1.296)(−0.055)
Consume_per0.003−91.4800.006
(1.182)(−0.592)(0.448)
Constant0.002526.211−0.539 **
(0.067)(0.202)(−2.520)
Year FEYesYesYes
Firm FEYesYesYes
Observations8497164410,180
R-squared0.0650.1410.384
Note: time period is from 2010 to 2019. Variables are winsorized at the 1% level. Robust t-statistics values are presented in (). Robust standard errors clustered at the double degree of firm and year levels. Significance: *** p < 0.01, ** p < 0.05, * p < 0.1.
Table 11. Heterogeneity test.
TFP_lp(1)(2)(3)(4)(5)(6)
Spicy_PC0.5490.776 *1.265 ***1.447 ***1.386 **1.646 ***
(1.316)(1.761)(4.083)(4.353)(2.442)(2.617)
Spicy_PC_SOE1.210 ***1.118 ***
(2.868)(2.638)
Spicy_PC_Scale 0.212 ***0.210 ***
(10.302)(10.217)
Spicy_PC_Export 0.124 ***0.127 ***
(4.103)(4.196)
Size0.386 ***0.382 ***0.352 ***0.349 ***0.381 ***0.378 ***
(33.713)(33.195)(29.884)(29.428)(22.696)(22.721)
ROA1.312 ***1.306 ***1.257 ***1.253 ***1.304 ***1.294 ***
(13.385)(13.312)(12.896)(12.835)(10.528)(10.413)
LEV0.530 ***0.532 ***0.522 ***0.524 ***0.547 ***0.545 ***
(14.057)(14.103)(13.943)(13.990)(11.151)(11.192)
BM−0.228 ***−0.224 ***−0.210 ***−0.206 ***−0.204 ***−0.200 ***
(−7.675)(−7.515)(−7.112)(−6.959)(−5.742)(−5.627)
Attention0.002 ***0.002 ***0.002 ***0.002 ***0.002 ***0.002 ***
(3.696)(3.738)(3.673)(3.707)(3.455)(3.483)
RET0.039 ***0.039 ***0.041 ***0.041 ***0.044 ***0.044 ***
(4.956)(4.935)(5.273)(5.255)(5.225)(5.232)
Turnover−0.000−0.000−0.000−0.000−0.000 *−0.000 *
(−1.590)(−1.640)(−1.425)(−1.476)(−1.677)(−1.714)
TOP_1−0.000−0.000−0.000−0.0010.0010.000
(−0.370)(−0.520)(−0.680)(−0.802)(0.729)(0.588)
TOP_100.0000.0000.0010.001−0.000−0.000
(0.391)(0.667)(1.062)(1.312)(−0.346)(−0.091)
Boardsize0.013 ***0.013 ***0.014 ***0.014 ***0.009 **0.009 **
(3.469)(3.456)(3.681)(3.660)(2.134)(2.185)
Indeboard0.210 **0.214 **0.219 **0.222 **0.1480.156
(2.146)(2.189)(2.247)(2.285)(1.323)(1.398)
Lncom0.016 *0.0150.018 *0.017 *0.022 *0.019
(1.647)(1.535)(1.833)(1.714)(1.750)(1.567)
SOE−0.657 ***−0.604 ***−0.067−0.065−0.086−0.083
(−2.863)(−2.621)(−1.626)(−1.584)(−1.624)(−1.554)
Separation0.0000.0000.0000.000−0.000−0.000
(0.231)(0.220)(0.235)(0.229)(−0.006)(−0.072)
CO_CEO−0.022 **−0.022 **−0.021 **−0.022 **−0.008−0.009
(−2.032)(−2.049)(−1.974)(−1.995)(−0.582)(−0.645)
GDP_per −0.000 −0.000 −0.000
(−0.237) (−0.008) (−0.241)
GDP_growth 0.013 *** 0.013 *** 0.013 ***
(3.334) (3.273) (2.722)
Pop_growth 0.005 0.004 0.007
(1.385) (1.209) (1.633)
Consume_per 0.156 *** 0.153 *** 0.206 **
(2.705) (2.684) (2.416)
Constant−1.217 ***−4.249 ***−0.961 ***−3.909 ***−1.576 ***−5.003 ***
(−3.485)(−4.748)(−3.026)(−4.513)(−3.255)(−4.050)
Year FEYesYesYesYesYesYes
Firm FEYesYesYesYesYesYes
Observations10,18010,18010,18010,18079087908
R-squared0.4800.4820.4870.4880.5040.505
Note: time period is from 2010 to 2019. Variables are winsorized at the 1% level. Robust t-statistics values are presented in (). Robust standard errors clustered at the double degree of firm and year levels. Significance: *** p < 0.01, ** p < 0.05, * p < 0.1.
Publisher’s Note: MDPI stays neutral with regard to jurisdictional claims in published maps and institutional affiliations.

