Article

A Comprehensive Evaluation Model on Optimal Operational Schedules for Battery Energy Storage System by Maximizing Self-Consumption Strategy and Genetic Algorithm

1
Institute of Refrigeration and Cryogenics, Zhejiang University, Hangzhou 310058, China
2
College of Environmental Science and Engineering, Donghua University, Shanghai 201620, China
3
Lily Group Co., Ltd., Hangzhou 311228, China
4
College of Energy Engineering, Zhejiang University, Hangzhou 310058, China
*
Author to whom correspondence should be addressed.
Sustainability 2022, 14(14), 8821; https://doi.org/10.3390/su14148821
Submission received: 16 May 2022 / Revised: 7 July 2022 / Accepted: 13 July 2022 / Published: 19 July 2022

Abstract

:
Building an energy storage system is beneficial when solar panels are not producing sufficient energy. However, there is a major issue in terms of feasibility and efficiency. These limitations could be overcome by the deployment of optimal operational strategies. In previous studies, researchers typically focused on finding problem-solving strategies in such situations with only one or two evaluation indicators, lacking a comprehensive evaluation of the integrated objective. Moreover, few studies propose a general model of battery systems suitable for forecast-based operation scenarios with different energy demand features. Therefore, this study developed a comprehensive evaluation model for the operational schedule optimization of a battery energy storage system with a detailed and holistic analysis as well as practicality in implementation. In order to consume the maximum allowable rate of PV generation as promptly and completely as possible, this model was based on a maximizing self-consumption strategy (MSC). A genetic algorithm was applied to time match PV generation and load demand with full consideration of comprehensive techno-economic indicators and total operation cost as well. The model was validated within a typical American house to select the best battery system according to techno-economic indicators for the three types of batteries analyzed. It was discovered that the three types of batteries including Discover AES, Electriq PowerPod2 and Tesla Powerwall+ could all be considered as options for energy storage, and there exist subtle differences in their technical performance during the short charging and discharging phases. Discover AES has the advantage of using PV generation in a timely manner to suit load demand during the long-term operation of a battery energy storage system. With the proper prediction of building energy demand by means of a machine learning approach, the model’s robustness and predictive performance could be further extended. The machine learning approach proved feasible for adapting our optimization model to various battery storage scenarios with different energy demand features. This study is novel in two ways. Firstly, hierarchical optimization was conducted with a genetic algorithm using the MSC strategy. Secondly, the machine learning approach was applied in conjunction with the genetic algorithm to perform online optimization for the predictive schedule. Additionally, three main advantages of the methodology proposed in this paper for producing an optimal operational schedule were identified, which are as follows: generic applicability, convenient implementation and good scalability. However, the charging and discharging performance of the battery energy storage system was simulated under short-term operation with regular solar radiation. Long-term operation considering solar fluctuation should be investigated in the future.

1. Introduction

Owing to the increasing consumption of fossil energy, environmental issues such as global warming and increasing carbon emissions are becoming increasingly prominent [1]. The increasing demand for electricity and the non-renewable nature of fossil energy necessitate the move towards renewable energies. As a result, cleaner renewable energy resources and a more sustainable use of this energy is urgently required [2]. Compared with other power generation technologies such as wind, biomass and nuclear energy, solar energy resources are widely distributed and feature the most ideal characteristics of sustainable development without any fuel consumption or pollution and carbon emissions [2,3]. However, there are several significant issues with solar energy sources including high intermittence, a large footprint and a low energy density and energy conversion efficiency. Moreover, they rely on factors beyond human control, such as sunlight radiation and climatic conditions [1]. Thus, building an energy storage system is beneficial when the solar energy sources, specifically solar panels, are not producing sufficient energy [2]. Battery energy storage offers an effective solution to reduce the burden of intermittent PV production on the grid and to increase the penetration of PV in residential houses. There are a variety of battery energy storage systems, and they all require one battery or a “bank of batteries”, i.e., two or more batteries [4,5]. Among them, the solar photovoltaic (PV) system has become the most commonly used technology in the building sector due to its outstanding advantages of low cost [4], eco-friendliness and ease of integration into buildings [6]. Moreover, solar photovoltaic systems can increase the self-consumption of battery energy storage and therefore contribute to a decentralized renewable electricity system [4,7,8].
There has been a wealth of research on the operational performance of battery energy storage systems [3,4,5,6,7,9,10,11,12,13,14,15,16,17,18]. Focusing on a hybrid energy system based on solar photovoltaics, Khan [17] studied various parameters of economic feasibility, sizing strategies with logical advancement to enhance their utilization, their arrangement, and future prospects. He also presented a brief review on developments in optimization techniques, reliability index and cost analyzing techniques for hybrid renewable energy systems. Zhang [3] analyzed the load profile of a multi apartment building in Gothenburg and the PV production profile under local weather conditions. It was found that the battery system was superior in achieving a higher self-sufficiency ratio with the same life cycle cost. Zhang [18] developed a mathematical model of a photovoltaic battery system to investigate its performance based on various economic and technical indicators. This study demonstrated that the integration of battery energy storage could increase the value of self-consumption and self-sufficiency rates while increasing the payback period.
Although battery energy storage systems provide a better alternative for solar energy exploitation and their operational performance has been thoroughly studied, there exists major issues in terms of feasibility and efficiency. These limitations could be overcome by the deployment of a suitable operation strategy and optimal operational schedules [19,20,21]. Optimal charging and discharging schedules would result in a considerable reduction in electricity cost and grid relief as well. In this context, appropriate operating schedules are important to achieve the desired performance of a battery energy storage system. In order to achieve either the optimization of the energy cost, investment cost or any economic profitability criteria, many studies explored appropriate operational schedules or strategies based on different objectives over recent years [4,5,6,19,20,21,22,23]. Schram [4] addressed the mismatch in electrical power between electricity supply from a photovoltaic system and household electricity demand. By using the simulation of batteries and a net present value analysis, the peak shaving potential was assessed under different control strategies of the batteries. Angenendt [21] presented new forecast-based operation strategies for increased battery lifetime and reduced costs. In addition, these strategies were compared to those that are commonly used in terms of the costs and self-sufficiency of the system. The results revealed that the developed forecast-based operation strategy can drastically increase battery lifetime and reduce the levelized cost of electricity by up to 12%. Talavera [22] proposed a method to size the generator for a PV self-consumption system based on cost-competitiveness, maximizing direct self-consumption. The results obtained suggest that a residential direct PV self-consumption system with an annual global irradiation at the optimal tilt angle may be a feasible investment to future owners of these systems. Nyholm [23] developed a model to investigate the self-consumption of electricity generated by a photovoltaic installation. The model maximized household self-sufficiency by minimizing the amount of electricity purchased from the grid and maximizing the level of self-consumption of PV electricity. The simulation results revealed that when a battery was used to store PV-generated electricity in-house, the self-sufficiency could increase by 12.5~30 percentage points for the upper range of the investigated PV capacities.
Despite several existing works dedicated to the evaluation of battery energy storage systems, the research on optimal operation schedules or strategies of the household system still leaves substantial areas to be explored. In previous studies, researchers typically focused on finding problem-solving strategies in the situations with only one or two evaluation indicators, lacking a comprehensive evaluation of the integrated objective. These methods led to narrower conclusions. For example, they usually focused on the advantages of the MSC strategy in maximizing PV generation from SCR, and rarely assessed other aspects of the strategy such as economic performance, cell ageing and building energy demand imbalance ratio. These factors are also important and should therefore be evaluated. Secondly, existing research is mostly limited to pure simulation without validation by actual energy demand data collected from real building terminals. Moreover, a general model of battery systems suitable for forecast-based operation scenarios with different energy demand features has rarely been explored. Therefore, the existing literature in this area generally discusses individual aspects of this problem without a detailed, holistic analysis of the results with regard to practicality in implementation.
With decreased subsidies for PV electricity in several countries, increased self-consumption could raise the profit of the PV system and lower the stress on the electricity distribution grid. Aiming at full self-consumption, the maximizing self-consumption strategy (MSC) is one of the most widely used operational strategies for PV systems. It has been widely used for the capacity optimization and performance evaluation of battery energy storage systems. It can be expected that the MSC strategy will become more popular as financial subsidies continue to decrease, especially for distributed systems. In this paper, we built a comprehensive evaluation model for optimal operational schedules of battery energy storage systems based on the maximizing self-consumption strategy and genetic algorithm. We first analyzes the basic requirements for solar-power storage and explored several questions to determine the energy demand of a typical off-the-grid house. In order to select the best battery storage system, we developed a mathematical model which formulates the dynamic operational characteristics of PV modules and the battery charge/discharge process, and several important performance aspects including techno-economic performance, battery aging as well as power supply imbalance ratio. For three types of batteries that are considered as suitable options for energy storage, all the techno-economic indicators including battery charge/discharge performance, techno-economic performance, battery aging, aiming at achieving an overall and comprehensive assessment of each strategy. Moreover, as building energy demand acts as the optimization objective for the energy storage strategy, an evaluation of the real time energy demand of buildings with individual preferences and characteristics is essential to overall regulation and optimization. To generalize our method of forecast-based operation scenarios with different energy demand features, we applied the machine learning approach to train the artificial neutral network with samples from combinations of different building envelope areas and outdoor temperatures as well as different indoor occupancy patters and different numbers of electrical appliances in operation. Afterwards, our model was tested in a typical American house to validate its robustness and predictive performance. The findings of this study are intended to provide guidance for decisionmakers to determine the most suitable operation strategy for battery energy storage systems.

2. Materials and Methods

2.1. Configuration of the Battery Energy System

The battery energy storage system adopted in this study is depicted in Figure 1. It consists of a solar panel and battery bank as the core energy storage device. The solar panel converts solar radiation into an electric current to charge these batteries, while these batteries are connected in parallel and are powered by solar radiation. The battery energy storage system starts operation during the day when enough sunlight can be collected by the solar panels. However, it is powered off at night when there is no solar energy supply. After being fully charged during the day, the battery bank discharges at night as the only energy source for the building terminal. To keep the battery energy storage system running smoothly, three major components are also necessary, including the DC/AC converter, MPPT controller and charge/discharge controller. The DC/AC converter is equipped for the conversion of a direct to alternating current; and MPPT is the maximum power point tracking controller that ensures maximum PV output [6,24]. Depending on the immediate energy demand and the amount of PV power generated, PV power can flow to the load or to the battery bank. As for the charge/discharge controller, it is designed to regulate the charging and discharging process of the batteries. The optimal operational schedule for the hybrid system requires a good knowledge of the energy status of each component. The following subsection focuses on the mathematical modeling of the battery storage components.

2.2. Mathematical Modeling on the Energy Storage Component

2.2.1. PV Array

Theoretically, the solar panel is modeled using the diode circuit in many studies [6,25]. For our case, the PV array is considered as the most common single diode. Using the four parameters ant the equivalent diagram of a single diode [6], the solar I-V curve is expressed in Equation (1):
I p v = I L I o [ exp ( γ T c ( V p v + I p v R s ) ) 1 ]
where Ipv and Vpv are considered as the panel current (A) and voltage (V), respectively, γ is the PV curve-fitting parameter, Rs is the module series resistance (Ω), IL is the photocurrent (A) and Io is the diode reverse saturation current. All parameters should be determined from experiments or real operation. The power extracted from the panel is the product of the output current and the voltage. To obtain the maximum power via the MPPT maximum power extraction method, the output current is given as Equation (2):
I p v = max ( I p v V p v )

2.2.2. Battery Bank

The equivalent circuit of the battery bank was modeled as a simple electric battery cell. The most significant elements of a battery’s energy state are the state of charge (SOC) and state of health (SOH). SOC depends essentially on the charging and discharging process. Indeed, SOC is defined as the available energy compared to the battery rated capacity, as given in Equation (3).
S O C ( t + 1 ) = S O C ( t ) + ϕ P b , c h ( t ) η c h E b Δ t ( 1 ϕ ) P b , d i s ( t ) E b η d i s Δ t
where Eb denotes the rated battery capacity during an entire roundtrip (kWh), t is time iteration (h), Pb,ch is the battery charging power (kW), Pb,dis is the discharge power (kW), ηch is the battery charging efficiency (96%), ηdis is the discharge efficiency (96%), Δt is time step for calculation (Δt = 1 h for this study), Φ is the binary number, 1 represents battery charge and 0 represents battery discharge.
Another factor should be properly modeled is battery aging which exerts a considerable influence on the operation cost and maintenance [3,6,18]. The battery state of health (SOH) denotes the ratio of current usable capacity to the initial total battery capacity. Generally, SOH is given by Equation (4).
S O H ( t ) = 1 0.2 β total ( t )
where β t o t a l is the total aging up to a given time (tot). The total aging of the battery includes calendar aging and cycle aging, which are expressed in Equation (5).
β total ( t o t ) = t = 1 t o t [ 6.6148 S O C ( t ) + 4.6404 ] × 10 6 + 0.5 t = 1 t o t | P b ( t ) | Δ t L c y c E b
where the first term in Equation (5) is calendar aging associated with SOC and temperature, while the second term denotes cycle aging. P b   is the battery power (charge/discharge power), and L c y c is the life cycle number of the battery.

2.3. Performance Indicators for System Evaluation

The performance of the battery can be evaluated in relation to different aspects. To choose the best battery for energy storage, three main factors were considered in this study including initial and maintenance cost, continuous power rating and useful capacity, as well as round-trip efficiency. In previous studies, instantaneous power rating was considered for an extreme scenario where energy supply is need suddenly, while this study mainly focused on the continuous charge and discharge performance of batteries. What should be noted is that all the factors considered here influence each other and they were evaluated using a comprehensive techno-economic indicator.

2.3.1. Technical Indicators

There are several widely used metrics available to assess renewable energy production and its contribution to household energy demand. The most accepted technical indicators are self-consumption rate (SCR) and self-sufficiency rate (SSR), respectively [6,18]. SCR is concerned with the consumption of PV power. It is defined as the proportion of PV generation consumed by the building terminal and batteries to the total PV power generated.
S C R = E p , d + E p , b E p v
where Ep,d is the total PV direct-used generation supplied to the users (kWh), Ep,b is the PV production used to charge the battery bank (kWh) and Epv is the total PV generation (kWh).
SSR emphasizes the load demand. It is equal to the ratio of the total PV generation stored by the battery and directly consumed by the load to the total load demand, formulated as:
S S R = E p , d + E p , b E d e
where E p , b denotes the load satisfied by battery discharge (kWh) and Ede is the total load demand (kWh), while the load cover ratio (LCR) is defined as the ratio of energy supplied by the battery energy storage system to the load demand, which is expressed as:
L C R = E p , d + E b , d E d e
where Eb,d is the total energy covered by batteries to the load (kWh).

2.3.2. Economic Indicators

In terms of the weekly operating performance of the battery energy storage system, it is convenient to determine the total cost as shown in Equation (9).
C t o t a l = t = 1 168 C p v ( t ) + C b ( t )
Cpv(t) is the cost for the operation of the PV system at the t-th time step, which could be calculated as:
C p v ( t ) = P p v ( t ) c p v Δ t
where Ppv(t) is the PV generation at the t-th time step (kWh), cpv represents the average cost of PV generation ($/kWh), which in this study was taken as 0.06886 $/kWh [6].
Cb(t) denotes the maintenance cost due to battery degradation at the t-th time step:
C b ( t ) = β total ( t ) c b E b
where βtotal(t) is the battery aging at the t-th time step. cb is the unit capacity cost of the battery ($/kWh) including the initial investment and maintenance cost [6], as given by Equation (12).
c b = c i + c m
where ci is the initial investment per unit capacity of the battery ($/kWh) and cm is the maintenance cost per unit capacity of the battery ($/kWh). For ease, it was taken as 20% of the initial investment.

2.4. Rule-Based MSC Strategy

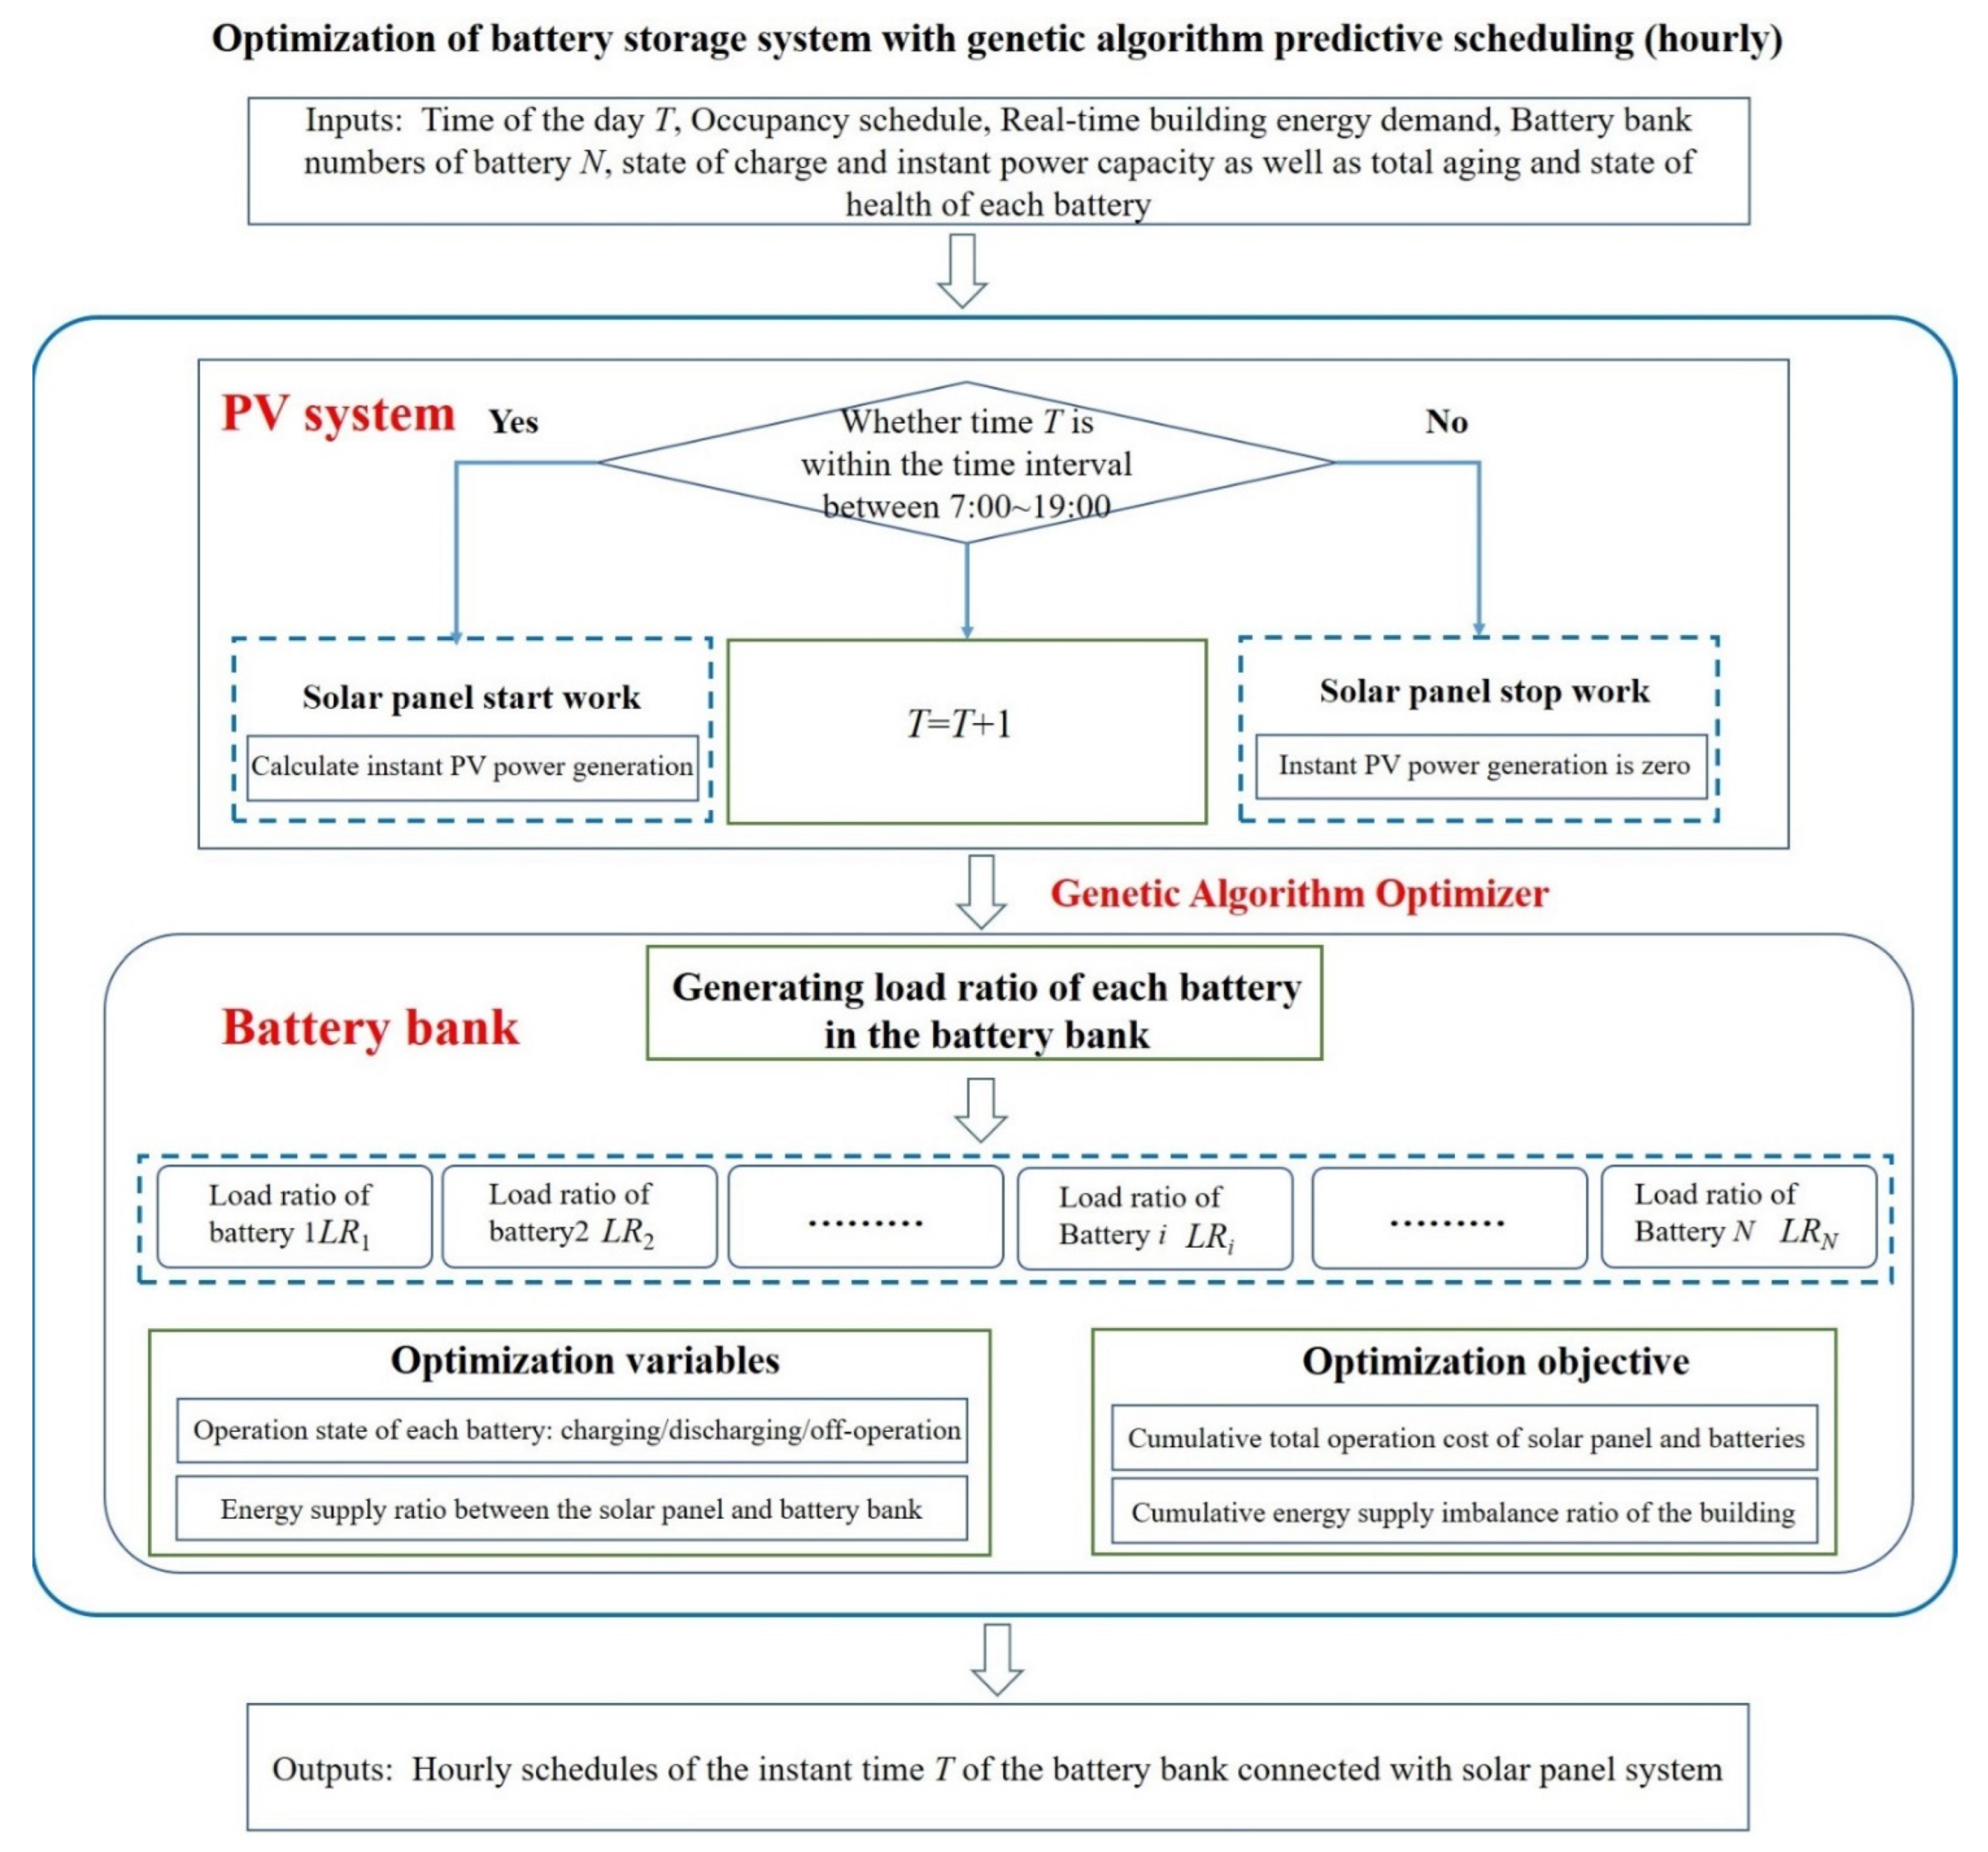
The maximizing self-consumption strategy (MSC) is one of the most widely used operational strategies for PV systems [6,18,21]. MSC is a simple method that attempts to consume the maximum allowable rate of PV generation as promptly and completely as possible [6]. In order to meet the load demand and battery charging needs, scheduling for the battery energy storage system by MSC should be optimized as follows: First of all, the current generation of the total PV system should be compared against the building load demand and charging capacity of the battery bank according to its real-time operation condition. If and only if the photovoltaic power generation is greater than the load demand would the battery bank be charged by the excess power energy. Otherwise, if the load demand exceeds the total PV generation, the battery bank should switch to the discharging mode to meet the load demand. As mentioned above, PV generation is greatly influenced by solar radiation, so the solar panel is assumed to only be in operation at 7:00~19:00 in the day due to the weak solar radiation at night.
Operation strategies based on the MSC are described in this part. The operational performance of the PV system throughout the week was simulated based on the genetic algorithm, with a temporal resolution of one hour. According to the principle of overall optimization of the battery storage system, the final SOC of each battery at a certain time step should be determined to achieve the minimum total operation cost as well as minimum power supply imbalance from the first time step to the current time step. The cumulative operation cost at any time t can be calculated using Equation (9), and power supply imbalance is given as:
Min Δ P = t = 1 168 | P d e ( t ) P p v ( t ) P b ( t ) |
P b ( t ) = ( 1 ϕ ) P b , d i s ( t ) η d i s ϕ P b , c h ( t ) η c h
where Pb(t) is the battery charging or discharging power (kW). The parameters are subject to the following constraints:
(1)
Battery charge/discharge rate limit:
| P b ( t ) | P b , lim
(2)
The state of charge (SOC) limit:
In this study, the state of charge (SOC) of the battery was used as the control variable. To prevent over-charging or over-discharging, constraints on SOC at the next time step (t + 1) should be made depending on the power, and can be expressed by Equation (16).
max ( S O C min , S O C ( t ) P b , lim Δ t E b ) S O C ( t + 1 ) min ( S O C max , S O C ( t ) + P b , lim Δ t E b )
where SOCmin and SOCmax are the lower and upper limits for SOC of the battery, respectively.
A flow chart illustrating the MSC strategy is given in Figure 2. Limited by the “rules”, the maximizing self-consumption strategy could not realize some operational requirements of the consumers. Therefore, some optimization methods were also used to determine a suitable energy management strategy for PV systems [26]. We applied heuristic methods, especially the genetic algorithm (GA) for the optimal operational schedule of the battery storage system. As is shown in the figure, the optimal schedule includes global optimization for the battery bank at day time and at night. The optimization variables are the operation state for each bank and energy supply ratios assigned to the batteries under charging or discharging. According to the basic principle of the MSC strategy and techno-economic evaluation of the system, as much of the photovoltaic power supply as possible should be stored at the minimum cost. Meanwhile, the real-time energy supply of the system should satisfy the energy demand of the building terminal, and the imbalance mismatch between supply and demand should be as small as possible. Therefore, the optimization objectives are total operation cost for the system and the total energy supply imbalance ratio on the basis of Equation (13).

2.5. Building Energy Demand Prediction

Given the instant energy demand of the building terminal, the operation strategy established in Section 2.4 seems robust and suitable for the PVB system outlined. Moreover, if the building demand changes due to the occupants’ preferences or individual building characteristics, a corresponding battery storage system should also be designed or optimized accordingly. Therefore, a general model with a machine learning approach suitable for forecast-based operation scenarios with different energy demand features was built for a battery energy storage system, as outlined in this section.

2.5.1. Individual Needs and Preferences

To consider individual needs and preferences for the model, the HVAC system energy load should be carefully considered. As a matter of fact, we found that the energy consumption of kitchen and lighting as well as household appliances only accounted for a minor ratio compared to the HVAC load; on the other hand, the HVAC load was highly dependent on the outdoor environment of the building location which can vary dramatically as well as occupants’ preferences including thermal comfort and energy supply inclination. In this section, we describe the selection of different building energy demand cases to construct an artificial neutral network to learn the complex patterns of arbitrary preferences and settings with the aim to generalize the model so that it is adaptable to various battery energy storage optimizations.

2.5.2. Establishment of Building Energy Demand Model

This part expands on a detailed formulation of the real time energy demand of the HVAC system for any buildings with different characteristics. In general, as discussed above, complex nonlinear patterns and relationship between many influencing factors exist for transient HVAC loads. Due to space limitations, occupants’ preferences about thermal comfort and HVAC system settings as well as energy source inclinations are not discussed in detail. We focused on the outdoor thermal environment and indoor occupancy pattern as well as different household appliances used by the occupant. These factors greatly influence building energy demand, thus the PVB system options should also vary according to the objective. Here, we describe three primary ratios of building energy demand including external envelope load (wall and windows), load from people indoors, lighting and household electrical appliances load [27].
(1)
External envelope
The building load due to transient heat transfer of external envelope could be calculated according to Equation (17) [20].
Q e n v e l o p e _ τ = K e n v e l o p e F e n v e l o p e ( T τ ξ + Δ T n )
where τ is the time (hour) for evaluation or prediction, Kenvelope is the heat transfer coefficient (W/m2/K), and Fenvelope denotes the overall heating exchange area of the building envelope. ξ is the time lag, tτ−ξ is the time during which the temperature propagation wave acts on the external wall of the building envelope, Δ is the temperature modification for the corresponding location of the building, and Tn is indoor temperature setting. It should be noted that owing to the transient heat exchange of the external building envelope, the load does not occur immediately but lags for a period. To determine the time lag, the heat transfer of the building envelope could be considered as one-dimensional ideal heat conduction:
T wall τ = a wall 2 T wall z 2
Given the periodic variation of outdoor temperatures during the day which can be described by the Fourier series, time lag expressed by phase angle for heat conduction of the building envelope could be roughly determined as:
β 0 = π a wall τ 0 δ
where δ is the wall thickness, a w a l l is thermal diffusion coefficient and τ0 denotes daily temperature variation periodicity.
(2)
Load from people indoor
HVAC energy load indoors is typical of user preference and individual characteristics [27], which can only be roughly evaluated using Equation (20).
Q p e r p l e _ τ = n p e o p l e q r X τ
where, npeople is the number of people allowed determined by per capita floor area. Usually, the sensible heat dissipation qr of an adult man per hour could be approximated to 70 W. The load factor of the sensible heat dissipation of humans depends on occupancy duration at the building, which could vary from 0.1 to 0.8.
(3)
Lighting and household electric appliances load
The HVAC load due to lighting and household appliances consumption including washing machines, TVs and electrical vehicles, etc., could be determined as [27]:
Q l o a d _ τ = i = 1 m n i W i X τ
where, ni is number of the the i-th type of appliances category, Wi represents single power of the i-th device, Xτ is the simultaneous use coefficient or load factor which could vary in the range of 0.5~0.9 depending on different continuous working hours.

2.5.3. Machine Learning Approach for Building Energy Demand

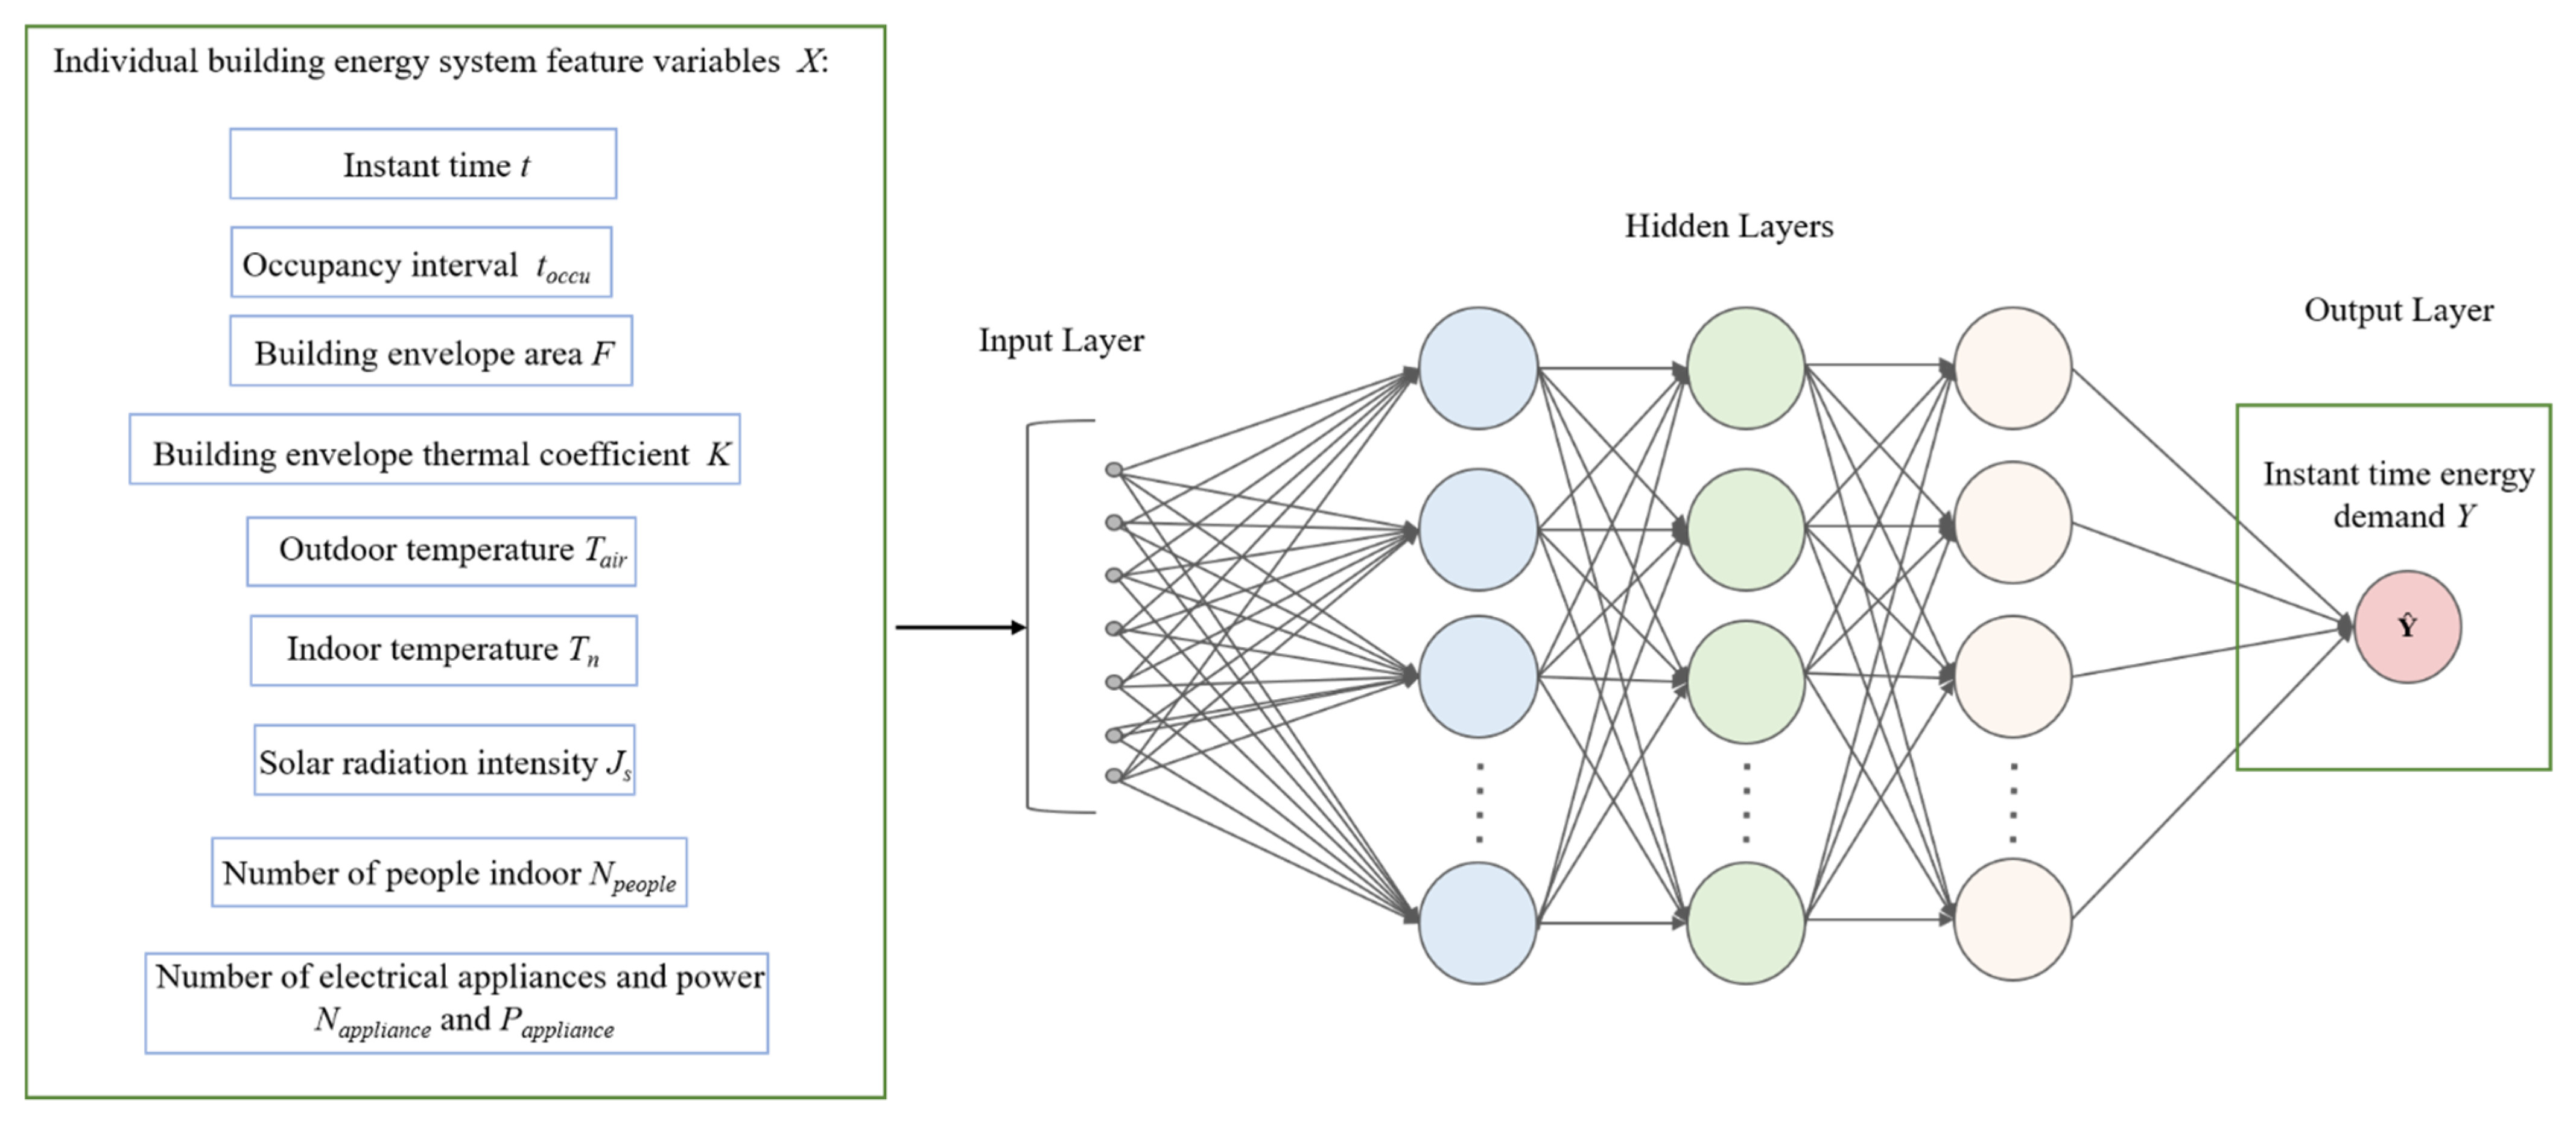
In order to obtain the building energy demand with high generalization and efficiency, we tested different HVAC scenarios, calculating their corresponding energy demand according to Equations (17)–(21) which was labelled as the output, whereas the features that affect the HVAC energy demand were parameterized as the inputs of the ANN models in order to automatically evaluate the arbitrary building energy demand as shown in Figure 3. ANN provides a surrogate model for the efficient prediction of complicated simulation of building load. The ANN model determines input data according to the suitable selection of the most discriminative indicators. In this study, we selected the following indicators: instant time, occupancy interval, building envelope area, thermal coefficient of building envelope, outdoor and indoor temperature, solar radiation intensity, number of people indoors, number of electrical appliances and power, while the output corresponds to instant energy demand. This model was structured as a five-layer neutral network with three hidden layers. All the layers were fully connected to each other, and the activation adopted a sigmoid function. To facilitate the training process, the dataset (including input features and output) was restructured as shown in Table 1 [28,29,30]. Each row represents a specific design feature. The dataset information represents design features with different units that have large variances with various orders of magnitude. Design features with large variances usually dominate the learning process and prevent the ANN from learning correctly from other features [31,32]. To underpin reliable and efficient data-driven prediction, features were standardized by removing the mean and then scaling to unit variance as follows [31]:
Z = X U S
where Z is the standard score of sample X, U is the mean value of the training dataset and S is the standard deviation of the training dataset.
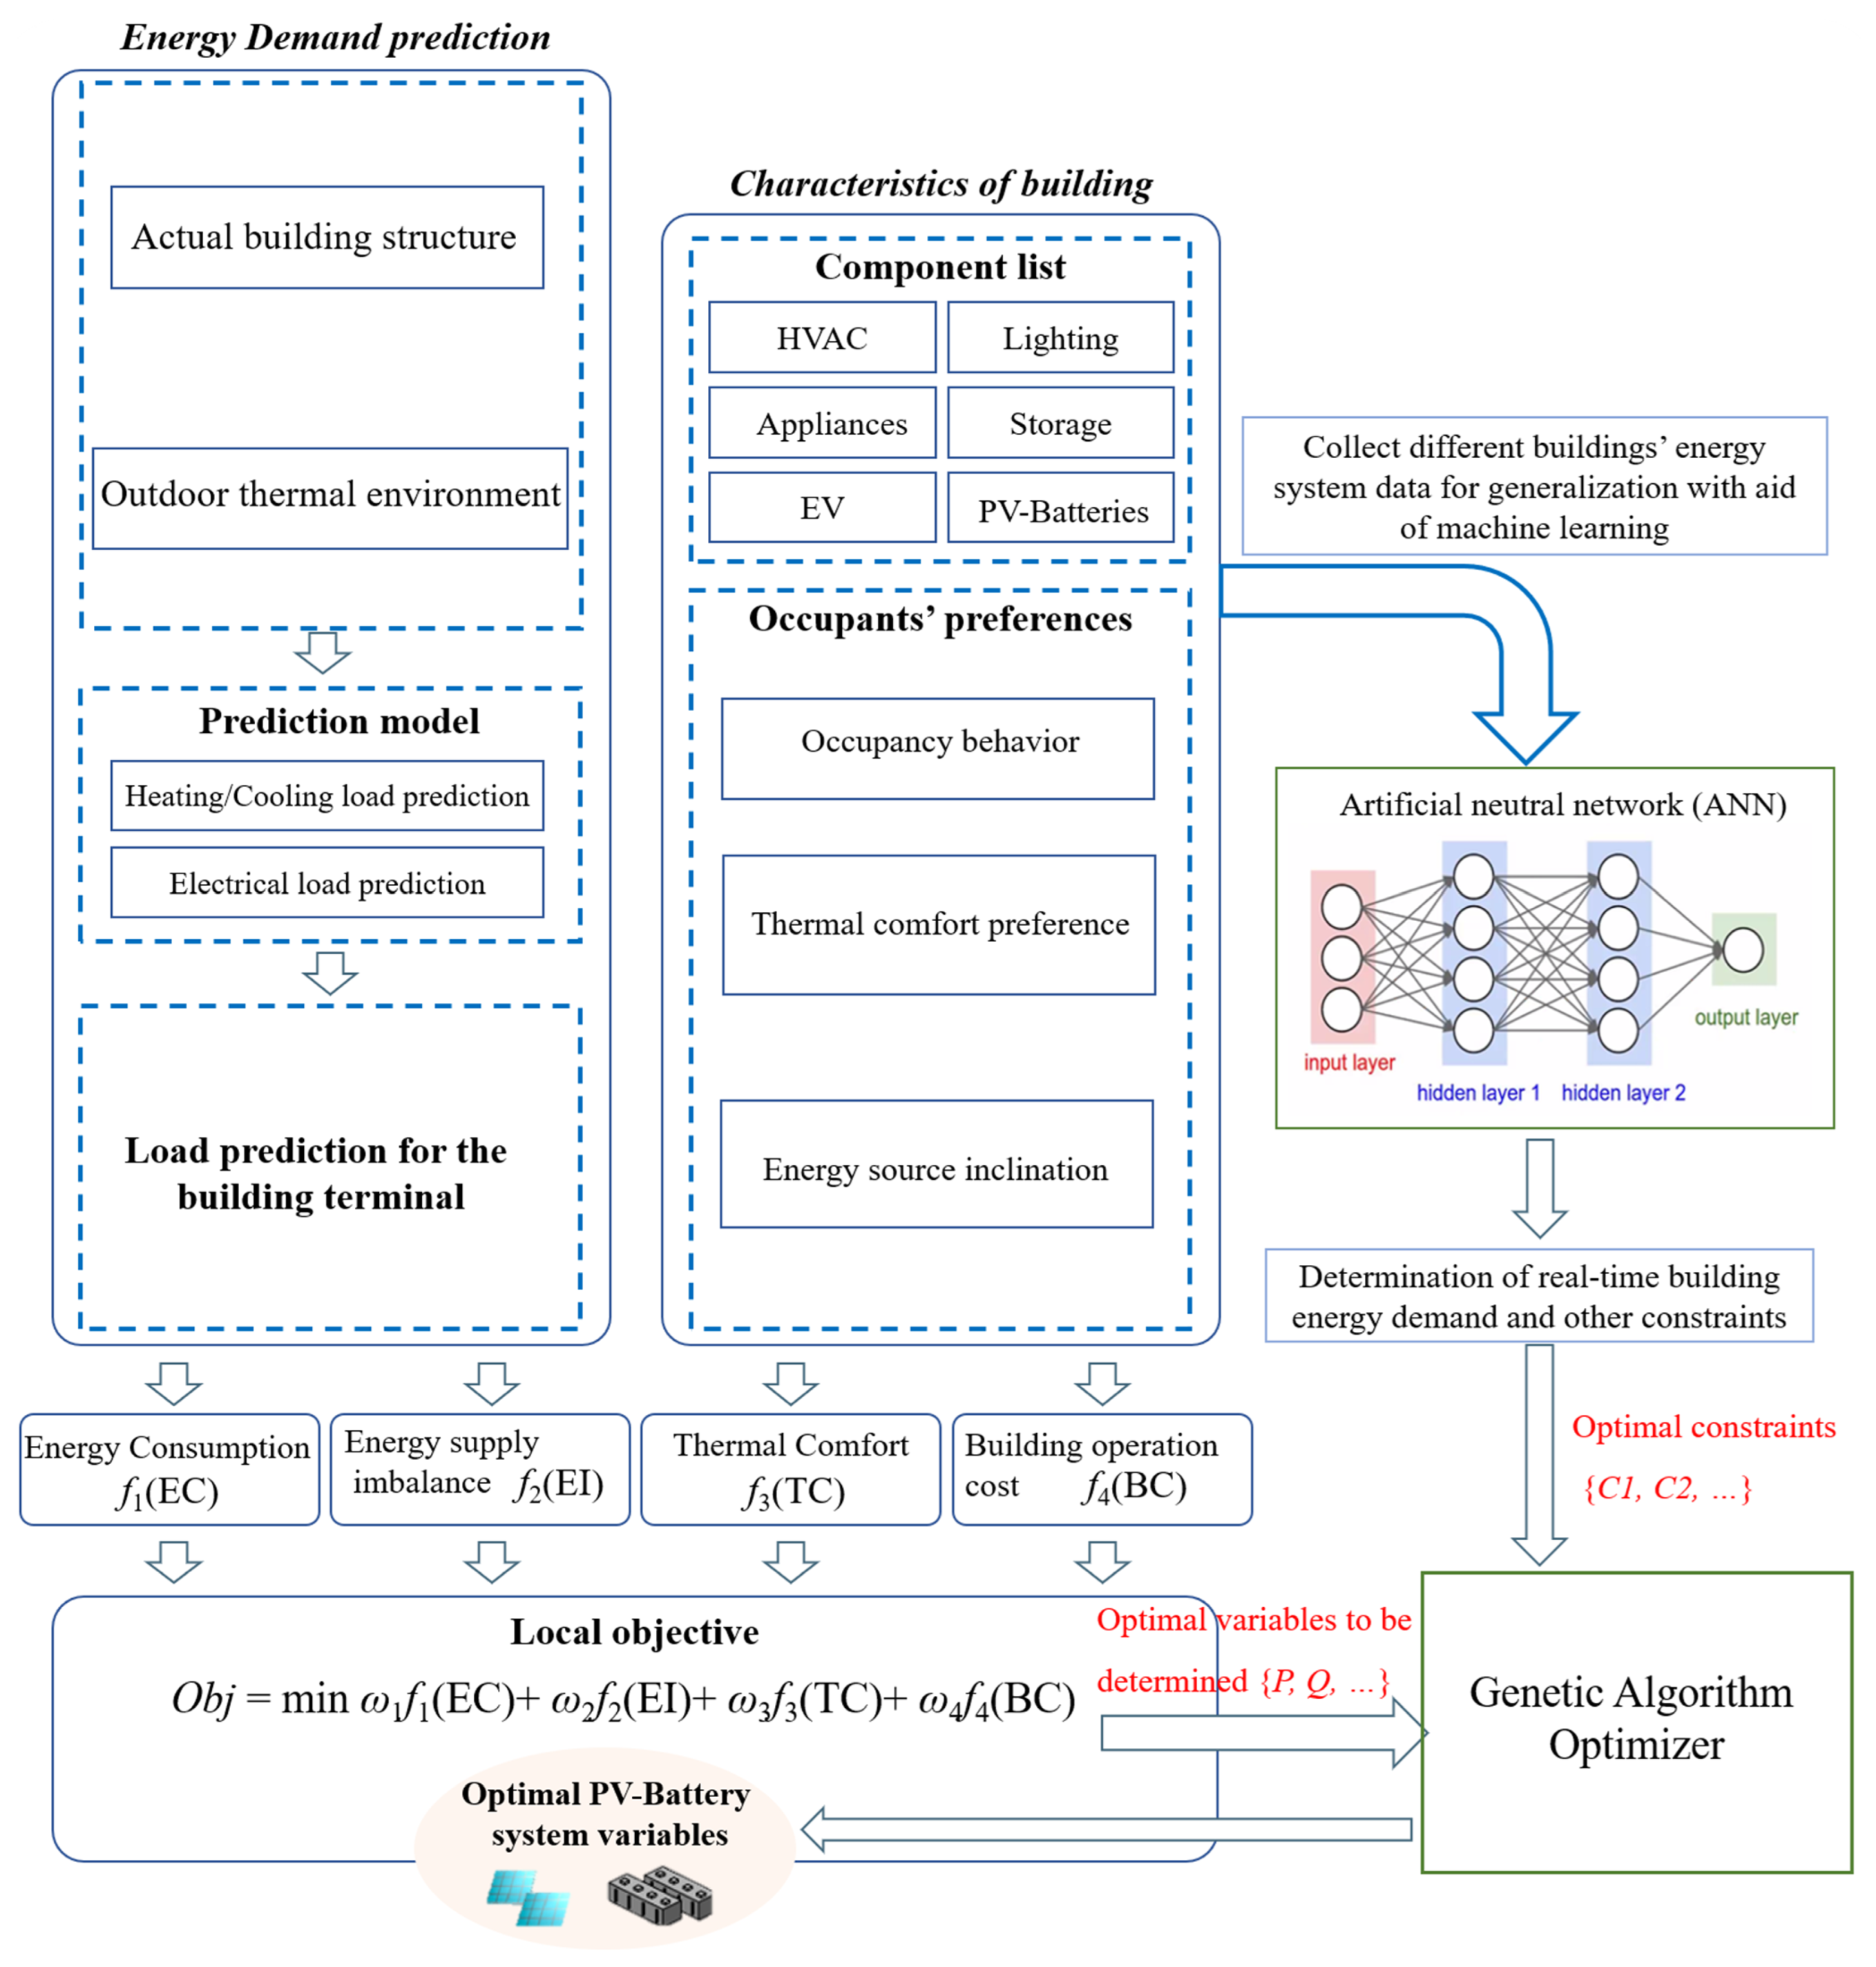
Therefore, optimal operation schedules for individual battery energy storage systems with building energy demand prediction are schematically depicted in Figure 4.
It should be noted that in Figure 4 the energy supply imbalance ratio is defined as a ratio to evaluate whether total energy supply and total energy demand are in good match during the overall charging and discharging of battery energy storage systems. It is mathematically formulated as:
E r r o r imbalance = | E supply E demand | E supply × 100 %
where E s u p p l y (kWh) is the total energy supply by the battery energy storage system and E d e m a n d (kWh) denotes total energy consumption at the building terminal.

3. Results

In Section 2, we proposed battery storage system modeling as well as an optimization approach based on the MSC strategy and GA algorithm. This section first presents necessary data collection and analysis for the battery storage system for a typical house in the USA. Afterwards, optimizations of the best battery storage schedules for a house with a given energy demand as well as scenarios where building energy demand is unknown were performed. Additionally, a comprehensive evaluation of the model was performed.

3.1. Data Collection and Analysis for Battery Storage System

3.1.1. Number of People Using Energy

Taking the USA for example, the average floor area per capita in 2020 was (65 ± 5) m2 [28]. By converting the value in square feet, we obtained an average floor area per capita of 700 ft2 ranging from 646 ft2 to 753 ft2. For a typical house size of 1600 ft2 (about 148 m2), after dividing it by the average floor area per capita, there would be a capacity of 2 to 3 people per house, with mostly 2 people per house.

3.1.2. Appliances That Need Energy

In 2019, residential customers in the United States purchased an average of 10,649 kilowatt-hours of electricity [29]. This works out to be roughly 887 kilowatt-hours per month, or about 30 kilowatt-hours per day. However, there are many factors that influence actual building energy demand [33,34], and the house size has a larger effect because of heating and cooling. According to the specific data collected by the Energy Information Administration in 2015 [28], the average household energy demand for a 2000 sq. ft. house was 11,604 kWh for the year. Table 2 presents the common electrical appliances and their average power consumption in a typical house in the USA [28,29,30].
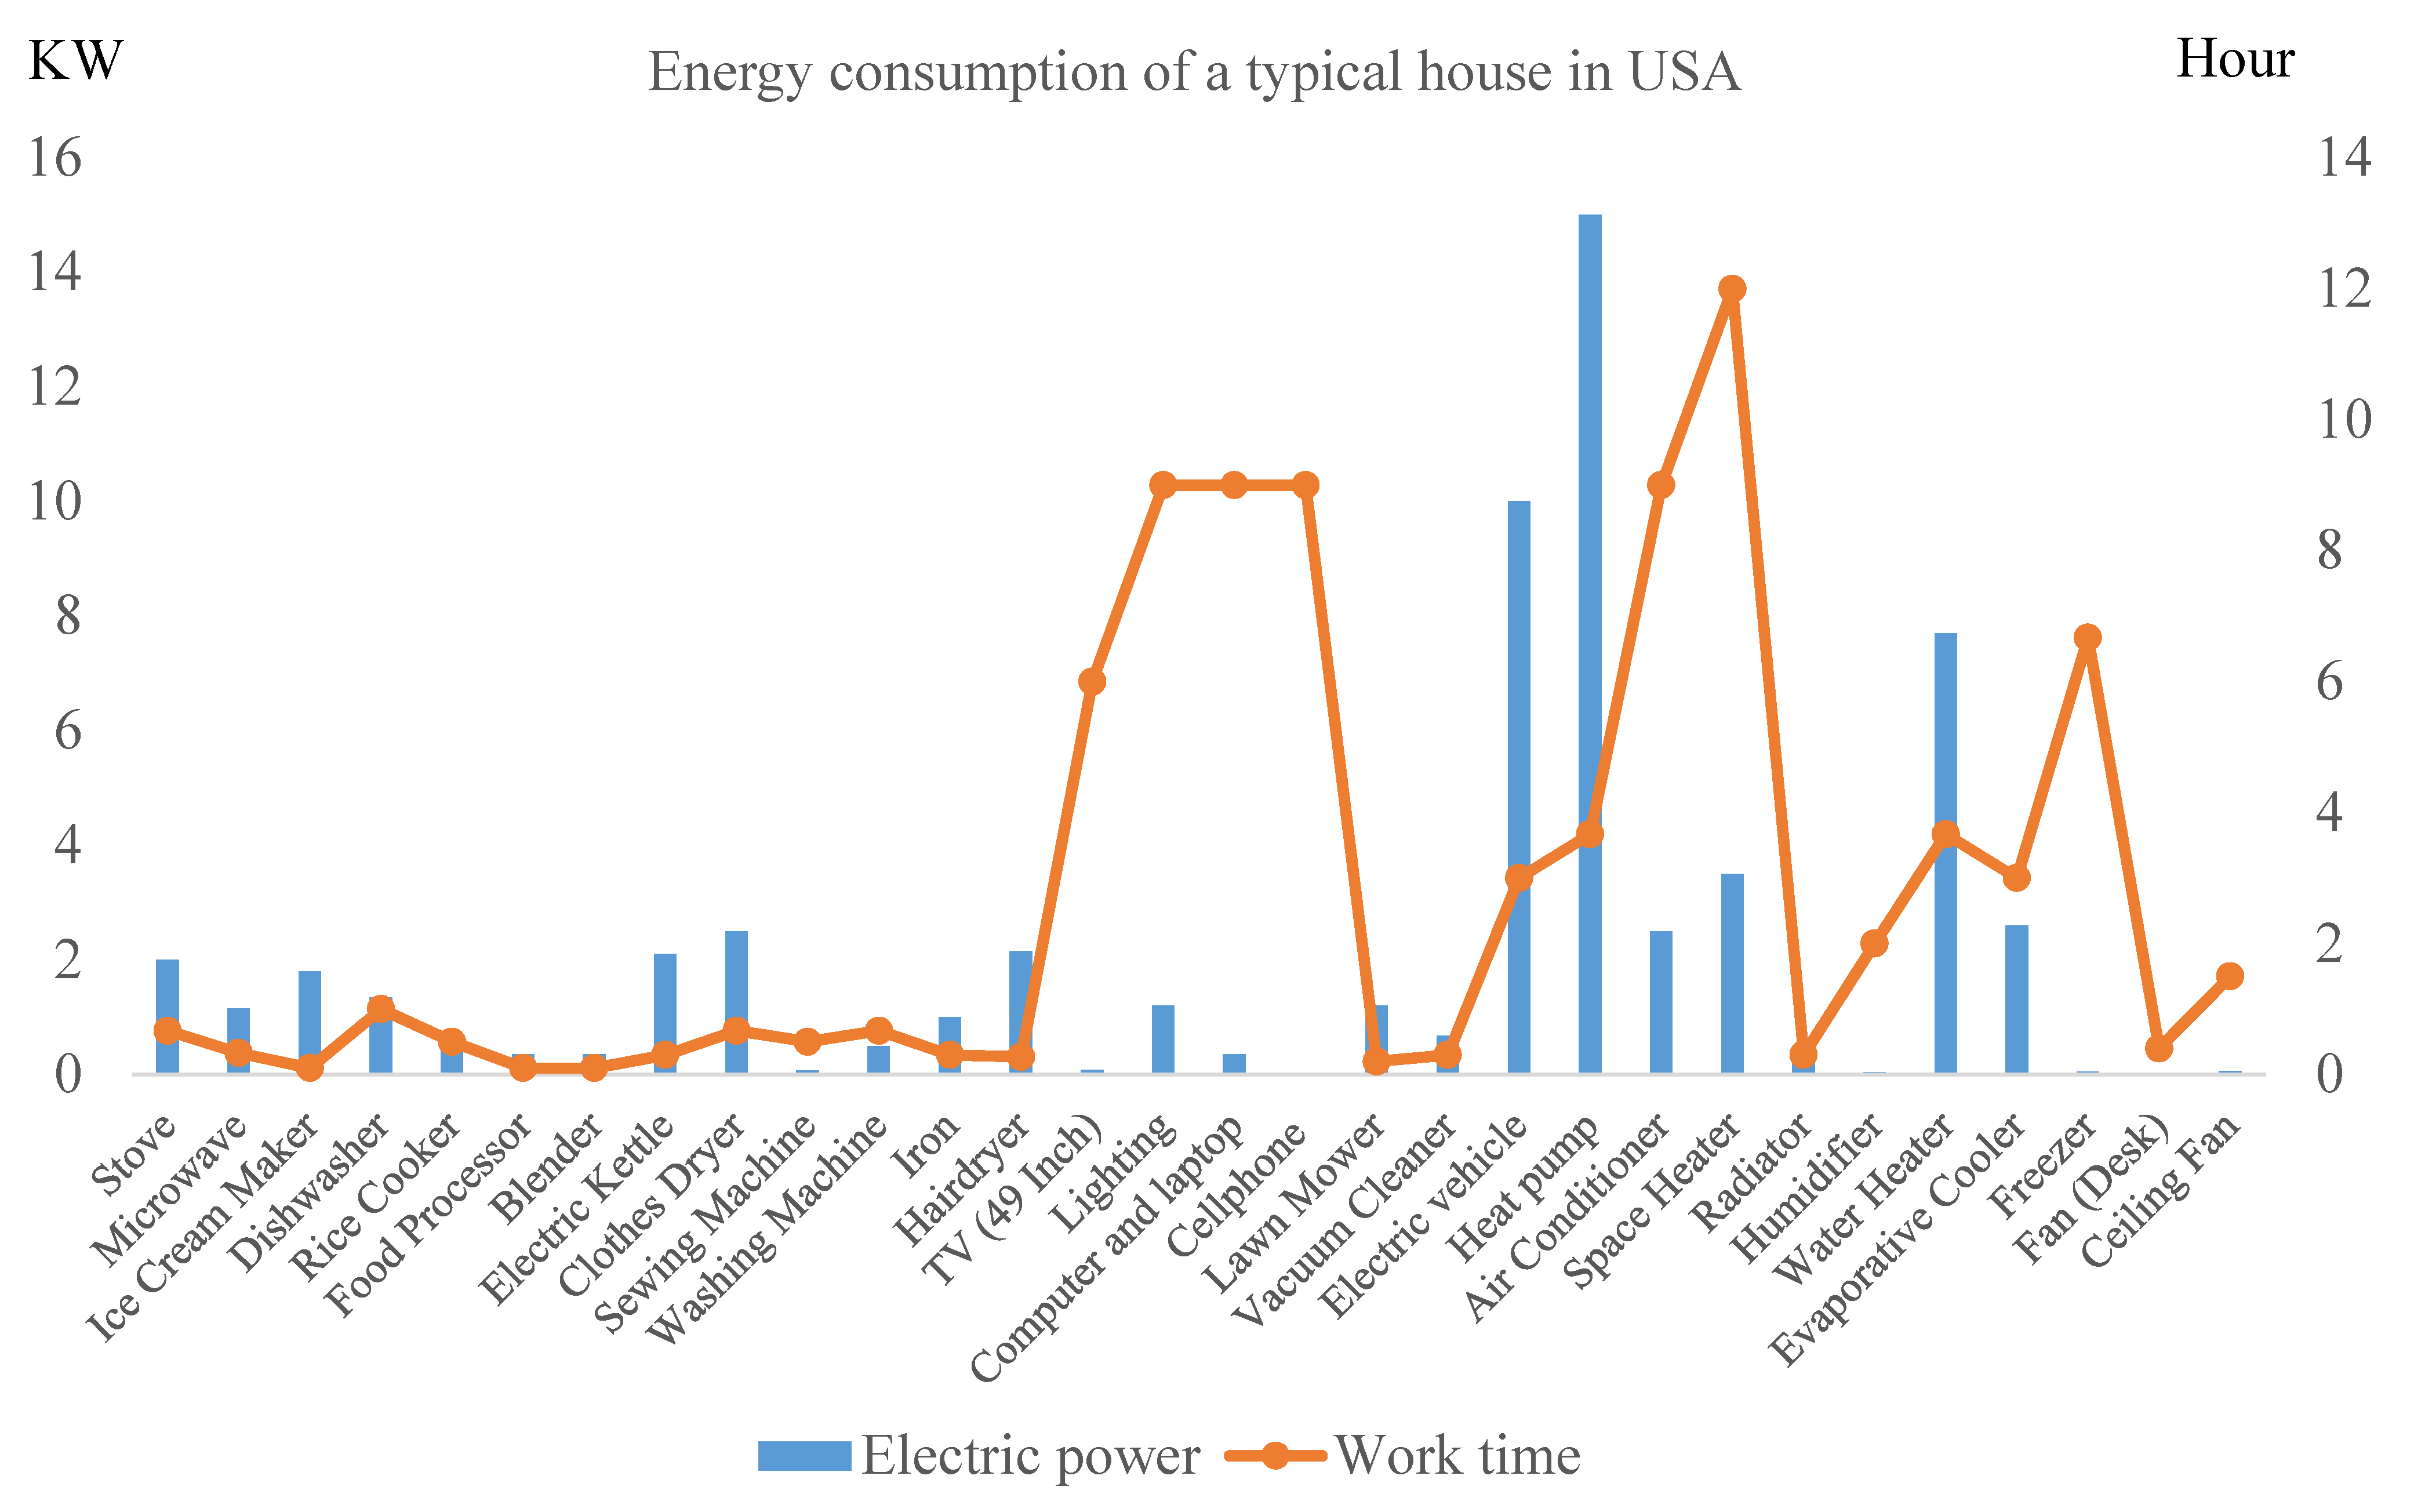
The statistics presented in Table 2 are summarized in Figure 5, which provides a clear comparison of their power rate and work time. It could be seen that there is a noticeable distinction for different electric appliances in terms of working time and energy consumption. Among them, lighting, computer and laptop, cellphone, air conditioner and space heater continued running due to frequent use for most of the day, while the other appliances were in operation for relatively short periods since they are only used when needed. With respect to real-time power consumption, it is extremely high for electric cars, heat pumps, water heaters and air conditioners. Consumption can amount to as high as 10 to 15 kW for electric cars and heat pumps. In general, electric vehicles, water heaters and HVAC systems including heat pumps, air conditioners and space heaters consume relatively larger ratios of electric energy.
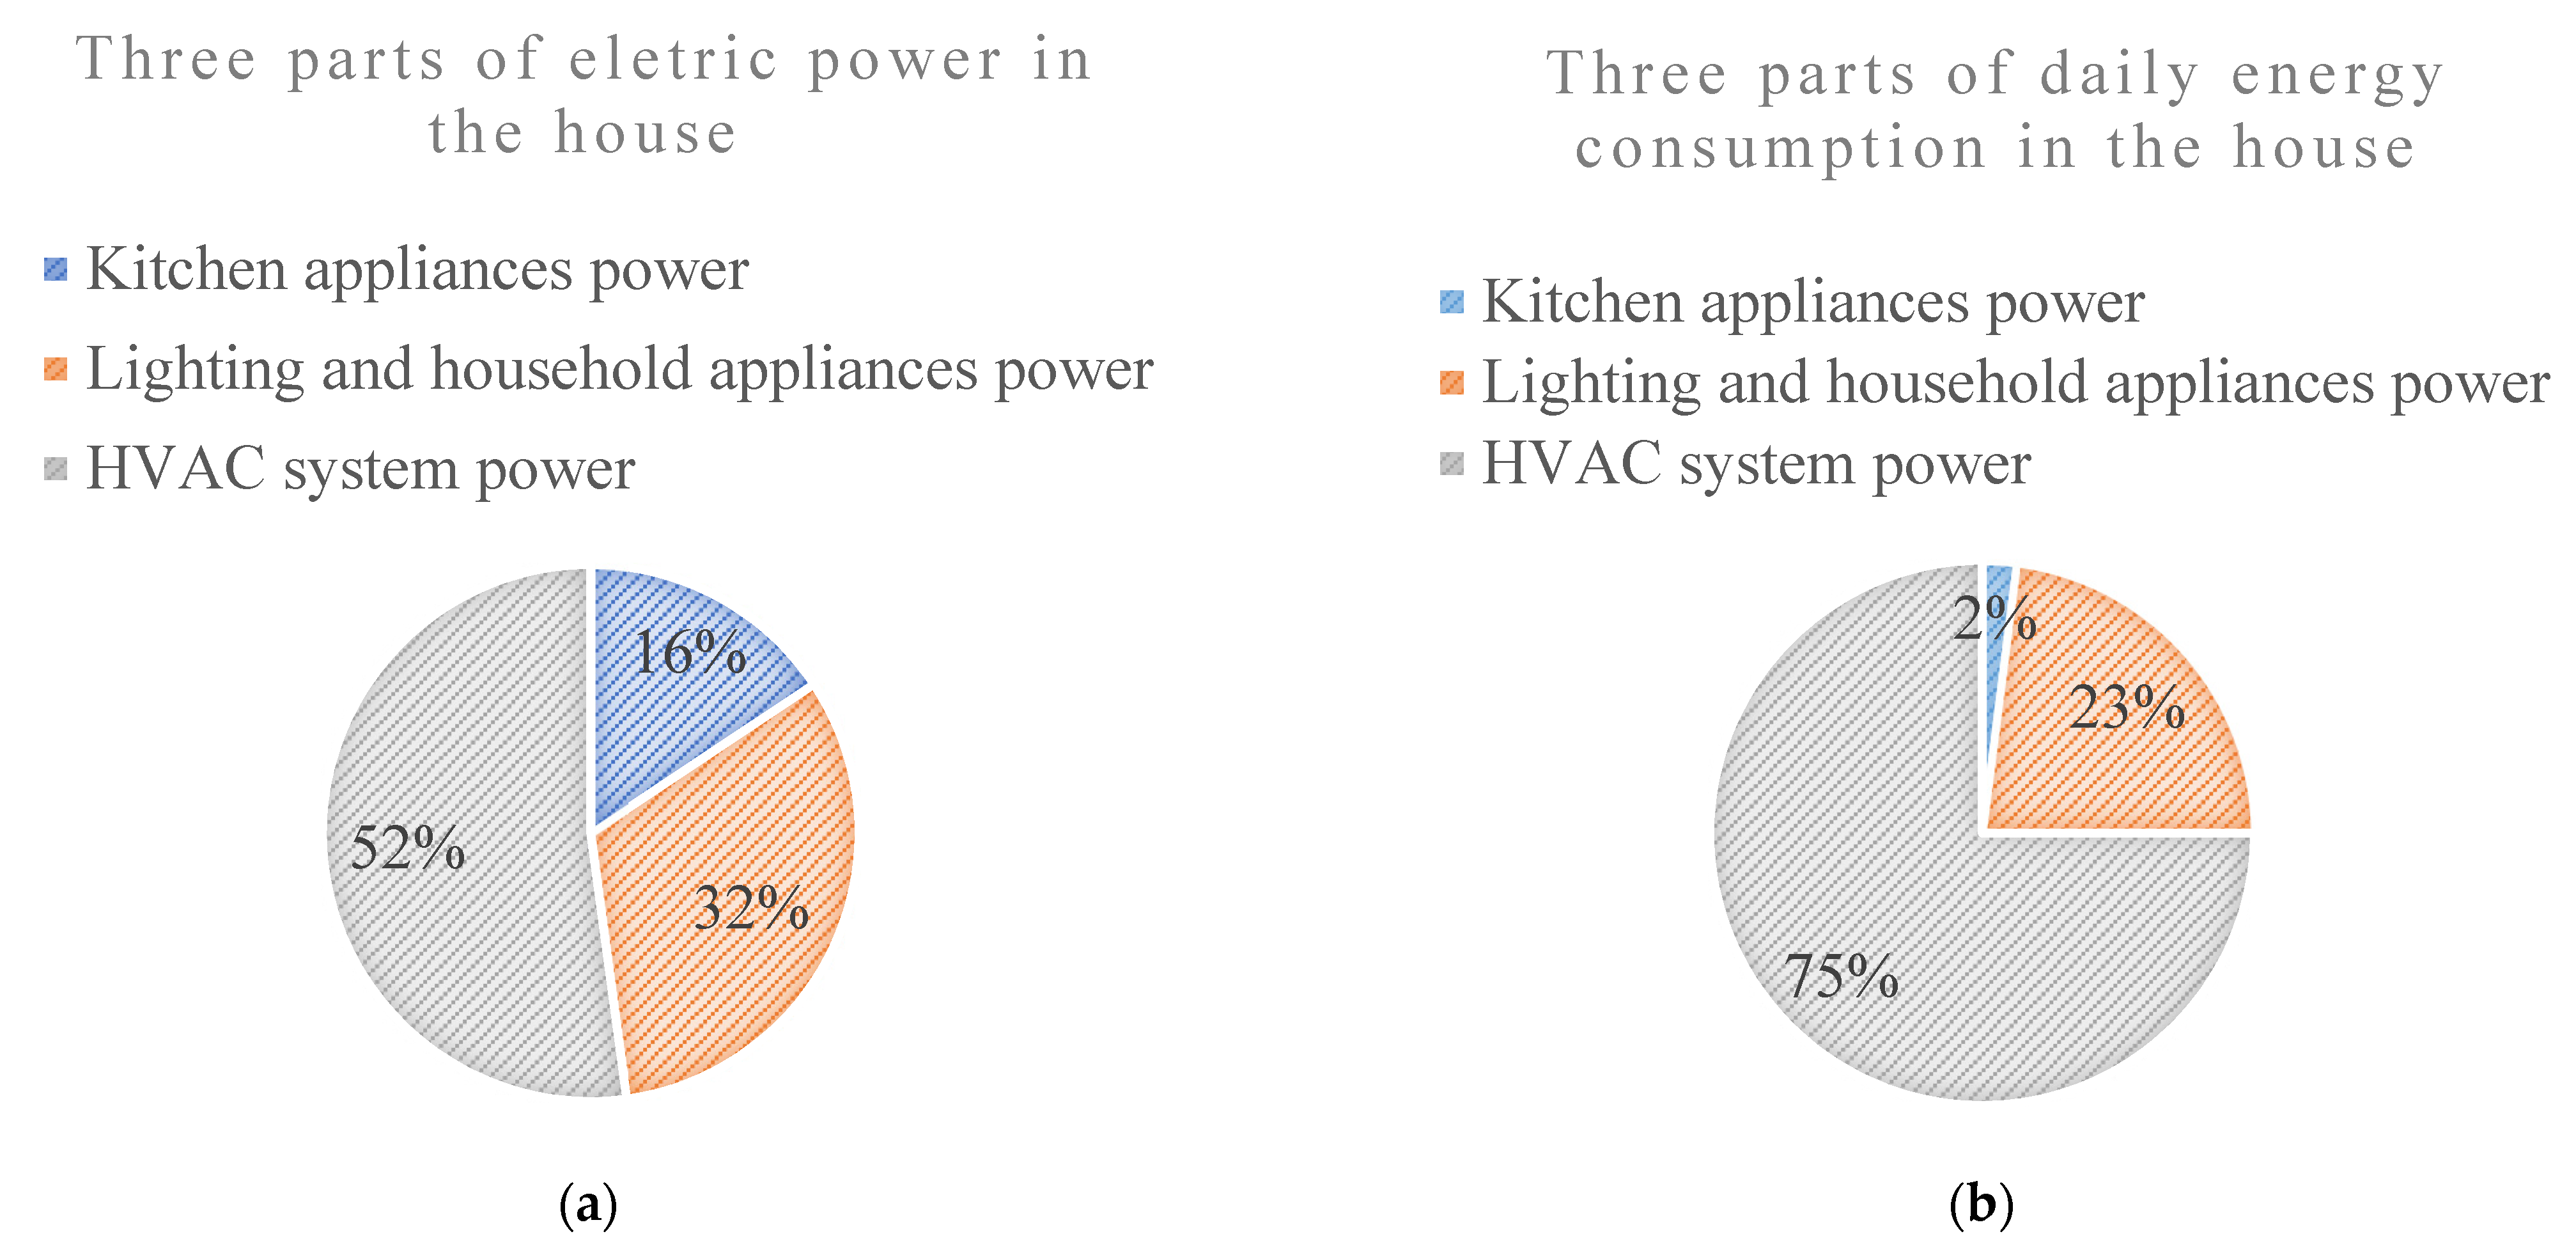
In view of the energy consumption characteristics of these electric appliances, we could further group them into three categories as shown in Figure 6. These three categories include kitchen appliances, lighting and household appliances and HVAC systems. It should be noted that Figure 6a presents the real-time power rates of three groups of electrical appliances according to the statistics from Table 2. We found that the HVAC system accounts for most of the total instant energy demand (kW) of the house, which is as high as 52%. By accumulating real-time power rate of the electric appliance with work time during the day, the corresponding daily energy consumptions for each group could be obtained as depicted in Figure 6b. It was found that the HVAC system would account for almost 75% of the total energy consumption (kW) in daily operation, while kitchen appliances only account for 2% of consumption.

3.1.3. Time Intervals When People at Home Use Energy

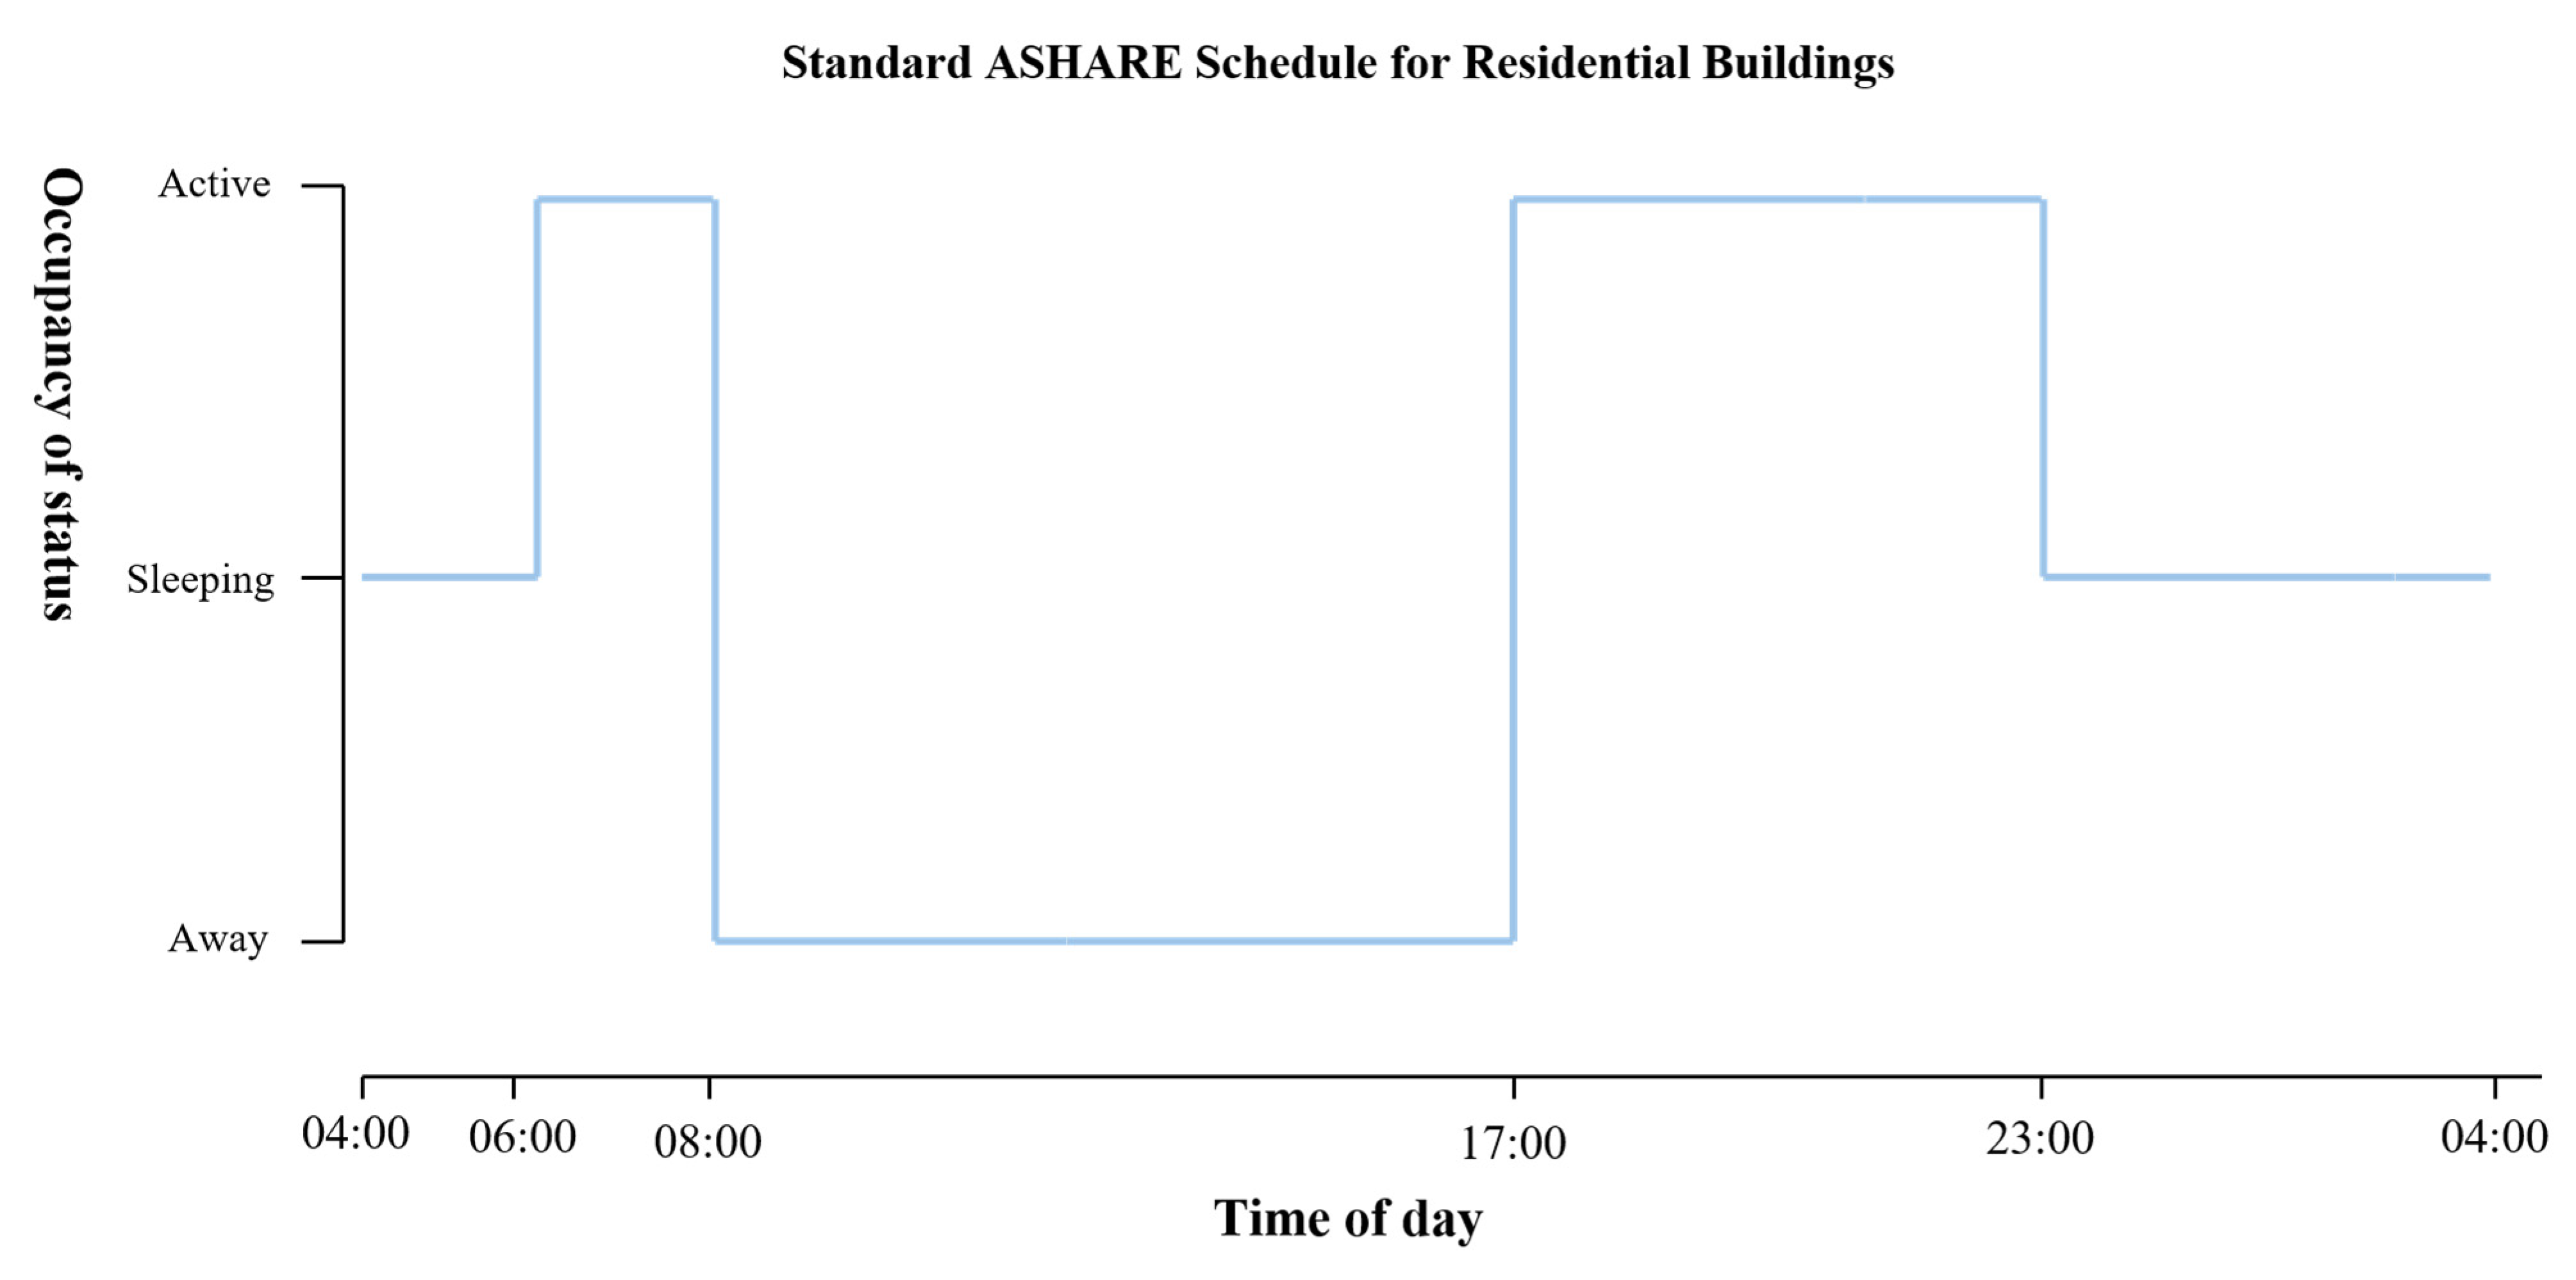
To obtain an idea of the occupancy interval during the daily operation of a typical house, we selected the standard occupancy schedule which is based on the multifamily building schedules of the ASHRAE standard 90.1-1989 [35]. Based on this schedule, a 24 h residential occupancy schedule was developed, as shown in Figure 7. The occupancy fraction was converted into three occupancy statuses, namely active, sleeping and away. Active means the residential house is occupied with greater energy consumption. For example, during the time interval when people are back from work. Sleeping corresponds to the period when people fall asleep at night; therefore, electric appliances such as a computer, cell phone and lighting would be powered off. Lastly, away denotes this house is in vacancy because people leave for work; this period is also expected to be an energy demand valley. Figure 8 indicates that the period from 23:00 to 06:00 is considered sleeping time. While 06:00 to 08:00 and 17:00 to 23:00 correspond to energy demand peak intervals when the owner of the house would wake up for work or return to the house from work. As for the period from 08:00~17:00, the house is not occupied and almost no energy is needed for electrical appliances except the HVAC system which is still running to maintain the thermal comfort of the indoor environment.
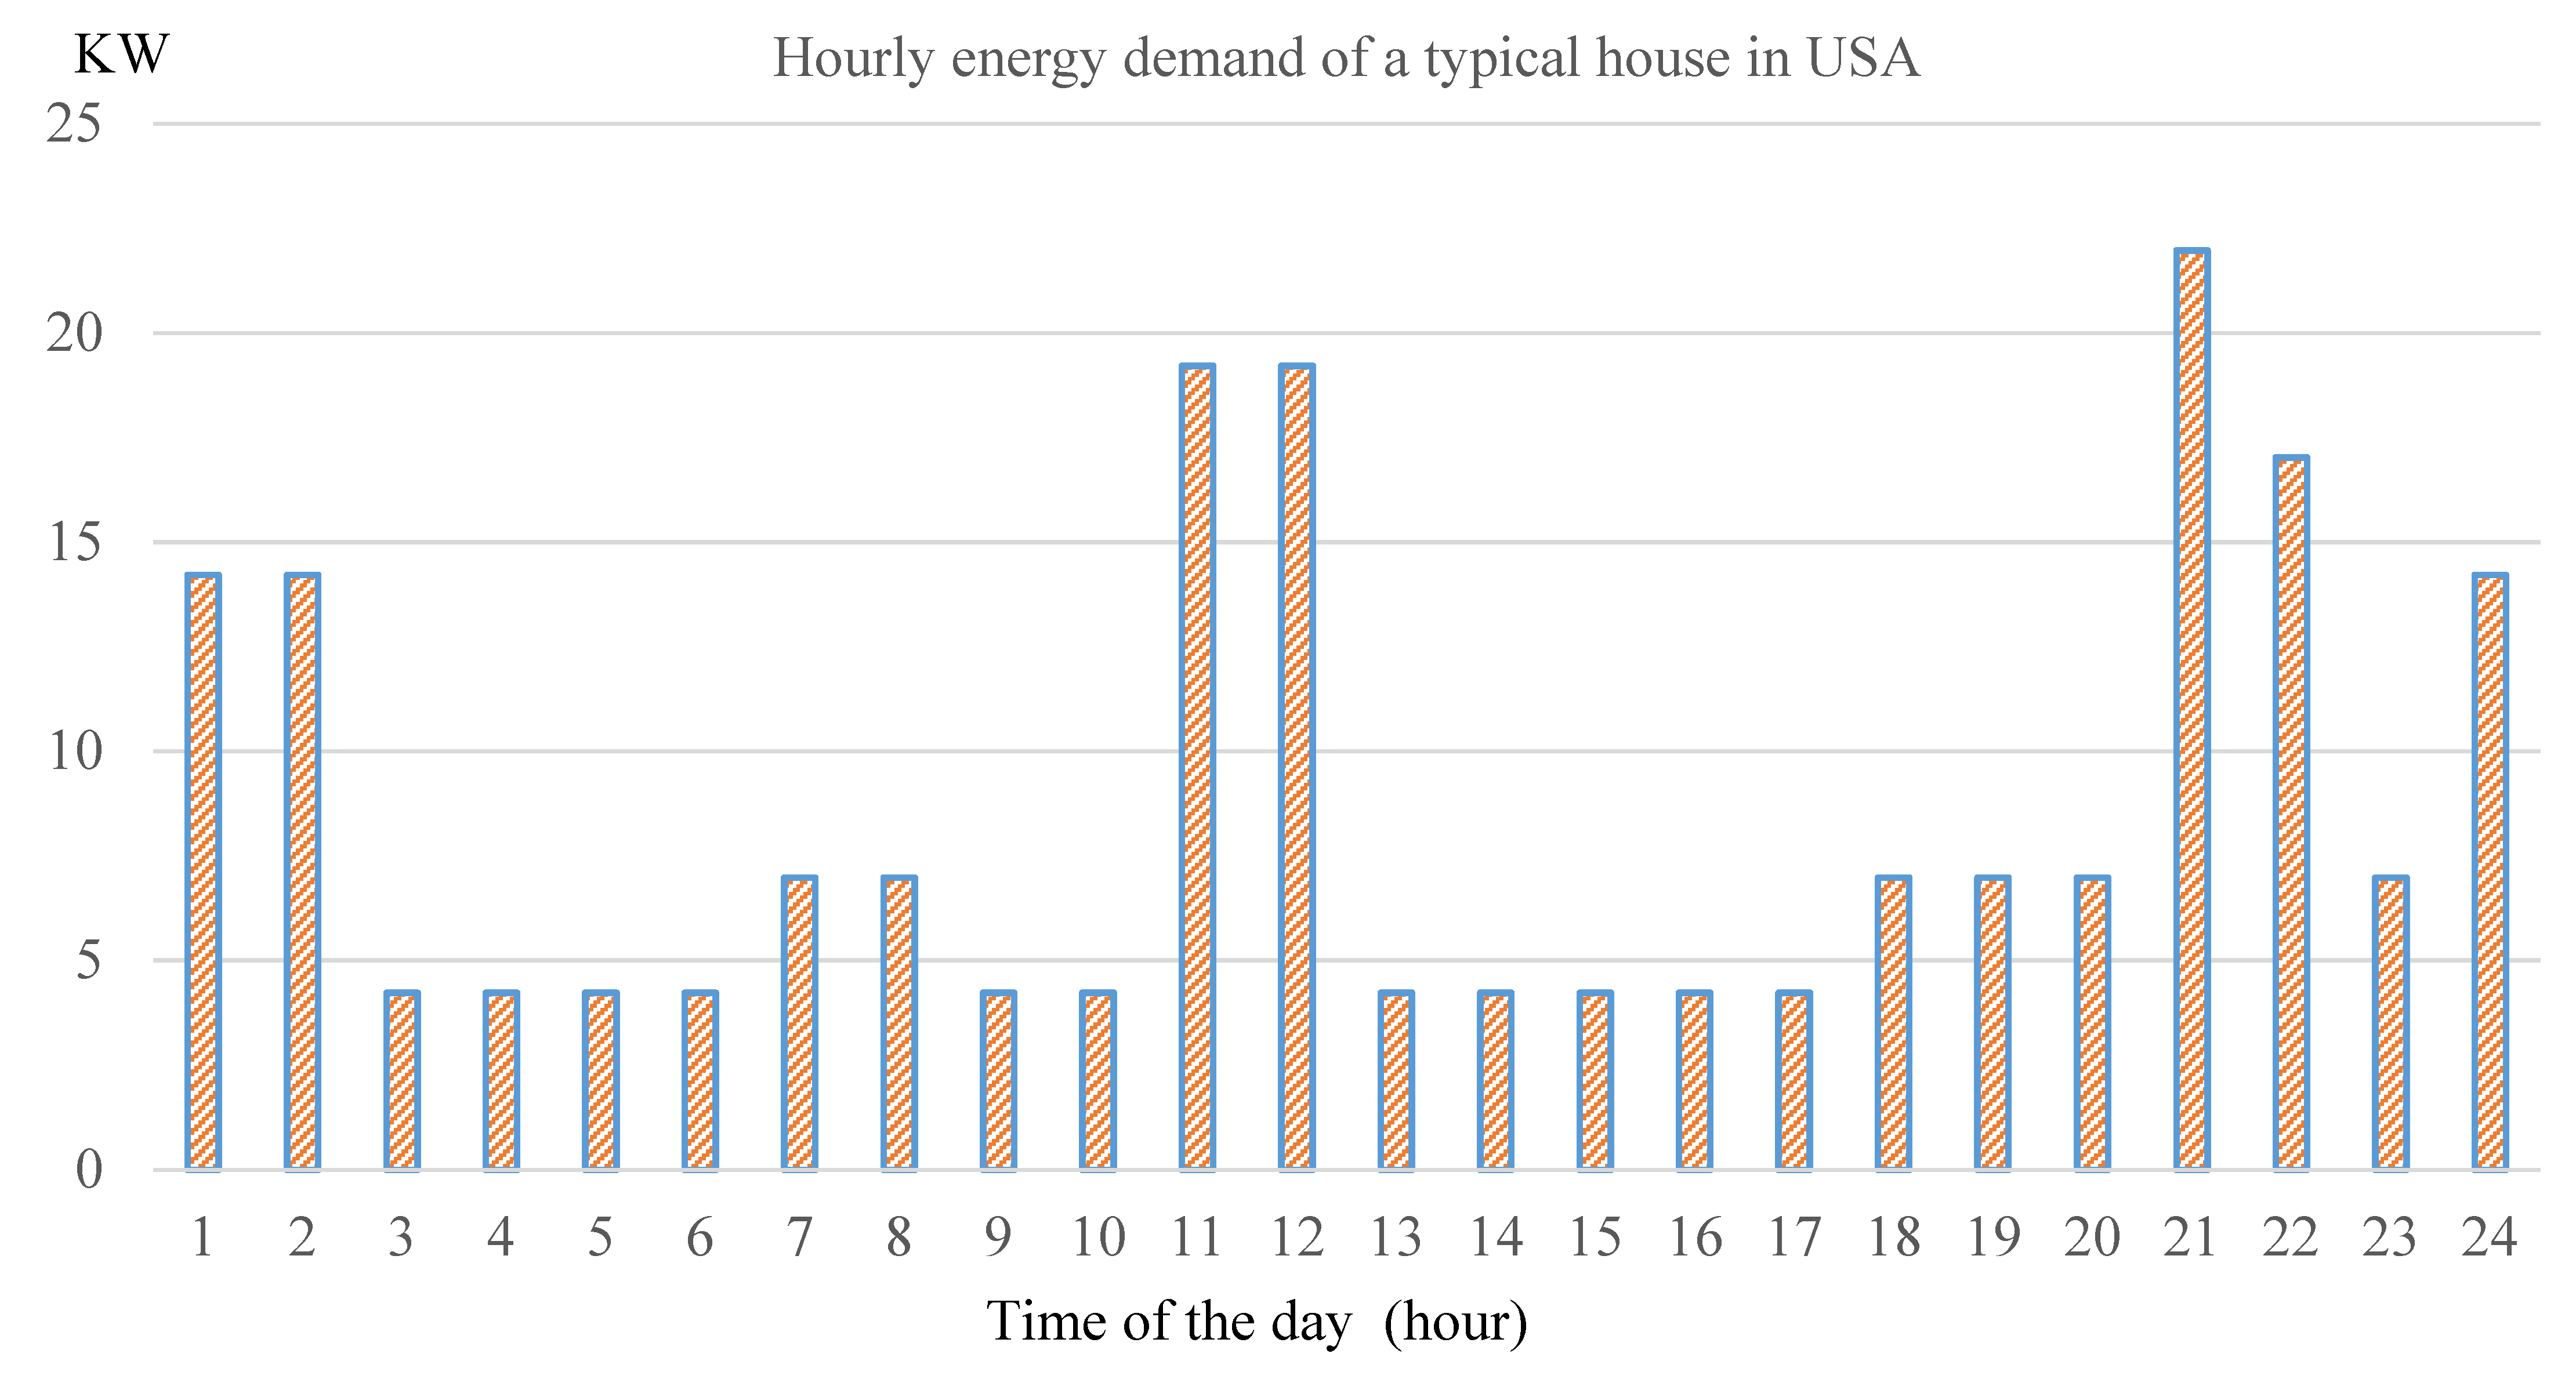
On the basis of the standard operation schedule for residential buildings, we assumed that the HAVC system continues running all the day and that the heat pump would be in operation with the overall work time of 3.67 h during the peak load period which occurs at noon from 10:00 to 12:00 and night from 21:00 to 22:00. Another large electrical appliance is an electric vehicle and it is scheduled to be charged at night from 23:00 to 2:00 with the necessary power rate of 10 kW. With respect to the other appliances, they are all considered to run only during the period when the house is occupied from 06:00 to 08:00 and 17:00 to 23:00. Therefore, the hourly energy demand of the house throughout the day could be determined, as shown in Figure 8. It could be seen that there is a energy demand peak at 1:00~2:00 at mid-night, 11:00~12:00 at noon, and 21:00~24:00 in the evening, while energy demand fluctuates quite smoothly below 5 kW during the other periods. This distribution characteristic of real-time energy demand sets the operational target for the battery energy storage system. It is also the optimization objective, essential for making the optimal operational schedule.

3.2. Operation Schedules of the Battery Storage System for a Typical House

In this section, battery storage options for the typical house were evaluated with an average energy demand of 8.6 kW and HVAC load of 4.21 kW. Specifically, short and long-term battery storage corresponding to weekly, monthly and annual energy storage scenarios are discussed comprehensively.
According to our simulation, the clear cyclic operation of charging and discharging stages of the battery bank could be observed; therefore, the weekly operation would clarify the dynamic operation characteristic of a PVB system with sufficient interpretation and this section mainly simulates and evaluates weekly operation. In view of the sample of batteries used for solar storage, we considered Discover AES, Electriq PowerPod2 and Tesla Powerwall+ as options for energy storage since they share continuous power ratings and are competent for real time power supply to houses. The main specifications of the batteries used in this study are listed in Table 3 and Table 4.
Total energy demand at night could be calculated as 112.48 kWh and the peak load is 22.9 kW; therefore, the minimum number of batteries needed considering the maximum power supply capacity for the three types of batteries are 4, 3 and 4, for overall electric power of 26.6 kW, 22.8 kW and 28.0 kW, respectively. On the other hand, to satisfy the total energy demand at night when the solar panel does not work and only the battery bank discharges power to the house, according to the usable capacity of the batteries, the minimum number of batteries needed are 112.48/7.4 = 16, 112.48/10 = 12 and 112.48/13.5 = 9, respectively. To satisfy both the constraints, the battery bank for the three types should comprise 16, 12 and 9 batteries at least.
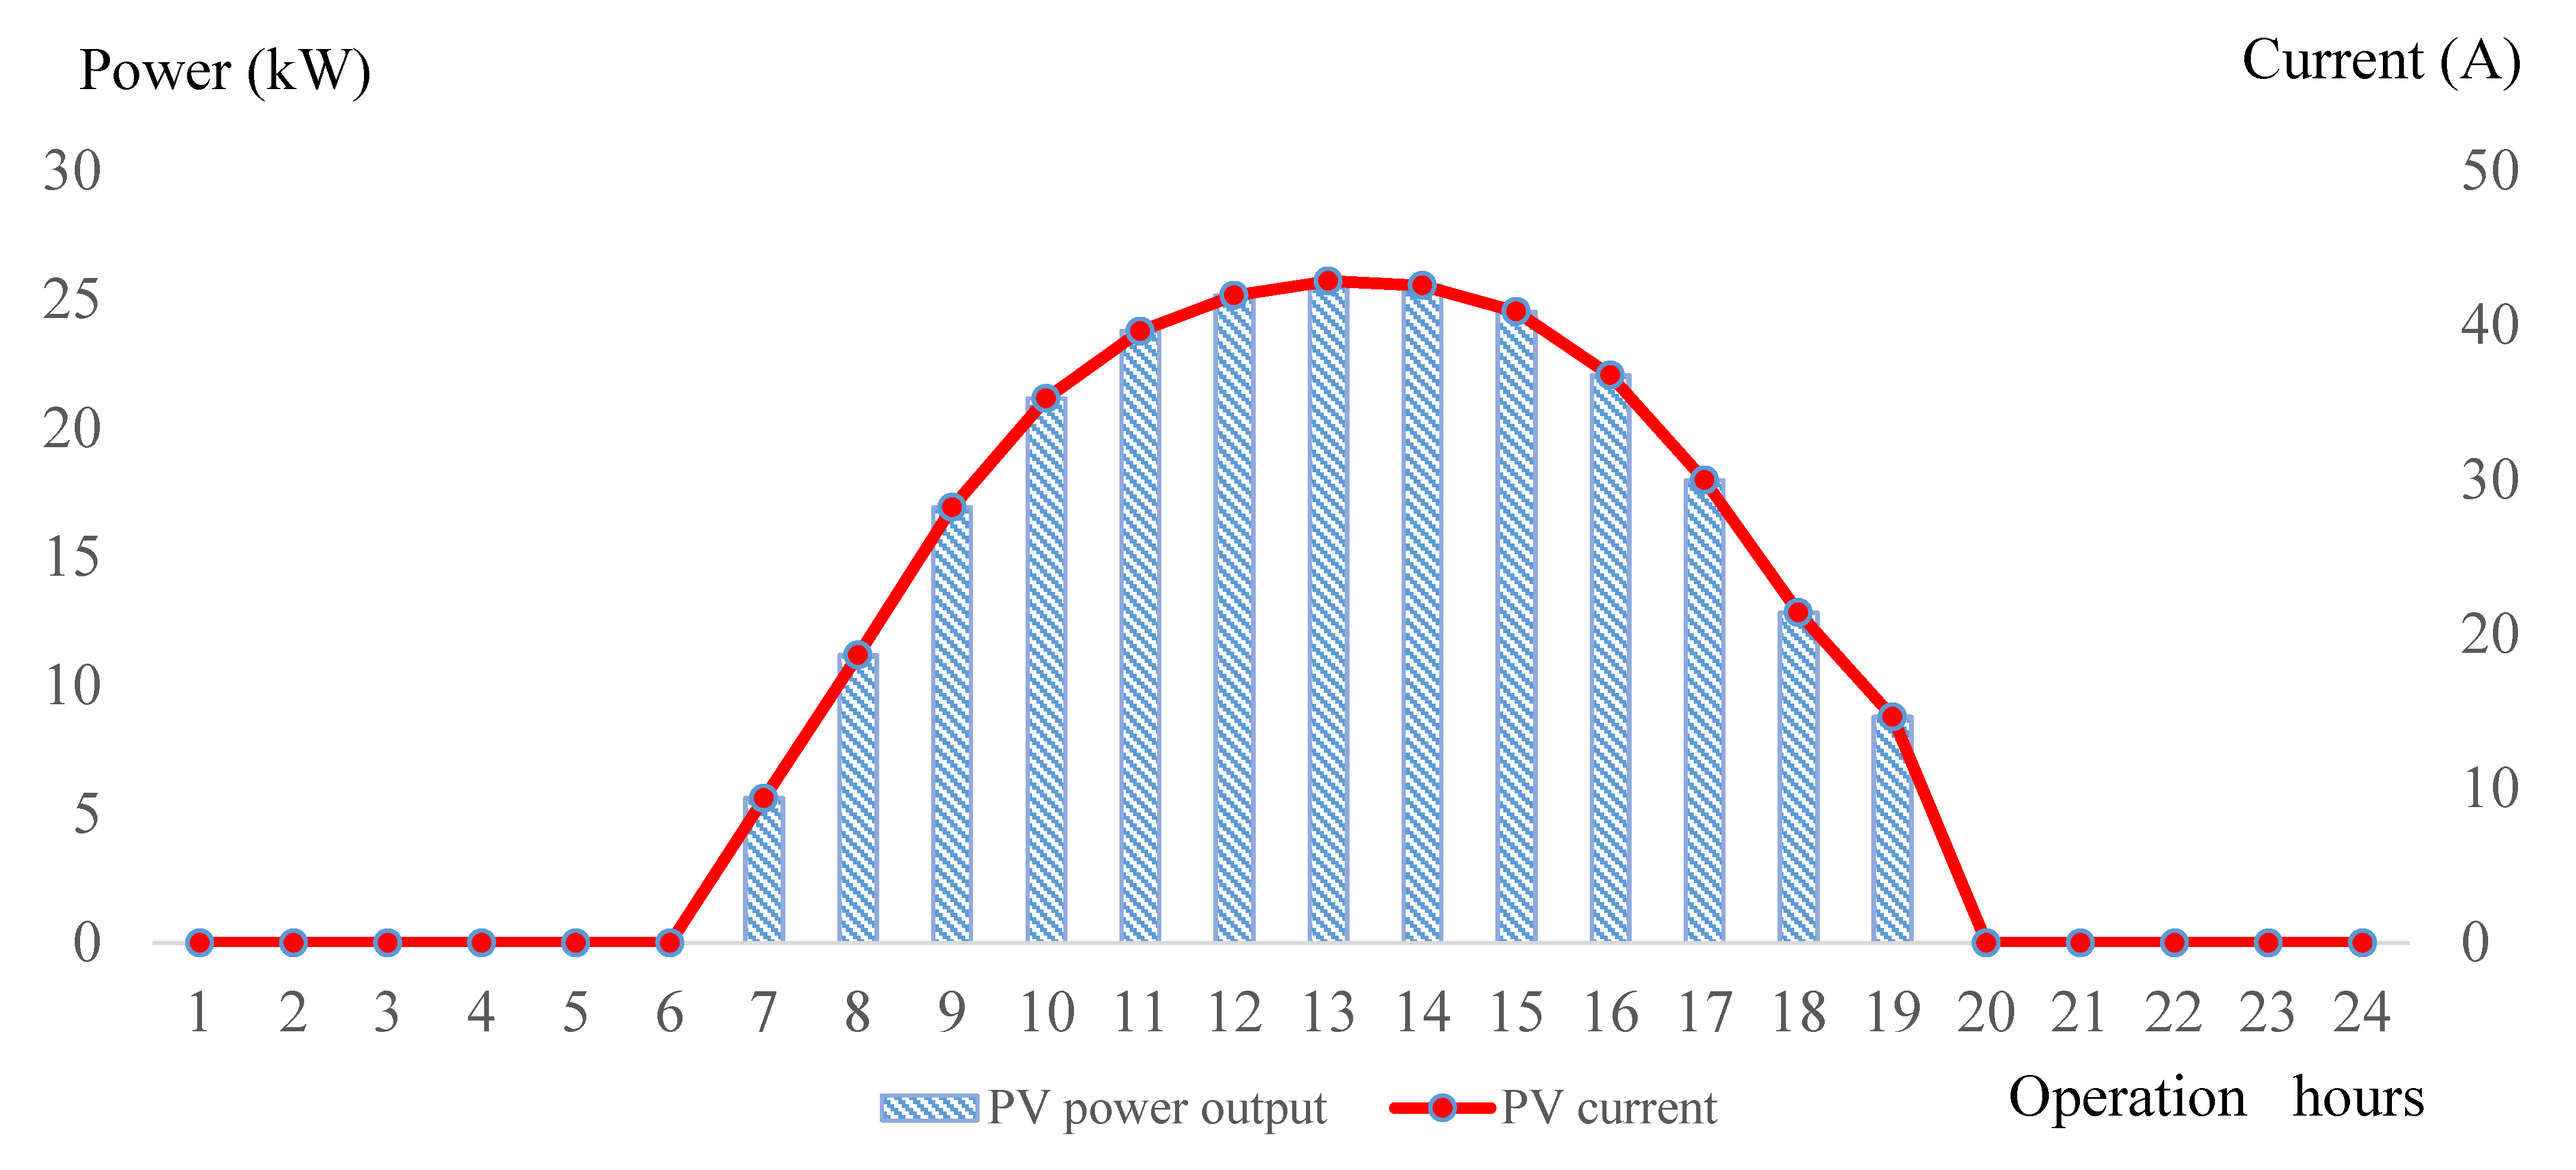
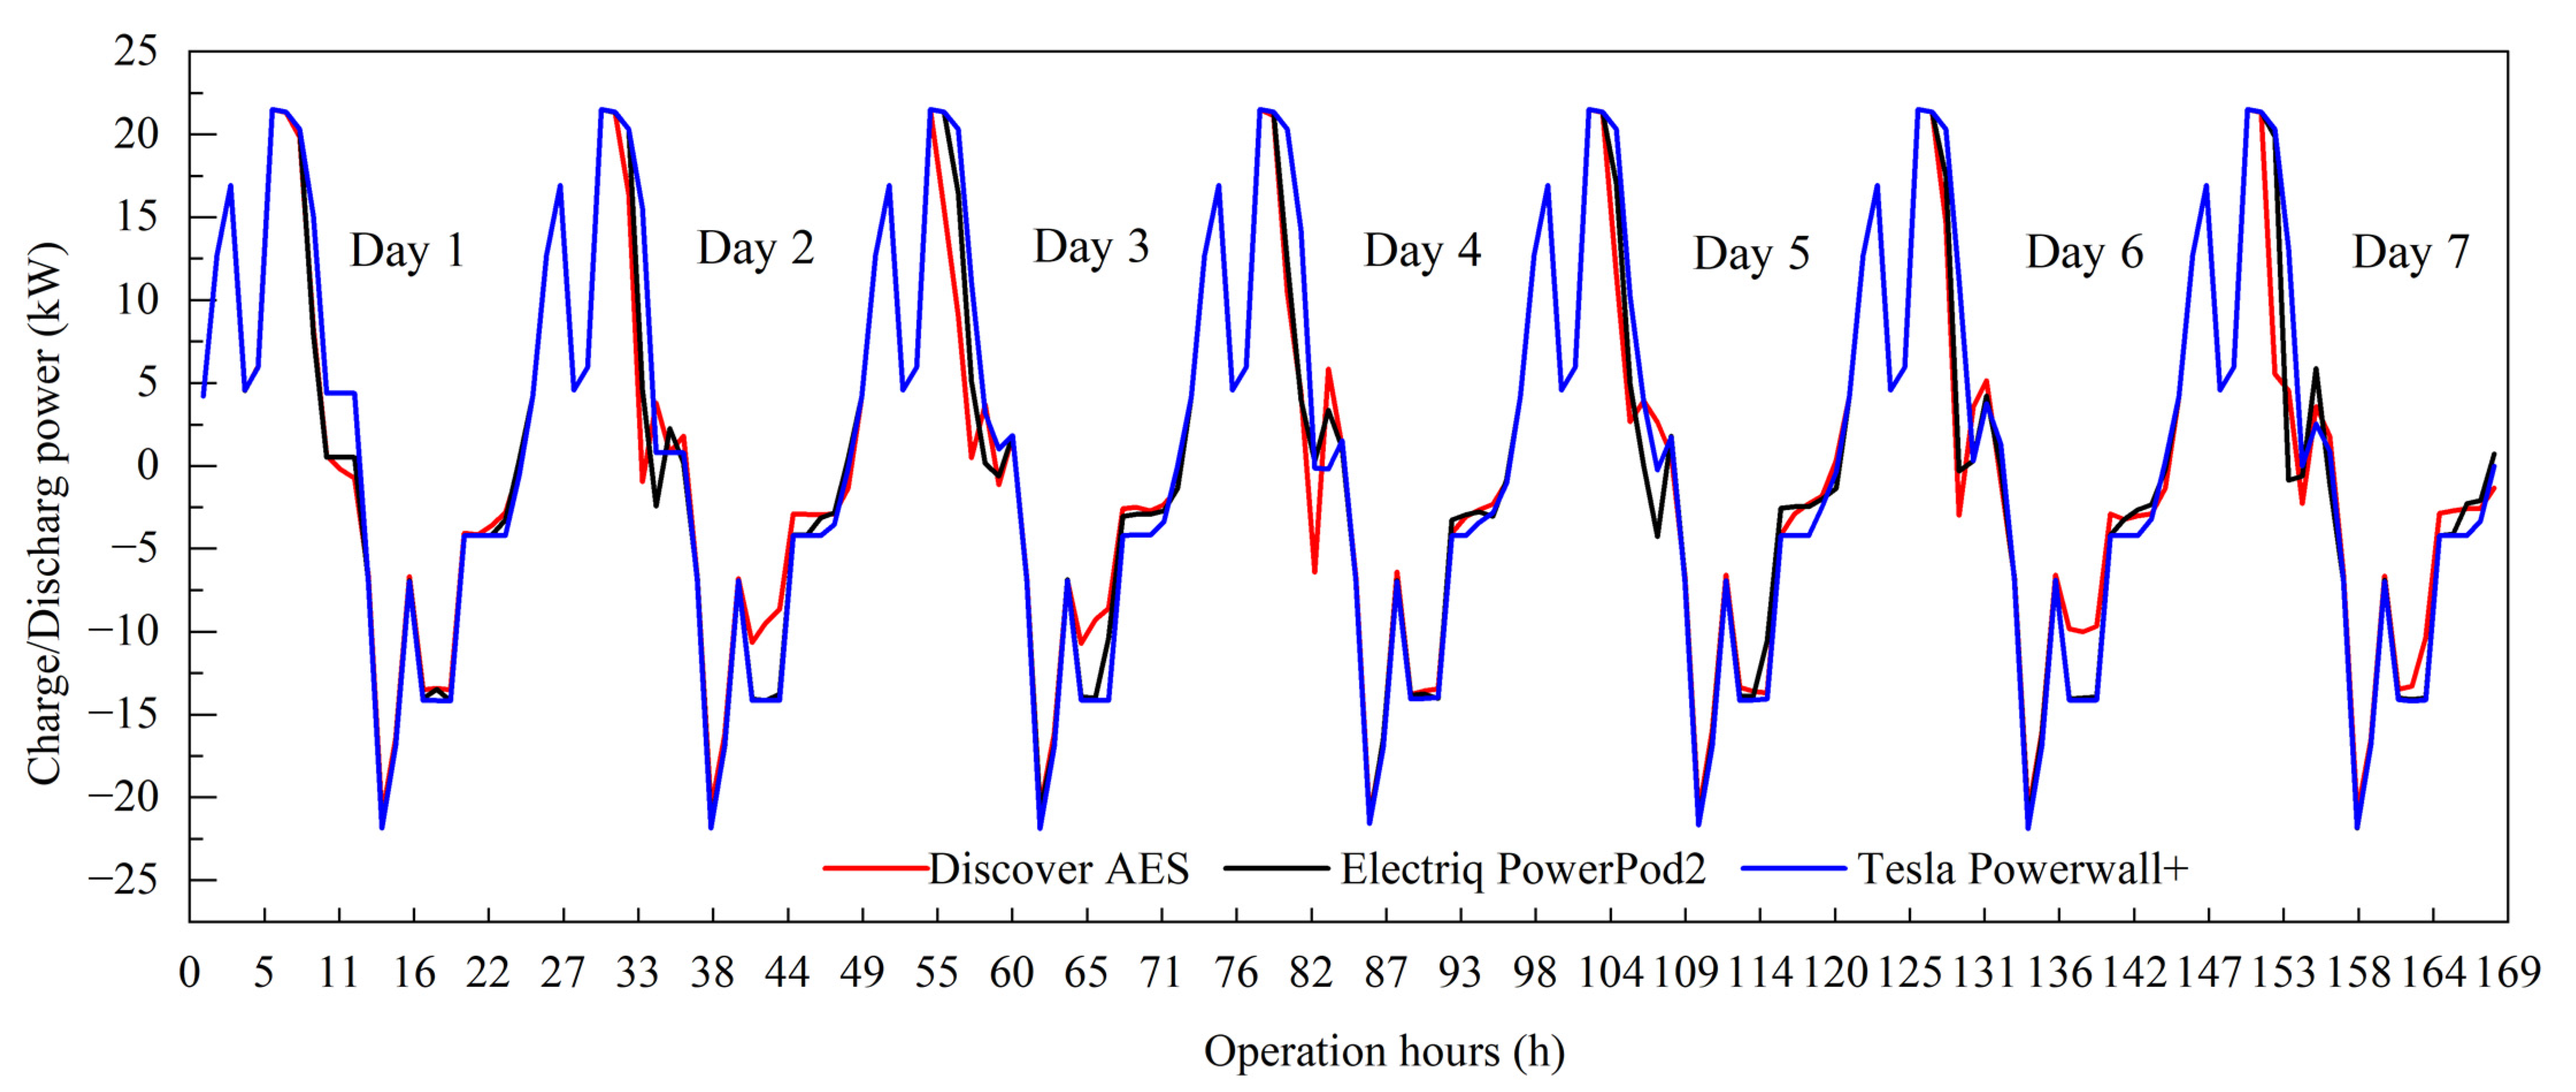
The solar panel was assumed to be installed on the roof of the building and the total rated installation capacity was 25 kW according to the energy demand of the 1600 ft2 house. Specifications of the solar panel are listed in Table 5, which could be adjusted in accordance with the solar radiation condition during the day time in the USA and the rated power generation capacity. Hourly power generation at day time is given in Figure 9. We found that at noon from 10:00 to 16:00, the PV panel reached its peak generation when the solar radiation was strongest. Given the instant PV power supply of the system, the optimal schedule of battery operation state could be robustly determined using the genetic algorithm on the basis of the MSC strategy, Figure 10 and Figure 11 present the weekly and daily operation round trip of three different battery types. In general, a very subtle difference exists between them as they all feature schedules of cyclic charging at noon and discharging at night.
In order to start the simulation, the battery bank should be charged first then discharged afterwards, so we opted to simulate the PVB system on a daily operation round beginning at 8:00 and ending at 8:00 the next day. Therefore, the power curve of battery bank along operational hours could be plotted in Figure 10 and Figure 11. Importantly, the operation hours are not actual operation times during the day. Considering that the period of 11:00 to 12:00 every day (three hours after the start of operation) corresponds to peak energy load intervals, most of the power from the PV panel would be exported to the building demand; therefore, less power could be spared to charge the batteries which explains a noticeable charging valley three hours after the start of operation as depicted in Figure 11. During the night shift, the energy demand peak falls between 21:00 and 2:00 when heat pump starts working and electric vehicles need to be charged; to meet the demand, enough power should be supplied so all the batteries are at their maximum discharging rate.
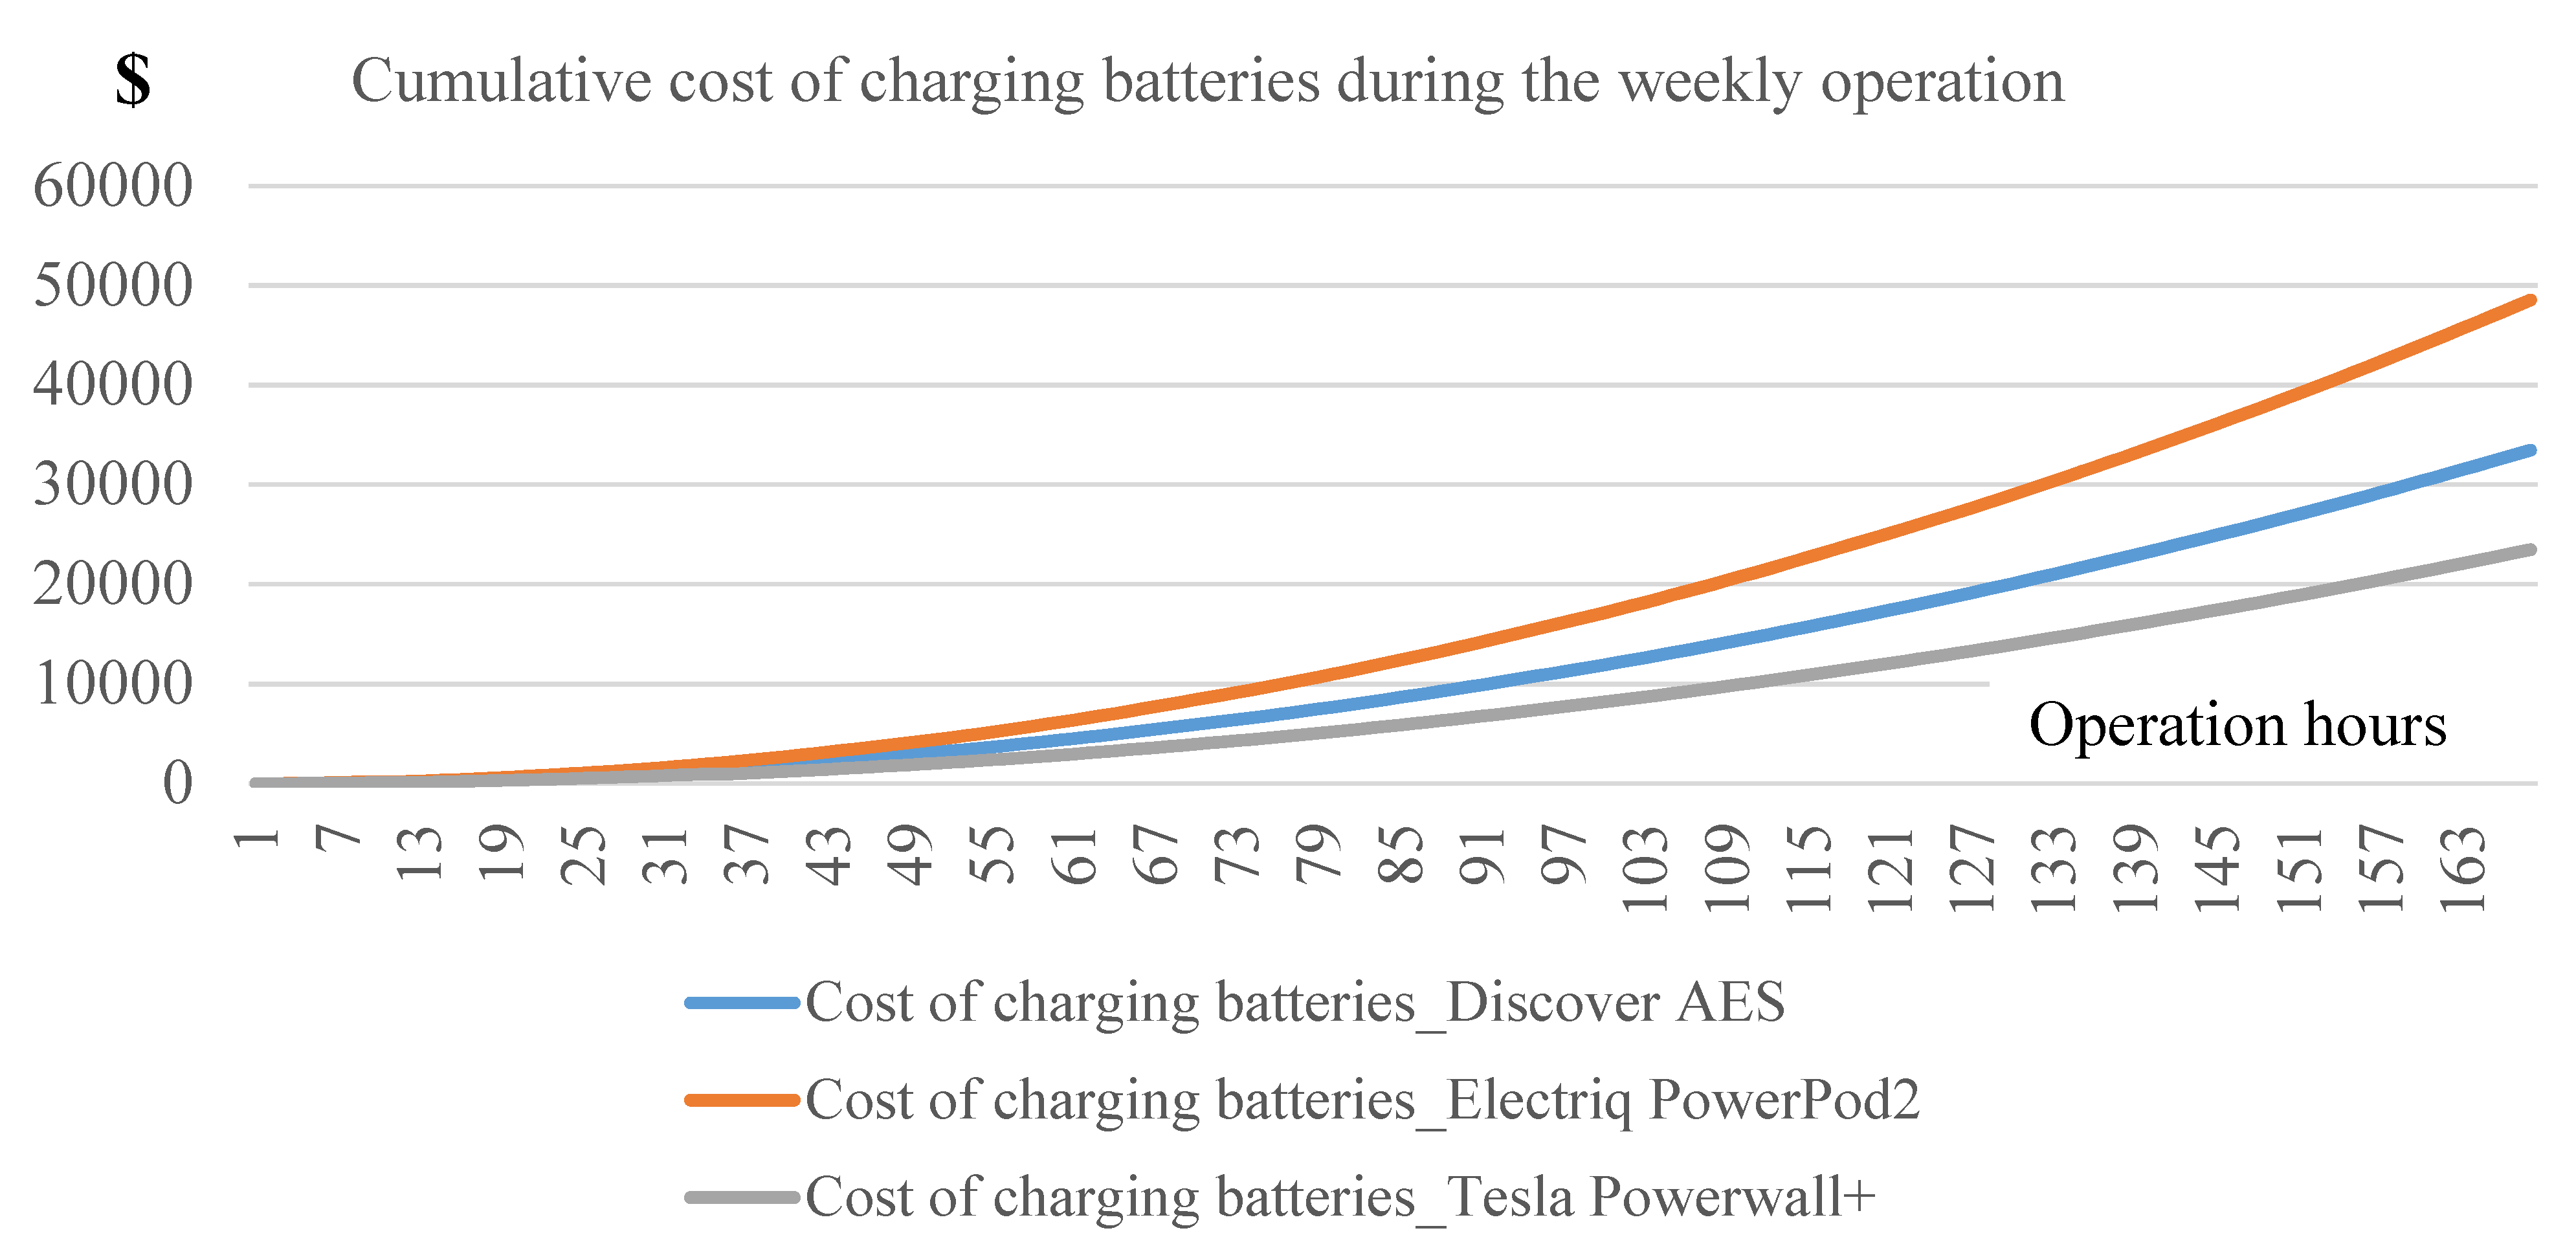
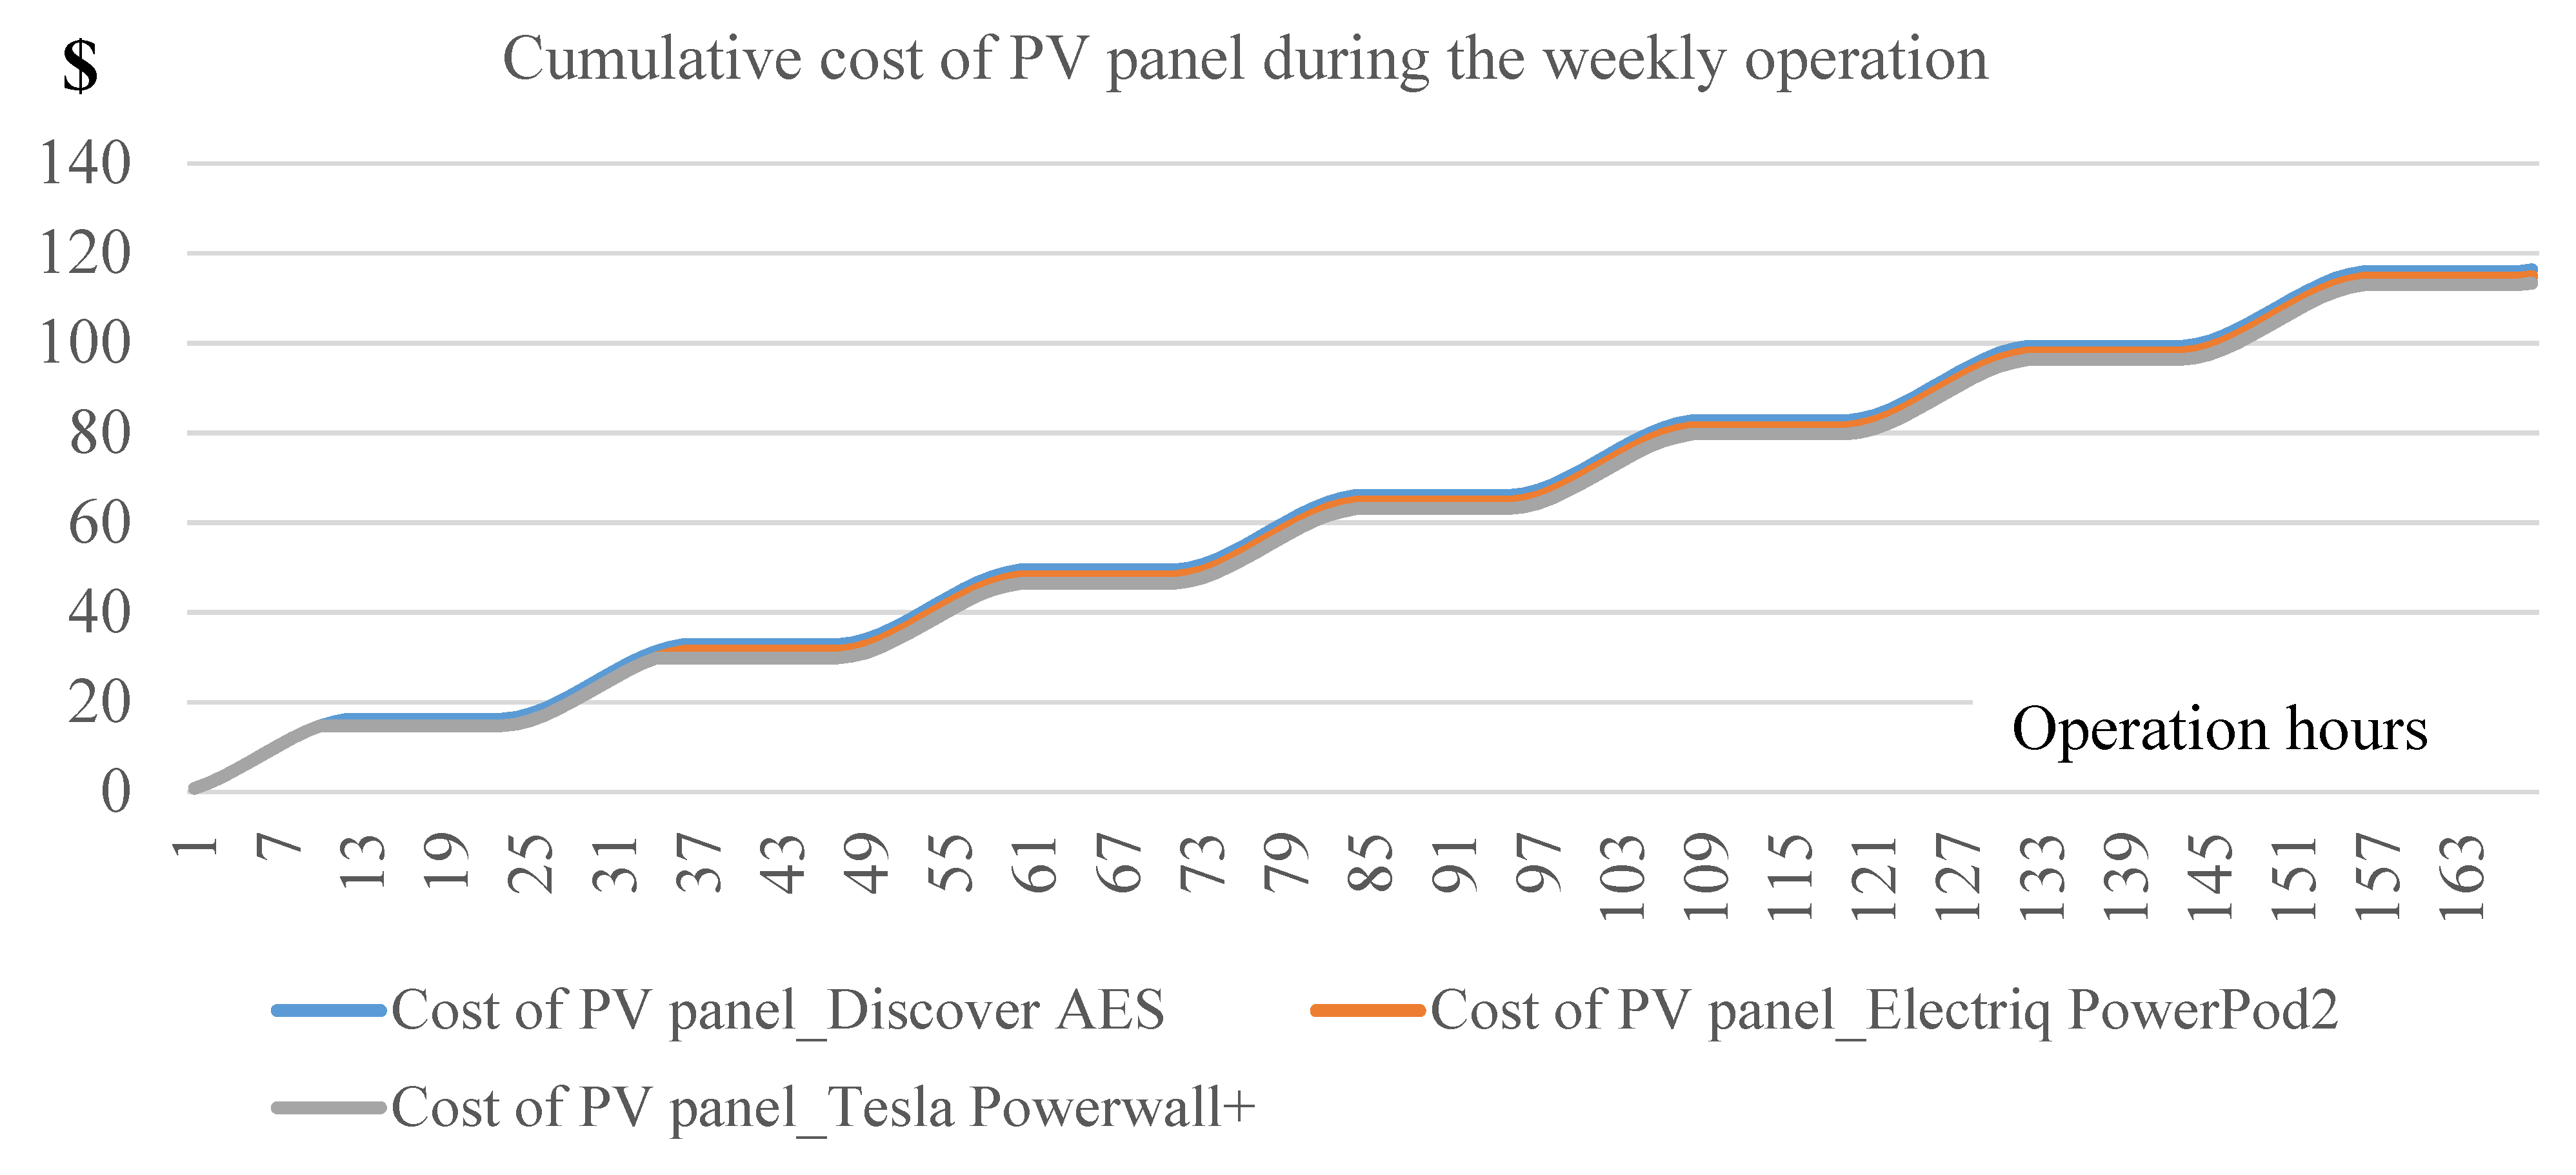
The cumulative operation cost of the PVB system, including the battery bank and solar panel, during the week is given in Figure 12 and Figure 13. Total cost grows linearly with the operation time, as a relatively fewer number of Tesla Powerwall+ batteries are needed for energy supply of the system with the initial cost which amounts to $76,500, while the battery of Electriq PowerPod2 features greater investment and more units are required. Therefore, the Tesla Powerwall+ received an excellent economic indicator among them. Considering the PV panel cost, a negligible difference was noticed among the three types of batteries, since they were installed with an identical solar PV configuration and hourly power generation was almost the same.
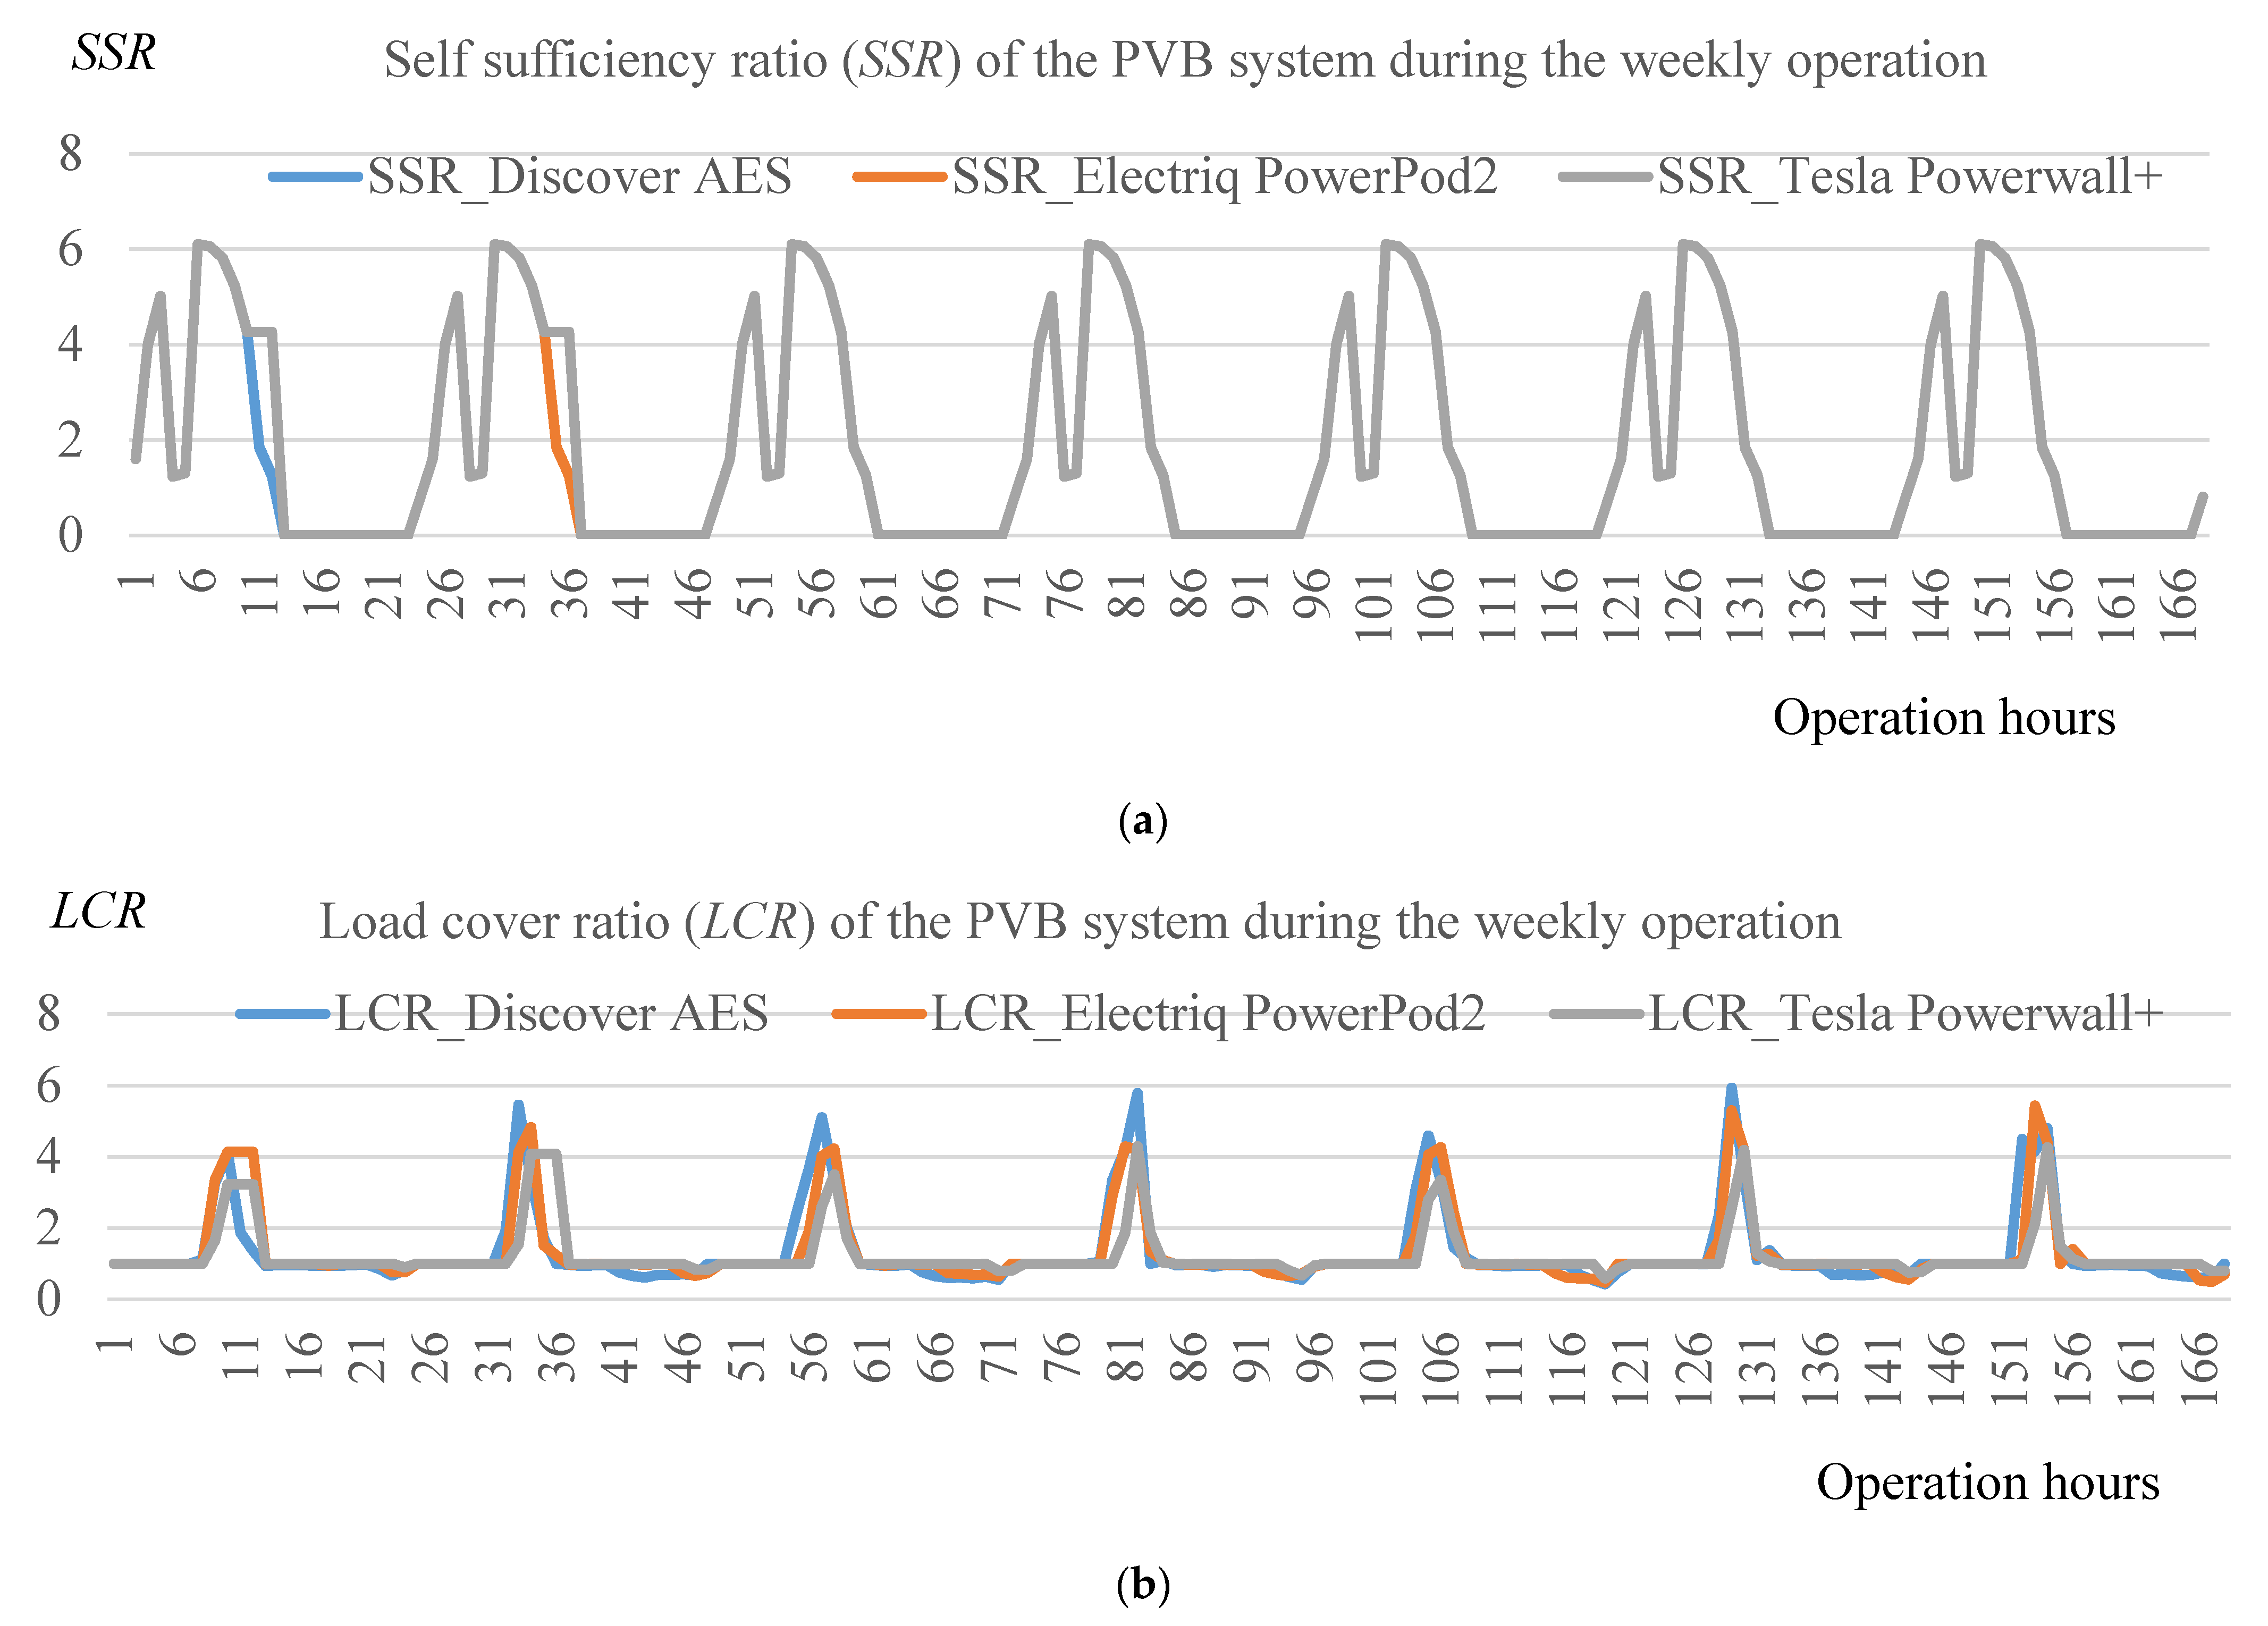
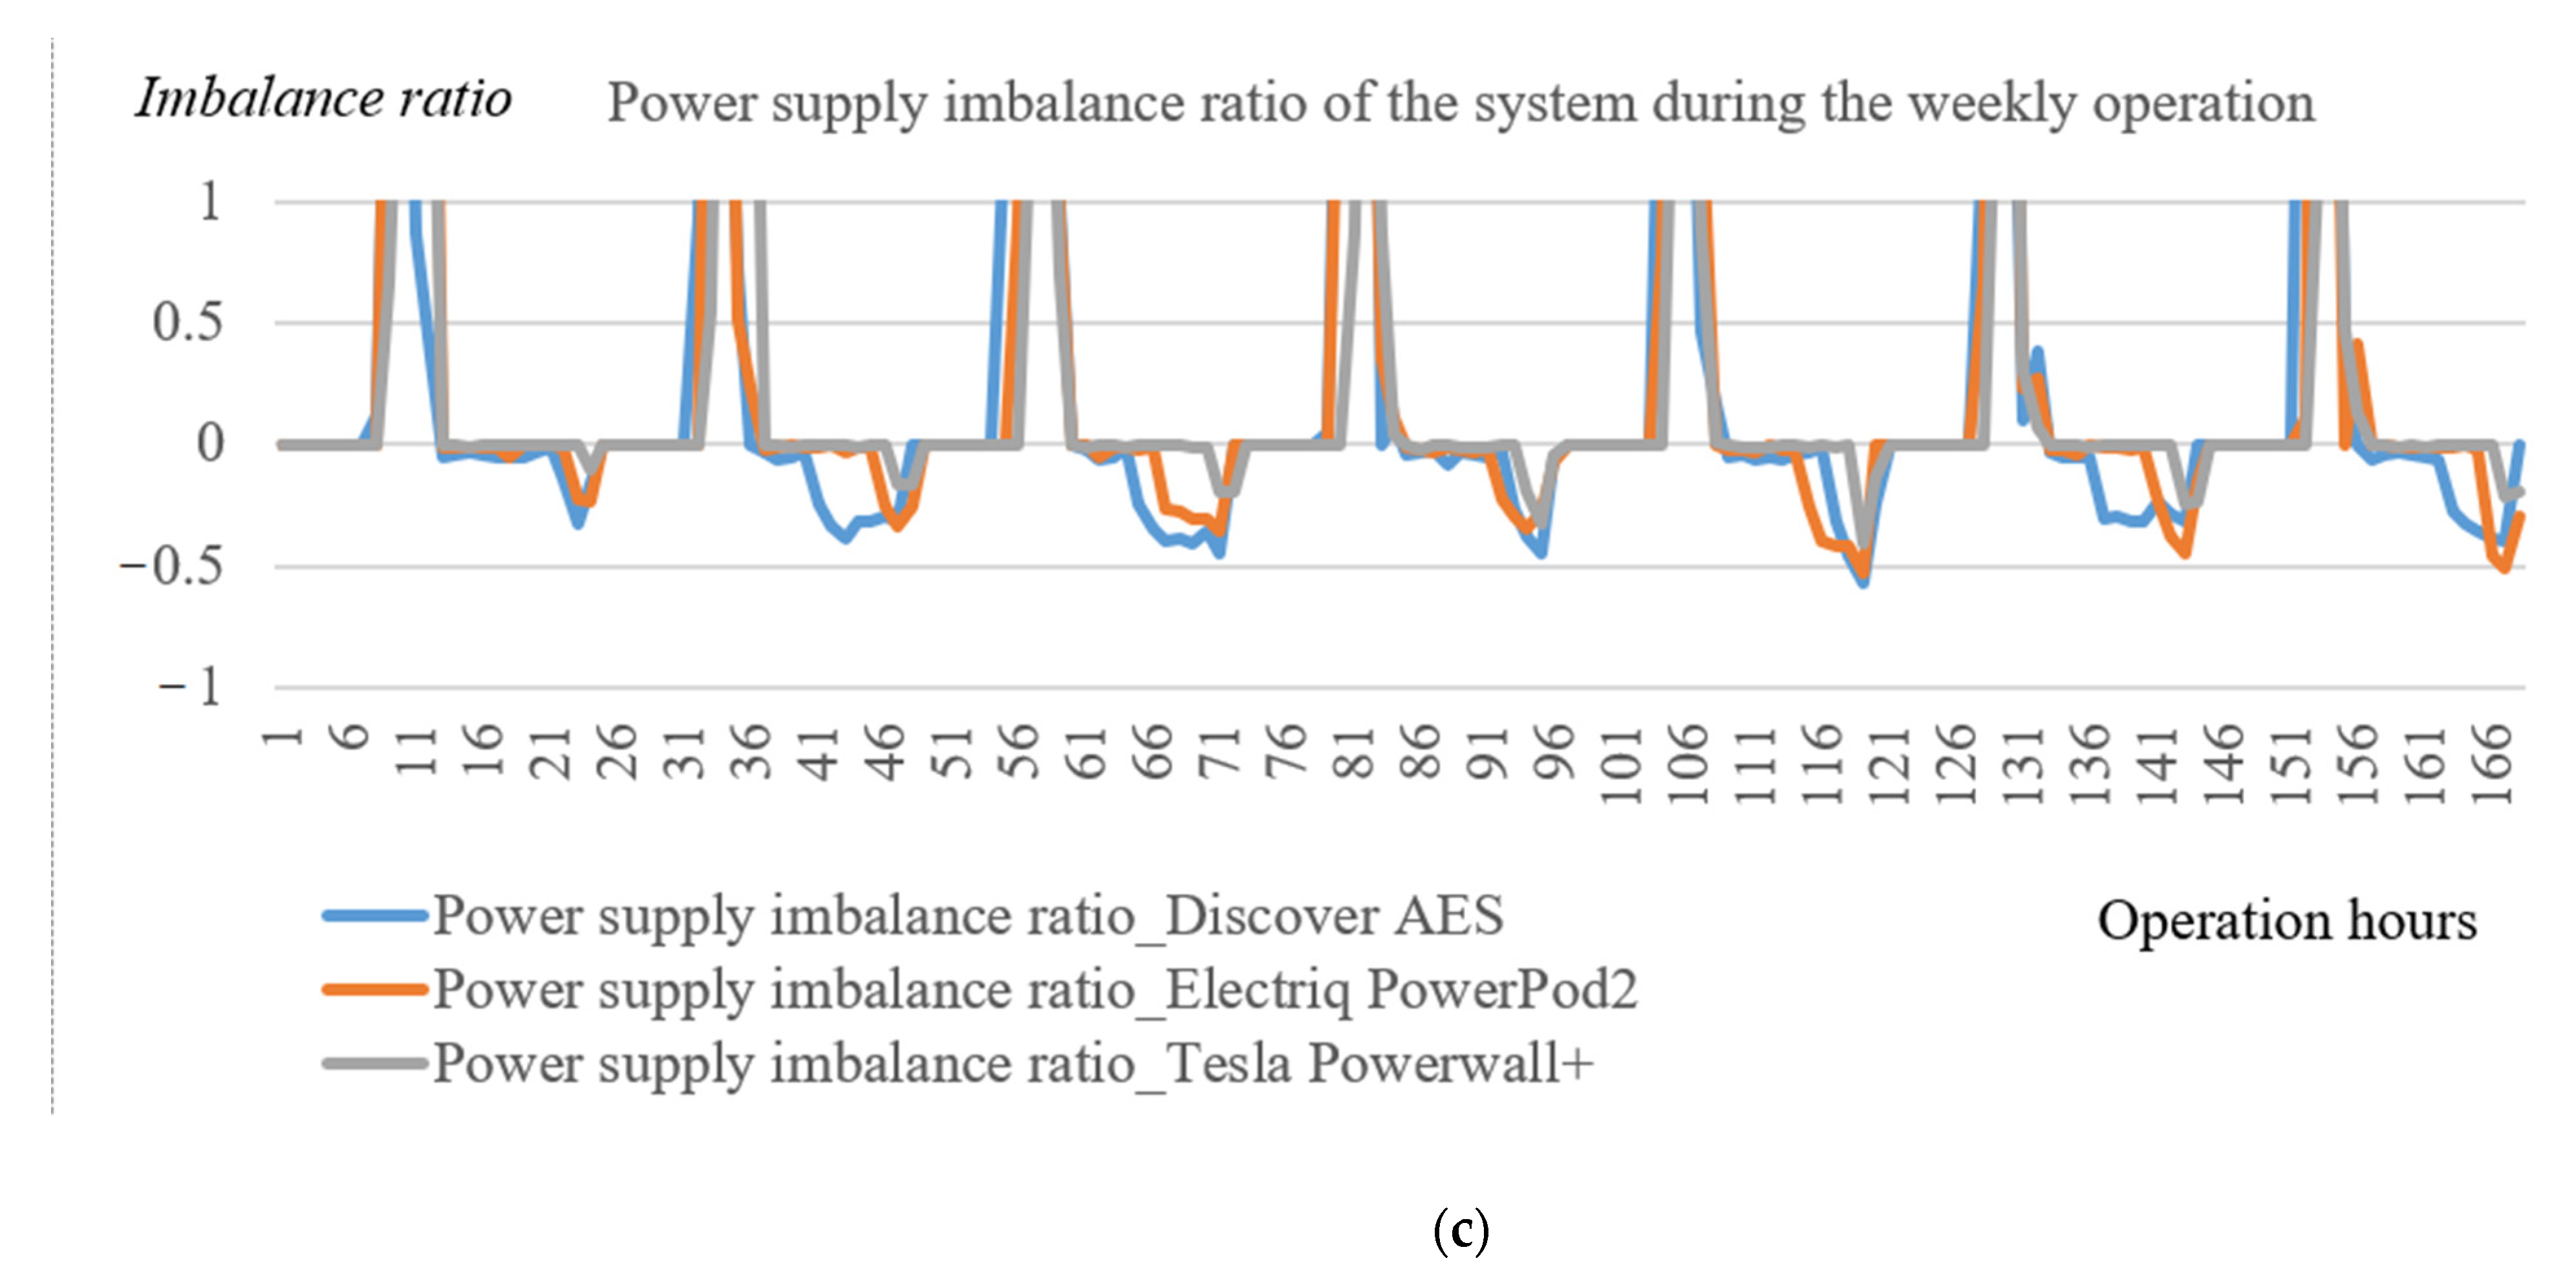
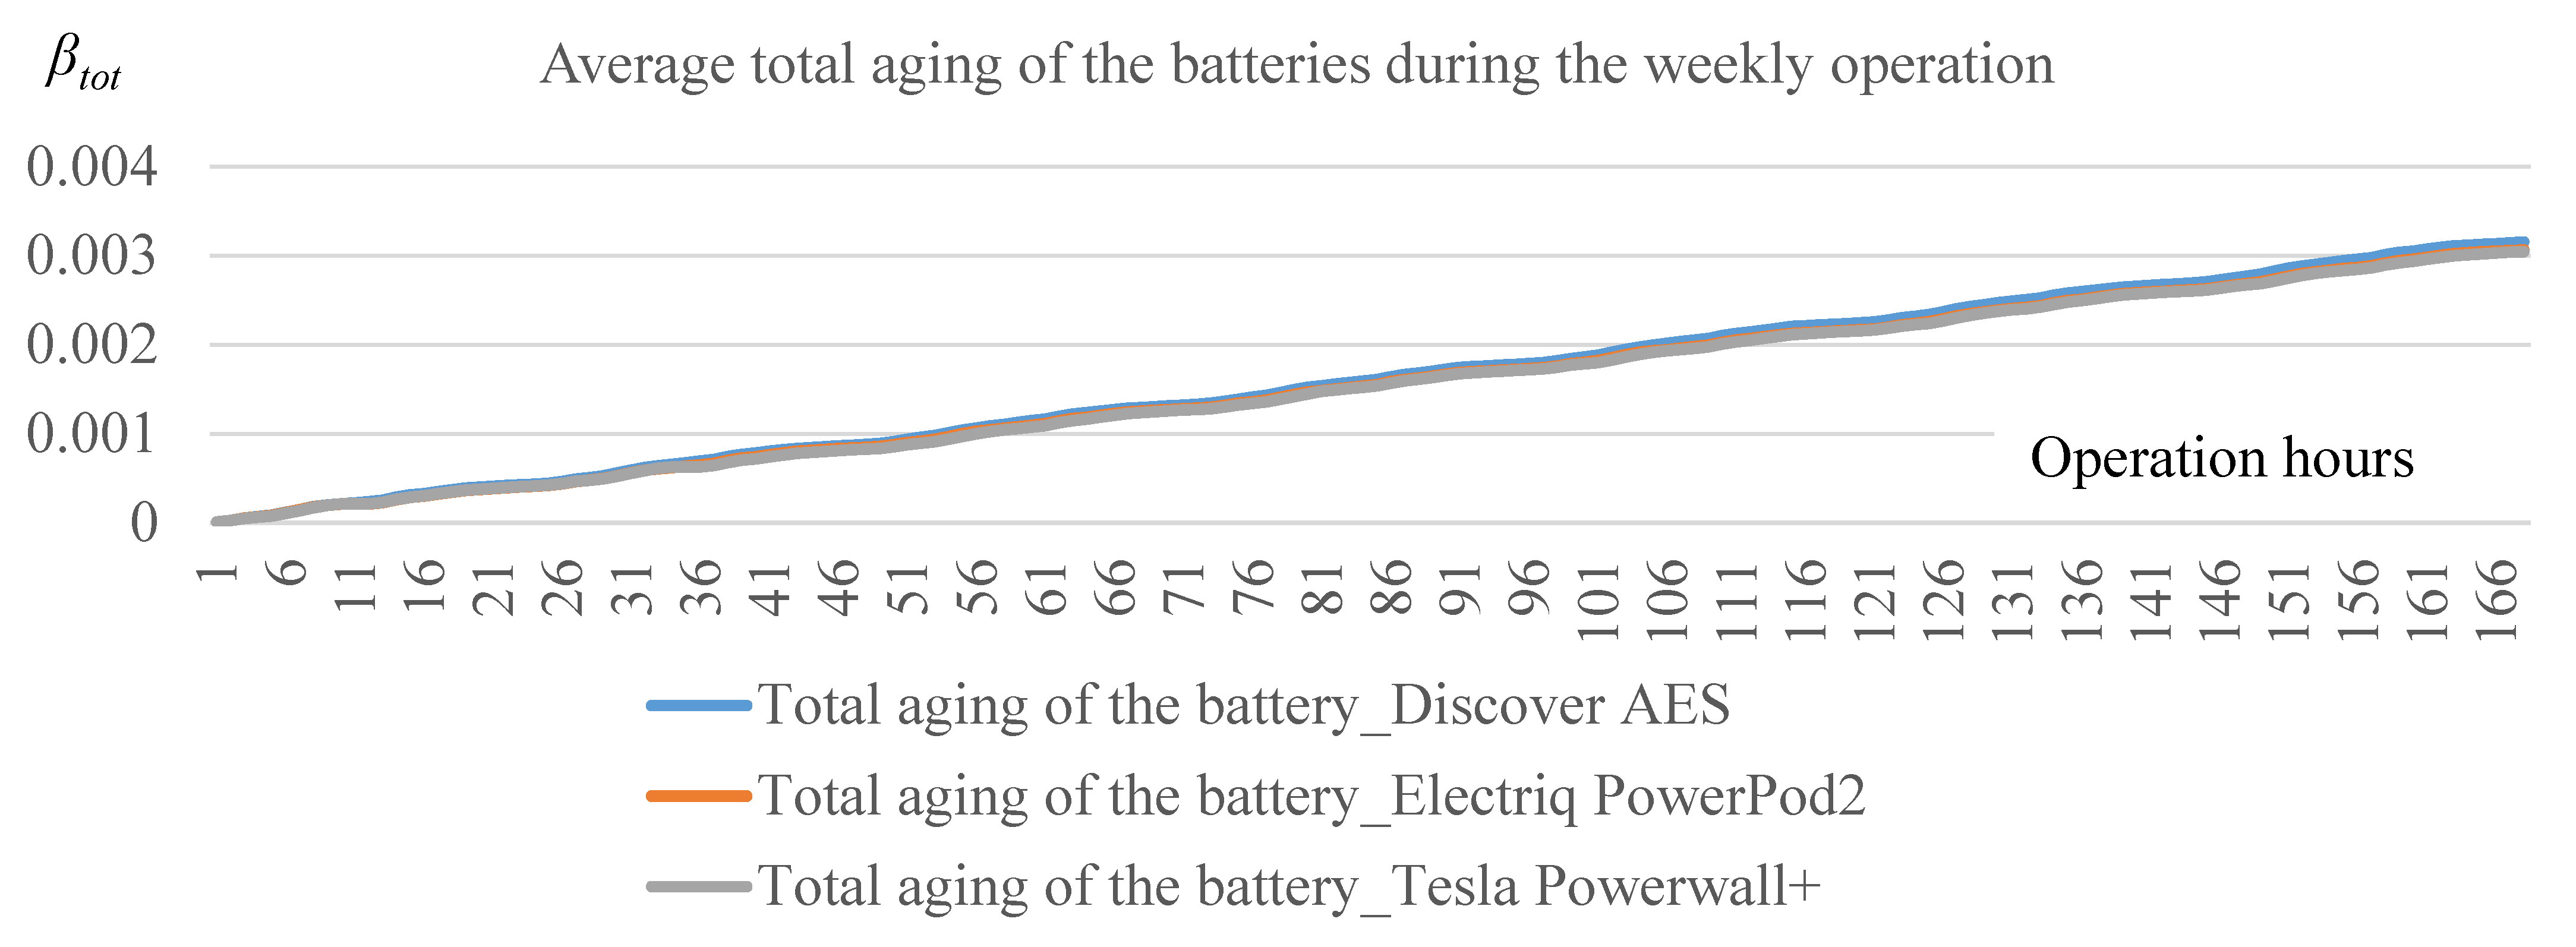
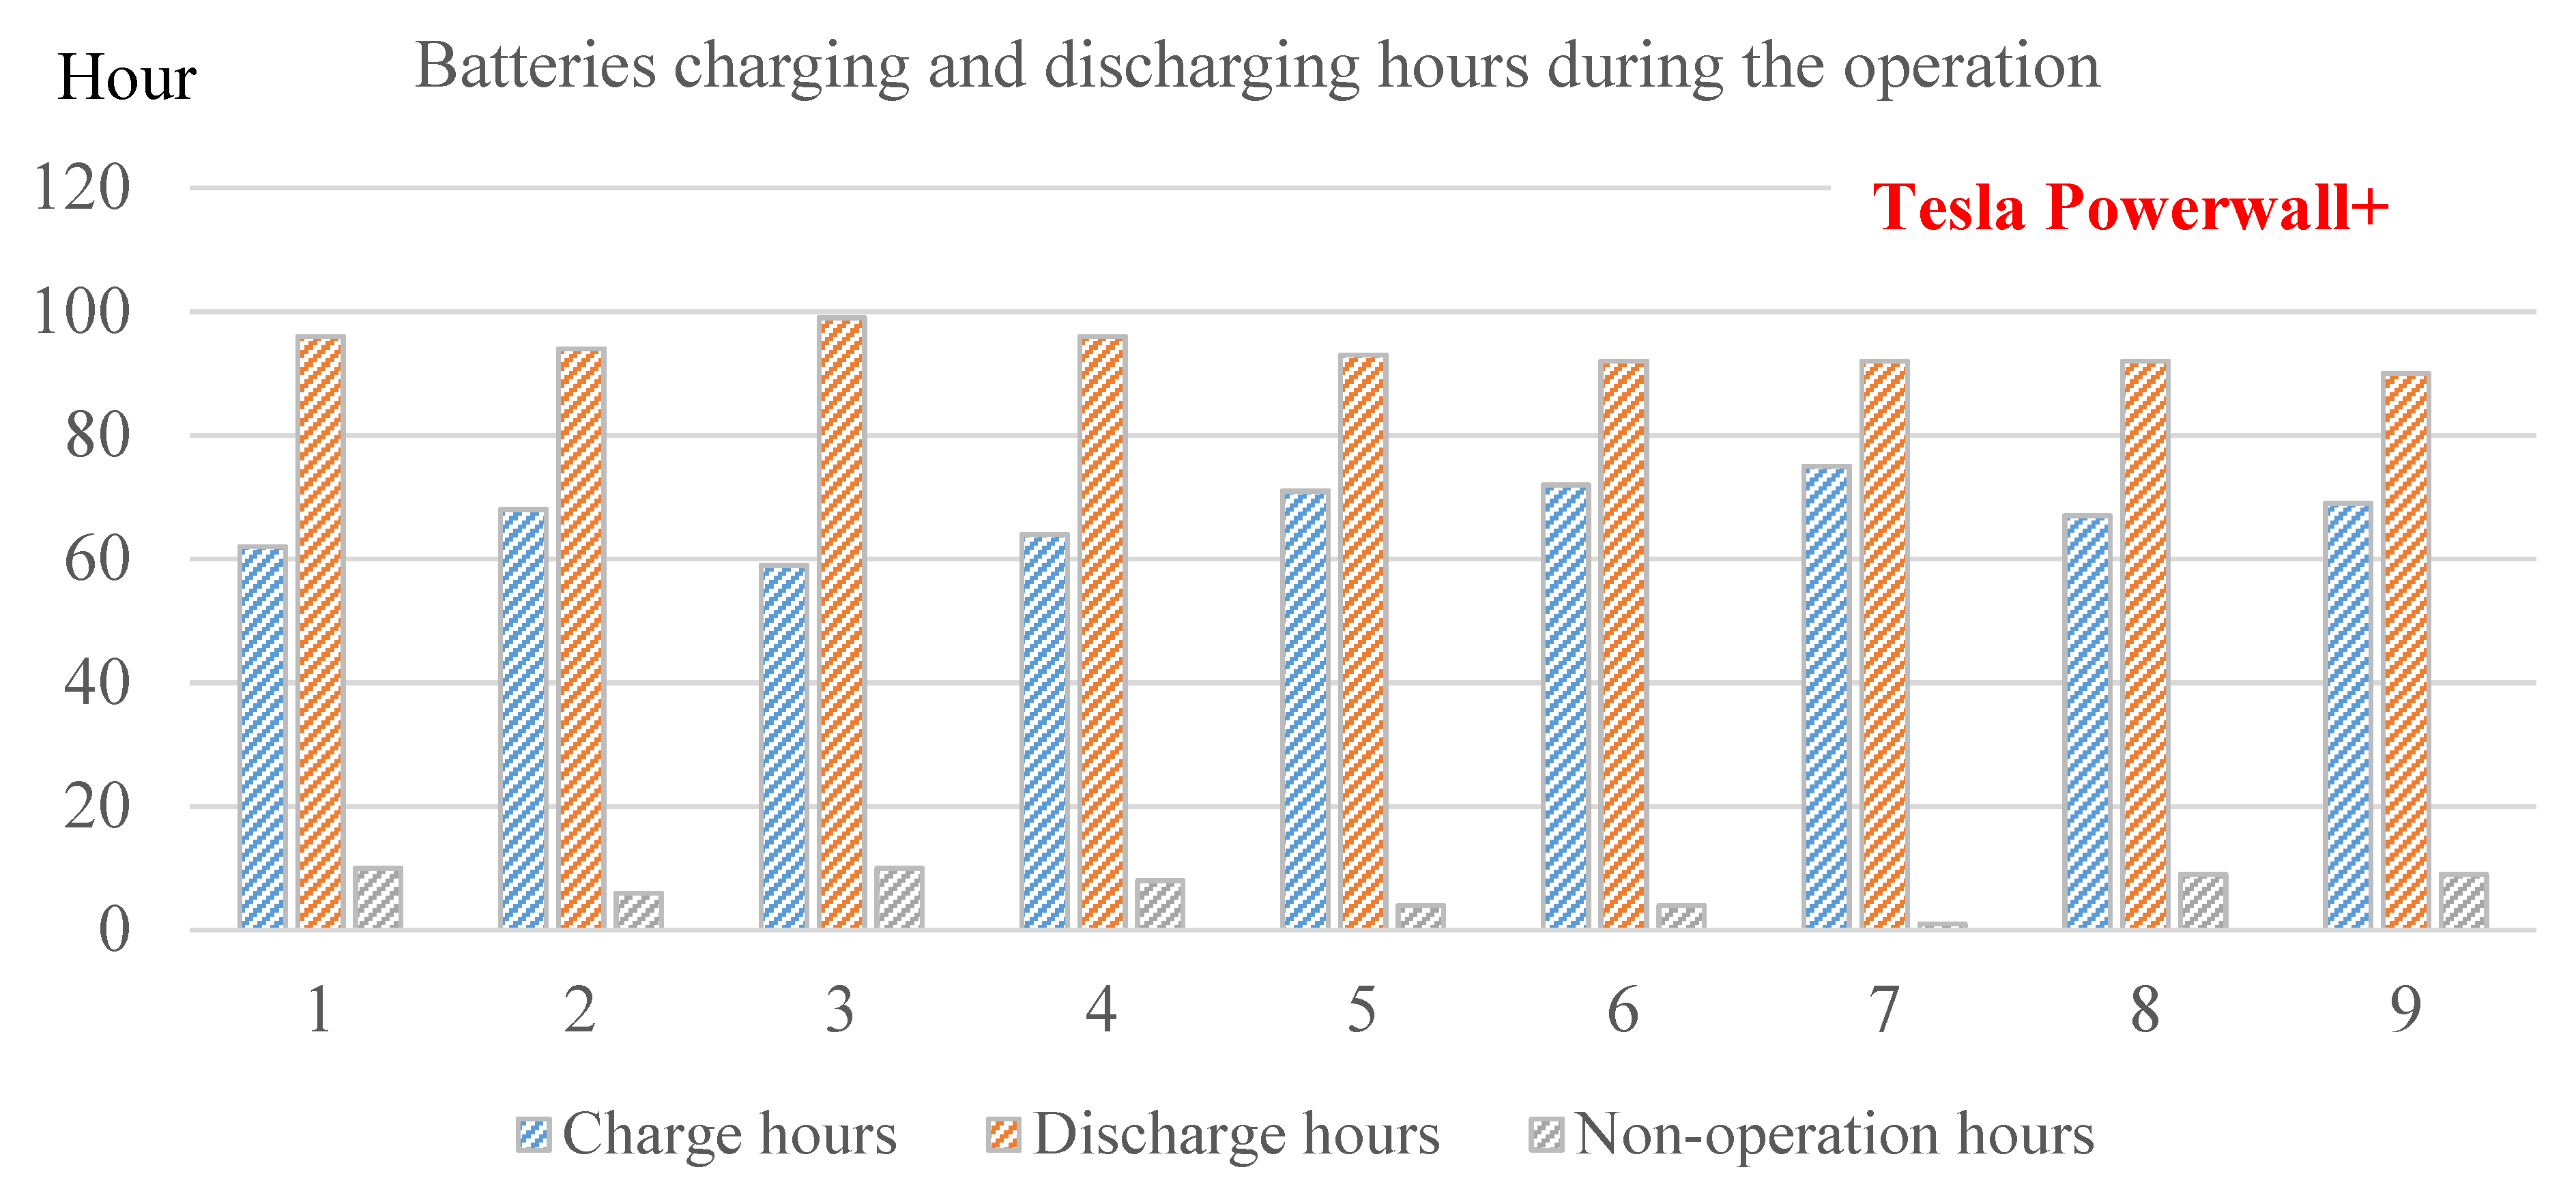
Table 6 compares the main techno-economic indicators of SCR, SSR, LCR as well as SOH and the power supply imbalance ratio of the three types of batteries. According to the simulation results, the SOH index, SCR and SSR remained almost the same. Furthermore, the battery energy storage system was installed with suitably designed and the adequate numbers of batteries and abundant PV generation potential which could cover the load demand, so each battery would be charged or discharged regularly, thereby achieving a desirable health index. On the other hand, due to the same load demand and identical schedules of the PV panel on the constant shift of the operation state at 7:00~19:00 and off-operation state at night, both the SCR and SSR index should undoubtedly be valued with subtle variations. It is also important to mention the load cover ratio and power supply imbalance ratio, because all the batteries are at their full SOC status, a certain amount of surplus power from the PV panel could not be exported to the battery bank in a timely way at noon when solar energy reaches the peak. Therefore, the surplus electrical energy would not be stored for night use but would instead be wasted. Apparent over-supply intervals exist during the day and short-supply intervals occur at night when = a gap exists between the building energy demand and instant supply as shown in Figure 14. Although all of the three batteries experienced the same features of improper energy peak between day time and night, the mismatch condition between the energy demand and supply sides accounted for about 25% of the operational hours while during other hours they were perfectly matched. Clearly, the Tesla Powerwall+ performs best, as for the LCR and imbalance ratio during cyclic operation. Considering both techno and economic indicators, the Tesla Powerwall+ was considered the best option for a battery energy storage system. The battery aging index, charging/discharging hours as well as dynamic SOC during the operation for Tesla Powerwall+ are illustrated in Figure 15, Figure 16 and Figure 17, respectively. It could be observed that the aging factor varied linearly with operation time, contributing to growing operation costs; consequently, all the batteries discharged more than they charges, and some batteries neither charged nor discharged but remained out of operation on a shift due to the SOC constraint for the sake of a healthy state. Charging and discharging performance of the battery storage system equipped with Discover AES batteries and Electriq PowerPod2 batteries for the typical house are not presented here, but summarized in Appendix A for simplicity.
Considering that the operation curves of the battery storage system were the same every week, the long-term operation characteristics (one year or 10 years) had a periodic function of the operation curves during one week. Due to the periodic characteristics, all the performance indicators independent of the operating time were kept the same. For example, the charging/discharging performance and technology indicators (including SSR, SCR, LCR and energy supply imbalance ratio) remained unchanged for the long-term scenario. However, the cumulative operation cost, battery aging and SOH were quite different, because they were related to the operation time. A comparison of these long-term indicators (cumulative operation cost, and SOH) is provided in Table 7. It shows that although the cost caused by battery degradation increased year after year, the rate of the total operation cost almost remained constant since the cost of PV generation outweighs that of battery degradation, while the battery state of health (SOH) decreased significantly with operation time from one year to five years. At five years, the corresponding SOH indicators and cumulative operation costs were 0.836/1.68 × 105$, 0.76/2.44$, and 0.715/1.18 × 105$ for Discover AES, Electriq PowerPod2 and Tesla Powerwall+, respectively. Discover AES was in best health state, while Tesla Powerwall+ had the minimum cost. In general, the total cost of Discover AES was medium with the best SOH, making it the ideal option for the long-term operation of a battery energy storage system.

3.3. Operation Schedules of the Battery Storage System with Energy Demand Prediction

In this section, we describe our method for forecast-based operation scenarios with different energy demand features. Changes were made to the original model described in Section 3.2 considering a building energy demand with more characteristics and user preferences involved, while other aspects of the model remained the same. Given the proper transient evaluation of building energy demand, the optimization objective and proper design of the corresponding PV panel as well as the necessary battery bank configuration could consequently be determined. All the optimal variables and system configuration were input to the MSC strategy and genetic algorithm; as a result, the optimal battery storage system option could eventually be found as shown in the flowchart of Figure 4.
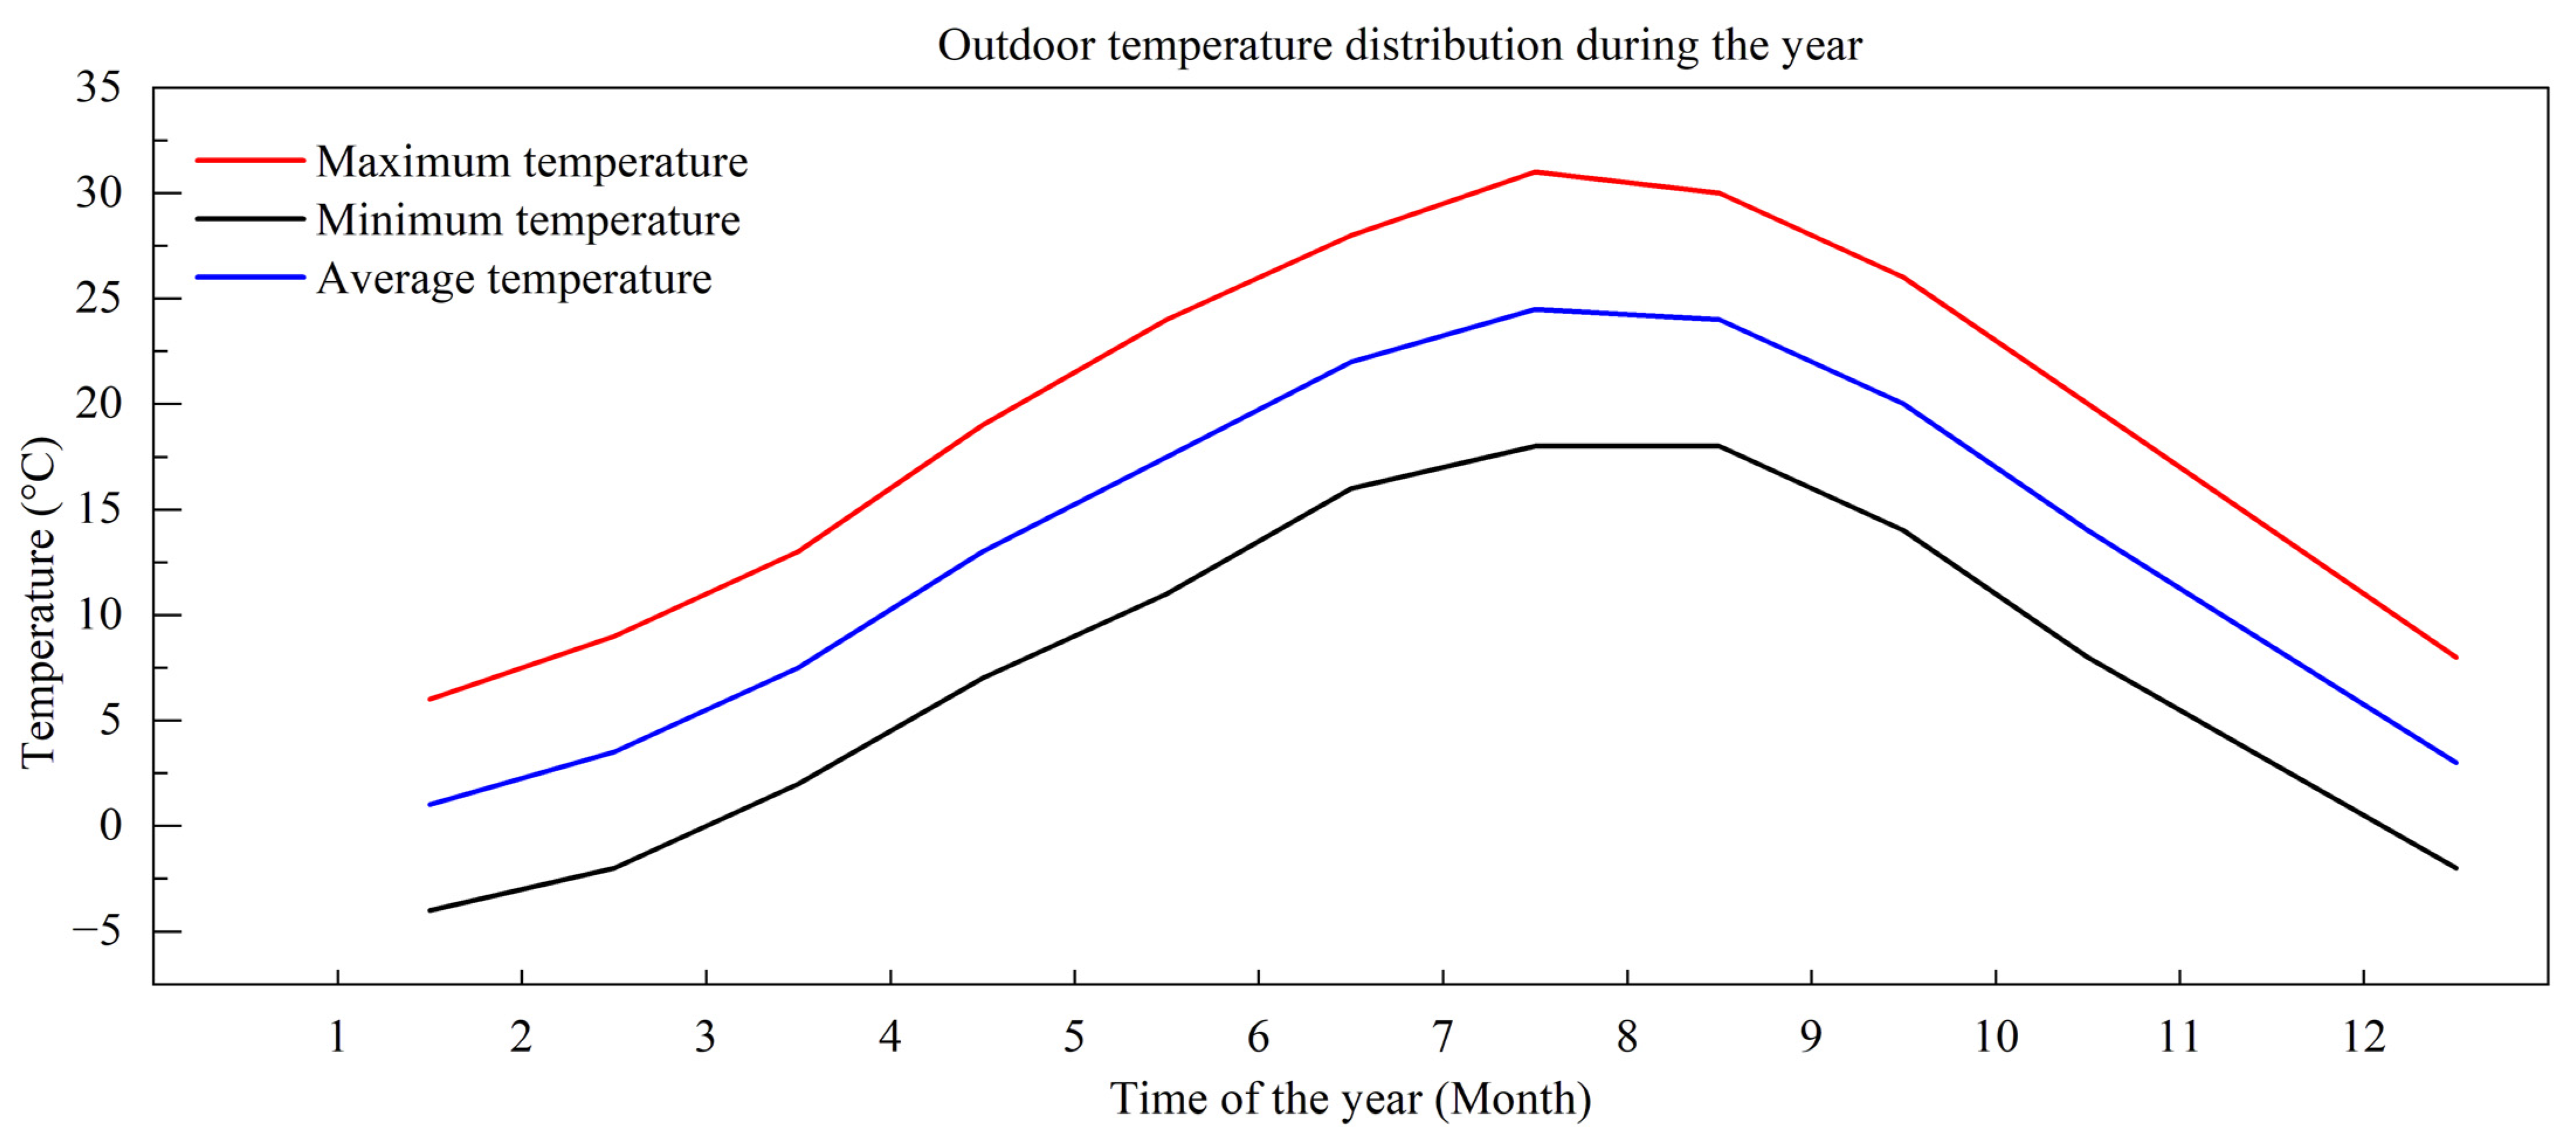
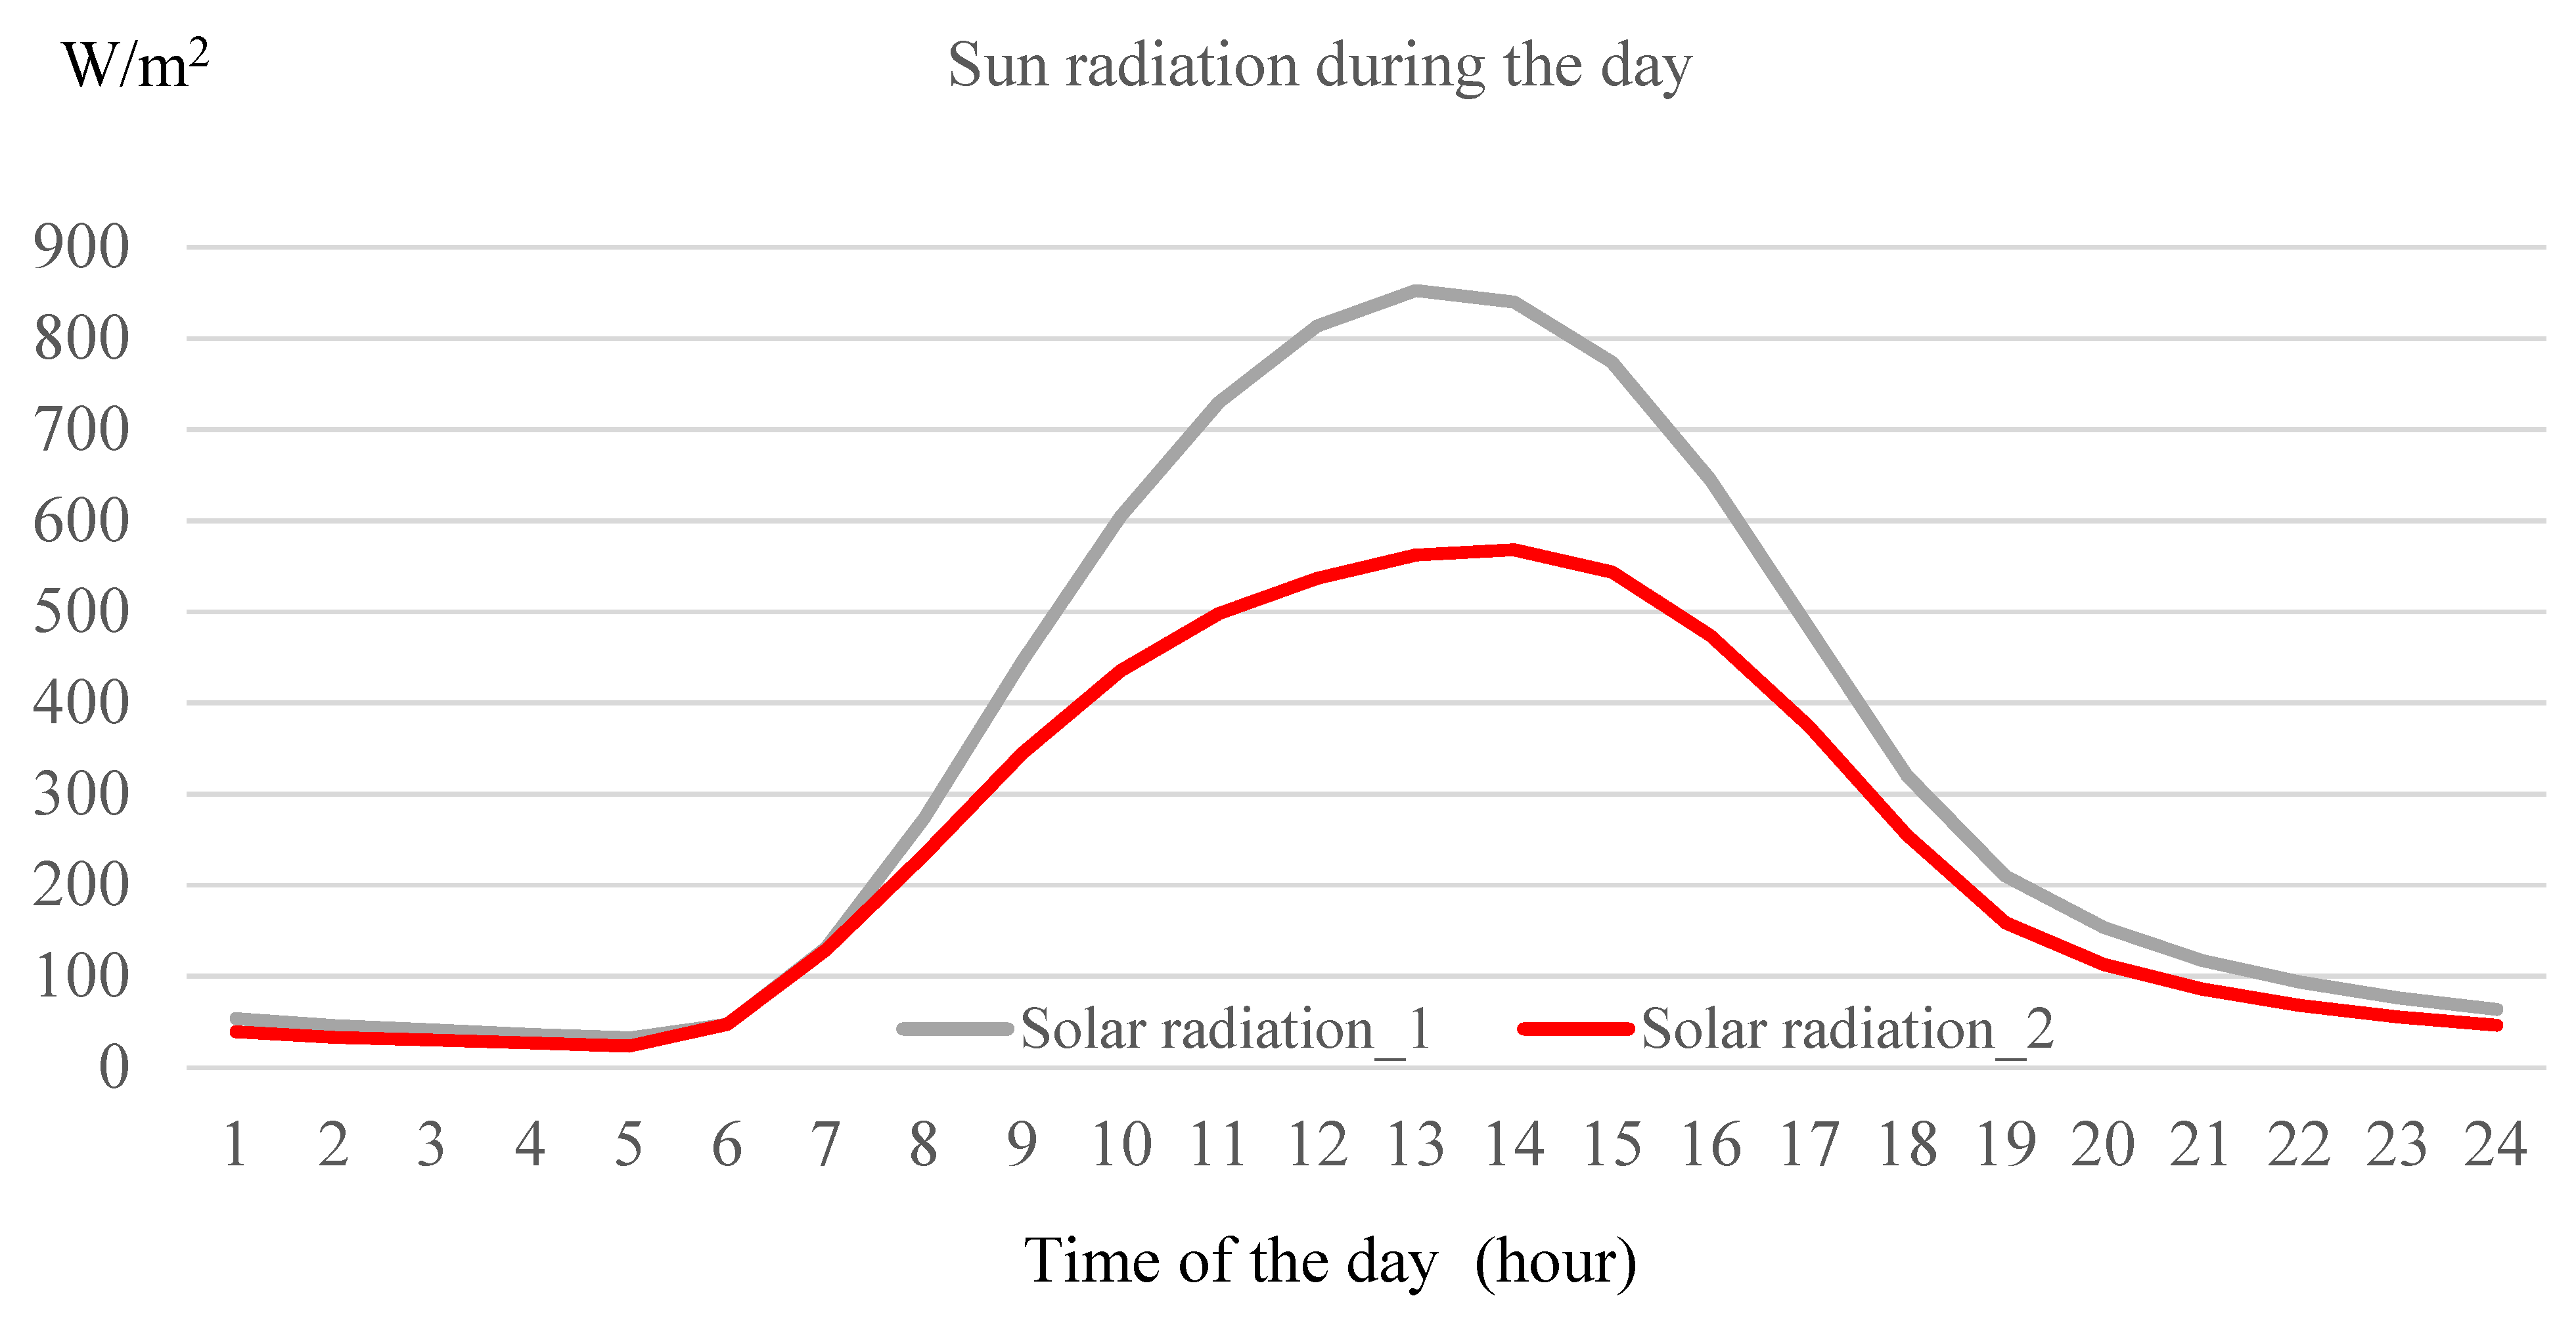
To test the robustness and predictive ability of ANN for the arbitrary building energy demand, a typical residential building was selected as the target building. Parameters of the building and the schedules of indoor occupants each day are given in Table 8. The occupied area per person and the equipment heat loss per unit area (including lighting and office facilities) were set as 46 m2/person and 20 W/m2 for summer (75 W/m2 for winter), respectively. Annual weather data of the typical meteorological year in the USA was extracted to represent the typical monthly outdoor environment during the whole year for building energy calculation as presented in Figure 18. Specifics of daily outdoor temperature are given in Table 9. Additionally, we selected a new case with relatively weak solar radiation for PV system power generation as depicted in Figure 19. The corresponding instant PV power during the day is presented in Figure 20.
On the basis of the building settings mentioned above, we first evaluated the instant energy demand during the day by ANN to validate its predictive performance. Figure 21 depicts the comparison between the ANN learned result and the actual value calculated using Equations (17)–(21) for two typical scenarios of building demand at summer and winter. It could be seen that good agreement was achieved for both cases which proves the excellence of ANN for complex building energy load prediction.
After we determined the building load demand, the power generation capacity of the solar panel was checked against the actual load in order to verify whether we installed a proper configuration of PV that could cover the terminal energy demand of the building. For the scenarios studied, the PVB system could safely run the building during summer with the total power generation of 193.16 kWh, which is almost six times that of the building energy demand needed as shown in Table 10. However, considering the scenario of the building at winter, due to the huge energy demand, the PV system could power the building during day time, but the energy demand peak interval occurred at night when the total energy demand amounted to 146.07 kW as calculated in Table 11; therefore, a noticeable gap between the energy supply and demand side was observed. So a PV system with an even larger power generation capacity should be installed.
In the above analysis, we achieved the optimal battery energy storage system using the MSC strategy and GA method which proves excellent for high dimensional multi-parameters problem optimization with great generalization ability. Building energy demand varies dynamically according to outdoor thermal atmosphere and indoor occupancy patterns as well as electrical appliances’ occupancy period during the day. This acts as the optimization objective for the energy storage strategy. Therefore, the evaluation of the real time energy demand of the building including individual preference and characteristics is essential to the overall regulation and optimization of the battery storage system. To generalize our method for any scenario with different energy demand features, we applied the machine learning approach to train the artificial neutral network with samples from combinations of different building envelope areas and outdoor temperatures as well as different numbers of people indoor and different numbers of electrical appliances. For testing the robustness of our method, we used the new sample of building and PV system configuration according to the actual solar radiation, and then we calculated the building load again and tried to illustrate whether the PV system could safely run the building with the results summarized in Table 10 and Table 11.
Through the comparison, we found that the building load prediction for ANN is similar to conventional calculations, so our method was found to be robust for generalization. According to previous studies [31,32], a multi-layer neural network with sufficient hidden units can approximate any high-order, nonlinear function. These hidden units are similar to the neurons in the human brain and are updated during the learning process through backpropagation after every iteration. ANNs and their variants are used in many fields such as computer vision, speech recognition and regression. With deeper, nonlinear hidden layers, ANN can estimate complex nonlinear relationships based on data in comparison to conventional calculation methods.

4. Discussion

We formulated the actual configuration of the solar panel and battery bank system with clear interpretation and various evaluation indexes with different techno-economic aspects. The genetic algorithm was applied to find the overall optimization schedule of the PVB system based on the commonly used MSC energy management strategy. This study highlights two novelties.
Firstly, hierarchical optimization was conducted with a genetic algorithm using the MSC strategy. In this study, frequent charging and discharging of the battery energy storage system was regulated in a hierarchy. Hierarchical optimization transforms the tightly coupled battery energy storage system into decoupled subsystems or subprocesses, while coupling between the subsystems or subprocesses was achieved through parallel optimization of the operation state variables within GA. On one hand, the overall system was partitioned into solar panels and battery banks hierarchically. Each component was mathematically modeled and optimized sequentially. On the other hand, the charging/discharging phase was assigned first and simulated in sequence. During optimization, the adaptive on/off switchover according to MSC strategy was fully considered in order to promptly consume the PV generation.
Secondly, the machine learning approach was applied in conjunction with the genetic algorithm to perform online optimization for the predictive schedule. The battery storage system must account for individual preferences and characteristics, which result in different building energy demands that should be properly predicted. With proper prediction of building energy demand by means of a machine learning approach, the model’s robustness and predictive performance could be further extended with good scalability, which is essential to overall regulation and optimization.
There are three advantages of the methodology proposed in this paper for making an optimal operational schedule of the battery energy storage system, which are as follows: generic applicability, convenient implementation, good scalability. They are further described as follows:
(1)
Generic applicability: Building energy demand acts as the optimization objective for the energy storage strategy but it has many techno-economic indicators. This model was enhanced from previous studies, which typically focused on only one or two evaluation indicators. It could comprehensively evaluate the integrated objective, and is thus more applicable to complex scenarios.
(2)
Convenient implementation: As shown in the flow chart for simulation in Figure 3, this model could easily be applied in a real project. It performs simplified modeling on the core components of the battery system and commonly used techno-economic indicators. Moreover, it is based on the GA approach for global optimization, and makes a clear distinction between the charging and discharging phase considering the classical MSC strategy. Therefore, the optimization could be conveniently implemented for a real control strategy
(3)
Good scalability: The model shows great potential in terms of its scalability. This paper investigated a simple battery energy system configuration, and more energy storage components could be easily incorporated and integrated with the original system. Moreover, this model also provides a test bed for new techno-economic indicators applicable to the optimization and evaluation of the system.
However, some limitations should be noted despite the advantages mentioned above. As demonstrated in Figure 12 and Figure 15, the battery ageing and cumulative cost grow almost linearly with operation time. This is not consistent with the actual case, because some details of the model are missing. The proper calibration with real operation conditions should be considered to modify the model to be accurate enough. The detailed model of this relationship should be more complicated than the ideal linear trend shown in Figure 12 and Figure 15. However, the figures illustrate that the operation time does have an impact on the battery ageing and operation cost. In addition, it could be observed in Figure 10, Figure 14 and Figure 17 that the operation curves of the battery bank during charging and discharging were rather smooth, because all the scenarios were assumed to have no abrupt variation in the energy load or solar radiation. As the battery energy system acts as a flexible buffer between the energy demand and supply side, it is important to explore the operational performance under extreme weather conditions or a sudden increase in user demand.

5. Conclusions

We built a comprehensive evaluation model based on the MSC strategy and genetic algorithm for battery storage system optimization used in a residential building. Several important performance aspects were discussed and evaluated, such as battery charge/discharge performance, techno-economic indicators, and battery aging. To generalize our model to various battery energy storage optimizations, we applied a machine learning approach to learn the complex patterns of arbitrary preferences and settings of building demand. The main conclusions from our work are as follows:
(1)
This comprehensive evaluation model for the operational schedule of a battery storage system could account for both technological and economic indicators, and the optimal solution based on MSC strategy genetic algorithm could be found.
(2)
The three types of batteries including Discover AES, Electriq PowerPod2 and Tesla Powerwall+ could be considered as options for energy storage. For short term operation, there exists subtle differences in the technical performance among them but Tesla Powerwall+ was the most cost-effective option.
(3)
According to long-term simulation, Discover AES had a relatively higher total operation cost, but it resulted in the lowest level of battery aging. Therefore, Discover AES has the advantage of using PV generation in a timely manner to suit the load demand.
(4)
The machine learning approach provides a feasible option for us to adapt our optimization model based on the MSC strategy and GA method for arbitrary battery storage scenarios with different energy demand features.
Future work and prospects following this study are outlined below.
Firstly, although we found the typical cyclic operation feature of the battery storage system, all the scheduled optimizations were organized on the basis of a regular day and night shift without consideration of irregular cloudy or rainy days when PV power generation would be greatly influenced. In addition, this simulation was based on short-term operation, and long-term operation with full consideration of solar radiation and climate condition should be comprehensively studied in the future. It should be noted that more battery types still need to be compared for optimal options. This paper only studied three commonly applied batteries. They are not so distinctive in terms of performance indicators, especially battery aging. Thus, a more comprehensive evaluation and comparison of a wider range of batteries will be conducted in our future work to further validate the model for predictive scheduling. On the other hand, more techno-economic indicators could be involved according to different evaluation scenarios. The paper studied energy consumption of a small typical house with SCR and SSR. For a larger energy system (say a local energy system for district heating), suitable techno-economic indicators should be proposed and investigated in order to achieve the optimal charging and discharging strategy.
Secondly, the optimization objective in GA was evaluated only from the total operation cost and power supply imbalance ratio. The proper evaluation for the PVB system in practice should be determined in accordance with more specific requirements and an in-depth consideration of the significance of each aspect of performance. The simulation results indicate that the GA algorithm can provide the optimal solution. In this study, we set the optimization goal as one integrated function, and there were not many optimal parameters. In future work, multi-objective optimization should be considered, and GA optimization would also be improved with adaptive mutation and cross probability. In addition, the battery energy storage system was simulated under a simple schedule by charging during the day and discharging at night. A more realistic schedule will be incorporated into the algorithm to further test the optimization performance of the evaluation model developed in this study.
Thirdly, the timing match of PV generation and load demand is an important factor affecting the battery capacity and scheduling strategy of the system. In this study, only the hourly power supply match was simulated; therefore, in future studies the coupling optimization of sizing and scheduling of PVB systems under different timing match conditions of PV generation and load demand should be investigated. The mismatch between the energy demand and battery storage system could be optimally adjusted. However, optimization has not been validated by comparison against the operation strategy without a proper schedule. Future work should conduct a comparison for the full validation of the schedule. Additionally, long-term charging and discharging would have greater potential for energy peak shaving; therefore, it is necessary to study the timing match for daily, monthly or annual operation, respectively.
Lastly, it is known that the main issue in storing solar energy is solar fluctuation. To potentially remedy this, we need to store a lot of energy during peak sunlight hours, but this requires a larger battery [36]. Larger batteries are usually very costly and not sustainable. A revolutionary concept is to use structures as renewable energy sources. To compare cement battery against available batteries, additional information about basic concepts for assessing the energy performance of a structure is needed [37]. These concepts pertain to the pyro permittivity-based energy [38] and pyro electret-based energy as well as the volumetric power density (power per unit volume) and volumetric energy density (energy per unit volume). According to Malewar in Inceptive Mind [39], cement batteries only have an energy density of 0.8 Wh/L, but Lithium-ion batteries have an energy density of 250–670 Wh/L (Lithium-Ion). However, cement batteries provide a unique advantage because we can expand their storage capacity by incorporating them into an entire concrete building. Considering a 1600 ft2 house with an approximate envelope of 1280 ft2, the solar energy stored could total up to 21.78 kWh, which amounts to almost two Tesla Powerwall+ batteries’ usable capacity but with a nearly zero cost of operation.

Author Contributions

Conceptualization, Y.Z. and X.S.; methodology, Y.Z.; software, Y.Z.; validation, Y.Z. and X.S.; formal analysis, Y.Z.; investigation, X.Q.; resources, X.Q.; data curation, X.Q.; writing—original draft preparation, Y.Z.; writing—review and editing, Y.Z.; visualization, X.S.; supervision, X.Q.; project administration, X.Q.; funding acquisition, X.Q. All authors have read and agreed to the published version of the manuscript.

Funding

This research was funded by the National Natural Science Foundation of China, grant number 52161135202.

Data Availability Statement

The data presented in this study are available in this article.

Acknowledgments

The authors gratefully acknowledge the support of College of Energy of Zhejiang university.

Conflicts of Interest

The authors declare no conflict of interest. The funders had no role in the design of the study; in the collection, analyses, or interpretation of data; in the writing of the manuscript, or in the decision to publish the results.

Appendix A

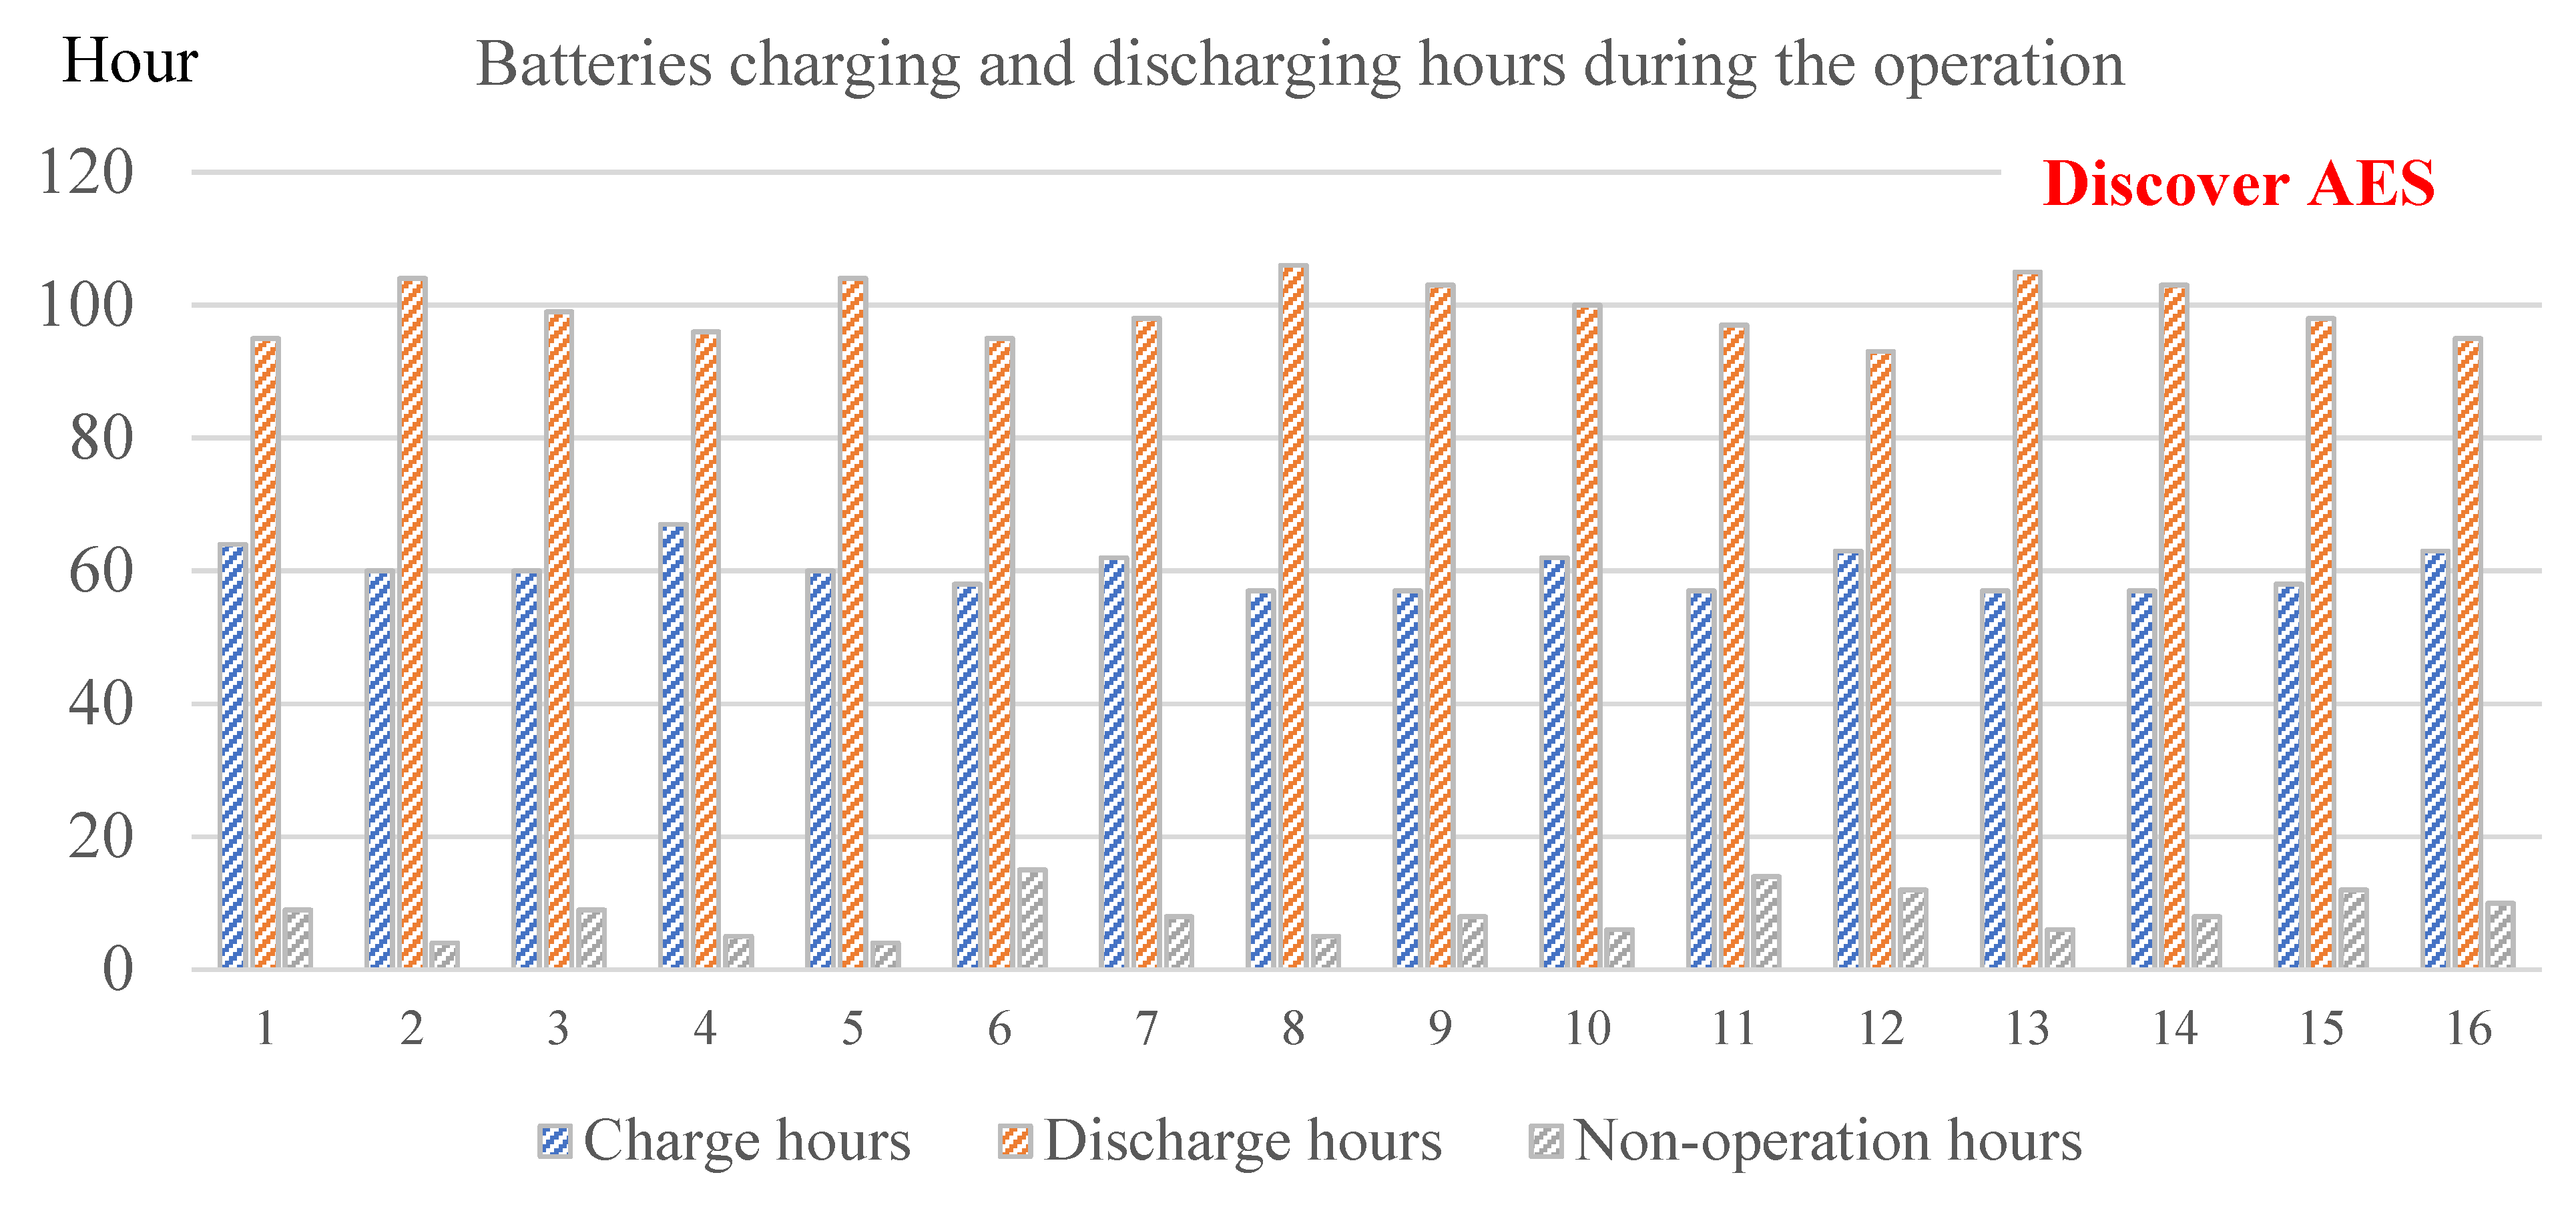
Figure A1. Total charging and discharging hours of Discover AES during the operation.
Sustainability 14 08821 g0a1
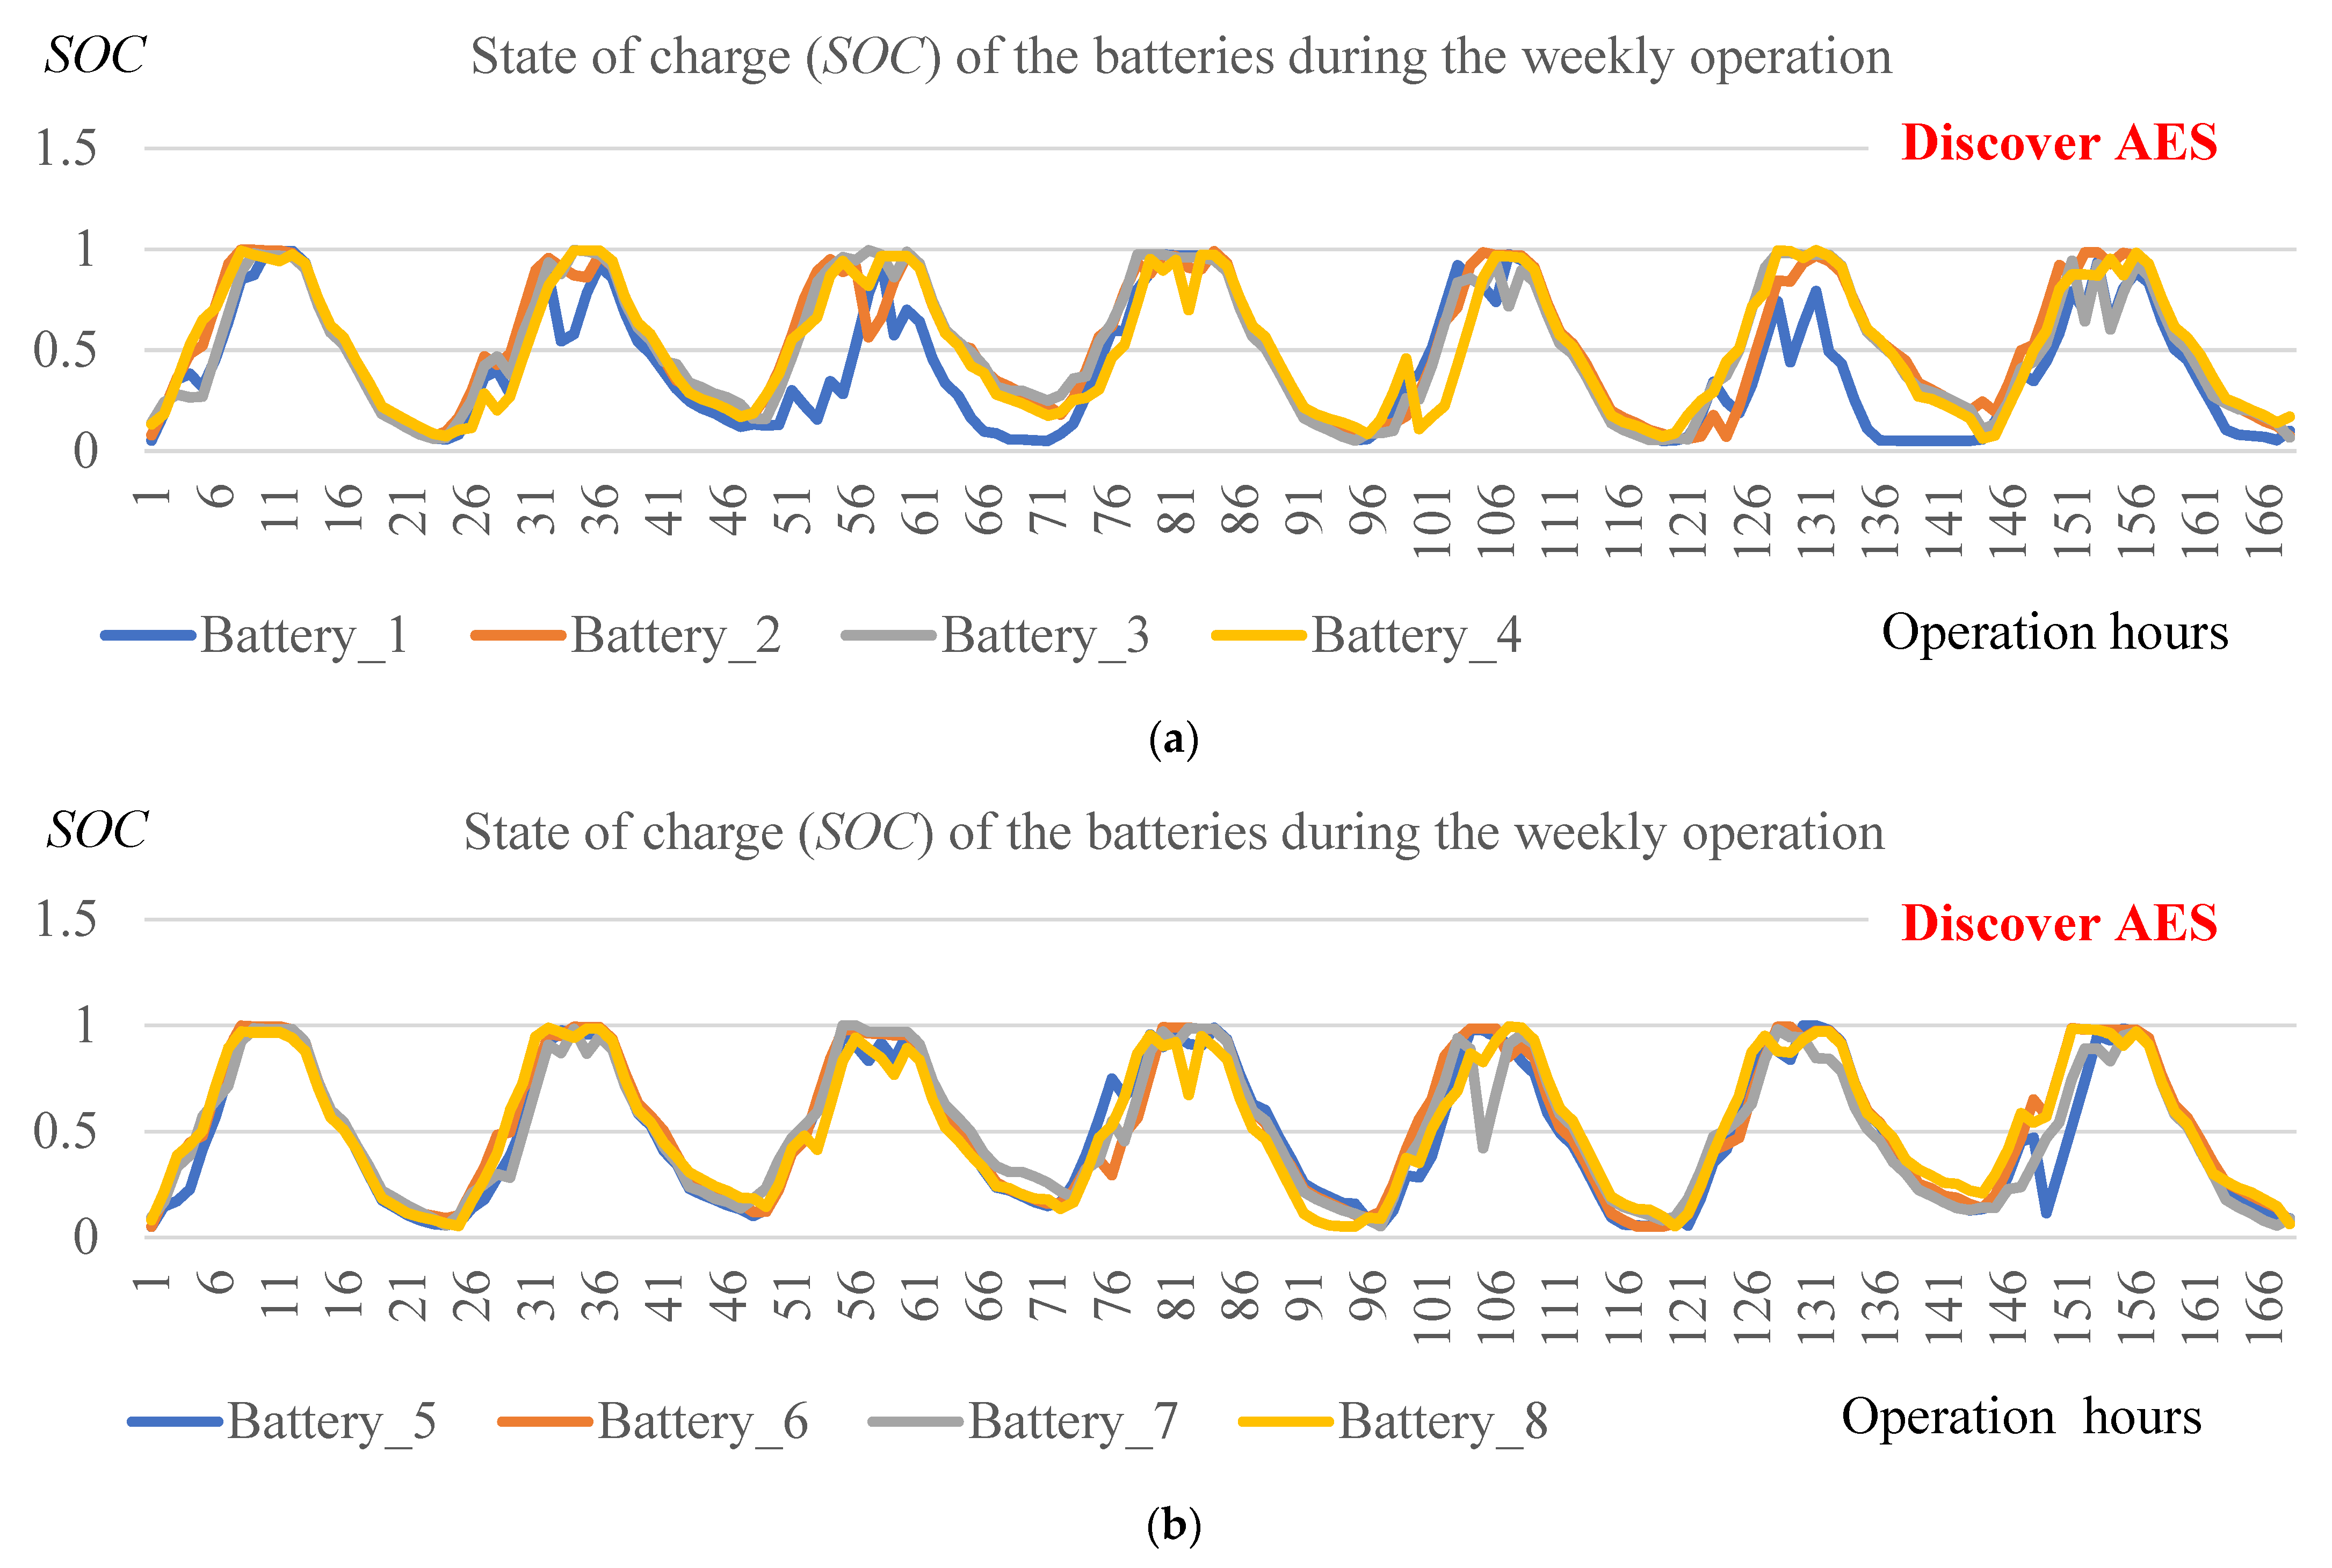
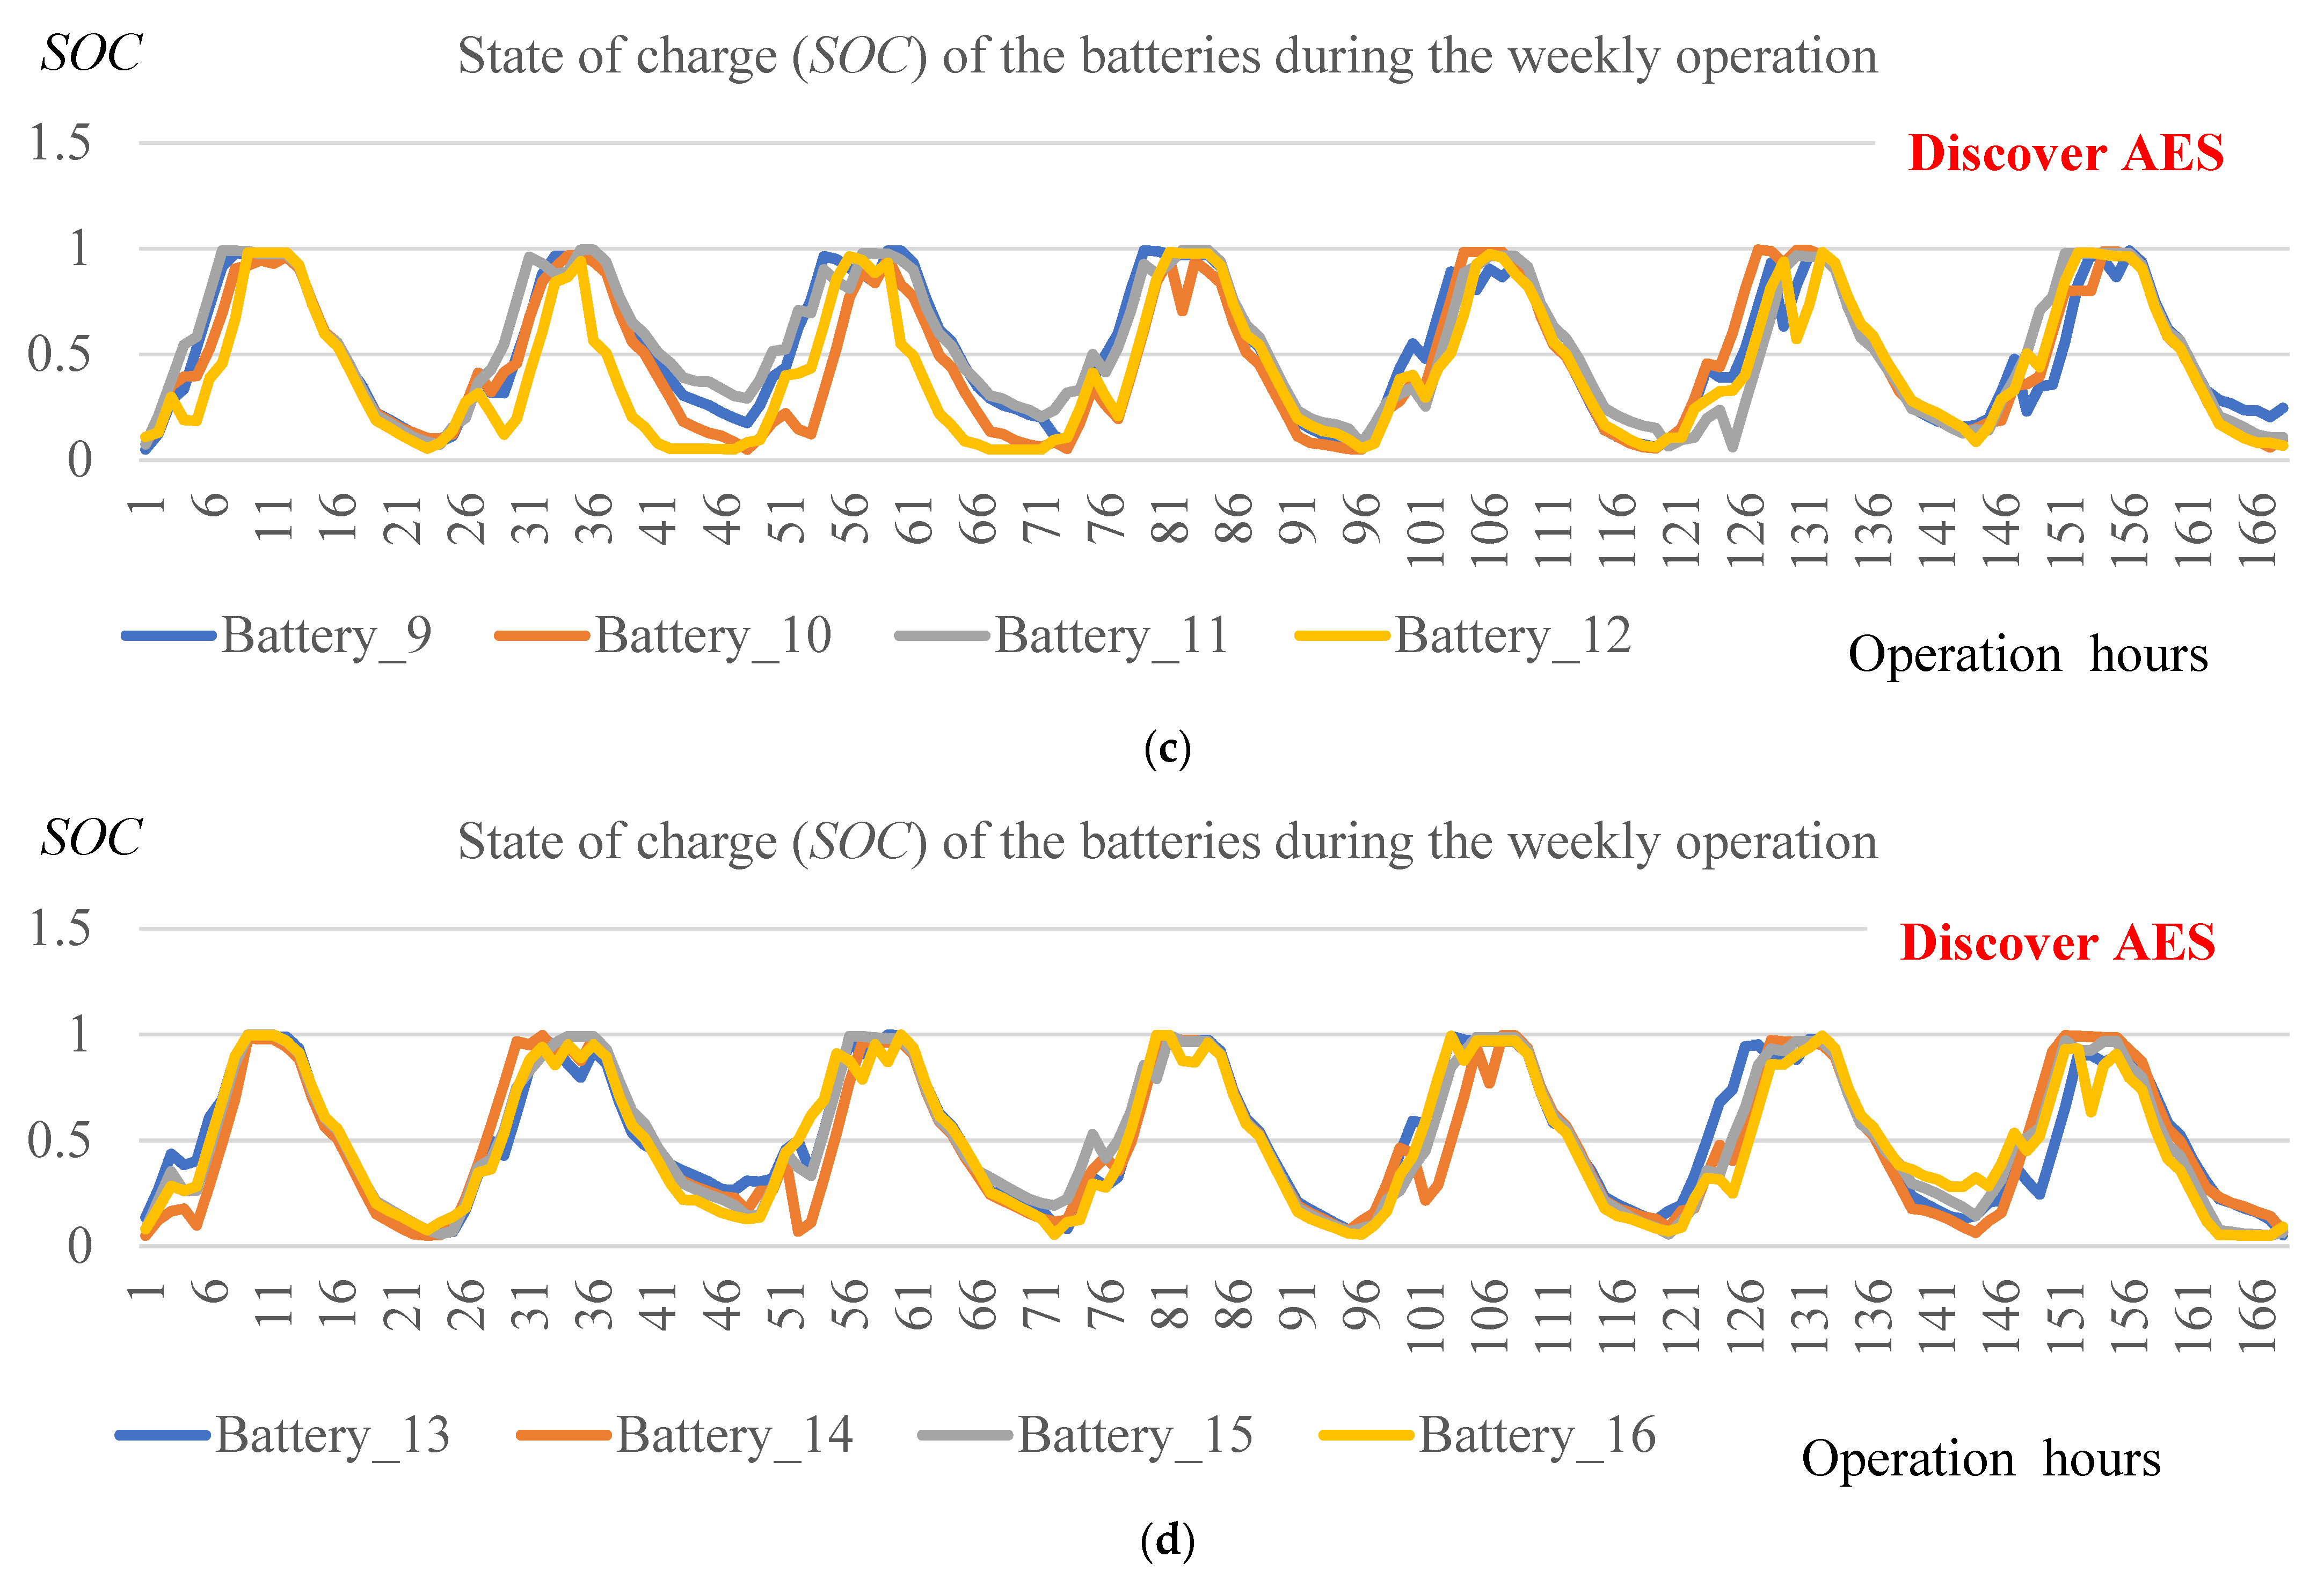
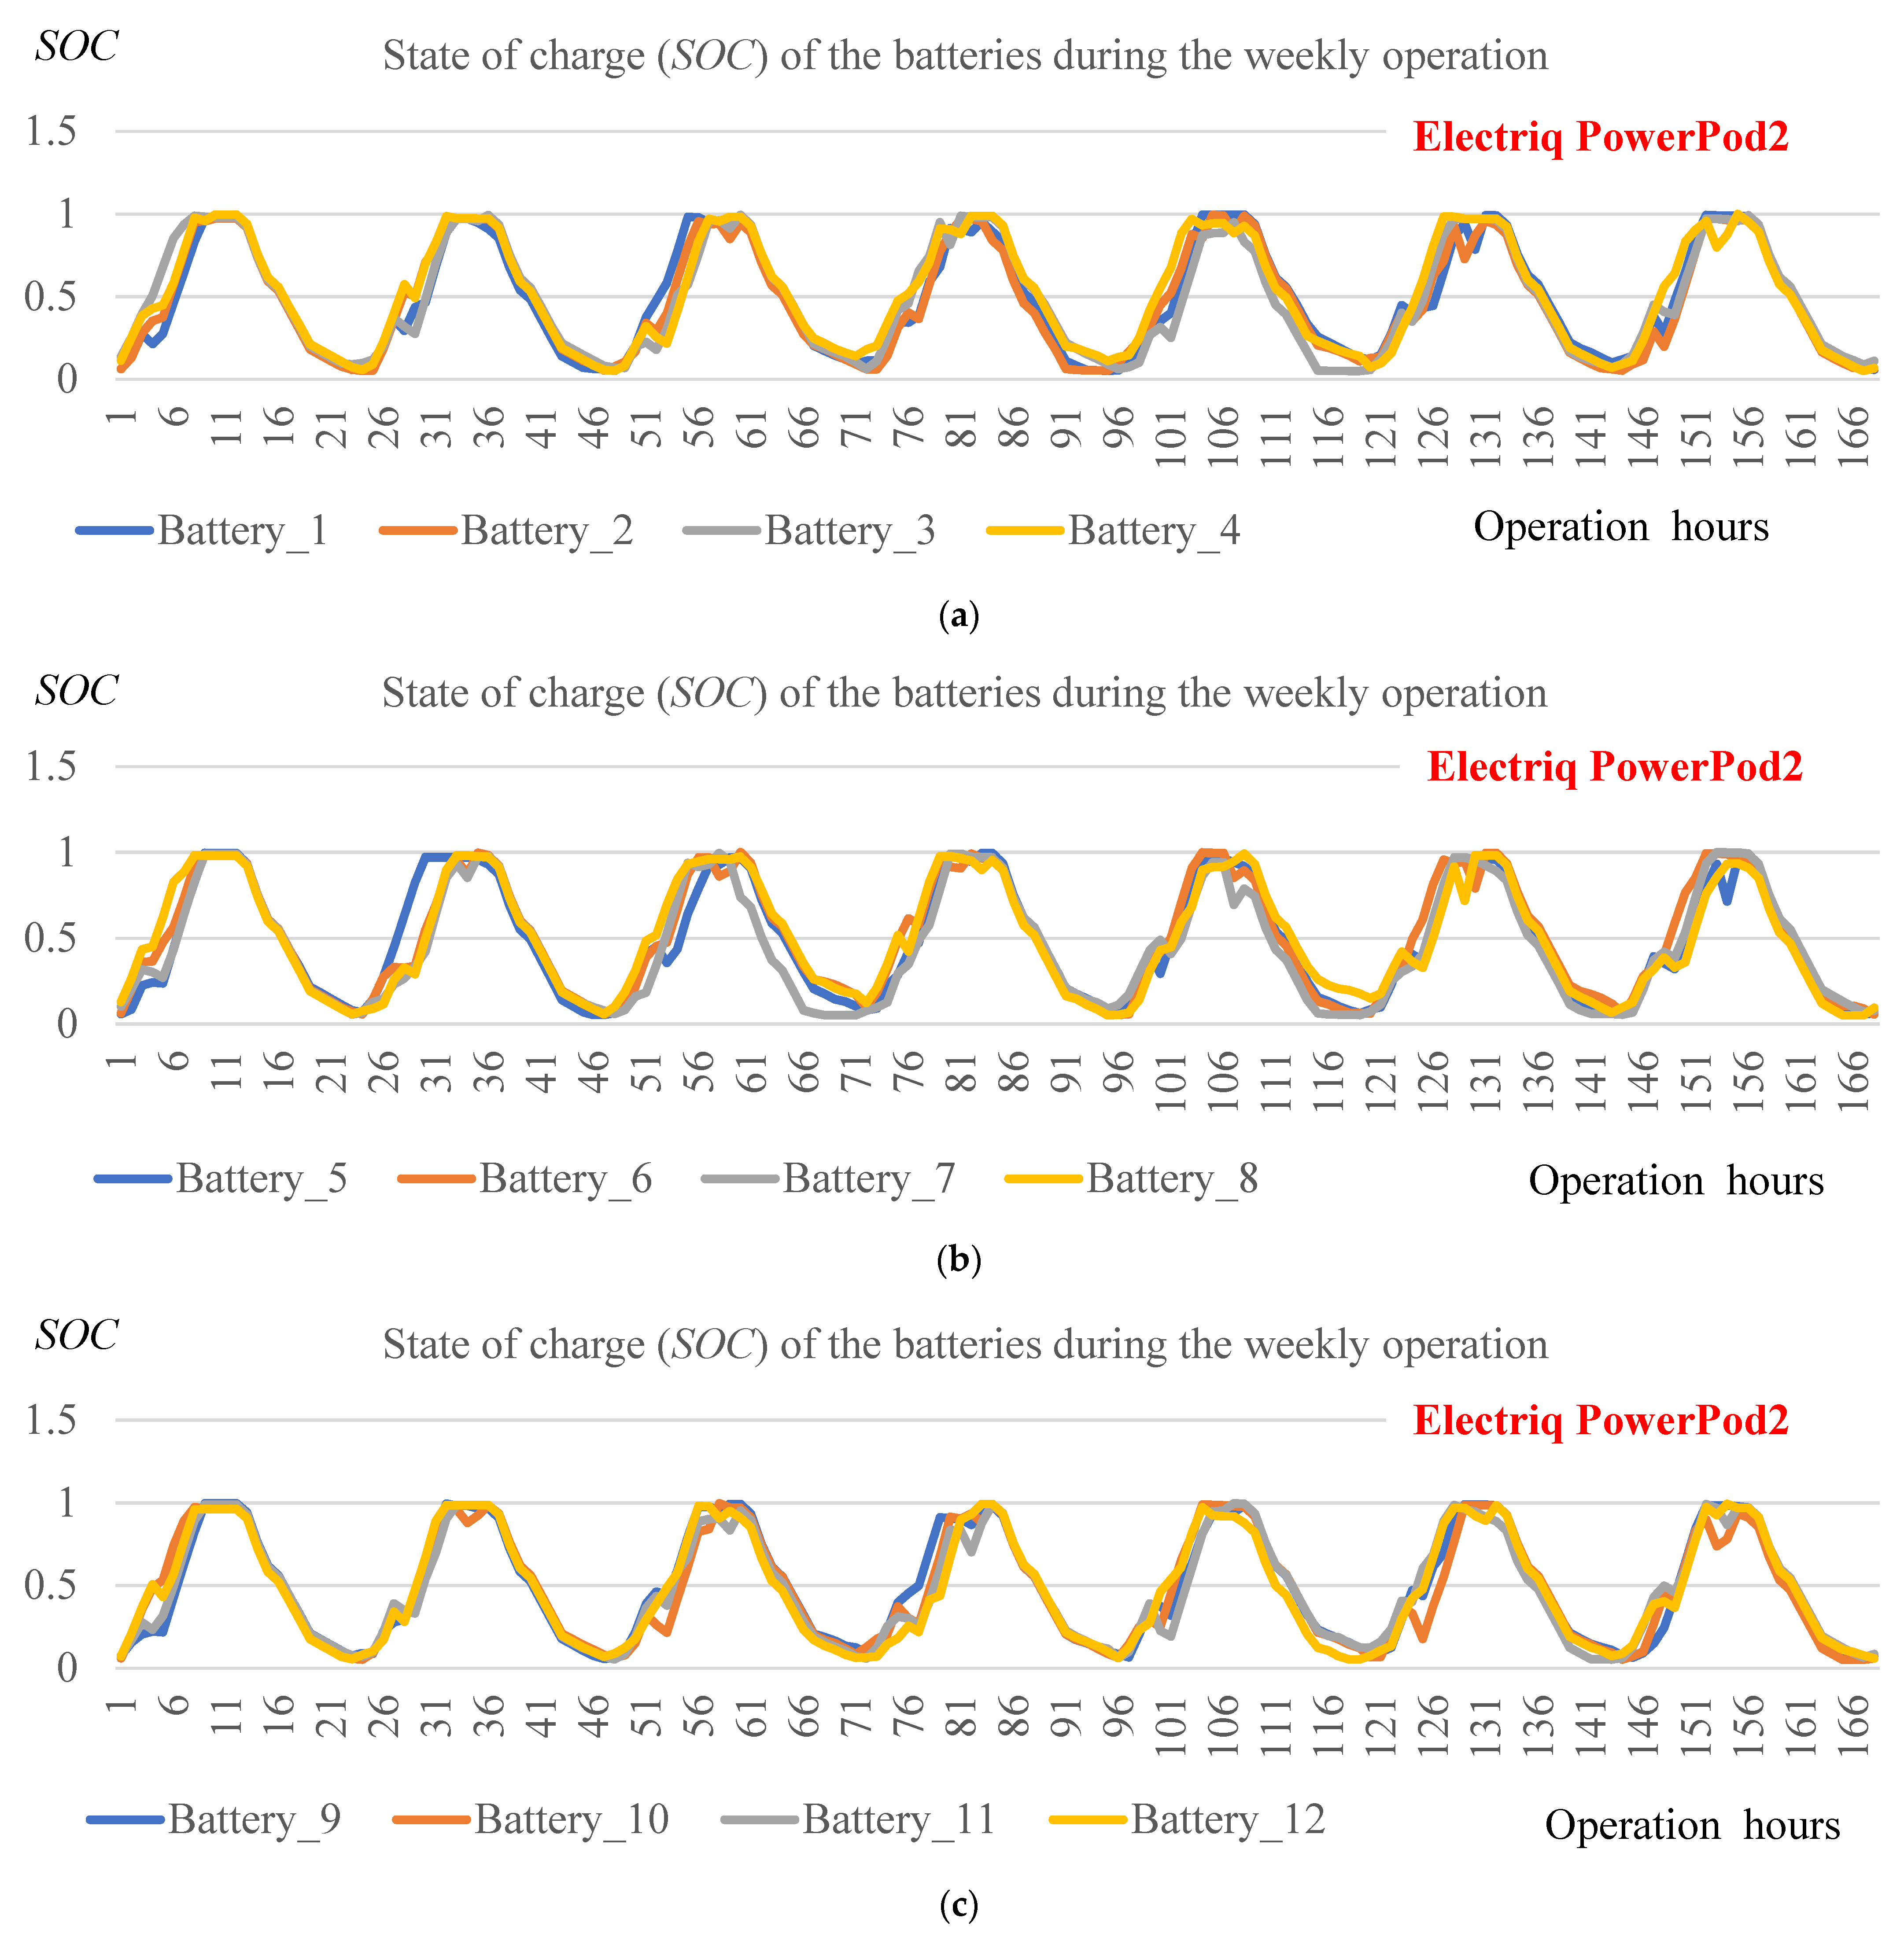
Figure A2. State of charge for Discover AES batteries during the operation. (a) batteries 1~4; (b) batteries 5~8; (c) batteries 9~12; (d) batteries 13~16.
Sustainability 14 08821 g0a2aSustainability 14 08821 g0a2b
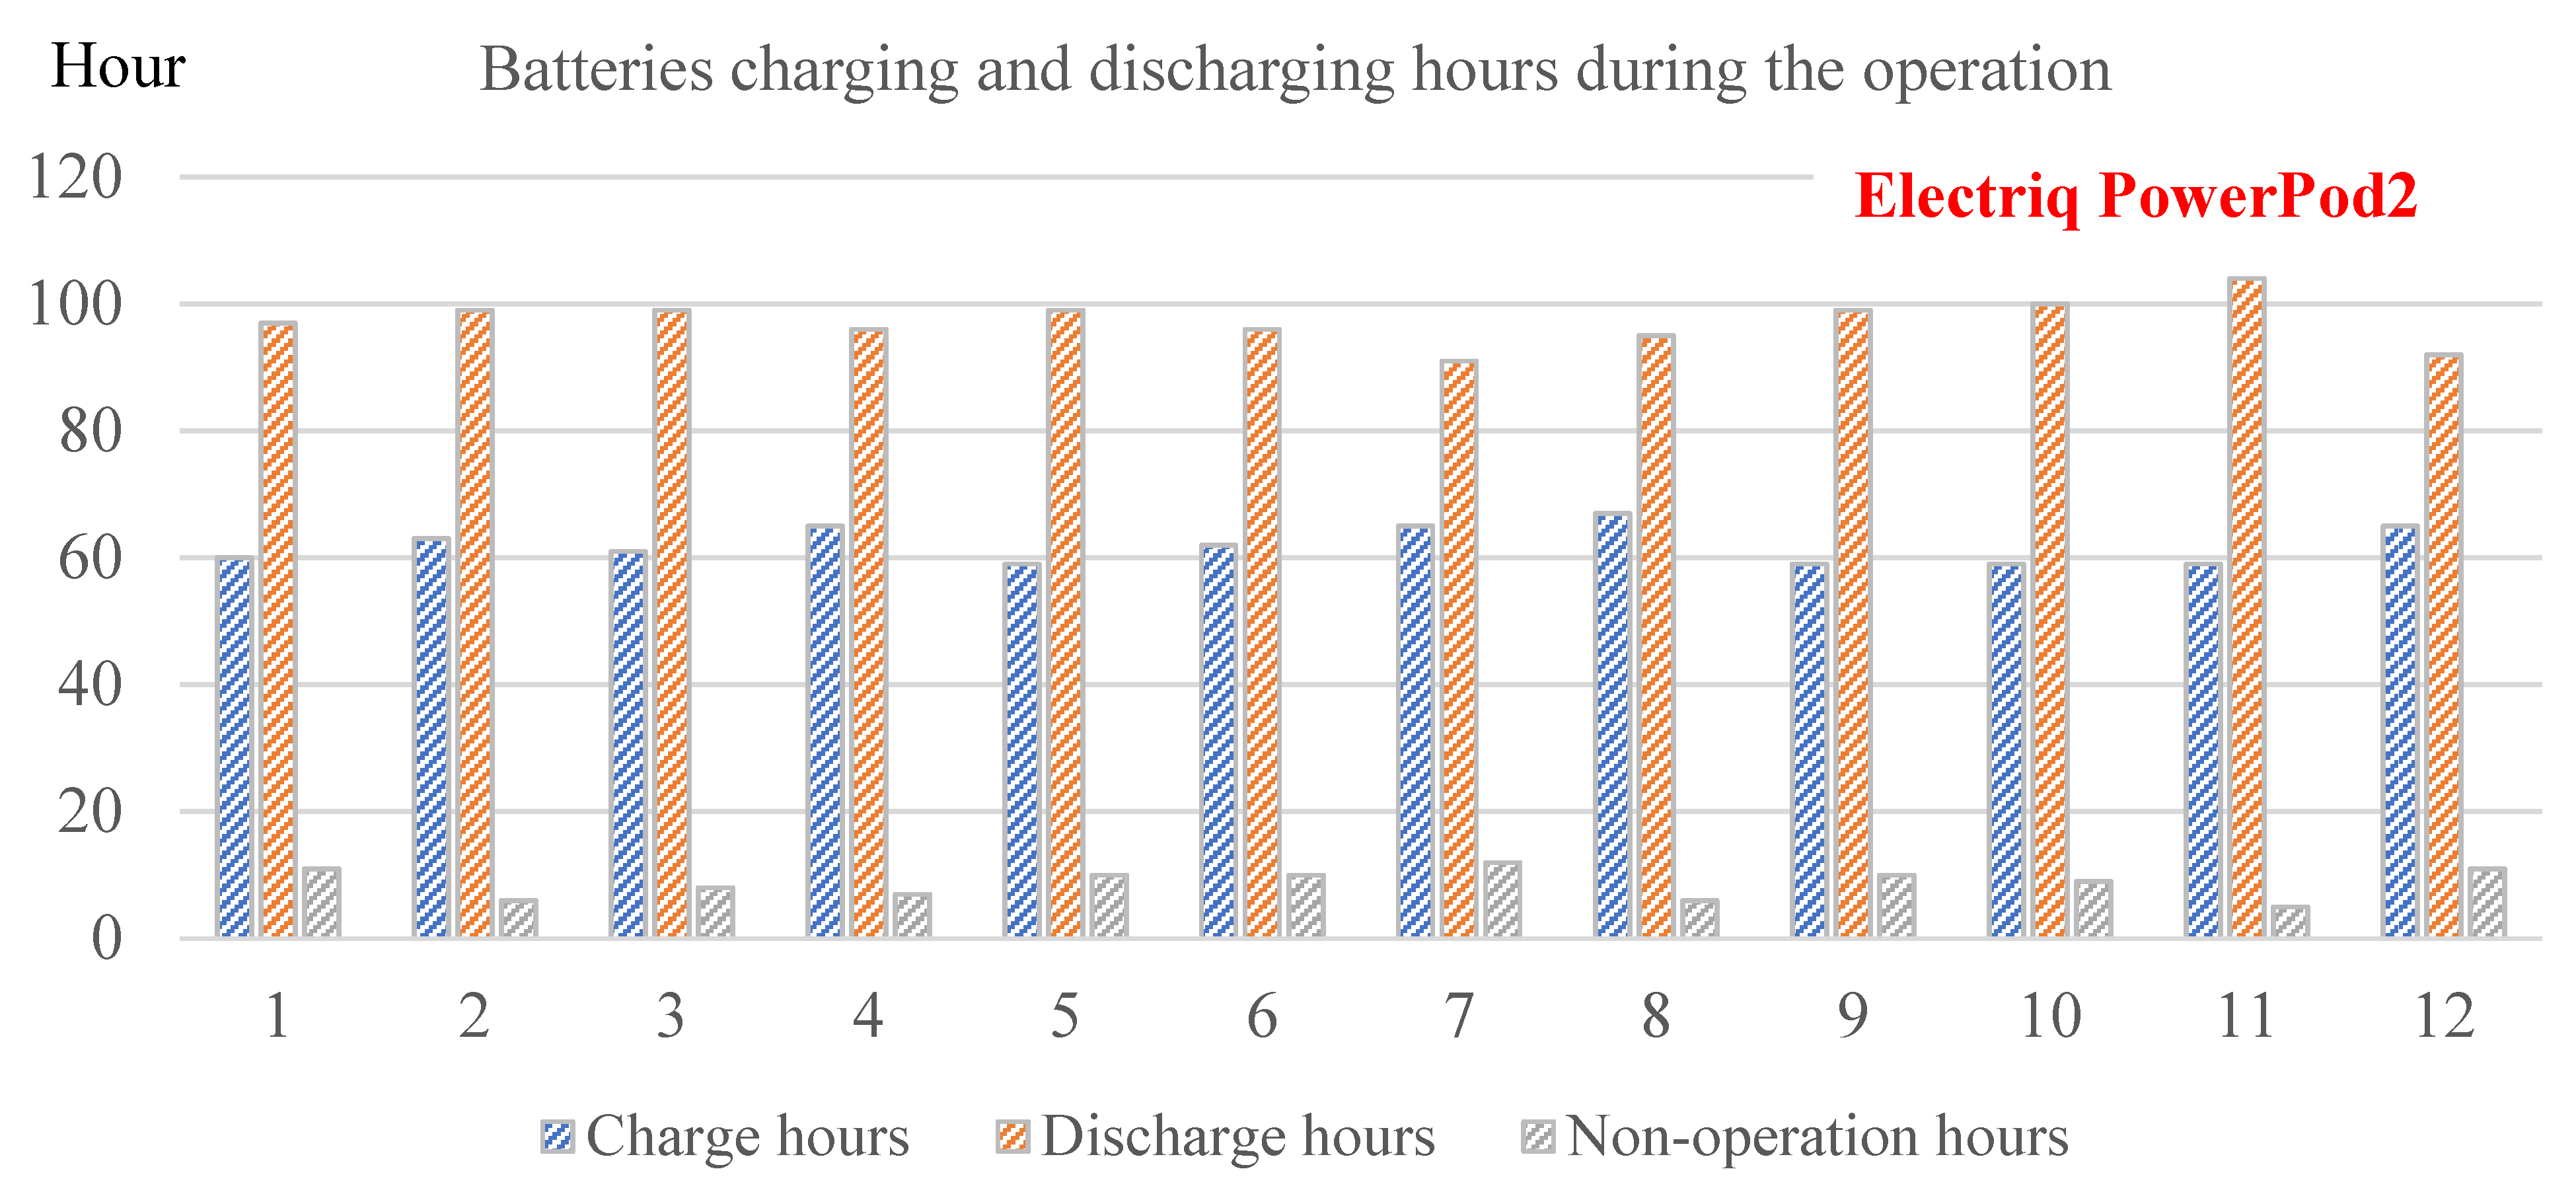
Figure A3. Total charging and discharging hours of Electriq PowerPod2 during the operation.
Sustainability 14 08821 g0a3
Figure A4. State of charge for Electriq PowerPod2 batteries during the operation. (a) batteries 1~4; (b) batteries 5~8; (c) batteries 9~12.
Sustainability 14 08821 g0a4

References

  1. Cabeza, L.F.; Chàfer, M. Technological options and strategies towards zero energy buildings contributing to climate change mitigation: A systematic review. Energy Build. 2020, 219, 110009. [Google Scholar] [CrossRef]
  2. Peng, J.; Yan, J.; Zhai, Z.; Markides, C.N.; Lee, E.S.; Eicker, U.; Zhao, X.; Kuhn, T.E.; Sengupta, M.; Taylor, R.A. Solar energy integration in buildings. Appl. Energy 2020, 264, 114740. [Google Scholar] [CrossRef]
  3. Zhang, Y.; Lundblad, A.; Campana, P.E.; Yan, J. Employing battery storage to increase photovoltaic self-sufficiency in a residential building of Sweden. Energy Procedia 2016, 88, 455–461. [Google Scholar] [CrossRef] [Green Version]
  4. Schram, W.L.; Lampropoulos, I.; van Sark, W.G.J.H.M. Photovoltaic systems coupled with batteries that are optimally sized for household self-consumption: Assessment of peak shaving potential. Appl. Energy 2018, 223, 69–81. [Google Scholar] [CrossRef]
  5. Guichi, A.; Talha, A.; Berkouk, E.M.; Mekhilef, S. Energy management and performance evaluation of grid connected PV-battery hybrid system with inherent control scheme. Sustain. Cities Soc. 2018, 41, 490–504. [Google Scholar] [CrossRef]
  6. Zou, B.; Peng, J.; Li, S.; Li, Y.; Yan, J.; Yang, H. Comparative Study of the Dynamic Programming-Based and Rule-Based Operation Strategies for Grid-Connected PV-Battery Systems of Office Buildings. Appl. Energy 2022, 305, 117875. [Google Scholar] [CrossRef]
  7. Braun, M.; Büdenbender, K.; Magnor, D.; Jossen, A. Photovoltaic self-consumption in Germany—Using lithium-ion storage to increase self-consumed photovoltaic energy. In Proceedings of the 24th European Photovoltaic Solar Energy Conference, Hamburg, Germany, 21–25 September 2009. [Google Scholar]
  8. Luthander, R.; Widén, J.; Nilsson, D.; Palm, J. Photovoltaic self-consumption in buildings: A review. Appl. Energy 2015, 142, 80–94. [Google Scholar] [CrossRef] [Green Version]
  9. Boussetta, M.; El Bachtiri, R.; Khanfara, M.; El Hammoumi, K. Assessing the potential of hybrid PV–Wind systems to cover public facilities loads under different Moroccan climate conditions. Sustain. Energy Technol. Assess. 2017, 22, 74–82. [Google Scholar] [CrossRef]
  10. Azuatalam, D.; Paridari, K.; Ma, Y.; Förstl, M.; Chapman, A.C.; Verbič, G. Energy management of small-scale PV-battery systems: A systematic review considering practical implementation, computational requirements, quality of input data and battery degradation. Renew. Sustain. Energy Rev. 2019, 112, 555–570. [Google Scholar] [CrossRef] [Green Version]
  11. Hussein Ala, A.; Fardoun Abbas, A. Design considerations and performance evaluation of outdoor PV battery chargers. Renew. Energy 2015, 82, 85–91. [Google Scholar] [CrossRef]
  12. Roy, A.; Bandyopadhyay, S. Design and optimization of wind-PV-battery hybrid system. In Wind Power Based Isolated Energy Systems; Springer: Berlin/Heidelberg, Germany, 2019; pp. 167–180. [Google Scholar]
  13. Cai, J.; Zhang, H.; Jin, X. Aging-aware predictive control of PV-battery assets in buildings. Appl. Energy 2019, 236, 478–488. [Google Scholar] [CrossRef]
  14. Chakir, A.; Tabaa, M.; Moutaouakkil, F.; Medromi, H.; Julien-Salame, M.; Dandache, A.; Alami, K. Optimal energy management for a grid connected PV-battery system. Energy Rep. 2020, 6, 218–231. [Google Scholar] [CrossRef]
  15. Hern’andez, J.C.; Sanchez-Sutil, F.; Mu˜noz-Rodríguez, F.J. Design criteria for the optimal sizing of a hybrid energy storage system in PV household-prosumers to maximize self-consumption and self-sufficiency. Energy 2019, 186, 115827. [Google Scholar] [CrossRef]
  16. Sharma, V.; Haque, M.H.; Aziz, S.M. Energy cost minimization for net zero energy homes through optimal sizing of battery storage system. Renew. Energy 2019, 141, 278–286. [Google Scholar] [CrossRef]
  17. Khan, F.; Pal, N.; Saeed Syed, H. Review of solar photovoltaic and wind hybrid energy systems for sizing strategies optimization techniques and cost analysis methodologies. Renew. Sustain. Energy Rev. 2018, 92, 937–947. [Google Scholar] [CrossRef]
  18. Zhang, Y.; Ma, T.; Elia Campana, P.; Yamaguchi, Y.; Dai, Y. A techno-economic sizing method for grid-connected household photovoltaic battery systems. Appl. Energy 2020, 269, 115106. [Google Scholar] [CrossRef]
  19. Mokrani, Z.; Rekioua, D.; Rekioua, T. Modeling control and power management of hybrid photovoltaic fuel cells with battery bank supplying electric vehicle. Int. J. Hydrog. Energy 2014, 39, 15178–15187. [Google Scholar] [CrossRef]
  20. Alramlawi, M.; Gabash, A.; Mohagheghi, E.; Li, P. Optimal operation of hybrid PV-battery system considering grid scheduled blackouts and battery lifetime. Sol. Energy 2018, 161, 125–137. [Google Scholar] [CrossRef]
  21. Angenendt, G.; Zurmühlen, S.; Axelsen, H.; Sauer, D.U. Comparison of different operation strategies for PV battery home storage systems including forecast-based operation strategies. Appl. Energy 2018, 229, 884–899. [Google Scholar] [CrossRef]
  22. Talavera, D.L.; Mu˜noz-Rodriguez, F.J.; Jimenez-Castillo, G.; Rus-Casas, C. A new approach to sizing the photovoltaic generator in self-consumption systems based on cost–competitiveness, maximizing direct self-consumption. Renew. Energy 2019, 130, 1021–1035. [Google Scholar] [CrossRef]
  23. Nyholm, E.; Goop, J.; Odenberger, M.; Johnsson, F. Solar photovoltaic-battery systems in Swedish households—Self-consumption and self-sufficiency. Appl. Energy 2016, 183, 148–159. [Google Scholar] [CrossRef] [Green Version]
  24. Verma, D.; Nema, S.; Shandilya, A.M.; Dash Soubhagya, K. Maximum power point tracking (MPPT) techniques: Recapitulation in solar photovoltaic systems. Renew. Sustain. Energy Rev. 2016, 54, 1018–1034. [Google Scholar] [CrossRef]
  25. Barth, N.; Jovanovic, R.; Ahzi, S.; Khaleel, M.A. PV panel single and double diode models: Optimization of the parameters and temperature dependence. Sol. Energy Mater. Sol. Cells 2016, 148, 87–98. [Google Scholar] [CrossRef]
  26. Abdmouleh, Z.; Gastli, A.; Ben-Brahim, L.; Haouari, M.; Al-Emadi, N.A. Review of optimization techniques applied for the integration of distributed generation from renewable energy sources. Renew. Energy 2017, 113, 266–280. [Google Scholar] [CrossRef]
  27. 2021 ASHRAE Fundamentals Handbook, SI. Available online: https://www.ashrae.org/technical-resources/ashrae-handbook/ashrae-handbook-online (accessed on 15 May 2022).
  28. U.S. Energy Information Administration—EIA—Independent Statistics and Analysis. Residential Energy Consumption Survey (RECS)-Data-U.S. Energy Information Administration (EIA). 2015. Available online: https://www.eia.gov/consumption/residential/data/2015/index.php?view=consumption#undefined (accessed on 15 May 2022).
  29. List of the Power Consumption of Typical Household Appliances. “Power Consumption of Typical Household Appliances” . Daft Logic, Daft Logic. Available online: https://www.daftlogic.com/information-appliance-power-consumption.htm (accessed on 6 November 2021).
  30. Teacher, English. “Home Appliances: 30 Best Household Electrical Appliances for Your Home”. Visual Dictionary, Visual Dictionary. Available online: https://visualdictionary.org/homeappliances/ (accessed on 19 April 2021).
  31. Hornik, K.; Stinchcombe, M.; White, H. Multilayer feedforward networks are universal approximators. Neural Netw. 1989, 2, 359–366. [Google Scholar] [CrossRef]
  32. Leshno, M.; Lin, V.Y.; Pinkus, A.; Schocken, S. Multilayer feedforward networks with a nonpolynomial activation function can approximate any function. Neural Netw. 1993, 6, 861–867. [Google Scholar] [CrossRef] [Green Version]
  33. Wu, W.; Kanamori, Y.; Zhang, R.; Zhou, Q.; Takahashi, K.; Masui, T. Implications of declining household economies of scale on electricity consumption and sustainability in China. Ecol. Econ. 2021, 184, 106981. [Google Scholar] [CrossRef]
  34. Ellsworth-Krebs, K. Implications of declining household sizes and expectations of home comfort for domestic energy demand. Nat. Energy 2019, 5, 1–6. [Google Scholar]
  35. Diao, L.; Sun, Y.; Chen, Z.; Chen, J. Modeling energy consumption in residential buildings: A bottom-up analysis based on occupant behavior pattern clustering and stochastic simulation. Energy Build. 2017, 147, 47–66. [Google Scholar] [CrossRef]
  36. Moy, K.; Lee, S.B.; Harris, S.J.; Onori, S. Design and Validation of Synthetic Duty Cycles for Grid Energy Storage Dispatch Using Lithium-ion Batteries. Adv. Appl. Energy 2021, 4, 100065. [Google Scholar] [CrossRef]
  37. Zhang, E.Q.; Tang, L. Rechargeable Concrete Battery. Buildings 2021, 11, 103. [Google Scholar] [CrossRef]
  38. Wen, S.; Chung, D.D.L. Pyroelectric behavior of cement-based materials. Cem. Concr. Res. 2003, 33, 1675–1679. [Google Scholar] [CrossRef]
  39. Malewar, A. Rechargeable Cement-Based Battery Could Let Buildings Store Energy. Inceptive Mind. Available online: https://www.inceptivemind.com/worlds-first-rechargeable-cement-based-battery-concept/19037/ (accessed on 4 August 2021).
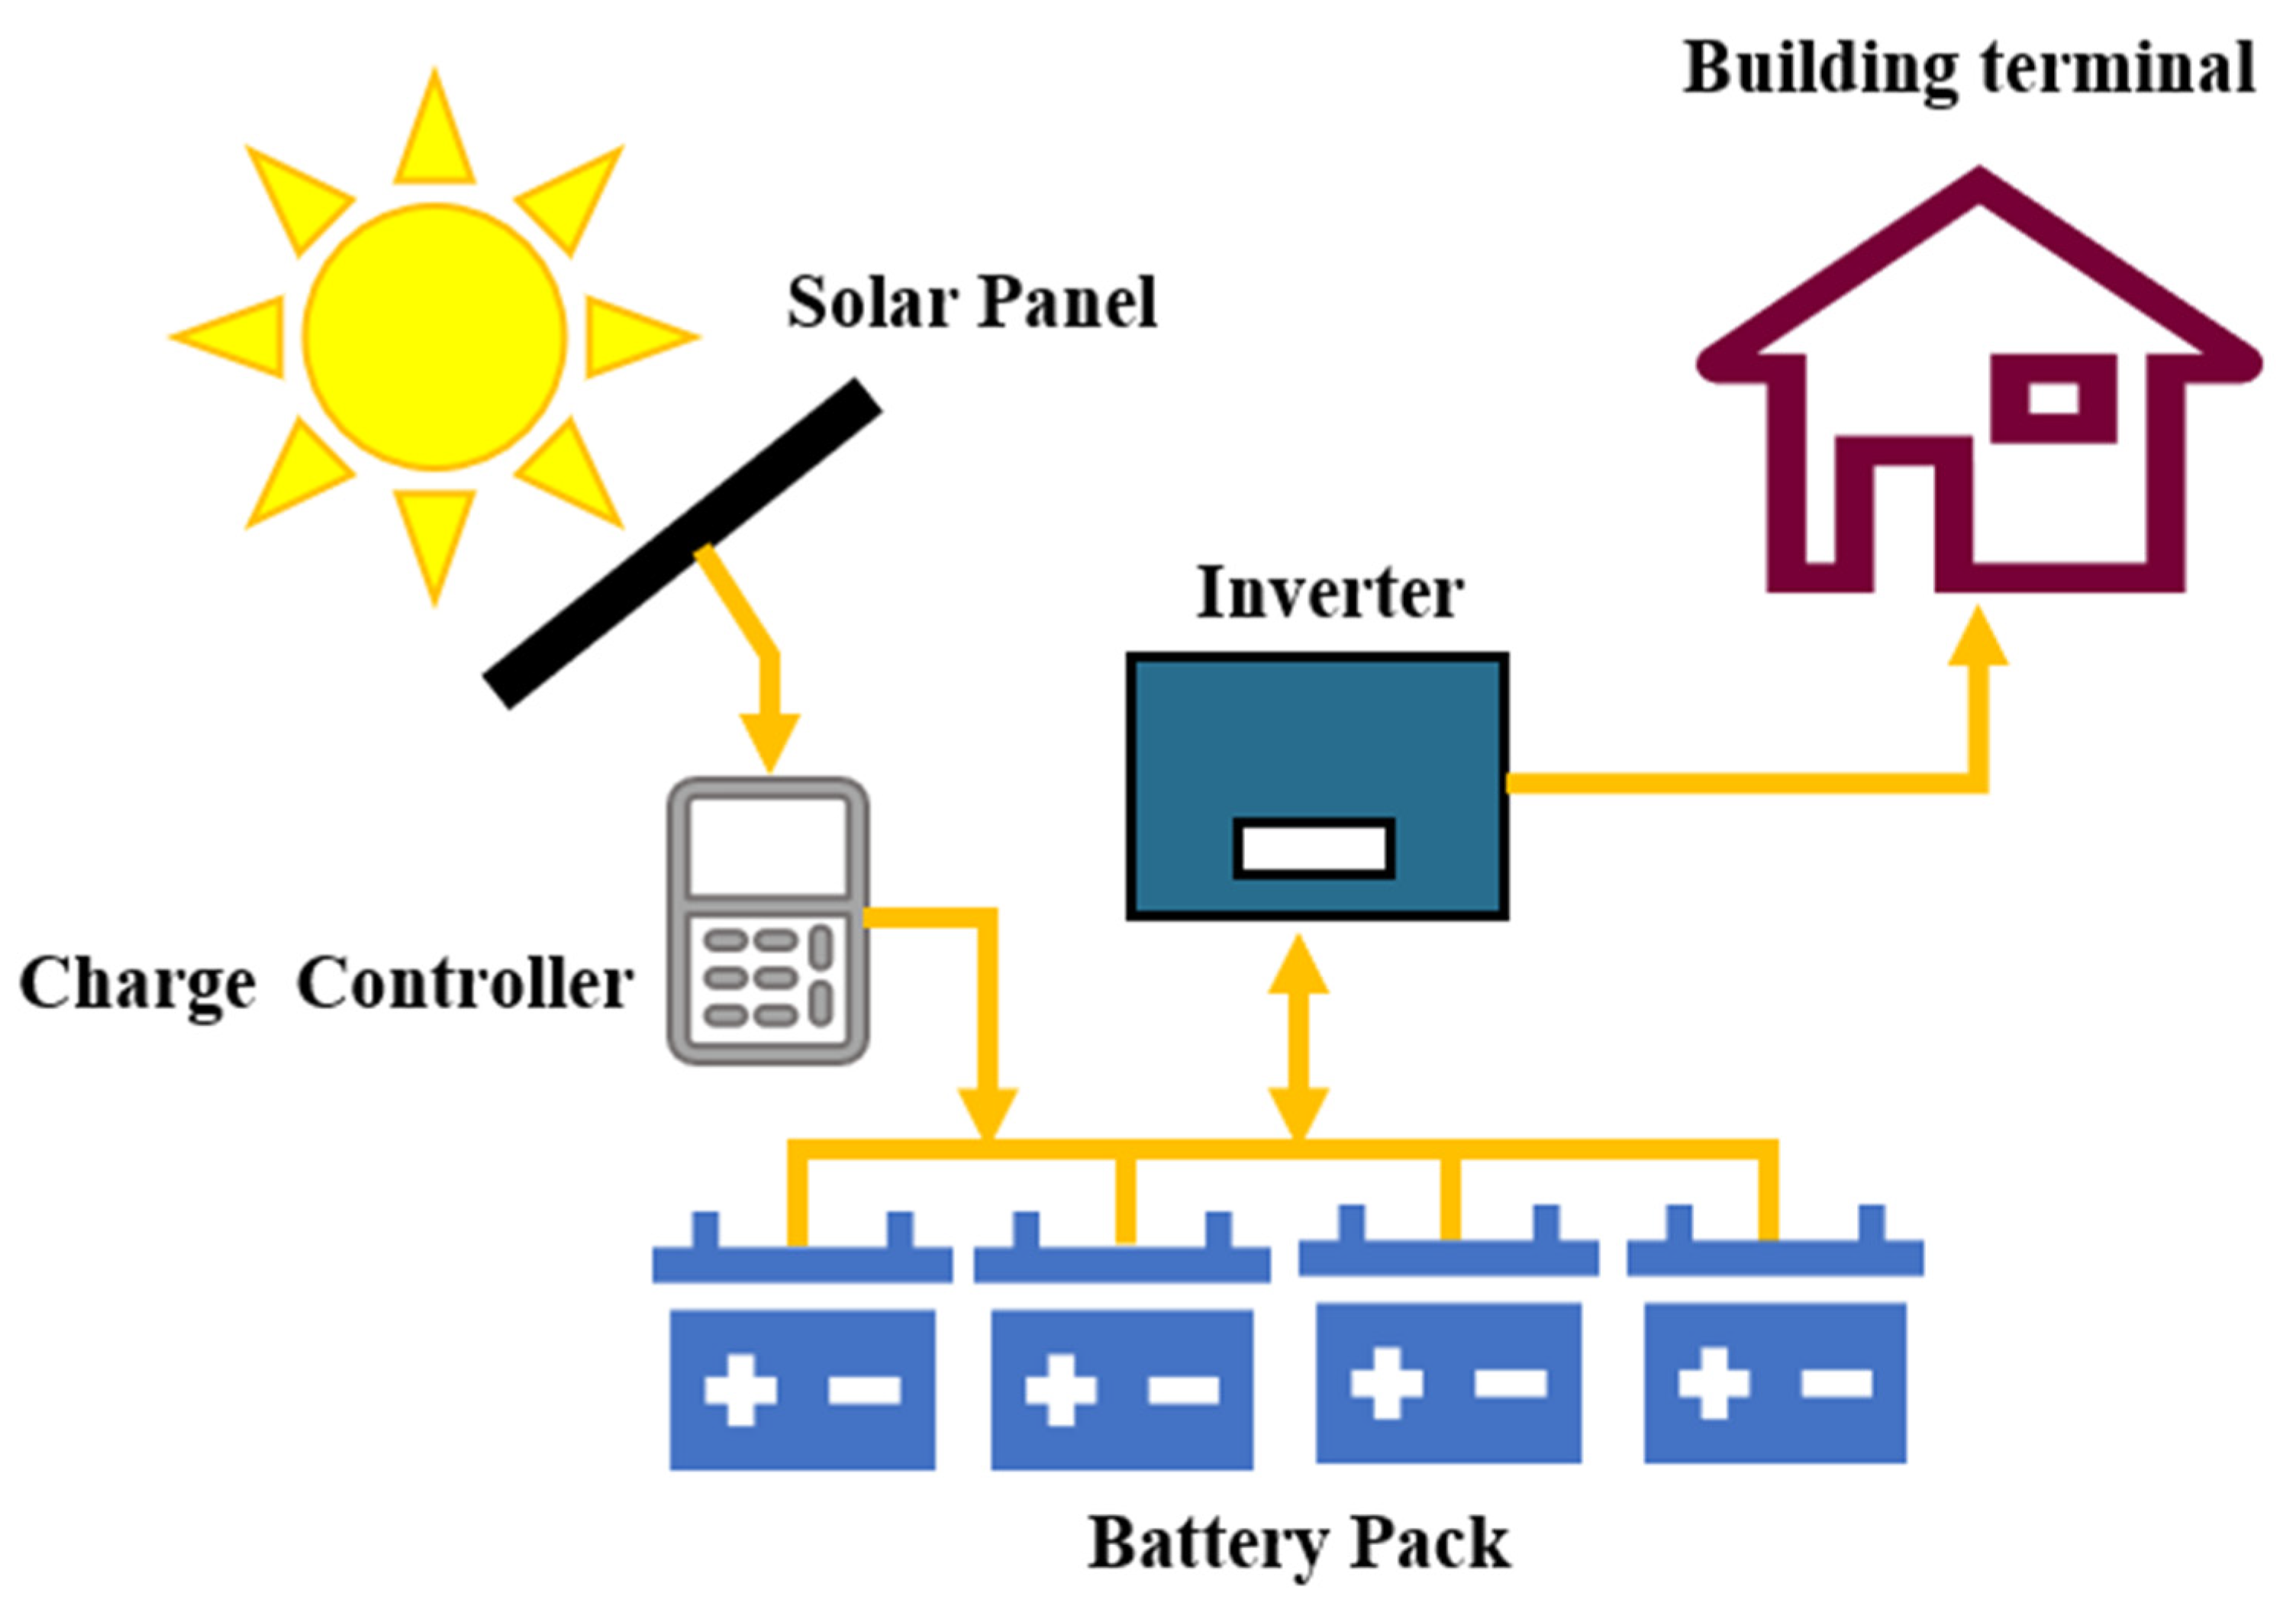
Figure 1. Schematic of battery storage system for solar energy.
Sustainability 14 08821 g001
Figure 2. Flowchart of the optimal operation strategy for a battery energy storage system with solar energy resource.
Sustainability 14 08821 g002
Figure 3. ANN prediction of building energy demand.
Sustainability 14 08821 g003
Figure 4. Optimal operation schedules for individual battery energy storage system with building energy demand prediction.
Sustainability 14 08821 g004
Figure 5. Energy consumption (kW) of a typical house in USA.
Sustainability 14 08821 g005
Figure 6. Energy consumption ratio of a typical house in USA. (a) Three parts of electric power in the typical house; (b) Three parts of daily energy consumption in the typical house.
Sustainability 14 08821 g006
Figure 7. Standard ASHARE schedule for residential building.
Sustainability 14 08821 g007
Figure 8. Distribution of the building energy demand throughout the day.
Sustainability 14 08821 g008
Figure 9. PV power generation of the solar panel during the day.
Sustainability 14 08821 g009
Figure 10. Hourly electric power supply of the PV batteries during the weekly operation.
Sustainability 14 08821 g010
Figure 11. Hourly electric power supply of the PV batteries during the daily operation.
Sustainability 14 08821 g011
Figure 12. Cumulative cost of the battery bank.
Sustainability 14 08821 g012
Figure 13. Cumulative cost of the PV panel.
Sustainability 14 08821 g013
Figure 14. Performance evaluation of the battery storage system: SCR, SSR, LCR and power supply imbalance ratio. (a) SCR; (b) SSR; (c) LCR.
Sustainability 14 08821 g014aSustainability 14 08821 g014b
Figure 15. Aging index of the batteries during the operation.
Sustainability 14 08821 g015
Figure 16. Total charging and discharging hours of Tesla Powerwall+ during the operation.
Sustainability 14 08821 g016
Figure 17. State of charge for Tesla Powerwall+ batteries during the operation. (a) batteries 1~4; (b) batteries 5~9.
Sustainability 14 08821 g017
Figure 18. Outdoor temperature during the year for evaluation of HVAC energy load.
Sustainability 14 08821 g018
Figure 19. Sun radiation of the new scenario in study: Solar_radiation_1 is the case studied in Section 5 and Solar_radiation_2 is the case studied in this section for generalization evaluation.
Sustainability 14 08821 g019
Figure 20. PV power generation according to the sun radiation of the new scenario studied in this section for generalization evaluation.
Sustainability 14 08821 g020
Figure 21. Validation of HVAC energy demand prediction by ANN.
Sustainability 14 08821 g021
Table 1. Input features of samples for ANN training.
ParameterRange of Value
Occupancy interval (h)0.5~10
Building floor area (ft2)600~2600
Thermal conductivity (W/m/K)0.1~0.5
Outdoor temperature (°C)−4~30
Indoor temperature (°C)24~26
Solar radiation intensity (W/m2)50~850
Number of people per house1~4
Number of electric appliances per house15~45
Average electric power of appliances (kW)0.5~5
Table 2. Common electrical appliances and the average power consumption (kW) in the house.
NumberElectrical
Appliance
Average Power Consumption and Daily Work Hours NumberElectrical
Appliance
Average Power Consumption and Daily Work Hours
1Stove2.00 kW/0.67 h16Computer and laptop0.350 kW/9.0 h
2Microwave1.150 kW/0.33 h17Cellphone 0.005 kW/9.0 h
3Ice Cream Maker1.800 kW/0.1 h18Lawn Mower1.200 kW/0.2 h
4Dishwasher1.350 kW/1.0 h19Vacuum Cleaner0.675 kW/0.3 h
5Rice Cooker0.500 kW/0.5 h20Electric vehicle10.00 kW/3.0 h
6Food Processor0.350 kW/0.1 h21Heat pump15.00 kW/3.67 h
7Blender0.350 kW/0.1 h22Air Conditioner2.500 kW/9.0 h
8Electric Kettle2.100 kW/0.3 h23Space Heater3.500 kW/12.0 h
9Clothes Dryer2.500 kW/0.67 h24Radiator0.500 kW/0.3 h
10Sewing Machine0.075 kW/0.5 h25Humidifier0.038 kW/2.0 h
11Washing Machine0.500 kW/0.67 h26Water Heater7.700 kW/3.67 h
12Iron1.000 kW/0.3 h27Evaporative Cooler2.600 kW/3.0 h
13Hairdryer2.150 kW/0.27 h28Freezer0.050 kW/6.67 h
14TV (49 Inch)0.085 kW/6.0 h29Fan (Desk)0.018 kW/0.4 h
15Lighting1.200 kW/9.0 h30Ceiling Fan0.065 kW/1.5 h
Table 3. Sample of batteries used for solar storage.
BatteryCost
(USD)
Battery TypeWeight
(lbs.)
Dimension
(L × W × D in inches)
Deka solar 8GCC2 6V 198$368SGLA6810.25 × 7.1 × 10.9
Trojan L-16-SPRE 6V 415$492FLA11811.7 × 6.9 × 17.6
Discover AES 7.4 kWh$6478LFP19218.5 × 13.3 × 14.7
Electriq PowerPod2$13,000LFP34627.5 × 50 × 9
Tesla Powerwall+$8500NMC343.962.8 × 29.7 × 6.3
Continuous Power Rating
(kW)
Instaneous Power Rating (kW)Round-Trip Efficiency
(%)
Usable Capacity
(kWh)
0.049 kW (for 20 h)−0.017 kW (for 100 h)Not Available80~85%1.18 kWh
0.19 kW (for 10 h)−0.023 kW (for 100 h)Not Available80~85%2.5 kWh
6.65 kW14.4 kW (for 3 s)>95%7.4 kWh
7.6 kW9 kW (for 60 s)96.60%10 kWh
7 kW10 kW (for 10 s)90.00%13.5 kWh
Table 4. Specifications of the batteries used in this study.
ParameterValue
Life cycle number4000
SOCmin0.05
SOCmax1
Table 5. Specifications of the solar panel for photovoltaic power generation.
ParameterValue
PV curve-fitting parameter γ0.004576 °C/V
Module series resistance10 Ω
Regression coefficient of photocurrent0.075 A m2/W
Regression coefficient of module temperature0.03125 °C m2/W
Referrence diode reverse saturation current90 A
PV voltage adjustment range by MPPT controller200~600 V
Table 6. Performance comparison of three types of charging batteries.
IndicatorsDiscover AESElectriq PowerPod2Tesla Powerwall+
SOH0.9990.9990.999
Total cost ($)3.36 × 1044.87 × 1042.36 × 104
SCR during the day1.01.01.0
SSR (max)6.16.16.1
SSR (min)0.80.80.8
LCR (max)5.95.44.3
LCR (min)0.430.470.59
Power supply imbalance ratio (max)4.944.443.3
Power supply imbalance ratio (min)−0.57−0.52−0.41
Table 7. Long-term performance comparison of three types of charging batteries.
Operation TimeIndicatorsDiscover AESElectriq PowerPod2Tesla Powerwall+
One yearSOH0.9670.9520.943
Total cost ($)3.36 × 1044.87 × 1042.36 × 104
Two yearsSOH0.9340.9040.886
Total cost ($)6.72 × 1049.74 × 1044.72 × 104
Three yearsSOH0.9010.8560.829
Total cost ($)1.08 × 1051.46 × 1057.08 × 104
Four yearsSOH0.8680.8080.772
Total cost ($)1.34 × 1051.95 × 1059.44× 104
Five yearsSOH0.8350.760.715
Total cost ($)1.68 × 1052.44 × 1051.18 × 105
Table 8. Specifications of the building studied in this case.
ParameterValue
Building floor area (ft2)2000
Number of people per area (/ft2)4
Occupancy interval (h)7
Thermel resistance (m2‧ K/W)1.35
Thermal conductivity (W/m/K)0.17
Specific thermal capacity (J/kg/K)800
Thermal diffusion coefficient (m2/s)4.98 × 10−5
Wall thickness (mm)230
Delay of the temperature wave0.1963
Table 9. Daily temperature distribution at different months of the year.
MonthDaily Temperature DistributionMonthDaily Temperature Distribution
January T a i r ( t ) = 1 + 5 sin ( π 12 ( t 6 ) ) July T a i r ( t ) = 24.5 + 6.5 sin ( π 12 ( t 6 ) )
February T a i r ( t ) = 3.5 + 5.5 sin ( π 12 ( t 6 ) ) August T a i r ( t ) = 24 + 6 sin ( π 12 ( t 6 ) )
March T a i r ( t ) = 7.5 + 5.5 sin ( π 12 ( t 6 ) ) September T a i r ( t ) = 20 + 6 sin ( π 12 ( t 6 ) )
April T a i r ( t ) = 13 + 6 sin ( π 12 ( t 6 ) ) October T a i r ( t ) = 14 + 6 sin ( π 12 ( t 6 ) )
May T a i r ( t ) = 17.5 + 6.5 sin ( π 12 ( t 6 ) ) November T a i r ( t ) = 8.5 + 5.5 sin ( π 12 ( t 6 ) )
June T a i r ( t ) = 22 + 6 sin ( π 12 ( t 6 ) ) December T a i r ( t ) = 3 + 5 sin ( π 12 ( t 6 ) )
Table 10. Evaluation of battery storage system performance for the summer case.
ParameterValue
Total power generation of PV (kWh)193.16
Total building demand during the day (kWh)30.48
Total building demand during the night (kWh)23.92
Energy demand gap (kWh)138.75
Energy imbalance ratio71.83%
Number of batteries needed for Discover AES4
Number of batteries needed for Electriq PowerPod23
Number of batteries needed for Tesla Powerwall+2
Table 11. Evaluation of battery storage system performance for the winter case.
ParameterValue
Total power generation of PV (kWh)193.16
Total building demand during the day (kWh)122.9
Total building demand during the night (kWh)146.07
Energy demand gap (kWh)−75.8
Energy imbalance ratio39.24%
Number of batteries needed for Discover AES17
Number of batteries needed for Electriq PowerPod213
Number of batteries needed for Tesla Powerwall+10
Publisher’s Note: MDPI stays neutral with regard to jurisdictional claims in published maps and institutional affiliations.