Article

Pathways of Nitrogen and Phosphorus Utilization and Removal from Cyanobacteria Wastewater by Combining Constructed Wetlands with Aerobic Reactors

School of Energy and Environment, Key Laboratory of Environmental Medicine Engineering, Ministry of Education, Southeast University, Nanjing 210096, China
*
Author to whom correspondence should be addressed.
Sustainability 2022, 14(14), 8819; https://doi.org/10.3390/su14148819
Submission received: 2 June 2022 / Revised: 12 July 2022 / Accepted: 14 July 2022 / Published: 19 July 2022

Abstract

:
Due to its low C/N ratio and high concentrations of nitrogen and phosphorus, the effluent of anaerobic cyanobacteria fermentation cannot be directly discharged without further treatment. To effectively reduce nutrient loads and utilize the nutrient resources of biogas slurry generated from the anaerobic digestion of stored algae, two different aerobic treatment units (AUs) were combined with an ecological treatment unit (EU) to create two different treatment systems. The two AUEU systems paired a constructed wetland (CW) with either a cascade biological contact reactor (CBCR) or a carrousel oxidation ditch reactor (CODR). In this paper, the water quality characteristics of biogas slurry were measured, and comprehensive experiments on the two trial-treatment systems were carried out to validate their performance in removing pollutants and utilizing resources. Furthermore, the pollutant removal efficiencies of the combined systems, along with the removal mechanisms and utilization of the nitrogen and phosphorus in the CWs, were also investigated. The results showed that the CWs, with aquatic vegetation, took up the majority of removed nitrogen and phosphorus by absorption, which effectively reduced the concentration of pollutants in the effluent and enabled the nitrogen and phosphorus to be reused in plants. Biomass assimilation by the absorption by vegetation took up 75.8%, 66.1%, 70.3%, and 86% of the removed NH4+-N, NOx-N, TN, and TP, respectively.

1. Introduction

The proportion of lakes (reservoirs) where eutrophication has become a problem has increased from 23% to 30% [1] in the past three years. Additionally, frequent outbreaks of cyanobacteria have primarily occurred as a result of lake eutrophication, and these outbreaks have become a common and serious environmental issue in China [2,3]. The salvage and collection of cyanobacteria is a common approach to rapidly reducing cyanobacteria in water. However, salvaged cyanobacteria cannot be treated by conventional burial or other measures because the cyanobacteria are in liquid form (high water content). Thus, most salvaged cyanobacteria are stored in nearby ditches or lakefront depressions, where the cyanobacteria gradually change into stored algae if not disposed of promptly. Furthermore, that stored algae may return to lakes through seepage or runoff and cause secondary pollution.
The treatment and associated resource utilization technologies for stored algae have been widely studied due to stored algae’s high organic content and high levels of nutrients such as nitrogen and phosphorus. Among those technologies, anaerobic fermentation technology has attracted a lot of attention because it is able to effectively treat algae as well as obtain biomass energy [4]. Although anaerobic fermentation technology has a high removal rate of organic matter, it is difficult to attain a biogas slurry (the effluent of anaerobic fermentation) that can be directly discharged into the environment. Besides, discarding this effluent would waste a large amount of organic matter, nitrogen, phosphorus, and other resources contained in the biogas slurry. At present, the commonly used pathways for the disposal of anaerobic fermentation products primarily consist of biochemical treatment [5,6], natural ecological treatment [7,8], and agricultural resource utilization [9,10]. Most research on biochemical treatment technology has focused on the innovation and improvement of aerobic treatment technology [11], such as the exploration of A/O (anaerobic/aerobic) combinations for the treatment of biogas slurry with the goal of carbon and nitrogen removal [12] and anaerobic fermentation liquid treatment based on sequencing batch reactor (SBR) technology with the goal of removing nitrogen [13,14]. Additionally, positive results were achieved using practical engineering to address those experiment results, where the removal rates of COD, NH4+-N, BOD5, and TN of the anaerobic digester in a hoggery reached above 90%. The biological contact oxidation process is one of the most popular technologies for biogas slurry treatment [15,16]. The biological contact oxidation process, as one example of an aerobic reactor, has an outstanding ability to remove pollutants from the influent due to a larger amount of biological solids per unit volume and higher volume load. In addition, this process has the ability to adapt to sudden changes in water quality and quantity. In the meantime, it was shown that the biological contact oxidation had a positive effect on biogas slurry treatment, so it was possible for the biological contact oxidation process to treat the biogas slurry of stored algae [17].
The oxidation ditch process, as delayed aeration-activated sludge technology, is commonly employed worldwide due to its convenient management, low investment, high stability, and good effluent quality [18]. Furthermore, the oxidation ditch process can effectively remove nitrogen and phosphorus from wastewater in addition to organic matter, and the produced effluent can meet the wastewater discharge requirements for nitrogen and phosphorus levels. Besides the biological contact oxidation process and oxidation ditch processes mentioned above, constructed wetlands (CWs) [19] present a natural ecological treatment method to remove all kinds of pollutants. Previous studies have shown that CWs have good removal rates for suspended matter [20] and a strong ability to remove organic matter. This is because insoluble organic matter can be trapped by plant roots, deposited through sedimentation, or filtered out by the substrate; therefore, CWs can remove insoluble organic matter by adsorption and biodegradation by plant root biofilms [21]. In addition, CWs are superior to the traditional biological treatment technologies in removing refractory organic compounds.
The pathways for nitrogen removal in CWs include volatilization, ammoniation (nitrification/denitrification), plant absorption, medium adsorption, and precipitation filtration. The primary method through which CWs remove nitrogen is nitrification/denitrification by microorganisms. The sewage flows through the root zone of the plant, which provides a rich surface for nitrifying bacteria, where nitrification takes place. The pathways for phosphorus removal in wetlands include plant absorption, soil or granular media adsorption, and precipitation storage. The inorganic phosphorus in the wastewater can be converted to its organic components (such as ATP, DNA, RNA, etc.) through absorption and assimilation by plants, which play a significant role in CW systems but have a limited absorption capacity. Biogas slurry is different from other types of sewage, and experience is limited in its treatment worldwide. Therefore, any attempt to adapt current sewage treatment processes for the treatment of biogas slurry should be based on an understanding of its water quality characteristics.
In this paper, the composition of biogas slurry was determined, and based on that determination, a combined treatment process, i.e., aerobic treatment unit–ecological treatment unit (AUEU), was proposed. Two different integrated systems (AUEUs) were designed and studied; the biological cascade biological contact reactor (CBCR)–aquatic vegetation constructed wetland (CW) (i.e., CBCR-CW) and the carrousel oxidation ditch reactor (CODR) contact oxidation–aquatic vegetation constructed wetland (CW) (i.e., CODR-CW). Furthermore, the parameters, including pollutant removal efficiency, pollutant removal mechanisms, and the influence of plants on nitrogen and phosphorus removal in the CW, were monitored. The combined technologies of aerobic and constructed wetlands took full advantage of both biochemical and ecological treatment technologies, thereby improving the quality of effluent water and system stability. In addition to the improved water quality, the utilization of nitrogen and phosphorus nutrients was also achieved, which can increase the economic benefits and reduce the costs of algae treatment. These new ideas and methods for the treatment and resource utilization of biogas slurry produced by anaerobic fermentation are presented in this paper.

2. Experimental Setup and Methodology

As shown in Figure 1, cyanobacteria were collected from Lake Taihu and introduced into a combined anaerobic reactor (USR + ABR) for treatment at 20 °C with a hydraulic retention time (HRT) of 5 d. The effluent of the anaerobic reactor (biogas slurry) was transferred into the aerobic treatment unit–ecological treatment unit (AUEU) for further purification using a peristaltic pump after precipitation. Either the cascade biological contact reactor (CBCR) or carrousel oxidation ditch reactor (CODR) was used for the aerobic treatment unit (AU) portion of the treatment. The two different combined systems were the cascade biological contact reactor (CBCR)–aquatic vegetation constructed wetland (CW) (CBCR-CW) and the carrousel oxidation ditch reactor (CODR) contact oxidation–aquatic vegetation constructed wetland (CW) (CODR-CW). It must be noted that the constructed wetlands (CWs) in both the CBCR-CW and CODR-CW had the same structure and conditions, and they used the same Ipomoea Aquatica (IA). In order to describe the role of wetlands in the two combined systems clearly, the CWs in the CBCR-CW and CODR-CW were designated as CW1 and CW2, respectively.

2.1. Experimental Setups

2.1.1. AU Setups

(1)
CBCR design
The CBCR was made of PVC with an effective volume of 60 L, the size of which was 0.4 m × 0.3 m × 0.65 m (L × W × H). An electromagnetic air pump was used to aerate the CBCR; meanwhile, a rotameter was set to keep the DO (dissolved oxygen) at around 3~4 mg/L. The schematic diagram of the CBCR is shown in Figure 2a.
(2)
CODR design
The CODR was made of PVC with an effective volume of 160 L, the size of which was 0.9 m × 0.4 m × 0.6 m (L × W × H). A stirring paddle was employed in the CODR to aerate in the aeration zone, and a rotameter was also used to control the amount of aeration. The schematic diagram of the CODR is shown in Figure 2b.

2.1.2. EU Setup

The horizontal subsurface flow in the constructed wetlands (CWs), with the size of 10 m ×1.0 m × 0.3 m (L × W × H), was designed and optimized to receive the cyanobacteria-containing solution after its pretreatment in AU. As shown in Figure 2c, the CW was composed of three parts, namely the water distribution channel, aquatic vegetation culture area, and discharge channel. The bottom slope and determined hydraulic load of the CW were 1% and 0.10 m3/(m2·d), respectively, and the water height could be adjusted through a mobile weir plate.
In this system, Ipomoea aquatica (IA) was chosen as the aquatic plant to absorb and assimilate nutrients in the effluent from the AU. The selected plants (15~40 cm in height) were collected and cultivated with an initial planting density of 55 plants/m2, which represented an average of those reported in published studies: 28 plants/m2 [22], 40 plants/m2 [23], 61 plants/m2 [24], and 80 plants/m2 [25]. These planting densities were similar to those observed at field scales, and plants all grew well during the test.

2.2. Experimental Methodology

2.2.1. Chemical Analysis

After filtration through 0.45 μm filters, measurements and other specific operation methods were conducted on all water samples taken from the combined systems. Additionally, the test methods and instruments used for the routine physical and chemical analysis are described below.
NH4+-N, NO2-N, NO3-N, and TN were measured using the Auto-Analyzer 3 instrument (Seal Analytical, Ltd., Southampton, UK). TP, COD, DO, and pH were monitored using the ascorbic acid–molybdenum blue method (EPA-600/4-79-020), DR1010 COD analyzer (HACH Co., Loveland, CO, USA), DO probe (HQ30d, HACH Co., Loveland, CO, USA), and a pH probe (pH100, YSI Co., Yellow Springs, OH, USA), respectively. Total microcystin (TMC-LR) and extracellular microcystin (EMC-LR) were tested with HPLC (Triplus TraceGC ITQ1100, THERMO FISHER Co., Waltham, MA, USA).

2.2.2. CW Methodology

(1)
Measurement of nitrification and denitrification intensity in the CW
At each sampling time point, 10 g of sludge was taken out at the 1/4, 1/2, and 3/4 points of the CW and stored in 250 mL triangle bottles. They were sealed with perforated rubber stoppers or cotton wool plugs after adding 100 mL nutrient solutions containing NH4+-N (25 mg/L) for the nitrification rate test or containing NO3-N for the denitrification rate test. Both of the contents of nutrient solutions for the nitrification and denitrification test are presented in Table 1.
Nitrification and denitrification intensity were measured in three 1 L reactors (A, B, and C), where the carbon sources of reactors A and B were supernatant and influent, respectively, while no carbon source was added to reactor C as a control. Then, the bottles were placed in a water bath at 20 °C for nitrification or denitrification intensity tests. The intensity of nitrification by the sediment was calculated as the change in NO3-N concentration before and after culture. It must be noted that, in the tests of nitrification and denitrification intensity, the change in NO3N concentration, or how much was generated or consumed, was measured by drying the sediment and expressed per unit of mass and time. The NH4+-N and NOx-N of each sample were measured three times, and nitrification and denitrification intensity tests were repeated four times.
(2)
Determination of IA absorption capacity for different forms of N and P
Vegetation was sampled at three time points to evaluate the growth rate, as well as the nutrient assimilation rates of the plants. All samples were washed with distilled water to eliminate residual nitrogen in the culture vessel and then incubated with the influent at 30 °C. To prevent NH4+-N nitrification, 5 mg/L thioureas was added in advance.
A total of 30 mL of influent and effluent samples were collected from the system every day for dissolved TN (DTN), NO3-N, NH4+-N, and dissolved TP (DTP) measurements. The nitrogen and phosphorus removal rates of NH4+-N, NO3-N, DTP, and DTN in water were calculated as the change in DTN, NH4+-N, NO3-N, and DTP concentration in plants while accounting for the change in the fresh weight of plants (FW).
To determine the plant’s TN and TP contents, each plant was weighed before and after being dried in a vacuum oven at 80 °C for 24 h. According to the standard methods [26], a representative subsample of all biomass samples was prepared for analysis in the laboratory (washed, cut, dried, and milled). Nitrogen and phosphorus analyses were also performed according to these standard methods. The TN content was analyzed with the micro-Kjeldahl′s method. In the plant’s TP content analysis, samples were ashed at 450 °C or 2 h, and concentrated HCl was added and mixed while heating. After cooling, the mixture was filtered, and phosphorus was determined using the methods described above for water samples.
(3)
Calculation method of removal amount of different forms of nitrogen and phosphorus
In this study, the quality of removal rates of pollutants per unit of the CW area and time were calculated as follows:
M = Q ( C i n C o u t ) / A
where M is the quality of pollutant mass removal rate (g/(m2·d)), A is the area of constructed wetland (CW) (m2), Cin and Cout are the inflow and outflow concentrations (mg/L) of CW, which are the effluent of AU and the effluent of AUEU, and Q is influent water volume (m3/d).
The total removal amount (S) of nitrogen and phosphorus in different forms can be calculated using the following equation:
S = Q × [ i = 1 n ( C i n , i C o u t , i ) × t i ]
where Cin, i and Cout, i are inflow and outflow concentrations (mg/L) of TN, NH4+-N, NOxN, or TP on the ith sample, ti represents the two adjacent water quality measurement time intervals (d). n refers to the number of sample tests during the testing process.
The pathways for ammonia nitrogen removal include NH4+-N volatilization, IA absorption, and removal by nitrification. NH4+-N volatilization can be determined according to the test results from the constructed wetland. Ammonia nitrogen absorption by IA (IAA) is described by the following equation:
I A A = ( k × C a ) × F W × T
where k is the absorption rate conversion coefficient of NH4+-N, C is the NH4+-N concentration (mg/L), k × C is the NH4+-N absorption rate (mg/(g·FW·d)), FW is the IA weight (g), T is the reaction time (d), and the values of k and a can be obtained from the relationship between IA absorption capacity and the concentration of NH4+-N.
The pathways for the removal of NOx-N include plant absorption and denitrification. Nitrate–nitrite nitrogen absorption by IA (IAN) can be depicted by the following equation:
I A N = ( k × C b ) × F W × T
where k is the absorption rate conversion coefficient of NOx-N, C is the NOx-N concentration (mg/L), k × C is the NOx-N absorption rate (mg/(g·FW·d)), and the values of k and b can be obtained from the relationship between IA absorption capacity and the concentration of NH4+-N.
The removal of TN is the sum of absorption by plants, removal by denitrification, sediment deposition, NH4+-N volatilization, and others such as consumption by birds, insects, and/or loss of plant roots. The removal of TP can be similarly calculated as the sum of absorption by plants and sediment deposition, among others.

3. Results and Discussions

3.1. Water Quality Characteristics Analysis of Anaerobic Biogas Slurry

The effluent of the combined anaerobic reactor (the anaerobic biogas slurry) was used as the influent in the AUEU system. This influent was different from other common types of sewage with its high mass of organic matter, which is relatively difficult to biodegrade. Thus, it was necessary to analyze the water quality characteristics of the biogas slurry before it was introduced into the treatment process. The water monitoring included water temperature, pH, concentrations of COD, NH4+-N, NOx-N, and TN, and TP organic pollutants.
During the test, the temperature of the biogas slurry corresponded with the air temperature, changing from 10 °C to 35 °C over the course of the experiment. The pH of the biogas slurry fluctuated between 7.5 and 8.1 and was generally alkaline because the organic nitrogen was ammoniated to ammonia nitrogen. Both the water temperature and pH matched the optimal conditions for the growth of the microorganisms involved in the aerobic treatment.
The qualitative analysis of the GC-MSC results of the biogas slurry by computer spectral database retrieval showed that most of the organic matter in the biogas slurry were alkenes, carboxylic acids, and alcohols, which are easily biodegradable. The maximum and minimum concentrations of BOD5 in the biogas slurry were 196.47 mg/L and 93.13 mg/L, respectively, and the biochemical reaction rate was between approximately 33.75 and 47.64%. Therefore, the biogas slurry had good biodegradability and could be treated using an aerobic biological treatment process. However, BOD5:TN:TP was equal to 19:7.5:1 in the biogas slurry, which is why it was necessary to supplement the removal of nitrogen and phosphorus. However, it was difficult to achieve better nitrogen and phosphorus removal in standard aerobic reactors. Thus, it was decided to utilize CW with aquatic vegetation to treat the nitrogen and phosphorus in the effluent of aerobic reactors, which not only degraded the nitrogen and phosphorus content but also had certain economic benefits.

3.2. Analysis of Removal Efficiency of Pollutants in AUEU

The influent quality of the CBCR-CW and CODR-CW were the same because the biogas slurry from the anaerobic digestion reactor was pumped into each of the two combined systems at the same time. Both of the temperatures in CW1 and CW2 were 20 °C, and the DO values in the CBCR and CODR were controlled to be 3~4 mg/L and 1.5~1.8 mg/L, respectively. The pollutant removal efficiencies were investigated in the CBCR and CODR with hydraulic retention times (HRTs) of 16 h, 12 h, 8 h, and 6 h and 40 h, 32 h, 24 h, and 16 h, respectively. After the start-up and commissioning of the combined systems, the experiments were carried out from June 31st to July 31st.

3.2.1. COD Removal Efficiency

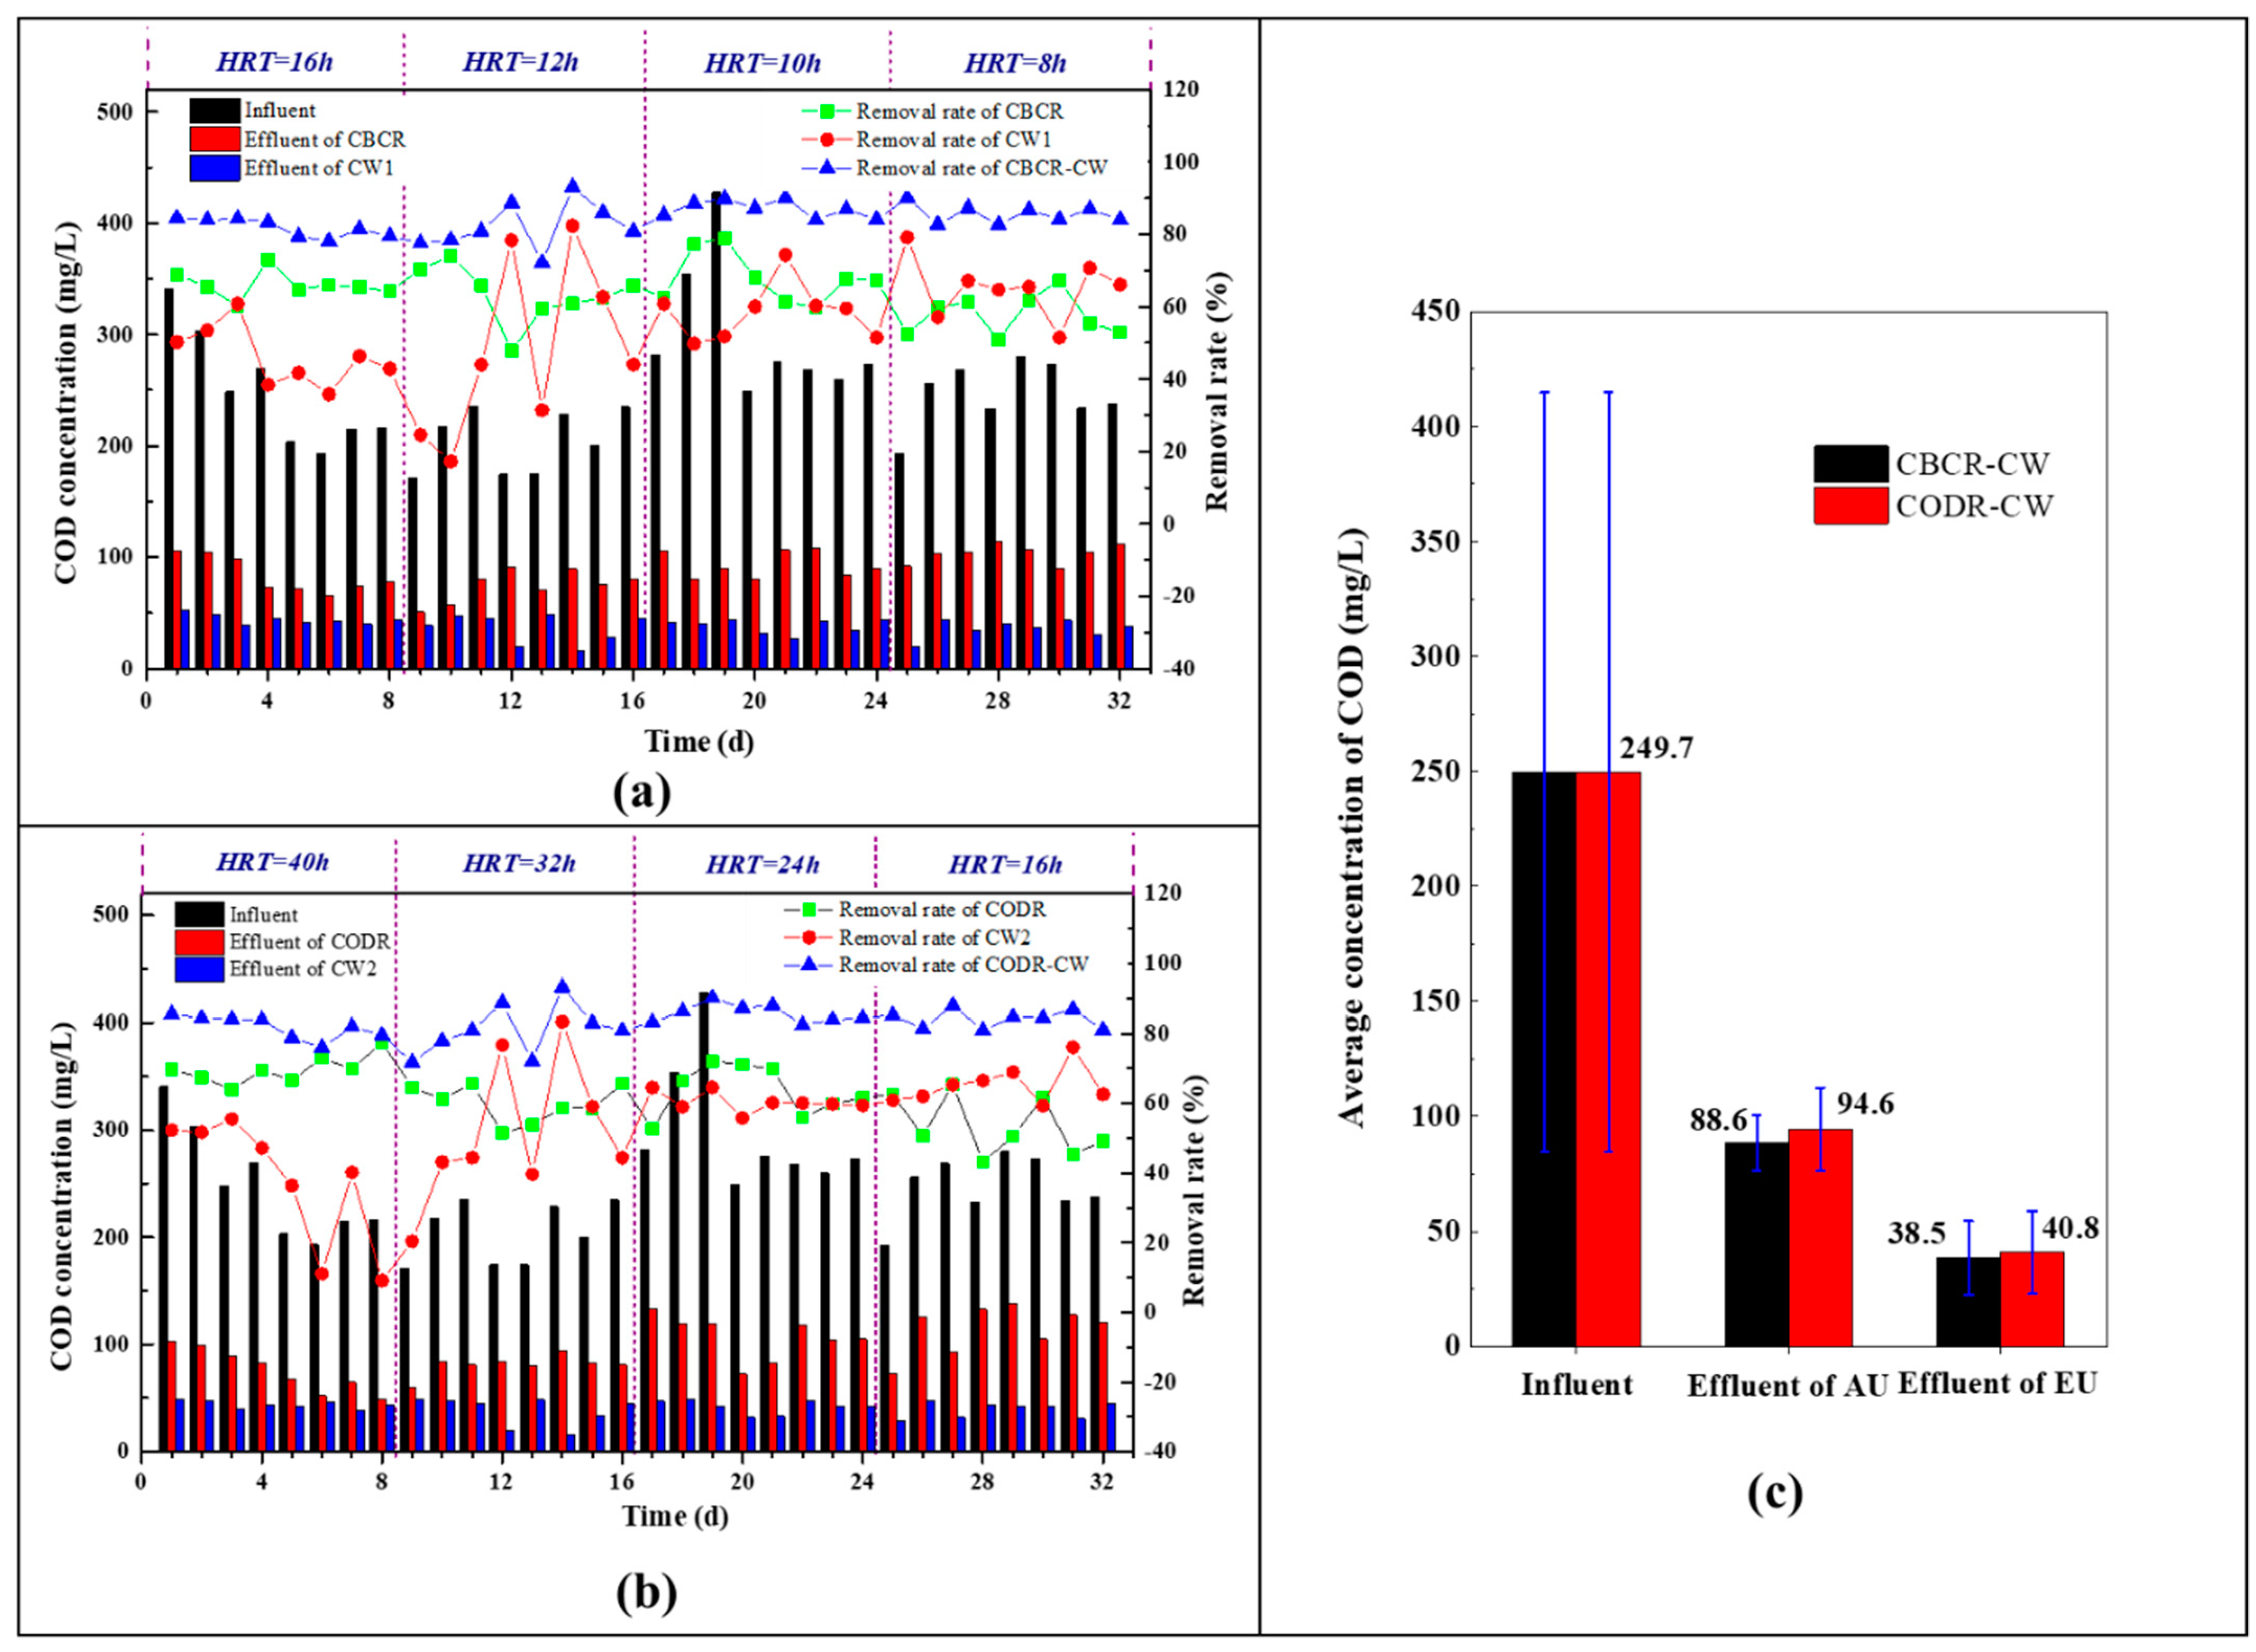
For the pollutant of COD in the CBCR-CW (Figure 3a), influent and effluent COD concentrations of the CBCR were in the range of 174~428 mg/L and 50~108 mg/L, respectively. The COD removal rate declined slightly with the increasing HRT exceeding 8 h. When the HRT was 6 h, the COD removal rate had a great decrease, and the average removal rate reached 63.9%. It can be seen that the CBCR had a better COD removal efficiency, but there was still a big gap between it and the standard of level 1 (GB18918-2002), so it was necessary to further treat it. As exhibited in Figure 3b, the influent and effluent COD concentrations in the CODR were 171.36~428 mg/L and 42.67~38.50 mg/L, respectively. COD removal rate increased slightly with the increase in HRT. The average removal rates at the HRT of 16 h and 40 h were 57% and 69%, respectively.
The results of the COD removal of CW1 and CW2 are also shown in Figure 3a,b. At the early stage of operation, both the performance of CW1 and CW2 was not stable, and thus, the number of microorganisms was small in the beginning, resulting in a great fluctuation of COD with an unstable removal rate. The performance of EU gradually stabilized with the increasing operating time.
On the whole, the CBCR-CW and CODR-CW had good removal rates for COD, and the effluent concentrations of COD of the two systems were 15.74~52.82 mg/L and 15.74~48.66 mg/L, equating to removal rates of 85% and 84%, respectively. Figure 3c reflects the changes in the average concentrations of COD in the CBCR-CW and CODR-CW. We found that most of the COD was removed during the AU portion of treatment (76.3% in the CBCR-CW and 74.3% in CODR-CW) and that the CBCR degraded slightly more COD than the CODR, which means the COD removal efficiency of the whole system can be improved by enhancing the COD removal capacity of the AU.

3.2.2. NH4+-N Removal Efficiency

For the removal of the pollutant NH4+-N, the different HRTs of AU in the CBCR-CW (Figure 4a) and CODR-CW (Figure 4b) had the most significant influence on efficiency with a relatively stable influent concentration of NH4+-N. The results showed that the NH4+-N removal efficiency decreased with decreases in HRT. The removal rate of NH4+-N in the CBCR reached 60% when the HRT exceeded 12 h, but the removal rate dropped sharply to 14~36% when the HRT was less than 8 h. The removal rate of NH4+-N in the CODR reached 96% when the HRT exceeded 24 h, but the removal rate dropped sharply to 18~50% when the HRT was 16 h.
The effects of the CWs (CW1 and CW2) on the effluent from the CBCR and CODR are depicted in Figure 4a,b. NH4+-N concentrations of effluent from both the CBCR and CODR were effectively reduced by EU. The removal rate of NH4+-N was higher in CW1, which had a higher concentration of NH4+-N in its influent from the CBCR; the average removal rate was 98%; and the average effluent concentration was 0.62 mg/L. Though there was a lower concentration of NH4+-N in the effluent from CODR, CW2 still had a good removal capability, and the effluent concentration was no more than 1 mg/L. Additionally, the average NH4+-N removal rates were over 89%.
The changes in the average concentrations of NH4+-N in the CBCR-CW and CODR-CW are shown in Figure 4c. The two sets of AUEU were relatively stable overall. The NH4+-N removed during the AU stage of the CBCR-CW and CODR-CW accounted for approximately 43.1% and 82.8%, respectively, indicating that the CBCR had poor NH4+-N removal efficiency. The relatively poor NH4+-N removal rate in the CBCR may be caused by the following reasons: (1) the short flow phenomenon may have formed in the CBCR, which causes water containing high concentrations of NH4+-N to pass through the system quickly; (2) the COD concentration in the CBCR was relatively high, which gave heterotrophic bacteria an advantage over autotrophic nitrifying bacteria, which made it difficult for nitrifying bacteria in the CBCR to become the dominant species; (3) the nitrifying bacteria did not have enough time to convert NH4+-N into nitrate nitrogen due to the short HRT.

3.2.3. TN Removal Efficiency

Regarding TN in the AUEU system in Figure 5a,b, the average removal rate of TN by the CBCR was only 22% due to the lack of the hypoxic conditions required for denitrification. Similarly, the average removal rate of TN from the CODR was only 13%. This is because the DO value of the anoxic zone in the CODR was 0.5~0.8 mg/L, which is a poor anoxic environment for denitrification. In general, the TN removal rates by the CBCR and CODR did not meet the standard of A grade in level 1 (GB18918-2002) [27].
Finally, after passing through the CWs, the effluent concentrations of TN in the CBCR-CW and CODR-CW changed by 0.11~5.59 mg/L and 0.48~8.57 mg/L, respectively. Both of the TN effluent concentrations of the two systems remained below 10 mg/L and met the standard of A grade in level 1 (GB18918-2002). As shown in Figure 5, the removal of TN primarily occurred in the EU portion of the combined process (76.5% in the CBCR-CW and 85.8% in the CODR-CW), and the TN removal rates of both the CBCR and CODR were low, which may have been caused by the phenomenon of short flow, insufficient nitrification in AU, and/or a non-hypoxic environment.

3.2.4. TP Removal Efficiency

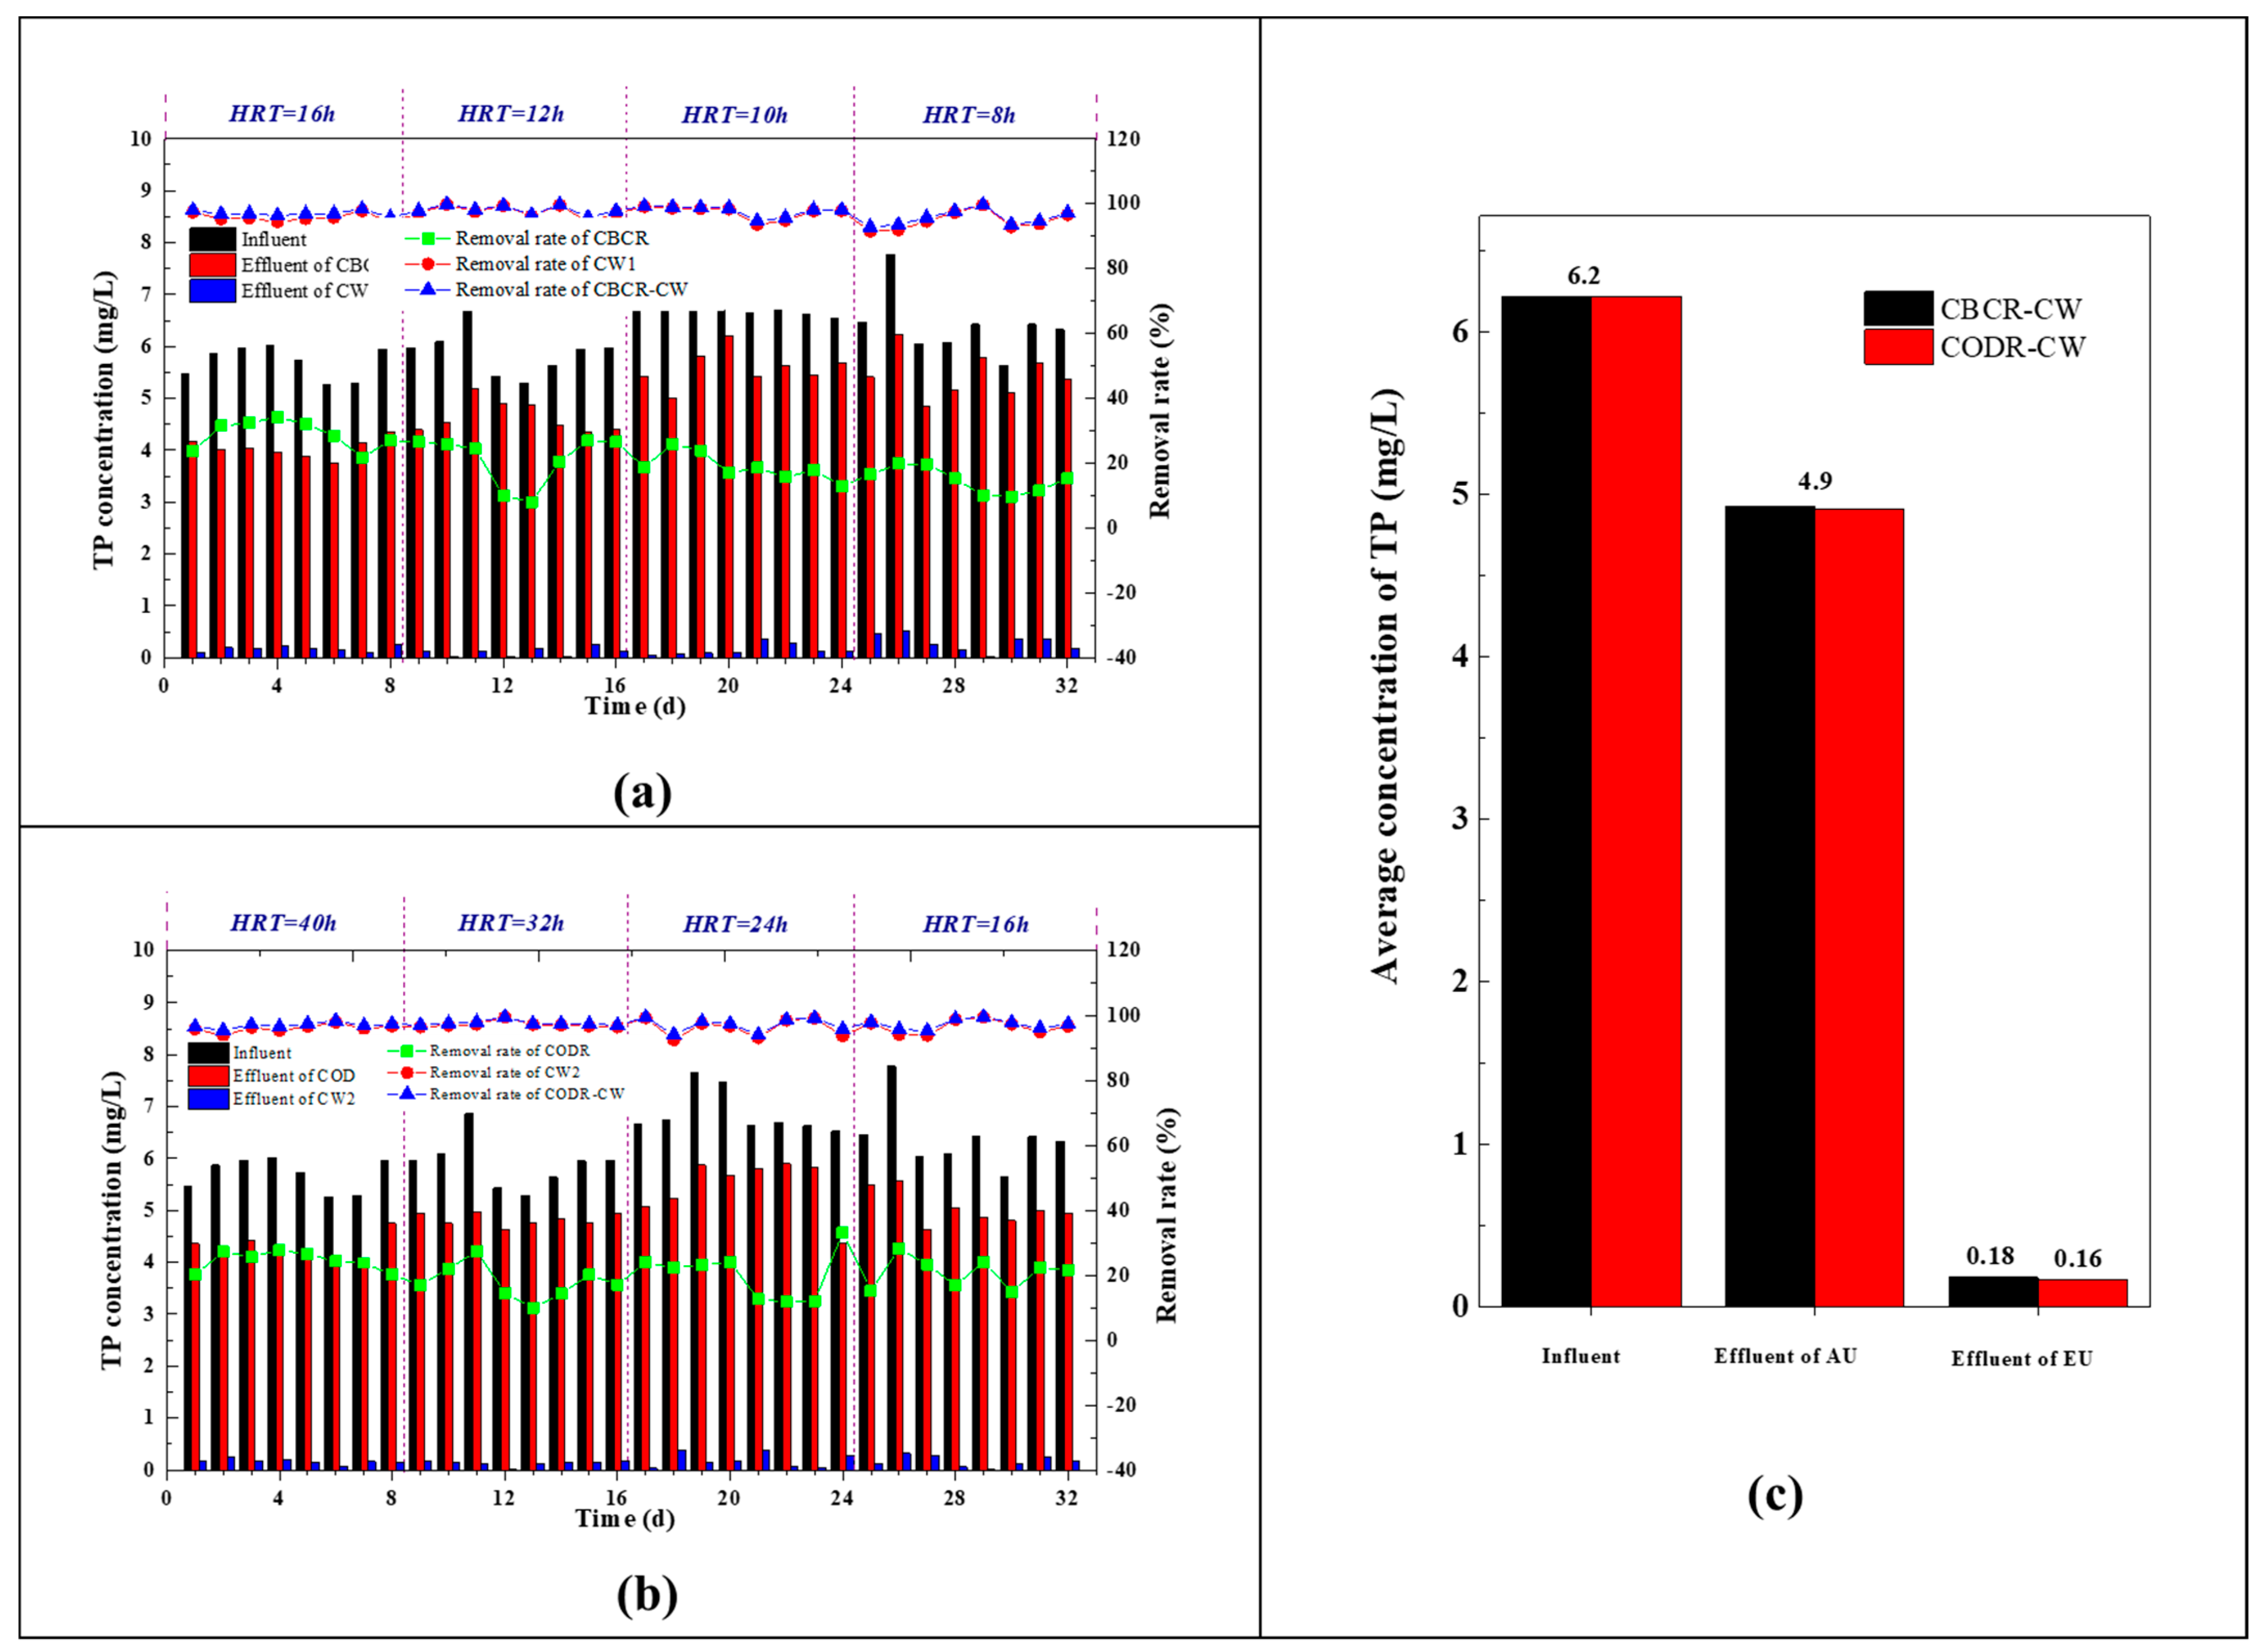
As presented in Figure 6a,b, the TP influent concentrations fluctuated within 5.26~7.77 mg/L. In contrast, the effluent TP concentrations of the CBCR and CODR fluctuated within the ranges of 3.76~6.24 mg/L and 3.98~5.90 mg/L, respectively. The average TP removal rates of the CBCR and CODR were approximately equal to 22% and 13%, respectively. Like the other pollutants mentioned above, the removal rate of TP in the CBCR and CODR changed slightly with different HRTs. In the CBCR, the TP removal rate was relatively high with an average of 28% with an HRT of 16 h, while the TP removal rate was only 15% when the HRT was 6 h. The reason for the low TP removal rate is that there was less residual sludge discharged from the CBCR. For the CODR, the maximum removal rate of 25% occurred when the HRT was 40 h. The low removal rate of TP in the CODR was caused by a lack of appropriate biological conditions for its removal. Eventually, the results showed that the TP removal by the CBCR and CODR were both insufficient to meet the requirements of A grade in level 1 (GB18918-2002).
Figure 6c demonstrates that the AU had lower efficiency for TP removal. The proportion of TP removed in the AU portion of the CBCR-CW and CODR-CW accounted for 23.59% and 22.13%, respectively, which might have been caused by the poor phosphorous releasing environment for the phosphorous bacteria and the relatively short flow of the contact oxidation pool. However, both the CBCR-CW and CODR-CW had good TP removal rates overall, and both of the effluent TP concentrations were below 0.5 mg/L, which met the standard of A grade in level 1 (GB18918-2002).

3.2.5. Removal of Algal Toxins from Biogas Slurry

Total microcystin (TMC-LR) and extracellular microcystin (EMC-LR) were measured using high-performance liquid chromatography (HPLC) at different stages of the aerobic treatment. The measured data are shown in Table 2.
As can be seen from Table 2, the sum of intracellular and extracellular MC-RR and LR (TMC-MCs) of the biogas slurry was far less than the national standard concentration (1 μg/L). It must be noted that the proportion of intracellular algal toxin (IMC) in the TMC was significantly greater than that of extracellular algal toxin (EMC) in most cases, which indicated that most of the algal toxins in stored algae had been decomposed during the anaerobic reactor treatment. The subsequent aerobic treatment reactor was used to further remove algal toxins so as to minimize the effects of algal toxins and ensure the absolute safety of the aquatic vegetation.

3.3. Removal Mechanisms of Nitrogen and Phosphorus in Constructed Wetlands

3.3.1. The Nitrification and Denitrification Rates in Sediment

Nitrification potentials of the inner sediment of the CWs on the effluent from different aerobic reactors are depicted in Figure 7. As can be seen from the figure, the CWs had more nitrification potential nearer the upstream end to treat effluent from the CBCR compared with that from the CODR. In other words, the nitrification potential decreased gradually along the direction of the water flow, and the degree of the reduction was larger nearer the effluent end than the front end. Effluent from the CBCR was more suitable for the growth of nitrifying bacteria due to its high DO value and high NH4+-N content in the water, so the nitrification in the front end of CWs was strong. NH4+-N and DO were gradually consumed as the sewage progressed through the CWs, which was not conducive to the growth and reproduction of nitrifying bacteria, leading to decreased nitrification intensity along the direction of flow. For the CODR, the highest nitrification rate was located in the middle, which was slightly more than the front end, which may be related to the formation and characteristics of the sediment, organic matter decomposition, ammoniation, and nitrification.
The denitrification potentials of the inner sediment of CWs on the effluent from different aerobic reactors are shown in Figure 7. The denitrification by wetland sediment of the CODR effluent was slightly larger than that from the CBCR. This is because the TN in effluent from the CODR contained mostly nitrate nitrogen, while the TN in the effluent from the CBCR mainly contained ammonia nitrogen. For wastewater with high ammonia nitrogen, sufficient nitrification is necessary before denitrification becomes efficient.

3.3.2. Effect of Plant Assimilation on the Removal and Utilization on Nitrogen and Phosphorus

The test influent was the effluent of the aerobic biological contact oxidation reactor with a DO concentration between approximately 5 and 7 mg/L. The DO concentration in the reactor was maintained at levels higher than 2 mg/L throughout the process, which inhibited the growth of denitrifying bacteria. With this in mind, the potential effects of denitrification were ignored, and the reductions in TSN, NH4+-N, NO3-N, and TSP were assumed to be due to assimilation by plants.
In CWs, vegetation takes up nutrients from wastewater and substrates and also provides a large surface area and favorable growing conditions for microbial growth. Therefore, vegetation can enhance the activity and abundance of microbes, thereby facilitating the removal of nutrients. The role of plants in nutrient removal can be estimated from plant biomass density and nutrient content [28].
In this study, three forms of nitrogen and TSP absorption rates increased with increases of inlet concentration. Correlation analysis confirmed this trend, showing that the influent TSN, NH4+-N, NO3-N, and TSP concentrations and the absorption rates were positively correlated, and the correlation indexes were greater than 0.98. These findings indicated that increases in the influent’s nitrogen and phosphorus concentrations enhanced the plant’s assimilation rate.

3.3.3. Removal Mechanism of Nitrogen and Phosphorus

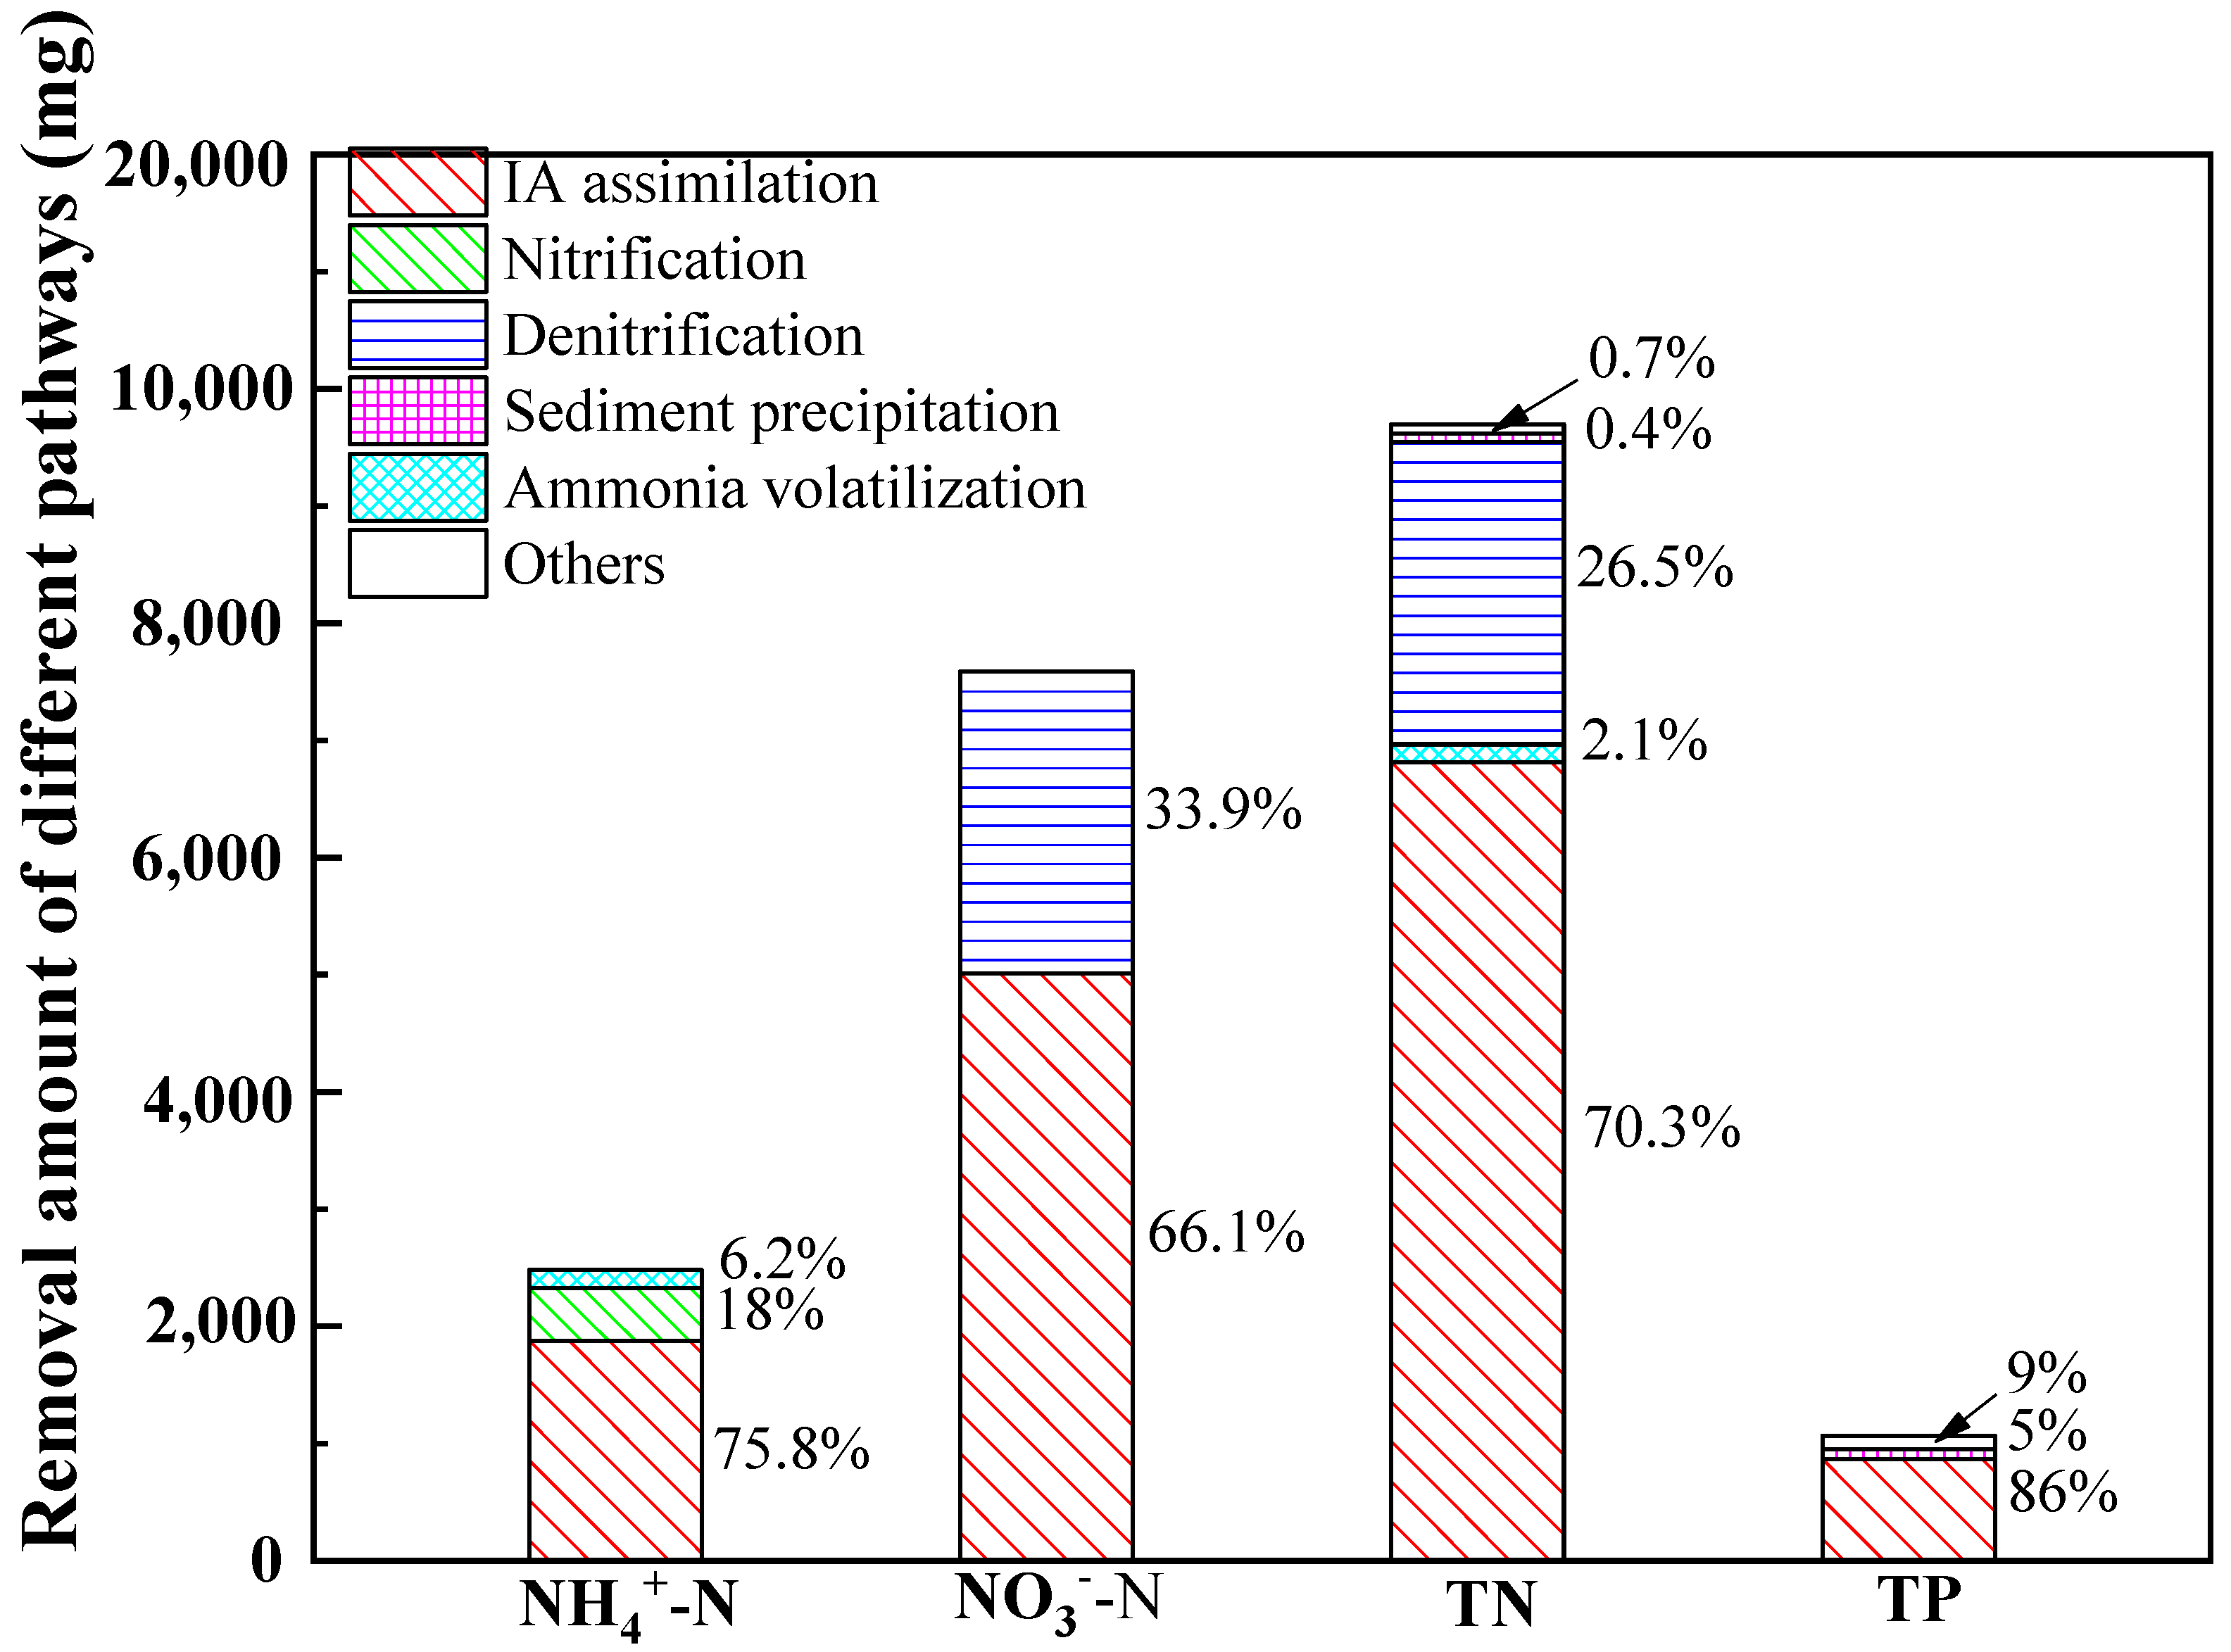
Nitrification and denitrification, plant assimilation capacity, and sediment precipitation were investigated to determine the nitrogen and phosphorus removal pathways in the CWs. It has been reported that CW’s effectiveness in wastewater treatment relies on the growth potential and ability of macrophytes to develop sufficient root systems for microbial attachment and material transformation.
In this experiment, the algae-containing effluent from the CBCR served as the influent of the CWs to investigate the removal efficiencies and pathways of nutrients. As shown in Figure 8, NH4+-N removal relied mainly on plant absorption (75.8%), nitrification (18%), and ammonia volatilization (6.2%) in the wetland system. NOx-N removal was mostly attributed to IA absorption (66.1%), followed by denitrification (33.9%). TN removal was mostly via IA absorption (70.3%), then denitrification (26.5%), followed by other mechanisms (Figure 8). The assimilation of nutrients into plant biomass can substantially contribute to nutrient removal efficiency [29]. Additionally, IA absorption accounted for 86% in the removal of TP, while sediment precipitation only accounted for 5%. For the various nutrients, IA biomass assimilation took 75.8%, 66.1%, 70.3%, and 86%, respectively, of the removed NH4+-N, NOx-N, TN, and TP. Thus, the absorption and assimilation of nutrients by plants were the primary means by which our aquatic vegetation CW system took up unwanted nutrients from the algae solution.

4. Conclusions

To effectively treat the biogas slurry produced by the anaerobic digestion of stored algae and facilitate the utilization of nitrogen and phosphorus resources of the biogas slurry, we proposed a combined process of aerobic treatment unit–ecological treatment unit (AUEU) based on the detected water quality characteristics of biogas slurry. Furthermore, two kinds of combined systems were designed, built, and tested in this paper, namely the biological cascade biological contact reactor (CBCR)–aquatic vegetation constructed wetland (CW) (CBCR-CW) and the carrousel oxidation ditch reactor (CODR) contact oxidation–aquatic vegetation constructed wetland (CW) (CODR-CW).
Comprehensive experiments were conducted with these two combined systems to validate their performance in the removal of pollutants and resource utilization. Moreover, the removal efficiency of pollutants in the combined systems and the removal mechanism together with the utilization of nitrogen and phosphorus in the CWs were explored. The main conclusions are summarized as follows:
Most of the organic matter in the biogas slurry were alkenes, carboxylic acids, and alcohols, which are easily biodegradable. The ratio of BOD5, TN, and TP in the biogas slurry was 19:7.5:1, which highlighted the necessity to strengthen the removal or utilization of nitrogen and phosphorus from the biogas slurry.
The CWs with aquatic vegetation were responsible for the majority of nitrogen and phosphorus removal by absorption, which effectively reduced the effluent concentration of pollutants and enabled the nitrogen and phosphorus to be reused in plants. In all, 76.5% of the total TP removed, and 85.8% of the total TN removed were removed by the CWs in the CBCR-CW and CODR-CW.
Plants’ absorption and assimilation of nutrients were the primary ways in which the CW system with aquatic vegetation treated the algae solution. Biomass assimilation by the absorption of Ipomoea Aquatica took 75.8%, 66.1%, 70.3%, and 86%, respectively, of all NH4+-N, NOx-N, TN, and TP removed.
Most of the algal toxins in stored algae were decomposed in the anaerobic reactor treatment. The subsequent aerobic treatment reactor further removed algal toxins, minimized the influence of algal toxins, and ensured the absolute safety of the aquatic vegetation.

Author Contributions

Conceptualization, L.G.; Data curation, X.Z.; Formal analysis, L.G. and X.Z.; Funding acquisition, G.Z.; Investigation, L.G. and X.Z.; Methodology, L.G.; Project administration, G.Z.; Resources, G.Z.; Software, L.G.; Validation, L.G.; Writing—original draft, L.G.; Writing—review & editing, L.G. and G.Z. All authors have read and agreed to the published version of the manuscript.

Funding

This research was sponsored by the Jiangsu Agricultural Science and Technology Innovation Fund, grant number: CX(20)3077.

Institutional Review Board Statement

Not applicable.

Informed Consent Statement

Not applicable.

Conflicts of Interest

The authors declare no conflict of interest.

References

  1. Sinha, E.; Michalak, A.M.; Balaji, V. Eutrophication will increase during the 21st century as a result of precipitation changes. Science 2017, 357, 405–408. [Google Scholar] [CrossRef] [PubMed] [Green Version]
  2. Viso-Vázquez, M.; Acuña-Alonso, C.; Rodríguez, J.; Álvarez, X. Remote detection of cyanobacterial blooms and chlorophyll-a analysis in a eutrophic reservoir using Sentinel-2. Sustainability 2021, 13, 8570. [Google Scholar] [CrossRef]
  3. Liu, L.; Huang, Q.; Qin, B.; Zhu, G.; Wu, P.; Wu, Y. Characterizing cell surface of blooming Microcystis in Lake Taihu, China. Water Sci. Technol. 2016, 73, 2731–2738. [Google Scholar] [CrossRef] [PubMed]
  4. Moreira, D.; Pires, J.C.M. Atmospheric CO2 capture by algae: Negative carbon dioxide emission path. Bioresour. Technol. 2016, 215, 371–379. [Google Scholar] [CrossRef] [PubMed]
  5. Krakat, N.; Demirel, B.; Anjum, R.; Dietz, D. Methods of ammonia removal in anaerobic digestion: A review. Water Sci. Technol. 2017, 76, 1925–1938. [Google Scholar] [CrossRef]
  6. Wang, Q.; Cao, H.; Yu, H.; Zhao, L.; Fan, J.; Wang, Y. Experimental Study on Purification Effect of Biochemical Pool Model for Treatment of Pavement Runoff by Aquatic Plants. Sustainability 2020, 12, 2428. [Google Scholar] [CrossRef] [Green Version]
  7. Postacchini, L.; Lamichhane, K.M.; Furukawa, D.; Babcock, R.W.; Ciarapica, F.E.; Cooney, M.J. Life cycle assessment comparison of activated sludge, trickling filter, and high-rate anaerobic-aerobic digestion (HRAAD). Water Sci. Technol. 2016, 73, 2353–2360. [Google Scholar] [CrossRef]
  8. Md Anawar, H.; Chowdhury, R. Remediation of polluted river water by biological, chemical, ecological and engineering processes. Sustainability 2020, 12, 7017. [Google Scholar] [CrossRef]
  9. Li, Y.; Manandhar, A.; Li, G.; Shah, A. Life cycle assessment of integrated solid state anaerobic digestion and composting for on-farm organic residues treatment. Waste Manag. 2018, 76, 294–305. [Google Scholar] [CrossRef]
  10. Chen, S.; Cao, Y.; Li, J. The effect of water rights trading policy on water resource utilization efficiency: Evidence from a quasi-natural experiment in China. Sustainability 2021, 13, 5281. [Google Scholar] [CrossRef]
  11. Neoh, C.H.; Noor, Z.Z.; Mutamim, N.S.A.; Lim, C.K. Green technology in wastewater treatment technologies: Integration of membrane bioreactor with various wastewater treatment systems. Chem. Eng. J. 2016, 283, 582–594. [Google Scholar] [CrossRef] [Green Version]
  12. Abdel-Shafy Hussein, I.; Al-Sulaiman, A.M.; Mansour Mona, S.M. Anaerobic/aerobic treatment of greywater via UASB and MBR for unrestricted reuse. Water Sci. Technol. 2014, 71, 630. [Google Scholar] [CrossRef]
  13. Showkat, U.; Najar, I.A. 2019 Study on the efficiency of sequential batch reactor (SBR)-based sewage treatment plant. Appl. Water Sci. 2019, 9, 2. [Google Scholar] [CrossRef] [Green Version]
  14. Masłoń, A. Impact of Uneven Flow Wastewater Distribution on the Technological Efficiency of a Sequencing Batch Reactor. Sustainability 2022, 14, 2405. [Google Scholar] [CrossRef]
  15. Yu, L.; Han, M.; He, F. A review of treating oily wastewater. Arab. J. Chem. 2017, 10, 1913–1922. [Google Scholar] [CrossRef] [Green Version]
  16. Duan, N.; Khoshnevisan, B.; Lin, C.; Liu, Z.; Liu, H. Life cycle assessment of anaerobic digestion of pig manure coupled with different digestate treatment technologies. Environ. Int. 2020, 137, 105522. [Google Scholar] [CrossRef]
  17. Ryu, B.G.; Kim, J.; Han, J.I.; Kim, K.; Kim, D.; Seo, B.-K.; Kang, C.-M.; Yang, J.-W. Evaluation of an electro-flotation-oxidation process for harvesting bio-flocculated algal biomass and simultaneous treatment of residual pollutants in coke wastewater following an algal-bacterial process. Algal Res. 2018, 31, 497–505. [Google Scholar] [CrossRef]
  18. Singh, N.K.; Kazmi, A.A.; Starkl, M. A review on full-scale decentralized wastewater treatment systems: Techno-economical approach. Water Sci. Technol. 2015, 71, 468–478. [Google Scholar] [CrossRef]
  19. Wu, H.; Zhang, J.; Ngo, H.H.; Guo, W.; Hu, Z.; Liang, S.; Fan, J.; Liu, H. A review on the sustainability of constructed wetlands for wastewater treatment: Design and operation. Bioresour. Technol. 2015, 175, 594–601. [Google Scholar] [CrossRef]
  20. Ávila, C.; Bayona, J.M.; Martín, I.; José Salas, J.; García, J. Emerging organic contaminant removal in a full-scale hybrid constructed wetland system for wastewater treatment and reuse. Ecol. Eng. 2015, 80, 108–116. [Google Scholar] [CrossRef] [Green Version]
  21. Radoux, M.; Cadelli, D.; Nemcova, M.; Ennabili, A.; Ezzahri, J.; Ater, M. Optimization of natural wastewater treatment technologies in the MHEA Experimental Centre in M’Diq, Mediterranean Coast of Morocco. In Proceedings of the Seventh International Conference on Wetland Systems for Water Pollution Control, Lake Buena Vista, FL, USA, 11–16 November 2000; pp. 1145–1152. [Google Scholar]
  22. White, S.A.; Cousins, M.M. Floating treatment wetland aided remediation of nitrogen and phosphorus from simulated stormwater runoff. Ecol. Eng. 2013, 61, 207–215. [Google Scholar] [CrossRef]
  23. Hubbard, R.K.; Newton, G.L.; Hill, G.M. Water quality and the grazing animal. J. Anim. Sci. 2004, 82, 255–263. [Google Scholar]
  24. Zhao, F.L.; Hu, G.D.; Wang, X.F.; Zhang, X.-H.; Yu, Z.-S. Serum overexpression of microRNA-10b in patients with bone metastatic primary breast cancer. J. Int. Med. Res. 2012, 40, 859–866. [Google Scholar] [CrossRef] [PubMed]
  25. Xian, Q.; Hu, L.; Chen, H.; Chang, Z.; Zou, H. Removal of nutrients and veterinary antibiotics from swine wastewater by a constructed macrophyte floating bed system. J. Environ. Manag. 2010, 91, 2657–2661. [Google Scholar] [CrossRef]
  26. Iglesias, A.; Rosenzweig, C.; Pereira, D. Agricultural impacts of climate change in Spain: Developing tools for a spatial analysis. Glob. Environ. Chang. 2000, 10, 69–80. [Google Scholar] [CrossRef]
  27. Dai, J.; Xu, M.; Chen, J.; Yang, X.; Ke, Z. PCDD/F, PAH and heavy metals in the sewage sludge from six wastewater treatment plants in Beijing, China. Chemosphere 2007, 66, 353–361. [Google Scholar] [CrossRef]
  28. Martin, M.; Gargallo, S.; Hernandez-Crespo, C.; Oliver, N. Phosphorus and nitrogen removal from tertiary treated urban wastewaters by a vertical flow constructed wetland. Ecol. Eng. 2013, 61, 34–42. [Google Scholar] [CrossRef]
  29. Brix, H. Do macrophytes play a role in constructed treatment wetlands? Water Sci. Technol. 1997, 35, 11–17. [Google Scholar] [CrossRef]
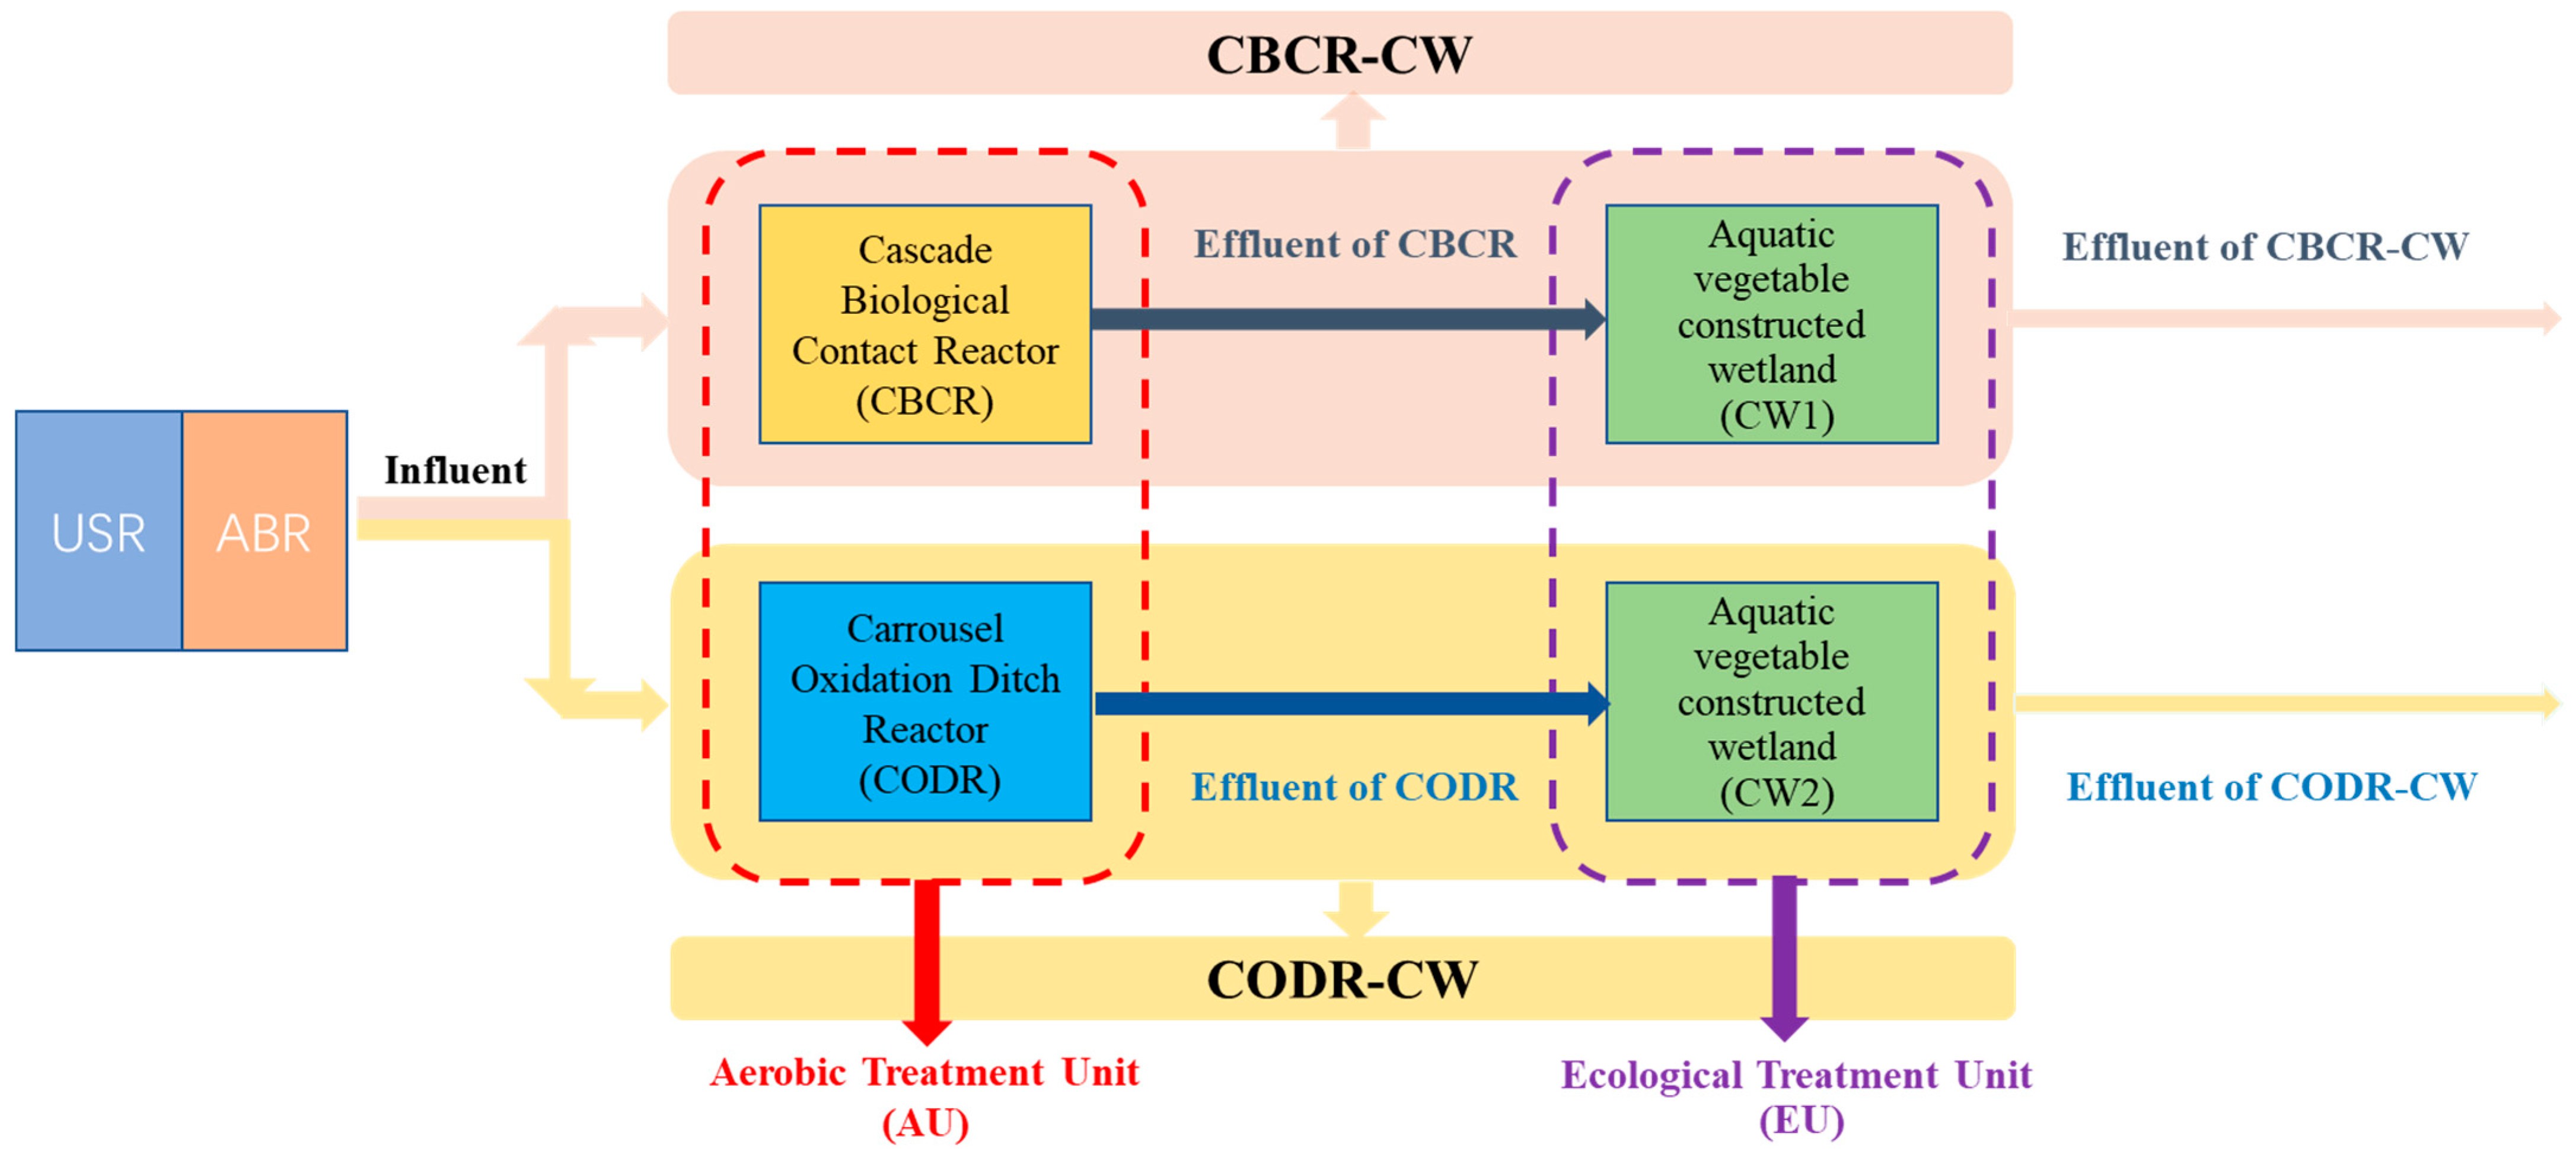
Figure 1. Flow chart of AUEU.
Sustainability 14 08819 g001
Figure 2. Schematic diagram of (a) CBCR, (b) CODR, and (c) CW.
Sustainability 14 08819 g002
Figure 3. Removal efficiency of COD in (a) CBCR-CW; (b) CODR-CW; (c) average COD concentrations at each stage of treatment.
Sustainability 14 08819 g003
Figure 4. Removal efficiency of NH4+-N in (a) CBCR-CW, (b) CODR-CW; (c) average NH4+-N concentrations at each stage of treatment.
Sustainability 14 08819 g004
Figure 5. Removal efficiency of TN in (a) CBCR-CW, (b) CODR-CW; (c) average TN concentrations at each stage of treatment.
Sustainability 14 08819 g005
Figure 6. Removal efficiency of TP in (a) CBCR-CW, (b) CODR-CW; (c) average TP concentrations at each stage of treatment.
Sustainability 14 08819 g006
Figure 7. Intensity of nitrification and denitrification along with the CWs.
Sustainability 14 08819 g007
Figure 8. Removal pathways and percentages of nitrogen and phosphorus in aquatic vegetation CWs.
Sustainability 14 08819 g008
Table 1. Contents of nutrient solutions in nitrification and denitrification tests.
Types of TestContents and Values
KH2PO4K2HPO4(NH4)2SO4KNO3GlucoseVolume RatiopH
Nitrification 0.2 mol/L0.2 mol/L0.05 mol/L0 mol/L0 mol/L3:7:30:0:07.2
Denitrification 0.2 mol/L0.2 mol/L0 mol/L0.03 mol/L0.02 mol/L3:7:0:30:107.2
Table 2. Algal toxin concentration at different stages of aerobic treatment.
TypeInfluentEffluent of CODREffluent of CBCREffluent of CW2Effluent of W1
TMC0.080000
EMC0.020000
TMC00000
EMC00000
Publisher’s Note: MDPI stays neutral with regard to jurisdictional claims in published maps and institutional affiliations.