
Geoprocessing Applied to the Assessment of Carbon Storage and Sequestration in a Brazilian Medium-Sized City


 ,
,  and
and
Abstract
:1. Introduction
2. Materials and Methods
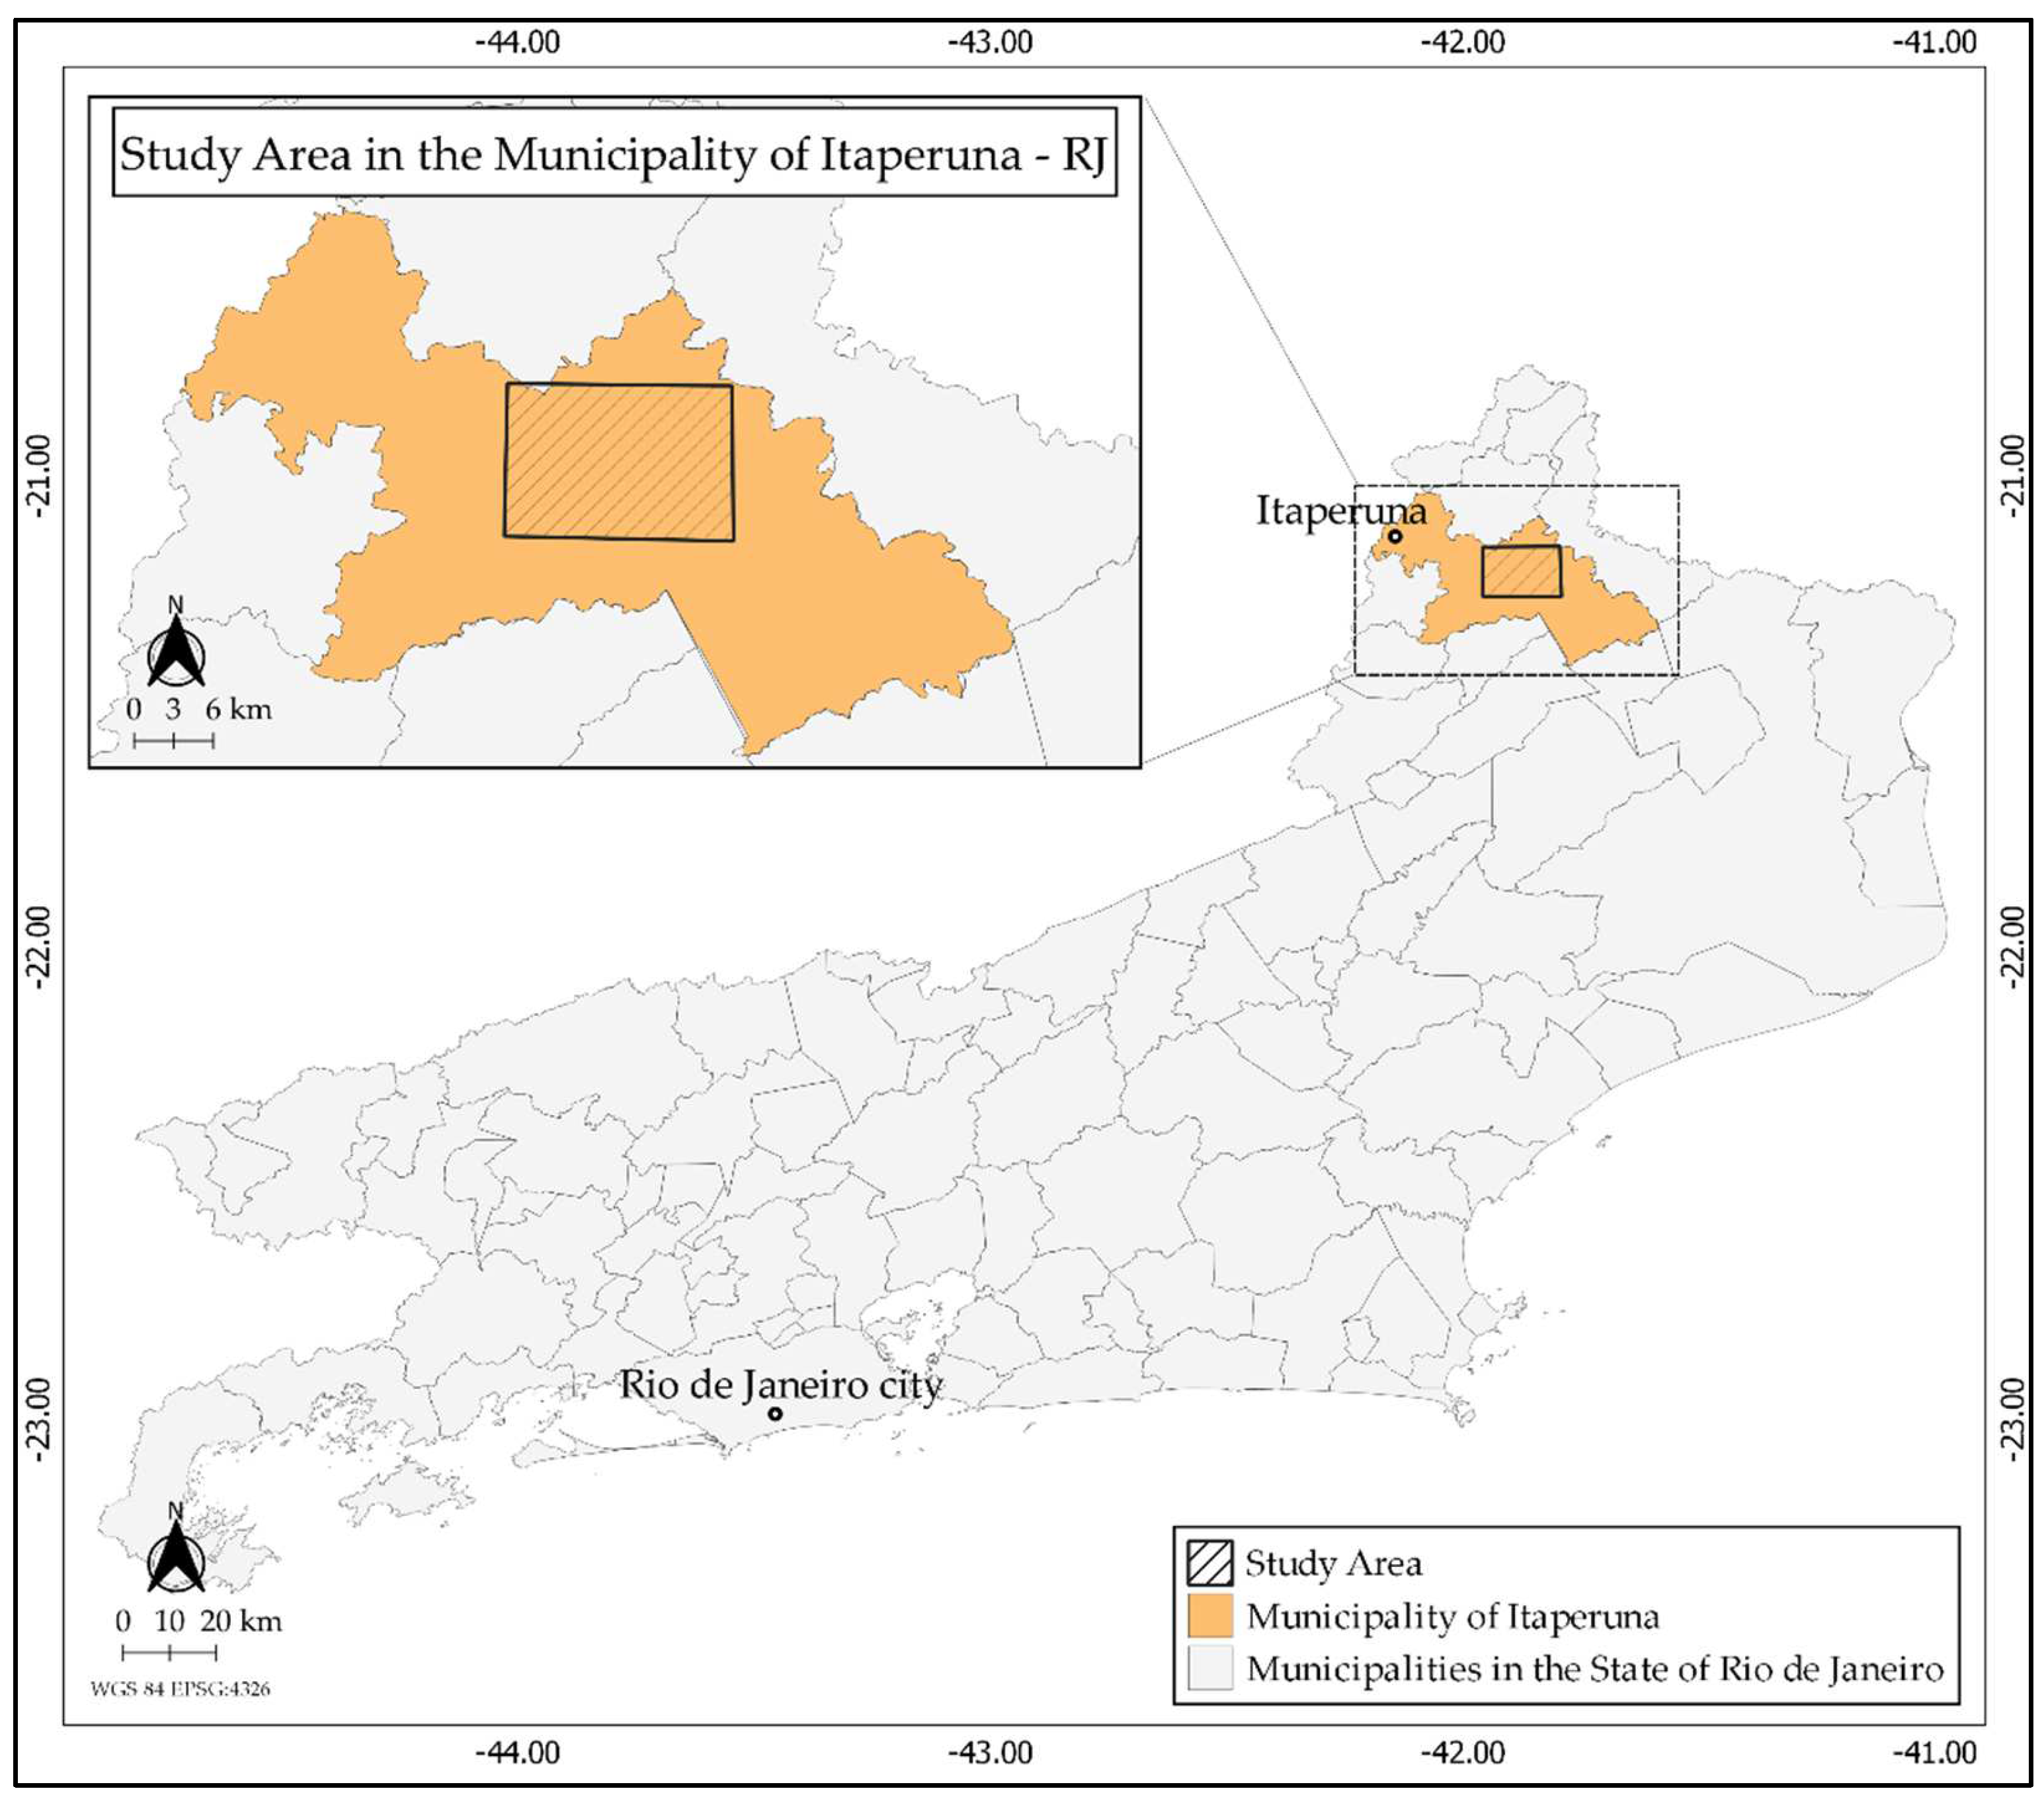
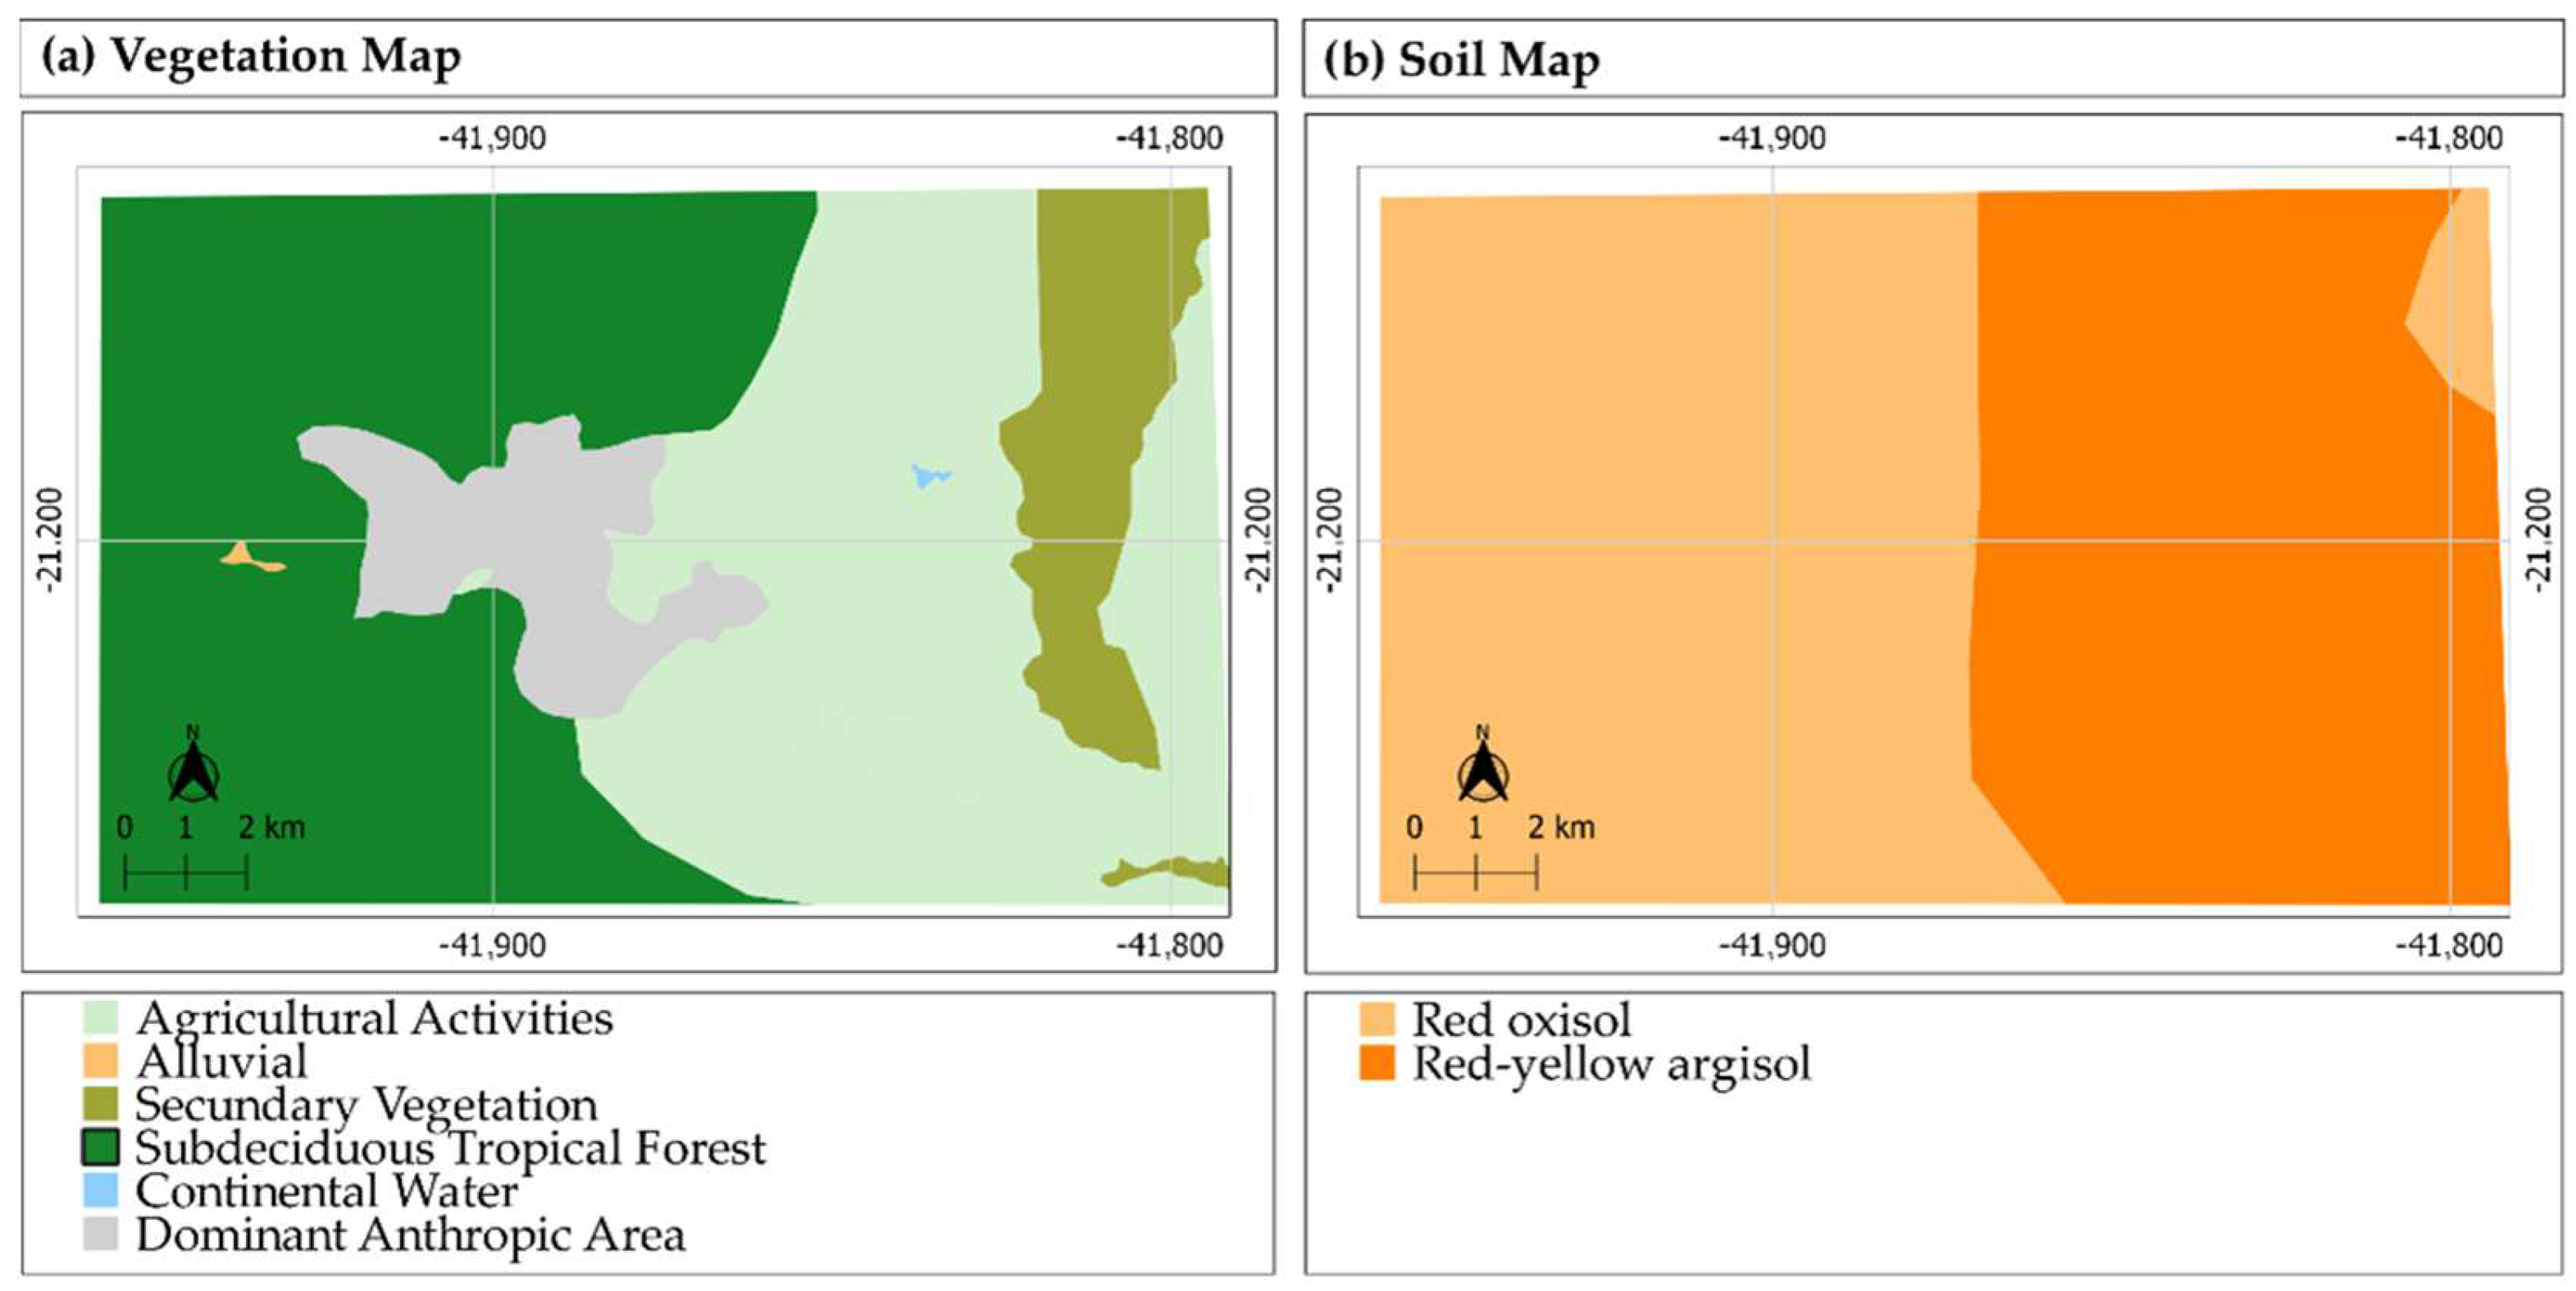
2.1. Case Study
2.2. Remote Sensing in Image Classification
- 1.
- Selecting training areas: Selection of pixels representing the classes of interest in the image and construction of decision-making rules. Each LULC class must have a collection of representative samples (pixels) given “D” training samples {xi, yi}, with i = 1, 2, …, D, where xi ∈ RM is a vector representation of a set and yi ∈ {−1, 1} is its associated class to generate a signature file with all spectral training information.
- 2.
- Generating signature file: These “training sites” are taken as the Real Map (composed of the selected samples of each LULC class) to enable the algorithm applied to classify the entire image, creating a Predicted Map.
- 3.
- Classifying: Finally, the entire image is classified by the selected algorithm.
2.3. InVEST CSS Methodology
2.4. Social Cost of Carbon
3. Results
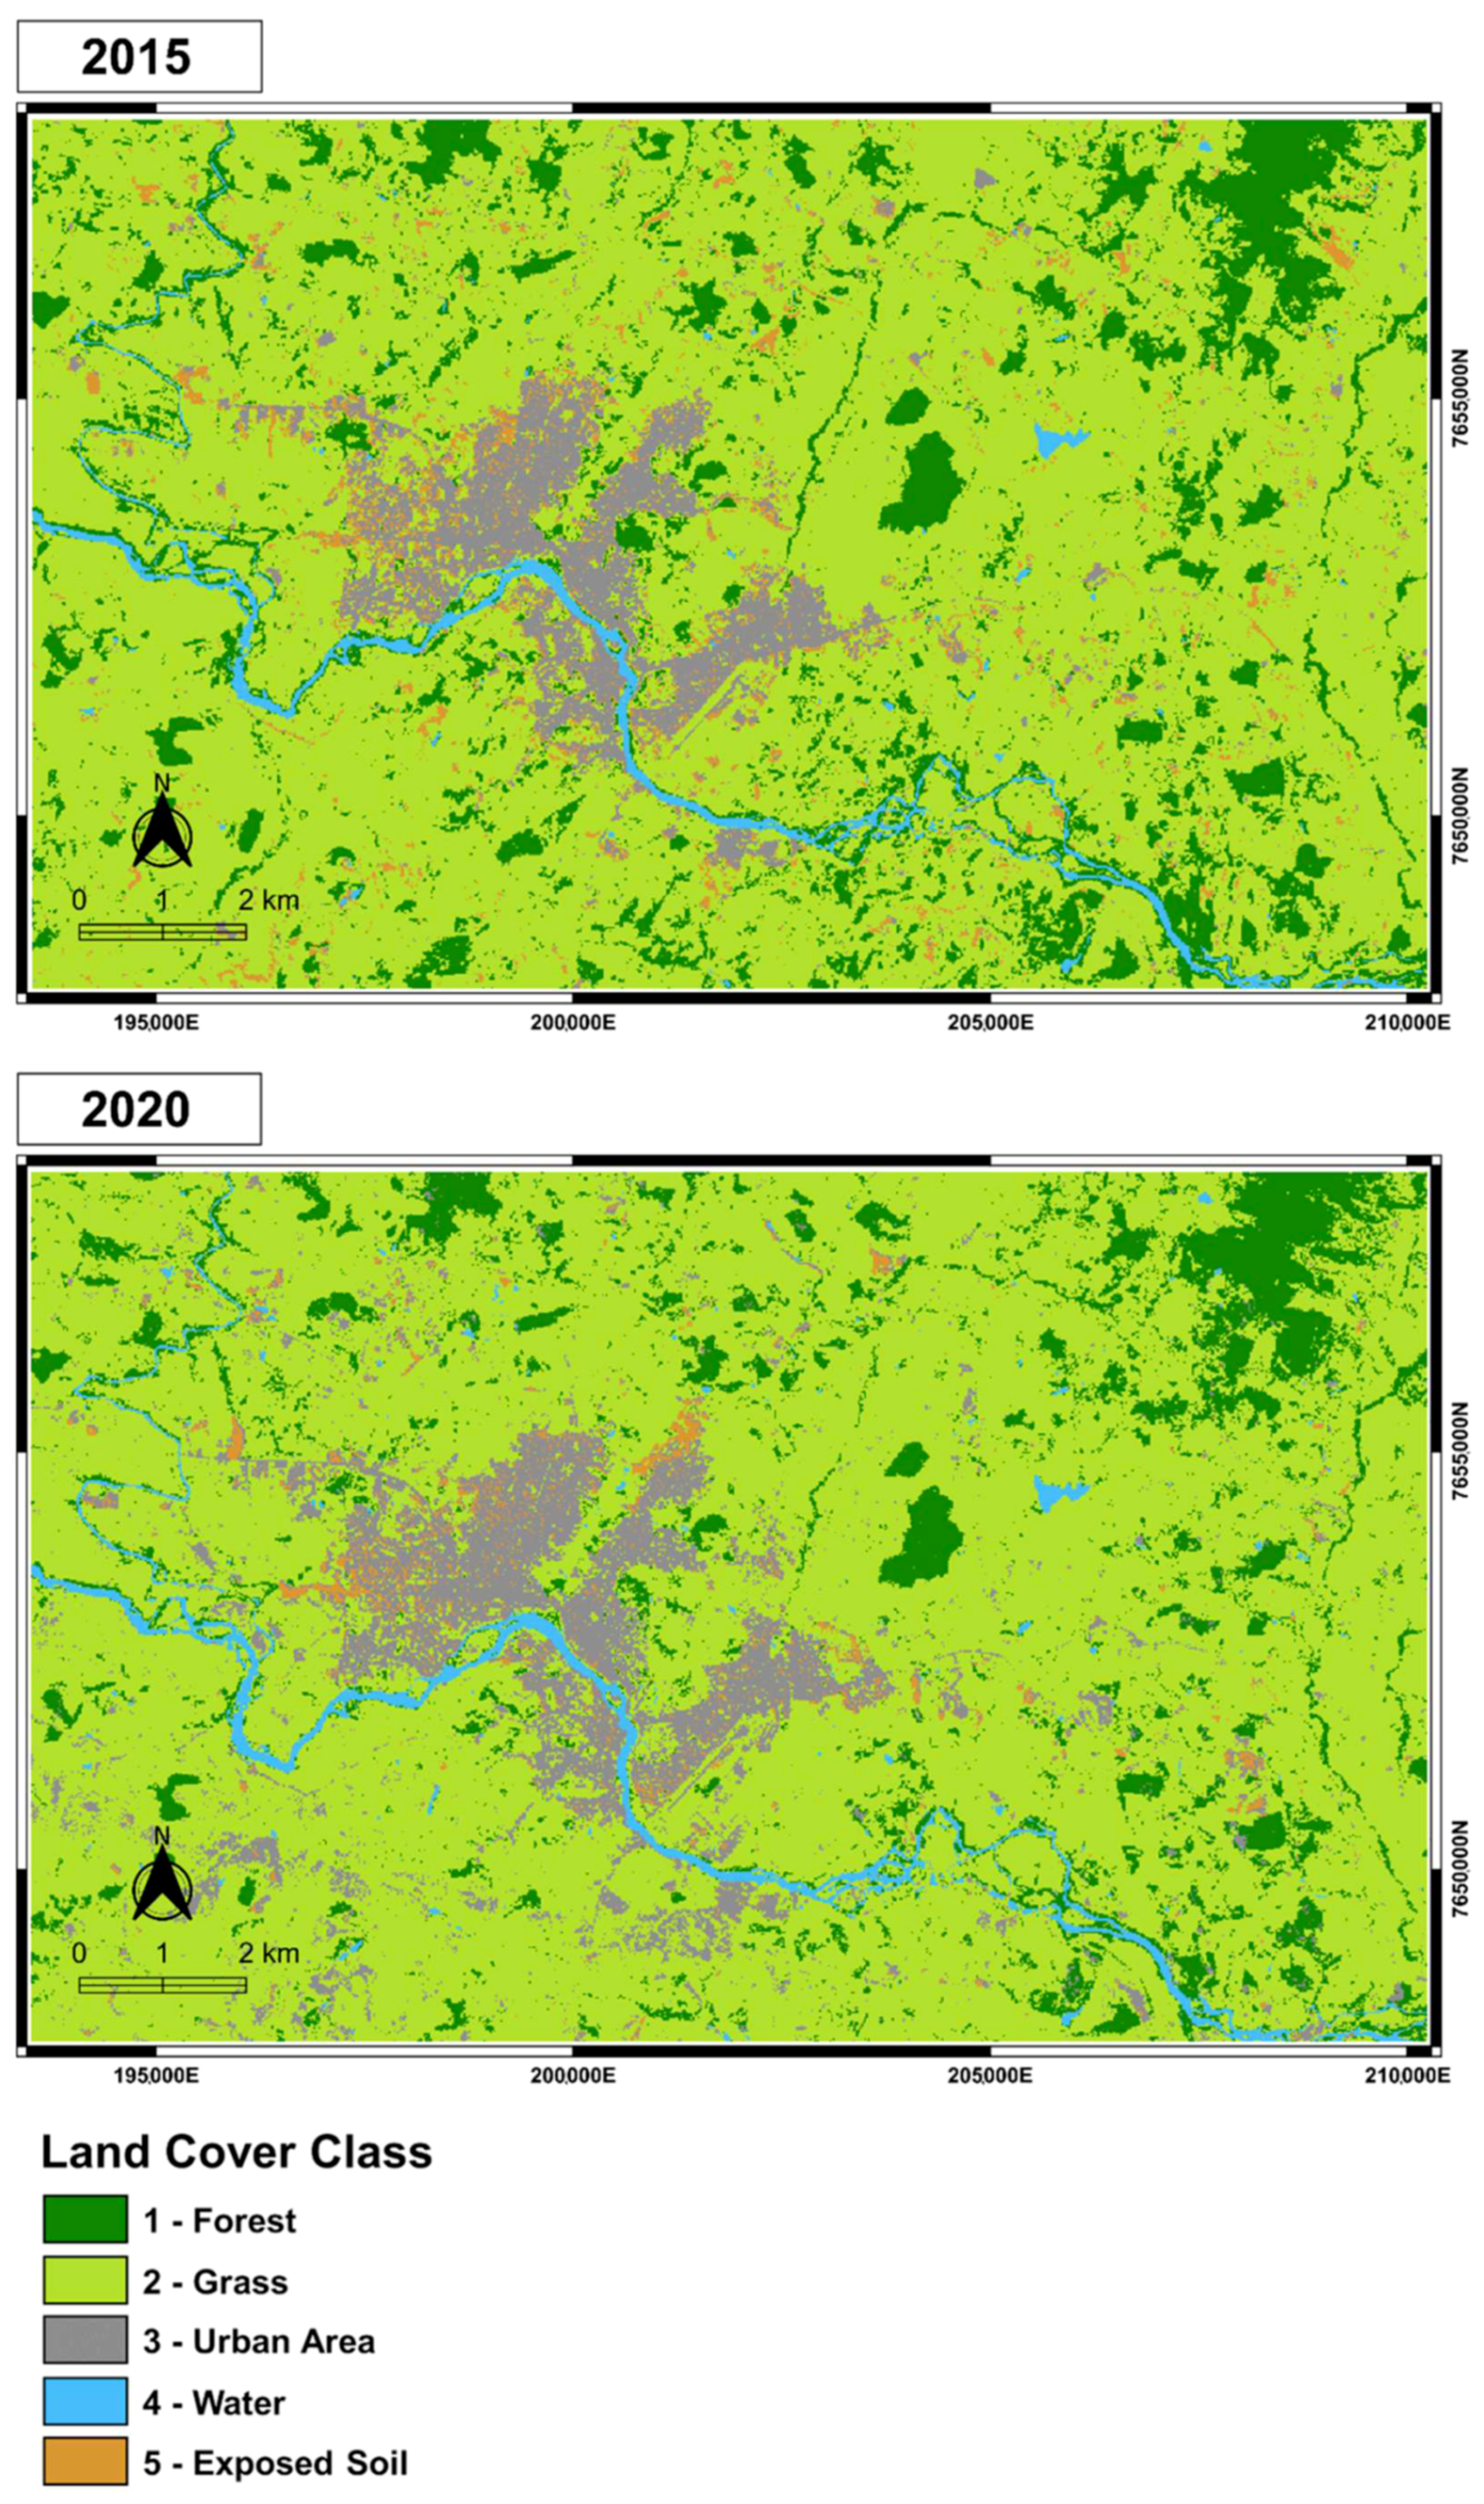
3.1. LULC Maps Classification
3.2. Carbon Pools
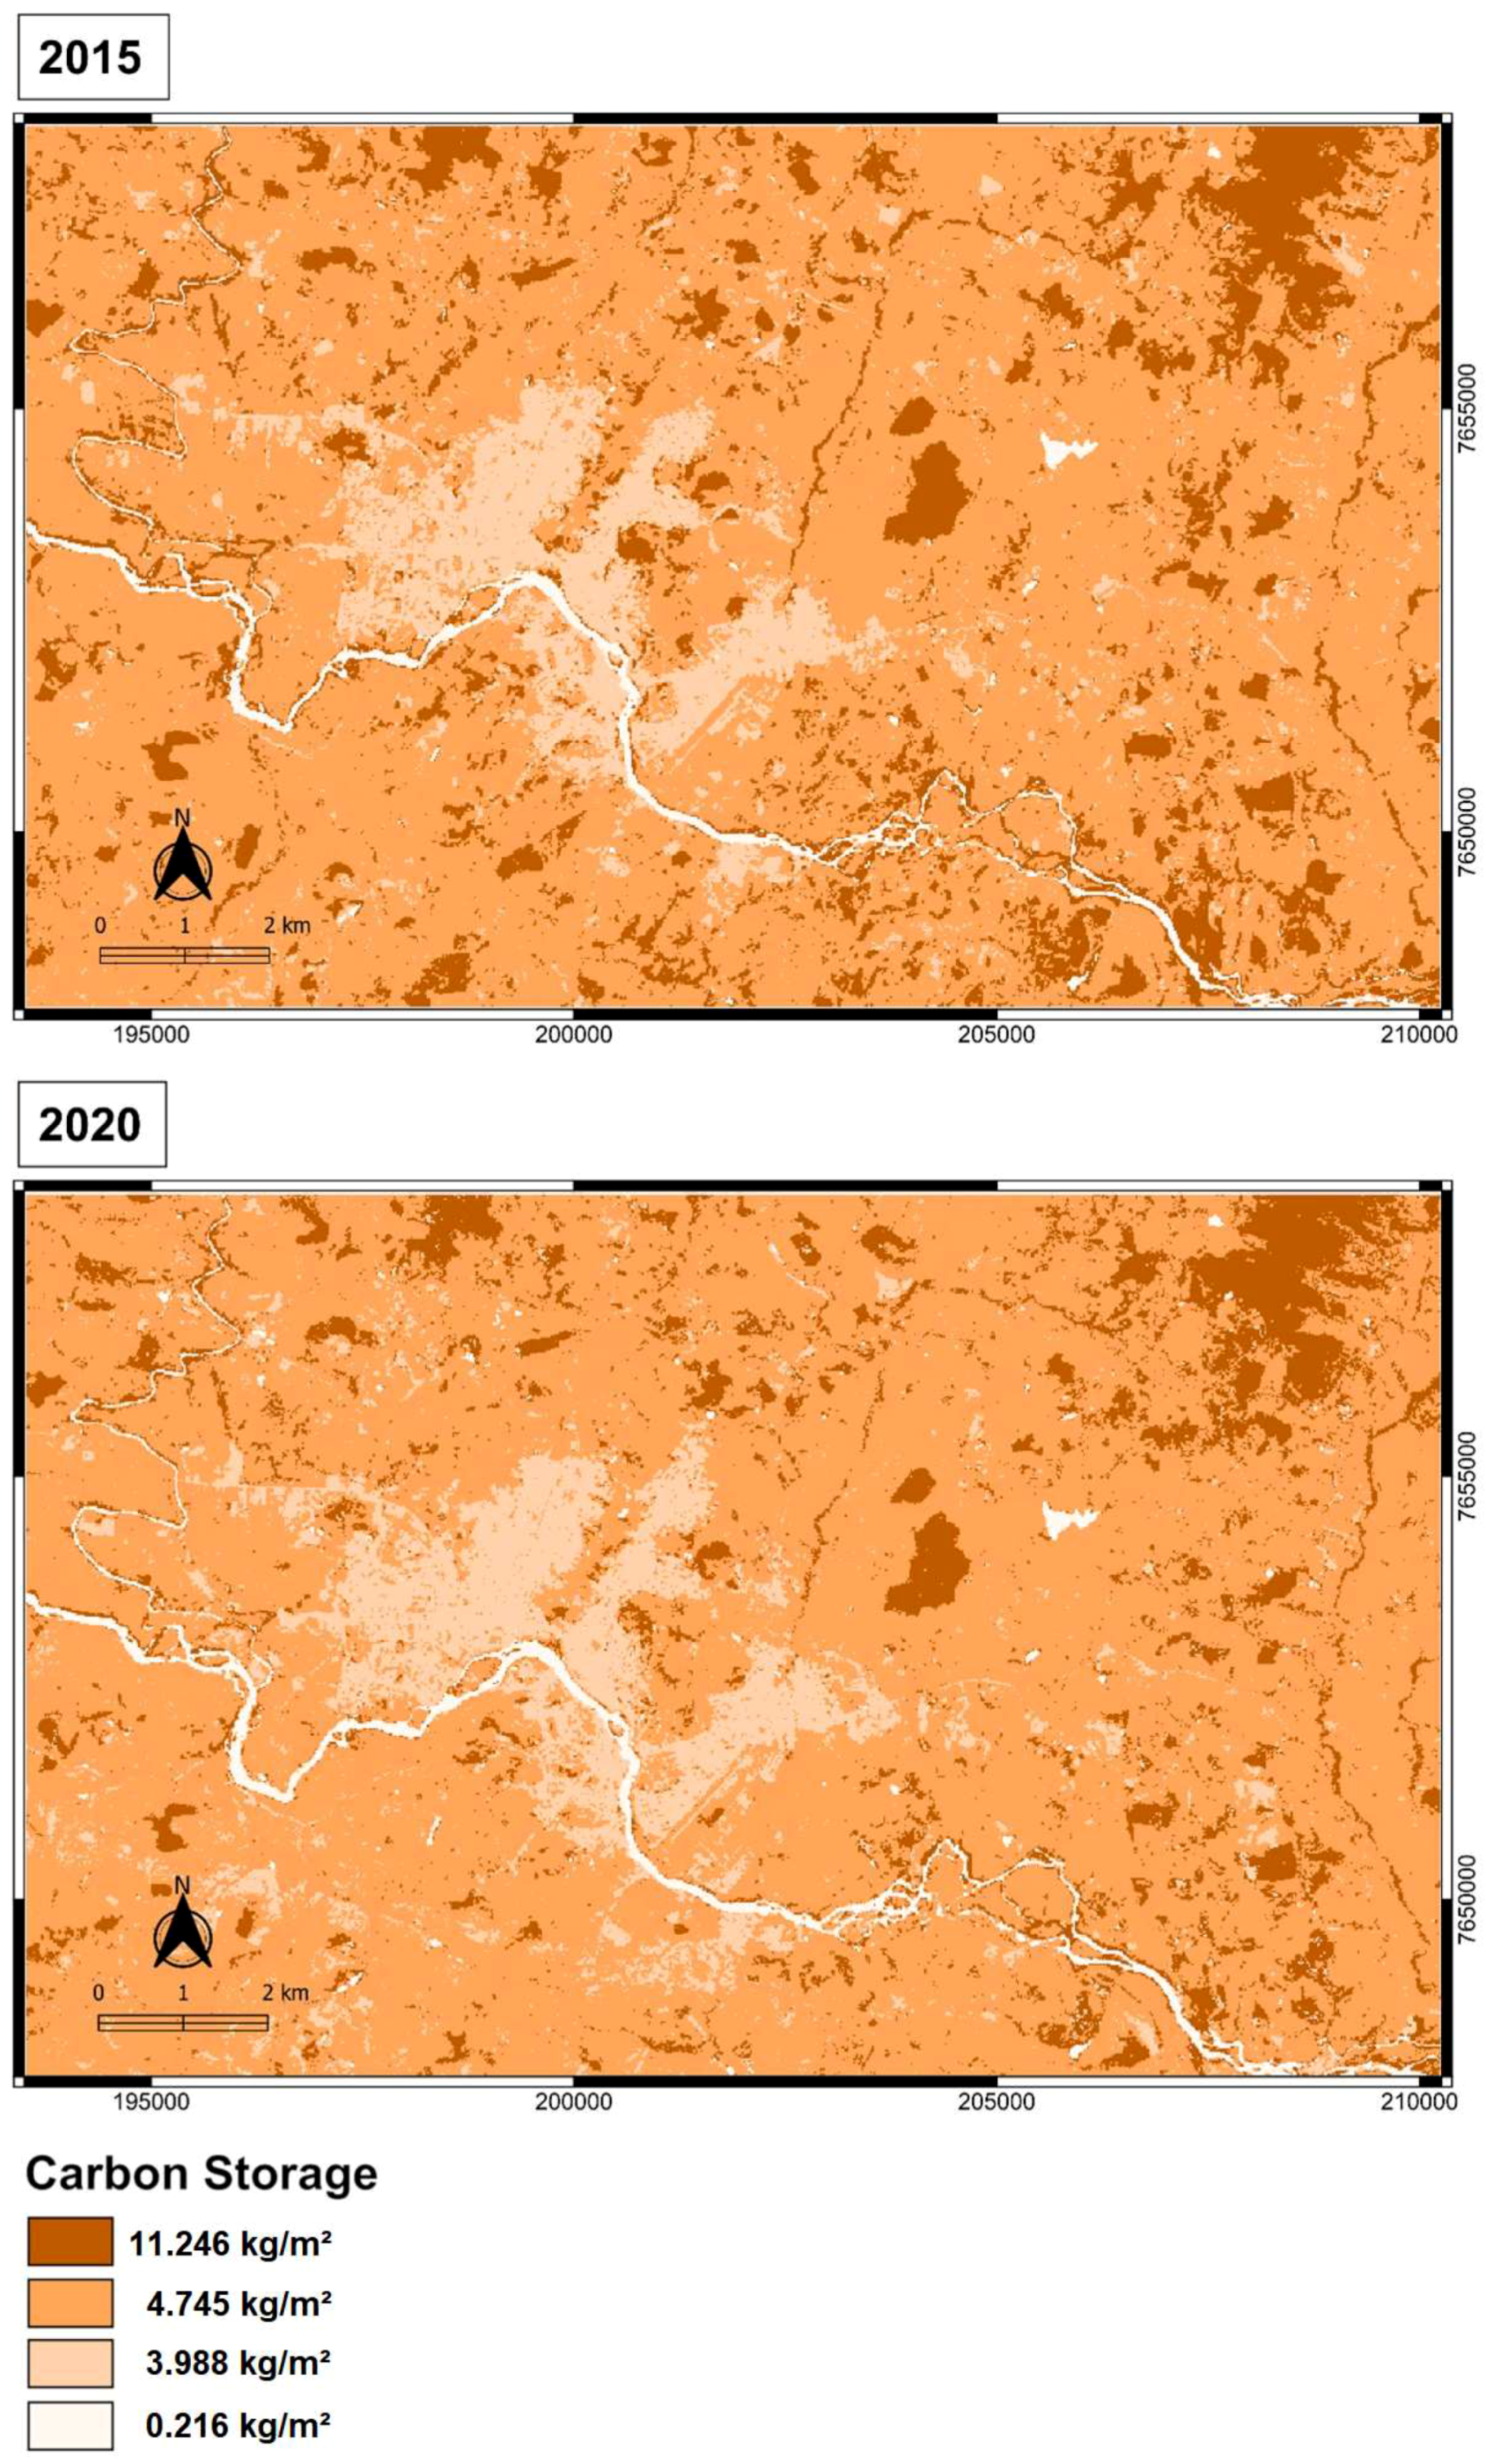
3.3. InVEST CSS
4. Discussion
5. Conclusions
Author Contributions
Funding
Institutional Review Board Statement
Informed Consent Statement
Acknowledgments
Conflicts of Interest
References
- UN. Secretary-General. World Commission on Environment and Development. Report of the World Commission on Environment and Development: Note/by the Secretary-General; United Nations: New York, NY, USA, 1987. [Google Scholar]
- Prado, A.L. Desenvolvimento urbano sustentável: De paradigma a mito. Oculum Ens. 2015, 12, 83–97. [Google Scholar] [CrossRef] [Green Version]
- Simon, D. Our Common Future: Report of the World Commission on Environment and Development (Book Review). Third World Plann. Rev. 1987, 9, 285. [Google Scholar] [CrossRef]
- United Nations. World Urbanization Prospects: The 2018 Revision; United Nations: New York, NY, USA, 2018. [Google Scholar]
- IBGE Instituto Brasileiro de Geografia e Estatística Cidades e Estados, Itaperuna (RJ). Available online: https://www.ibge.gov.br/cidades-e-estados/rj/itaperuna.html (accessed on 25 June 2022).
- Intergovermental Panel on Climate Change. 2006 IPCC Guidelines for National Greenhouse Gas Inventories, Volume 1: General Guidance and Reporting Annex 8a.2 Reporting Tables; Institute for Global Environmental Strategies (IGES): Hayama, Japan, 2006. [Google Scholar]
- de Azevedo, T.R.; Costa Junior, C.; Brandão Junior, A.; Cremer, M.D.S.; Piatto, M.; Tsai, D.S.; Barreto, P.; Martins, H.; Sales, M.; Galuchi, T.; et al. SEEG initiative estimates of Brazilian greenhouse gas emissions from 1970 to 2015. Sci. Data 2018, 5, 180045. [Google Scholar] [CrossRef] [Green Version]
- Bennett, A.F.; Saunders, D.A. Habitat fragmentation and landscape change. In Conservation Biology for All; Oxford University Press: Oxford, UK, 2010; pp. 88–106. [Google Scholar]
- Munthali, M.G.; Davis, N.; Adeola, A.M.; Botai, J.O.; Kamwi, J.M.; Chisale, H.L.W.; Orimoogunje, O.O.I. Local Perception of Drivers of Land-Use and Land-Cover Change Dynamics across Dedza District, Central Malawi Region. Sustainability 2019, 11, 832. [Google Scholar] [CrossRef] [Green Version]
- Hailu, A.; Mammo, S.; Kidane, M. Dynamics of land use, land cover change trend and its drivers in Jimma Geneti District, Western Ethiopia. Land Use Policy 2020, 99, 105011. [Google Scholar] [CrossRef]
- Ahmed, R.; Ahmad, S.T.; Wani, G.F.; Ahmed, P.; Mir, A.A.; Singh, A. Analysis of landuse and landcover changes in Kashmir valley, India—A review. GeoJournal 2021. [Google Scholar] [CrossRef]
- Weng, S.-S.; Chen, K.-Y.; Li, C.-Y. Application of the Analytic Hierarchy Process and Grey Relational Analysis for Vendor Selection of Spare Parts Planning Software. Symmetry 2019, 11, 1182. [Google Scholar] [CrossRef] [Green Version]
- Ramankutty, N.; Foley, J.A. Estimating historical changes in global land cover: Croplands from 1700 to 1992. Glob. Biogeochem. Cycles 1999, 13, 997–1027. [Google Scholar] [CrossRef]
- Maitima, J.M.; Mugatha, S.M.; Reid, R.S.; Gachimbi, L.N.; Majule, A.; Lyaruu, H.; Pomery, D.; Mathai, S.; Mugisha, S. The linkages between land use change, land degradation and biodiversity across East Africa. Afr. J. Environ. Sci. Technol. 2009, 3, 310–325. [Google Scholar] [CrossRef]
- Berihun, M.L.; Tsunekawa, A.; Haregeweyn, N.; Meshesha, D.T.; Adgo, E.; Tsubo, M.; Masunaga, T.; Fenta, A.A.; Sultan, D.; Yibeltal, M. Exploring land use/land cover changes, drivers and their implications in contrasting agro-ecological environments of Ethiopia. Land Use Policy 2019, 87, 104052. [Google Scholar] [CrossRef]
- United Nations. Kyoto Protocol to the United Nations Framework Convention on Climate Change; United Nations: New York, NY, USA, 1998. [Google Scholar]
- Amaral, R.; Costa, S.D.A.P.; Muzzi, M.R.S. O sequestro de carbono em trechos da floresta urbana de Belo Horizonte: Por um sistema de espaços livres mais eficiente no provimento de serviços ecossistêmicos urbanos. Paisag. Ambient. 2017, 39, 163–179. [Google Scholar] [CrossRef] [Green Version]
- Gretchen, C. Daily Nature’s Services: Societaldependence on Natural Ecosystems; Island Press: Washington, DC, USA, 1997. [Google Scholar]
- Kweku, D.; Bismark, O.; Maxwell, A.; Desmond, K.; Danso, K.; Oti-Mensah, E.; Quachie, A.; Adormaa, B. Greenhouse Effect: Greenhouse Gases and Their Impact on Global Warming. J. Sci. Res. Rep. 2018, 17, 1–9. [Google Scholar] [CrossRef]
- IPCC. Climate Change 2014 Synthesis Report Summary Chapter for Policymakers; IPCC: Geneva, Switzerland, 2014. [Google Scholar]
- IPCC. Climate Change Widespread, Rapid, and Intensifying—IPCC Press Release; IPCC: Geneva, Switzerland, 2021. [Google Scholar]
- Lal, R. Sequestration of atmospheric CO2 in global carbon pools. Energy Environ. Sci. 2008, 1, 86–100. [Google Scholar] [CrossRef]
- Hinge, A.; He, J.; Bartram, J.; Javier, J.; Xu, J.; Fjellman, E.; Sesaki, H.; Li, T.; Yu, J.; Wunderlich, M.; et al. Asymmetrically Segregated Mitochondria Provide Cellular Memory of Hematopoietic Stem Cell Replicative History and Drive HSC Attrition. Cell Stem Cell 2020, 26, 420–430.e6. [Google Scholar] [CrossRef] [PubMed]
- Batjes, N.H. Total carbon and nitrogen in the soils of the world. Eur. J. Soil Sci. 2014, 65, 10–21. [Google Scholar] [CrossRef]
- InVEST. InVEST Carbon Storage and Sequestration User Guide. Available online: https://storage.googleapis.com/releases.naturalcapitalproject.org/invest-userguide/latest/carbonstorage.html (accessed on 4 May 2021).
- Bluffstone, R.; Coulston, J.; Haight, R.G.; Kline, J.; Polasky, S.; Wear, D.N.; Zook, K. Estimated Values of Carbon Sequestration Resulting from Forest Management Scenarios Chapter 1: Assessing Pollinator Habitat Services to Optimize Conservation Programs Chapter 2: Ecosystem Service Benefits Generated by Improved Water Quality from Conservat. In The Valuation of Ecosystem Services from Farms and Forests: Informing a Systematic Approach to Quantifying Benefits of Conservation Programs. Report No. 0114-301; Council on Food, Agricultural and Resource Economics (C-FARE): Washington, DC, USA, 2017; pp. 7–24. [Google Scholar]
- Sharp, R.; Tallis, H.; Ricketts, T.; Guerry, A.; Wood, S.; Chaplin-Kramer, R.; Nelson, E. The Natural Capital Project. The Nature Conservancy and World Wildlife Fund. In VEST Version 3.2. 0 User’s Guide; Stanford University: Stanford, CA, USA; University of Minnesota: Minneapolis, MN, USA, 2015. [Google Scholar]
- Embrapa. Sistema Brasileiro de Classificação de Solos; Embrapa: Brasília, Brazil, 2018; ISBN 978-85-7035-198-2. [Google Scholar]
- Martorano, L.G.; Rossiello, R.O.P.; Meneguelli, N.A.; Lumbreras, J.F.; Valle, L.S.S.; Motta, P.E.F.; Rebello, E.R.G.; Said, U.P.; Martins, G.S. Aspectos Climáticos do Noroeste Fluminense, RJ.—Portal Embrapa; Embrapa Solos: Rio de Janeiro, Brazil, 2003. [Google Scholar]
- IBGE Instituto Brasileiro de Geografia e Estatística Mapa de Vegetação do Brasil. Available online: https://geoftp.ibge.gov.br/informacoes_ambientais/vegetacao/mapas/brasil/vegetacao.pdf (accessed on 20 August 2021).
- IBGE Instituto Brasileiro de Geografia e Estatística Mapa de Solos do Brasil. Available online: https://geoftp.ibge.gov.br/informacoes_ambientais/pedologia/mapas/brasil/solos.pdf (accessed on 20 August 2021).
- Campos, P.C.O. Avaliação do Efeito da Variação da Umidade no Comportamento Mecanístico de um Trecho da Estrada de Ferro Carajás; Instituto Militar de Engenharia: Rio de Janeiro, Brazil, 2019. [Google Scholar]
- Campos, P.C.D.O.; Silva, B.-H.D.A.E.; Marques, M.E.S. Caracterização geotécnica dos solos de subleito ferroviário: Investigações de campo e laboratoriais. Rev. Ibero-Am. Ciências Ambient. 2019, 10, 178–193. [Google Scholar] [CrossRef]
- CPRM—Companhia de Pesquisa Recursos Minerais Bacia do Rio Muriaé. Available online: https://www.cprm.gov.br/sace/index_bacias_monitoradas.php?getbacia=bmuriae# (accessed on 20 April 2020).
- CEIVAP—Comitê de Integração da Bacia Hidrográfica do Rio Paraíba do Sul Plano de recursos hídricos da Bacia Paraíba do Sul—Resumo. Available online: https://www.ceivap.org.br/downloads/cadernos/Caderno6-Muriae.pdf (accessed on 24 November 2021).
- Campos, P.C.D.O.; Paz, T.D.S.R.; Lenz, L.; Qiu, Y.; Alves, C.N.; Simoni, A.P.R.; Amorim, J.C.C.; Lima, G.B.A.; Rangel, M.P.; Paz, I. Multi-Criteria Decision Method for Sustainable Watercourse Management in Urban Areas. Sustainability 2020, 12, 6493. [Google Scholar] [CrossRef]
- Campos, P.C.D.O.; Paz, I. Spatial Diagnosis of Rain Gauges’ Distribution and Flood Impacts: Case Study in Itaperuna, Rio de Janeiro—Brazil. Water 2020, 12, 1120. [Google Scholar] [CrossRef] [Green Version]
- Jain, A.K. Data clustering: 50 years beyond K-means. Pattern Recognit. Lett. 2010, 31, 651–666. [Google Scholar] [CrossRef]
- Steinhaus, H. Sur la division des corps matériels en parties. Bull. L’academie Pol. des Sci. 1956, IV, 801–804. [Google Scholar]
- Ball, G.H.; Hall, D.J. ISODATA, a Novel Method of Data Analysis and Pattern Classification; Stanford Research Institute: Stanford, CA, USA, 1965. [Google Scholar]
- Forgy, E. Cluster Analysis of Multivariate Data: Efficiency versus Interpretability of Classifications. Biometrics 1965, 21, 768–780. [Google Scholar]
- Dempster, A.P.; Laird, N.M.; Rubin, D.B. Maximum Likelihood from Incomplete Data Via the EM Algorithm. J. R. Stat. Soc. Ser. B 1977, 39, 1–22. [Google Scholar] [CrossRef]
- Ari, C.; Aksoy, S. Unsupervised classification of remotely sensed images using Gaussian mixture models and particle swarm optimization. In Proceedings of the 2010 IEEE International Geoscience and Remote Sensing Symposium, Honolulu, HI, USA, 25–30 July 2010; pp. 1859–1862. [Google Scholar]
- Mather, P.; Tso, B. Classification Methods for Remotely Sensed Data, 2nd ed.; CRC Press: Boca Raton, FL, USA, 2009; ISBN 9780429192029. [Google Scholar]
- Vapnik, V. The Nature of Statistical Learning Theory, 2nd ed.; Springer Science & Business Media: New York, NY, USA, 1999. [Google Scholar]
- Cortes, C.; Vapnik, V. Support-vector networks. Mach. Learn. 1995, 20, 273–297. [Google Scholar] [CrossRef]
- Zhao, B.; Zhong, Y.; Zhang, L.; Huang, B. The Fisher Kernel Coding Framework for High Spatial Resolution Scene Classification. Remote Sens. 2016, 8, 157. [Google Scholar] [CrossRef] [Green Version]
- Fisher, J.R.B.; Acosta, E.A.; Dennedy-Frank, P.J.; Kroeger, T.; Boucher, T.M. Impact of satellite imagery spatial resolution on land use classification accuracy and modeled water quality. Remote Sens. Ecol. Conserv. 2018, 4, 137–149. [Google Scholar] [CrossRef]
- Khan, U.; Minallah, N.; Junaid, A.; Gul, K.; Ahmad, N. Parallelepiped and Mahalanobis Distance based Classification for forestry identification in Pakistan. In Proceedings of the 2015 International Conference on Emerging Technologies (ICET), Peshawar, Pakistan, 19–20 December 2015; pp. 1–6. [Google Scholar]
- Raiyani, K.; Gonçalves, T.; Rato, L.; Barão, M. Mahalanobis distance based accuracy prediction models for Sentinel-2 Image Scene Classification. Int. J. Remote Sens. 2022, 1–26. [Google Scholar] [CrossRef]
- Ma, L.; Li, M.; Ma, X.; Cheng, L.; Du, P.; Liu, Y. A review of supervised object-based land-cover image classification. ISPRS J. Photogramm. Remote Sens. 2017, 130, 277–293. [Google Scholar] [CrossRef]
- Blaschke, T. Object based image analysis for remote sensing. ISPRS J. Photogramm. Remote Sens. 2010, 65, 2–16. [Google Scholar] [CrossRef] [Green Version]
- Instituto Nacional de Pesquisas Espaciais Catálogo de Imagens. Available online: http://www.dgi.inpe.br/CDSR/ (accessed on 11 May 2021).
- Solórzano, J.V.; Mas, J.F.; Gao, Y.; Gallardo-Cruz, J.A. Land Use Land Cover Classification with U-Net: Advantages of Combining Sentinel-1 and Sentinel-2 Imagery. Remote Sens. 2021, 13, 3600. [Google Scholar] [CrossRef]
- Damtea, W.; Kim, D.; Im, S. Spatiotemporal Analysis of Land Cover Changes in the Chemoga Basin, Ethiopia, Using Landsat and Google Earth Images. Sustainability 2020, 12, 3607. [Google Scholar] [CrossRef]
- Liu, C.; Li, W.; Zhu, G.; Zhou, H.; Yan, H.; Xue, P. Land Use/Land Cover Changes and Their Driving Factors in the Northeastern Tibetan Plateau Based on Geographical Detectors and Google Earth Engine: A Case Study in Gannan Prefecture. Remote Sens. 2020, 12, 3139. [Google Scholar] [CrossRef]
- Lal, R. Soil Carbon Sequestration Impacts on Global Climate Change and Food Security. Science 2004, 304, 1623–1627. [Google Scholar] [CrossRef] [PubMed] [Green Version]
- Kotchen, M. Which Social Cost of Carbon? A Theoretical Perspective; National Bureau of Economic Research: Cambridge, MA, USA, 2016. [Google Scholar]
- Energy Research Company Carbon Pricing: Risks and Opportunities for Brazil. Available online: https://www.epe.gov.br/sites-pt/publicacoes-dados-abertos/publicacoes/PublicacoesArquivos/publicacao-549/NT%20EPE-DEA-GAB-014-2020%20-%20Precificação%20de%20C_final_05012021.pdf (accessed on 20 August 2021).
- Borges, E.C.; Paz, I.; Leite Neto, A.D.; Willinger, B.; Ichiba, A.; Gires, A.; Campos, P.C.D.O.; Monier, L.; Cardinal, H.; Amorim, J.C.C.; et al. Evaluation of the spatial variability of ecosystem services and natural capital: The urban land cover change impacts on carbon stocks. Int. J. Sustain. Dev. World Ecol. 2021, 28, 339–349. [Google Scholar] [CrossRef]
- Torres, C.M.M.E.; Jacovine, L.A.G.; Soares, C.P.B.; Oliveira Neto, S.N.; Santos, R.D.; Castro Neto, F. Quantificação de biomassa e estocagem de carbono em uma floresta estacional semidecidual, no Parque Tecnológico de Viçosa, MG. Rev. Árvore 2013, 37, 647–655. [Google Scholar] [CrossRef] [Green Version]
- Baldotto, M.A.; Vieira, E.M.; Souza, D.D.O.; Baldotto, L.E.B. Estoque e frações de carbono orgânico e fertilidade de solo sob floresta, agricultura e pecuária. Rev. Ceres 2015, 62, 301–309. [Google Scholar] [CrossRef]
- Pouyat, R.V.; Yesilonis, I.D.; Nowak, D.J. Carbon Storage by Urban Soils in the United States. J. Environ. Qual. 2006, 35, 1566–1575. [Google Scholar] [CrossRef] [Green Version]
- Adhikari, S.; Lal, R.; Sahu, B.C. Carbon sequestration in the bottom sediments of aquaculture ponds of Orissa, India. Ecol. Eng. 2012, 47, 198–202. [Google Scholar] [CrossRef]
- U.S. Bureau of Labor Statistics CPI Inflation Calculator. Available online: https://www.bls.gov/data/inflation_calculator.htm (accessed on 25 August 2021).
- Paz, T.D.S.R.; da Rocha Junior, V.G.; de Oliveira Campos, P.C.; Paz, I.; Caiado, R.G.G.; de Aragão Rocha, A.; Lima, G.B.A. Hybrid method to guide sustainable initiatives in higher education: A critical analysis of Brazilian municipalities. Int. J. Sustain. High. Educ. 2022. [Google Scholar] [CrossRef]
- Galán-Valdivieso, F.; Saraite-Sariene, L.; Alonso-Cañadas, J.; Caba-Pérez, M. Do Corporate Carbon Policies Enhance Legitimacy? A Social Media Perspective. Sustainability 2019, 11, 1161. [Google Scholar] [CrossRef] [Green Version]
- Nikologianni, A.; Moore, K.; Larkham, P. Making Sustainable Regional Design Strategies Successful. Sustainability 2019, 11, 1024. [Google Scholar] [CrossRef] [Green Version]

| Image Classification Technique | Software/Algorithm | Reference |
|---|---|---|
| Unsupervised Classification | K-means | [38,39] |
| ISODATA | [40,41] | |
| Supervised Classification | Maximum Likelihood | [42] |
| Gaussian Mixture Model (GMM) | [43] | |
| Minimum Distance | [44] | |
| Support Vector Machine (SVM) | [45,46] | |
| Fisher Kernel (FK) | [47,48] | |
| Mahalanobis Distance | [49,50] | |
| Object-Based Image | Object-Based Image | [51,52] |
| Specification | 2015 | 2020 |
|---|---|---|
| Date | 27 December 2015 | 6 October 2020 |
| Satellite | CBERS 04A | CBERS 04A |
| Sensor | MUX | MUX |
| Spectral Bands | B05: 0.45–0.52 µm B06: 0.52–0.59 µm B07: 0.63–0.69 µm B08: 0.77–0.89 µm | B05: 0.45–0.52 µm B06: 0.52–0.59 µm B07: 0.63–0.69 µm B08: 0.77–0.89 µm |
| Spatial Resolution (Nadir) | 16 m | 16 m |
| LULC Classes | 2015 | 2020 | ||||
|---|---|---|---|---|---|---|
| User’s Accuracy (%) | Producer’s Accuracy (%) | F1-Score (%) | User’s Accuracy (%) | Producer’s Accuracy (%) | F1-Score (%) | |
| Forest | 100.00 | 100.00 | 100.00 | 96.03 | 97.58 | 96.80 |
| Grass | 96.15 | 98.04 | 97.09 | 98.29 | 95.83 | 97.05 |
| Urban Area | 95.16 | 96.72 | 95.93 | 94.26 | 93.50 | 93.88 |
| Water Surface | 100.00 | 100.00 | 100.00 | 99.13 | 100.00 | 99.56 |
| Exposed Soil | 95.52 | 92.75 | 94.12 | 93.33 | 94.12 | 93.72 |
| Overall Accuracy (%) | 97.33 | 96.17 | ||||
| Kappa Coefficient (%) | 96.66 | 93.33 | ||||
| Year | Area (104 × m2) | |||||
|---|---|---|---|---|---|---|
| Forest | Grass | Urban Area | Water Surface | Exposed Soil | Total | |
| 2015 | 2436.92 | 13,106.64 | 1017.12 | 294.16 | 533.96 | 17,388.80 |
| 2020 | 1908.40 | 13,337.28 | 1547.08 | 360.16 | 235.88 | 17,388.80 |
| 2020–2015 | −528.52 | 230.64 | 529.96 | 66.00 | −298.08 | 0.00 |
| LULC Class | LULC Code | Carbon Storage (kg/m2) | ||||
|---|---|---|---|---|---|---|
| Aboveground Biomass | Soil Biomass | Soil Organic Matter (0–40 cm) | Dead Organic Matter | Total | ||
| Forest | 1 | 3.748 [61] | 0.695 [61] | 6.376 [62] | 0.427 [61] | 11.246 |
| Grass | 2 | 0.291 [6] | 0.466 [6] | 3.988 [62] | 0 | 4.745 |
| Urban Area | 3 | 0 | 0 | 3.988 [62,63] | 0 | 3.988 |
| Water Surface | 4 | 0 | 0 | 0.216 [64] | 0 | 0.216 |
| Exposed Soil | 5 | 0 | 0 | 3.988 [62,63] | 0 | 3.988 |
| Year | Carbon Storage (103 kg) | |||||
|---|---|---|---|---|---|---|
| Forest | Grass | Urban Area | Water Surface | Exposed Soil | Total | |
| 2015 | 274,056.02 | 621,910.07 | 40,562.75 | 635.39 | 21,294.32 | 958,458.55 |
| 2020 | 214,618.66 | 632,853.94 | 61,697.55 | 777.95 | 9406.89 | 919,354.99 |
| 2020–2015 | −59,437.36 | 10,943.87 | 21,134.80 | 142.56 | −11,887.43 | −39,103.56 |
Publisher’s Note: MDPI stays neutral with regard to jurisdictional claims in published maps and institutional affiliations. |
© 2022 by the authors. Licensee MDPI, Basel, Switzerland. This article is an open access article distributed under the terms and conditions of the Creative Commons Attribution (CC BY) license (https://creativecommons.org/licenses/by/4.0/).
Share and Cite
Felix, N.B.; Campos, P.C.d.O.; Paz, I.; Marques, M.E.S. Geoprocessing Applied to the Assessment of Carbon Storage and Sequestration in a Brazilian Medium-Sized City. Sustainability 2022, 14, 8761. https://doi.org/10.3390/su14148761
Felix NB, Campos PCdO, Paz I, Marques MES. Geoprocessing Applied to the Assessment of Carbon Storage and Sequestration in a Brazilian Medium-Sized City. Sustainability. 2022; 14(14):8761. https://doi.org/10.3390/su14148761
Chicago/Turabian StyleFelix, Norton Barros, Priscila Celebrini de Oliveira Campos, Igor Paz, and Maria Esther Soares Marques. 2022. "Geoprocessing Applied to the Assessment of Carbon Storage and Sequestration in a Brazilian Medium-Sized City" Sustainability 14, no. 14: 8761. https://doi.org/10.3390/su14148761
APA StyleFelix, N. B., Campos, P. C. d. O., Paz, I., & Marques, M. E. S. (2022). Geoprocessing Applied to the Assessment of Carbon Storage and Sequestration in a Brazilian Medium-Sized City. Sustainability, 14(14), 8761. https://doi.org/10.3390/su14148761