Article

Interactions of Environmental Variables and Water Use Efficiency in the Matopiba Region via Multivariate Analysis

by
Dimas de Barros Santiago
1,*,
Humberto Alves Barbosa
2,3,
Washington Luiz Félix Correia Filho
4 and
José Francisco de Oliveira-Júnior
4,5
1
Postgraduate Program in Meteorology, Academic Unit of Atmospheric Sciences (UACA), Federal University of Campina Grande (UFCG), Campina Grande 58429-140, PB, Brazil
2
Laboratory of Satellite Image Analysis and Processing (LAPIS), Institute of Atmospheric Sciences, Campus A. C. Simões, Federal University of Alagoas, Maceió 57072-900, AL, Brazil
3
Institute of Atmospheric Sciences (ICAT), Federal University of Alagoas (UFAL), Maceió 57072-260, AL, Brazil
4
Institute of Mathematics, Statistics, and Physics (IMEF), Federal University of Rio Grande (FURG), Rio Grande 96203-900, RS, Brazil
5
Graduate Program in Biosystems Engineering (PGEB), Federal Fluminense University (UFF), Niterói 24220-900, RJ, Brazil
*
Author to whom correspondence should be addressed.
Sustainability 2022, 14(14), 8758; https://doi.org/10.3390/su14148758
Submission received: 3 June 2022 / Revised: 5 July 2022 / Accepted: 14 July 2022 / Published: 18 July 2022
(This article belongs to the Section Sustainable Agriculture)

Abstract

:
This study aimed to evaluate the interaction of environmental variables and Water Use Efficiency (WUE) via multivariate analysis to understand the importance of each variable in the carbon–water balance in MATOPIBA. Principal Component Analysis (PCA) was applied to reduce spatial dimensionality and to identify patterns by using the following data: (i) LST (MOD11A2) and WUE (ratio between GPP-MOD17A2 and ET-MOD16A2), based on MODIS orbital products; (ii) Rainfall based on CHIRPS precipitation product; (iii) slope, roughness, and elevation from the GMTED and SRTM version 4.1 products; and (iv) geographic data, Latitude, and Longitude. All calculations were performed in R version 3.6.3 and Quantum GIS (QGIS) version 3.4.6. Eight variables were initially used. After applying the PCA, only four were suitable: Elevation, LST, Rainfall, and WUE, with values greater than 0.7. A positive correlation (≥0.78) between the variables (Elevation, LST, and Rainfall) and vegetation was identified. According to the KMO test, a series-considered medium was obtained (0.7 < KMO < 0.8), and it was explained by one PC (PC1). PC1 was explained by four variables (Elevation, LST, Rainfall, and WUE), among which WUE (0.8 < KMO < 0.9) was responsible for detailing 65.77% of the total explained variance. Positive scores were found in the states of Maranhão and Tocantins and negative scores in Piauí and Bahia. The positive scores show areas with greater Rainfall, GPP, and ET availability, while the negative scores show areas with greater water demand and LST. It was concluded that variations in variables such as Rainfall, LST, GPP, and ET can influence the local behavior of the carbon–water cycle of the vegetation, impacting the WUE in MATOPIBA.

1. Introduction

The need for areas with agricultural potential in the world has been growing over the years due to population growth [1]. The Brazilian Cerrado has been essential in this search for agricultural areas and has undergone significant transformations over decades due to large-scale food production, whether for export or domestic supply [2,3,4]. Such transformations associated with human activities influence the climate, causing changes in land use and land cover (LULC) and, consequently, affecting the carbon (C) and water (H2O) cycles of the local vegetation [5].
Barros Santiago et al. [4] showed a brief approach to influences in an exploratory way, spatially describing the behavior of vegetation associated with these changes and those influenced by some environmental variables that altered the WUE in MATOPIBA. However, it was not clear what the contribution rate of each environmental variable in the WUE changes, which will be described and detailed in this study by using multivariate analyses in order to identify the contributions in the C-H2O balance of the vegetation.
One method for identifying the C-H2O balance of the vegetation is to analyze the water use efficiency (WUE), a method based on the relationship between the gross primary productivity (GPP) of the crop or vegetation and evapotranspiration (ET) [6,7,8]. Gross primary productivity represents the primary carbon inputs to the terrestrial system [9], and ET is a measure of water loss from the ecosystem [10]. Therefore, water-use efficiency provides fundamental information in assessing impacts related to climate change, irrigation deficiency, and the management of ecosystem productivity [11].
Previous studies have shown that internal and external factors affect WUE [12,13]. For example, regarding internal factors, each species has singularities regarding stomatal conductance and photosynthetic rates, which influence the assimilation of C and the efficiency of using H2O and, thus, the C-H2O balance [14]. Furthermore, vegetation is one of the basic components of terrestrial ecosystems and is responsible for the equilibrium of the C-H2O balance [5,15]. In turn, external factors are related to climatic variables such as air temperature, rainfall [16,17], and elevation [13], due to the fact that the distribution of vegetation is determined by water availability and temperature [18,19].
Changes in the vegetation directly cause changes in the ecosystem. Plants play an important role in greenhouse gas (GHG) absorption and contribute to climate stability [20]. The interaction between plants and their associated soil biota can lead to complex feedback, regulating plant community dynamics and ecosystem processes [21].
In areas where agricultural expansion occurs, land use for agricultural purposes on the vegetation and the environment includes reducing carbon storage and the degradation of natural habitats with a consequent loss of biodiversity [22,23]. However, the most significant impact is probably the reduction in climate services provided by carbon storage in frontier soils, particularly in extensive high-latitude agricultural frontiers [24].
In Brazil, the new agricultural frontier is known as MATOPIBA. This region is located in the Cerrado biome and is favorable for the development of agriculture, especially for the production of grains [25]. Furthermore, the area within this delimitation is characterized by expanding an agricultural frontier equipped with high-productivity technologies [26].
The MATOPIBA was officially recognized as an agricultural frontier through Decree number 8447 of 6 May 2015, which deals with the Agricultural Development Plan for the region to promote and coordinate public policies aimed at sustainable economic development based on agricultural activities and livestock [27]. In the last 20 years, the considerable increase in soybean production resulting from the expansion of cultivated areas and productivity significantly increased the Gross Domestic Product (GDP) of the municipalities in the region [27,28]. Studies on the agricultural expansion taking place in Cerrado areas, specifically in the MATOPIBA region, investigated in the present case, are thus essential. However, due to the large territorial extension of the MATOPIBA region, estimating the WUE locally by using punctual measurements (weather stations) becomes unfeasible. One alternative is remote sensing [29,30], a method that facilitates large-scale spatial assessments. Monitoring using this tool provides information about land surface processes and helps evaluate the expansion of the agricultural land area [31].
The impacts of agricultural expansion on water resources are closely related to each other and the regional climate due to the perceived increase in irritated areas in the Cerrado over the past decades and mainly in Bahia [32]. The use of WUE contributes to understanding the consequences of land use and cover change, as these changes for agricultural purposes occasioned greater water demand. Therefore, the objective of this study was to evaluate the interactions between environmental factors and their effects on WUE dynamics in the MATOPIBA agricultural frontier between the years 2001 and 2019 via remote sensing and multivariate analysis.

2. Materials and Methods

2.1. Study Area

The MATOPIBA region covers four Brazilian states: Maranhão, Tocantins, Piauí and Bahia, with 73 million hectares (ha), consisting of 337 municipalities [26]–(Figure 1). Altitudes vary between 1 and 1254 m above mean sea level (MSL), with the highest altitudes at the extreme west (W) of Bahia and the lowest in the north (N) of Maranhão. MATOPIBA encompasses portions of three biomes, Cerrado (90.94%), Amazon (7.27%), and Caatinga (1.64%), corresponding to areas of 66,543,540.87 ha (665,435.41 km2), 5,319,628.40 ha (53,196.29 km2) and 1,203,107.22 ha (12,031.08 km2), respectively [26].
The rainfall regime in MATOPIBA is seasonal, with the rainy season from September/October to April/May, with values above 900 mm, and the dry season from May to September, with values below 600 mm [34,35]. Due to its territorial extension, MATOPIBA presents a rainfall distribution according to the biomes, with the highest (smallest) records near the border with the Amazon (Caatinga) [34]. According to the evaluation of the variability of rainfall over the Brazilian Cerrado carried out by Correia Filho et al. [3] on a multiscale, the largest accumulations occur in the west (W) (Mato Grosso-MT and Goiás-GO), northwest (NW) (Tocantins), and north (N) (Maranhão) sectors of the biome, with values > 1500 mm·year−1, mainly in the transition zone with the Amazon.
About the terrain, 47.9% of the areas are flat (slope up to 3°) and 33.7% of areas have gentle slopes (slope between 3° and 8°); data from the agricultural aptitude of Matopiba reveal a significant proportion of land with high potential for intensive agriculture development–approximately 26 million hectares (35% of the total) are classified as possessing good and regular aptitude [36]. The predominance of large grain production regions in the Plateaus and Depressions areas occurs due to the ease of the mechanization of cultivation and the lower risk of erosion occurring, which is a cause of precautions due to the predominance in the region of sandy and sandy mean texture soils [37].
In MATOPIBA, three river basins are inserted: Tocantins, Atlantic (between north and northern transitions regions), and the San Francisco River. In these river basins, the Tocantins, Araguaia, São Francisco River, and Parnaíba Rivers are inserted [26].

2.2. Acquisition of Remote Sensing Data

In this study, we used GPP (MOD17A2), ET (MOD16A2) [38], and land surface temperature (LST, MOD11A2) [39] data at a spatial resolution of 1 km × 1 km, obtained from the website (https://lpdaac.usgs.gov/products/, accessed on 10 May 2022).
Elevation, roughness, and slope data referring to the MATOPIBA region were obtained from the EarthEnv website (https://www.earthenv.org/topography/, accessed on 11 May 2022), resulting from the products Global Multi-resolution Terrain Elevation Data 2010 (GMTED 2010) and 90 m Shuttle Radar Topographic Mission (SRTM) void-filled SRTM4.1 dev [40], which has a spatial resolution of 0.05° × 0.05°.
Land Use and Land Cover data were obtained from the MAPBIOMAS website (https://mapbiomas.org/, accessed on 15 May 2022), which has a spatial resolution of 30 m × 30 m and annual time resolution. The data are separated by biomes; thus, it was necessary to produce a mosaic referring to the study area.
The Rainfall product was taken from Climate Hazard Group InfraRed Precipitation with Station (CHIRPS) data [3,38,41], with a spatial resolution of 0.05° × 0.05° (https://data.chc.ucsb.edu/products/CHIRPS-2.0/, accessed on 11 May 2022). Annual rainfall accumulated data between 2001 and 2019 were used in this study. CHIRPS data are consistent and validated when compared to regions with a high density of stations and meteorological data, as noted by Funk et al. [41]., Duan et al. [42], and Oliveira-Júnior et al. [38], which are helpful in studies of remote regions or regions with poor or absent rain gauge coverage [43]. Extraction, manipulation, and calculation were performed using R version 3.6.3 [44] and Quantum GIS (QGIS) version 3.4.6 [45].

2.3. Estimate of Water Use Efficiency (WUE)

Water use efficiency was calculated as the ratio between GPP (MOD17A2) and ET (MOD16A2)–(Equation (1)) [38,46,47,48]. Both products have a spatial resolution of 1 km × 1 km and weekly temporal resolution, which were later reprocessed to a spatial resolution of 0.05° × 0.05° and monthly temporal resolution.
WUE = GPP ET
WUE is provided in gC/mm.m2, GPP is provided in grams of carbon per square meter (gC/m2), and ET is provided in millimeters (mm).

2.4. Methods

Principal Component Analysis (PCA) Applied to Environmental and Meteorological Data

A PCA was applied to evaluate and understand the changes in WUE in the MATOPIBA region. For this, the mean compositions (from 2001 to 2019) of the following variables were used:
  • LST and WUE (ratio between GPP and ET), based on MODIS orbital products;
  • Rainfall, based on CHIRPS precipitation product;
  • Elevation, Roughness, and Slope of the GMTED and SRTM version 4.1 products;
  • Geographic data, based on Latitude and Longitude.
The purpose of the PCA is to reduce the number of variables in a dataset to preserve the total variance and identify patterns and/or processes associated with the observed variables [49,50]. However, before submitting the database to the PCA, it is essential to apply the Kaiser–Meyer–Olkin (KMO) and Measure Sampling Adequacy (MSA) tests [51,52]. These tests aim to identify the ideal number of principal components (PC). Kaiser’s method, which selects eigenvalues greater than 1 (λ > 1) [51], was used in this case for this purpose. In addition, the degree of influence of each PC was also verified from their respective factor loading (scores). The KMO and MSA tests are used as indicators of database quality individually and collectively, respectively [49,50]. They are obtained by Equations (2) and (3).
KMO = ( j k j r jk 2 ) ( j k j r jk 2 + j k j p jk 2 )
MSA = ( k j r jk 2 ) ( k j r jk 2 + k j p jk 2 )
r is the standard correlation coefficient, and p is the standard partial correlation coefficient.
According to Fávero et al. [53], the KMO and MSA tests range from 0 to 1. The values are interpreted as follows: value of the variable or matrix < 0.5—discarded; between 0.5 and 0.6—bad; between 0.6 and 0.7—reasonable; between 0.7 and 0.8—medium; between 0.8 and 0.9—good; and above 0.9—excellent.

3. Results

3.1. Principal Component Analysis

The results obtained correspond to the correlation analysis via PCA, which is initially run with eight variables. Only four variables presented KMO values > 0.7 and were suitable: Elevation, LST, Rainfall, and WUE (medium adequacy, 0.7 < KMO < 0.8). The variable WUE (0.8 < KMO < 0.9) was classified as good, followed by Elevation, LST, and Rainfall classified as medium (0.7 < KMO < 0.8), as shown in Table 1.
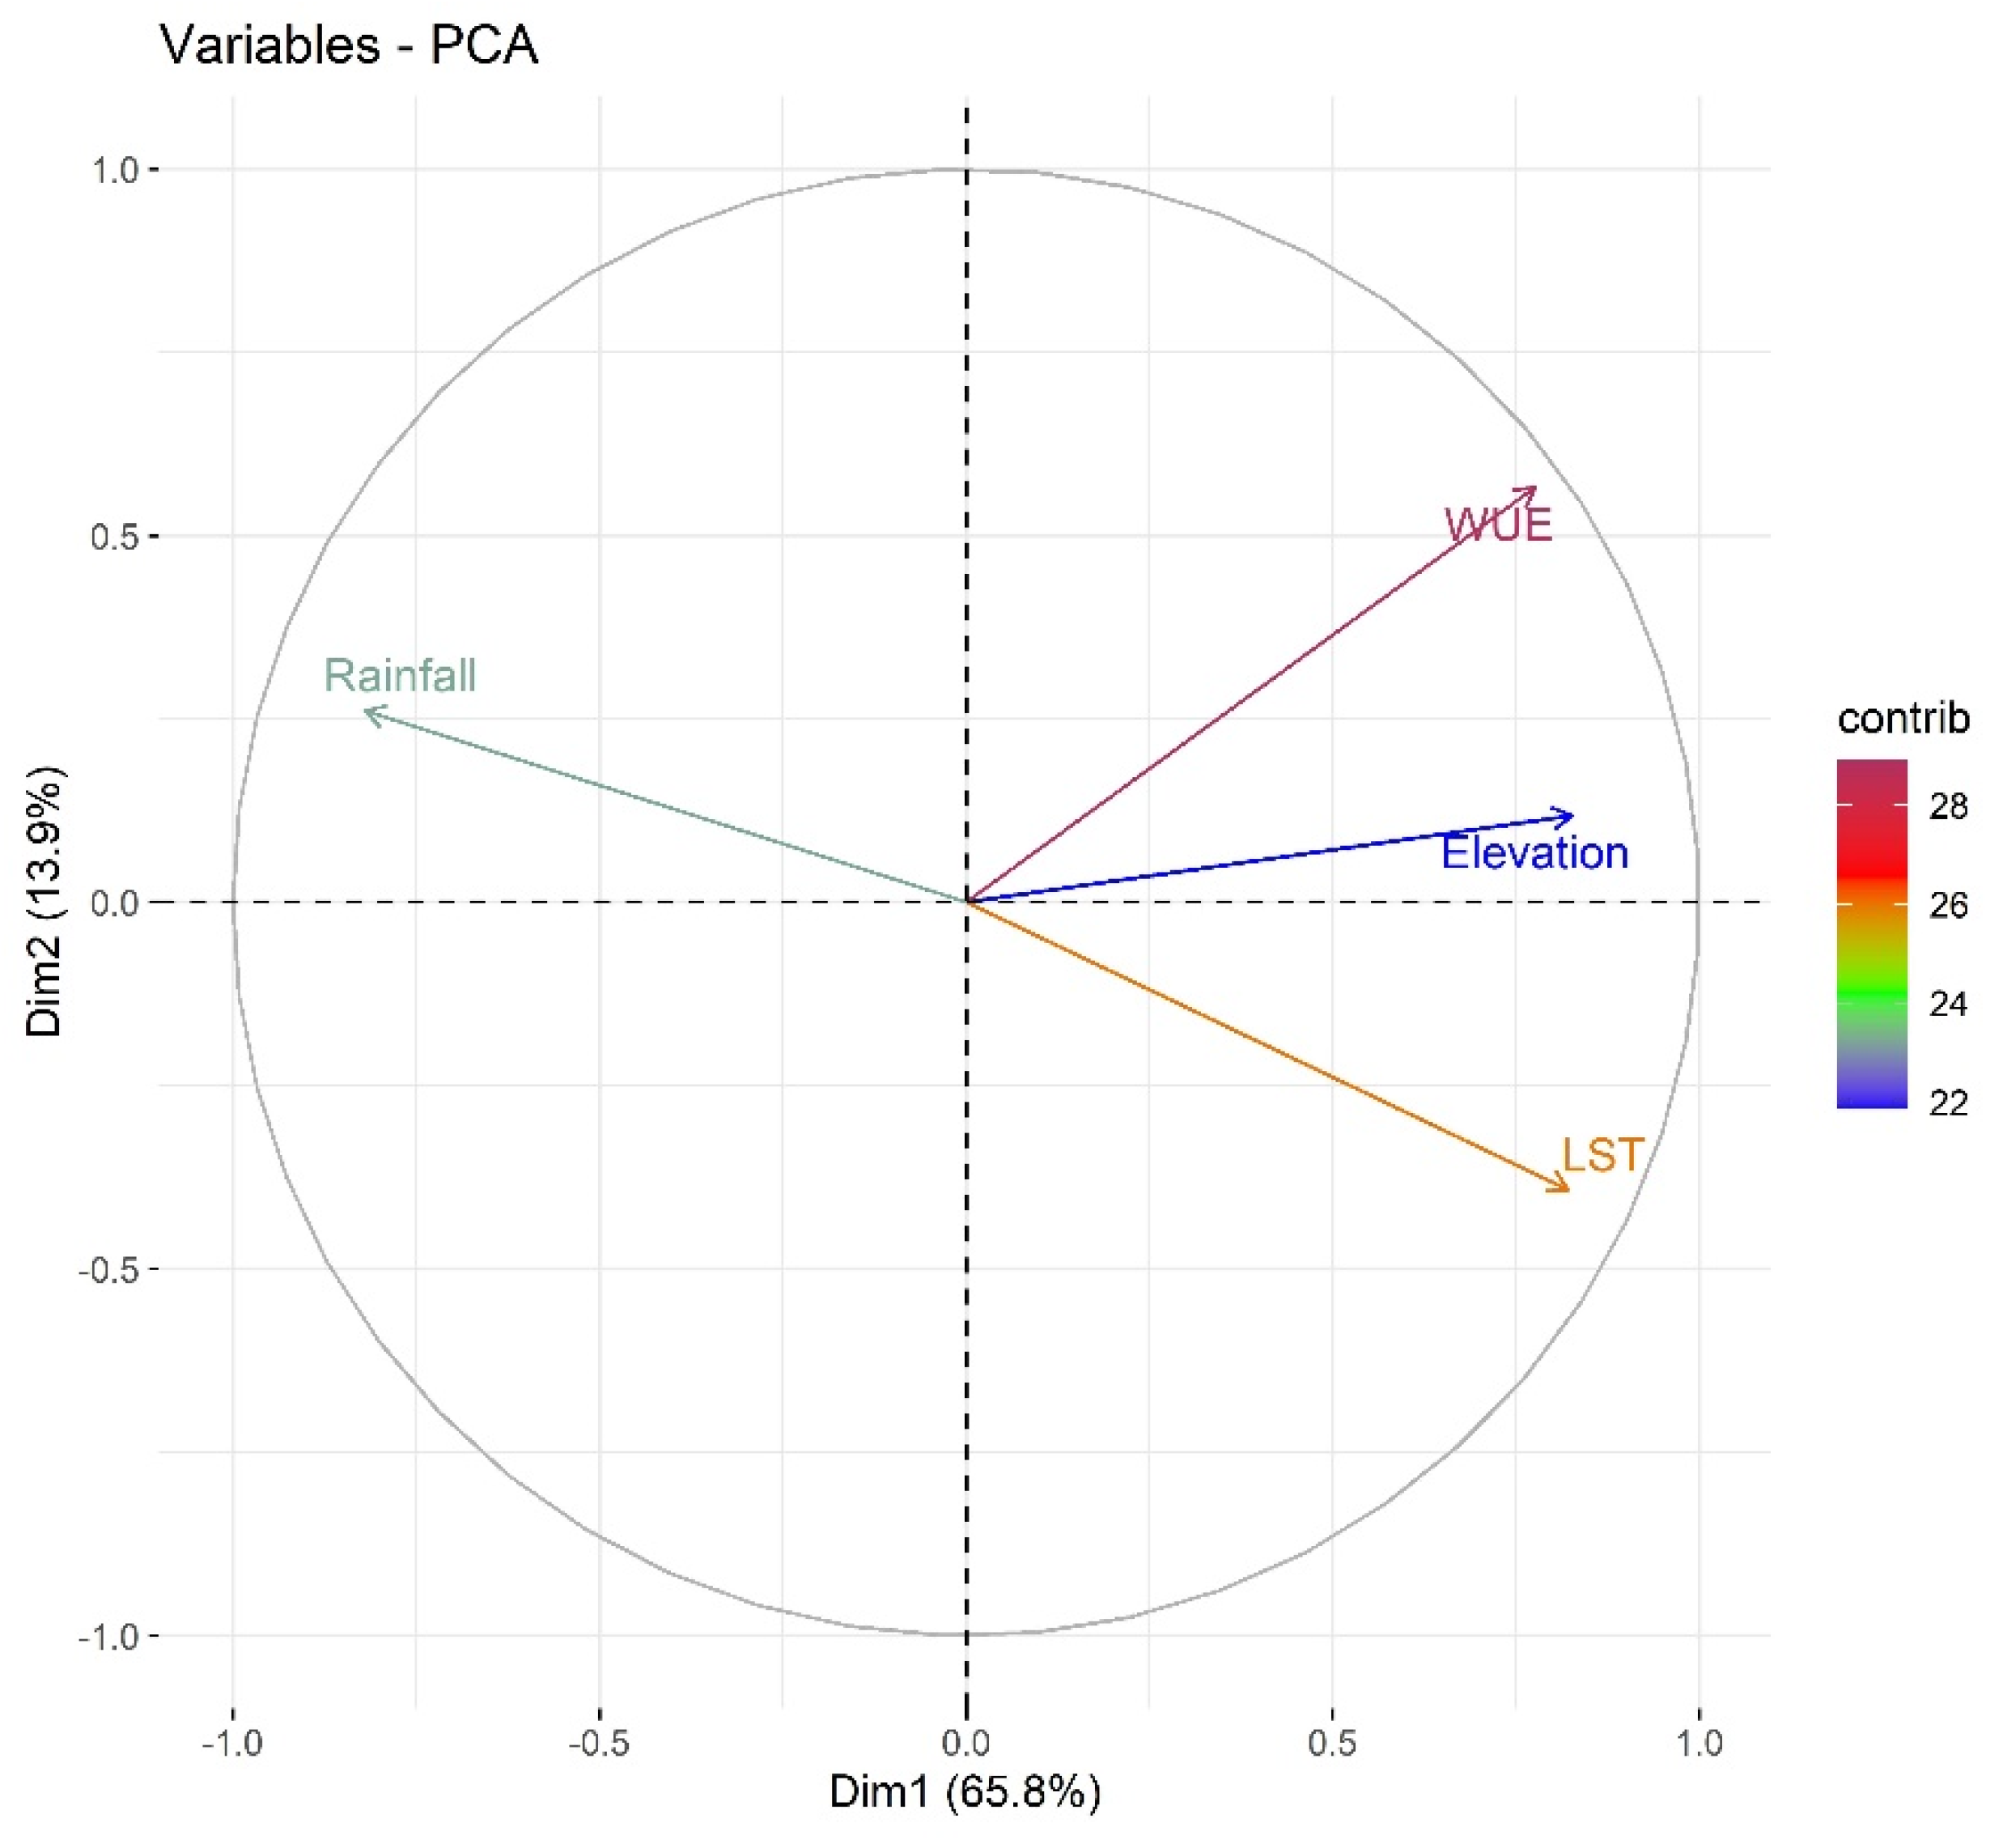
The overall MSA value was 0.79, with a similar classification relative to the KMO test. According to Kaiser’s criterion (λ > 1), one single component (PC1) explained a good part of the total variance of the relational pattern between the variables and WUE [52,54]. Table 1 and Figure 2 show the correlation analysis and the percentage of contribution of each variable relative to each PC, indicating a positive correlation (≥0.78) between the variables and the WUE of the MATOPIBA region. In addition, the PC1 indicated that the four variables—Elevation, LST, Rainfall, and WUE—explained 65.77% of the total variance. Regarding the degree of contribution of the variables to the PC1, there was a slight difference (<4%) between the variables with the highest and lowest percentage; the contributions were distributed as follows: Elevation (25.95%), LST (25.64%), Rainfall (25.55%), and WUE (22.86%).
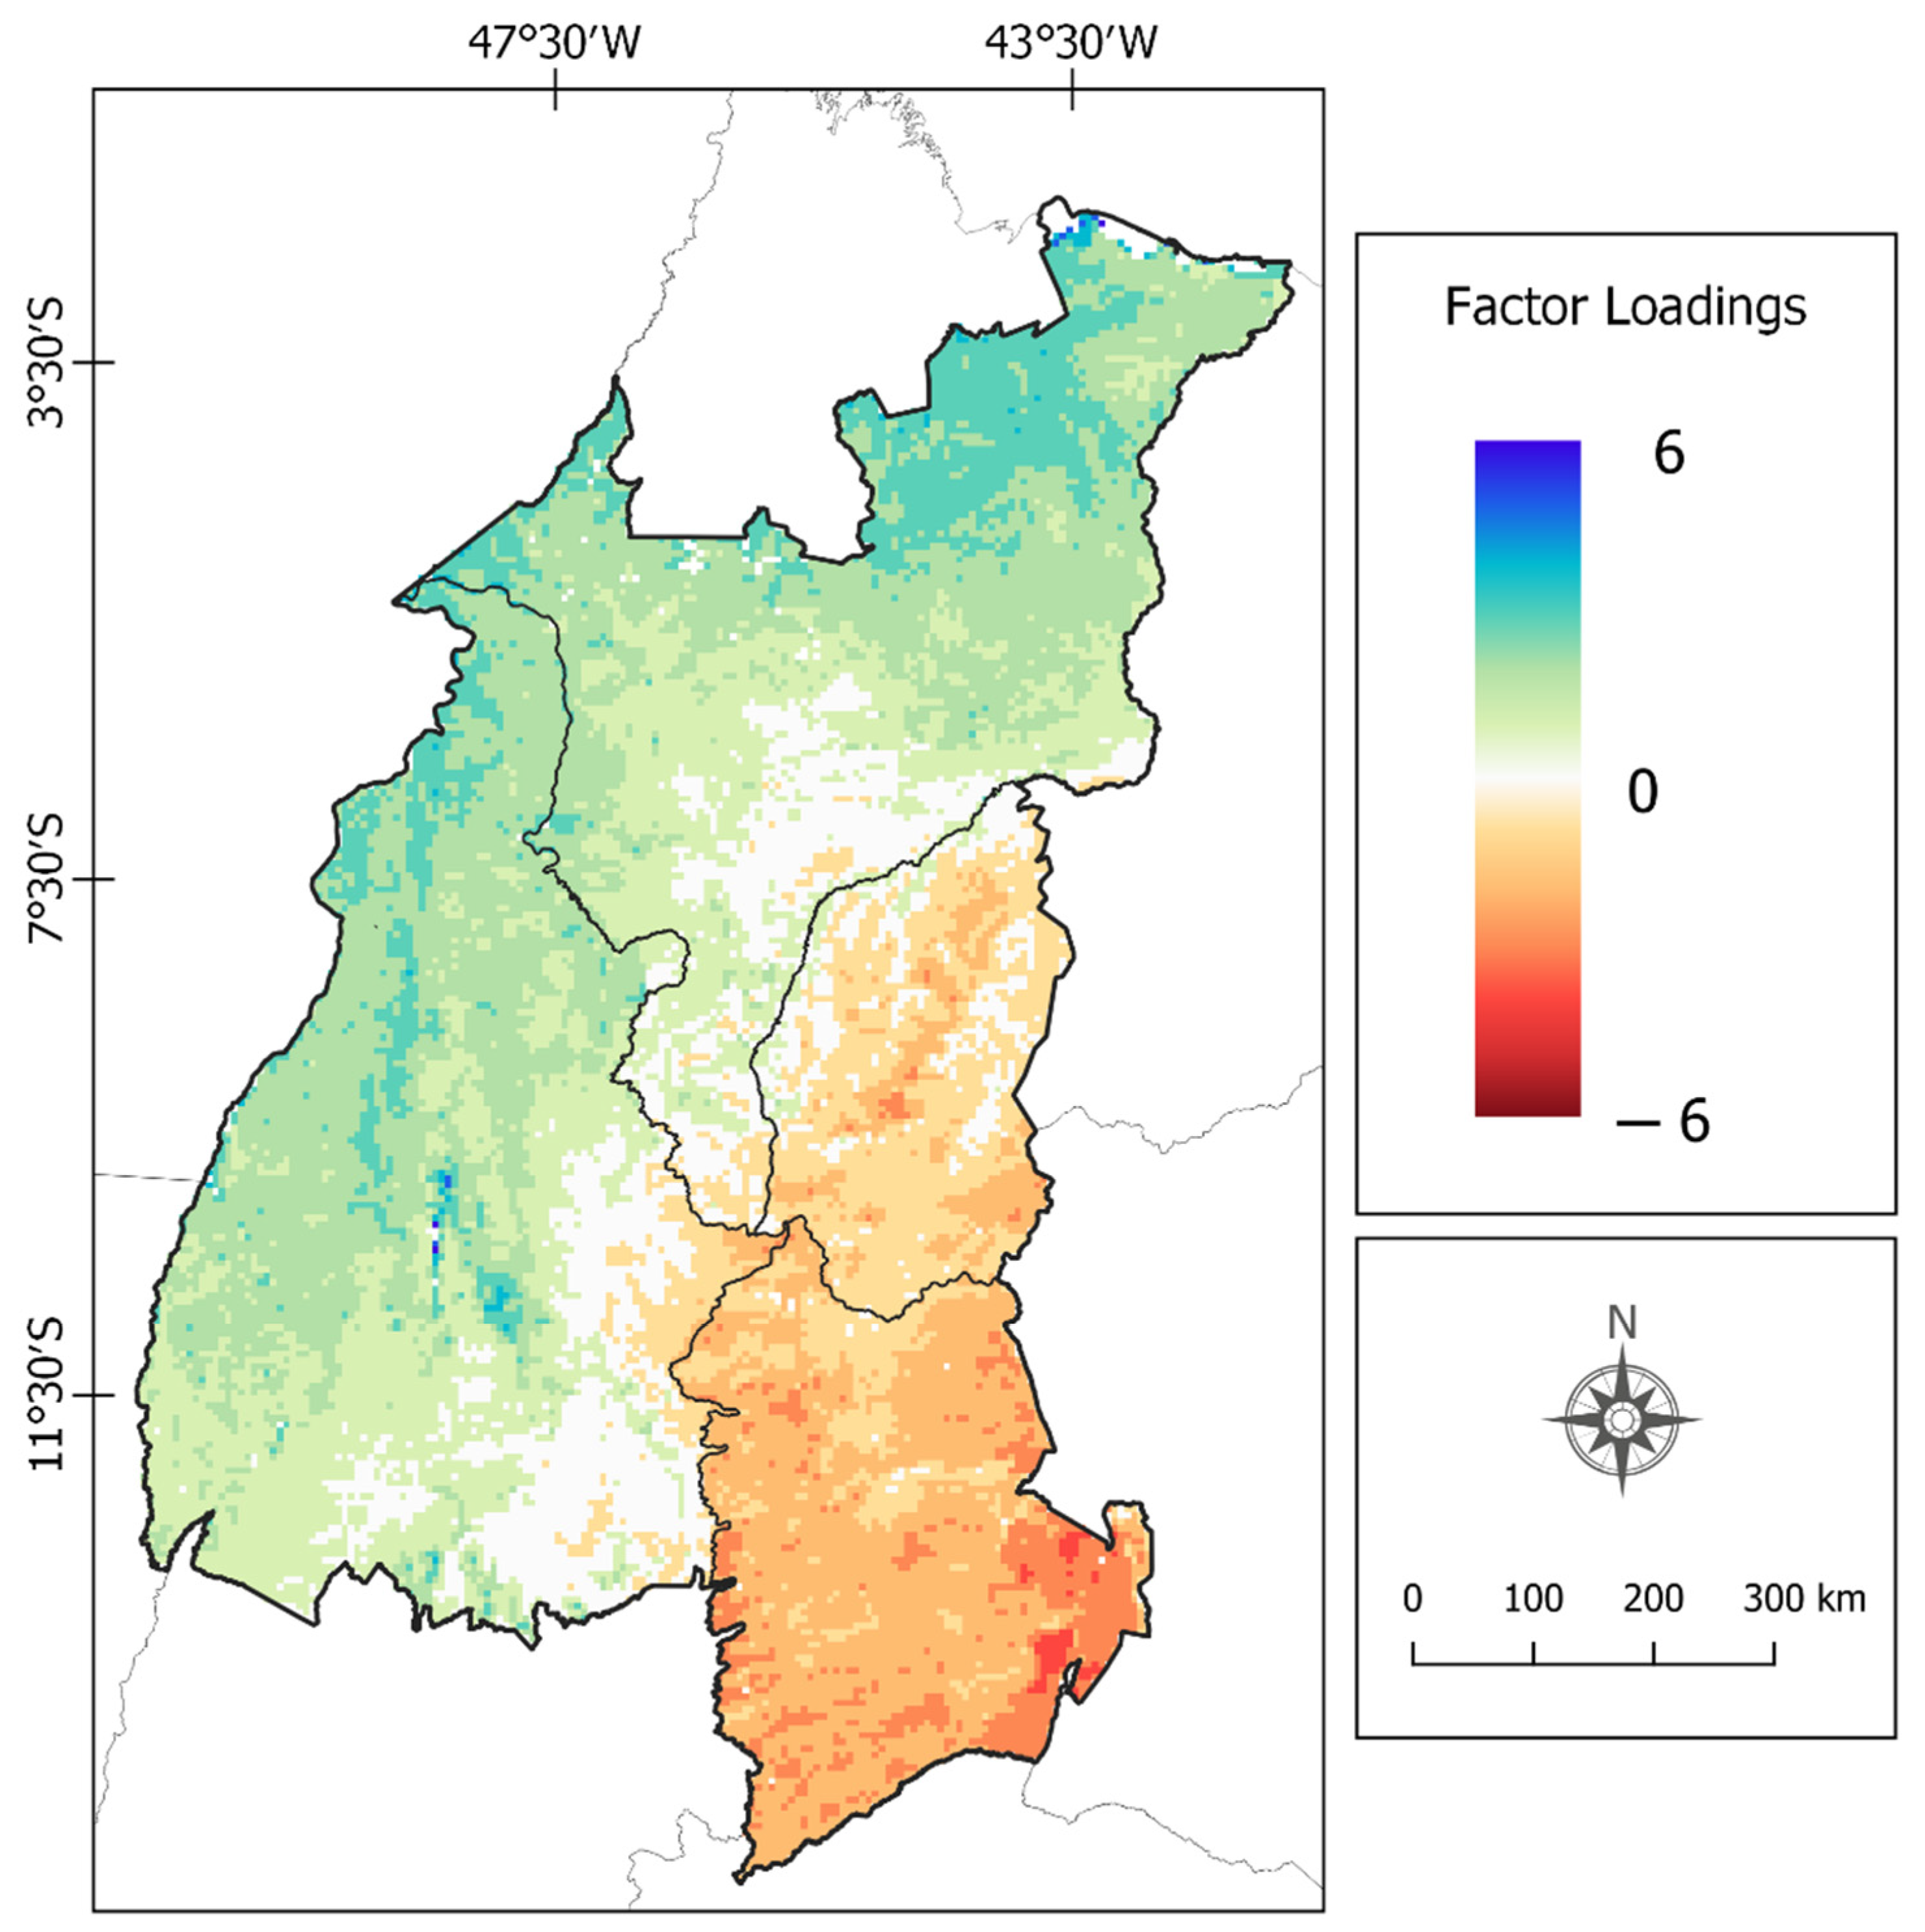
Figure 3 shows the factor loadings related to PC1, indicating a different behavior with positive/negative patterns. Negative scores were observed in the western portion of the states of Bahia and Piauí, possibly resulting from agricultural practices in these regions [55,56]. Proper management in agriculture, necessary for enhancing the development of crops, leads to greater WUE and water demand [57,58]. In addition, the portions where negative scores were observed were coincidently located in areas with higher elevations, higher LST values, and lower rainfall rates, which corroborates the results of Barros Santiago et al. [4].
Positive scores were observed in the south of the state of Maranhão and over a large part of the state of Tocantins, possibly related to the variables Rainfall, GPP, and ET, since these areas have a dense vegetation cover (forests in the northern portion of the Maranhão) and watercourses of the main rivers existing in the Brazilian Cerrado. For example, Correia Filho et al. [3] evaluated the behavior of precipitation in the Brazilian Cerrado and identified the highest rainfall rates (>1500 mm·year−1) in the northern part of Maranhão.

3.2. Spatio-Temporal Variation of LULC

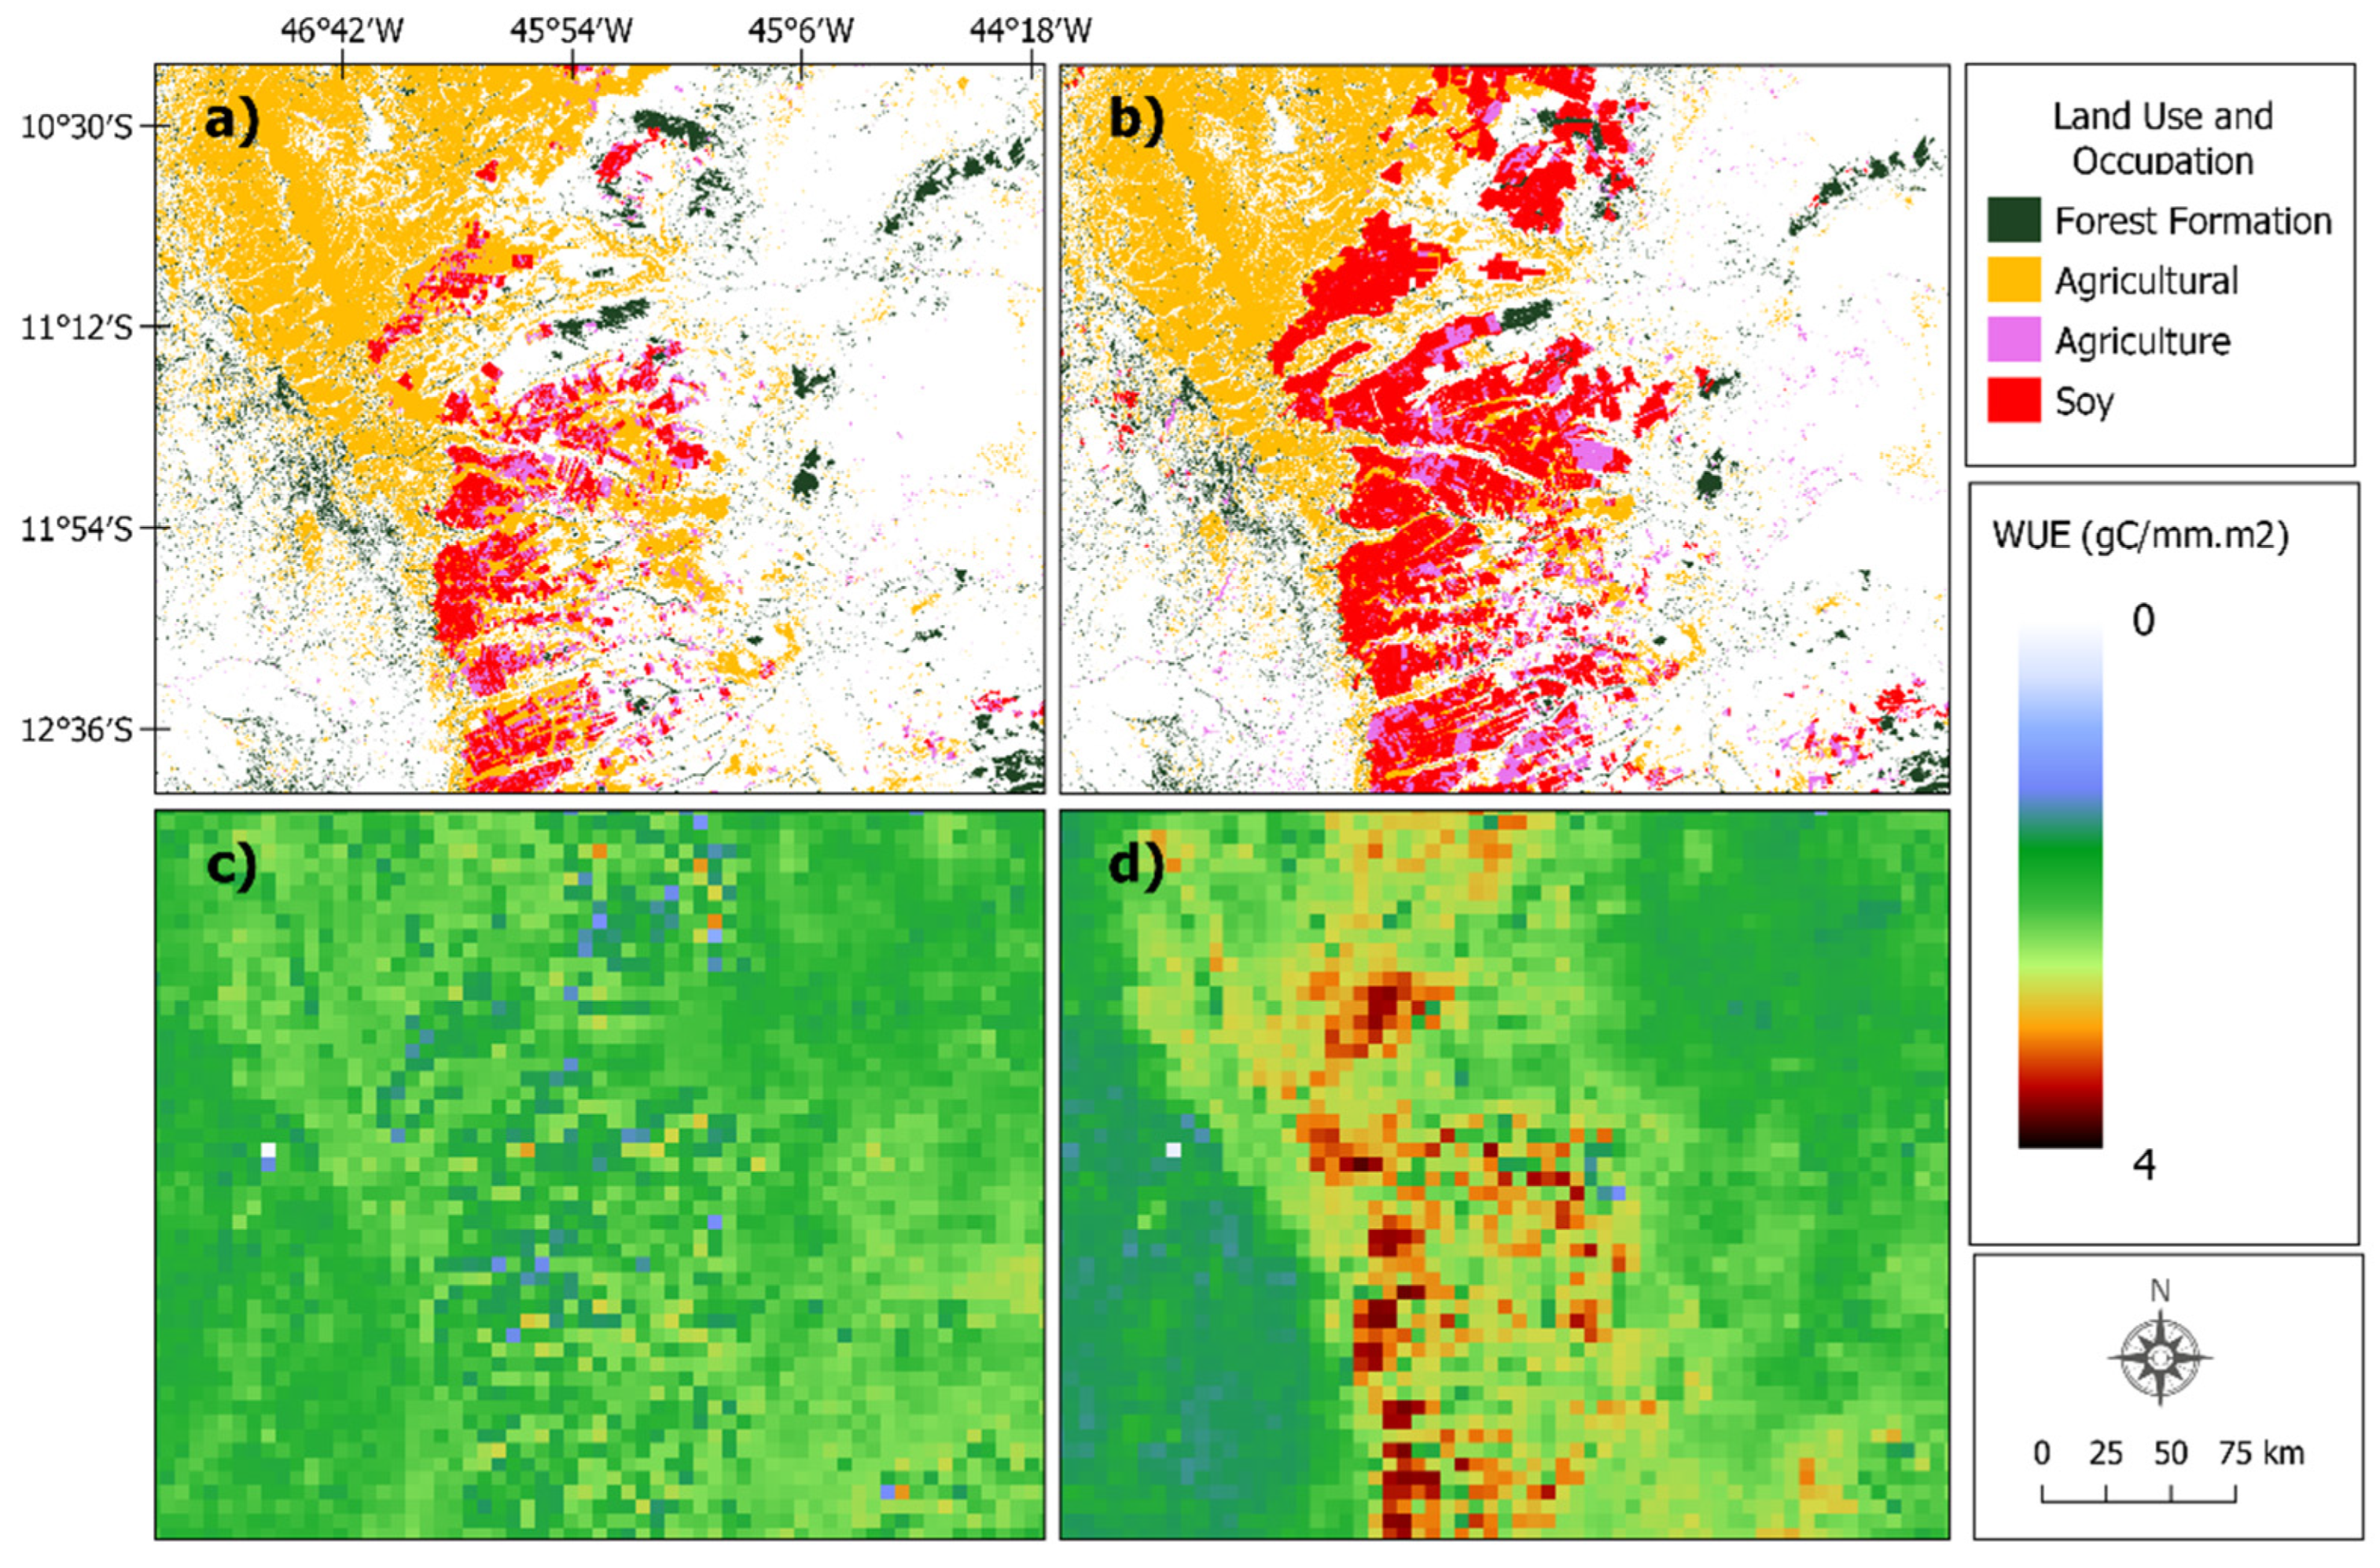
The change in LULC influences the WUE; in this manner, the changes for agricultural purposes change the values of the WUE’s in the MATOPIBA region. Over the course of 19 years (2001–2019), an addition was found in the areas of agricultural production. In the year 2001, agriculture occupied 0.52% (7393 km2) and soybean plantings occupied 0.53% (7581 km2) of the MATOPIBA area. In the year 2019, the agricultural area increased by 1.08% (15,369 km2) and soybeans increased by 3% (42,539 km2). Between the years analyzed, there was an addition in agriculture of 0.56% (7976 km2) and soybeans by 2.47% (34,958 km2). When we observe Figure 4a,b, which is a clipping inserted south of the MATOPIBA region, the expansion of agricultural and soybean planting areas is noted. Figure 4c,d related to WUE show that soybean planting areas obtained the highest values of WUE (>2.8 gC/mm.m2), and the relationship between the larger WUEs and agricultural areas shows that the anthropic influence due to cultural treatment and agricultural manning induced higher agricultural productivity and, consequently, an increased economic return.

4. Discussion

The composition of the analyzed variables (Elevation, LST, Rainfall, and WUE) directly influenced the PC1, and they can be explained by the fact that WUE has a high sensitivity to climate change and by geographical aspects of the environment, for which its modifications affect the behavior of the vegetation, altering the WUE. Recently, Chen et al. [59] and Collados-Lara et al. [60] identified an opposite relationship between elevation and air temperature. This is due to the thermal contrast between soil and atmosphere and also due to the effect of variations in air mass and humidity, which is in line with Kattel et al. [61], who observed the highest values of air temperatures at higher altitudes and the lower values at lower altitudes. In the regions with high elevations, climate change affects several environmental factors (temperature, humidity, and light, among others) [62] and, consequently, the WUE. In this study, WUE significantly increased with elevation in the function of the agricultural areas present in these portions of the MATOPIBA (west of the state of Bahia).
LST and Rainfall are used as indicators of the relationship between vegetation and climate change because they directly impact vegetation growth [63,64]. Land-surface temperature exerts a strong influence on vegetation development. Huang et al. (2019) found that the ideal temperature for global productivity for all vegetation types is 23 ± 6 °C. In tropical forests, the ideal temperature must be close to the mean temperature during the growth season [65].
In some instances, the increase in WUE is conditioned to high temperatures [66,67] as long as it is within a certain threshold. It is noteworthy that the ideal temperature for photosynthesis is between 20 °C and 30 °C [68], and temperatures beyond this range contribute to decreasing the WUE of the crop, resulting in increased transpiration and soil evaporation [69]. In this manner, high temperatures (>30 °C) force plants to adapt to greater carbon dioxide (CO2) absorption along with a smaller loss of H2O by evaporation, thus impacting the carbon–water cycle of the vegetation [70].
The effects of the rainfall are variable and depend on the species present in the ecosystem [71]. The rainfall aids in the biophysical processes of the vegetation [72,73]. It is noteworthy that the association of lower rainfall with high evapotranspiration rates contributes to increased stress in plants [74]. Thus, plant growth depends on the rainfall regime; if rainfall is insufficient, then growth will depend exclusively on the groundwater availability [75], forcing the plants to adapt to minimizing the loss of H2O by transpiration. In turn, excess rainfall associated with cloud cover reduces the incidence of solar radiation on the ground and, thus, impairs the photosynthetic processes [76].
Water use efficiency, the most prominent variable in PC1, can be explained by its input variables in Equation (1) (GPP and ET), which are measures related to the exchange of C and H2O between plants and the atmosphere (photosynthesis) [77,78] and, therefore, dependent on the environment. The highest GPP values were observed along with areas where ET values were high (N of Maranhão), associated with greater rainfall availability in this region [2,3]. Frankenberg et al. [79] and Ma et al. [80] found the highest total annual GPP values in areas of dense vegetation and evergreen broadleaf forests. Zhang et al. [81] highlighted the areas with high vegetation density that presented higher ET values than croplands. Giacomoni and Mendes [82] evaluated the behavior of ET over the state of Rio Grande do Sul and identified that the regions with the highest ET values were those with less anthropic influence (dense forests and lakes).
In recent years, the MATOPIBA consortium has stood out for its growing grains production, such as corn, beans, cotton [83], and especially soybean [28]. Such rapid agricultural development resulted from investments in agribusiness [84]. These activities in MATOPIBA associated with changes in environmental factors (LST, Rainfall, and ET) affect the carbon–water cycle of terrestrial ecosystems and, ultimately, the behavior of GPP and ET. Thus, significant changes in WUE were observed in agricultural areas that show a better response to these changes, obtaining higher productivity [48]. Pereira and Castro [85] corroborated data from the National Supply Company [86] in that the mean grain yield in Brazil increased from 1496 kg/ha in 1990 to 3588 kg/ha in 2015, corresponding to a growth of 140%. Furthermore, the total area under soybean crops harvested in the MATOPIBA consortium increased from 0.8 Mha in 1999 to 4.1 Mha in 2018 [87], representing about 11% of the national production of soybean, corresponding to 13.3 million tons in the crop year 2018/19 [86].

5. Conclusions

The multivariate analysis of the environmental variables and WUE in the MATOPIBA region showed that only four variables were suitable for analysis, namely, Elevation, LST, Rainfall, and WUE, with KMO and MSA values > 0.75, and 0.79, respectively. In the PCA, it was found that one PC was sufficient for the evaluation, as the PC1 corresponded to 65.77% of the explained variance. Elevation was the highest contribution in the PC1 (25.95%) variable and influenced the other variables due to the altitude gradient existing in MATOPIBA. This behavior alters the carbon–water cycle of the vegetation and consequently affects the WUE.
In the spatial aspect, positive (negative) scores were observed in regions of the states of Maranhão and Tocantins (west of the states of Bahia and Piauí). Negative scores were related to higher WUE values, prompted by the expansion of agricultural practices in the region. When associated with higher LST values, these practices increase the water demand in croplands existing in MATOPIBA. On the other hand, positive scores were related to greater water availability associated with areas of dense vegetation and ecoregions of the Cerrado biome existing in the MATOPIBA region, contributing to the increase in GPP and ET.
The results obtained indicate that agricultural expansion in the MATOPIBA region is directly affected by changes in environmental factors (Elevation, LST, Rainfall, GPP, and ET). Such factors are directly linked to the way the vegetation, whether in natural or agricultural lands, behaves with the carbon–water cycle and its spatio-temporal distribution, which impacts the efficiency of water use in MATOPIBA.

Author Contributions

D.d.B.S.: Conceptualization; formal analysis; investigation; methodology; writing—original draft. H.A.B.: Writing—review and editing. W.L.F.C.F.: Writing—review and editing. J.F.d.O.-J.: Writing—review and editing. All authors have read and agreed to the published version of the manuscript.

Funding

This work was supported by the Conselho Nacional de Desenvolvimento Científico e Tecnológico-(CNPq/MCTI/FNDCT Nº 18/2021), Brazil, through Universal—Programa de Monitoramento da Desertificação por Satélite no Semiárido Brasileiro—under the grant/award number (403223/2021-0 to H.A.B).

Institutional Review Board Statement

The ethical review is not applicable for this study due tonot involving of humans or animals.

Informed Consent Statement

Not Applicable.

Data Availability Statement

We are thankful to MODIS (https://lpdaac.usgs.gov/products/, accessed on 10 May 2022) for GPP (MOD17A2), ET (MOD16A2), and LST (MOD11A2) data. Elevation, roughness, and slope data referring to the MATOPIBA region were obtained from the EarthEnv website (https://www.earthenv.org/topography/, accessed on 11 May 2022). Land Use and Land Cover data were obtained from the MAPBIOMAS website (https://mapbiomas.org/, accessed on 15 May 2022). The rainfall data is obtained from Climate Hazards Group InfraRed Precipitation with Stations (CHIRPS) product (http://chg.geog.ucsb.edu/data/chirps/index.html, accessed on 20 January 2019).

Acknowledgments

The first author thanks the Coordination for the Improvement of Higher Education Personnel (CAPES) for granting the doctoral scholarship. The second author thanks CNPq for granting the Research Productivity Fellowship level 1-D (317633/2021-0). The fourth author thanks CNPq for granting the Research Productivity Fellowship level 2 (309681/2019-7).

Conflicts of Interest

The authors declare no conflict of interest.

References

  1. Folberth, C.; Khabarov, N.; Balkovič, J.; Skalský, R.; Visconti, P.; Ciais, P.; Obersteiner, M. The global cropland-sparing potential of high-yield farming. Nat. Sustain. 2020, 3, 281–289. [Google Scholar] [CrossRef]
  2. Junior, C.A.D.S.; Costa, G.D.M.; Rossi, F.S.; Vale, J.C.E.D.; de Lima, R.B.; Lima, M.; de Oliveira-Junior, J.F.; Teodoro, P.E.; Santos, R.C. Remote sensing for updating the boundaries between the brazilian Cerrado-Amazonia biomes. Environ. Sci. Policy 2019, 101, 383–392. [Google Scholar] [CrossRef]
  3. Correia Filho, W.L.F.; de Oliveira-Júnior, J.F.; Junior, C.A.D.S.; Santiago, D.D.B. Influence of the El Niño–Southern Oscillation and the sypnotic systems on the rainfall variability over the Brazilian Cerrado via Climate Hazard Group InfraRed Precipitation with Station data. Int. J. Clim. 2021, 42, 3308–3322. [Google Scholar] [CrossRef]
  4. Barros Santiago, D.; Barbosa, H.A.; Correia Filho, W.L.F. Alterações na eficiência do uso da água relacionadas com fatores climáticos e uso e ocupação do solo, na região do MATOPIBA. Pesqui. Soc. Desenvol. 2021, 10, e3010917891. [Google Scholar]
  5. Li, G.; Chen, W.; Li, R.; Zhang, X.; Liu, J. Assessing the spatiotemporal dynamics of ecosystem water use efficiency across China and the response to natural and human activities. Ecol. Indic. 2021, 126, 107680. [Google Scholar] [CrossRef]
  6. Beer, C.; Ciais, P.; Reichstein, M.; Baldocchi, D.; Law, B.; Papale, D.; Soussana, J.-F.; Ammann, C.; Buchmann, N.; Frank, D.; et al. Temporal and among-site variability of inherent water use efficiency at the ecosystem level. Glob. Biogeochem. Cycles 2009, 23, 3233. [Google Scholar] [CrossRef]
  7. Yang, S.; Zhang, J.; Zhang, S.; Wang, J.; Bai, Y.; Yao, F.; Guo, H. The potential of remote sensing-based models on global water-use efficiency estimation: An evaluation and intercomparison of an ecosystem model (BESS) and algorithm (MODIS) using site level and upscaled eddy covariance data. Agric. For. Meteorol. 2020, 287, 107959. [Google Scholar] [CrossRef]
  8. Sun, H.; Bai, Y.; Lu, M.; Wang, J.; Tuo, Y.; Yan, D.; Zhang, W. Drivers of the water use efficiency changes in China during 1982–2015. Sci. Total Environ. 2021, 799, 149145. [Google Scholar] [CrossRef]
  9. Yuan, L.; Lv, Z.; Adams, M.J.; Olsen, S.K. Crystal structures of an E1–E2–ubiquitin thioester mimetic reveal molecular mechanisms of transthioesterification. Nat. Commun. 2021, 12, 22598. [Google Scholar] [CrossRef]
  10. Jassal, R.S.; Black, T.A.; Spittlehouse, D.L.; Brümmer, C.; Nesic, Z. Evapotranspiration and water use efficiency in different-aged Pacific Northwest Douglas-fir stands. Agric. For. Meteorol. 2009, 149, 1168–1178. [Google Scholar] [CrossRef]
  11. Tang, X.; Li, H.; Desai, A.R.; Nagy, Z.; Luo, J.; Kolb, T.E.; Olioso, A.; Xu, X.; Yao, L.; Kutsch, W.; et al. How Is Water-Use Efficiency Of Terrestrial Ecosystems Distributed And Changing On Earth? Sci. Rep. 2015, 4, 7483. [Google Scholar] [CrossRef] [PubMed]
  12. Zhu, X.J.; Yu, G.R.; Wang, Q.F.; Hu, Z.M.; Zheng, H.; Li, S.G.; Hao, Y.B. Spatial variability of water use efficiency in China’s terrestrial ecosystems. Glob. Planet. Chang. 2015, 129, 37–44. [Google Scholar] [CrossRef]
  13. Mbava, N.; Mutema, M.; Zengeni, R.; Shimelis, H.; Chaplot, V. Factors affecting crop water use efficiency: A worldwide meta-analysis. Agric. Water Manag. 2019, 228, 105878. [Google Scholar] [CrossRef]
  14. Zuomin, S.; Ruimei, C.; Shirong, L. Response of leaf# delta#~(13) C to altitudinal gradients and its mechanism. Acta Ecol. Sin. 2004, 24, 2901–2906. [Google Scholar]
  15. Chen, C.; Park, T.; Wang, X.; Piao, S.; Xu, B.; Chaturvedi, R.K.; Fuchs, R.; Brovkin, V.; Ciais, P.; Fensholt, R.; et al. China and India lead in greening of the world through land-use management. Nat. Sustain. 2019, 2, 122–129. [Google Scholar] [CrossRef]
  16. Xue, B.-L.; Guo, Q.; Otto, A.; Xiao, J.; Tao, S.; Li, L. Global patterns, trends, and drivers of water use efficiency from 2000 to 2013. Ecosphere 2015, 6, art174. [Google Scholar] [CrossRef]
  17. Huang, M.; Piao, S.; Zeng, Z.; Peng, S.; Ciais, P.; Cheng, L.; Mao, J.; Poulter, B.; Shi, X.; Yao, Y.; et al. Seasonal responses of terrestrial ecosystem water-use efficiency to climate change. Glob. Chang. Biol. 2016, 22, 2165–2177. [Google Scholar] [CrossRef] [PubMed]
  18. Woodward, F.I. Climate and Plant Distribution; Cambridge University Press: Cambridge, UK, 1987. [Google Scholar]
  19. Martinez-Vilalta, J.; Lloret, F. Drought-induced vegetation shifts in terrestrial ecosystems: The key role of regeneration dynamics. Glob. Planet. Chang. 2016, 144, 94–108. [Google Scholar] [CrossRef] [Green Version]
  20. Delgado, R.C.; Pereira, M.G.; Teodoro, P.E.; dos Santos, G.L.; de Carvalho, D.C.; Magistrali, I.C.; Vilanova, R.S. Seasonality of gross primary production in the Atlantic Forest of Brazil. Glob. Ecol. Conserv. 2018, 14, 392. [Google Scholar] [CrossRef]
  21. Pugnaire, F.I.; Morillo, J.A.; Peñuelas, J.; Reich, P.B.; Bardgett, R.D.; Gaxiola, A.; Wardle, D.A.; van der Putten, W.H. Climate change effects on plant-soil feedbacks and consequences for biodiversity and functioning of terrestrial ecosystems. Sci. Adv. 2019, 5, eaaz1834. [Google Scholar] [CrossRef] [Green Version]
  22. van Meijl, H.; Havlik, P.; Lotze-Campen, H.; Stehfest, E.; Witzke, P.; Domínguez, I.P.; Bodirsky, B.L.; van Dijk, M.; Doelman, J.; Fellmann, T.; et al. Comparing impacts of climate change and mitigation on global agriculture by 2050. Environ. Res. Lett. 2018, 13, 064021. [Google Scholar] [CrossRef] [Green Version]
  23. Popp, A.; Calvin, K.; Fujimori, S.; Havlik, P.; Humpenöder, F.; Stehfest, E.; Bodirsky, B.L.; Dietrich, J.P.; Doelmann, J.C.; Gusti, M.; et al. Land-use futures in the shared socio-economic pathways. Glob. Environ. Chang. 2017, 42, 331–345. [Google Scholar] [CrossRef] [Green Version]
  24. Hannah, L.; Roehrdanz, P.R.; C., K.B.K.; Fraser, E.D.G.; Donatti, C.I.; Saenz, L.; Wright, T.M.; Hijmans, R.J.; Mulligan, M.; Berg, A.; et al. The environmental consequences of climate-driven agricultural frontiers. PLoS ONE 2020, 15, e0228305. [Google Scholar] [CrossRef] [PubMed]
  25. CONAB-Companhia Nacional de Abastecimento; INMET-Instituto Nacional de Meteorologia. Culturas de verão-safra 2013/2014: Região do MATOPIBA: Sul do Estado de Maranhão, Leste do Estado do Tocantins, Sudoeste do Estado do Piauí e extremo Oeste do Estado da Bahia. Bolet. Monit. Agríc. 2014, 3, 1–24. [Google Scholar]
  26. Miranda, E.E.; Magalhães, L.A.; Carvalho, C.A. Nota técnica nº 1: Proposta de Delimitação Territorial do Matopiba. Embrapa. 2014. Available online: https://www.embrapa.br/gite/publicacoes/NT1_DelimitacaoMatopiba.pdf (accessed on 18 May 2022).
  27. Ribeiro, L.C.D.S.; Lôbo, A.S.; Silva, L.D.D.; Andrade, N.F.S. Padrões de crescimento econômico dos municípios do MATOPIBA. Rev. Econom. Sociol. Rural 2020, 58. [Google Scholar] [CrossRef]
  28. Sá, H.A.; Morais, L.; Campos, C.S.S. Que desenvolvimento é esse? Análise da expansão do agronegócio da soja na área do MATOPIBA a partir de uma perspectiva furtadiana. In Proceedings of the Anais do XXI Congresso Brasileiro de Economia, Curitiba, Brazil, 9–11 September 2015. [Google Scholar]
  29. Ceccato, P.N.; Dinku, T. Introduction to Remote Sensing for Monitoring Rainfall, Temperature, Vegetation and Water Bodies; IRI Technical Report 10-04; International Research Institute for Climate and Society: Palisades, NY, USA, 2010. [Google Scholar]
  30. Zahran, S.A.E.-S.; Saeed, R.A.-H.; Elazizy, I.M. Remote sensing based water resources and agriculture spatial indicators system. Egypt. J. Remote Sens. Space Sci. 2022, 25, 515–527. [Google Scholar] [CrossRef]
  31. Jung, J.; Maeda, M.; Chang, A.; Bhandari, M.; Ashapure, A.; Landivar-Bowles, J. The potential of remote sensing and artificial intelligence as tools to improve the resilience of agriculture production systems. Curr. Opin. Biotechnol. 2021, 70, 15–22. [Google Scholar] [CrossRef]
  32. Spagnolo, T.; Couto Junior, A.F. Expansão da agricultura irrigada por pivô central no Cerrado entre os anos de 1984 e 2008. In Proceedings of the Brazilian Symposium of Remote Sensing (SBSR), XVI, Foz do Iguaçú, Brazil, 13–18 April 2013; pp. 712–719. [Google Scholar]
  33. Weber, E.; Hasenack, H.; Ferreira, C.J.S. Adaptação do Modelo Digital de Elevação do Srtm Para O Sistema de Referência Oficial Brasileiro E Recorte Por Unidade da Federação; UFRGS Centro de Ecologia: Porto Alegre, Brazil, 2004; Available online: https://sosgisbr.com/2011/06/18/modelos-digitais-de-elevacao-do-srtm-no-formato-geotiff/ (accessed on 3 June 2022).
  34. Lima, J.E.F.W. Situação E Perspectivas Sobre As Águas Do Cerrado. Ciência Cult. 2011, 63, 27–29. [Google Scholar] [CrossRef] [Green Version]
  35. Nascimento, D.; Novais, G. Clima do Cerrado: Dinâmica atmosférica e características, variabilidades e tipologias climáticas. Élisée Rev. Geogr. UEG 2020, 9, e922021. [Google Scholar]
  36. Lumbreras, J.F.; Carvalho Filho, A.; Motta, P.E.F.; Barros, A.H.C.; Aglio, M.L.D.; Dart, R.; De, O.; Silveira, H.L.F.; Quartaroli, C.F.; Almeida, R.E.M.; et al. Aptidão agrícola das terras do Matopiba; Embrapa Solos. Documentos, 179; Embrapa Solos: Rio de Janeiro, Brazil, 2015. [Google Scholar]
  37. Mingoti, R.; Brasco, M.A.; Holler, W.A.; Lovisi Filho, E.; Spadotto, C.A. Matopiba: Caracterização das Áreas com Grande Produção de Culturas Anuais. 2014. Available online: https://www.embrapa.br/busca-de-publicacoes/-/publicacao/991059/matopiba-caracterizacao-das-areas-com-grande-producao-de-culturas-anuais (accessed on 23 May 2022).
  38. Oliveira, G.; Brunsell, N.; Moraes, E.C.; Shimabukuro, Y.E.; Bertani, G.; Dos Santos, T.V.; Aragao, L.E.O.C. Evaluation of MODIS-based estimates of water-use efficiency in Amazonia. Int. J. Remote Sens. 2017, 38, 5291–5309. [Google Scholar] [CrossRef]
  39. Wan, Z. New refinements and validation of the collection-6 MODIS land-surface temperature/emissivity product. Remote Sens. Environ. 2014, 140, 36–45. [Google Scholar] [CrossRef]
  40. Amatulli, G.; Domisch, S.; Tuanmu, M.N.; Parmentier, B.; Ranipeta, A.; Malczyk, J.; Jetz, W. A suite of global, cross-scale topographic variables for environmental and biodiversity modeling. Sci. Data 2018, 5, 180040. [Google Scholar] [CrossRef] [PubMed] [Green Version]
  41. Funk, C.; Peterson, P.; Landsfeld, M.; Pedreros, D.; Verdin, J.; Shukla, S.; Husak, G.; Rowland, J.; Harrison, L.; Hoell, A.; et al. The Climate Hazards Infrared Precipitation With Record For Monitoring Extremes. Sci. Data 2015, 2, 10–66. [Google Scholar] [CrossRef] [PubMed] [Green Version]
  42. Duan, Z.; Liu, J.; Tuo, Y.; Chiogna, G.; Disse, M. Evaluation of eight high spatial resolution gridded precipitation products in Adige Basin (Italy) at multiple temporal and spatial scales. Sci. Total Environ. 2016, 573, 1536–1553. [Google Scholar] [CrossRef] [Green Version]
  43. Paredes-Trejo, F.J.; Barbosa, H.; Kumar, T.L. Validating CHIRPS-based satellite precipitation estimates in Northeast Brazil. J. Arid. Environ. 2017, 139, 26–40. [Google Scholar] [CrossRef]
  44. R Development Core Team. R: A Language and Environment for Statistical Computing; R Foundation for Statistical Computing: Vienna, Austria, 2020; Available online: http://www.R-project.org/ (accessed on 3 January 2021)ISBN 3-900051-07-0.
  45. Quantum GIS Geographic Information System, V. 3.4.6. Open Source Geospatial Foundation Project. 2019. Available online: https://qgis.org/pt_BR/site/ (accessed on 10 January 2021).
  46. Diaz, M.B.; Roberti, D.R.; Carneiro, J.V.; Souza, V.D.A.; de Moraes, O.L.L. Dynamics of the superficial fluxes over a flooded rice paddy in southern Brazil. Agric. For. Meteorol. 2019, 276–277, 107650. [Google Scholar] [CrossRef]
  47. Xiangyang, S.; Genxu, W.; Mei, H.; Ruiying, C.; Zhaoyong, H.; Chunlin, S.; Juying, S. The asynchronous response of carbon gain and water loss generate spatio-temporal pattern of WUE along elevation gradient in southwest China. J. Hydrol. 2020, 581, 124389. [Google Scholar] [CrossRef]
  48. Wang, L. An analytical reductionist framework to separate the effects of climate change and human activities on variation in water use efficiency. Sci. Total Environ. 2020, 727, 138306. [Google Scholar] [CrossRef]
  49. Correia Filho, W.L.F.; da Silva Aragão, M.R. Padrões temporais do vento à superfície em mesorregiões do estado da Bahia. Ciênc. Nat. 2014, 36, 402–414. [Google Scholar] [CrossRef] [Green Version]
  50. Costa, M.D.S.; De Oliveira-Júnior, J.F.; Dos Santos, P.J.; Correia Filho, W.L.F.; De Gois, G.; Blanco, C.J.C.; Teodoro, P.E.; da Silva, C.A., Jr.; Santiago, D.D.B.; Souza, E.D.O.; et al. Rainfall extremes and drought in Northeast Brazil and its relationship with El Niño–Southern Oscillation. Int. J. Climatol. 2021, 41, E2111–E2135. [Google Scholar] [CrossRef]
  51. Kaiser, H.F. A second generation little jiffy. Psychometrika 1970, 35, 401–415. [Google Scholar] [CrossRef]
  52. Kaiser, H.F.; Rice, J.; Little, J.; Mark, I. Educational and psychological measurement. Educ. Psychol. Meas. 1974, 34, 111–117. [Google Scholar] [CrossRef]
  53. Fávero, L.P.; Belfiore, P.; Da Silva, F.L.; Chan, B.L. Análise de Dados: Modelagem Multivariada Para Tomada de Decisões; Elsevier: Rio de Janeiro, Brazil, 2009. [Google Scholar]
  54. Correia Filho, W.L.F.; de Oliveira-Júnior, J.F.; dos Santos, C.T.B.; Batista, B.A.; Santiago, D.D.B.; Junior, C.A.D.S.; Teodoro, P.E.; da Costa, C.E.S.; da Silva, E.B.; Freire, F.M. The influence of urban expansion in the socio-economic, demographic, and environmental indicators in the City of Arapiraca-Alagoas, Brazil. Remote Sens. Appl. Soc. Environ. 2022, 25, 100662. [Google Scholar] [CrossRef]
  55. Buainain, A.M.; Garcia, J.R.; Vieira Filho, J.E.R. A economia agropecuária do Matopiba: Agricultural economy of Matopiba. Estud. Soc. Agric. 2018, 26, 376–401. [Google Scholar]
  56. Sampaio, M.D.A.P. Oeste da Bahia: Agricultura globalizada, desterritorialização e movimentos políticos emancipatórios. Geogr. Atos Online 2019, 8, 8–32. [Google Scholar] [CrossRef]
  57. Novoa, V.; Ahumada-Rudolph, R.; Rojas, O.; Sáez, K.; de la Barrera, F.; Arumí, J.L. Understanding agricultural water footprint variability to improve water management in Chile. Sci. Total Environ. 2019, 670, 188–199. [Google Scholar] [CrossRef]
  58. Silva, S.; Neves, E. Importância do manejo da irrigação. Enciclopéd. Biosf. 2020, 17. [Google Scholar] [CrossRef]
  59. Chen, A.; Huang, L.; Liu, Q.; Piao, S. Optimal temperature of vegetation productivity and its linkage with climate and elevation on the Tibetan Plateau. Glob. Chang. Biol. 2021, 27, 1942–1951. [Google Scholar] [CrossRef] [PubMed]
  60. Collados-Lara, A.J.; Fassnacht, S.R.; Pulido-Velazquez, D.; Pfohl, A.K.; Morán-Tejeda, E.; Venable, N.B.; Puntenney-Desmond, K. Intra-day variability of temperature and its near-surface gradient with elevation over mountainous terrain: Comparing MODIS land surface temperature data with coarse and fine scale near-surface measurements. Int. J. Climatol. 2021, 41, E1435–E1449. [Google Scholar] [CrossRef]
  61. Kattel, D.B.; Yao, T. Temperature-topographic elevation relationship for high mountain terrain: An example from the southeastern Tibetan Plateau. Int. J. Clim. 2018, 38, e901–e920. [Google Scholar] [CrossRef]
  62. Yang, Y.; Guan, H.; Batelaan, O.; McVicar, T.R.; Long, D.; Piao, S.; Liang, W.; Liu, B.; Jin, Z.; Simmons, C.T. Contrasting responses of water use efficiency to drought across global terrestrial ecosystems. Sci. Rep. 2016, 6, 23284. [Google Scholar] [CrossRef] [PubMed] [Green Version]
  63. Zhang, X.; Ge, Q.; Zheng, J. Impacts and lags of global warming on vegetation in Beijing for the last 50 years based on remotely sensed data and phonological information. Chin. J. Ecol. 2005, 24, 123. [Google Scholar]
  64. Zhu, W.; Mao, F.; Xu, Y.; Zheng, J.; Song, L. Analysis on response of vegetation index to climate change and its prediction in the three-rivers-source region. Plateau Meteorol. 2019, 38, 693–704. [Google Scholar]
  65. Zhong, R.; Wang, P.; Mao, G.; Chen, A.; Liu, J. Spatiotemporal variation of enhanced vegetation index in the Amazon Basin and its response to climate change. Phys. Chem. Earth Parts ABC 2021, 123, 103024. [Google Scholar] [CrossRef]
  66. Ju–lin, G.; Tao, Z.; Zhi-gang, W.; Gai–ling, G.; Lei, F. The relationships of water use efficiency with leaf physiological characteristics in Gaodan grass. Acta Agron. Sin. 2007, 33, 455–460. [Google Scholar]
  67. Ponce-Campos, G.E.; Moran, M.S.; Huete, A.; Zhang, Y.; Bresloff, C.; Huxman, T.E.; Eamus, D.; Bosch, D.D.; Buda, A.R.; Gunter, S.; et al. Ecosystem resilience despite large-scale altered hydroclimatic conditions. Nature 2013, 494, 349–352. [Google Scholar] [CrossRef]
  68. Yamori, W.; Hikosaka, K.; Way, D. Resposta à temperatura da fotossíntese em plantas C3, C4 e CAM: Aclimatação e adaptação à temperatura. Pesq. Fotossíntese 2013, 119, 101–117. [Google Scholar] [CrossRef]
  69. Xiao, G.; Zheng, F.; Qiu, Z.; Yao, Y. Impact of climate change on water use efficiency by wheat, potato and corn in semiarid areas of China. Agric. Ecosyst. Environ. 2013, 181, 108–114. [Google Scholar] [CrossRef]
  70. Raza, A.; Razzaq, A.; Mehmood, S.S.; Zou, X.; Zhang, X.; Lv, Y.; Xu, J. Impact of Climate Change on Crops Adaptation and Strategies to Tackle Its Outcome: A Review. Plants 2019, 8, 34. [Google Scholar] [CrossRef] [Green Version]
  71. Nielsen, U.N.; Ball, B.A. Impacts of altered precipitation regimes on soil communities and biogeochemistry in arid and semi-arid ecosystems. Glob. Chang. Biol. 2014, 21, 1407–1421. [Google Scholar] [CrossRef]
  72. Wilcox, K.R.; Blumenthal, D.M.; Kray, J.A.; Mueller, K.E.; Derner, J.D.; Ocheltree, T.; Porensky, L.M. Plant traits related to precipitation sensitivity of species and communities in semiarid shortgrass prairie. New Phytol. 2020, 229, 2007–2019. [Google Scholar] [CrossRef] [PubMed]
  73. He, L.; Li, Z.-L.; Wang, X.; Xie, Y.; Ye, J.-S. Lagged precipitation effect on plant productivity is influenced collectively by climate and edaphic factors in drylands. Sci. Total Environ. 2020, 755, 142506. [Google Scholar] [CrossRef] [PubMed]
  74. Correia Filho, W.L.F.; Dos Santos, T.V.; Diogo, A.M.; De Amorim, R.F.C. Diagnóstico da Precipitação e EVI em Dois Eventos de Seca no Nordeste do Brasil. Rev. Depart. Geogr. 2018, 35, 102–112. [Google Scholar] [CrossRef]
  75. Doble, R.; Simmons, C.T.; Jolly, I.; Walker, G. Spatial relationships between vegetation cover and irrigation-induced groundwater discharge on a semi-arid floodplain, Australia. J. Hydrol. 2006, 329, 75–97. [Google Scholar] [CrossRef]
  76. Pyrgou, A.; Santamouris, M.; Livada, I. Spatiotemporal Analysis of Diurnal Temperature Range: Effect of Urbanization, Cloud Cover, Solar Radiation, and Precipitation. Climate 2019, 7, 89. [Google Scholar] [CrossRef] [Green Version]
  77. Dalastra, G.M.D.; Echer, M.D.M.E.; Guimarães, V.F.G.; Brito, T.S.B.; Inagaki, A.M.I. Trocas gasosas e produtividade de tomateiro com diferentes hastes por planta. Ihering. Sér. Bot. 2020, 75, e2020020. [Google Scholar] [CrossRef]
  78. Yamori, W. Chapter 12: Photosynthesis and respiration. In Plant Factory, 2nd ed.; Elsevier: Amsterdam, The Netherlands; pp. 197–206. [CrossRef]
  79. Frankenberg, C.; Fisher, J.B.; Worden, J.; Badgley, G.; Saatchi, S.S.; Lee, J.-E.; Toon, G.C.; Butz, A.; Jung, M.; Kuze, A.; et al. New global observations of the terrestrial carbon cycle from GOSAT: Patterns of plant fluorescence with gross primary productivity. Geophys. Res. Lett. 2011, 38. [Google Scholar] [CrossRef] [Green Version]
  80. Ma, J.; Xiao, X.; Zhang, Y.; Doughty, R.; Chen, B.; Zhao, B. Spatial-temporal consistency between gross primary productivity and solar-induced chlorophyll fluorescence of vegetation in China during 2007–2014. Sci. Total Environ. 2018, 639, 1241–1253. [Google Scholar] [CrossRef]
  81. Zhang, T.; Peng, J.; Liang, W.; Yang, Y.; Liu, Y. Spatial–temporal patterns of water use efficiency and climate controls in China’s Loess Plateau during 2000–2010. Sci. Total Environ. 2016, 565, 105–122. [Google Scholar] [CrossRef]
  82. Giacomoni, H.M.; Mendes, C.A.B. Estimativa de Evapotranspiração Regional por meio de Técnicas de Sensoriamento Remoto Integradas a Modelo de Balanço de Energia. Rev. Brasil. Recur. Hídr. 2008, 13, 33–42. [Google Scholar]
  83. Landau, E.C.; Guimarães, D.P.; De Souza, D.L. Caracterização Ambiental das áreas com Agricultura Irrigada por pivôs Centrais na Região do Matopiba-Brasil, 1st ed.; Embrapa Milho e Sorgo: Sete Lagoas, Brazil, 2014; p. 43. [Google Scholar]
  84. Colussi, J. MATOPIBA: Mudanças No Uso Da Terra Na Nova Fronteira. Master’s Thesis, Universidade Federal do Rio Grande do Sul (UFRGS), Rio Grande do Sul, Brazil, 2017; p. 99. [Google Scholar]
  85. Pereira, C.N.; Porcionato, G.L.; Castro, N. Aspectos socioeconômicos da região do MATOPIBA. Bol. Reg. Urban Ambient. IPEA 2018, 18, 47–60. [Google Scholar]
  86. CONAB-Companhia Nacional de Abastecimento. Acompanhamento da Safra Brasileira de Grãos, Safra 2018/19-Oitavo Levantamento. 2019; pp. 1–135. Available online: https://www.conab.gov.br/info-agro/safras/graos/boletim-da-safra-de-graos (accessed on 25 January 2021).
  87. IBGE–Instituto Brasileiro de Geografia e Estatística. 3° Levantamento Sistemático da Produção Agrícola (LSPA). 2018. Available online: https://www.ibge.gov.br/estatisticas/economicas/agricultura-e-pecuaria/9201-levantamento-sistematico-da-producao-agricola.html (accessed on 10 January 2021).
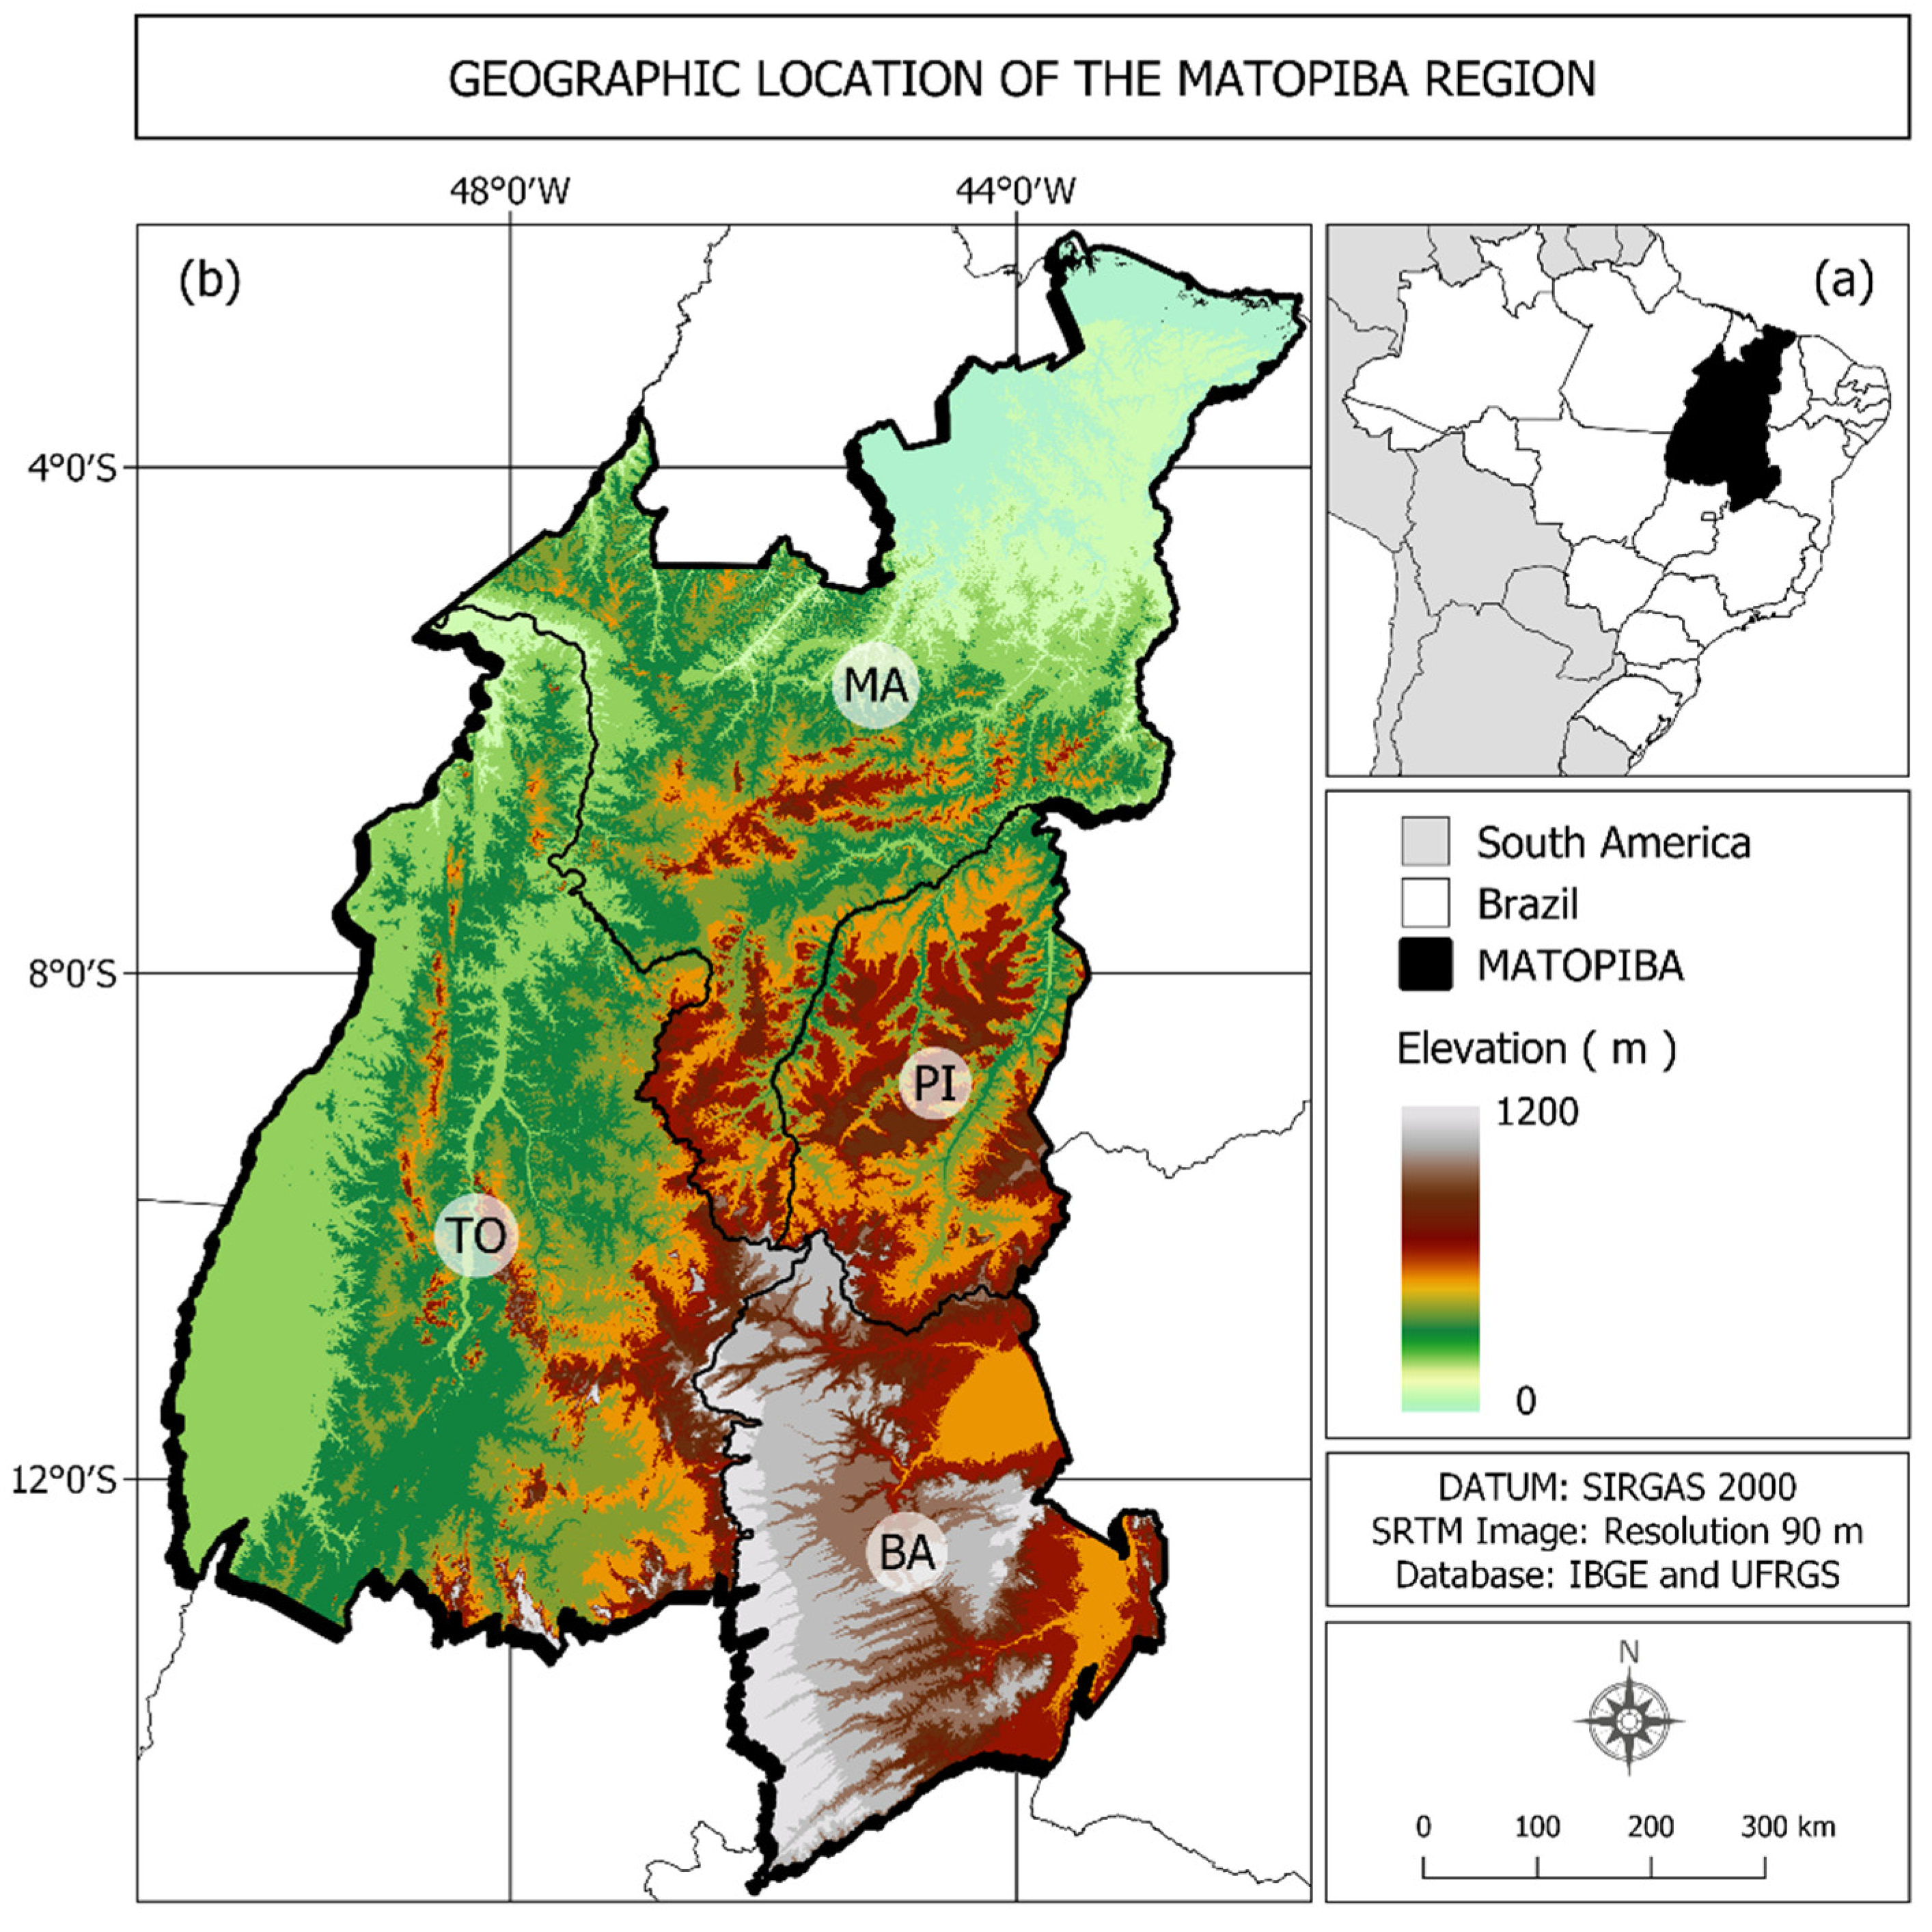
Figure 1. Geographic location of the MATOPIBA region in Brazil and South America (a) and elevation of the MATOPIBA region (b). SRTM data source: Weber et al. [33].
Sustainability 14 08758 g001
Figure 2. Biplot showing the degree of contribution of the stations (individual) and years (variables), from the first two main components.
Sustainability 14 08758 g002
Figure 3. Spatial behavior of the Factor Loadings corresponding to the first PC.
Sustainability 14 08758 g003
Figure 4. Land use and land cover variation in 2001 (a), 2019 (b) e WUE 2001 (c), 2019 (d).
Sustainability 14 08758 g004
Table 1. Correlation analysis (CA) and contribution (%) of the variables analyzed for the PC1 and KMO and MSA test results. The results of the KMO and MSA tests vary from 0.50 to 1. The results of the CA vary from −1 to 1. The explained variance and percentage of contribution vary from 0 to 100.
VariablesKMOCorrelation PC1Contribution PC1 (%)
Elevation0.790.8225.95
LST0.790.8325.64
Rainfall0.790.7825.55
WUE0.81−0.8222.86
Variance Explained (%)--65.77
Overall MSA = 0.79
Publisher’s Note: MDPI stays neutral with regard to jurisdictional claims in published maps and institutional affiliations.