Article

Spatiotemporal Evolution of Water Resource Utilization and Economic Development in the Arid Region of China: A “Matching-Constraint” Perspective

1
College of Geography and Environmental Science, Northwest Normal University, Lanzhou 730070, China
2
College of Resources and Environment, Lanzhou University, Lanzhou 730000, China
*
Author to whom correspondence should be addressed.
Sustainability 2022, 14(14), 8724; https://doi.org/10.3390/su14148724
Submission received: 8 June 2022 / Revised: 14 July 2022 / Accepted: 14 July 2022 / Published: 16 July 2022

Abstract

:
Water resources are the most important guarantees for sustainable socioeconomic development in arid regions. However, serious water scarcity puts great pressure on the sustainable development of the northwest arid region of China. Based on the “matching-constraint” perspective, this study used the Gini coefficient, imbalance index, and growth drag model of water resources to quantify the spatiotemporal evolution of water resource utilization (WRU) and economic development (ED) in the northwest arid region from 2009 to 2019. The results showed the following: (1) The matching degree of WRU and ED in Gansu and Xinjiang from 2009 to 2019 was poorer than that in Ningxia, Shaanxi, and Qinghai. Cities with the high matching type of WRU and ED were dominant, with a proportion of 60.78%. (2) During the study period, the growth drag of water resources showed an “N-shaped” change of “rising–declining–rising” and a spatial pattern of “decreasing from inland to coastal” in the northwest arid region. The average growth drag coefficients for the five northwestern provinces were as follows: Xinjiang (2.22%), Gansu (1.61%), Ningxia (1.41%), Qinghai (1.01%), and Shaanxi (0.84%). The total percentage of low and medium constraint type cities was 74.51%. (3) Based on the urban “matching-constraint” types, the WRU status was divided into four zone types: Zones I and IV had relatively well-allocated water resources; however, zone IV had more significant water resource constraints, with the growth drag coefficient ranging from 1.10% to 2.30%. An imbalance between WRU and ED existed in Zones II and III; moreover, the water resource constraints of these two zones were also significant, with growth drag coefficients ranging from 0.12% to 1.47% and 1.03% to 2.90%, respectively. Additionally, we explored the driving mechanisms of WRU and sustainable ED in the northwest arid region. Policy recommendations are proposed for the optimal use of water resources, capital, and labor for different types of cities.

1. Introduction

Water plays an irreplaceable role in ensuring human survival and maintaining ecological balance [1]. It is also a key input factor for economic growth and plays a vital role in supporting the steady development of regional economies [2]. Over the past 10 decades, global climate change, a population explosion, and rapid economic and social development have resulted in an increase in human water demand by nearly six-fold; this continues to grow steadily at a rate of 1% per year [3,4]. Following this trend, a water crisis is expected to present a serious threat to the sustainable development of countries worldwide by 2050 [5]. China is the world’s largest developing country, but its per capita water resources are only a quarter of the world average [6]. Behind the miracle of China’s economic growth is a growing conflict between increasing demand for water and limited supply capacity, which has serious negative implications for quality socioeconomic development, particularly in arid and semiarid regions [7]. Specifically, the northwest arid region is one of the regions in China with the most severe resource-based water shortages and contradictions between water supply and demand [8]. It is also representative of arid and semi-arid regions of the world. The successive promotion of national strategies such as Western Development, the “Belt and Road” strategy, and the New Land–Sea Trade Corridor has accelerated industrialization and economic development (ED) in the northwest arid region [9,10]. The northwest arid region is growing into a hotspot to help realize China’s comprehensive modernization and high-quality development [11]. However, water scarcity is already a bottleneck for economic growth in the northwest arid region [12]. Inappropriate water resources utilization (WRU) has led to spatial mismatches and the inefficient use of water resources, further hindering the healthy development of the regional economy [13]. In this context, it is urgent to accurately quantify the spatiotemporal evolution of WRU and ED in the northwest arid region and examine the role of limited water resources allocation in the region’ economic system, so as to provide a reference for facilitating optimal WRU and sustainable ED. These explorations have practical significance for alleviating the water resources crisis in the process of economic development of the northwest arid region, which is also important for promoting the coordination of WRU and ED in China and globally and for achieving the goals of the 2030 Agenda for Sustainable Development.
The matching of WRU and ED factors is the basis for the rational allocation of water resources. Many scholars have conducted a series of studies on the matching of regional water resources with economic factors, which include two ideas. First, following the construction of the evaluation index system, the coupling coordination degree (CCD) model was used to analyze the coupling effect between WRU and ED [14,15]. Second, indirect means, such as the Gini coefficient and Theil index, were used to measure the match between regional water resources and ED factors [16,17]. However, scholars inevitably encounter shortcomings such as the under-representation of indicators and the subjectivity of weights when determining indicator systems and indicator weights [18]. The Gini coefficient method is a simple and mature method which presents its calculation by ratio analysis to quantify the match between WRU and ED [19]. Moreover, the evaluation criterion of the Gini coefficient has been accepted internationally, thus making it easier to interpret and compare the matching degree of WRU and ED between different countries or regions [20]. Therefore, it is widely used by many scholars, and the research results involve multiple scales, such as national [21], city cluster [22], basin [23], and provincial [24]. However, the Gini coefficient can only reflect the overall match between regional water resources and ED factors and does not reflect the spatial differences in the matching degree within regions. Therefore, some scholars have compensated for this shortcoming of the Gini coefficient by introducing an imbalance index. For example, Ma et al. [25], who used the Gini coefficient and the imbalance index, found that the agricultural water footprint and the agricultural gross domestic product (GDP) of Zhangjiakou were in a relatively matched state in 2005 and 2015. Han et al. [26] used the Lorenz Gini coefficient method and imbalance index model to construct a spatiotemporal matching method between regional WRU and ED and found that the spatiotemporal matching between water resources and socioeconomic factors evolved in relation to regional water resource endowments and economic growth rates. Therefore, in this study we used the Gini coefficient and imbalance index to evaluate the spatiotemporal matching between WRU and ED factors in the northwest arid region.
Water resources investments have contributed significantly to the rapid economic growth of the region. However, as the economy has developed and people’s living standards have improved, the scarcity of water resources has become increasingly evident [27]. To address the mismatch between WRU and ED, scholars both in China and abroad have begun to focus on the extent to which socioeconomic development is constrained by water resources. Nordhaus et al. [28] first used the Solow model to empirically investigate the resource constraint hypothesis proposed in the new economic growth theory and confirmed that the economic growth rate in the USA was reduced by approximately 0.24% annually owing to the constraints of land and other resources. Bruvoll et al. [29] used the dynamic resource environment application model to find that resource constraints have taken a toll on social welfare in Norway. They also suggested that natural resource constraints can lead to the social costs of environmental management, which, in turn, hinder the economy and increase social welfare expenditure. Romer [30] proposed the use of the Cobb–Douglas production function to measure the effect of resource constraints, building on the work of earlier researchers. He formally defined the difference between the economic growth rate without resource constraints and the constrained growth rate as “growth drag”. Water scarcity in China has become an important constraint on sustainable ecological and socio-economic development. Zhang et al. [31] used panel data to demonstrate that economic growth rates in eastern, western, central, and northeastern China were reduced by the drag effect of water resources by 0.23%, 0.07%, 0.43%, and 0.09%, respectively, per annum from 1987 to 2017. Peng et al. [32] introduced the growth drag model of water resources, which quantifies the average growth drag level of water resources on economic growth, and found it to be 1.20% in the Hengduan Mountains for the 2006–2015 period. Li et al. and An et al. [33,34] have studied the drag effect of water resources on food production and urbanization. An analytical framework for water constraint issues in China has been developing gradually.
In summary, the results of existing research have provided many useful references for this study. However, we identified three problems that had not been fully addressed, as follows: (1) Few scholars have studied the matching status between WRU and ED factors in the northwest arid region at provincial and municipal levels. In this respect, most studies have compared differences in the degree of matching of northwestern provinces at a national level. However, as municipal governments play a direct role in coordinating the utilization of water resources within cities, it is necessary to study the matching between WRU and ED in the northwest arid region at both provincial and municipal levels. (2) Current research on the drag effect of water resources is concentrated in mountainous regions, developed economic zones, and eastern cities of China, while research on the drag effect of water resources in the northwest arid region is still lacking. Theoretically, the constraints of water resources on economic growth in the arid region of China are probably even greater and need to be revealed quantitatively. (3) There is a lack of comprehensive research on the matching degree and constraining effect of WRU on ED. Therefore, in this study, we linked the matching and constraining effects of WRU on ED as an equally important research area to scientifically and accurately quantify the spatiotemporal evolution of WRU and ED in the northwest arid region, identify WRU problems in the process of ED, and alleviate the hazards of water scarcity on economic growth. Specifically, based on the new “matching-constraint” perspective, we systematically investigated the spatial-temporal evolution of the matching degree and degree of constraints between WRU and ED in the northwest arid region from 2009 to 2019 using the Gini coefficient method, imbalance index method, and growth drag model of water resources. Subsequently, based on the urban “matching-constraint” type, we divided the WRU status into zones to identify respective WRU problems.

2. Data Sources and Methods
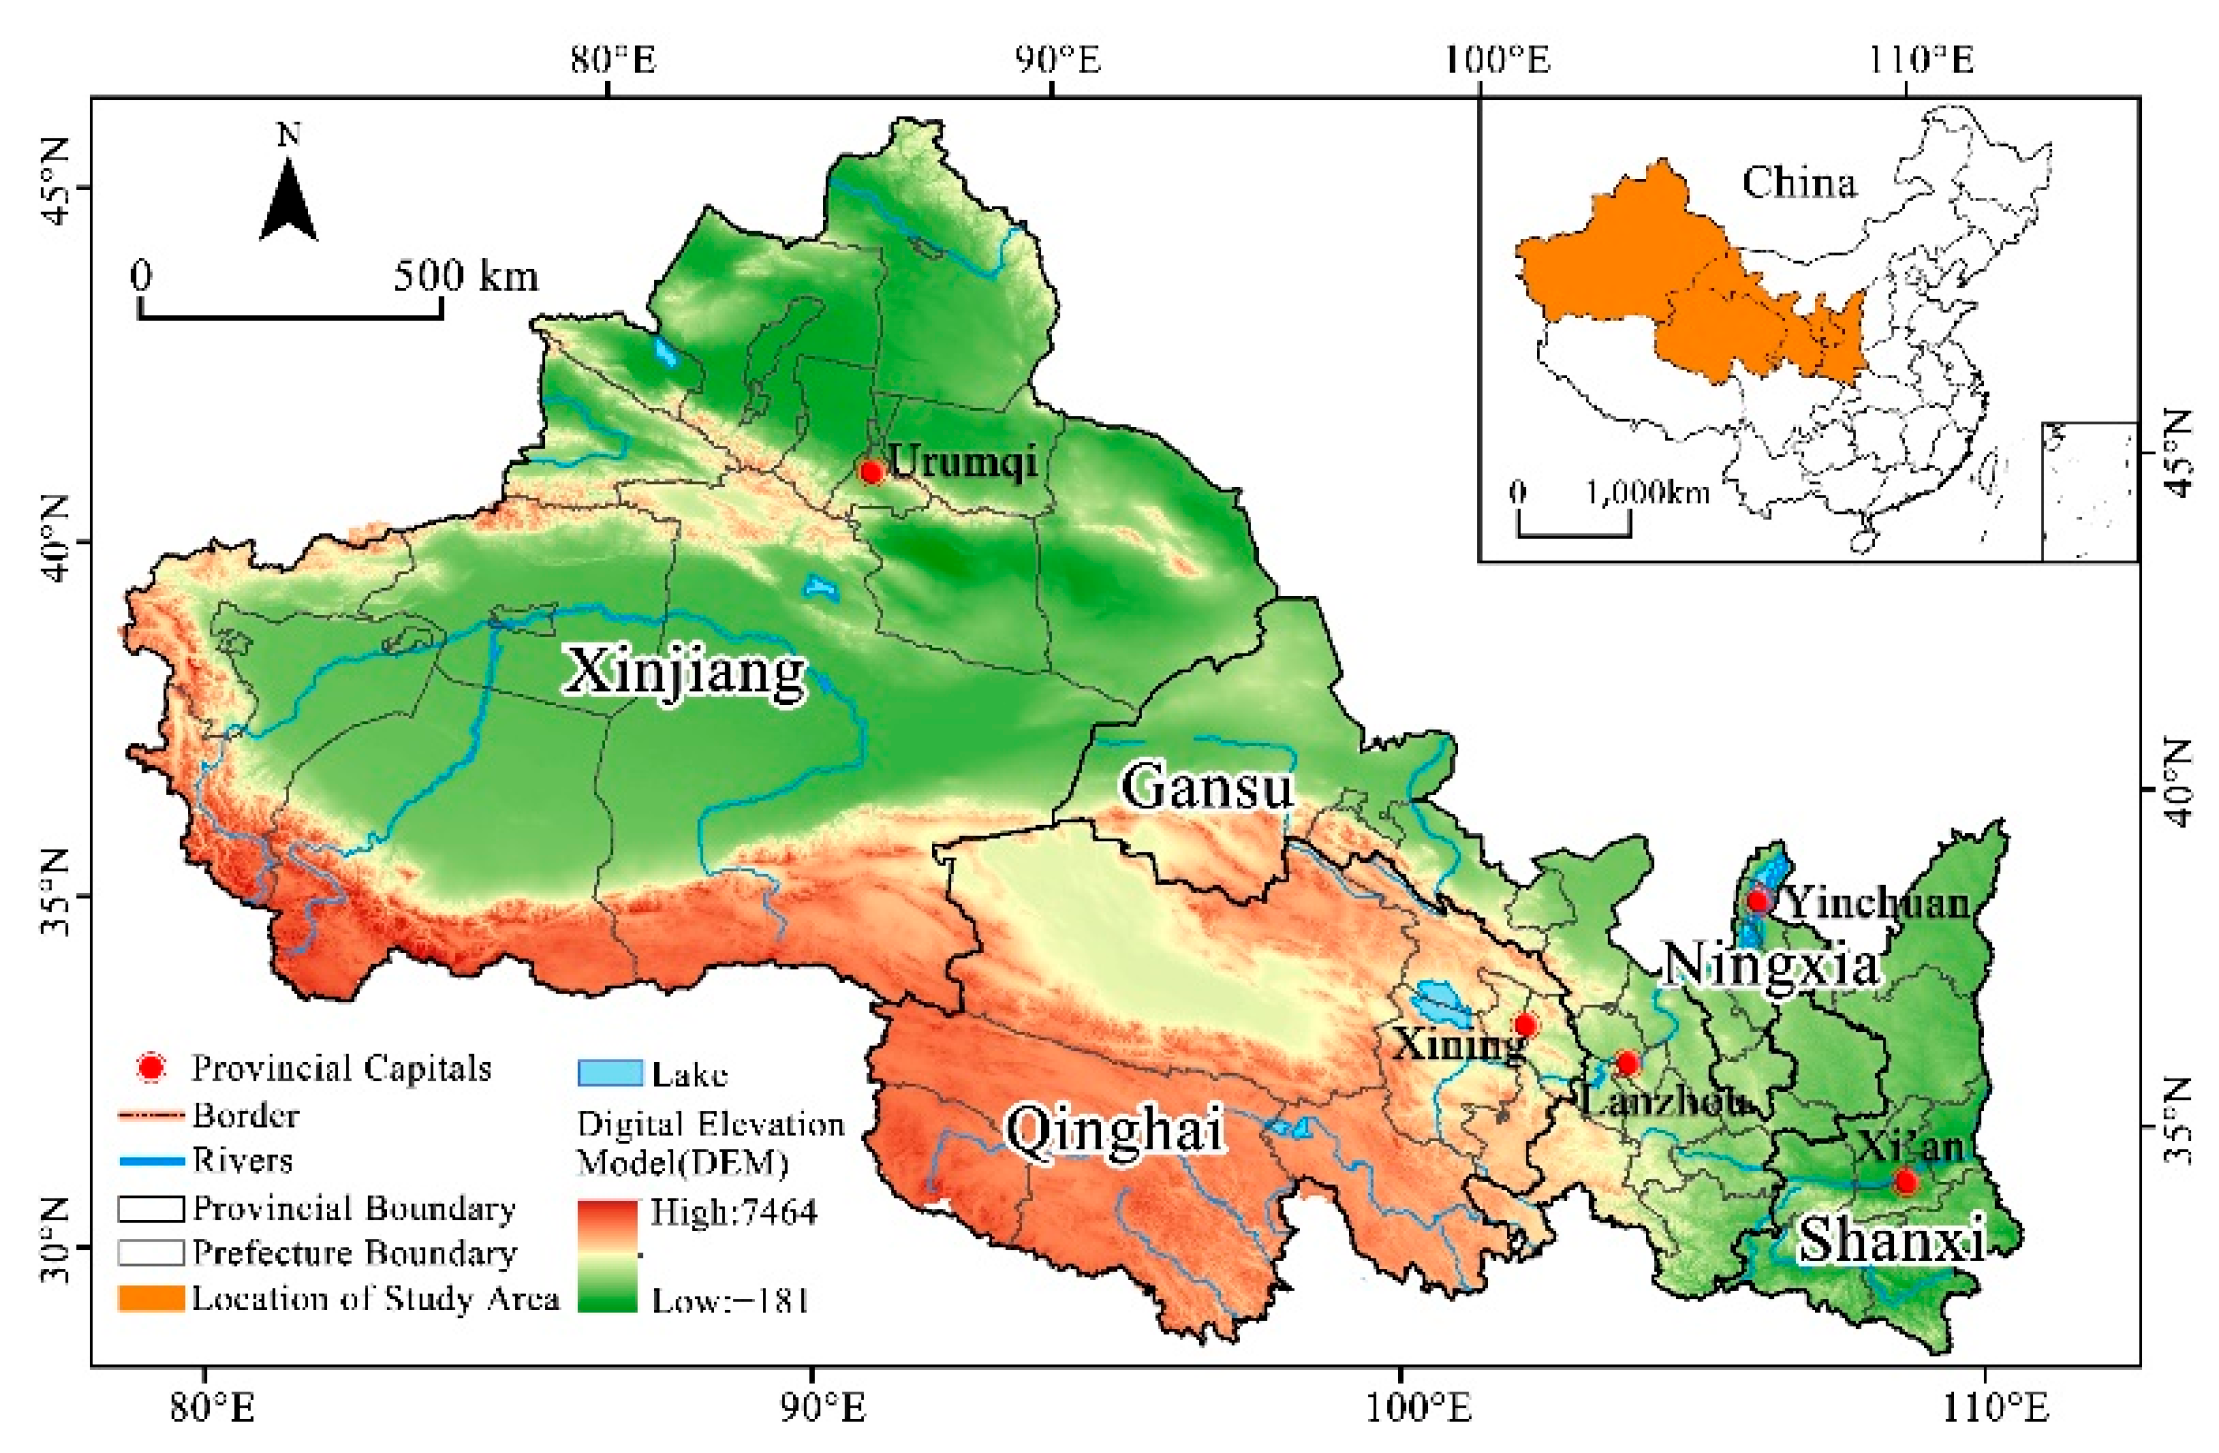
2.1. Study Area

The northwest region is one of the seven natural geographic regions of China, located in the center of Eurasia [35] (Figure 1). The region is characterized by arid and semi-arid climates with scarce precipitation and ecological fragility; thus, it is also known as the northwest arid region [36]. The entire northwest arid region was taken as the study area, covering a total of 51 urban administrative units in 5 provinces, namely Shaanxi, Gansu, Qinghai, the Ningxia Hui Autonomous Region, and the Xinjiang Uygur Autonomous Region. Specifically, Shaanxi is deeply integrated into the new domestic and international double-circle pattern and Gansu is a strategic hub for China’s opening up to the outside world [37,38]. Qinghai has an important and special ecological position, commonly known as the “Chinese Water Tower” [39]. Ningxia is actively becoming a pioneering area for ecological protection and high-quality development in China’s Yellow River Basin, whereas Xinjiang is the core area for the construction of China’s Silk Road Economic Belt [40]. This shows that the northwest arid region has an important supporting role to play in building a firm ecological security barrier in China, building the Silk Road Economic Belt, and promoting coordinated and high-quality regional development. However, the total amount of water resources of the northwest arid region in 2019 was 2332.32 × 108 m3, accounting for only 8.03% of the country’s total water resources. The water resources per capita was approximately 990 m3, less than 1/10 of the global average. It is evident that the extreme lack of water resources has become the most important factor to hinder ED and social progress in the northwest arid region [41]. Promoting the rational exploitation of water resources in the northwest arid region has been elevated to the level of strategic management of regional resources and economic security [42].

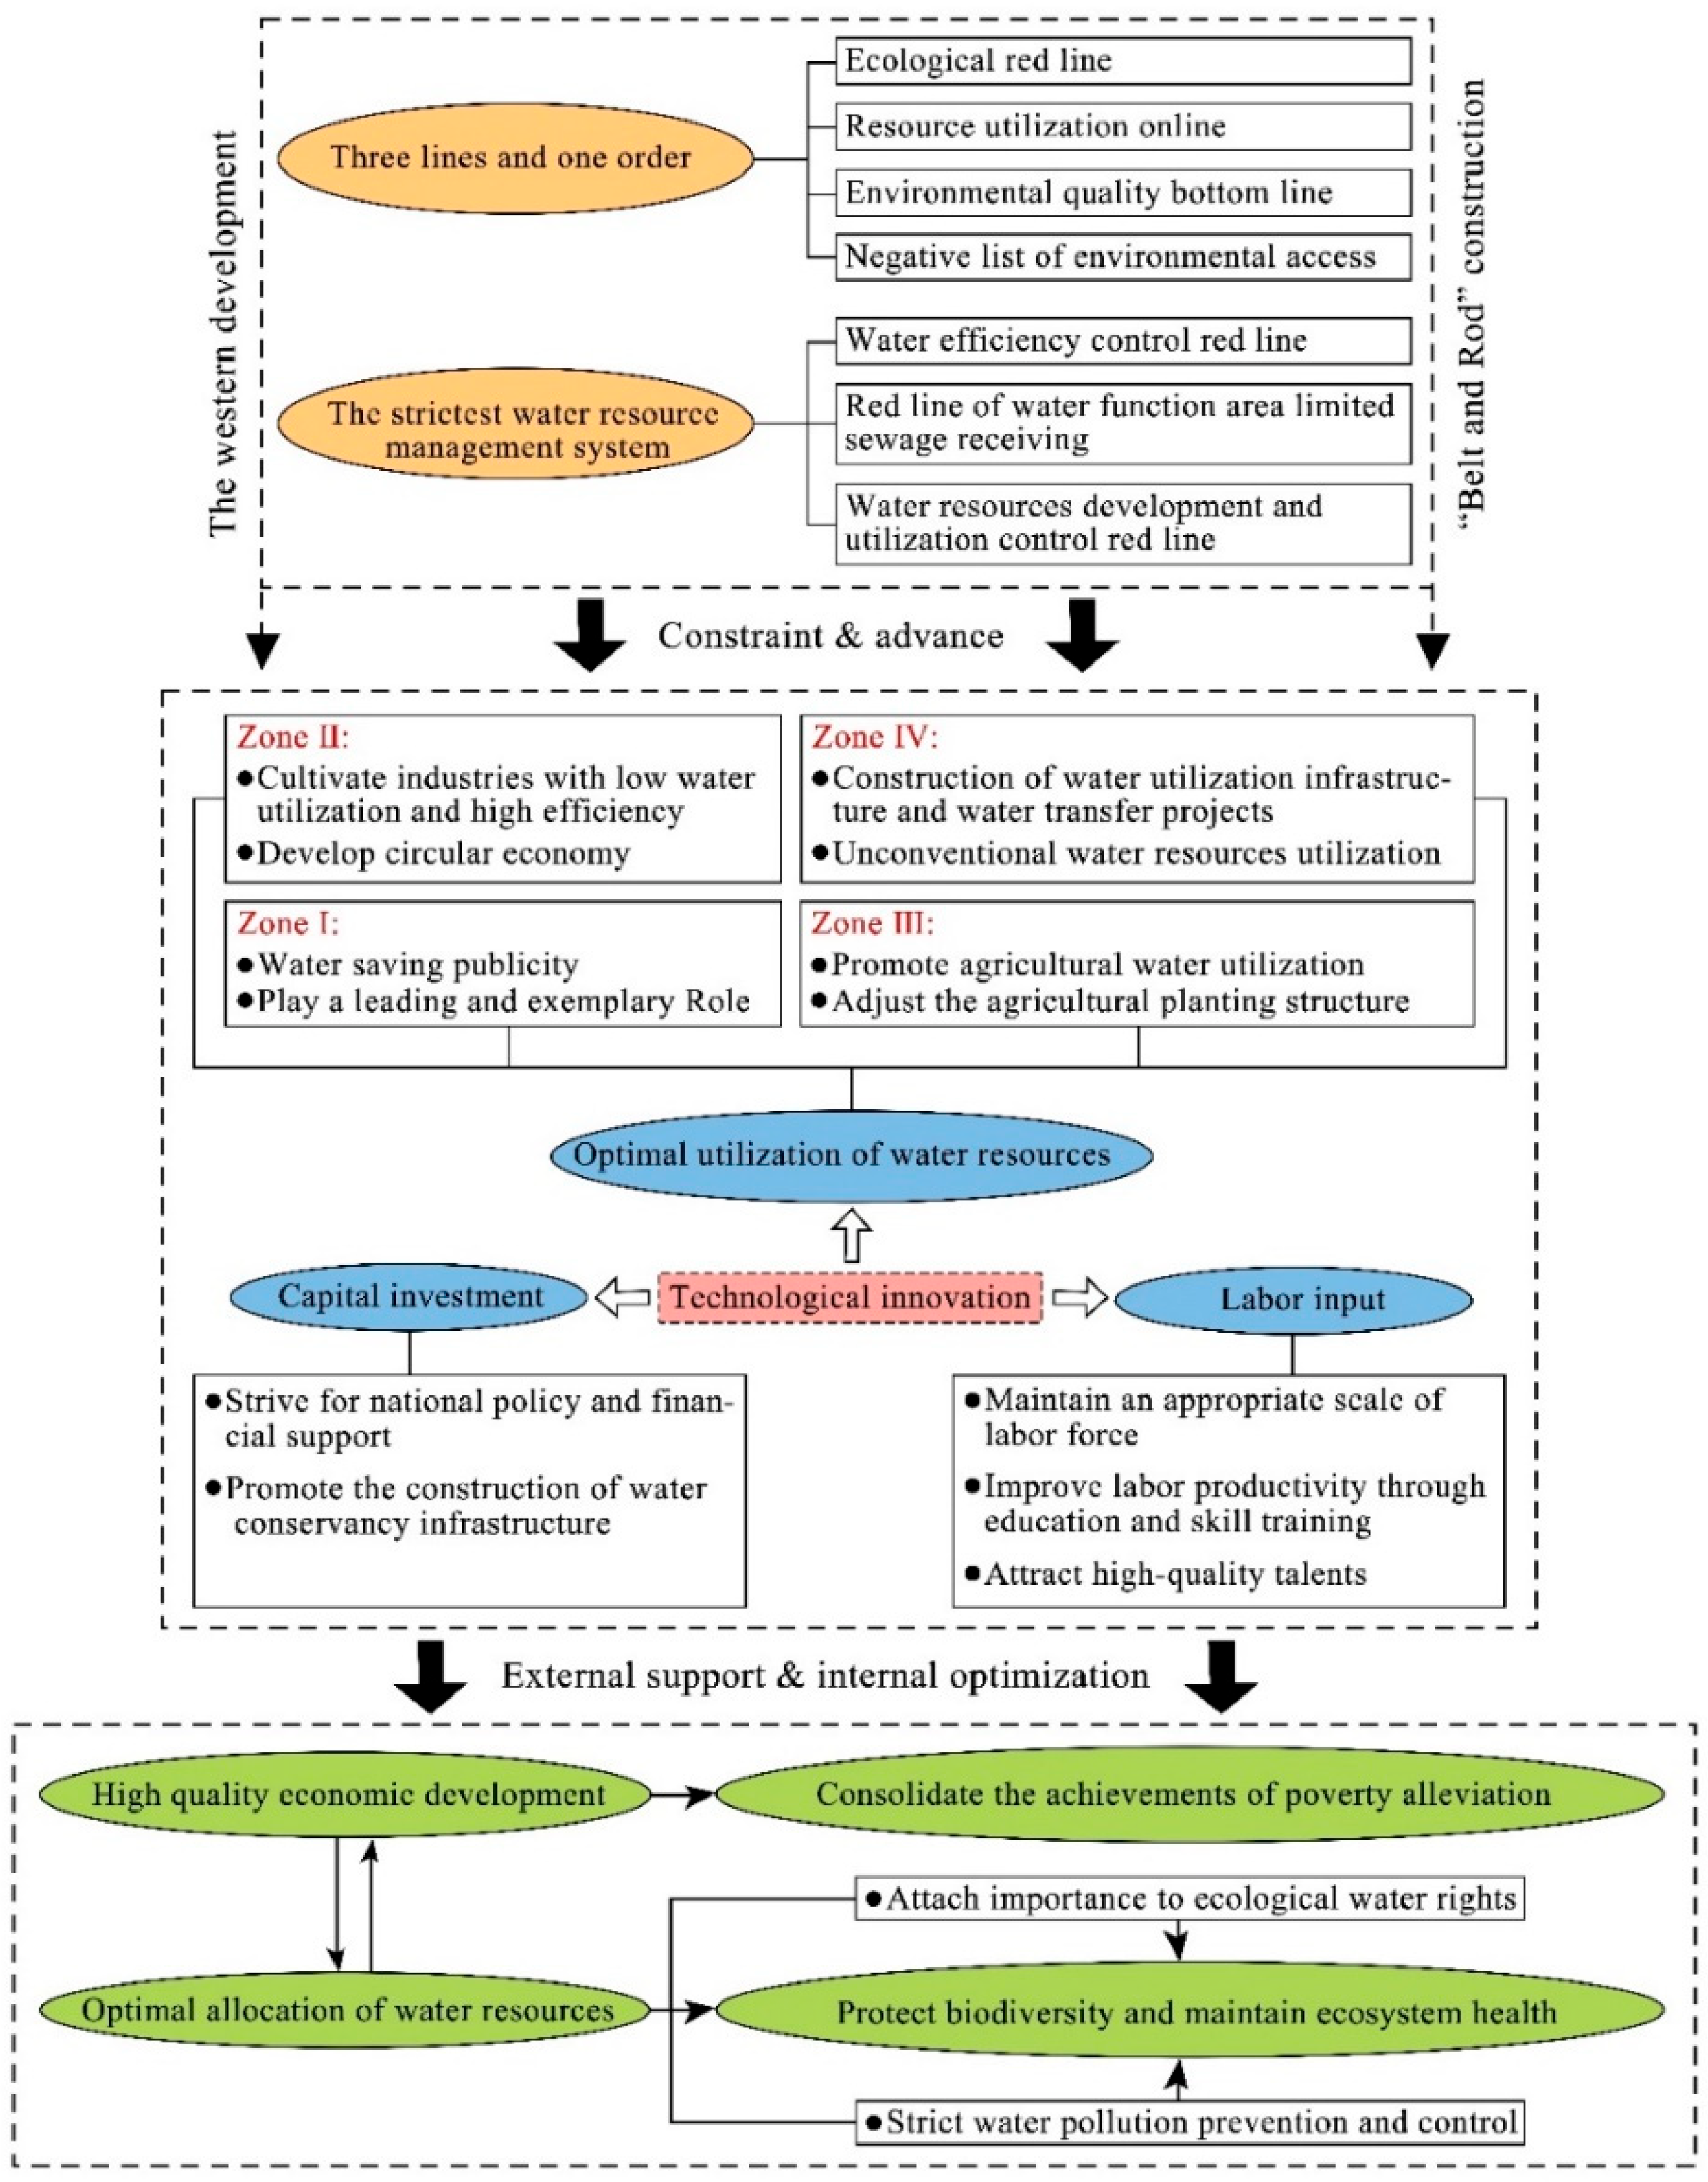
2.2. Research Framework

A research framework was developed based on a “matching-constraint” perspective to quantify the spatiotemporal evolution of WRU and ED in the northwest arid region. The framework consists of three parts, as illustrated in Figure 2. (1) The first is indicator selection. ① First we selected two indicators to measure the matching degree of WRU and ED. WRU refers to the amount of water resources utilized in a region to promote economic and social development and protect the ecological environment, reflecting the effective support of water resources for regional sustainable development [43]. To accurately characterize the input of water resources in the process of economic development, the total water consumption of agricultural water, industrial water, domestic water, and ecological water was selected as the basic matching object based on the direction of water resource development and utilization to measure the matching degree of WRU and ED. The ED in this study refers to the overall level of regional development and economic activity capacity. Therefore, GDP was selected as the matching classification object to measure the matching degree of WRU and ED. ② Next, we selected four indicators to quantify the constraint effect of WRU on ED. According to the new growth theory, capital and labor are the basic factors of production in economic development, and resources are inevitably consumed in the process of economic development in any region [31]. On the one hand, with the continuous accumulation of capital and an increase in the labor force, the demand for resources will also increase. If the growth rate of resources is lower than that of the labor force, it will lead to a decrease in the growth rate of per capita output and restrict ED [30]. On the other hand, technological progress enables effective capital and labor factors to replace the role of resources in ED and reduce their absolute usage [27]. Therefore, it is necessary to incorporate the influence of capital and labor force on ED into the theory when discussing the constraint effect of resource utilization on ED. Based on previous studies and considering the study purpose, the total water consumption, capital, and labor were selected as the basic input indices, and GDP was selected as the output index to represent the economic output value to conduct a quantitative study on the constraint effect of WRU on ED in the northwest arid region. (2) The second part involves the spatiotemporal evolution of WRU and ED, comprising three steps. Step 1: Using the Gini coefficient and the imbalance index, we calculated the matching degree of WRU and ED at the provincial and municipal levels in the northwest arid region and then analyzed their temporal evolution and spatial differences. Step 2: The improved Cobb–Douglas production function was used to construct a growth drag model of water resources, and the output elasticities of water resources, capital, and labor for ED were determined by applying a ridge regression model. On this basis, the growth drag of water resources in the northwest arid region was quantified and its temporal trends and spatial patterns were studied. Step 3: Based on the “matching-constraint” type of the WRU and ED of the cities in the northwest arid region, we divided the WRU status zones in order to identify WRU problems. (3) The third part is the discussion of driving mechanism. We explored the driving mechanism of WRU and sustainable ED in the northwest arid region and proposed specific measures to optimize WRU and ED.

2.3. Data Source and Index Selection

Data on total water consumption (i.e., the sum of industrial water, agricultural water, domestic water, and ecological water) were obtained from the Shaanxi Provincial Water Resources Bulletin, Gansu Provincial Water Resources Bulletin, Qinghai Provincial Water Resources Bulletin, Ningxia Hui Autonomous Region Water Resources Bulletin, and Xinjiang Uygur Autonomous Region Water Resources Bulletin for the period 2009–2019. Capital was estimated using the perpetual inventory method based on fixed asset investment amount data. The labor was based on year-end social employment data and economic output was based on GDP data. Data for the three aforementioned parameters were collected from the Shaanxi Statistical Yearbook, Gansu Development Yearbook, Qinghai Statistical Yearbook, Ningxia Statistical Yearbook, and Xinjiang Statistical Yearbook from 2010 to 2020.

2.4. Methods

(1)
Gini coefficient
The Gini coefficient was created by Gini Corrado based on the Lorenz curve and can be used as a quantitative indicator of the fairness of a certain income distribution in society [44]. Water resources are characterized by an unbalanced spatial distribution, which directly affects the ED of a region, and its intrinsic law can be analogous to the problem of equilibrium in the income distribution [45]. Therefore, to identify the matching degree of WRU and ED in the northwest arid region, the specific Gini coefficient was calculated as follows:
G = 1 i = 1 n ( x i x i 1 ) ( y i + y i 1 )
where G represents the Gini coefficient of water resources–GDP; xi represents the cumulative percentage of total water consumption in the ith city; yi represents the cumulative percentage of GDP in the ith city; and n represents the number of all cities in the province. When i = 1, (xi−1, yi−1) is considered as (0, 0). Based on the relevant study [46], the degree of water resources–GDP matching degree was classified into five levels: “high matching” (0 < G < 0.2), “relative matching” (0.2 ≤ G < 0.3), “general matching” (0.3 ≤ G < 0.4), “relative mismatching” (0.4 ≤ G < 0.5) and “extremely mismatching” (0.5 ≤ G < 1).
(2)
Imbalance index
The Gini coefficient can reflect the overall matching degree between the regional WRU and ED, but it does not reveal spatial differences in the matching. Therefore, in this study, we constructed the consistency coefficient of WRU and ED to reflect the differences in urban matching degree based on the research of Han et al. [26]. The formula used was
D I F i = W R i G D P i = w r i / i = 1 n w r i / g d p i / i = 1 n g d p i
where DIFi represents the consistency coefficient between WRU and ED in city i, WRi represents the level of WRU aggregation in city i, GDPi represents the level of economic aggregation in city i, wri represents the total water consumption in city i, gdpi represents the GDP in city i, and n represents the number of all cities in the province.
The DIF indicator can describe the degree of difference in the matching of urban WRU and ED distributions, but it is difficult to compare the relative degree of matching deviation. Therefore, to depict the spatial equilibrium degree of the distribution of urban WRU and ED, we further constructed the imbalance index of WRU and ED. The formula used was
D E V i = D I F i 1 2
where DEVi represents the water resources–GDP imbalance index of city i and takes a value in the range of (0, +∞). The smaller the DEVi value, the better the matching degree of WRU and ED in city i; conversely, the larger the DEVi value, the poorer the matching of WRU and ED in city i.
(3)
Growth drag model of water resources
Treatment of indicators in the model section: (1) Price index adjustment for GDP and fixed asset investment amount was used. To avoid the influence of inflation on the measurement results, we used 2009 as the base period and adopted price indices to make comparable price adjustments to the data on the GDP and fixed asset investment amount of provinces and cities, aiming to more accurately reflect the actual changes in both datasets. (2) The perpetual inventory method was used to estimate the fixed capital stock; for the relevant calculation steps please refer to the research of Ye and Ke et al. [47,48].
Derivation of a growth drag model for water resources: Romer’s growth drag equation is based on the Cobb–Douglas production function, which examines the constraints imposed by natural resources on economic growth [30]. In this study, we made some modifications to Romer’s classical model by incorporating only the water resources element into the model to create a growth drag model of water resources.
Y ( t ) = K ( t ) α W ( t ) β [ A ( t ) L ( t ) ] 1 α β
where Y(t), K(t), W(t), A(t), and L(t) represent the total output, capital input, total water consumption, technical progress, and labor input of region i at time t, respectively. α and β are parameters representing capital stock elasticity and water consumption elasticity, respectively, with α > 0, β > 0 and 1 – α − β > 0.
By deforming the above equation by taking the logarithm of both sides simultaneously and then taking the derivative with respect to time, the economic growth rate equation is obtained as
g Y ( t ) = α g K ( t ) + β g W ( t ) + ( 1 α β ) [ g A ( t ) g L ( t ) ]
where gY(t), gK(t), gW(t), gA(t) and gL(t) are the growth rate functions of Y, K, W, A, and L, respectively.
According to Romer’s theory and Xue et al.’s research [30,49], the capital accumulation equation is ΔKt = sYt−1 − (1 − δ)Kt−1, and if the growth rate of K is expected to remain constant, then (ΔKt/Kt−1) = (Yt−1/Kt−1). Assuming that when the economy maintains equilibrium growth, the rate of economic growth remains the same as the rate of capital growth on the equilibrium growth path, gY(t) = gK(t). In the case where ED is not constrained by water resources, water resources and labor change in tandem at this point. Both the labor growth rate and the water resources growth rate are n. Thus, after shifting the terms, the growth rates of economic output under the scenario where ED is constrained by water resources and the growth rates of economic output under the unconstrained scenario are
g Y ( t ) = ( 1 α β ) ( g L ( t ) + g A ( t ) ) + β g W ( t ) ( 1 α )
g Y ( t ) = ( 1 α β ) ( n + g A ( t ) ) + β n ( 1 α )
The growth drag of water resources is equal to the difference between the growth rate of economic output in the unconstrained case and the growth rate of economic output in the constrained case. Based on the above derivation process, the water resources growth drag can be derived as
D r a g w = β ( n g W ( t ) ) 1 α
where Dragw is the growth drag of water resources. If the growth drag is positive, water resource is a constraint on ED, and the larger the value, the greater the constraint. Conversely, a negative growth drag indicates that there is no significant constraint on ED.
(4)
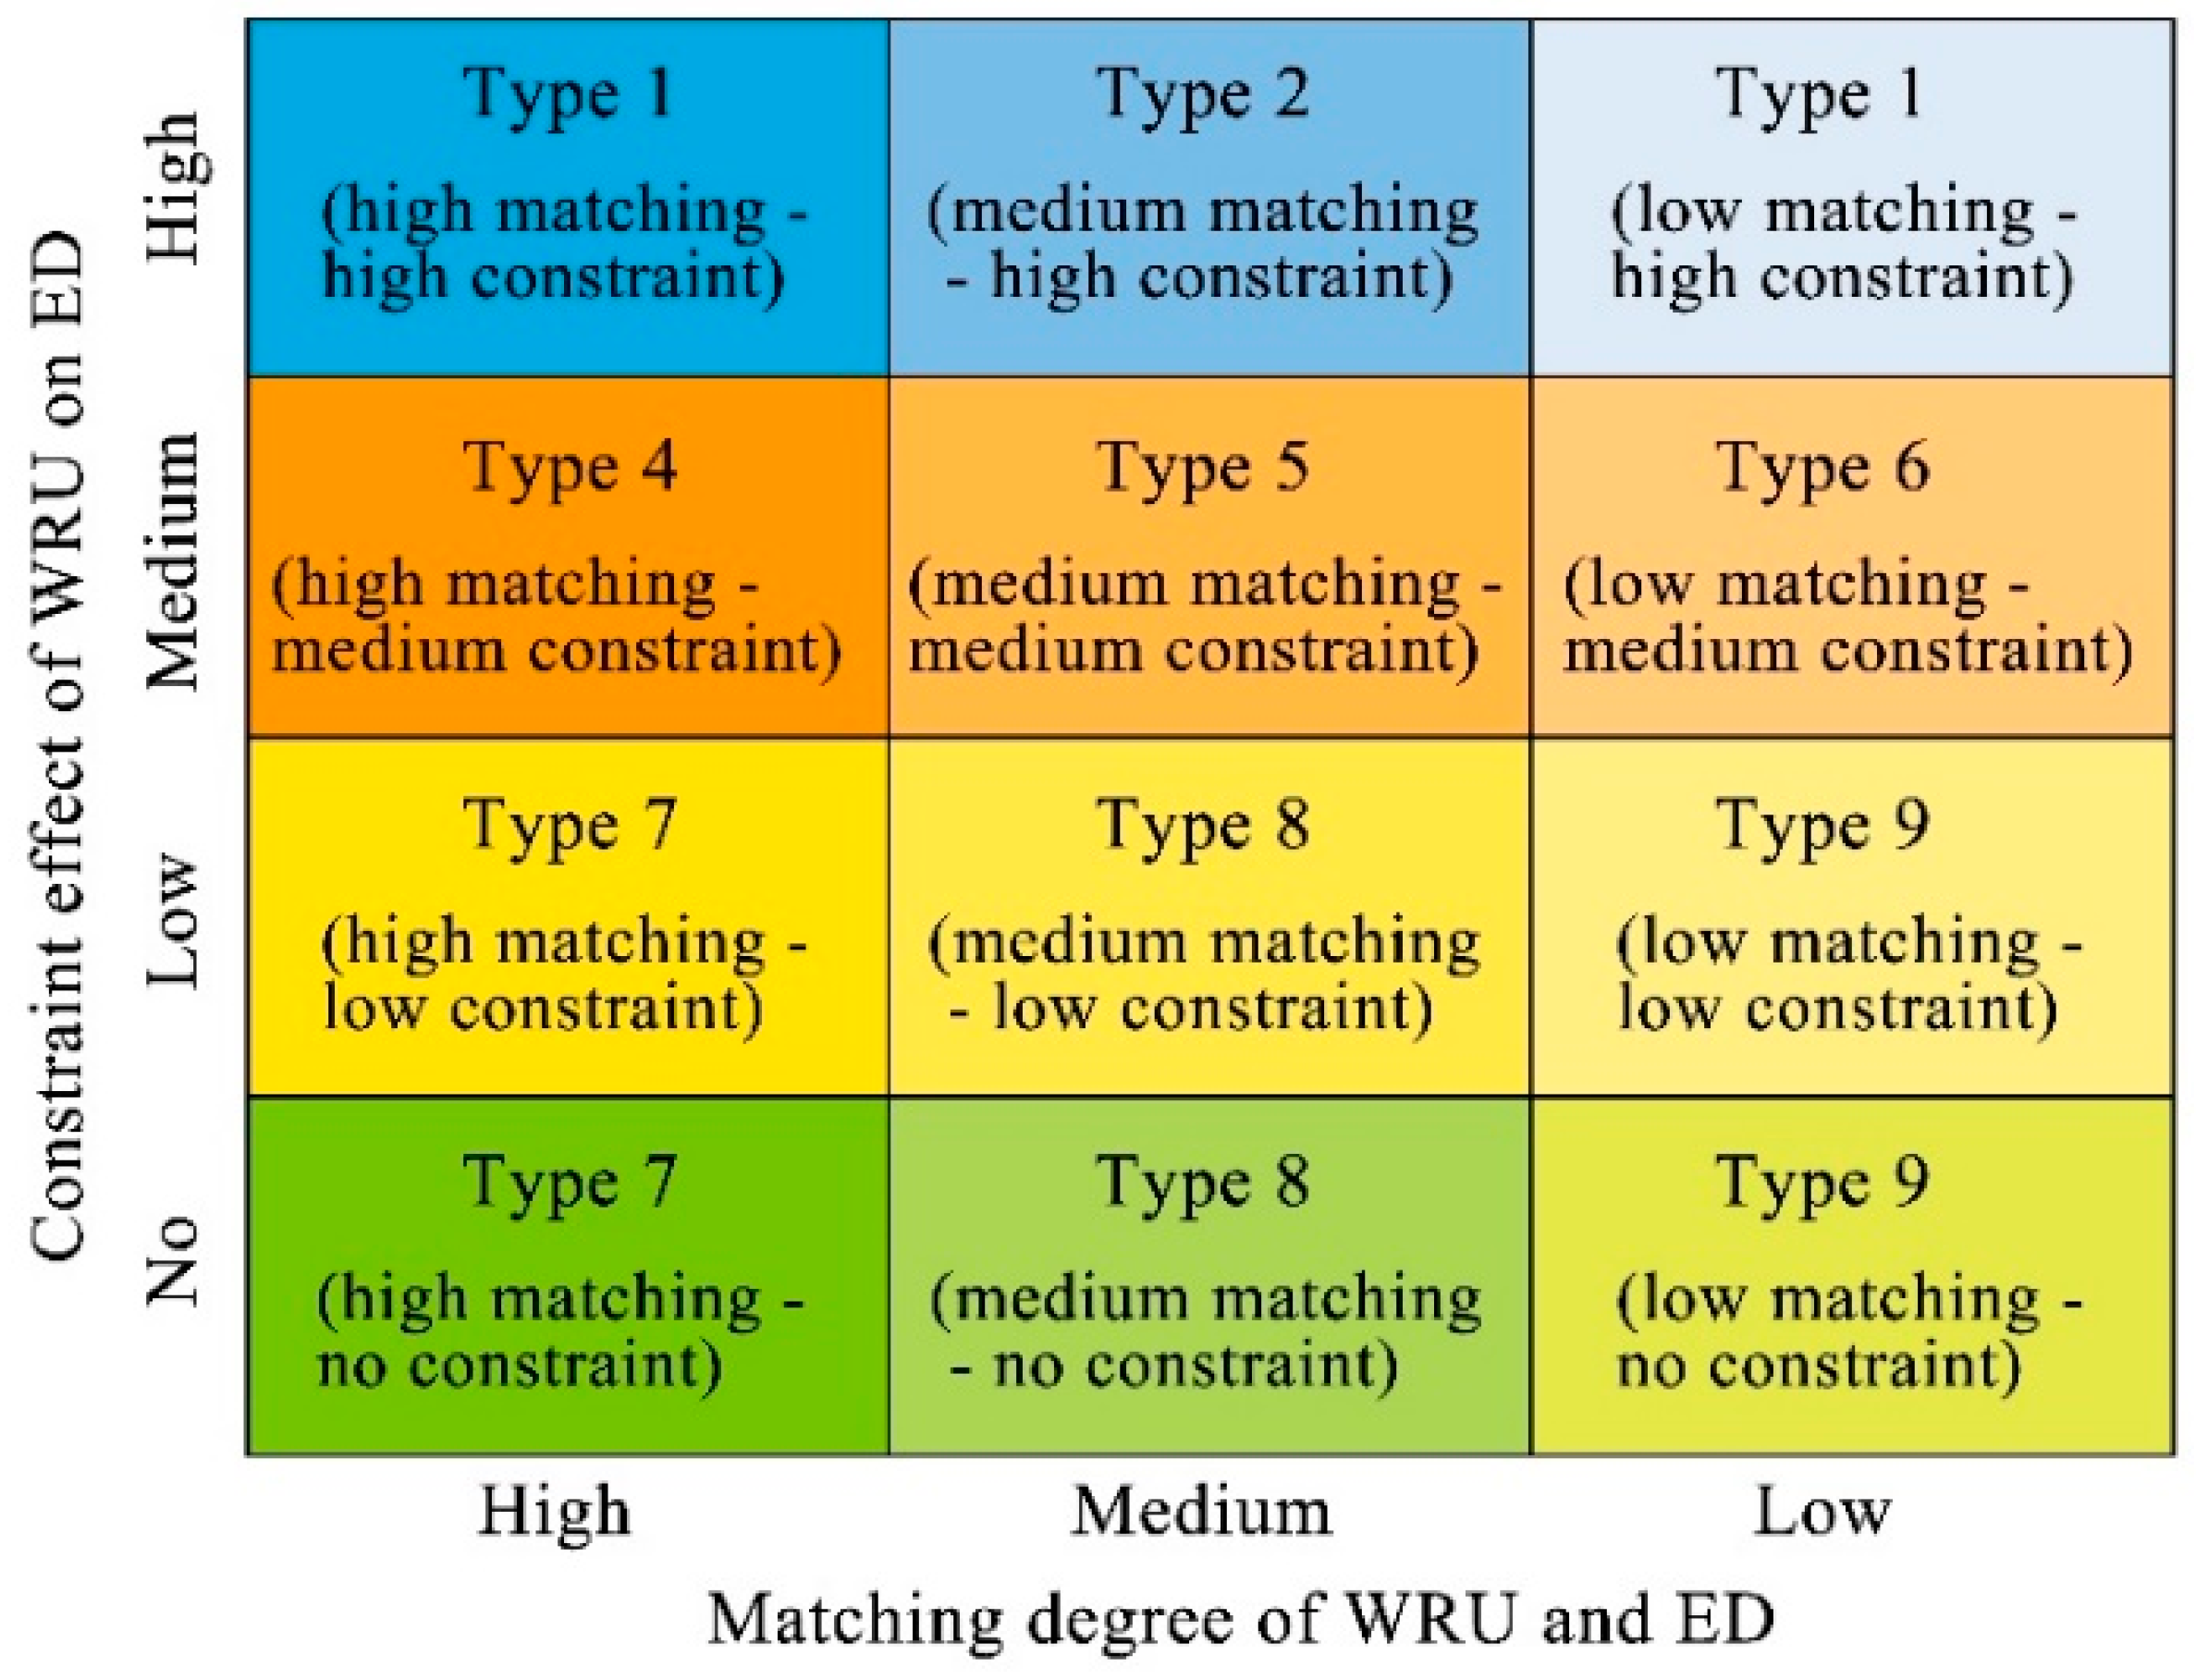
Classification of urban “matching-constraint” types
The matching degree of urban WRU and ED in the northwest arid region and the degree of constraint of WRU on ED are important bases for classifying the zoning of WRU status and identifying WRU problems in the northwest arid region. The natural breaks method is a grading and classification method that uses the distribution of numerical statistics to maximize the difference between classes [50]. Therefore, we used the natural breaks method to classify the matching degree of WRU and ED into three classes and the degree of constraint of WRU on ED into four classes. By introducing a two-dimensional Cartesian coordinate system, it is theoretically possible to obtain 12 types of “matching-constraint” for urban WRU and ED (Figure 3).

3. Results

3.1. Matching Analysis of Water Resources Utilization and Economic Development

The changes in the water resources–GDP Gini coefficients of the five northwestern provinces from 2009 to 2019 varied significantly (Table 1). The water resources–GDP Gini coefficients of Shaanxi and Xinjiang generally showed an overall decreasing trend, while the Gini coefficients of Qinghai and Ningxia showed a fluctuating increase. The Gini coefficient of Gansu continued to rise and exceeded 0.5 in 2017. Further calculations of the average Gini coefficients for the five provinces over the study period revealed a polarization in the matching degree of WRU and ED in the five provinces. In Shaanxi, Qinghai, and Ningxia, the water resources–GDP Gini coefficients were all below the warning line of 0.4. The matching degrees of WRU and ED in these three provinces were “general matching”, “general matching”, and “relative matching”, respectively. The water resources–GDP Gini coefficients for the Gansu and Xinjiang provinces were well above the warning line, and the matching degrees of WRU and ED in these two provinces were “relative mismatching” and “extremely mismatching”, respectively.
The water–GDP imbalance index showed a fluctuating downward trend for 70.59% of cities in the northwest arid region from 2009 to 2019. The remaining cities showed varying degrees of imbalance index increases (Figure 4). Jinchang exhibited the largest change in the water resources–GDP imbalance index, which increased from 0.08 in 2009 to 1.55 in 2019, representing an increase of 1837.50%. The reason for this phenomenon is that Jinchang is a typical resource-based industrial and mining city dominated by a non-ferrous metallurgical economy. After years of large-scale mining, the combined constraints of the imbalance between mineral resource storage and extraction and international nickel prices have made ED less dynamic, and GDP growth has become negative. Jinchang is unable to support the efficient utilization of water resources in this ED condition, and water consumption is increasing annually. Jinchang’s water consumption proportion has gradually exceeded its GDP proportion since 2012, resulting in a continued reduction in the matching degree of WRU and ED. Bortala has seen the greatest reduction in its water resources–GDP imbalance index. Its water resources–GDP imbalance index decreased from 0.25 to 0.04 between 2009 and 2019, representing a decrease of 85.25%. Since the Xinjiang regional government issued preferential policies to support the development of tourism in 2011, Bortala has actively developed and nurtured its tourism industry, which has developed well and has become a strong driver of economic growth. Bortala’s economy has developed well, and by 2019, the proportion of GDP and water consumption was essentially the same, 2.71% and 2.81%, respectively. This shows that when a city’s water utilization proportion is greater than its GDP proportion, its ED is faster and its WRU and ED matching degree is more optimized. This result is consistent with the findings of Han et al. [26]. In this study, we also calculated the average water resources–GDP imbalance index for each city and used the natural breaks method to classify the high matching type (0 <imbalance index ≤ 0.67), medium matching type (0.67 < imbalance index ≤ 1.62), and low matching type (imbalance index > 1.62). Our results showed that cities with the high matching type of WRU and ED were dominant overall, accounting for 60.78% of cities. Cities in the medium matching type were the next most important, accounting for 21.57% of cities. Nine cities (Hanzhong, Jiuquan, Zhangye, Hainan, Urumqi, Altay, Aksu, Kashgar, and Hotan) were in the low matching type, accounting for 17.65% of cities.

3.2. Constraint Effect of Water Resources Utilization on Economic Development

3.2.1. Analysis of the Output Elasticity of Factors

During the ED process, different provinces in the northwest arid region developed different patterns and structures of water utilization. In this study, we followed the research method of An et al. [34] and employed the ridge regression method to calculate the output elasticity of water consumption, capital, and labor force for the five northwestern provinces from 2009 to 2019. The results showed that models were effective and all of the model fits were higher than 98% (Table 2). The ridge regression results showed that the elasticity of water resources output in the five northwestern provinces did not differ significantly and was higher than 0.20 in all provinces. This shows that water resources have a positive effect on the ED of the northwest arid region. Compared with water resources, capital and labor factors made a stronger contribution to ED in the northwest arid region. The output elasticity ratio of the capital and labor factors in the five northwest provinces was close to 1:1. This indicates that the northwest arid region economy as a whole is at a capital-intensive and labor-intensive stage, and continued investment in capital and labor can still promote regional development to a large extent.

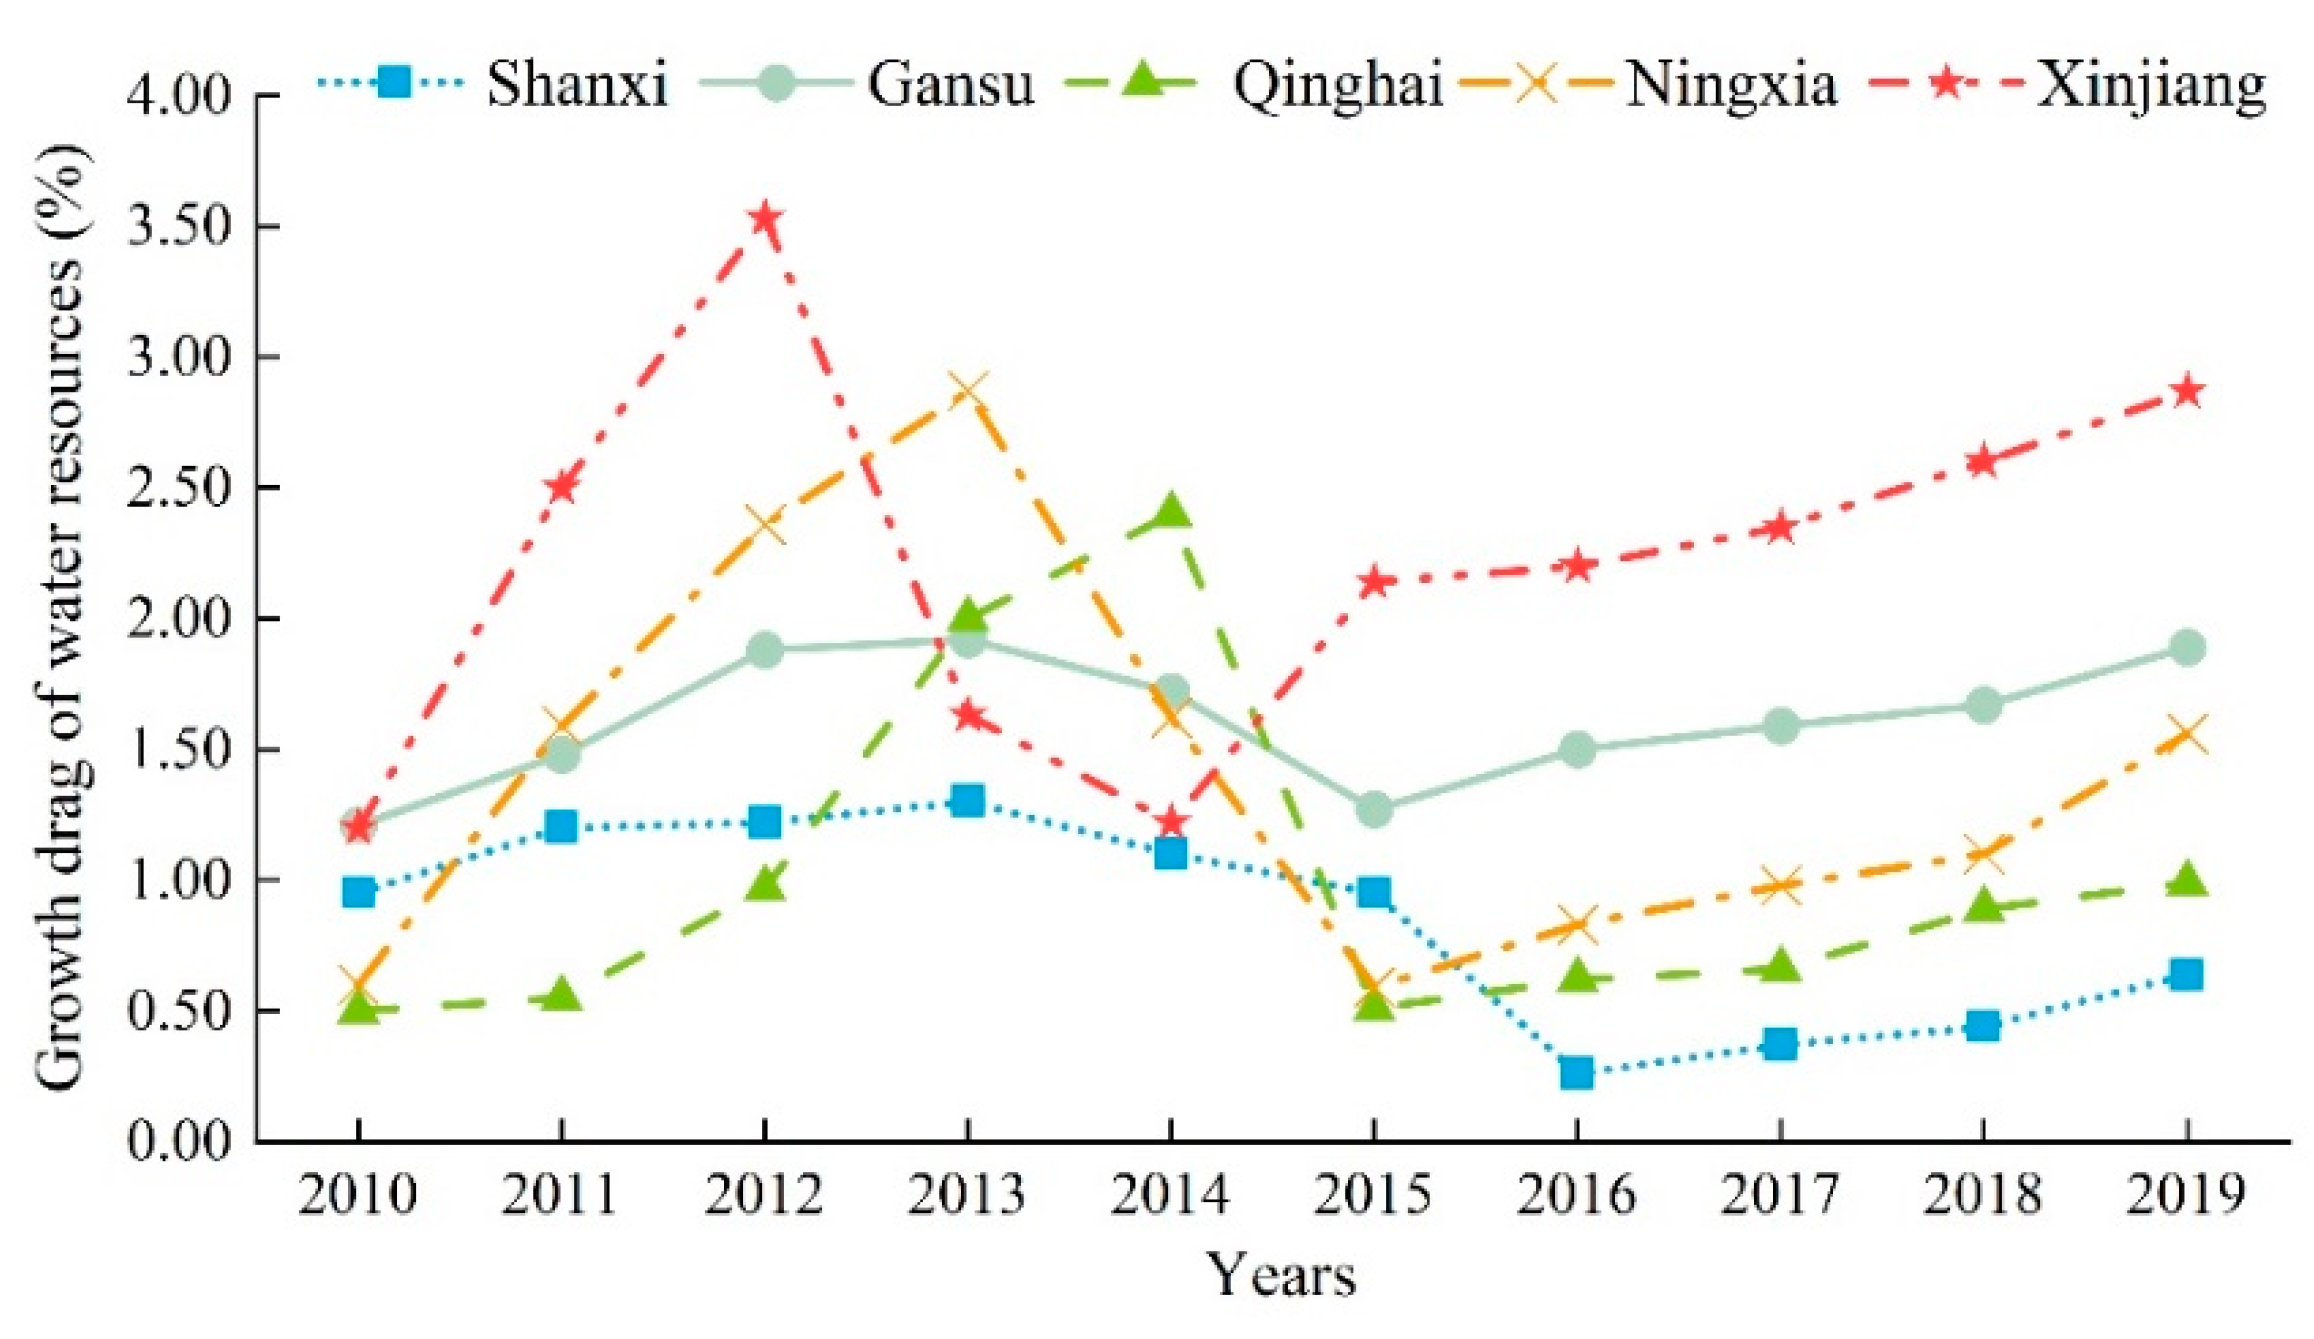
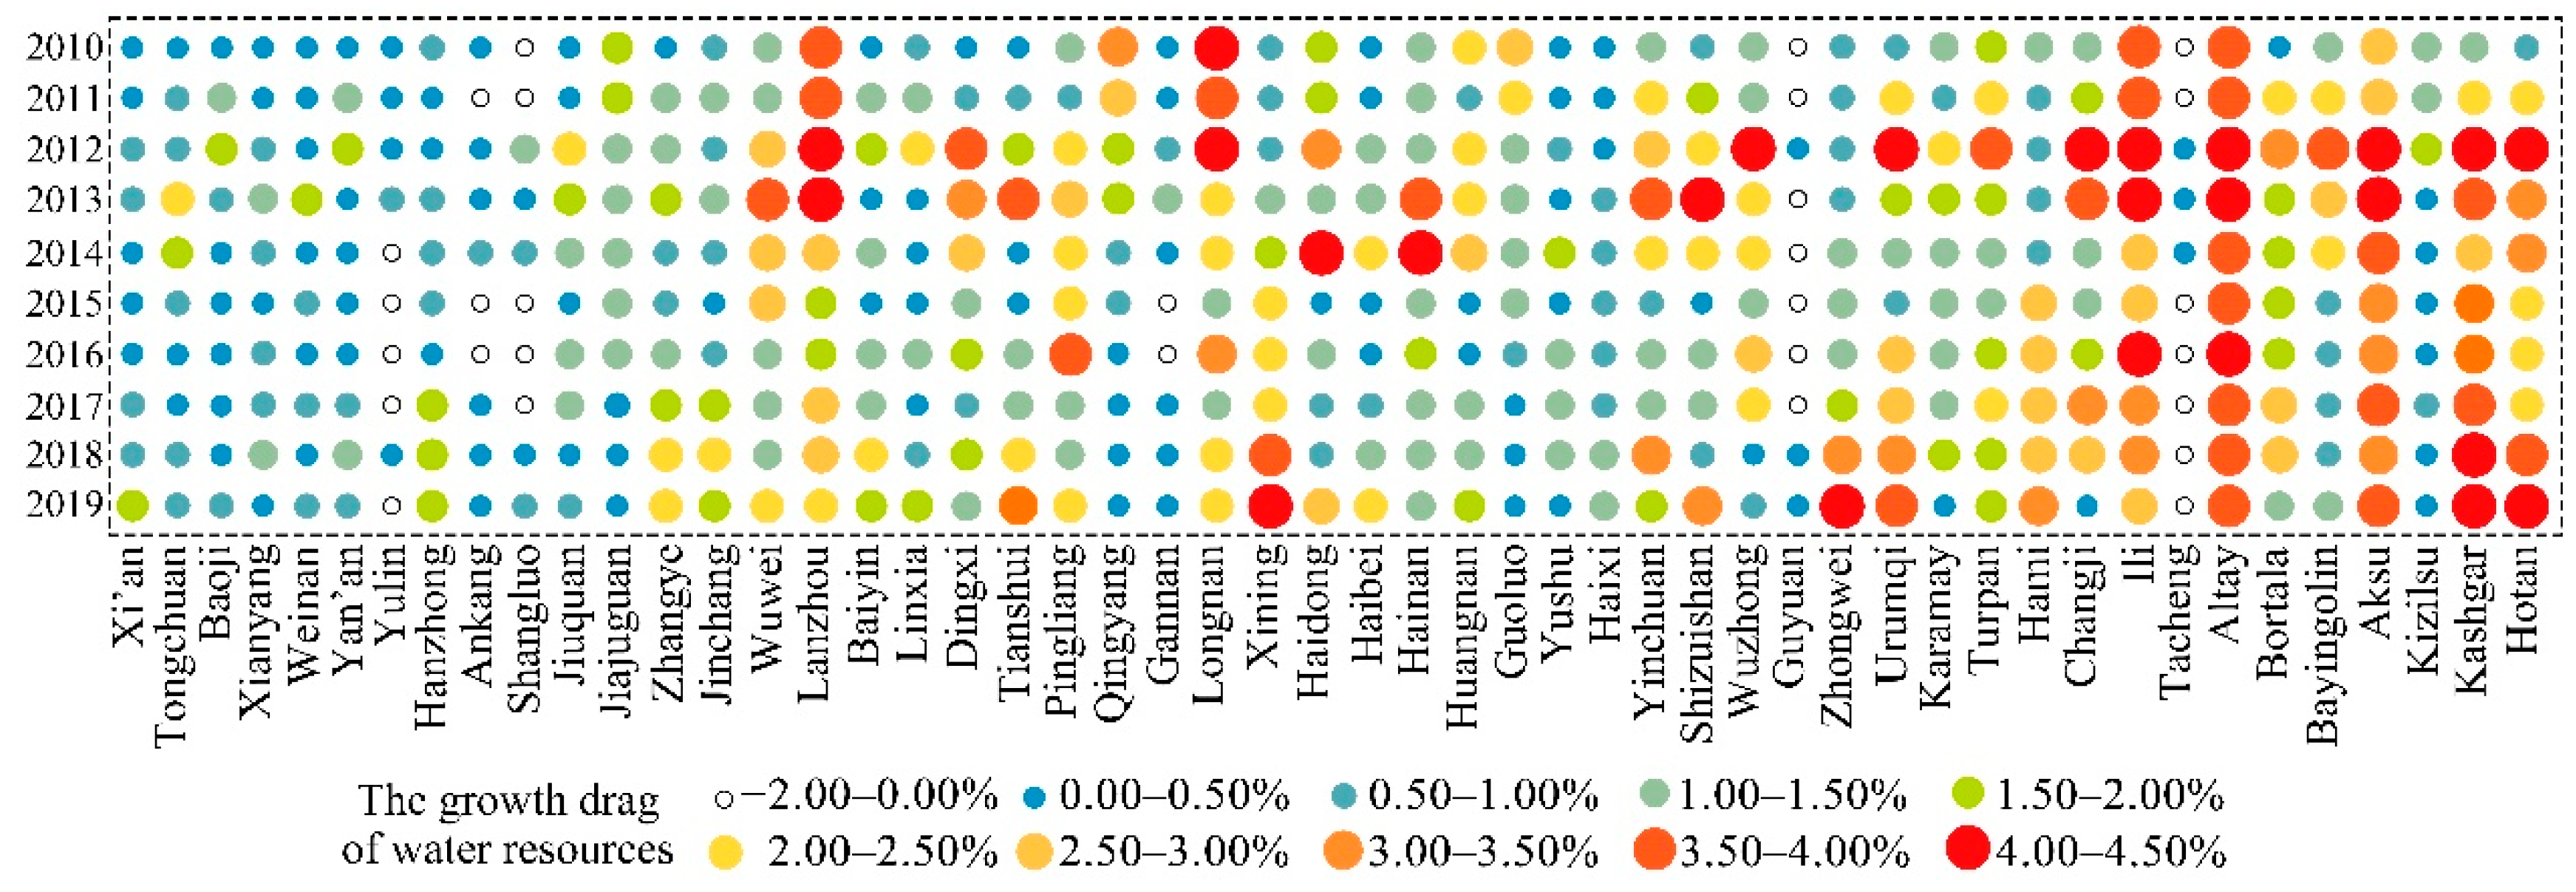
3.2.2. Analysis of the Growth Drag of Water Resources

At the provincial level, the growth drag of water resources in the five provinces showed an “N-shaped” curve of rise–fall–rise over the study period (Figure 5). Specifically, the growth drag of water resources in the five provinces reached an inflection point around 2013, and WRU became less of a constraint on ED in the period after that. The main reason for this change was the substitution effect of technological innovation on water resources. However, the substitution effect of science and technology is limited and temporary. The constraining effect of WRU on ED continued to increase in the five provinces from 2016 to 2019, and the increase accelerated annually. In recent years, regional development strategies such as Western Development and the “Belt and Road” construction have provided important impetus to the ED of the northwest arid region. As the ED and living standards of people in the northwest arid region continue to rise, the demand for water continues to grow. However, owing to the implementation of the strictest water resources management system, the total amount of water used in the northwest arid region is under strict control. These strict measures combined with the low efficiency of WRU in the northwest arid region make it difficult to compensate for the shortcomings caused by the lack of water supply, resulting in an increasingly severe constraint on the ED of the northwest arid region’s WRU. The average growth drag of water resources in the five northwestern provinces was ranked as follows: Xinjiang (2.22%), Gansu (1.61%), Ningxia (1.41%), Qinghai (1.01%), and Shaanxi (0.84%). The average growth drag of water resources in all five provinces was greater than the Chinese average growth drag of water resources of 0.15% [31], proving that water resources have a significant constraining effect on ED in the northwest arid region. Xinjiang was the most severely constrained by water resources in its ED process, much more so than other provinces. On the one hand, Xinjiang’s water resources endowment is insufficient. Despite the transfer of water from external basins, the region is still severely deprived of water resources and suffers from poor water resources infrastructure and WRU rates, leading to wastage of water resources. On the other hand, heavy industry and irrigated agriculture, which are highly water-intensive, are proving important for the ED of Xinjiang. This high dependence on water resources has put enormous pressure on Xinjiang’s ED.
At the prefecture level, Figure 6 shows the year-to-year changes in the water resources growth drag of each city in the northwest arid region from 2010 to 2019. The trend in the growth drag of water resources in 44 of the 51 cities in the northwest arid region remained consistent at the provincial level over the study period. The growth drag coefficients of these cities exhibited a rising–declining–rising trend. The growth drag coefficients exhibited a continuous decline in Jiayuguan, Qingyang, and Guoluo. Jiayuguan, Qingyang, and Guoluo are important fulcrums of ecological security barriers of the Qilian Mountain, Yellow River Basin, and Sanjiangyuan, respectively. All three cities are burdened with ecological protection, attach great importance to the ability to contain water in the region, and vigorously promote the construction of a water-saving society, with an average annual water resources growth rate of no more than 3.41%. In addition, these three cities suffer from serious population losses caused by lagging ED, with the labor growth rate showing a continuous decline and reduced water demand, which has, to some extent, alleviated the constraining effect of water resources in the three cities. The four cities of Xining, Haixi, Zhongwei, and Hami continued to see an increase in their growth drag coefficients. This is mainly due to the new development opportunities offered in these cities by the “Belt and Road” construction. As major projects and programs come to fruition, the economic benefits of these projects attract more labor, thereby boosting regional employment. However, this has also led to a rapid increase in water demand, which has intensified the conflict between water supply and demand and has increased the severity of water constraints on these cities’ ED.
To provide a more direct indication of the spatial distribution of WRU constraints on ED, we used the natural breaks method to classify the degree of WRU constraints on ED in cities into four types after calculating the average growth drag of water growth for each city (Figure 7, Table 3). These types included no constraint (growth drag coefficient < 0), low constraint (0 ≤ growth drag coefficient < 1.00%), medium constraint (1.00% ≤ growth drag coefficient < 2.00%), and high constraint (growth drag coefficient ≥ 2.00%). The degree of constraints on ED imposed by WRU in the northwest arid region generally showed a “decreasing inland to coastal” pattern. Six cities (Yulin, Ankang, Shangluo, Gannan, Guyuan, and Tacheng) were in the no constraint type, accounting for 11.76% of the total. The ED of cities in this type was not constrained by water resources. The largest number of cities in the low and medium constraint types was 38, with a total proportion of 74.51%. The high constraint type, comprising 13.73% of cities, included Lanzhou, Longnan, Yili, Altay, Aksu, Kashgar and Hotan. These seven cities were the most constrained by water resources in the northwest arid region and were also the areas where the conflict between WRU and ED was most pronounced.

3.3. Status Zoning of Water Resources Utilization

Taking into account the results of the matching degree and degree of constraint between the WRU and ED of 51 cities in the northwest arid region, we obtained eight types of “matching-constraint” between WRU and ED. Cities of similar types were then further grouped together according to their “matching-constraint” types, resulting in a total of four types of WRU status zones (Figure 8). Zone I involved both the high matching–no constraint type and the high matching–low constraint type and contained 17 cities, accounting for 33.33% of the total. The WRU status of cities in this zone was the best among the four types of zones, and was mainly characterized by reasonable water resources allocation, low or no rigid constraints on water resources, and a growth drag of water resources below 0.80%. Zone II contained two types of cities, medium matching–low constraint and medium matching–medium constraint, with a total of 11 cities and a proportion of 21.57%. There was a mild imbalance between the urban WRU and ED in this zone. Wuwei, Shizuishan, Weinan, Jinchang, Baiyin, Haixi, Kizilsu, and Bayingolin had a higher water consumption share than GDP share, whereas the opposite was observed in Pingliang, Qingyang, and Karamay. The cities within this zone were affected by water resource constraints that reduced the annual average rate of urban economic development by 0.12–1.47%. Zone III contained two types of cities, low match–medium constraint and low match–high constraint, with nine cities—accounting for 17.65% of cities. There was a serious imbalance between urban WRU and ED within this zone. All cities had a much higher water consumption share than GDP share, with low water resources efficiency and serious water waste problems. The average annual rate of ED in cities under the influence of water resources constraints was reduced by 1.03–2.90%. Zone IV contained high matching–medium constraint and high matching–high constraint cities, with a total of 14 cities and a proportion of 27.45%. The state of urban water allocation in the region was relatively good; however, the water demand gap was still large, resulting in a severe constraint on ED that emerged from the WRU. The average annual rate of ED in these cities decreased by 1.10–2.30% due to water resources constraints.

4. Discussion

4.1. Comparison with Previous Studies

In this study, the research framework of the spatiotemporal evolution of WRU and ED was constructed based on the “matching-constraint” perspective, providing a new perspective for the study of the evolutionary relationship between WRU and ED and filling the gap in research on the water resource drag effect in the northwest arid region. We found that the matching degree of WRU and ED showed a polarization trend, and the evolution of the matching degree was related to regional water resource endowment and economic growth rate in the northwest arid region. Li et al. [51] and Han et al. [26] proposed similar results, thus proving the accuracy and reliability of the study. Zhu et al. [52] found that the matching degree of WRU and ED in various cities and autonomous prefectures of Kazakhstan showed a trend of first rising and then declining from 1995 to 2015, and the matching degree of most cities and autonomous prefectures decreased to an extremely mismatched state in 2015. Kazakhstan has a climate similar to that of the northwest arid region and has an important relationship with trans-boundary waters. Our study results showed that the matching degree of WRU and ED in Shaanxi, Qinghai, and Ningxia was better than that in Kazakhstan in 2015. Gansu and Xinjiang were also in an extremely mismatched state; however, the matching state of Xinjiang showed a significant declining trend. This indicates that the strictest water resource management system implemented in the northwest arid region was quite effective, and it must be kept in the future and focused on improving the matching degree of WRU and ED in Gansu Province. Zhang et al. [31], Pan et al. [27], Peng et al. [32], and Shen et al. [53] applied the growth drag model to prove that the economic growth rates in China, the Chengdu Chongqing urban agglomeration, the Hengduan Mountains, and the Yangtze River Economic Belt declined annually by 0.15%, 0.70%, 1.20%, and 0.03%, respectively, from 2006 to 2016 due to water resource constraints. Our study showed that the water resource drag effect of 49.02% of cities was more than 1.03% in the northwest arid region, and the water resource drag effect of the cities with the most severe water resource constraint was 2.90%, which is approximately 19 times the average level of China, and shows an increasing trend. Therefore, compared with other regions of China, the ED of the northwest arid region is more seriously restricted by water resources, requiring effective mitigation.

4.2. Analysis of Driving Mechanism

The northwest arid region is an important ecological barrier and ecological function area in China and has an important function in the optimization of the ecological security barrier system and providing strategic ecosystem services for the country [54]. Research on WRU and sustainable ED in the northwest arid region cannot ignore this important ecological status. Therefore, the economic and social development of the northwest arid region and the optimization of water resource inputs must be carried out in an in-depth manner in accordance with the ecological civilization strategy. Under the control of the “three lines and one list” and the strictest water resources management system, water resources and land space should be used in a scientific and reasonable manner. In addition, the two major development strategies of Western Development and “Belt and Road” construction provide new opportunities for the use of resources, capital investment, and employment of labor in the northwest arid region. It is important to focus on the economic benefits and chain effects brought about by the Western Development and the “Belt and Road” construction for the efficient use of water resources and ED in the northwest arid region.
The results of the study showed that 17.65% of the cities in the northwest arid region exhibited a low match between WRU and ED. Moreover, the constraining effect of WRU on ED was much higher in the northwest arid region than the Chinese average. This means that the way water resources are used in the northwest arid region needs to be optimized and adjusted. Therefore, cities in Zone I should prioritize promoting water conservation and vigorously promote the successful experience and advanced technology of WRU in the cities, thus giving full impetus to the leading role of other zones. In cities in Zone II, which are all resource-based [55], the development of water-intensive industries should be strictly controlled and low-water-consumption and high-efficiency industries should be actively explored and cultivated, with the aim of improving the utilization rate of water resources, especially the reuse rate of industrial water and the development of a circular economy. The focus of Zone III should be on improving the efficiency of the WRU. Water conservation in agriculture is key to the efficient use of water resources in arid zones [9]. Cities in Zone III should vigorously promote the application of high-efficiency, water-saving irrigation technology, facilitate the restructuring of agricultural cultivation and intensive agricultural production, and improve WRU efficiency. Cities in Zone IV should focus on the construction and maintenance of water infrastructure and inter-basin water transfer projects and actively promote the use of unconventional water sources to store more water resources to fill the water gap in the ED process. In addition, research has shown that sustained investment in capital and labor can yield positive ED in the northwest arid region. Therefore, in terms of capital investment, cities should seize major opportunities for development, seek policy and financial support for major national infrastructure and other projects, promote the rapid implementation of projects (especially water infrastructure construction projects), and promote the ED of the northwest arid region in a high-priority manner. In terms of labor, cities should maintain it in moderate sizes. For example, cities such as Yulin and Ankang with a negative growth drag of water resources have a surplus of water resources, in which case they need to actively attract labor from surrounding areas to promote their ED. Other cities need to strictly control their labor force growth rates. Meanwhile, cities should also focus on improving labor productivity through education and skills training, and further improve their talent development systems to provide a flow of high-end talent support for green and high-quality development in the northwest arid region [56]. Another point worth noting is that, according to the calculation of the growth drag of water resources (Equation (8)), the growth drag of water resources was directly proportional to the elasticity coefficient of the factor. It is particularly important for the northwest arid region to reduce the elasticity coefficient of water resources. This means that paying full attention to the alternative role of science and technology in water resources is essential. Using technological innovation to reduce the dependence of ED in the northwest arid region on the amount of water resource inputs can fundamentally alleviate the role of water resource constraints.
The above measures can promote the optimal allocation of water resources in the arid area of northwest China and improve the utilization efficiency of water resources to support the sustainable development of the regional economy, consolidate the achievements of poverty eradication, and alleviate the problem of relative poverty. In addition, the ecological environment in the northwest arid region is extremely fragile, and water resources are a key factor in maintaining ecosystem stability [57]. However, there is fierce competition for water resources between economic development and ecological protection in the northwest arid region, and the ecological water in this area has long been occupied by other water-use fields such as agriculture, which has a negative impact on the health of the ecosystem [58]. Aiming to coordinate economic growth and ecological protection and realize sustainable development, governments at all levels in the northwest arid region must give full play to the leading role of policies and strictly implement the control measures of “nature first, and equal emphasis on ecological protection and development”. It is necessary to pay more attention to ecological water rights, reduce agricultural water use through water-saving technology to compensate for the shortage of ecological water, do a good job in water pollution prevention and control, improve ecological compensation mechanisms, avoid ecological deterioration, and protect regional biodiversity (Figure 9).

4.3. Limitations

This study has some limitations. The water resources growth drag model mainly refers to the approach of Zhang et al. and Peng et al. [31,32], which identifies effective labor as the product of labor input and technological progress. However, this approach has shortcomings in explaining the endogeneity problem. This may lead to deviations between the results and reality, and further optimization is required to improve the accuracy of the research results. In addition, in this study, we only examined the spatiotemporal evolution of the total WRU and ED in the northwest arid region. However, water resources can be subdivided into different types (agricultural, industrial, and domestic water). The evolution of the relationship between different types of WRU and regional ED has not yet been clarified.

5. Conclusions

Water is the lifeline for sustainable development in the northwest arid region, but the process of ED in the northwest arid region faces a huge threat of water scarcity and irrational use of water resources. In this study, we quantified the spatiotemporal evolution of WRU and ED in the northwest arid region from a new perspective of “matching-constraint”. We systematically investigated the spatiotemporal evolution of the matching degree and the degree of constraints between WRU and ED in the northwest arid region from 2009 to 2019 and divided the WRU status into zones. The main conclusions are as follows: (1) The matching degree of WRU and ED in the northwest arid region showed polarization, and the matching degree of most cities is gradually improving. (2) WRU had a significant constraint effect on ED in the northwest arid region. Overall, the growth drag of water resources in the northwest arid region showed an “N-shaped” change and a spatial pattern of “decreasing from in-land to coastal” during the study period. (3) There was a great difference in the WRU status between cities in the northwest arid region. Cities in the four zones should adjust and optimize the WRU and ED mode according to local conditions, attach importance to ecological environment protection, and promote sustainable development. This study provided a new perspective and study idea for the research on the relationship between regional WRU and ED. More importantly, in practice, to systematically quantify the matching degree and constraint effect of regional WRU and ED, the framework of this study can provide an important reference for the governments to learn about the real state of WRU at the regional level. It can also provide scientific guidance for formulating optimization measures of WRU, alleviating rigid constraints of water resources in economic growth, promoting ecological environment protection, and realizing sustainable and high-quality development.

Author Contributions

J.D. was responsible for data collection and writing; Y.B. proposed the research ideas and methods of the manuscript; X.Y. and Z.G. were responsible for creating the figures and forms. All authors have read and agreed to the published version of the manuscript.

Funding

This research was funded by the Project of the National Natural Science Foundation of China (40771054), Key R&D Program of Gansu Province, China (18YF1FA052), Foundation of Key Talent Projects of Gansu Province (No. 2021RCXM073), and the Foundation of Key Projects of Natural Science of Gansu Province (No. 21JR7RA278 and 21JR7RA28121).

Institutional Review Board Statement

Not applicable.

Informed Consent Statement

Not applicable.

Data Availability Statement

Not applicable.

Acknowledgments

Thanks to the hard-working editors and valuable comments from reviewers.

Conflicts of Interest

The authors declare no conflict of interest.

References

  1. Gleeson, T.; Wada, Y.; Bierkens, M.F.P.; Van Beek, L.P.H. Water Balance of Global Aquifers Revealed by Groundwater Footprint. Nature 2012, 488, 197–200. [Google Scholar] [CrossRef]
  2. Yang, F.; Wang, D.; Zhao, L.; Wei, F. Efficiency Evaluation for Regional Industrial Water Use and Wastewater Treatment Systems in China: A Dynamic Interactive Network Slacks-Based Measure Model. J. Environ. Manag. 2021, 279, 111721. [Google Scholar] [CrossRef]
  3. Maryam, S. Global Water Shortage and Potable Water Safety; Today’s Concern and Tomorrow’s Crisis. Environ. Int. 2022, 158, 106936. [Google Scholar]
  4. UNESCO. The United Nations World Water Development Report 2018; UNESCO: Paris, France, 2018; pp. 1–20. [Google Scholar]
  5. Xu, X.C.; Zhang, Y.Y.; Chen, Y.M. Projecting China’s Future Water Footprint under the Shared Socio-Economic Pathways. J. Environ. Manag. 2020, 260, 110102. [Google Scholar] [CrossRef] [PubMed]
  6. UNESCO. The United Nations World Water Development Report 2020; UNESCO: Paris, France, 2020; pp. 1–25. [Google Scholar]
  7. Zhang, P.; Deng, M.; Long, A.; Deng, X.; Wang, H.; Hai, Y.; Wang, J.; Liu, Y. Coupling analysis of social-economic water consumption and its effects on the arid environments in Xinjiang of China based on the water and ecological footprints. J. Arid Land 2020, 12, 73–89. [Google Scholar] [CrossRef] [Green Version]
  8. Chen, Y.N.; Li, B.F.; Li, Z.; Li, W.H. Water Resource Formation and Conversion and Water Security in Arid Region of Northwest China. J. Geogr. Sci. 2016, 26, 939–952. [Google Scholar] [CrossRef] [Green Version]
  9. Liu, X.; Shi, L.; Engel, B.A.; Sun, S.; Zhao, X.; Wu, P.; Wang, Y. New Challenges of Food Security in Northwest China: Water Footprint and Virtual Water Perspective. J. Clean. Prod. 2020, 245, 118939. [Google Scholar] [CrossRef]
  10. Mu, L.; Fang, L.; Dou, W.; Wang, C.; Qu, X.; Yu, Y. Urbanization-Induced Spatio-Temporal Variation of Water Resources Utilization in Northwestern China: A Spatial Panel Model Based Approach. Ecol. Indic. 2021, 125, 107457. [Google Scholar] [CrossRef]
  11. Chen, W.; Sun, F.; Ma, Q. Blue Book of Northwestern China: Northwestern China Development Report 2020; Social Sciences Academic Press: Beijing, China, 2020; pp. 38–42. [Google Scholar]
  12. Bao, C.; Zou, J.J. Analysis of Spatiotemporal Changes of the Human-Water Relationship Using Water Resources Constraint Intensity Index in Northwest China. Ecol. Indic. 2018, 84, 119–129. [Google Scholar] [CrossRef]
  13. Han, X.; Zhao, Y.; Gao, X.; Jiang, S.; Lin, L.; An, T. Virtual Water Output Intensifies the Water Scarcity in Northwest China: Current Situation, Problem Analysis and Countermeasures. Sci. Total Environ. 2021, 765, 144276. [Google Scholar] [CrossRef]
  14. Jia, Y.; Shen, J.; Wang, H.; Dong, G.; Sun, F. Evaluation of the Spatiotemporal Variation of Sustainable Utilization of Water Resources: Case Study from Henan Province (China). Water 2018, 10, 554. [Google Scholar] [CrossRef] [Green Version]
  15. Wang, X.; Dong, Z.; Xu, W.; Luo, Y.; Zhou, T. Study on Spatial and Temporal Distribution Characteristics of Coordinated Development Degree among Regional Water Resources, Social Economy, and Ecological Environment Systems. Int. J. Environ. Res. Public Health 2019, 16, 4213. [Google Scholar] [CrossRef] [PubMed] [Green Version]
  16. Malakar, K.; Mishra, T.P.A. Inequality in Water Supply in India: An Assessment Using the Gini and Theil Indices. Environ. Dev. Sustain. 2018, 20, 841–864. [Google Scholar] [CrossRef]
  17. Yang, G.Y.; Li, S.Y.; Wang, H.; Wang, L. Study on Agricultural Cultivation Development Layout Based on the Matching Characteristic of Water and Land Resources in North China Plain. Agric. Water Manag. 2022, 259, 107272. [Google Scholar] [CrossRef]
  18. Li, D.L.; Zuo, Q.T.; Zhang, Z.Z. A New Assessment Method of Sustainable Water Resources Utilization Considering Fairness-Efficiency-Security: A Case Study of 31 Provinces and Cities in China. Sustain. Cities Soc. 2022, 81, 103839. [Google Scholar] [CrossRef]
  19. Wiemer, S.; Daniele, C. Handbook of Income Distribution; Elsevier: Amsterdam, The Netherlands, 2015; pp. 1535–1727. [Google Scholar]
  20. Pius, B.; Yang, X.H.; Bian, D.H. Water Use Inequality and Efficiency Assessments in the Yangtze River Economic Delta of China. Water 2020, 12, 1709. [Google Scholar]
  21. Zhang, J.H.; Li, J.; Tang, Y. Analysis of the Spatio-Temporal Matching of Water Resource and Economic Development Factors in China. Resour. Sci. 2012, 34, 1546–1555. [Google Scholar]
  22. Xiong, Y.; Sun, W.J.; Wang, M.; Peng, Z.L.; Cui, Z.Z. Spatio-Temporal Matching between Water Resource and Economic Development Elements in Changsha-Zhuzhou-Xiangtan Urban Agglomeration. Econ. Geogr. 2019, 39, 88–95. [Google Scholar]
  23. Zhang, X.T.; Yu, F.W. Analysis of the Matching Status between Economic Development and Water Resources in the Yellow River Basin. China Popul. Resour. Environ. 2012, 22, 1–6. [Google Scholar]
  24. Wang, J.Q.; Qin, L.J.; He, H.S. Assessing Temporal and Spatial Inequality of Water Footprint Based on Socioeconomic and Environmental Factors in Jilin Province, China. Water 2019, 11, 521. [Google Scholar] [CrossRef] [Green Version]
  25. Ma, W.; Meng, L.; Wei, F.; Opp, C.; Yang, D. Spatiotemporal variations of agricultural water footprint and socioeconomic matching evaluation from the perspective of ecological function zone. Agric. Water Manag. 2021, 249, 106803. [Google Scholar] [CrossRef]
  26. Han, Y.; Jia, S.-f.; Lu, C.-x.; Lyu, A.-f. Spatiotemporal Matching between Water Resources and Social Economy: A case Study in Zhangjiakou. J. Nat. Resour. 2020, 35, 1392–1401. [Google Scholar]
  27. Pan, Y.C.; Ma, L.; Tang, H.; Wu, Y.; Yang, Z. Land Use Transitions under Rapid Urbanization in Chengdu-Chongqing Region: A Perspective of Coupling Water and Land Resources. Land 2021, 10, 812. [Google Scholar] [CrossRef]
  28. Nordhaus, W.D. Lethal model 2: The limits to growth revisited. Brook. Pap. Econ. Act. 1992, 2, 1–59. [Google Scholar] [CrossRef] [Green Version]
  29. Bruvoll, A.G.; Glomstrd, S.; Vennemo, H. Environmental drag: Evidence from Norway. Ecol. Econ. 1999, 30, 235–249. [Google Scholar] [CrossRef]
  30. Romer, D.; Chow, C. Advanced Macroeconomic Theroy; Mcgraw-Hill: New York, NY, USA, 1996. [Google Scholar]
  31. Zhang, Y.; Liu, W.X.; Zhao, M.J. The Drag Effect of Water Resources on China’s Regional Economic Growth: Analysis Based on the Temporal and Spatial Dimensions. Water 2020, 12, 266. [Google Scholar] [CrossRef] [Green Version]
  32. Peng, L.; Deng, W.; Tan, J.; Lin, L. Restriction of Economic Development in the Hengduan Mountains Area by Land and Water Resources. Acta Geogr. Sin. 2020, 75, 1392–1401. [Google Scholar]
  33. Li, M.H.; Zhou, L.; Zhou, Y.X. Research on Growth Drag of Water Resources on Grain Production-Metrological Inspection Based on Statistical Data from 2001 to 2016 in Shandong. J. Arid Land Resour. Environ. 2019, 33, 16–23. [Google Scholar]
  34. An, M.; Butsic, V.; He, W.; Zhang, Z.; Qin, T.; Huang, Z.; Yuan, L. Drag Effect of Water Consumption on Urbanization-A Case Study of the Yangtze River Economic Belt from 2000 to 2015. Water 2018, 10, 1115. [Google Scholar] [CrossRef] [Green Version]
  35. Lu, W.; Liu, W.; Hou, M.; Deng, Y.; Deng, Y.; Zhou, B.; Zhao, K. Spatial-Temporal Evolution Characteristics and Influencing Factors of Agricultural Water Use Efficiency in Northwest China-Based on a Super-DEA Model and a Spatial Panel Econometric Model. Water 2021, 13, 632. [Google Scholar] [CrossRef]
  36. Zhang, Y.; Liu, W.; Cai, Y.; Khan, S.U.; Zhao, M. Decoupling Analysis of Water Use and Economic Development in Arid Region of China- Based on Quantity and Quality of Water Use. Sci. Total Environ. 2020, 761, 143275. [Google Scholar] [CrossRef] [PubMed]
  37. Dang, X.W.; Zhou, L.; Hu, F.N.; Yuan, B.; Tang, J.J. The Multi-scale Direct and Indirect Effects of Urban Expansion of Guanzhong Plain Urban Agglomeration on Ecological Land. Acta Ecol. Sinica. 2022, 42, 3020–3023. [Google Scholar]
  38. Wang, R.; Chen, M.D. The Research on Overall Strategic Vision of Westward Opening Up in Western Region. China Soft Sci. Mag. 2013, 4, 69–78. [Google Scholar]
  39. Dong, H.W.; Feng, Z.M.; Yao, Y.Z.; Li, P.; You, Z. Sustainability assessment of critical natural capital: A case study of water resources in Qinghai Province, China. J. Clean. Prod. 2021, 286, 125532. [Google Scholar] [CrossRef]
  40. Si, X.H.; Bai, L.K.; Wang, J.K.; Tang, B.; Wang, L. Blue Book of Northwestern China: Northwestern China Development Report 2022; Social Sciences Academic Press: Beijing, China, 2022; pp. 121–161. [Google Scholar]
  41. Deng, M.J. “Three Water Lines” strategy: Its spatial patterns and effects on water resources allocation in northwest China. Acta Geogr. Sin. 2018, 73, 1189–1203. [Google Scholar]
  42. Wang, F.; Ma, Y.; Dong, J. Blue Book of Northwestern China: Northwestern China Development Report 2018; Social Sciences Academic Press: Beijing, China, 2018; pp. 39–41. [Google Scholar]
  43. Xiong, Y.; Jiang, N.; Li, J.Z.; Jiang, D.L.; Peng, Z.L. Study on Urban Moderate Scale of Changsha-Zhuzhou-Xiangtan Urban Agglomeration Based on the Water Resources Carrying. Econ. Geogr. 2016, 36, 76–81. [Google Scholar]
  44. Gini, C. Measurement of Inequality of Income. Econ. J. 1921, 31, 124–126. [Google Scholar] [CrossRef]
  45. Hu, Z.; Chen, Y.; Yao, L.; Wei, C.; Li, C. Optimal Allocation of Regional Water Resources: From A Perspective of Equity-Efficiency Tradeoff. Resour. Conserv. Recycl. 2016, 109, 102–113. [Google Scholar] [CrossRef]
  46. Jantzen, R.T.; Volpert, K. On the Mathematics of Income Inequality: Splitting the Gini Index in Two. Am. Math. Mon. 2012, 119, 824–837. [Google Scholar] [CrossRef] [Green Version]
  47. Ye, Y.M. Calculation and Analysis of Total Factor Productivity in China and Provinces. Economists 2002, 18, 115–121. [Google Scholar]
  48. Ke, S.Z.; Xiang, J. Estimation of the Fixed Capital Stocks in Chinese Cities for 1996-2009. Stat. Res. 2012, 29, 19–24. [Google Scholar]
  49. Xue, J.B.; Zhao, M.Z.; Zhu, Y.X. Growth Drag Effect, Factor Contribution Rate and Resource Redundancy-Analysis Based on Agriculture. Technol. Econ. 2017, 36, 65–74. [Google Scholar]
  50. Zhou, L.; Dang, X.W.; Mu, H.W. Cities Are Going Uphill: Slope Gradient Analysis of Urban Expansion and Its Driving Factors in China. Sci. Total Environ. 2021, 775, 145836. [Google Scholar] [CrossRef] [PubMed]
  51. Li, W.M.; Huang, C.Q. The Study of Matching Between Utilization of Water Resource and Economic Factors in the Northwest Arid Area of China. Water Sav. Irrig. 2018, 7, 88–93. [Google Scholar]
  52. Zhu, W.; Zhou, H.F.; Chai, C.H. Study on the Spatial-temporal Matching of Water Resources with Population, GDP in Kazakhstan. J. Irrig. Drain. 2019, 38, 101–108. [Google Scholar]
  53. Shen, X.M.; Xia, Y.X.; Jiang, M.D.; Xu, J.R.; Zheng, S.X. Damping Effect of Economic Growth in Yangtze River Economic Belt Under Water Resources Constraint. Chin. J. Environ. Manag. 2019, 5, 67–73. [Google Scholar]
  54. Wei, W.; Li, Z.; Xie, B.; Zhou, J.; Guo, Z. Spatial distance-based integrated evaluation of environmentally sensitivity for ecological management in northwest China. Ecol. Indic. 2020, 118, 106753. [Google Scholar] [CrossRef]
  55. Hu, B.W.; Zhou, L.; Wang, Z.H. Spatiotemporal Differentiation of Green Economic Efficiency of Resource-Based Cities in Arid Area. Resour. Sci. 2020, 42, 383–393. [Google Scholar] [CrossRef]
  56. Zhou, L.; Che, L.; Zhou, C.H. Spatio-temporal evolution and influencing factors of urban green development efficiency in China. Acta Geogr. Sin. 2019, 74, 2027–2044. [Google Scholar] [CrossRef]
  57. Yan, D.; Chen, L.; Sun, H.W.; Liao, W.H.; Chen, H.R. Allocation of Ecological Water Rights Considering Ecological Networks in Arid Watersheds: A Framework and Case Study of Tarim River Basin. Agric. Water Manag. 2022, 267, 107636. [Google Scholar] [CrossRef]
  58. Li, J.Y.; Cui, L.B.; Dou, M.; Akhtar, A. Water Resources Allocation Model Based on Ecological Priority in the Arid Region. Environ. Res. 2021, 199, 111201. [Google Scholar]
Figure 1. Study area.
Sustainability 14 08724 g001
Figure 2. Research framework.
Sustainability 14 08724 g002
Figure 3. “Matching-constraint” types of urban WRU and ED.
Sustainability 14 08724 g003
Figure 4. Urban imbalance index and matching degree of WRU and ED.
Sustainability 14 08724 g004
Figure 5. Growth drag of water resources in the five northwest provinces.
Sustainability 14 08724 g005
Figure 6. Changes in the growth drag of urban water resources.
Sustainability 14 08724 g006
Figure 7. Spatial distribution of urban water constraint types.
Sustainability 14 08724 g007
Figure 8. “Matching-constraint” types of urban WRU and ED and WRU status zones in the northwest arid region.
Sustainability 14 08724 g008
Figure 9. Schematic diagram of the driving mechanism of WRU and sustainable ED.
Sustainability 14 08724 g009
Table 1. Gini coefficient of water resources–GDP in the five northwest provinces.
Regions20092010201120122013201420152016201720182019Average
Shaanxi0.390.390.390.380.350.340.310.300.310.320.290.34
Gansu0.440.440.450.460.480.480.490.490.500.500.520.48
Qinghai0.300.360.340.320.320.340.340.340.320.290.310.33
Ningxia0.200.210.200.190.270.320.300.310.270.280.320.26
Xinjiang0.570.560.570.550.530.520.500.500.510.510.490.53
Table 2. Ridge regression estimation results.
RegionsCapital Production
Elasticity Coefficient
(α)
Labor Production
Elasticity Coefficient
(1 − α − β)
Water Consumption Production Elasticity Coefficient
(β)
R2
Shaanxi0.415 **0.314 **0.270 *0.984
Gansu0.414 **0.370 **0.213 *0.990
Qinghai0.397 **0.324 **0.274 **0.991
Ningxia0.429 **0.369 **0.201 *0.988
Xinjiang0.377 **0.325 **0.296 **0.992
Note: * and ** indicate significance at the 5% and 1% levels, respectively.
Table 3. Types of urban constraint.
Constraint TypeInvolved Cites
No constraint1. Yulin; 2. Ankang; 3. Shangluo; 4. Gannan; 5. Guyuan; 6. Tacheng
Low constraint1. Xi’an; 2. Tongchuan; 3. Baoji; 4. Xianyang; 5. Weinan; 6. Yan’an; 7. Jiayuguan; 8. Jinchang; 9. Baiyin; 10. Linxia; 11. Qingyang; 12. Haibei; 13. Guoluo; 14. Yushu; 15. Haixi; 16. Karamay; 17. Changji; 18. Bayingolin; 19. Kizilsu
Medium constraint1. Hanzhong; 2. Jiuquan; 3. Zhangye; 4. Wuwei; 5. Dingxi; 6. Tianshui; 7. Pingliang; 8. Xining; 9. Haidong; 10. Hainan; 11. Huangnan; 12. Yinchuan; 13. Shizuishan; 14. Wuzhong; 15. Zhongwei; 16. Urumqi; 17. Turpan; 18. Hami; 19. Bortala
High constraint1. Lanzhou; 2. Longnan; 3. Ili; 4. Altay; 5. Aksu; 6. Kashgar; 7. Hotan
Publisher’s Note: MDPI stays neutral with regard to jurisdictional claims in published maps and institutional affiliations.

