Article

Can Moderate Agricultural Scale Operations Be Developed against the Background of Plot Fragmentation and Land Dispersion? Evidence from the Suburbs of Shanghai

1
College of Surveying and Geo-Informatics, Tongji University, Shanghai 200092, China
2
School of Geography Science and Geomatics Engineering, Suzhou University of Science and Technology, 99 Xuefu Road, Suzhou 215009, China
*
Author to whom correspondence should be addressed.
Sustainability 2022, 14(14), 8697; https://doi.org/10.3390/su14148697
Submission received: 7 June 2022 / Revised: 11 July 2022 / Accepted: 14 July 2022 / Published: 15 July 2022

Abstract

:
Agricultural scale management has become the inexorable trend of modern agricultural development. Plot consolidation and centralized land management are traditionally viewed as the premise and foundation of agricultural scale operations in Europe, India, and China. In order to quantitatively verify whether this view is suitable for Shanghai suburbs, this paper measured the dynamic evolution characteristics of agricultural land and agricultural operations scale in suburban Shanghai at the plot level and peasant household level, using landscape metrics and agricultural statistics methods, respectively. At the city or regional level (the suburbs of Shanghai), the driving mechanism of the change of landscape aggregation degree of farmland was revealed using principal component analysis and multiple linear regression analysis. The results show that (1) in the suburbs of Shanghai, the expansion of the plot scale is restricted by various objective conditions, and the plot fragmentation pattern is inevitable and will exist for a long time; (2) the degree of land management dispersion exhibits an overall increasing trend; (3) moderate scale operations at the peasant household level generally demonstrate an increasing trend and are not obviously correlated with changes in the plot scale; and (4) service scale operations represent the main remedy for future agricultural development; (5) the improvement of agricultural mechanization level was positively correlated with the cultivated land aggregation index (AI), but economic development, industrial restructuring, and urbanization were negatively correlated with the AI of cultivated land. The results show that the appropriate scale of management of agriculture can still be developed in the suburbs of metropolis against the background of land fragmentation and dispersion. Of course, it is essential to change the concept and path of agricultural scale management development.

1. Introduction

Competition between large-scale farms and small-scale peasant households and between traditional farmers and new agricultural operation entities as well as the sustainable development of these farms remain common challenges facing the world today [1,2,3]. The usual result is that larger farms are getting larger while smaller operations are decreasing in number, thereby achieving agricultural economies of scale. Economies of scale refer to a kind of phenomenon that increases output, reduces the long-term average cost, and increases economic benefit by expanding the scale of production under the certain technical conditions. It reflects the relationship between the concentration of factors of production and the economic benefit. Agricultural scale operation contains elements of agricultural production, agricultural management entities, agricultural management links, and agri-business; its category is greater than that of land scale operation. Land as a basic part of agricultural production, land moderate scale management is a kind of important embodiment of moderate scale management of agriculture. Agricultural land moderate scale management refers to agricultural land management scale that achieved the best land scale benefit [4]. For more than half a century, scholars have conducted a lot of research on agricultural scale operations and made major progress, which is detailed as follows.
(1)
On a spatial scale, agricultural scale management involves both the macro level (national level, cross-regional level) and micro level (plot level, peasant household level) [5,6,7,8,9,10,11,12].The research focused on the cost and profit analysis of farmland fragmentation and consolidation [13,14,15], as well as the relationship between farm size and land productivity [16,17]. Deininger et al. [18] considered the potential endogeneity of land fragmentation and differences in crop selection. Relevant research results have also emerged from the micro perspective of production and management individuals, the meso perspective of industrial organization development, and the macro perspective of industrial integration [19]. Due to the different spatial scales of the research, the conclusions are varied and sometimes even contradictory. At the urban scale, emphasis is placed on the multifunctional and sustainable development of urban agriculture rather than its scale operation [20]. Generally, a high percentage of small farms, farms that are tenanted, part-time farms, and farms that are fragmented is a typical structural characteristic of agriculture in the peri-urban regions [21]. Therefore, in the suburbs of big cities, is developing agriculture moderate scale operation feasible?
(2)
Research on the influencing mechanism of agricultural scale management is gradually deepening. The comparative study on economies of scale and diseconomies of scale of farmland is extended to investigate the “degree” of the moderate-scale operation of farmland. For agricultural production units, the bigger the scale is not the better, moderate scale management is the most important. In Asia, for example, it is the average agricultural workforce management 3 ha of arable land in the early 1980s [21]. However, actual operation processes, due to differences in business objectives, usually will produce different agricultural moderate scales. At the same time, agricultural moderate scales have features such as regional difference, time variability, and diversity of form [22,23,24]. Therefore, how to determine the agricultural moderate scale is still a complex problem. It is generally believed that land fragmentation will increase farmers’ production costs and affect agricultural returns to scale [25,26,27], while farm size and land fragmentation will restrict agricultural mechanization [28]. Additionally, it is believed that agricultural managers’ management ability, human and land endowment, market competition environment, agriculture and land policy, non-agricultural employment and agricultural labor force opportunity cost, and the technological progress induced by the change in the relative price of the input factors are the main factors affecting the moderate-scale operation of agricultural land [29,30,31]. But what are the direction and intensity of these influences? Further clarification is needed.
(3)
In terms of operation mode, the scale operation of agricultural production factors (such as land) is gradually expanded to the scale operation of agricultural socialized services and agri-business [24]. Business entities have also been extended from large planters and family farms to specialized cooperatives, leading agricultural enterprises, joint-stock cooperatives, and grain industry alliances, and vegetable industry alliances [25]. Recently, attention has been paid to the development of the green agricultural growth corridor, which aims to coordinate large-scale agricultural investment with environmental protection [32]. However, in the suburbs of a metropolis, what are the most suitable form and path of agricultural scale management?
(4)
Regarding the evaluation indexes and methods for agricultural scale management, one advance is from a single assessment of economic benefits to a comprehensive assessment of economic, social, and environmental benefits [33,34,35]. Moreover, the evaluation methods have become more abundant; in addition to the traditional group comparison method and statistical analysis, production function, peasant household models, spatial autocorrelation model were gradually applied [36,37,38]. The recent progress of the evaluation methods was from land fragmentation assessment to landscape fragmentation assessment [39,40,41,42,43], and from the economic approach to the landscape ecological approach [44,45,46,47,48,49,50,51,52]. Previous landscape pattern analyses either focused on the relationship between urban landscape patterns and ecological environment effects, or were interested in the relationship between urban landscape patterns and land use change [53,54,55]. However, the relationship between agricultural scale management and landscape pattern change of farmland has not received enough attention.
In general, although agricultural scale operations have always been a topic of concern in agricultural economics, rural development economics, and rural geography, there still have the following questions worth further study. (1) At a specific scale, existing studies mostly focused on the macro scale (cross-regional or national) and microscopic scale (plot or peasant households) and ignored the city or regional scale, especially in the context of farmland shrinking and plot fragmentation; does agricultural scale operation in the metropolitan suburbs have growth potential? (2) The traditional view is that plot consolidation and centralized land management are the premise and foundation of agricultural scale management [10,56,57]. However, there are two typical models of agricultural scale operation in the world: one is the large-scale modern agricultural development model represented by the United States, which has more land resources per capita and aims to improve labor productivity; the other is the small-scale modern agricultural development model represented by Japan, which has less land resources per capita and aims to improve land productivity [58]. In an increasingly fragmented landscape of metropolitan suburbs, will agricultural operation entities go? (3) The debate over the scale economy and descaling of the economy continues. Taneja [59] argued that large-scale production is a product of the era of industrial economy, and economies of scale shape giant enterprises. Descaling represents the largest change in the digital economy, and as artificial intelligence advances, more descaling will emerge. Whether can economies of scale and economies of descale coexist for a long-term?
As a rising global city, Shanghai’s agricultural development has its own characteristics based on absorbing the experience of developed countries, and it has become a model of high-tech refined agriculture, high-quality leisure agriculture and high-level urban agriculture in China [60]. In particular, the designation of “Special Agricultural Products Protection Zones”, “Grain Production Function Zones”, and “Vegetable Production Protection Zones” in Shanghai in 2017 means that Shanghai’s characteristic agricultural development has moved to a new stage. Therefore, choosing Shanghai as the research object has important academic value and practical significance.
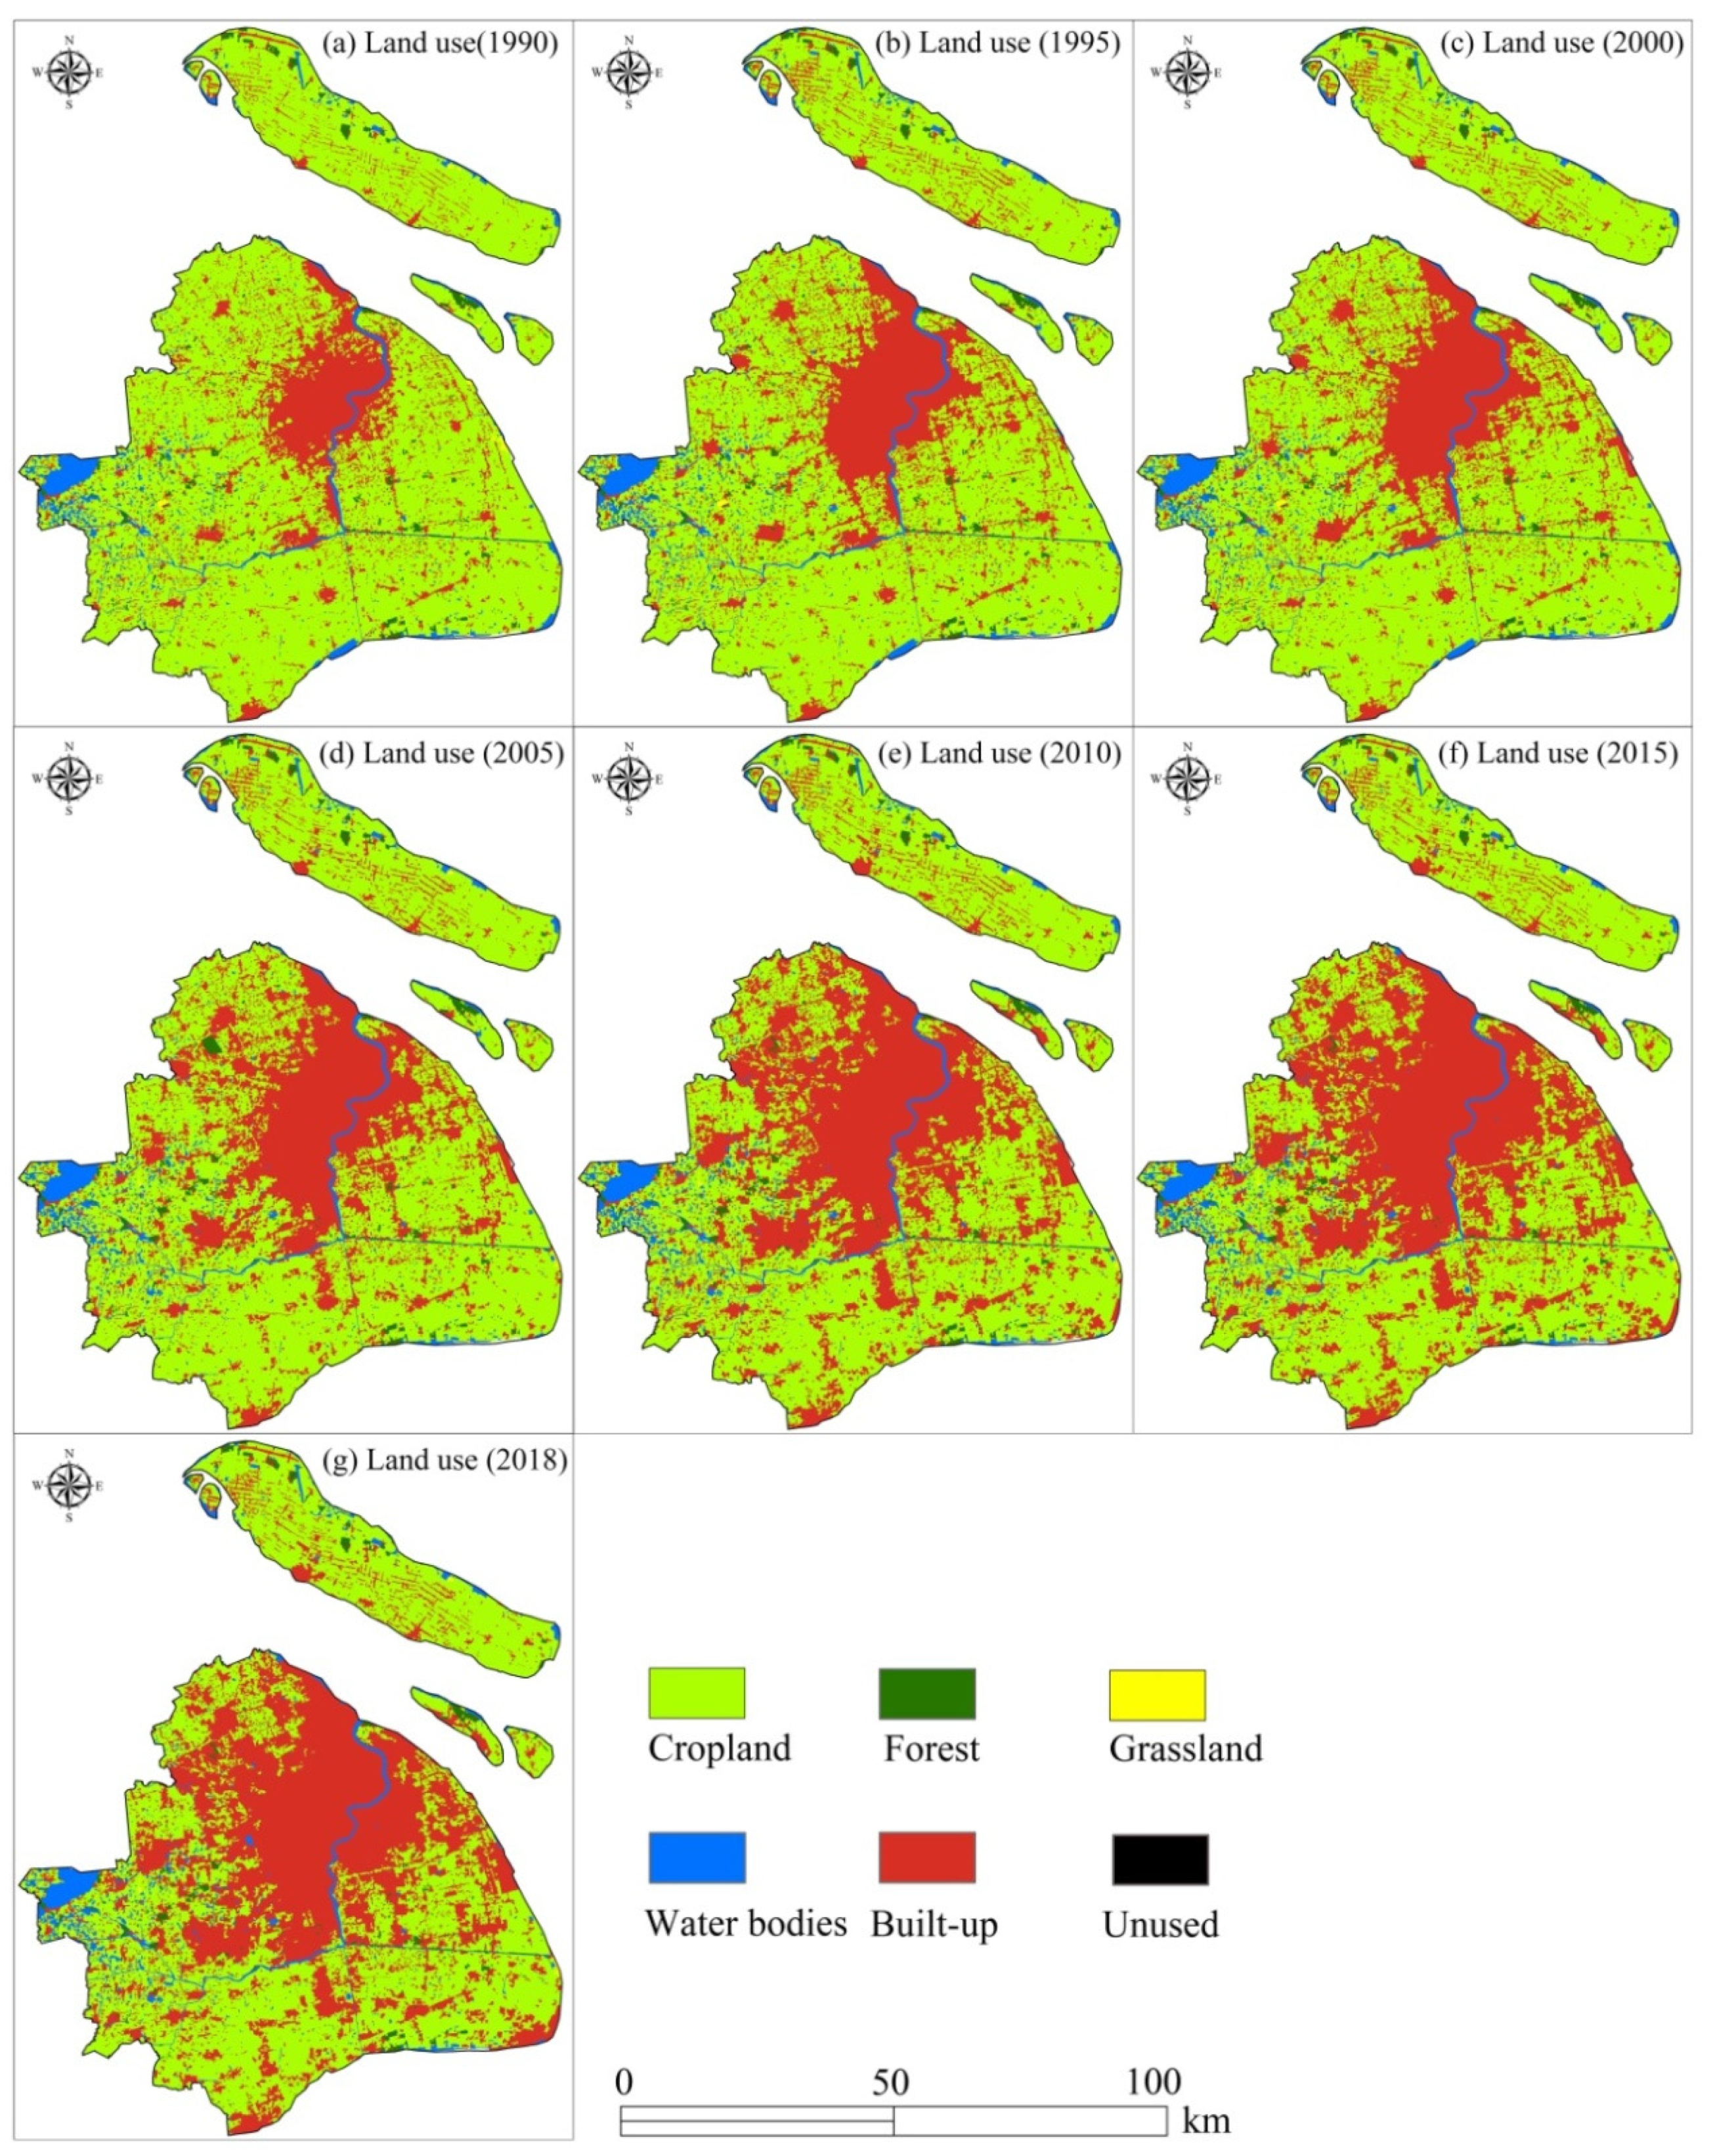
The main objectives of this paper are as follows: (1) based on remote sensing image data, this study used landscape ecology method to identify whether the spatial change of land use in suburban Shanghai tended to be fragmented and decentralized during the period from1990 to 2018. (2) Based on the statistical data, the paper identified whether the scale of agricultural operation in the suburbs of Shanghai tended to increase or decrease at the peasant household level and city or regional level. (3) This paper clarified the main factors driving the change of landscape aggregation degree of cultivated land in Shanghai suburbs. (4) Last, this paper explored the development concepts and paths of agricultural moderate-scale operation in suburban Shanghai under the background of land fragmentation and dispersion.

2. Data and Methods

2.1. Data Sources

The remote sensing data of Shanghai from 1990 to 2018 used in this paper are Landsat TM/ETM image data with a spatial resolution of 30m from the Geospatial Data Cloud (http://www.gscloud.cn/ (accessed on 6 January 2022)) of the Chinese Academy of Sciences (CAS). After the remote sensing image is processed by radiation correction, geometric correction, image enhancement, image mosaic, clipping, etc., the land use change characteristics are determined according to the land use classification system of the CAS. To unify the study area and eliminate the influence of borders and marine waters, the Shanghai administrative map in 2018 was used as a standard division scope to clip the following seven years of remote sensing images: 1990, 1995, 2000, 2005, 2010,2015, and 2018 (Table 1). In this study, we mainly used remote sensing images in summer of each year. Since the remote sensing images of April, May, June, and August of 2005 have high cloud cover, and the remote sensing image data of September is not available, we choose the remote sensing image of October of 2005, which had better data availability but ignored the production cycle/seasonal pattern of crops.
The social and economic data and agricultural statistical data used in this paper come from the following sources: The data of agricultural scale operation households in Shanghai suburbs are from “Shanghai Agricultural Census (1997, 2007, 2017)”, the data of specialized farmer cooperatives in Shanghai suburbs are from “Shanghai Statistical Yearbook (2014–2020)”, and the data of family farms in Shanghai suburbs are from “Shanghai Suburb Statistical Yearbook (2014–2020)”. Data of cultivated land scale in Shanghai suburbs come from “Shanghai Suburban Development Report (1991, 2001, 2011, 2020)”. The driving factors of cultivated land scale change mainly include economic development, industrial structure adjustment, urbanization, and agricultural science and technology. The data are all from the “Shanghai Statistical Yearbook (1991–2019)”.

2.2. Data Processing

Based on the ENVI platform, this study used the support vector machine, maximum likelihood method, and BP neural network in supervised classification methods to classify and interpret the remote sensing images of Shanghai from 1990 to 2018 [61]. By comparing the overall classification accuracy and kappa coefficients of the three classification algorithms, this paper finally selects the BP neural network algorithm, which has high classification accuracy, to obtain land use types in Shanghai. Using the BP neural network algorithm of supervised classification, we divided the land use types of remote sensing images in seven years in Shanghai into cultivated land, forestland, grassland, water bodies, built-up land, and unused land (Figure 1, Table 2). The overall accuracy of the land use classification in the seven years reached over 87%, and the kappa coefficient was greater than 0.77, which met the requirements of this study.

2.3. Methods

This paper measures the change of agricultural land and agricultural management scale in suburban Shanghai from three scales: (1) at the plot level, we use the landscape metrics method; (2) at the peasant household level (or property right level), we use the agricultural statistical method; and (3) at the city or regional level, we use correlation analysis, principal component analysis (PCA) and multiple linear regression methods to reveal the driving forces of the change of landscape aggregation degree of cultivated land.

2.3.1. Landscape Metrics Method

Landscape ecology takes the knowledge system of geography and ecology as the framework and constructs landscape indexes based on the spatial distribution characteristics of regional landscapes to describe the characteristics of each block to carry out targeted analysis on the spatial distribution of regional parcels, such as dominance degree, concentration degree, and connectivity degree [54,62,63,64,65,66]. Commonly used software for landscape spatial pattern analysis includes APACK, SIMMAP, LEAP, and Fragstats [58].
This article uses Fragstats4.1 as an analysis tool to calculate the landscape index of the main types of land use in Shanghai. The number of patches (NP), mean patch size (MPS), path density (PD), largest path index (LPI) and landscape shape index (LSI) were selected to analyze the landscape spatial patterns (Table 3).
Here, NP is the total number of plots of land type, which can reflect the concentration or fragmentation degree of land type. Generally, a greater NP value corresponds to a higher fragmentation degree of land, with a lower value corresponding to a higher concentration degree. MPS is the ratio between the area and the number of patches, which indirectly reflects the expansion or shrinkage trend of the landscape lot. With an increase in MPS, the land type generally presents an expansion trend, and vice versa. The information reflected by PD is similar to that reflected by NP, and it is suitable for the macroscopic display of the concentration or fragmentation degree of land type and is also a negative indicator of land spatial concentration degree. LPI is the largest patch area in the land type and represents a simple index for measuring landscape dominance. LSI reflects the degree of agglomeration or dispersion of land type. A larger LSI corresponds to a more discrete land type and more irregular and disorderly characteristics. However, when the LSI becomes increasingly concentrated, it represents a negative index of land space concentration degree and an important index in landscape ecological statistics [64].
To further analyze the spatial structure of the landscape of the land, we selected AI, MNN, DIVISION, CONNECT, COHESION, and SPLIT [48] to quantify the landscape spatial structure characteristics of land use in Shanghai (Table 4).
Here, the aggregation index (AI), which mainly reflects the degree of spatial concentration of a land use type, is calculated based on the length of the common boundary between pixels of the same land use type. The higher the AI value is, the higher the degree of spatial agglomeration of the land use type is. The mean nearest distance (MNN) refers to the average distance to the nearest adjacent patches of the same type. Larger values of MNN indicate that patches of the same land use type are more scattered. DIVISION indicates the discrete degree of individual distribution of different patches in a certain type of landscape. This index directly reflects the fragmentation degree of the landscape space after being segmented. The larger the value of DIVISION is, the greater the degree of landscape segmentation and the greater the patch dispersion are. The connectance index (CONNECT) measures the degree of spatial connectivity and concentration of a land use type. Its value can also reflect the spatial concentration potential of land use types. The higher the value of CONNECT is, the higher the spatial concentration potential is. Conversely, lower CONNECT values indicate that the potential for spatial concentration is reduced. The path cohesion index (COHESION) mainly measures the degree of natural connectivity within a given land use type, and its value is highly related to the degree of land use aggregation. At the landscape level, SPLIT refers to the square of the total area of the landscape divided by the sum of the squares of all the patches in the landscape. The larger the value of SPLIT, the higher the degree of fragmentation in the landscape, reflecting the complexity of the landscape spatial structure [45,49].

2.3.2. Driving Factors Analysis Method for the Landscape Aggregation Degree of Cultivated Land

Some scholars have discussed the driving factors of cultivated land fragmentation [46,67,68], but few have studied the driving factors of the change of landscape aggregation degree of cultivated land. In this study, AI (aggregation index) is used to represent the landscape aggregation degree of cultivated land. Generally, the factors affecting the change of landscape aggregation degree of cultivated land are diverse, including nature, economy, society, policy, agricultural science and technology. Among them, economic development, industrial restructuring, urbanization, agricultural science and technology level, policy, and natural factors are the main impacting factors [65,68,69]. Since natural factors are relatively stable in a short period of time, and policy factors are difficult to be quantified and have a certain degree of contingency. Therefore, this paper mainly considers four aspects of economic development, industrial restructuring, urbanization and agricultural science and technology.
According to the actual situation of Shanghai, 15 indicators that may affect the change of arable land landscape aggregation degree are selected. We choose per capita gross domestic product, rural disposable income per capita, newly increased fixed assets and gross output value of agriculture to measure the economic development of Shanghai. To measure the adjustment of Shanghai’s industrial structure by gross industrial output value, the proportion of tertiary industry, and the proportion of agricultural workers. The urbanization of Shanghai is measured by an increase in urban resident population, the proportion of construction land area, the investment in real estate development, the length of road and green land area. The agricultural science and technology level of Shanghai is measured by the total power of agricultural machinery, consumption of chemical fertilizers and consumption of pesticides. The research methods of driving force analysis of cultivated land landscape aggregation degree include correlation analysis, principal component analysis, and multiple linear regression analysis.
(1)
Correlation analysis
Pearson correlation analysis was conducted using Statistical Product and Service Solution (SPSS) 26 software (International Business Machines Corporation, Armonk City, New York, USA, 2019), and the correlation coefficients of each driving factor and the landscape aggregation degree of cultivated land were obtained. Pearson correlation analysis results show that 10 indicators are correlated (p < 0.05), among which 8 indicators are strongly correlated (p < 0.01) (Table 5 and Table 6). Therefore, this paper selects these 10 driving factors and the landscape aggregation degree of cultivated land for regression analysis.
(2)
Principal component analysis (PCA)
We selected 10 driving factors from four aspects to explore the response relationship between cultivated land landscape aggregation degree and these driving factors. In order to eliminate the multicollinearity of driving factors data, PCA method was used to reduce the dimensionality of data and extract the main information of driving factors data before multivariate linear regression analysis was carried out [70].
The driving factors data of the landscape aggregation degree of cultivated land is multi-dimensional. In order to eliminate the influence of different dimensions, the original data were standardized. Then, Kaiser-Meyer-Olkin (KMO) and Bartlett spherical tests were conducted to test whether the index data were suitable for PCA. As seen in Table 7, the observed Bartlett test statistic was 280.459; the degree of freedom was 45; the probability was close to 0, less than the significance level of 0.05; and the KMO value was 0.732 > 0.6, indicating that it was suitable for PCA.
The PCA results showed that cumulative contribution rate of the first and second principal components reached 95.24%, and the value of the characteristic root of the two principal components is greater than 1 (Table 8). Therefore, most of the information of the factors could be generalized by extracting only two principal components.
Factors were then rotated by Varimax, and factor loading was calculated. As seen in Table 9, X11, X12, X13, X21, X22, X32, X33, and X34 had higher loads on the first principal component, and X31 and X41 had higher loads on the second principal component. It can be concluded that the driving factors of the first principal component are economic development, industrial restructuring and urbanization factors, and the driving factors of the second principal component are increase in urban resident population and total power of agricultural machinery.
(3)
Regression Analysis
Through the above analysis, two unrelated principal components (Y1 and Y2) were obtained. Taking Y1 and Y2 as independent variables and the landscape aggregation degree of cultivated land (Y) as dependent variables, we established the regression model between the dependent variable and principal components, and the following regression equation was obtained:
Y = 0.044 Y 1 0.049 Y 2 + 97.623
In order to determine the validity of the analysis results, the regression model was tested so that R2 = 0.939 was close to 1, indicating that the regression model had a high degree of fit (Table 10). F-test and t-test results were both less than 0.05, indicating that the regression model had statistical significance and that the regression equation could be used to explain the change of landscape aggregation degree of cultivated land.
To make the model more intuitive, the independent variable was restored to the original variable; that is, the expressions of F1 and F2 regarding the original variable were substituted into the regression Equation (2), and the final regression model was obtained as follows:
Y = 0.0345 X 11 0.0282 X 12 0.0525 X 13 0.0440 X 21 0.0425 X 22 0.0413 X 31 0.0465 X 32 0.0310 X 33 0.0499 X 34 + 0.0573 X 41 + 97.623

3. Results

3.1. At the Plot Level: Visible Land Fragmentation and Dispersion

Figure 2 shows that the cultivated land in Shanghai is mainly distributed in the periphery of the central city and towns, and Chongming District. It consists of dry land and paddy fields, of which paddy fields account for the majority. Dry land is scattered at the edge of the city and part of the coastal leisure and rotation land. According to the variation in land spatial morphology, the characteristics of farmland fragmentation and sparsity in the suburbs of Shanghai are visible.
According to the GIS spatial overlay analysis of the reclassified cultivated land data of Shanghai, the cultivated land area of Shanghai was 4793.40 km2 in 1990, 4384.55 km2 in 2000, 3567.91 km2 in 2010, 3383.81 km2 in 2015, and only 3337.38 km2 in 2018, which represented a decrease of nearly 30% in 28 years. Among these changes, cultivated land decreased at the fastest rate from 2000 to 2010, and the rate of decline has dropped significantly since 2010 (Figure 2).
The results of landscape spatial analysis show that, from 1995 to 2018, the cultivated land NP in Shanghai increased from 103 to 613, the PD increased from 0.02/100 ha to 0.18/100 ha, and the MPS decreased from 4330.01 ha to 501.02 ha year by year. The doubling of the NP and PD value and the shrinkage of the MPS value directly reflected the trend of the fragmentation of cultivated land in the suburbs of Shanghai. From 1990 to 2018, the LPI, which measures the dominance of land types, decreased from 23.16% to 21.85%, which means that the advantage of cultivated land among various land types in Shanghai declined.
The cultivated land LSI increased from 43.89/100 ha to 52.28/100 ha, indicating that the irregularity of the cultivated land patch shape increased; the cultivated land form changed from simple to complex; and the overall degree of dispersion increased (Table 11).
In summary, from the perspective of the most intuitive spatial distribution maps of cultivated land in Shanghai and landscape metrics, cultivated land in Shanghai showed an overall morphological evolution process of shrinkage, dispersion, fragmentation, and complexity from 1995 to 2018.
Similarly, from 1990 to 2018, the AI of cultivated land in Shanghai decreased from 98.14% to 97.20%, indicating that cultivated land in Shanghai gradually became fragmented. The DIVISION of cultivated land increased from 0.89 to 0.99, indicating that the separation degree of cultivated land landscape increased. The overall change trend of the cultivated land metric COHESION is not significant, and the MNN of cultivated land shows an overall upward trend in fluctuations. The cultivated land metric CONNECT decreased from 3.41% in 1995 to 0.49% in 2018, which means that the connectivity of cultivated land in Shanghai shows a downward trend. The SPLIT index continued to increase from 1.6812 in 1990 to 3.8821 in 2018, which means that the fragmentation of cultivated land in Shanghai is more serious (Table 12).
By region, the aggregation index (AI) of cultivated land in Shanghai suburban districts tends to decline on the whole, among which Minhang, Baoshan, and Jiading have the largest decline, while Chongming, Jinshan, and Fengxian have the smallest decline (Table 13). The SPLIT index of cultivated land in Shanghai suburban districts tends to rise on the whole, among which Minhang, Baoshan, and Songjiang districts have the most obvious changes (Table 12). For nearly 30 years, these three districts have witnessed the fastest growth of urban population and the largest increase of housing scale, as well as the fastest industrialization development and the fastest decrease of cultivated land in Shanghai, so the degree of cultivated land fragmentation is the most prominent. Since the former Pudong New Area located in the inner suburbs was merged with the former Nanhui District located in the outer suburbs, the degree of farmland fragmentation was reduced on the whole, resulting in the change of SPLIT index of cultivated land is not as obvious as the above three districts.
In general, from the perspective of the traditional indexes AI and DIVISION, as well as MNN, CONNECT, and SPLIT, cultivated land in Shanghai gradually became increasingly discrete and fragmented, especially between 1995 and 2018.

3.2. At the Peasant Household Level: Increasing Scale of Agricultural Operation

Although the fragmentation of land parcels can be observed objectively, the operation scale of peasant households is still likely to expand at the level of peasant households. First, the number of peasant households is decreasing; and second, the total amount of cultivated land that land use right transfer has occurred is increasing. From 1996 to 2016, the number of agricultural operating households in the suburbs of Shanghai decreased by 48.61%, the number of large-scale agricultural production operating households increased from 2900 to 7900, and the number of agricultural production and operating units increased from 3200 to 5700 (Table 14). This finding shows that the farmland management of the suburbs of Shanghai is transferred to the agricultural scale operation households.
Specialized farmer cooperatives and family farms are the main bodies of farmers’ large-scale operations. From 2013 to 2018, the average number of specialized farmer cooperatives was approximately 3080, with an average number of 65,400 members, driving 127,500 nonmember farmers (Table 15). In 2019, due to the impact of economic slowdown, the total size of the three showed a shrinking phenomenon.
Family farms have gradually become the normal operation of large-scale agricultural production households. In 2017, there were 4516 family farms in the suburbs of Shanghai, with an average of 2.5 people per family. Among them, 800 family farms had contracted farmland of less than 6.67 ha, 2219 family farms had contracted farmland of 6.67–10 ha, and 1497 family farms had contracted farmland of more than 10 ha. In recent years, the total number of family farms has decreased, but the number of family farms with an average operating size of more than 10 ha has steadily increased (Table 16), thus reflecting a growth trend of large-scale operation of farmers.

3.3. At the City or Regional Level: Driving Factors Analysis of the Change of Landscape Aggregation Degree of Farmland

The results showed that the total power of agricultural machinery (X41) was positively correlated with the cultivated land aggregation index; that is, the larger the index value was, the higher the cultivated land aggregation index was. In fact, the improvement of agricultural mechanization level helps to reduce the number of agricultural labor force, promote the moderate scale of agricultural land management and farmland aggregation degree in the suburbs of Shanghai. The other nine indexes were negatively correlated with the cultivated land aggregation index; that is, the larger the indexes were, the lower the degree of cultivated land aggregation was. In other words, in the suburbs of big cities, the more developed the economy, the more advanced the industrial structure and the higher the urbanization level, the more unfavorable the improvement of the degree of farmland aggregation. The influence degree of these 9 indicators on cultivated land aggregation is as follows: Newly increased fixed assets (X13) > Length of road (X34) > Proportion of construction land area (X32) > Gross output value of industry (X21) > Proportion of tertiary industry (X22) > Increase in urban resident population (X31) > Per capita gross domestic product (X11) > Investment in real estate development (X33)>Rural disposable income per capita (X12). This means that the negative effects of fixed asset investment, transportation construction, expansion of built-up areas, industrialization and service-oriented economy, and urban population growth on cultivated land aggregation degree are greater than those of economic development level, income level, and real estate development in the suburbs of Shanghai.

4. Discussion

The fragmentation of cultivated land is one of the main factors restricting agricultural scale operation, and it is a common phenomenon in many countries and regions, especially in Central and Eastern Europe, India, and China [27,71,72,73,74,75]. Previous studies were mostly based on sample survey data and field interview data from specific times and areas [13], which have drawbacks that include small coverage, small sample size, and limited representativeness. Based on the interpretation of remote sensing images, this paper uses landscape metric methods to reveal the spatiotemporal evolution characteristics of agricultural land in the suburbs of Shanghai. The research perspectives are more diverse and the study duration is longer.
In fact, farmland fragmentation can be divided into natural fragmentation, property rights fragmentation, and agricultural business activities fragmentation or non-agricultural business activities fragmentation. Although natural fragmentation is inevitable, the fragmentation of property rights and human activities can be ameliorated or exacerbated to some extent. Since Shanghai implemented the policy of Pudong development and opening up in 1990, the rapid development of industrialization and urbanization in Shanghai has led to a sharp reduction in the area of agricultural land [24,76]. First, due to the continuous occupation of cultivated land by urban construction, rural residential construction, rural road and other infrastructure construction, and non-agricultural industrial development, the total amount of cultivated land in Shanghai continue to decrease from 323,200 ha in 1990 to 158,900 ha in 2019. However, in recent years, due to the rapid reduction of rural population and the strengthening of cultivated land protection, the area of cultivated land owned by each rural population or rural employee has increased (Table 17). Second, in terms of space, Shanghai has flat terrain, high intensity of land development and high spatial suitability. The layout of cultivated land is adjacent to the development of construction land. In addition, the road network and water network are too dense, and the distribution of cultivated land by the roads, houses, and rivers is scattered and fragmented. Agricultural land has been increasingly broken up by various types of non-agricultural land, resulting in the decrease of concentrated and contiguous agricultural land. Based on this kind of change situation, the Shanghai municipal government proposed the development strategy of the “Three Concentrations” in 1995. However, over the next two decades coincided with the fastest development of industrialization and urbanization in Shanghai, and the policy effect of the “Three Concentrations” was not fully displayed due to the reality of plot fragmentation and land dispersion. By 2019, only 62 percent of concentrated and contiguous farmlands larger than 20 ha in Shanghai’s suburbs were cultivated, although land consolidation and high-standard farmland construction had helped to some extent. Third, under the influence of high intensity human activities, industrial production and transportation construction, the aggregation degree and the quality of cultivated land in the inner suburbs such as Baoshan, Jiading, Minhang districts are lower than those in the outer suburbs of Shanghai.
The traditional view was that enlarging the scale of land through land consolidation was an important method of promoting the moderate-scale management of agriculture [77,78]. However, we found that moderate-scale agricultural management can also be developed under the background of land fragmentation. Land fragmentation has existed for a long time. According to the Food and Agriculture Organization of the United Nations (FAO), 70% of the food produced in the world still comes from small-scale agriculture [79]. In the suburbs of Shanghai, due to the unique farmland shrinkage and inheritance system [65], population growth and urban expansion, historical and cultural traditions and other factors, we should not overstate the negative effects of land fragmentation (e.g., long farming distance, irregular plot shape, and inappropriate for mechanical operation) [44] and instead should pay attention to the positive role of land fragmentation (e.g., diversification of planting is conducive to the spread of natural and market risks, part-time farming, improvements of landscape value, and land exchange) [13,43]. In addition, its negative effects can also be reduced to a certain extent by innovative policies [80]. It is commonly believed that land fragmentation will increase production costs and lead to loss of productivity. However, the historical productivity losses from land fragmentation have been moderate, with profits increasing to some extent by diversification of risks, as well as by land consolidation efforts. In addition, increases in production costs may induce the replacement of labor by machinery. Moreover, the relationship between farm size and production costs is not always linear but may show an inverted U-shaped curve [30].
We also found that agricultural economies of scale can be obtained under the background of land dispersion. This can be examined from a multi-scale perspective. At the plot scale, the expansion of the plot scale is undoubtedly beneficial to the improvement of land use efficiency. However, even if they do not expand the plot scale, land use efficiency can still improve. Land transfer can also expand the scale of peasant household operation and regional operation scale. There is no certain connection between the changes in peasant household operation scale and regional operation scale and the changes in plot scale. In other words, land fragmentation and dispersion can coexist with peasant household scale management and regional scale management. For example, in Songjiang District, Shanghai, since the establishment of family farms operated by professional farmers in 2007, 95% of the grain acreage has been transferred into 862 family farms as of 2019, although the fragmentation of plots has not greatly improved. The cultivated land area per family farm has expanded to approximately 10.567 hectares; the annual income of a family farm with single grain production and operation exceeds 130,000 yuan (RMB); and the annual income of a family farm with combined planting and raising exceeds 200,000 yuan (RMB) [81]. Family farms have become the best method of operating agriculture on a moderate scale [82]. Therefore, we need to further update the concept from micro-level farmland scale operation, which emphasizes land consolidation, to higher-level peasant household scale operation, which is oriented by property right transfer and regional specialization. In addition to the size of plots, more attention should be given to the spatial distribution of plots and the mutual external influences between plots and villages and between plots [83].
The main reasons for the development of moderate-scale agricultural operation in Shanghai are as follows: (1) various supportive policies of the government, including financial support, tax preference, land use and electricity support, management talents cultivations and service platform establishments; (2) improved level of agricultural mechanization and socialization of agriculture with the overall level of mechanization in ploughing, sowing, and harvesting major crops in Shanghai exceeding 80% by 2016; and (3) demonstration effects of new business entities. By the end of 2019, there were 2757 specialized farmer cooperatives in Shanghai, including 86 state-level demonstration cooperatives, 124 city-level demonstration cooperatives, and 4347 family farms at the moderate scale, which included 76 city-level demonstration family farms. These model operators not only have high production efficiency but also high-quality agricultural products and high farmer income.
For a long time, the expansion of farmland scale operations has been regarded as the main focus of basic policies to promote agricultural sustainable development. Land consolidation helps to enhance the inseparability of production factors, which indicates that appropriate scale management of land has an internal scale economy. Appropriate scale operation of agricultural socialized services represented by the modes of farmers’ professional cooperatives, companies and farming, and comprehensive agricultural association helps to enhance the inseparability of production process, so it has external scale economy. Through the innovation of agricultural systems, the compound moderate-scale operation represented by the combination of planting and breeding, the combination of grain crops and economic crops, and the combination of multifunctional agriculture, can achieve a comprehensive scale economy integrating an internal scale economy, an external scale economy and a scope economy (i.e., the efficiency obtained by the expansion of business scope). Development practice shows that agricultural scale management can be implemented through the division of labor of agriculture on the basis of professional services, including unified seedlings, unified field management, unified harvest, unified brand, and unified marketing services. This will be an important way to improve China’s agricultural competitiveness and integrate China’s smallholders into the modern agricultural systems [8]. In other words, a specialized division of labor (service economies of scale) can bring about a scale effect, which can make up for the diseconomy of land scale to some extent [84]. The consolidation of agricultural land in Shanghai is restricted by many factors: (1) it is difficult to change the traditional small-scale agricultural management mode, which has formed over a long time due to the large number of people and less land; (2) farmers’ pursuit of risk minimization leads to the production pattern of increasing agricultural diversification levels; (3) farmers’ love of land and limitations associated with China’s equal inheritance system of agricultural land; (4) the increasing number of construction projects has intensified land fragmentation; (5) the development of the rural land market is slow, which hinders the circulation of rural land use rights, with Shanghai’s rural contracted land transfer ratio at approximately 75% in 2016; and (6) unified land transfer guidance prices not only ignore the benefit differences among different crop growers, but also increase the economic burden of low output value grain growers and lead to farmland subcontract and re-subcontract phenomena. As of 2016, Shanghai still had nearly 200,000 hectares of agricultural land, most of which was not well modernized for moderate-scale operations; approximately 560,000 farmers, many of whom were still engaged in traditional small-scale farming; and more than 5000 scattered natural villages, most of which needed comprehensive land consolidation.
Most of the previous studies focused on farmland fragmentation and its driving mechanism. Shi X. [67] believed that output-income and industrial structure adjustment were the two main driving mechanisms affecting farmland fragmentation in Daxing District of Beijing. Gao [38] used the industry concentration and spatial Gini coefficient methods to estimate the change trend of cultivated land aggregation degree in the suburbs of Shanghai, but she only analyzed the impacting factors of cultivated land change, and considered that the added value of the tertiary industry, rural residents per capita consumption expenditure, total retail sales of social consumer goods were the three main factors influencing the Shanghai suburban cultivated land decrease. As a matter of fact, industrialization, urban expansion and rural housing construction are the main reason for the decrease of arable land. This paper made a comprehensive analysis of farmland fragmentation and aggregation degree, revealed the driving mechanism of farmland aggregation degree in the suburbs of Shanghai, and concluded that the improvement of agricultural mechanization is conducive to farmland aggregation degree, while economic development, urbanization and industrial restructuring are not conducive to farmland aggregation degree. This study found that the negative effects of fixed asset investment, transportation construction, expansion of built-up areas, industrialization and service-oriented economy, and urban population growth on cultivated land aggregation degree are greater than those of economic development level, income level, and real estate development. It can be seen that the factors affecting the decrease of cultivated land are obviously different from those affecting the change of cultivated land landscape aggregation degree. Land, labor forces, capital, technology, and management are five basic elements of agricultural scale operations. In addition to land and capital, the other three factors are all related to people. In fact, these three factors are more important than land and capital. In order to effectively improve the scale of agricultural operation, we should get rid of the constraints of land resources and pay more attention to improving the quality of labor force and the level of agricultural mechanization, thereby enhancing technological innovation capacity and socialized service and smart management ability of agricultural industry chain.
The agglomeration forces of various economic activities come from the increasing returns to scale. The theory of new economic geography explicitly assumes that the imperfect competition framework and increasing returns hypothesis apply only to non-agricultural industries [84]. As a sector, agriculture has constant and even decreasing returns to scale and do not concentrate because of the immobility of the land. We cannot use the methods such as the concentration index, spatial Gini coefficient to reveal the concentration or agglomeration of farmland. However, we can analyze the levels of concentration in the land management because land use right is a transferable property right. Therefore, we retain the concept to “centralized land management or agricultural operations”. In addition, in landscape ecology, landscape aggregation (degree) index is also a commonly used concept.

5. Conclusions

Our research showed that, in the suburbs of Shanghai, the expansion of the plot scale is restricted by various objective conditions, and the plot fragmentation pattern is inevitable and will exist for a long time. However, we are helpless in the face of large-scale farming. In fact, agricultural scale management has the characteristics of multiple spatial levels, such as the plot level, peasant household level, and city or regional level. Although we cannot realize centralized and contiguous land parcels in physical form, we can improve the degree of land parcel aggregation in property rights form by promoting the transfer of land parcel property rights to promote moderate-scale operation at the level of peasant households [85,86], as well as to realize the centralization, intensification and specialization of regional agricultural production and management.
We also found that there was an obvious trend of the dispersion of land use in the suburbs of Shanghai. From 1990 to 2018, the cultivated land area has been shrinking in suburban Shanghai, however, the agricultural households with appropriate operation scale and large-scale agricultural operation entities tend to increase in the number, show that under the background of plot fragmentation and land dispersion, moderate scale management of agriculture is still viable. In fact, there are three main ways in which to develop agricultural scale management: land centralized scale management, service centralized scale management and compound agricultural scale management [9,10,87]. It is difficult to eliminate the scattered and fragmented pattern of contracted land in the short term. Therefore, service scale management and compound agricultural scale management are the main remedies for future agricultural sustainable development. Future policy support should be focused on the scale of agricultural services and agricultural system innovations, strengthen the ability construction of agricultural social service systems, guide socialized service organizations to provide for pest control, fertilizer application, mechanized production, irrigation and drainage, storage and preservation services for family farms, break through the constraints of small-scale decentralized and fragmented land management on the development of modern agriculture [21,88], develop agricultural stock cooperative systems, and promote diversification of agricultural business models.
This study found that the total power of agricultural machinery is positively correlated with the cultivated land aggregation degree, but fixed asset investment, transportation construction, expansion of built-up areas, industrialization, service-oriented economy, urban population growth, economic development level, income level, and real estate development are negatively correlated with the cultivated land aggregation degree. Faced with the challenges of shrinking farmland, the ageing of the rural population and rising agricultural production costs, Shanghai should fully give play to the positive driving effect of agricultural mechanization on farmland aggregation degree, and rely on agricultural mechanization to improve the efficiency of land use; it should also encourage all kinds of talent to provide low-cost, convenient, and all-round technical services for agricultural producers and operators. It is gratifying that, under the dual strategic guidance of the strengthening of cultivated land resource protection and strict controlling urban growth boundaries, the permanent basic farmland distribution pattern in the suburbs of Shanghai will remain relatively stable, which laid a foundation for further improve the level of agricultural mechanization in Shanghai.
The limitations of this study are as follows: (1) the selection of remote sensing images in different periods not only affects the accuracy of image interpretation, but also is closely related to the production cycle of crops. Due to the poor availability of remote sensing images in the same period in 2005, we can only select remote sensing images in October, which may have a certain impact on the identification accuracy of land use types in that year. (2) This paper mainly uses the landscape ecology method to analyze the change of farmland landscape pattern. This method relies on the accuracy of farmland grid data of remote sensing image classification, and the higher the accuracy of data, the more accurate the analysis result. The classification accuracy has been verified and meets the experimental requirements of this study. However, if more accurate farmland survey vector data can be obtained, the reliability and accuracy of research results will be improved. Furthermore, a more detailed analysis of farmland spatial change can be carried out. (3) The landscape structure indexes of cultivated land are varied. According to the research needs, this paper only investigated the driving factors affecting the change of cultivated land aggregation degree. Future research can further analyze the driving factors and effects of the changes of other landscape structure indexes of cultivated land.

Author Contributions

Y.S.: manuscript writing, conceptual design and technical guidance, fund acquisition. Q.Y.: methodology and calculation, formal analysis and investigation. L.Z.: Data acquisition and visualization. S.S.: Data acquisition and processing. All authors have read and agreed to the published version of the manuscript.

Funding

This research was supported by Shanghai Planning and Land Resource Administration Bureau (one of the key projects for Shanghai General Land Use Planning Revision (2015(D)-002(F)-11).

Institutional Review Board Statement

Not applicable.

Informed Consent Statement

Not applicable.

Data Availability Statement

Data and materials are available from the authors upon request.

Acknowledgments

The authors thank the anonymous reviewers for their valuable comments and suggestions on this article.

Conflicts of Interest

The authors declare no conflict of interest.

References

  1. Adolph, B.; Allen, M.; Beyuo, E.; Banuoku, D.; Barrett, S.; Bourgou, T.; Bwanausi, N.; Dakyaga, F.; Derbile, E.K.; Gubbels, P.; et al. Supporting smallholders’decision making: Managing trade-offs and synergies for sustainable agricultural intensification. Int. J. Agric. Sustain. 2021, 19, 456–473. [Google Scholar] [CrossRef]
  2. Spangler, K.; Burchfield, E.K.; Schumacher, B. Past and current dynamics of U.S. agricultural land use and policy. Front. Sustain. Food Syst. 2020, 4, 98. [Google Scholar] [CrossRef]
  3. Mariola, M.; Moledina, A.; Nye, L.A. Are beginning and small-scale farmers drawn to diversification? Ten years’ findings from Ohio. J. Ext. 2021, 58, 16. Available online: https://tigerprints.clemson.edu/joe/vol58/iss5/16 (accessed on 6 March 2022).
  4. Bi, B. Land Economics (Version 8); Renmin University of China Publishing House: Beijing, China, 2020. (In Chinese) [Google Scholar]
  5. Bowler, I.R. Intensification, concentration and specialization in agriculture: The case of the European-community. Geography 1986, 71, 14–24. [Google Scholar]
  6. Ilbery, B.W. Farm fragmentation in the Vale of Evesham. Area 1984, 16, 159–165. [Google Scholar]
  7. Fleisher, C.M.; Liu, Y. Economies of scale, plot size, human capital and productivity in Chinese agriculture. Q. Rev. Econ. Financ. 1992, 32, 112–123. [Google Scholar]
  8. Losada, H.; Martínez, H.; Vieyra, J.; Pealing, R.; Zavala, R.; Cortés, J. Urban agriculture in the metropolitan zone of Mexico City: Changes over time in urban, suburban and peri-urban areas. Environ. Urban. 1998, 10, 37–54. [Google Scholar] [CrossRef]
  9. Ji, Y.; Gu, T.; Chen, Y.; Xu, Z.; Zhong, F. Agricultural scale operation at the land parcel level: A discussion based on the relationship between transfer rent and land parcel size. Manag. World 2017, 33, 65–73. (In Chinese) [Google Scholar]
  10. Wang, J.; Chen, Z.; Huang, Z.; Reardon, T. A reexamination of the relationship between land productivity and farmers’ scale of operation in the transition period. Manag. World 2015, 31, 65–81. (In Chinese) [Google Scholar]
  11. Lu, H.; Xie, H.; He, Y.; Wu, Z.; Zhang, X. Assessing the impacts of land fragmentation and plot size on yields and costs: A translog production model and cost function approach. Agric. Syst. 2018, 161, 81–88. [Google Scholar] [CrossRef]
  12. Zhang, L.; Luo, B. Agricultural reduction: The scale logic of farm household operation and its evidence. Chin. Rural. Econ. 2020, 36, 81–98. (In Chinese) [Google Scholar]
  13. Blarel, B. The economics of farm fragmentation: Evidence from Ghana and Rwanda. World Bank Econ. Rev. 1992, 6, 233–254. [Google Scholar] [CrossRef] [Green Version]
  14. Wu, Z.; Liu, M.; Davis, J. Land consolidation and productivity in Chinese household crop production. China Econ. Rev. 2005, 16, 28–49. [Google Scholar] [CrossRef]
  15. Ali, D.A.; Deininger, K. Costs and Benefits of Land Fragmentation: Evidence from Rwanda; Policy Research Working Paper Series; The World Bank: Washington, DC, USA, 2015. [Google Scholar]
  16. Rahman, S.; Rahman, M. Impact of land fragmentation and resource ownership on productivity and efficiency: The case of rice producers in Bangladesh. Land Use Policy 2008, 26, 95–103. [Google Scholar] [CrossRef] [Green Version]
  17. Ali, D.A.; Deininger, K. Is There a Farm Size-Productivity Relationship in African Agriculture? Evidence from Rwanda; Policy Research Working Paper, No. 6770; The World Bank: Washington, DC, USA, 2014. [Google Scholar]
  18. Deininger, K.; Monchuk, D.; Nagarajan, K.H.; Singh, K.S. Does land fragmentation increase the cost of cultivation? Evidence from India. J. Dev. Stud. 2017, 53, 82–98. [Google Scholar] [CrossRef] [Green Version]
  19. Zhao, Y.; Lv, H.; Liu, Z. Some thoughts on promoting moderate scale management of agriculture in China. Res. Agric. Mod. 2017, 38, 938–945. (In Chinese) [Google Scholar]
  20. Xue, Y. Retrospect of the 13th Five-Year Plan and reflection on the 14th Five-Year Plan of urban agriculture development in Shanghai. Shanghai Rural. Econ. 2020, 40, 13–17. (In Chinese) [Google Scholar]
  21. Grigg, D. An Introduction to Agricultural Geography; Hutchinson & Co., Ltd.: London, UK, 1984. [Google Scholar]
  22. Li, H.; Fu, L.; Huang, Z.; Peng, W. Various forms of moderate scale management of agriculture and development prospects. Acta Agric. Zhejiangensis 2021, 33, 161–169. (In Chinese) [Google Scholar]
  23. Nie, Y. Antitrust law’s regulations on scale management in China’s new agricultural industrialization system. Outlook Agric. 2018, 47, 51–58. [Google Scholar] [CrossRef] [Green Version]
  24. Huang, Z. Insist on moderation and diversity and promote agricultural scale management. Agric. Econ. Manag. 2017, 8, 12–14. (In Chinese) [Google Scholar]
  25. Wan, G.; Cheng, E. Effects of land fragmentation and returns to scale in the Chinese farming sector. Appl. Econ. 2001, 33, 183–194. [Google Scholar] [CrossRef]
  26. Tan, S.; Heerink, N.; Kruseman, G.; Qu, F. Do fragmented landholdings have higher production costs? Evidence from rice farmers in Northeastern JiangxiProvince, P.R. China. China Econ. Rev. 2008, 19, 347–358. [Google Scholar] [CrossRef]
  27. Wang, Y.; Li, X.; Lu, D.; Yan, J. Evaluating the impact of land fragmentation on the cost of agricultural operation in the southwest mountainous areas of China. Land Use Policy 2020, 99, 105099. [Google Scholar] [CrossRef]
  28. Wang, X.; Yamauchi, F.; Huang, J.; Rozelle, S. What constrains mechanization in Chinese agriculture? Role of farm size and fragmentation. China Econ. Rev. 2020, 62, 101221. [Google Scholar] [CrossRef]
  29. Niroula, G.S.; Thapa, G.B. Impacts and causes of land fragmentation and lessons learned from land consolidation in South Asia. Land Use Policy 2005, 22, 358–372. [Google Scholar] [CrossRef]
  30. Latruffe, L.; Piet, L. Does land fragmentation affect farm performance? A case study from Brittany, France. Agric. Syst. 2014, 129, 68–80. [Google Scholar] [CrossRef]
  31. Zhang, X.; Zhou, Y. Determinants of business scale and their impact on agricultural production: A literature review. Xinjiang Agric. Reclam. Econ. 2018, 38, 83–92. (In Chinese) [Google Scholar]
  32. Bergius, M.; Benjaminsen, T.A.; Maganga, F.; Buhaug, H. Green economy, degradation narratives, and land-use conflicts inTanzania. World Dev. 2020, 129, 104850. [Google Scholar] [CrossRef]
  33. Kawasaki, K. The costs and benefits of land fragmentation of rice farms in Japan. Aust. J. Agric. Resour. Econ. 2010, 54, 509–526. [Google Scholar] [CrossRef] [Green Version]
  34. Li, H.; Fu, Y.; Xu, X.; Liu, J. Spatial-temporal variance on farmland scale operation and environmental efficiency in Jiangsu Province. Sci. Technol. Manag. Land Resour. 2019, 36, 36–46. (In Chinese) [Google Scholar]
  35. Ma, X.; Che, X.; Li, N.; Tang, L. Has cultivated land transfer and scale operation improved the agricultural environment? An empirical test on impact of cultivated land use on agricultural environment efficiency. China Land Sci. 2019, 33, 62–70. (In Chinese) [Google Scholar]
  36. Ren, P.; Wu, T.; Zhou, J. Analysis of spatial distribution pattern and evolutionary characteristics of cultivated lands based on spatial autocorrelation model and GIS platform-A case study of Longquanyi District, Chengdu, China. Chin. J. Eco-Agric. 2016, 24, 325–334. (In Chinese) [Google Scholar]
  37. Shi, T.; Xu, X.; Hu, Z. Progress in research on appropriate scale management of land. Jiangsu Agric. Sci. 2018, 46, 1–5. (In Chinese) [Google Scholar]
  38. Gao, J. Analysis of spatial and temporal variation characteristics of cultivated land in suburban Shanghai and its influencing factors. Master’s thesis, East China Normal University, Shanghai, China, May 2018. (In Chinese). [Google Scholar]
  39. Nguyen, T.; Cheng, E.; Findlay, C. Land fragmentation and farm productivity in China in the 1990s. China Econ. Rev. 1996, 7, 169–180. [Google Scholar] [CrossRef]
  40. Poudevigne, I.; Alard, D. Landscape and agricultural patterns in rural areas: Acase study in the Brionne Basin, Normandy, France. J. Environ. Manag. 1997, 50, 335–349. [Google Scholar] [CrossRef]
  41. Tan, S.; Heerink, N.; Qu, F. Land fragmentation and its driving forces in China. Land Use Policy 2006, 23, 272–285. [Google Scholar] [CrossRef]
  42. Bai, Z.; Chen, Y.; Xie, B.; Wu, W. The relationship between landscape fragmentation and cultivated land use efficiency-Case of Kangle County, Gansu Province. J. Arid. Land Resour. Environ. 2014, 28, 42–47. (In Chinese) [Google Scholar]
  43. Zang, L.; Su, Y. A literature review and its enlightenment of farmland fragmentation issue. Ecol. Econ. 2019, 35, 79–83. (In Chinese) [Google Scholar]
  44. Bentley, J.W. Economic and ecological approaches to land fragmentation: In defense of a much-maligned phenomenon. Annu. Rev. Anthropol. 1987, 16, 31–67. [Google Scholar] [CrossRef]
  45. Jaeger, J.A.G. Landscape division, splitting index, and effective mesh size: New measures of landscape fragmentation. Landsc. Ecol. 2000, 15, 115–130. [Google Scholar] [CrossRef]
  46. Hung, P.V.; Macaulay, T.G.; Marsh, S.P. The economics of land fragmentation in North of Vietnam. Aust. J. Agric. Resour. Econ. 2007, 51, 195–211. [Google Scholar] [CrossRef] [Green Version]
  47. Kjelland, M.E.; Kreuter, U.P.; Clendenin, G.A. Factors related to spatial patterns of rural land fragmentation in Texas. Environ. Manag. 2007, 40, 231–244. [Google Scholar] [CrossRef] [PubMed]
  48. Demetriou, D.; Stillwell, J.; See, J. A new methodology for measuring land fragmentation. Comput. Environ. Urban Syst. 2013, 39, 71–80. [Google Scholar] [CrossRef] [Green Version]
  49. Yuan, Y.; Jin, Y.; Nie, X.; Ling, R.; Wu, S.; Lan, S. Study on dynamic urban landscape pattern indexes in Shanghai based on Fragstats4. J. Shandong Agric. Univ. (Nat. Sci. Ed. ) 2020, 51, 1157–1162. (In Chinese) [Google Scholar] [CrossRef]
  50. Kowe, P.; Mutanga, O.; Odindi, J.; Dube, T. A quantitative framework for analysing long term spatial clustering and vegetation fragmentation in an urban landscape using multi-temporal landsat data. Int. J. Appl. Earth Obs. Geoinf. 2020, 88, 102057. [Google Scholar] [CrossRef]
  51. Urrutia, A.L.; Gonzalez-Gonzalez, C.; Mora Van Cauwelaert, E.M.; Rosell, J.A. Landscape heterogeneity of peasant-managed agricultural matrices. Agric. Ecosyst. Environ. 2020, 292, 106797. [Google Scholar] [CrossRef]
  52. Grzelak, A. The objectives of farm operations: Evidence from a region in Poland. Agriculture 2020, 10, 458. [Google Scholar] [CrossRef]
  53. Yue, W. Studyon Urban Landscape Pattern and Its Thermal Environment Eeffect Based on Remote Sensing Image. Ph.D. Thesis, East China Normal University, Shanghai, China, May 2005. (In Chinese). [Google Scholar]
  54. Wu, W.; Wang, Y.; Liu, M.; Li, C. A review on the use of landscape indices to study the effects of three-dimensional urban landscape patterns on haze pollution in China. Pol. J. Environ. Stud. 2021, 30, 2957–2967. [Google Scholar] [CrossRef]
  55. Zhou, Y.; Li, X.; Liu, Y. Land use change and driving factors in rural China during the period 1995–2015. Land Use Policy 2020, 90, 05048. [Google Scholar] [CrossRef]
  56. Song, Y.; Qiu, Q.; Guo, Q.; Lin, J.; Li, F.; Yu, Y.; Li, X.; Tang, L. The application of spatial Lorenz curve (SLC) and Gini coefficient in measuring land use structure change. In Proceedings of the 18th International Conference on Geoinformatics, Beijing, China, 18–20 June 2010; pp. 1–5. [Google Scholar] [CrossRef]
  57. Liu, M.; He, Z.; Jiang, L.; Qiu, W.; Zhang, C. Application of space Lorenz curve in land-use and its changes—A case study of Chengguan District of Lhasa, Tibet. Res. Soil Water Conserv. 2010, 17, 228–231. (In Chinese) [Google Scholar]
  58. Huang, Z. Is "family farms" the way to develop Chinese agriculture? Open Times 2014, 33, 176–194. (In Chinese) [Google Scholar]
  59. Taneja, H.; Maney, K. Unscaled: How AI and a New Generation of Upstarts Are Creating the Economy of the Future; Hachette Book Group: New York, NY, USA, 2018. [Google Scholar]
  60. Shi, Y.; Ren, H.; Guo, X.; Tao, T. Implementation and advancement of a rural residential concentration strategy in the suburbs of Shanghai. Land 2020, 9, 367. [Google Scholar] [CrossRef]
  61. Ying, W.; Jin, J.; Jiang, H.; Zhang, X.; Lu, X.; Chen, X.; Zhang, J. Satellite-based detection of bamboo expansion over the past 30 years in Mount Tianmushan, China. Int. J. Remote Sens. 2016, 37, 2908–2922. [Google Scholar] [CrossRef]
  62. Turner, M.G.; Gardner, R.H.; O’Neill, R. Landscape ecology in theory and practice. Geography 2003, 83, 479–494. [Google Scholar]
  63. Rajaei, F.; Sari, A.E.; Salmanmahiny, A.; Delavar, M.; Bavani, A.R.M.; Srinivasan, R. Surface drainage nitrate loading estimate from agriculture fields and its relationship with landscape metrics in Tajan watershed. Paddy Water Environ. 2017, 15, 541–552. [Google Scholar] [CrossRef]
  64. Yu, D.; Qiao, J.; Shi, P. Spatio-temporal patterns, relationships, and drivers of China’s agricultural ecosystem services from 1980 to 2010: A multiscale analysis. Landsc. Ecol. 2018, 33, 575–595. [Google Scholar] [CrossRef]
  65. Shi, Y.; Shi, Y. Spatio-temporal variation characteristics and driving forces of farmland shrinkage in four metropolises in East Asia. Sustainability 2020, 12, 754. [Google Scholar] [CrossRef] [Green Version]
  66. Yuan, X.; Yang, Y.; Zhang, Y. Study on landscape sensitivity and diversity analysis in Yucheng City. Comput. Comput. Technol. Agric. 2016, 9, 48–59. [Google Scholar]
  67. Shi, X. Research on Dynamic Evolution and Driving Mechanism of Cultivated Land Fragmentation Degree in Metropolitan Area. Master’s Thesis, Henan Agricultural University, Zhengzhou, China, June 2011. (In Chinese). [Google Scholar]
  68. Su, R.; Cao, Y. Methods analysis on cultivated land use changes in China: Based on driving and simulation. Chin. J. Agric. Resour. Reg. Plan. 2019, 40, 96–105. (In Chinese) [Google Scholar]
  69. Hou, X.; Liu, J.; Zhang, B.; Zhao, M.; Xia, C. Impact of urbanization on the eco-efficiency of cultivated land utilization: A case study on the Yangtze River Economic Belt, China. J. Clean. Prod. 2019, 238, 117916. [Google Scholar] [CrossRef]
  70. Wellmann, T.; Haase, D.; Knapp, S.; Salbach, C.; Selsam, P.; Lausch, A. Urban land use intensity assessment: The potential of spatio-temporal spectral traits with remote sensing. Ecol. Indic. 2018, 85, 190–203. [Google Scholar] [CrossRef]
  71. Abdollahzadeh, G.; Kalantari, K.; Sharifzadeh, A.; Sehat, A. Farmland fragmentation and consolidation issues in Iran: An investigation from landholder’s viewpoint. J. Agric. Sci. Technol. 2012, 14, 1441–1452. [Google Scholar]
  72. Hartvigsen, M. Land reform and land fragmentation in Central and Eastern Europe. Land Use Policy 2014, 36, 330–341. [Google Scholar] [CrossRef]
  73. Sklenicka, P.; Zouhar, J.; Trpáková, I.; Vlasák, J. Trends in landownership fragmentation during the last 30 years in Czechia, and a projection of future developments. Land Use Policy 2017, 67, 640–651. [Google Scholar] [CrossRef]
  74. Standing Committee of the Shanghai Municipal People’s Congress. Announcement of the Standing Committee of the Shanghai Municipal People’s Congress (No. 55). Regulations on Promoting the Development of Family Farms in Shanghai. 2020-11-27. Available online: https://www.sohu.com/a/435912581_120209938. (accessed on 15 December 2020).
  75. Dijk, T.V. Scenarios of central European land fragmentation. Land Use Policy 2003, 20, 149–158. [Google Scholar] [CrossRef]
  76. Tian, L.; Li, Y.; Shao, L.; Zhang, Y. Measuring spatio-temporal characteristics of city expansion and its driving forces in Shanghai from 1990 to 2015. Chin. Geogr. Sci. 2017, 27, 875–890. [Google Scholar] [CrossRef]
  77. Simons, S. Land fragmentation in developing countries: The optimal choice and policy implications. Explor. Econ. Hist. 1988, 25, 254–262. [Google Scholar]
  78. FAO. Coping with the Food and Agriculture Challenge: Smallholders’ Agenda. In Preparation and Outcomes of the 2012 United Nations Conference on Sustainable Development; Food and Agriculture Organization of the UN: Rome, Italy, 2013. [Google Scholar]
  79. Yucer, A.; Kan, M.; Demirtas, M.; Kalanlar, S. The importance of creating new inheritance policies and laws that reduce agricultural land fragmentation and its negative impacts in Turkey. Land Use Policy 2016, 56, 1–7. [Google Scholar] [CrossRef]
  80. Yao, S. Family farms have become an important choice in agricultural modernization by optimizing resource allocation and developing scale operation. Shanghai Rural. Econ. 2020, 40, 9–11. (In Chinese) [Google Scholar]
  81. Yang, Y. Optimal mode of agricultural moderate scale management based on measurement of moderate scale of Wugang City in Hunan Province. Asian Agric. Res. 2018, 10, 7–10. [Google Scholar]
  82. King, R.L. Land fragmentation: Notes on a fundamental rural spatial problem. Prog. Hum. Geogr. 1982, 6, 475–494. [Google Scholar] [CrossRef]
  83. Shi, Y.; Yang, B. Reflections on and countermeasures against implementing strategy of “Three Concentrations” in suburban Shanghai. J. Tongji Univ. (Soc. Sci. Ed. ) 2004, 15, 7–12. (In Chinese) [Google Scholar]
  84. Fujita, M.; Krugman, P. The new economic geography: Past, present and the future. Pap. Reg. Sci. 2004, 83, 139–164. [Google Scholar] [CrossRef]
  85. Ye, X.; Weng, N. Farmland concentration with half a century delay: A difficult conversion from small scale to large scale farming in Japan and its implications. Chin. Rural. Econ. 2018, 34, 124–137. (In Chinese) [Google Scholar]
  86. Dijk, T.V. Complications for traditional land consolidation in Central Europe. Geoforum 2007, 38, 505–511. [Google Scholar] [CrossRef]
  87. Ji, M.; Li, L. Agricultural production trusteeship: The main form of scale management of agricultural services. Issues Agric. Econ. 2020, 41, 68–75. (In Chinese) [Google Scholar]
  88. Hu, X.; Wang, M.; Wu, X. Factor allocation and agricultural scale operation development: An investigation of the dimension of division of labor. Guizhou Soc. Sci. 2018, 347, 149–154. (In Chinese) [Google Scholar]
Figure 1. Map of land use in Shanghai in 1990, 1995, 2000, 2005, 2010, 2015, and 2018.
Sustainability 14 08697 g001
Figure 2. Spatial distribution maps of cultivated land in the suburbs of Shanghai (1990–2018).
Sustainability 14 08697 g002
Table 1. Remote sensing images used in this study.
YearSatelliteResolution RatioDate
1990Landsate-5(TM)30 m13 July 1990
1995Landsate-5(TM)30 m11 July 1995
2000Landsate-5(TM)30 m6 June 2000
2005Landsate-5(TM)30 m17 October 2005
2010Landsate-5(TM)30 m24 May 2010
2015Landsate-8(OLI)30 m3 August 2015
2018Landsate-8(OLI)30 m26 July 2018
Table 2. Percentage of each land use and its change over time.
Year CroplandForestGrasslandWater BodiesBuilt-UpUnused
1990Area (ha)479,340.249984.311312.7526,557.65102,992.500
Percentage (%)77.291.610.214.2816.610
1995Area(ha)445,990.759988.54458.9128,328.31135,355.2495.74
Percentage (%)71.911.610.074.5721.820.02
2000Area (ha)438,455.039749.01472.5928,575.94142,934.880
Percentage (%)70.701.570.084.6123.050
2005Area (ha)401,897.9510,583.77627.5326,844.60180,251.310
Percentage (%)64.801.710.104.3329.060
2010Area (ha)356,791.059635.90604.5926,617.67226,567.93280.11
Percentage (%)57.501.550.104.2936.510.05
2015Area (ha)338,381.459332.48532.7826,745.26245,647.530
Percentage (%)54.521.500.094.3139.580
2018Area (ha)335,737.629247.14528.0326,458.20248,619.35681.21
Percentage (%)54.031.490.084.2640.030.11
Table 3. The calculation formula and definitions of landscape pattern indexes.
AcronymNameFormulaDefinition
NPNumber of patches N P = n i n i is the number of patches contained in type i
MPSMean patch size M P S = C A n i C A   is the type of patches area, n i is the number of patches of type i
PDPath density P D = n i A 10000 100 n i is the number of patches of type i , A is the total area of all landscapes
LPILargest path index L P I = max a i j A 100 a i j is the area of patch i j , A is the total area of all landscapes
LSILandscape shape index L S I = e i m i n e i 10000 100 e i is the total edge length or perimeter of type patch, and
m i n e i is the possible minimum value of e i
Note: Type i represents the landscape type of cultivated land, while patch ij represents the patch of cultivated land.
Table 4. The calculation formula and definitions of landscape structure indexes.
AcronymNameFormulaDefinition
AIAggregation index A I = i = 1 m g i i max g i i p i 100 g i i is the number of similar adjacent patches of the corresponding landscape type; p i is the area ratio of type patches
MNNMean nearest distance M N N = j = 1 n m i n ( d i j ) m i d i j   is the distance between patches i and j ,   m i is the number of type patches with the closet distance
DIVISIONLandscape division index D I V I S I O N = 1 j = 1 n a i j A 2 a i j is the area of patch i j , A   is the total number of landscape grids
CONNECTConnectance index C O N N E C T = j = k n c j k n i n i 1 2 100 c j k   is the number of connections between patch j and patch k related to patch type i ; n i   is the number of patches i
COHESIONPath cohesion index C O H E S I O N = 1 j = 1 n p i j j = 1 n p i j a i j 1 1 A 1 100 p i j   is the perimeter of patch i j , a i j is the area of patch i j ; A   is the total number of landscape grids
SPLITSPLIT index S P L I T = A 2 j = 1 n a i j 2 A is the total landscape area; a i j is the area of patch i j
Note: Type i represents the landscape type of cultivated land, while patch ij represents the patch of cultivated land.
Table 5. Index system for driving force analysis of the landscape aggregation degree of cultivated land.
Grade I IndexesGrade II IndexesUnit
Economic development (X1)Per capita gross domestic product (X11)Yuan
Rural disposable income per capita (X12)Yuan
Newly increased fixed assets (X13)100 million yuan
Industrial restructuring (X2)Gross output value of industry (X21)100 million yuan
Proportion of tertiary industry (X22)100 million yuan
Urbanization (X3)Increase in urban resident population (X31)10,000 people
Proportion of construction land area (X32)%
Investment in real estate development (X33)100 million yuan
Length of road (X34)km
Agriculture science
and technology (X4)
Total power of agricultural machinery (X41)million kilowatts
Table 6. Pearson correlation analysis results.
IndexCorrelation Coefficientp-Value
X11−0.934 **0.002
X12−0.849 *0.016
X13−0.918 **0.000
X21−0.934 **0.002
X22−0.894 **0.007
X310.651 **0.001
X32−0.951 **0.001
X33−0.882 **0.009
X34−0.970 **0.000
X410.790 *0.035
Note: * p < 0.05, ** p < 0.01. According to the significance test method, p < 0.05 is generally as significant, and p < 0.01 is considered very significant. If the correlation coefficient is positive, it is called positive correlation, indicating that the two variables change in the same direction. If the correlation coefficient is negative, it is called negative correlation, indicating that the two variables change in opposite directions. Pearson correlation coefficient is between 1 and −1, and the greater the absolute value of the coefficient, the greater the correlation degree.
Table 7. Kaiser-Meyer-Olkin (KMO) and Bartlett spherical tests.
Kaiser-Meyer-Olkin Measure of sampling Adequacy0.732
Bartlett test for sphericityApproximate Chi-Square280.459
Degrees of freedom45
Statistical significance (Sig.)0.000
Table 8. The results of principal component analysis (PCA).
ComponentValue of Characteristic Root% of VarianceCumulative %
18.12181.20781.207
21.40314.03395.240
30.3683.68298.922
40.0600.60099.522
Table 9. Factor loading matrix after rotation.
IndexFirst Principal ComponentSecond Principal Component
X110.975−0.171
X120.951−0.279
X130.9780.194
X210.9740.024
X220.972−0.005
X31−0.1220.951
X320.9910.058
X330.970−0.238
X340.979−0.139
X41−0.721−0.523
Table 10. Goodness of fit, F-test and t-test of the regression model.
RR2Adjusted R2Errors in Standard Estimates
0.9690.9390.9090.114
F-testt-Test
FStatistical Significance (sig)tsig
30.8700.004−7.7150.002
−1.4890.004
Table 11. Index of landscape pattern of cultivated land in the suburbs of Shanghai (1990–2018).
YearNPMPSPD/100 haLPI/%LSI/100 ha
19902122261.040.03423.1643.89
19951034330.010.02020.5045.93
20001552828.740.02519.6346.85
20052191835.150.03519.8048.75
20103101150.940.05012.4952.91
2015670505.050.10812.5052.60
2018613501.020.1821.8552.28
Table 12. Landscape structure index of cultivated land in the suburbs of Shanghai (1990–2018).
YearAI/%DIVISIONCOHESION/%MNNCONNECT/%SPLIT
199098.140.888999.93175.301.791.6812
199597.980.906799.93160.893.411.7123
200097.920.911699.92159.632.061.7791
200597.740.910999.92155.781.433.4326
201097.390.958399.86180.821.133.5071
201597.340.961699.85200.980.713.5248
201897.200.994299.84202.450.493.8821
Table 13. Aggregation index and SPLIT index of cultivated land and their changes in the suburbs of Shanghai.
RegionDistrictIndex1990200020102018
The inner suburbsBaoshanAI/%96.868396.168994.691794.7574
SPLIT1.12031.25877.29925.9689
JiadingAI/%97.788997.029095.490095.6742
SPLIT1.03221.05102.08781.9077
MinhangAI/%96.731096.212694.975194.2682
SPLIT3.00103.48647.58709.9575
PudongAI/%98.201697.846597.325197.1281
SPLIT1.60421.82572.76322.9895
The outer suburbsSongjiangAI/%97.780997.602296.747596.6099
SPLIT2.10162.21574.39636.4727
QingpuAI/%97.364497.156796.365396.2195
SPLIT1.47521.49981.92661.9759
JinshanAI/%98.677798.634797.936197.9239
SPLIT1.50761.50721.56221.5795
FengxianAI/%98.727898.712798.158998.0094
SPLIT1.94201.93741.93771.9431
ChongmingAI/%98.550998.271898.120298.1202
SPLIT1.26971.27691.25991.2516
Table 14. Agricultural scale operation household statistics in the suburbs of Shanghai.
YearAgricultural Production OperatorsLarge-Scale Agricultural Production Operation HouseholdsAgricultural Production and Business Units
19961,087,60029003200
2006640,40051002800
2016558,90079005700
Note: Since 1990, Shanghai has conducted three agricultural censuses in 1996, 2006 and 2016.According to the actual situation of rural production in Shanghai, the statistical scope of medium-scale production operation households is clearly defined as follows: (1) the cultivated land is more than 3.33 ha, (2) more than 100 pigs are raised, (3) the poultry output is more than 10,000, (4) egg production is above 20 tons, and (5) he annual income of comprehensive agriculture is above 100,000 yuan. Whether planting, breeding, or conducting comprehensive agricultural management, if one of the above conditions is met, then it shall be counted as a scale production operation household. Data sources: Shanghai Agricultural Census Data Compilation.
Table 15. Development of specialized farmer cooperatives in the suburbs of Shanghai.
YearNumber of Specialized Farmer CooperativesTotal Number of MembersDrive the Number of Nonmember Farmers
2013320069,578106,322
2014319268,164122,169
2015321664,561122,809
2016320264,421122,848
2017281362,966144,200
2018286562,686146,393
2019275758,662133,888
Table 16. Statistics on family farms in the suburbs of Shanghai.
YearNumber of Family FarmsThe Number of Farms with Less Than 6.67 ha of Arable LandThe Number of Farms with 6.67–10 ha of Arable LandThe Number of Farms with More Than 10 ha of Arable LandNumber of Family Farmers
201318937847473624914
2014306796413567478105
20153829997183399910,005
201642438102191124210,604
201745168002219149711,351
201844346502192159210,771
201943476192088164010,731
Table 17. Changes in cultivated land scale in the suburbs of Shanghai.
YearTotal Cultivated Area
(104 ha)
Average Occupies Arable Land per Rural Population (m2)Average Occupies Arable Land per Rural Employee (m2)
199032.327731293
200028.597311048
201020.10598969
201915.896731109
Publisher’s Note: MDPI stays neutral with regard to jurisdictional claims in published maps and institutional affiliations.

