Abstract
The ongoing exponential growth of human population poses a risk to sustainable development goals (SDGs). Unless we understand the drivers of this growth and inform policy development accordingly, SDGs would remain a dream. One of the old theories of population growth known as the Malthusian theory predicts that resource availability drives population growth until a certain time when population growth outrun resource availability, leading to all sort of crises summarized as Malthusian crisis. Although the link between economic growth and population has been widely investigated while testing the theory, little is known about environmental and social factors potentially driving population growth. Here, because of various crises of our time recalling the Malthusian crisis, we revisited the theory by fitting structural equation models to environmental, social and economic data collected over 30-year period in South Africa. None of the social variables tested predicts population growth. Instead, we found that biodiversity (species protection index) correlates positively with population growth. Biodiversity provides various resources through ecosystem goods and services to human, thus supporting population growth as predicted in the Malthusian theory. However, we also found that this population growth may lead to conservation conflict as we found that biodiversity habitat (wetland area) correlates negatively with population growth, thus raising the compromising effect of population growth on life on earth. What’s more, we found a significant link between economic growth measured as GDP and population growth, further supporting the Malthusian prediction. Overall, our study re-affirms the value of biodiversity to human and suggests that the Malthusian theory should continuously be tested with predictors other than economic.
1. Introduction
The population debate is one of the most critical topics in sustainability discourse [1]. Broadly, there are three major themes that guide the debate. Firstly, the nature and extent of population change is interrogated [2,3,4]. Secondly, the role and importance of underlying drivers of population dynamics are also explored [5,6], and lastly, the population-sustainability nexus is investigated [7]. These themes constitute the bases of the debate regarding the importance of population dynamic in sustainability studies.
Indeed, the global population was estimated to be 7.9 billion people in 2021 [8], the majority of which is found in Asia and Africa which host 59.8% and 16.9% of the human population, respectively [1,9]. Most notably, China and India are the most populous countries, each with a population of over 1 billion people [8]. Although Africa has considerably lower population size in relation to Asia, the continent exhibits the highest population growth rate among all the continents with an annual growth rate of 2.45% [9]. This makes Africa one of the key contributors to the global human population change and an important case study for population studies.
Studies of the relationship between population and the economy usually adopt population growth as the predictor of economic performance [10,11,12]. However, the economy has lot of potential to impact population dynamic by improving the standard of living which in turn increases life-expectancy, net migration, and reduced mortality rates due to improved healthcare systems [12,13,14,15]. Although economic drivers of population dynamics are key, the impact of social and environmental factors on population dynamics, two of the three pillars of sustainability, are equally important but remain largely overlooked (but see [16]).
In general, the population-sustainability studies aim to understand the relationship between population and the different pillars of sustainability to guide public discourse and decision-making processes. This debate has historical origins which can be traced back to the conception of the Malthusian theory [17]. The theory noted the exponential increment of the human population and predicted that this exponential growth will ultimately outstrip the available resources which are constrained to linear growth, leading to all sorts of catastrophes such as famine and war [18,19]. However, the Malthusian theory remains controversial because the initially predicted collapse of human population did not occur mainly due to technological development [20].
Nevertheless, the recent surge of various socio-economic and environmental calamities (e.g., famine, political unrests, COVID-19 or Ebola pandemics, etc.) which recall the predicted Malthusian crisis makes the theory still relevant in the sustainability space [19]. As such, the emerging socio-economic and environmental calamities necessitate the re-evaluation of the Malthusian theory particularly in the developing world, a world experiencing a slow-to-no technological development [21,22]. Since technological development is acknowledged as the major factor preventing the Malthusian crisis [1,16], the focus on the developing world to test the theory becomes justified. More critically, the test of Malthusian theory focused mainly on the relationships between food availability or economic growth versus population growth (e.g., [19]), thus neglecting socio-environmental factors as drivers of population dynamics [16]. We suggest that both social and environmental factors are as equally important as the economic factors in driving population dynamics.
For example, the developing world experiences the poorest environmental conditions. Both air quality, biodiversity, and natural habitat parameters, among others, show continuous decline in quality with high potential for human and ecological calamities [23,24]. The coal-intensive energy sector, increasing land-use change, and overexploitation of natural resources are seen as imminent threats to air quality, species survival and ecological health [25,26,27]. These parameters have notable effects on human population dynamics, and this link has recently been termed the “new Malthusianism” [16]. Air pollution, in particular, is regarded as one of the leading causes of premature mortality, especially in developing regions [28]. Consequently, it is expected that the increasing environmental degradation may have a controlling effect on population dynamics [16].
Furthermore, the impact of social and political factors on population dynamics is usually studied in relation to the functioning and effectiveness of socio-political institutions [29]. Most commonly, political stability, policy effectiveness, and corruption have been used to assess effectiveness of social and governance institutions [30,31,32]. Also, these factors have been shown to affect population dynamics either through direct population control measures (e.g., China) or through indirect impact on human behaviour [33,34]. Like most developing regions, South Africa has historically experienced and continues to experience a surge of political unrest, corruption, and social instability [35,36], and these social stressors are expected to affect population growth.
Do these socio-environmental factors also drive population dynamics as predicted for economic factors in the Malthusian theory? The present study, as opposed to most studies which rather tested the Malthusian theory through the economic or food lens, aims to investigate this question in the context of developing regions focusing primarily on social and environmental factors. Specifically, we determined whether the social and environmental factors alongside various economic metrics drive population changes in South Africa.
2. Materials and Methods
2.1. Study Area
South Africa is a developing country located at the southern-most tip of the African continent. With a latitudinal span of 22° S to 35° S and a longitudinal span of 17° E to 33° E, South Africa has a land surface area of 1,219,602 km2 [37]. South Africa host a wide diversity of terrestrial and marine biodiversity and ecosystems, making it one of the most ecologically rich regions in the world. Biodiversity in South Africa is unusually rich with its flora comprising ~ 24,000 species. South Africa is one of the 17 megadiverse countries in the world with nine biomes [38] and a vast network of protected areas [39]. South Africa also hosts three major biodiversity hotspots is the only country hosting an entire floral Kingdom [40]. In the Cape Floral Kingdom, over 9000 plant species are recorded, 70% of which are endemic to the kingdom. A recent study reported that 1400–1500 plant species might still be missing in South Africa’s biodiversity assessment, suggesting that the country’s flora might be close to 26,000 species [41]. South Africa is also rich in wetlands, which are natural fabrics providing a range of ecosystem services. Unfortunately, 35% to 60% of South Africa’s wetlands is lost or severely degraded [42]. Also, there are prevalently high rates of atmospheric emissions from both household and industrial origins [43].
South Africa is one of the most populous countries in Africa with an estimated population of 60,142 thousand people in 2021 [44]. The high population is jointly attributed to high fertility and migration rates. Additionally, similar to global patterns, there is a rapid increase in the country’s urban populations which present unique socio-environmental challenges [45]. The economic landscape of South Africa is characterised by a high unemployment rate [46]. Furthermore, South Africa is rated one of the most unequal societies based on social and economic indicators. Additionally, South Africa is faced with increasing cases of social and political unrest, high incidences of corruption and lack of accountability, especially among government institutions [47,48,49].
2.2. Data Collection
Data analysed in this study were retrieved from the database of the Yale University, USA, domiciliated at www.epi.yale.edu, accessed 22 August 2022. Data in this repository were primarily collected for the calculation of the 2020 Environmental Performance Index for 180 countries [50] and span 30 years (1990–2019) with a one-year temporal resolution. These data were sourced from various origins, including international organizations, research institutions, academia, and government agencies (Table S1) and were documented using various data collection instruments, including Remote sensing, Observations from monitoring stations, Surveys and questionnaires, Estimates derived from both on-the-ground measurements and statistical models, Industry reports and verifiable government statistics [50].
For the present study, five (05) variables were retrieved to cover, for South Africa, all three (03) pillars of sustainability, that is, environmental, social, and economic pillars. These five variables include (i) Biodiversity and Habitat, (ii) Air pollution, (iii) Environmental Management, (iv) Governance and (v) Economy (Table S1). Biodiversity and habitat, air pollution, and environmental management form the environmental pillar of sustainability in this study, whereas governance was employed as the social pillar, and the economy made up the last pillar of sustainability (Table S1). Several indicators were used to measure each of these 5 variables: (i) biodiversity and habitat were measured by 9 indicators (Marine Protected Area, Protected Areas, Species Habitat Index, Species Protection Index, Fish Stock, Fish Catch, Terrestrial Protected Areas, Wetland Areas, and Grassland Area), (ii) Air pollution by 7 indicators (Fluorinated Gases emissions, N2O Emissions, NOX Emissions, Black Carbon emissions, Sulphur dioxide emissions, and CO2 emission from land cover changes), (iii) Environmental Management by 1 indicator (Sustainable Nitrogen Management), (iv) Governance by 6 indicators (Control on Corruption, Government Effectiveness, Rule of Law, Regulatory Quality, Political Stability and Absence of Violence, Voice and Accountability) and (v) Economy by 4 indicators (value added by services, Area of economic exclusion zone, Gross Domestic Product, Economic Freedom) (Table S1). All data collected are presented in Table S2.
2.3. Data Analysis
All analyses were done in R4.1.2 [51] and the R scripts used are presented in Supplemental Information. Prior to analysis, data were treated as explained below.
2.3.1. Data Imputation and Data Rescaling
The time series data that were collected have missing observations for some of the years (Table S2a); see also Figure S1 for missing patterns). We then imputed the missing values using the multivariate imputation by chain equations (MICE) method [52] employing the mice function in the MICE package [53]. In addition, because variables are in varying scales, we have rescaled them as follows: rescaled variables = (observation − mean)/standard deviation, and rescaled variables were used in the analyses described below (Table S2b).
2.3.2. Selection of Indicators to Represent Each of the 5 Variables
Apart from the variable ‘environmental management’, all other variables have more than one indicator (Table S1). Two different approaches were used to select the most suitable indicators to represent each variable.
Firstly, because population dynamic is the response variable we aim to model in this study, each indicator of each of the 5 variables mentioned above was used as a predictor of population (re-scaled value) in an iterative stepwise regression process by fitting the Generalized Linear Models (GLM) with Gaussian error family. As such, 27 models were fitted during this process and, for the set of models involving different indicators of each variable, the Akaike Information Criterion (AIC) value was used to select the best model, thus the best indicator for that variable. This means that, for a given variable, the indicator used in the model showing the lowest AIC value was selected as representing that variable). From this exercise, the indicator ‘species protection index’ (SPI) was selected to represent the variable ‘Biodiversity and Habitat’ whereas ‘methane emissions’ (CH4) was selected for ‘air pollution’, and ‘sustainable nitrogen management’ (SNM) represents the variable ‘environmental management’. Also, the indicator ‘control on corruption’ (CCO) was selected to represent ‘governance’ (thus social pillar of sustainability; Table S1), and the ‘gross domestic product’ (GDP) represents the variable ‘economy’ (see Table S3). This approach of indicator selection is termed ‘method 1’.
Secondly, for a variable, we run a pairwise correlation analysis among the set of indicators representing that variable, using Spearman correlation test. For a pair of indicators, when a correlation coefficient r ≥ 0.5, we considered these indicators as strongly correlated. In cases where two or more indicators were found to be strongly correlated, only a single indicator was selected, and the others were excluded from further analyses (Table S4). From this selection process, three air pollution indicators (CO2 emission from land cover changes, methane, and N20 emissions), five biodiversity and habitat indicators (Protected areas, species habitat index, fish stock, fish catch, and wetland area), three economic indicators (gross domestic product, economic freedom index, and area of economic exclusion zone), and three indicators for governance (government effectiveness, rule of law, political stability, and lack of violence) were selected and used for further analysis. This approach of indicator selection is termed ‘method 2’.
2.3.3. Structural Equation Modelling
We fitted a structural equation modelling (SEM) to the data initially treated as explained above (re-scaled values for selected variables were used in the SEM analysis). This multivariate analysis technique includes a combination of factorial and regression analyses to test relationships along predefined structural paths. The theory and use of SEM is explained in detail elsewhere (see [5,54]). The SEM was fitted using the R library Lavaan [55] with the Maximum Likelihood (ML) estimation method [56,57].
Using the indicators that were selected in our ‘method 1’, an SEM (referred to as SEM1) was created (see R script). Although it is recommended that at least two model evaluation indices should be used to assess the goodness-of-fit of SEM and that the Chi-square test (X2) be prioritised as one of the most robust evaluation indices, the X2 measure was excluded from our evaluation based on the size of the sample that was used (X2 is very sensitive to sample size [54]). Rather, the goodness-of-fit of the SEM was determined based on the Comparative Fit Index (CFI) and the Root Mean Square Error of Approximation (RMSEA). These parameters were interpreted following ref. [54]: CFI ≥ 0.95 and RSMEA < 0.09 for a good fit. For our SEM, CFI = 0.942 and RMSEA = 0.541, indicating a poor fit for the SEM. To improve the fit of our SEM, the variables that were used in the model were revised with reference to how best they correlate with the response variable in the model: the Environmental Management variable had the worst fit parameter (p = 0.879) and was therefore excluded from the model. After the model was rerun (without the Environmental Management variable), the selected evaluation indices showed a good fit (CFI = 1.00; RMSEA = 0.00). This means that the model provides a good representation of the data.
Using the indicators that were selected based on our ‘method 2’ (pairwise regression between indicators of a specific variable), all the 135 possible combinations of the selected indicators (3 air pollution indicators × 5 biodiversity and habitat indicators × 3 economic indicators × 3 governance indicators) were mapped as shown in Figure S2. An SEM for each possible combination were fitted and the goodness-of-fit for each model was evaluated using the AIC value. The best of the 135 SEMs fitted was selected based on AIC value (AIC = 207.809; CFI = 1.0; RMSEA = 0.00). In this best SEM (referred to as SEM2) are the following indicators: methane representing the variable ‘air pollution’, wetland area (WTA) representing ‘biodiversity and habitat’, GDP for ‘economy’ and government effectiveness (GOE) for ‘governance’. The AIC values for all the SEMs are summarized in Table S5
2.3.4. Ethical Considerations
We adhered to all the ethical principles of the University of Johannesburg whose ethical committee approved the present study under the reference # 2022-02-04/Phogole_Yessoufou.
3. Results
Drivers of Population Change
For both SEM1 and SEM2, CFL = 1.0 and RMSEA = 0.00, suggesting a good fit of our models to the data. Irrespective of the SEM considered, similar variables predict human population change: SEM1 (biodiversity and habitat, β1 = 0.35 ± 0.07, p < 0.01; and economy, β1 = 0.76 ± 0.09, p < 0.001; Table 1 and Figure 1) and SEM2 (biodiversity and habitat, β2 = −0.191 ± 0.08, p = 0.013; economy, β2 = 1.024 ± 0.11, p < 0.001; Table 2 and Figure 2).

Table 1.
Regression coefficients in SEM1 where Air pollution = CH4; Biodiversity and habitat = Species Protection Index; Economy = Gross Domestic Product; Governance = Control of Corruption (CCO); Pop = population. * indicates the significance level of a relationship.
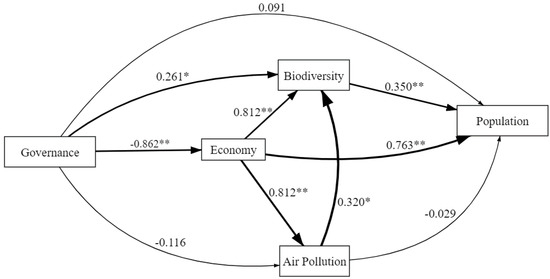
Figure 1.
Illustration of SEM1 where Air pollution = CH4; Biodiversity and habitat = Species Protection Index; Economy = Gross Domestic Product; Governance = Control of Corruption (CCO). * Significant path (p < 0.05). * means marginal significance level and ** means moderate significance level of a relationship.
Table 2.
Regression coefficients in SEM2 where Air pollution = CH4; Biodiversity and habitat = Wetland Area; Economy = Gross Domestic Product; Governance = Government Effectiveness (GOE); Pop = population. * means significance level of a relationship.
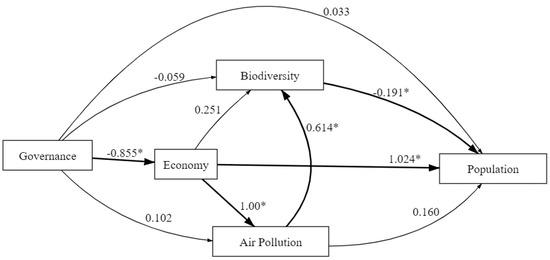
Figure 2.
Illustration of SEM2 where Air pollution = CH4; Biodiversity and habitat = Wetland Area; Economy = Gross Domestic Product; Governance = Government Effectiveness (GOE). * means significance level of a relationship.
Furthermore, a negative significant relationship was observed between governance and the economy: SEM1 (β1 = −0.86 ± 0.09, p < 0.01) and SEM2 (β2 = −0.86 ± 0.1 p < 0.001), and a positive relationship between the economy and air pollution: SEM1: (β1 = 0.81 ± 0.15, p < 0.01) and SEM2 (β2 = 1.00 ± 0.14, p < 0.001). Additionally, variations in biodiversity could be explained by air pollution: SEM1 (β1 = 0.320 ± 0.16, p = 0.047) and SEM2 (β2 = 0.641 ± 0.19, p = 0.002), and also governance (β1 = 0.26 ± 0.13, p = 0.046), and the economy (β1 = 0.85 ± 0.18, p < 0.01) but only in SEM1 (Table 1 and Table 2; Figure 1 and Figure 2).
4. Discussion
4.1. Proximal Drivers of Population
Irrespective of how indicators of variables were selected, we found that biodiversity (species protection index or biodiversity habitat measured as wetland area) and economy (measured as GDP) correlate significantly with population. However, species protection index correlates positively with population while wetland area correlates negatively. Several studies also reported a positive co-variation between biodiversity (e.g., wildlife species richness [58,59,60,61] or plant diversity [62]) and human population. One explanation is that both biodiversity and population may simply co-vary with environmental parameters [62], thus justifying the structural equation model fitting approach used in the present study. Indeed, in their recent study, Davies et al. [62] demonstrated that environmental energy (measured as actual evapotranspiration) predicts human population density in southern Africa, but that biodiversity has a stronger predictive power for human population density in the same region, suggesting that there is more than a simple covariation of both biodiversity and population with environmental parameter in the relationship between biodiversity and human population. Our study complements that of ref. [62] suggesting that it is not just population density that correlates with biodiversity but also population growth too. Both studies therefore highlight how close is the link between biodiversity and human population.
Another explanation for the positive link between biodiversity and human population is that biodiversity provides to human a life support system through the provision of various ecosystem services, including regulating (e.g., carbon sequestration and clean air), provisioning (e.g., food and medicine) and cultural services [63,64]. Specifically, areas richer in biodiversity (e.g., phylogenetic plant diversity) correspond to areas with greater ecosystem services [62,65] that improve human well-being [60], and such areas match areas with high human population settlement in southern Africa [62]. Our finding suggests that biodiversity may drive population dynamic, mirroring the predictions of the Malthusian theory which indicates that resource availability (here biodiversity) would drive changes in population to a certain point in time where population would overtake resource growth, leading to the Malthusian crisis [66].
One of the manifestations of the Malthusian crisis is environmental degradation due to over-exploitation of natural resources grounded on exponential population growth [66]. It is therefore not surprising that we found a significant negative relationship between biodiversity habitat (here, wetland area) and human population in our study, reflecting the impacts of anthropogenic pressures on natural resources. Such pressures include demand for energy, demand of land for agriculture and demand for many more ecosystem services (e.g., water purification) that wetlands provide to human [67,68]. In search for these services, human eventually over-exploit wetlands (and natural habitats at large; [69], leading to the reduction of the extent of such sensitive ecosystem, thus justifying the negative relationships we found between wetland area and human population over the last 30 years. For example, 65% of South Africa’s wetland ecosystems are at risk of collapse, and 22% of South Africa’s natural terrestrial habitats are already lost, the most important loss occurring particularly in fynbos, grasslands, and Indian ocean costal belt [69]—the conservation conflict of Balmford et al. [58]. It is also reported elsewhere that population drives the loss of biodiversity (e.g., [52,70], and this loss may lead to uncalled-for consequences on human species itself [66], thus calling for actions to fix population growth.
What drives population growth? Apart from biodiversity as reported above, we also found that economic growth (GDP) is a significant and positive predictor of population change. The positive relationship between the two, i.e., the economy and population, is not unique to this study [15,19]. The impact of economic growth on population change can be explained by the economically sustained technological advancements. Such advancements improve healthcare and food security, which in turn lead to higher birth rate and lower mortality rates as well as increased food productivity that stimulates population growth as predicted in the Malthusian theory. As a support to this, ref. [20] found that well-off people who traditionally exhibit low fertility rate are now showing high fertility rate due to technological advancement. Other studies have also reported significant relationships between economic performance and different indicators of population such as child nutrition, infant mortality, and suicide rates [13,14,71].
4.2. Distal Drivers of Population
4.2.1. Economy, Air Pollution, and Biodiversity
We found a significant positive relationship between economic performance and air pollution. The energy fuelling South Africa’s economy is heavily based on coal [72], which is a source of dirty energy. It is therefore not surprising that we found a positive and significant correlation between South Africa’s economy and pollution. Our indicator of pollution is methane, a GHG linked to climate change [73]. As such, industrialisation coupled with over-reliance on conventional energy sources such as coal may be driving economic development, but this is not environmentally sustainable, calling for a progressive transition to green economy.
Several studies have observed similar patterns both at country and regional contexts [74,75,76]. However, there is an emerging dissociation of GDP from atmospheric pollution, which may be driven by increasing adoption of clean energy resources, especially in developed regions [77,78]. This pattern, however, cannot be expected in developing regions which are still in the early stages of economic development and with heavy reliance on fossil fuels such as coal and biomass [79]. These contrasting observations between developed and developing regions align to the Environmental Kuznets Curve (EKC) hypothesis which states that environmental pollution would proportionally increase in response to economic development until a critical point is reached [80]. This critical point, which is characterised by high income levels, would enable a transition towards the adoption of cleaner energy sources and less emission-intensive economy. This is supported by a recent study which shows that economic growth in South Africa is strongly linked to the emission of major air pollutants [81]. This then suggests that, unless moderating measures are instituted, the South African emissions levels will continue to rise in response to the need for economic growth until an optimal economic standard is achieved which will then enable the decoupling of atmospheric emissions from economic performance.
Furthermore, we also found that the economy is positively linked to biodiversity (measured as species protection index). Several authors have demonstrated the biodiversity-economy nexus [82,83,84]. Economic growth may promote species protection by making the resources necessary for biodiversity conservation available. Conversely, it can also hamper species protection by threatening the establishment and maintenance of protected areas [85]. In South Africa, some protected areas are largely dependent on financial support from the state, although few financially self-sustaining protected areas are also recorded in the country [86], supporting the relationship we found between biodiversity and economy. It is evident, however, that species protection is more complex and dependent on a myriad of factors which transverse economic, cultural, and political factors. Therefore, this presents an important opportunity for future research on the drivers of biodiversity protection in a country like South Africa that is rich in endemic biodiversity, and with a history of biodiversity-linked international relations, deep cultural values that are aligned to nature, and substantial economic reliance on ecotourism.
Finally, we found a significant positive relationship between air pollution and biodiversity. This is because, as showed above, both biodiversity and pollution co-vary with economy.
4.2.2. Governance and Its Impact on the Economy and Biodiversity
Governance, which is measured by the level of government effectiveness and control of corruption, was shown to significantly impact the economy and biodiversity. When considering the level of corruption as an indicator for governance, the negative link we found between governance and economic performance was expected as economic growth is reliant on good governance. As indicated by Dalyop [29], poor governance leads to increased uncertainty and risks which reduce investment and the overall economic performance. Surprisingly, government effectiveness, as another indicator for governance, was found to be negatively related to the economic performance. The potential reason for this observation may be related to the metric for measuring government effectiveness. The indicator for government effectiveness was derived from public perceptions which may not reflect the actual government performance driving economic growth. This is because public perception may be informed by factors that do not reflect the actual performance of a subject [87]. The issue of governance and economic performance is particularly more complex in South Africa, given its historical and contemporary political and socio-economic structures. Not only is it relevant for governance to influence economic performance, but economic performance may also impact government effectiveness and control of corruption. This is more important in a country that has high levels of social and economic inequality that resulted from decades of racial discrimination against majority ethnic groups. Consequently, the worsening economic conditions among previously marginalised groups have often resulted in violent public outbreaks and political riots [35,36].
The results of the current study also show that governance is positively related to biodiversity. This mirrors existing studies which explored the significance of government effectiveness in achieving biological conservation [88,89,90]. Good governance, as a function of government effectiveness and control of corruption, may positively influence species protection through the promulgation of conservation policies and economic regulations that promote species protection. A study by Chidakel et al. [91] found that a lack of accountability from key governance institutions may threaten the feasibility of protected areas in South Africa.
Overall, instead of the traditional correlation between economic growth and population change as predicted by the Malthusian theory, we showed in the present study that environmental factors, specifically biodiversity also predicts population growth. However, we also found evidence for conservation conflict since we found a negative correlation between wetland area and population growth, thus calling for the need to fix population growth for sustainability purpose or at least educate population on sustainability issues. However, the question is: can environmental education be successful when people’s priority is elsewhere (e.g., food insecurity, job)? Such correlation was not found for any of the social factors we tested, calling for continued commitment to further investigate the social factors that may underlying population growth.
Supplementary Materials
The following supporting information can be downloaded at: https://www.mdpi.com/article/10.3390/su14148668/s1, Figure S1: Distribution and Pattern of Missing Data; Figure S2: Possible combinations of indicators selected following Method 2 (see subsection ‘Selection of indicators to represent each of the 5 variables’ in Method section). Each acronym represents an indicator of a given variable and the meaning of each acronym as well as the corresponding variable are in Table S1.; Table S1: Variables used in this study as well as their indicators and sources; Table S2: (a) Raw data collected; (b) Scaled data; Table S3: The results of the stepwise regression with population as the response variable (Indicator Selection Method 1). * Indicators in red are selected as an indicator for each predictor variable; p-values highlighted in green are significant as per our chosen threshold (p < 0.05); Table S4: The pairwise regression of indicators for each variable (Indicator Selection Method 2). The indicators highlighted in yellow were selected for further analysis using SEM, and the regression coefficients that are written in bold are considered to be strongly significant (coefficient ≥ 0.5); Table S5: AIC and BIC values for each of the 135 SEMs resulting from the selected indicator combinations in Figure S2. R script: R script used in this analysis.
Author Contributions
Conceptualization, K.Y.; methodology, B.P. and K.Y.; validation, K.Y.; formal analysis, B.P.; investigation, B.P. and K.Y.; resources, B.P. and K.Y.; data curation, B.P. and K.Y.; writing—original draft preparation, B.P.; writing—review and editing, K.Y.; supervision, K.Y.; project administration, K.Y. All authors have read and agreed to the published version of the manuscript.
Funding
K.Y. received funding from the National Research Foundation Incentive Funding for Rated Researchers grant # 146104.
Institutional Review Board Statement
The study was conducted in accordance with the Declaration of Helsinki and approved by the Ethics Committee of the University of Johannesburg (ref. 2022-02-04/Phogole_Yessoufou).
Informed Consent Statement
Not applicable.
Data Availability Statement
Data are available as Supplemental Information.
Acknowledgments
We thank the National Research Foundation Incentive Funding for Rated Researchers grant # 146104.
Conflicts of Interest
The authors declare no conflict of interest.
References
- Bonggarts, J. Slow down population growth. Nature 2016, 530, 409–412. [Google Scholar] [CrossRef]
- Bongaarts, J. Human population growth and the demographic transition. Philos. Trans. R. Soc. B Biol. Sci. 2009, 364, 2985–2990. [Google Scholar] [CrossRef] [PubMed]
- Lee, R.D. The demographic transition: Three centuries of fundamental change. J. Econ. Perspect. 2003, 17, 167–190. [Google Scholar] [CrossRef]
- Zimmer, A.; Guido, Z.; Tuholske, C.; Pakalniskis, A.; Lopus, S.; Caylor, K.; Evans, T. Dynamics of population growth in secondary cities across southern Africa. Landsc. Ecol. 2020, 35, 2501–2516. [Google Scholar] [CrossRef]
- Lima, M.; Abades, S. Malthusian Factors as Proximal Drivers of Human Population Crisis at Sub-Saharan Africa. Front. Ecol. Evol. 2015, 3, 130. [Google Scholar] [CrossRef]
- Nieves, J.; Stevens, F.; Gaughan, A.; Linard, C.; Sorichetta, A.; Hornby, G.; Patel, N.; Tatem, A. Examining the correlates and drivers of human population distributions across low- and middle-income countries. J. R. Soc. Interface 2017, 14, 20170401. [Google Scholar] [CrossRef] [PubMed]
- Henderson, K.; Loreau, M. How ecological feedbacks between human population and land cover influence sustainability. PLoS Comput. Biol. 2018, 14, e1006389. [Google Scholar] [CrossRef] [PubMed]
- UN DESA (United Nations Department of Economic and Social Affairs). Global Population Growth and Sustainable Development Goals. 2021. Available online: https://www.un.org/development/desa/pd/sites/www.un.org.development.desa.pd/files/undesa_pd_2022_global_population_growth.pdf (accessed on 12 December 2021).
- Roser, M.; Ritchie, H.; Ortiz-Ospina, E. World Population Growth. 2019. Available online: https://ourworldindata.org/world-population-growth (accessed on 10 January 2021).
- Bucci, A. Product proliferation, population, and economic growth. J. Hum. Cap. 2015, 9, 170–197. [Google Scholar] [CrossRef]
- Peterson, E. The Role of Population in Economic Growth. SAGE Open 2017, 7, 215824401773609. [Google Scholar] [CrossRef]
- Hosen, A. The Stability of Population and GDP Growth: A Comparative Analysis Among Different Nations in the World. Int. J. Bus. Econ. Res. 2019, 8, 180. [Google Scholar] [CrossRef]
- Headey, D.D. Developmental drivers of nutritional change: A cross-country analysis. World Dev. 2013, 42, 76–88. [Google Scholar] [CrossRef]
- Coope, C.; Gunnell, D.; Hollingworth, W.; Hawton, K.; Kapur, N.; Fearn, V.; Wells, C.; Metcalfe, C. Suicide and the 2008 economic recession: Who is most at risk? Trends in suicide rates in England and Wales 2001–2011. Soc. Sci. Med. 2014, 117, 76–85. [Google Scholar] [CrossRef]
- Degu, A. The Nexus Between Population and Economic Growth in Ethiopia: An Empirical Inquiry. Int. J. Bus. Econ. Sci. Appl. Res. 2019, 12, 43–50. [Google Scholar] [CrossRef]
- Bretschger, L. Malthus in the light of climate change. Eur. Econ. Rev. 2020, 127, 103477. [Google Scholar] [CrossRef]
- Malthus, T. An Essay on the Principle of Population as it Affects the Future Improvement of Society; Electronic Scholarly Publishing: Bellingham, WA, USA, 1798. [Google Scholar]
- Strydom, N.; Struweg, J. Malthus revisited: Long-term Trends in South African Population Growth and Agricultural Output. Agrekon 2016, 55, 34–36. [Google Scholar] [CrossRef]
- Montano, B.; Garcia-Lopez, M. Malthusianism of the 21st century. Environ. Sustain. Indic. 2020, 6, 100032. [Google Scholar] [CrossRef]
- Myrskylä, M.; Kohler, H.-P.; Billari, F.C. Advances in Development Reverse Fertility Declines. Nature 2009, 460, 741–743. [Google Scholar] [CrossRef]
- Taagepera, R. A world population growth model: Interaction with Earth’s carrying capacity and technology in limited space. Technol. Forecast. Soc. Chang. 2014, 82, 34–41. [Google Scholar] [CrossRef]
- Lanz, B.; Dietz, S.; Swanson, T. Global population growth, technology, and Malthusian constraints: A quantitative growth theoretic perspective. Int. Econ. Rev. 2017, 58, 973–1006. [Google Scholar] [CrossRef]
- Patnaik, R. Impact of Industrialization on Environment and Sustainable Solutions–Reflections from a South Indian Region. IOP Conf. Ser. Earth Environ. Sci. 2018, 120, 012016. [Google Scholar] [CrossRef]
- Nabi, A.; Shahid, Z.; Mubashir, K.; Ali, A.; Iqbal, A.; Zaman, K. Relationship between population growth, price level, poverty incidence, and carbon emissions in a panel of 98 countries. Environ. Sci. Pollut. Res. 2020, 27, 31778–31792. [Google Scholar] [CrossRef] [PubMed]
- Barbier, E.; Hochard, J. Land degradation and poverty. Nat. Sustain. 2018, 1, 623–631. [Google Scholar] [CrossRef]
- Temesgen, M.; Getahun, A.; Lemma, B. Livelihood Functions of Capture Fisheries in Sub-Saharan Africa: Food Security, Nutritional, and Economic Implications. Rev. Fish. Sci. Aquac. 2019, 27, 215–225. [Google Scholar] [CrossRef]
- Agbo, K.; Walgraeve, C.; Eze, J.; Ugwoke, P.; Ukoha, P.; Van Langenhove, H. A review on ambient and indoor air pollution status in Africa. Atmos. Pollut. Res. 2021, 12, 243–260. [Google Scholar] [CrossRef]
- Landrigan, P.J.; Fuller, R.; Acosta, N.J.R.; Adeyi, O.; Arnold, R.; Basu, N.; Baldé, A.B.; Bertollini, R.; Bose-O’Reilly, S.; Boufford, J.I.; et al. The Lancet Commission on pollution and health. Lancet 2018, 391, 462–512. [Google Scholar] [CrossRef]
- Dalyop, G.T. Political instability and economic growth in Africa. Int. J. Econ. Policy Stud. 2019, 13, 217–257. [Google Scholar] [CrossRef]
- Lederman, D.; Loayza, N.V.; Soares, R.R. Accountability and corruption: Political institutions matter. Econ. Politics 2005, 17, 1–35. [Google Scholar] [CrossRef]
- Shabbir, G.; Anwar, M.; Adil, S. Corruption, political stability, and economic growth. Pak. Dev. Rev. 2016, 55, 689–702. [Google Scholar] [CrossRef]
- Kesar, A.; Kamaiah, B.; Jena, P.K.; Yadav, M.P. The Asymmetric Relationship between Corruption, Political Stability and Economic Growth: New Evidence from BRICS Countries. Indian Econ. J. 2022, 70, 249–270. [Google Scholar] [CrossRef]
- Zheng, Z. Reproductive behaviour and determinants in a low-fertility era in China. Asian Popul. Stud. 2018, 15, 127–130. [Google Scholar] [CrossRef]
- Alpermann, B.; Zhan, S. Population Planning after the One Child Policy: Shifting Modes of Political Steering in China. J. Contemp. China 2019, 28, 348–366. [Google Scholar] [CrossRef]
- Cillier, J.; Aucion, C.; Economics, Governance and Instability in South Africa. Institute for Security Studies. 2016. Available online: https://www.researchgate.net/publication/305034098_Economics_Governance_and_Instability_in_South_Africa (accessed on 17 March 2022).
- Matshoba, A. July Riots Rob SA Economy of above 5% Growth. 2022. Available online: https://www.moneyweb.co.za/news/economy/july-riots-rob-sa-economy-of-above-5-growth/ (accessed on 17 March 2022).
- RSA (Republic of South Africa). Geography and Climate. 2021. Available online: https://www.gov.za/about-sa/geography-and-climate (accessed on 17 March 2022).
- Rutherford, M.; Mucina, L.; Powrie, L. Biomes and bioregions of Southern Africa. In The Vegetation of South Africa, Lesotho and Swaziland; South African National Biodiversity Institute: Pretoria, South Africa, 2006. [Google Scholar]
- Bezeng, B.S.; Yessoufou, K.; Taylor, P.J.; Tesfamichael, S.G. Expected spatial patterns of alien woody plants in South Africa’s protected areas under current scenario of climate change. Sci. Rep. 2020, 10, 7038. [Google Scholar] [CrossRef]
- Germishuizen, G.; Meyer, N.L.; Steenkamp, Y.; Keith, M. A checklist of south African plants. In Southern African Botanical Diversity Network Report; No. 41. Pretoria: SABONET; IUCN: Gland, Switzerland, 2006. [Google Scholar]
- Mamathaba, M.P.; Yessoufou, K.; Moteetee, A. What Does It Take To Further Our Knowledge of Plant Diversity in The Megadiverse South Africa? Preprints 2022, 2022060066. [Google Scholar] [CrossRef]
- Adeeyo, A.O.; Ndlovu, S.S.; Ngwagwe, L.M.; Mudau, M.; Alabi, M.A.; Edokpayi, J.N. Wetland Resources in South Africa: Threats and Metadata Study. Resources 2022, 11, 54. [Google Scholar] [CrossRef]
- Seymore, R.; Inglesi-Lotz, R.; Blignaut, J. A greenhouse gas emissions inventory for South Africa: A comparative analysis. Renew. Sustain. Energy Rev. 2014, 34, 371–379. [Google Scholar] [CrossRef]
- Stats SA (Statistics South Africa). Mid-Year Population Estimates. 2021. Available online: http://www.statssa.gov.za/publications/P0302/P03022021.pdf (accessed on 17 March 2022).
- Turok, I.; Borel-Saladin, J. Is urbanisation in South Africa on a sustainable trajectory? Dev. S. Afr. 2014, 31, 675–691. [Google Scholar] [CrossRef]
- Stats SA (Statistics South Africa). Quarterly Labour Force Survey (QLFS)–Q4:2021. 2022. Available online: http://www.statssa.gov.za/publications/P0211/Media%20release%20QLFS%20Q4%202021.pdf (accessed on 17 March 2022).
- Bruce, D. Addressing corruption in South Africa. S. Afr. Crime Q. 2014, 48, 49–62. [Google Scholar] [CrossRef]
- Stats SA (Statistic South Africa). Inequality Trends in South Africa: A Multidimensional Diagnostic of Inequality. 2019. Available online: https://www.statssa.gov.za/publications/Report-03-10-19/Report-03-10-192017.pdf (accessed on 17 March 2022).
- Vhumbunu, C.H. The July 2021 Protests and Socio-Political Unrest in South Africa: Reflecting on the Causes, Consequences and Future Lessons. Confl. Trends 2021, 3, 3–13. [Google Scholar]
- Wendling, Z.A.; Emerson, J.W.; de Sherbinin, A.; Esty, D.C. 2020 Environmental Performance Index. 2020. Available online: https://epi.yale.edu/downloads/epi2020report20210112.pdf (accessed on 17 March 2022).
- R Development Core Team. R: A Language and Environment for Statistical Computing. R Foundation for Statistical Computing, Vienna, Austria. 2021. Available online: http://www.R-project.org/ (accessed on 17 March 2022).
- Van Buuren, S. Package ‘MICE’. 2021. Available online: https://cran.r-project.org/web/packages/mice/mice.pdf (accessed on 17 March 2022).
- Burgette, L.F.; Reiter, J.P. Multiple imputation for missing data via sequential regression trees. Am. J. Epidemiol. 2010, 172, 1070–1076. [Google Scholar] [CrossRef]
- Fan, Y.; Chen, J.; Shirkey, G.; John, R.; Wu, S.; Park, H.; Shao, C. Applications of structural equation modeling (SEM) in ecological studies: An updated review. Ecol. Processes 2016, 5, 19. [Google Scholar] [CrossRef]
- Rosseel, Y. Package “Lavaan”. 2022. Available online: https://cran.r-project.org/web/packages/lavaan/lavaan.pdf (accessed on 17 March 2022).
- Savalei, V. Understanding Robust Corrections in Structural Equation Modeling. Struct. Equ. Modeling Multidiscip. J. 2014, 21, 149–160. [Google Scholar] [CrossRef]
- Capmourteres, V.; Anand, M. Assessing ecological integrity: A multi-scale structural and functional approach using Structural Equation Modeling. Ecol. Indic. 2016, 71, 258–269. [Google Scholar] [CrossRef]
- Balmford, A.; Moore, J.L.; Brooks, T.; Burgess, N.; Hansen, L.A.; Williams, P.; Rahbek, C. Conservation conflicts across Africa. Science 2001, 291, 2616–2619. [Google Scholar] [CrossRef]
- Chown, S.L.; Van Rensburg, B.J.; Gaston, K.J.; Rodrigues, A.S.L.; Van Jaarsveld, A.S. Energy, species richness, and human population size: Conservation implications at a national scale. Ecol. Appl. 2003, 13, 1233–1241. [Google Scholar] [CrossRef]
- Evans, K.L.; Van Rensburg, B.J.; Gaston, K.J.; Chown, S.L. People, species richness and human population growth. Glob. Ecol. Biogeogr. 2016, 15, 625–636. [Google Scholar] [CrossRef]
- Luck, G.W. A review of the relationships between human population density and biodiversity. Biol. Rev. 2007, 82, 607–645. [Google Scholar] [CrossRef]
- Davies, T.J.; Maurin, O.; Yessoufou, K.; Daru, B.H.; Bezeng, B.S.; Schaefer, H.; Thuiller, W.; Van der Bank, M. Tree phylogenetic diversity supports nature’s contribution to people, but is at risk from human population growth. bioRxiv 2021. [Google Scholar] [CrossRef]
- Daily, G.C. (Ed.) Nature’s Services; Island Press: Washington, DC, USA, 1997. [Google Scholar]
- Millennium Ecosystem Assessment. Ecosystems and Human Well-Being: Synthesis; Island Press: Washington, DC, USA, 2005. [Google Scholar]
- Molina-Venegas, R. Conserving evolutionarily distinct species is critical to safeguard human well-being. Sci. Rep. 2021, 11, 24187. [Google Scholar] [CrossRef]
- Malthus, T.R. An Essay on the Principle of Population; Ward, Lock and Co.: London, UK, 1890. [Google Scholar]
- Verhoeven, J.T.A.; Arheimer, B.; Yin, C.; Hefting, M.M. Regional and global concerns over wetlands and water quality. Trends Ecol. Evol. 2006, 21, 96–103. [Google Scholar] [CrossRef]
- Nyman, J.A. Ecological Functions of Wetlands. In Wetlands; LePage, B., Ed.; Springer: Dordrecht, The Netherlands, 2011. [Google Scholar] [CrossRef]
- Skowno, A.L.; Jewitt, D.; Slingsby, J.A. Rates and patterns of habitat loss across South Africa’s vegetation biomes. S. Afr. J. Sci. 2021, 117, 8182. [Google Scholar] [CrossRef]
- Mehring, M.; Mehlhaus, N.; Ott, E.; Hummel, D. A systematic review of biodiversity and demographic change: A misinterpreted relationship? Ambio 2020, 49, 1297–1312. [Google Scholar] [CrossRef] [PubMed]
- Baird, S.; Friedman, J.; Schady, N. Aggregate income shocks and infant mortality in the developing world. Rev. Econ. Stat. 2011, 93, 847–856. [Google Scholar] [CrossRef]
- Pavoine, S.; Bonsall, M.B.; Davies, T.J.; Masi, S. Mammal extinctions and the increasing isolation of humans on the tree of life. Ecol. Evol. 2019, 9, 914–924. [Google Scholar] [CrossRef]
- Stats SA (Statistic South Africa). The Importance of Coal. 2015. Available online: https://www.statssa.gov.za/?p=4820 (accessed on 17 March 2022).
- UNEP (United Nations Environmental Programme). Methane Emissions Are Driving Climate Change. Here’s How to Reduce Them. 2021. Available online: https://www.unep.org/news-and-stories/story/methane-emissions-are-driving-climate-change-heres-how-reduce-them#:~:text=Methane%20is%20also%20a%20powerful,keeping%20began%20in%20the%201980s (accessed on 17 March 2022).
- Altieri, K.; Stone, A. Prospective air pollutant emissions inventory for the development and production of unconventional natural gas in the Karoo basin, South Africa. Atmos. Environ. 2016, 129, 34–42. [Google Scholar] [CrossRef]
- Deshmukh, P.; Kimbrough, S.; Krabbe, S.; Logan, R.; Isakov, V.; Baldauf, R. Identifying air pollution source impacts in urban communities using mobile monitoring. Sci. Total Environ. 2020, 715, 136979. [Google Scholar] [CrossRef] [PubMed]
- Joshua, U.; Bekun, F.; Sarkodie, S. New insight into the causal linkage between economic expansion, FDI, coal consumption, pollutant emissions and urbanization in South Africa. Environ. Sci. Pollut. Res. 2020, 27, 18013–18024. [Google Scholar] [CrossRef]
- Haberl, H.; Wiedenhofer, D.; Virág, D.; Kalt, G.; Plank, B.; Brockway, P.; Fishman, T.; Hausknost, D.; Krausmann, F.; Leon-Gruchalski, B.; et al. A systematic review of the evidence on decoupling of GDP, resource use and GHG emissions, part II: Synthesizing the insights. Environ. Res. Lett. 2020, 15, 065003. [Google Scholar] [CrossRef]
- Ritchie, H. Many Countries Have Decoupled Economic Growth from CO₂ Emissions, Even If We Take Offshored Production into Account. 2021. Available online: https://ourworldindata.org/co2-gdp-decoupling (accessed on 17 March 2022).
- IEA (International Energy Agency). Global Energy Review: Coal. 2021. Available online: https://www.iea.org/reports/global-energy-review-2021/coal (accessed on 17 March 2022).
- Wang, W. Region EKC for Air Pollution: Evidence from China. Environ. Pollut. 2018, 7, 46–52. [Google Scholar] [CrossRef][Green Version]
- Shikwambana, L.; Mhangara, P.; Kganyago, M. Assessing the Relationship between Economic Growth and Emissions Levels in South Africa between 1994 and 2019. Sustainability 2021, 13, 2645. [Google Scholar] [CrossRef]
- Waldron, A.; Mooers, A.O.; Miller, D.C.; Nibbelink, N.; Redding, D.; Kuhn, T.S.; Roberts, J.T.; Gittleman, J.L. Targeting global conservation funding to limit immediate biodiversity declines. Proc. Natl. Acad. Sci. USA 2013, 110, 12144–12148. [Google Scholar] [CrossRef]
- Lindsey, P.A.; Miller, J.R.B.; Petracca, L.S.; Hunter, L.T.B. More than $1 billion needed annually to secure Africa’s protected areas with lions. Proc. Natl. Acad. Sci. USA 2018, 115, 10788–10796. [Google Scholar] [CrossRef] [PubMed]
- Kauano, É.; Silva, J.; Diniz Filho, J.; Michalski, F. Do protected areas hamper economic development of the Amazon region? An analysis of the relationship between protected areas and the economic growth of Brazilian Amazon municipalities. Land Use Policy 2020, 92, 104473. [Google Scholar] [CrossRef]
- Cowan, G.I.; Mpongoma, N.; Britton, P. (Eds.) Management Effectiveness of South Africa’s Protected Areas; Department of Environmental Affairs: Pretoria, South Africa, 2010. [Google Scholar]
- Welz, A. The Pandemic Has Undone South Africa’s National Parks. 2021. Available online: https://www.theatlantic.com/science/archive/2021/06/covid-19-tourism-conservation-south-africa/619091/ (accessed on 22 April 2022).
- Lupyan, G. How Reliable Is Perception? Philos. Top. 2017, 45, 81–106. [Google Scholar] [CrossRef]
- Sowman, M.; Hauck, M.; van Sittert, L.; Sundae, J. Marine Protected Area Management in South Africa: New Policies, Old Paradigms. Environ. Manag. 2011, 47, 573–583. [Google Scholar] [CrossRef]
- Niedziałkowski, K.; Paavola, J.; Jędrzejewska, B. Participation and protected areas governance: The impact of changing influence of local authorities on the conservation of the Białowieża Primeval Forest, Poland. Ecol. Soc. 2012, 17, 2. [Google Scholar] [CrossRef]
- Chidakel, A.; Candice, E.; Child, B. The comparative financial and economic performance of protected areas in the Greater Kruger National Park, South Africa: Functional diversity and resilience in the socio-economics of a landscape-scale reserve network. J. Sustain. Tour. 2020, 28, 1100–1119. [Google Scholar] [CrossRef]
Publisher’s Note: MDPI stays neutral with regard to jurisdictional claims in published maps and institutional affiliations. |
© 2022 by the authors. Licensee MDPI, Basel, Switzerland. This article is an open access article distributed under the terms and conditions of the Creative Commons Attribution (CC BY) license (https://creativecommons.org/licenses/by/4.0/).