
Eco-Friendly Optimum Structural Concrete Mix Design
by
 , ,
, ,
Najib N. Gerges
1 ,
,
Camille A. Issa
2,*,
Elias Sleiman
1,3,
Sara Aintrazi
1,
Jad Saadeddine
1,
Remi Abboud
1 and
Marc Antoun
4 1
Department of Civil Engineering, University of Balamand, Balamand P.O. Box 100, Lebanon
2
Department of Civil Engineering, Lebanese American University, Byblos P.O. Box 36, Lebanon
3
CIMEO-Rhone Alpes, 69120 Vaulx En Velin, France
4
Department of the Built Environment, Eindhoven University of Technology, 5612 AZ Eindhoven, The Netherlands
*
Author to whom correspondence should be addressed.
Sustainability 2022, 14(14), 8660; https://doi.org/10.3390/su14148660
Submission received: 24 February 2022
/
Revised: 19 April 2022
/
Accepted: 13 July 2022
/
Published: 15 July 2022
(This article belongs to the Special Issue Sustainable Organic Materials Used in the Construction Sector)
Abstract
:Concrete, the most consumed man-made material worldwide, has shaped the environment and the modern world. Even though concrete is a major contributor to the carbon footprint, it is indispensable for building the sustainable world of tomorrow. Researchers have been exploring ways to reduce the carbon footprint and to implement strategical waste management plans in which wastes are repurposed. Pollution has been a challenge for almost all countries, especially with the increase in the release of greenhouse gases in the atmosphere and the emissions resulting from wastes in unmanaged landfills. Additionally, the areas available for landfills have become scarce. Daily all around the world, generated are wastes such as wood ash, waste glass, used tires, construction debris, and demolition wastes. These wastes usually accumulate in landfills for years, as they are mostly nondecomposable. This research explores a solution to this twofold problem in which concrete components are replaced by wastes and by-products, which in return reduces the need for raw materials that have a significant carbon footprint and repurposes wastes as part of a circular economy. In this research, wood ash is used as a partial replacement of cement and sand, fine crushed glass and crumb rubber as partial replacements of sand, and crushed glass and recycled concrete aggregates as partial replacements of gravel. The optimum eco-friendly structural concrete mix was determined to be the combined mix consisting of 5% wood ash as a partial replacement of cement; 20% wood ash, 20% fine crushed glass, and 2% crumb rubber as partial replacements of sand; and 5% crushed glass and 50% recycled concrete aggregates as partial replacements of coarse aggregates. By mass, the recycled waste materials constituted 32% of the mix, translating into 34% of its volume. Additionally, identified were mixes that may be used for structural applications.
1. Introduction
The negative impacts of the continuous increase in pollution level on mankind and the environment has become a reality humans are trying to deal with. Creating a healthier environment has been a concern for scientists for a long time, and disposing of generated wastes properly proved to be highly effective in treating such problem. One way of proceeding is by producing an eco-friendly concrete mix combining all of these wastes while still maintaining acceptable mechanical properties. Concrete, due to its performance, strength, durability, flexibility, and affordability, a major construction material, is used in all sorts of buildings, bridges, roads, and dams. Thus, the world is now in pursuit of a sustainable future which involves repurposing materials to avoid unwarranted waste and obtain the most value out of the resources, along with minimizing air pollution sources. This sustainable future calls for sustainable construction materials development and hence, an eco-friendly structural concrete mix is desired.
Among the multitude of issues facing our modern world, pollution remains one of the top challenges that need to be addressed. According to the United Nations Economic Commission for Europe (UNECE), air pollution is a main environmental health threat and a major cause of diseases [1]. Carbon dioxide (CO2) is a major air pollutant in terms of greenhouse effects and is the result of fossil fuel combustions to which cement production is a tremendous contributor. Cement is a major component of concrete, and its production is estimated to be the source of 8% of the world’s CO2 [2]. According to Greenspec [3], the production of 1 ton of cement produces 780 kg of CO2, and it is considered as a global emitter. However, concrete has transformed into an indispensable component for the growth of infrastructure and construction and without it, the built environment is not capable of providing the necessities of modern lifestyles. More than 10 billion tons of concrete are being produced yearly [4]. Such a volume of concrete necessitates the extensive utilization of humongous amounts of natural resources for aggregates and cement production. Limestone quarries and cement manufacturing plants are also considered as sources of pollution, including the emissions from the trucks hauling the materials. Currently, even the acquisition of sand can be disastrous, as it is ruining so many of the world’s beaches and river courses. Therefore, while concrete has shaped the built-up environment, it has contributed enormously to the carbon footprint.
Landfilling is one of the foremost prevalent methods of disposing municipal and industrial wastes, but it is also a major contributor to environmental pollution. Other than the potential threats that landfilling imposes to the soil and groundwater, it also causes the release of toxic gases and odors if not managed properly. Methane (CH4) and carbon dioxide (CO2) are among the major greenhouse gases (GHG) emitted from landfills [5]. These emitted gases and odors have negative effects on the environment and health. According to the World Health Organization (WHO) [6], around 91% of the world’s population lives in places where air quality levels exceed acceptable limits. The increase in population resulted in a higher demand for cars; thus, tire waste is consequently increasing. Disposing of tires through incineration generates a huge amount of CO2, benzene, and other toxic substances because of their high combustible properties. Scrap tires, for example, need 100 years to decompose naturally, resulting in soil poisoning and chemical releasing, and almost one-quarter of scrap tires end up in landfills each year [7]. Disposing of them in landfills can inflict several hazards such as tire fires that produce emissions that are even more toxic than those of a combustor. The only effective eco-friendly way of the disposal of this waste is through recycling. Tire waste could be grinded into crumb rubber (CR) and incorporated in concrete mixes [8]. Based on experimental work by Eldin and Senouci [9], the concrete tensile strength is reduced by 50% and the compressive strength is reduced by 85% if the coarse aggregates are replaced by rubber. Busic et al. [10] proved that partially replacing fine aggregates in self-compacting concrete by rubber exhibited better, fresh, and hardened properties in concrete compared to replacing coarse aggregates. According to experiments conducted by Tripathi and Baniy [11], using crumb rubber in the concrete mix significantly increased the toughness and ductility of concrete and suggested using chemical admixtures to increase the compressive strength lost due to the presence of rubber and still benefit from the ductility. According to Gerges et al. [12], the optimum percentage of rubber replacing the fine aggregates is 5% to maintain maximum compressive strength and 10% to maintain maximum flexural strength. Huang et al. [13] proposed an empirical model relating CR content to the compressive strength of the resulted concrete design. Wang and Du [14] experimentally verified the thermal and sound insulation and noise reduction advantages of the incorporation of CR in concrete mix. Recently, Amiri et al. [15] experimentally investigated the influence of the simultaneous replacements of both CR and recycled concrete on the mechanical properties and durability of concrete.
Another undecomposable, yet 100% recyclable, waste found in landfills is glass. It potentially takes one million years for a glass bottle to decompose in the atmosphere, or even longer if it is in a landfill. According to the Environmental Protection Agency (EPA), glass constitutes almost 5% of the municipal solid waste landfilled each year, which is almost 6 million tons of glass each year [16]. A field in which waste glass may be used is the construction sector, where the waste glass is reused as aggregate in concrete production due to the similarities in the physical and chemical properties of sand and glass [17]. Lately, several papers [18,19,20] have re-emphasized the benefits and impact of incorporating waste glass in concrete mix design.
Landfills also receive construction and demolition wastes (CDW), which are the debris generated during the construction, renovation, and demolition of buildings, roads, and bridges. EPA supports and recognizes that CDW are resources that could be used in new construction projects, thus eliminating the need for virgin materials to be mined and processed [21]. In 2018, the United States produced 600 million tons of CDW, which is more than twice the amount of the generated municipal solid wastes and is usually dumped in landfills with exhaustible volume capacities. According to a study by Novková and Mikulica [22], recycled concrete (RC) aggregates generated from CDW can easily replace the natural aggregates of concrete, as these form almost 70% of the concrete’s total volume. Not only does this save the natural resources, but it also saves the space of landfills and reduces costs if the price of the recycling and separation process is compared with the price of the energy-intensive aggregate exploitations. Other advantages of using RC include the reduction in costs in terms of transporting concrete to the landfill and transporting raw materials to the construction site. It also extends the life of the landfill due to the reduction in the amount of waste disposal. While the practical use of RC in concrete is rare to find, several studies show results from the testing of concrete with partial or total replacement of natural aggregates (NA) by RC. According to Pavlu et al. [23], RC properties depend on the source, quality of the waste material, percentage ratio of components, and also on the sieve-fraction of aggregates, and so RC retrieved from different sources presents different mechanical and physical properties. Veriana et al. [24] indicated that the maximum replacement rate of NA by RC should range between 30% and 50%. Moreover, according to Nováková and Mikulica [22], a 20% replacement of natural aggregates with RC had no negative influence on the physico-mechanical properties of concrete; it also resulted in a rise in the compressive strength by 5.8% in comparison with the mix containing 100% NA, and this was attributed to the residual cement contained in RC. A study conducted by Tošić et al. [25] concluded that by taking the economical, environmental, and technical aspects into account, structural concrete containing 50% of RC would yield optimal results. In research conducted by Taffese [26], it was concluded that although RC showed lower physical and mechanical properties compared with natural aggregates, concrete with 10% RC had a higher compressive strength than that employing only natural aggregates, and the splitting tensile strength of the concrete samples composed of up to 20% RC was similar to that of the NA concrete.
As nations recognize that bioenergy provides a solution for minimizing carbon dioxide emissions, green energy in the form of biomass is becoming increasingly important. Wood biomass is considered as a sustainable source of energy and a valuable renewable alternative to finite fossil fuels. However, a by-product produced in this burning process is wood ash (WA). WA is a major environmental pollutant and health hazard in the absence of emission control processes, which are also very expensive [27]. The most common way of disposing of this waste is either by landfilling or by incineration. Unmanaged landfills increase the possibility of polluting underground water resulting from the leaching of the heavy metals in WA and can also cause airborne diseases to neighboring populations. On the other hand, incineration increases the emissions of carbon dioxide in the atmosphere. According to Siddique [28], approximately 70% of the WA generated is landfilled, thus leading to extensive investigation on how to use WA in building materials. According to Naik [29], WA has a substantial potential for use as a pozzolanic mineral admixture and an activator in cement-based materials, and it was observed that increasing the replacement percentage from 0% to 30% of the total binder weight while maintaining the same water–cement ratio decreased the slump value of the concrete from 80 mm to 40 mm. The mixture of 12% WA replacement of the total cement resulted in a compressive strength of 46 MPa, which was even greater than that of the control mix [30].
Thus, with the advantages and disadvantages of incorporating WA, waste glass, CR, and RC as individually or at most as two to three simultaneous waste materials replacing normal concrete mix components have been explored. Consequently, the main objective of this study is to obtain an eco-friendly concrete mix in which the normal concrete mix components are mostly replaced by the wastes that generally end up in landfills, accomplishing a major step towards a sustainable future. This outcome provides an alternative solution for landfilling, lowers the environmental impact of concrete manufacturing, and reduces costs. As a matter of fact, the outcome would be the resolution of a five-fold problem: cement production, wood, tire, glass wastes disposition, and the concrete debris from demolition wastes.
2. Experimental Program
2.1. Concrete Mix Components
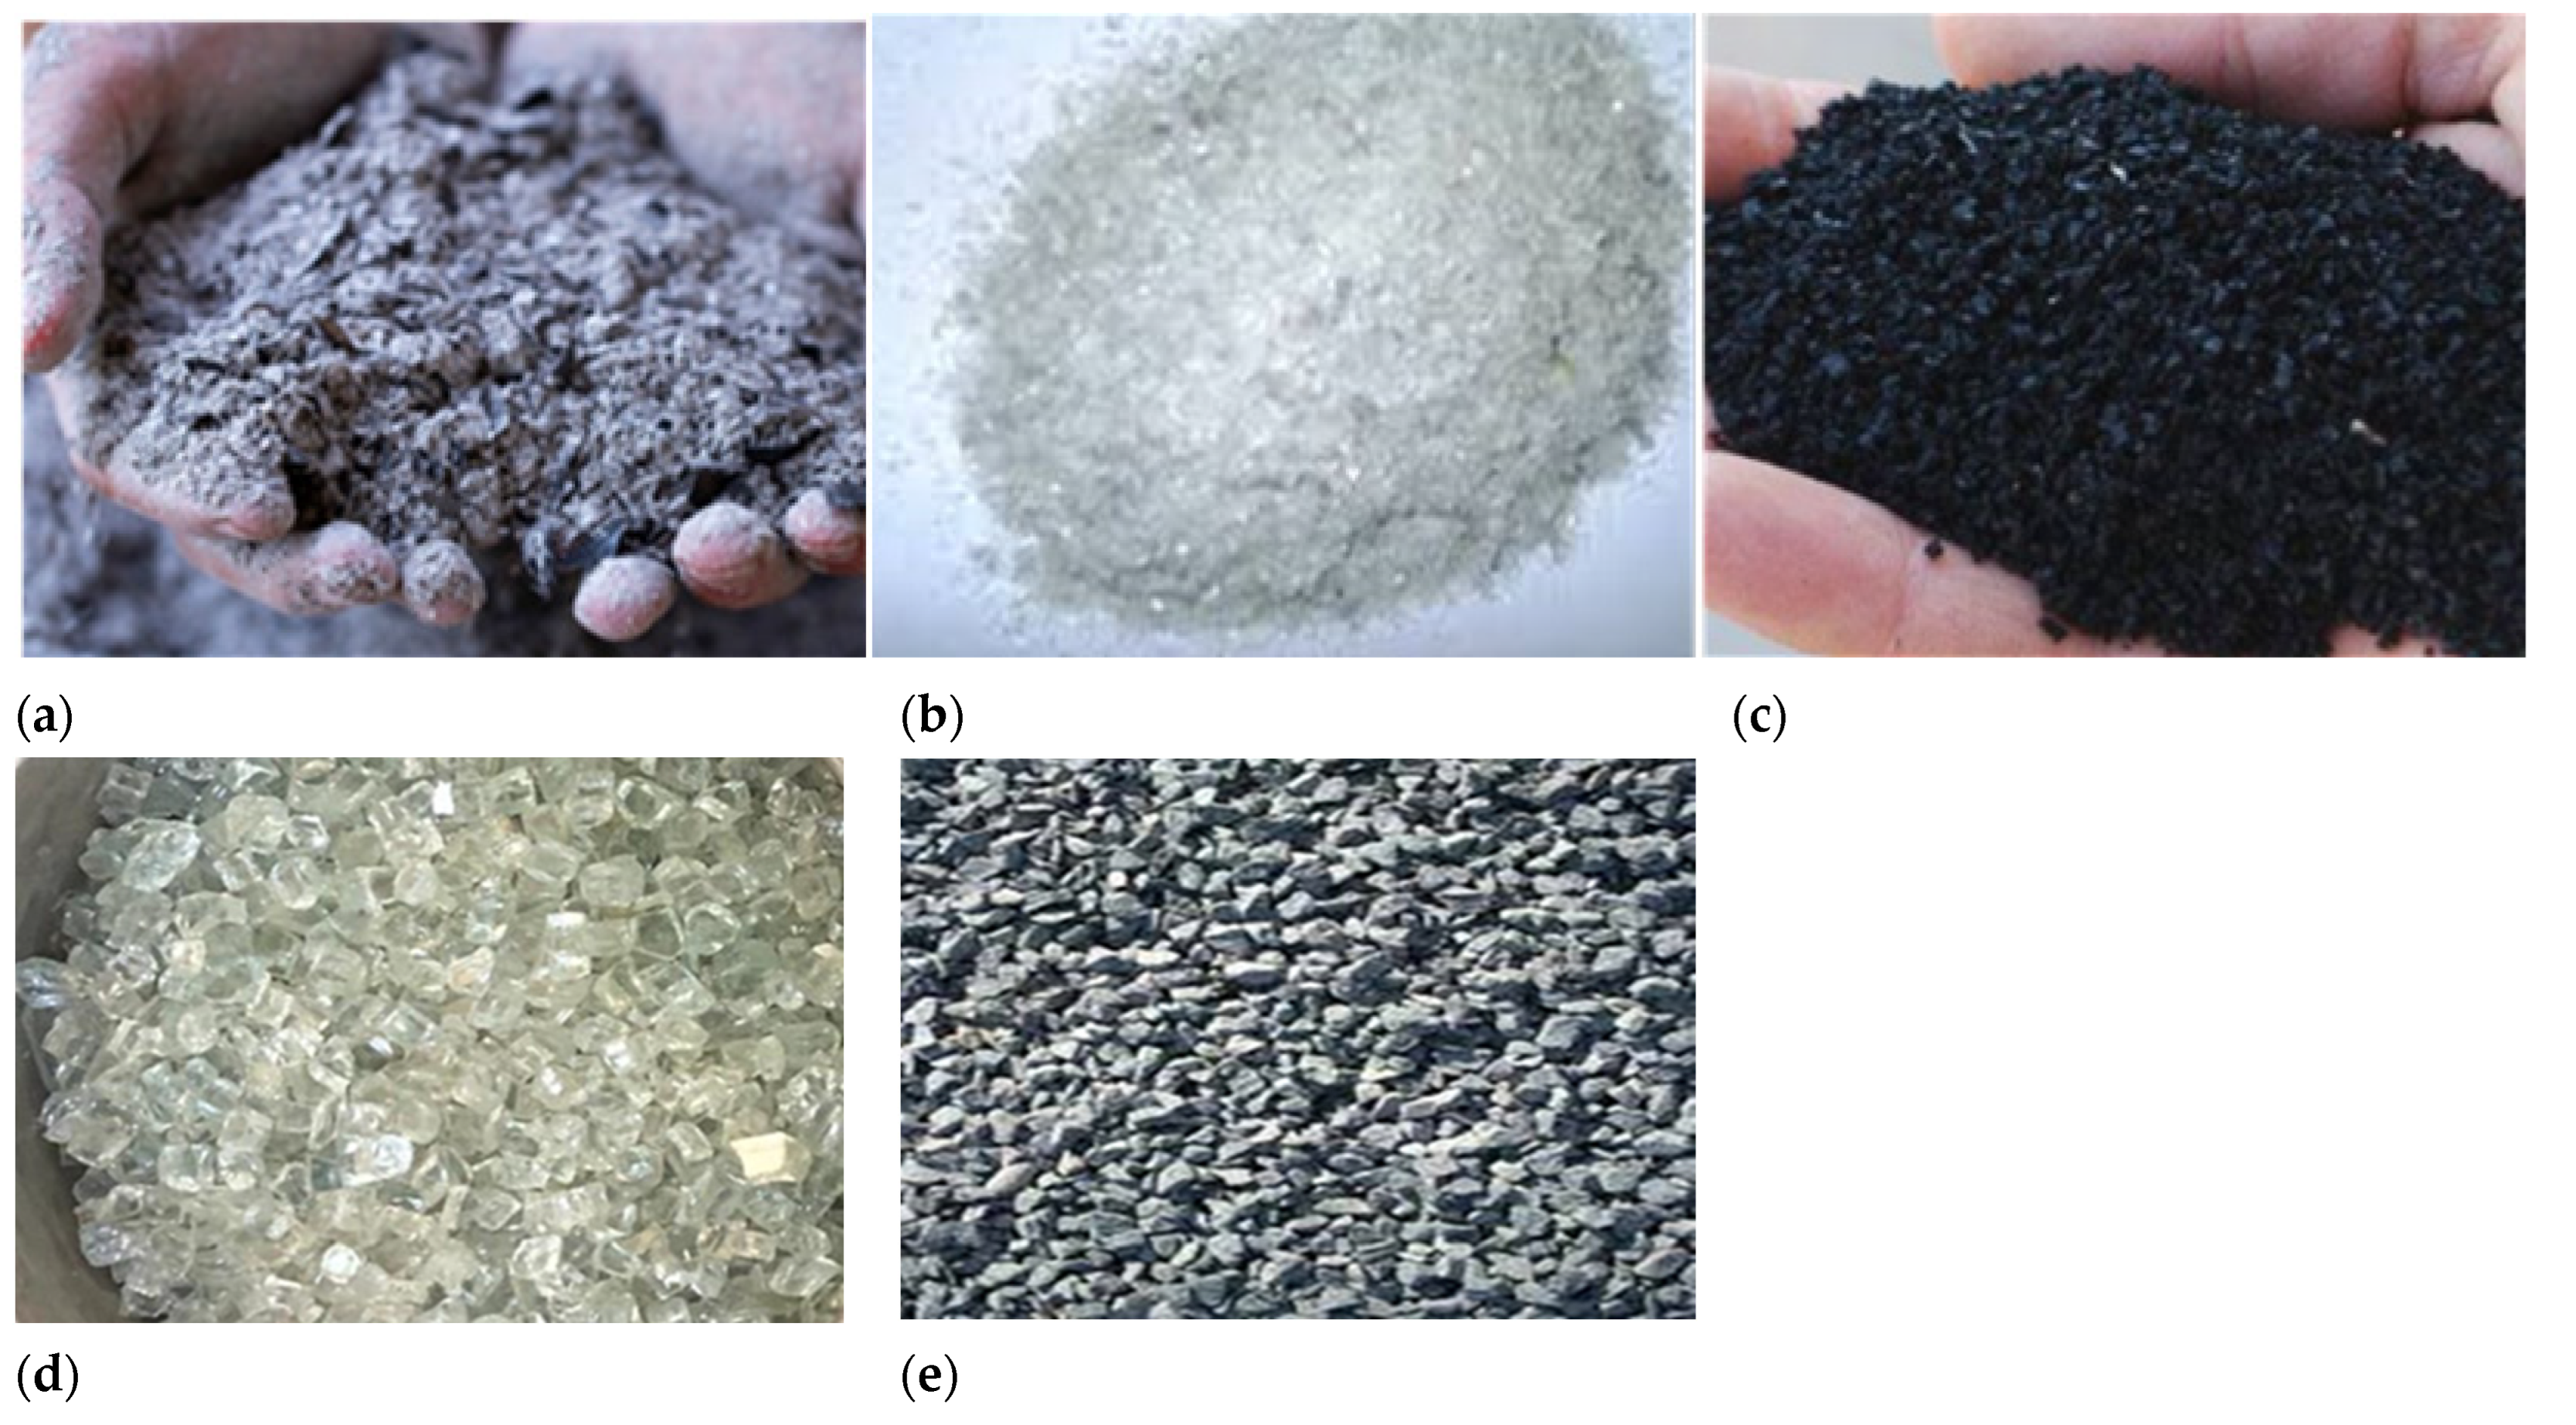
In this study, besides the natural concrete mix components, five different types of waste materials that have been commonly used individually and combined with each other have been selected as substitute recyclables ingredients. Thus, the utilized ingredients in the concrete mix design are:
Wood ash (WA): The wood ash is a residue resulting from the burning of wood (Figure 1a) and was collected from a local wood bakery. The grain size of wood ash ranges between 0.13 mm to 0.60 mm. The specific gravity of WA was determined to be 1.70.
Crumb rubber (CR): Crumb rubber (Figure 1c) consists of fine rubber particles ranging in size from 0.075 mm to no more than 4.75 mm. Crumb rubber is generated after shredding the waste tires and removing the steel debris that are found in steel-belted tires.
Crushed glass (CG): Crushed glass (Figure 1d) is a waste glass material that is crushed in the roller.
Fine crushed glass (FCG): Fine crushed glass (Figure 1b) is a waste glass material that is crushed in the roller and becomes granulated by sieving. The specific gravity of FCG was determined to be 2.45.
Recycled concrete (RC): Recycled concrete (Figure 1e) is an aggregate derived from the crushing of previously used concrete structural elements.
Natural sand (NS): Natural sand, also known as fine aggregates, is a loose granular substance, usually colored yellowish to brownish; it is a by-product of the erosion of mainly siliceous rocks, which constitute the main terrain of beaches, riverbeds, seabed, and deserts. The grain size of sand ranges between 0.13 mm to 4.75 mm.
Gravel: Gravel, also known as coarse aggregates, is any particle greater than 4.75 mm, but generally ranges between 9.5 mm and 37.5 mm in diameter. Gravel is basically crushed stone of unconsolidated rock fragments. The most common types of rock used in gravel are sandstone, limestone, and basalt.
Ordinary Portland Cement (OPC): The final element added to the mixture is Ordinary Portland Cement (PAL 42.5), also known as Cement Type I. The mix resulting from the utilization of this cement is the most adaptable, long-lasting mortar/concrete and represents the most widely used cement in construction sites.
Water (W): The water used in the mixture is distilled water, with all sorts of impurities removed, leading to the reduction in any potential sources of inaccuracies.
Sieve analysis for these coarse and fine aggregates was conducted according to ASTM C136 [31]. Figure 2 displays the sieve analysis results for the three coarse aggregates and for the four fine aggregates. The particle size distributions of recycled concrete aggregates and crushed glass are like that of the gravel. The grain size distributions of the four fine aggregates is reasonable, around the limits as defined by the ASTM standards [31]. It is worth mentioning that wood ash partially replacing natural sand was used to substitute the finer particles of the fine aggregates in the mixes.
The chemical compositions of the fine crushed glass and the wood ash are displayed in Table 1. As for the crumb, it is the usual composition of rubber tires. Two main synthetic rubber polymers used in tire manufacturing are butadiene rubber and styrene butadiene rubber. These rubber polymers are used in combination with natural rubber. Variations in the physical and chemical properties of these rubber polymers determine the performance of each component in the tire as well as the overall tire performance.
2.2. Concrete Mix Design
The concrete mix design was conducted in a fashion to serve the main scope of this study, which is to establish the most eco-friendly concrete mix resulting from replacing the largest quantity of raw/recycled materials with solid wastes while realizing an optimum mix. Several mix design combinations were examined for this purpose. The concrete mixing, casting, curing, and test samples preparation was conducted according to ASTM C192 [32]. In this study, all types of concrete mixes were realized at a constant water-to-cement ratio (w/c) of 0.5. A normal concrete mix was defined and tested as a control mix. The control mix resulted from a combination of 320 kg/m3 of cement, 160 kg/m3 of water, 740 kg/m3 of sand, and 1240 kg/m3 of gravel. More than 60 different mixes were casted by partially replacing cement by wood ash, sand by crumb rubber and/or wood ash and/or fine crushed glass, and gravel by recycled concrete aggregates and/or or crushed glass. Table 2 summarizes the concrete mix components and the partial replacement ratios explored utilizing individual waste materials.
A second set of concrete mixes in which two types of waste replacement percentages were incorporated are summarized in Table 3.
A third set of mixes in which three types of wastes were incorporated are summarized in Table 4.
2.3. Conducted Experiments
For each mix type, three cylindrical specimens 15 cm by 30 cm were cast for each experiment, and the following parameters were obtained according to the applicable ASTM standards
- Slump test according to ASTM C143 [33];
- Compressive strength at 7, 28, and 90 days according to ASTM C39 [34];
- Splitting tensile strength at 28 days according to ASTM C496 [37];
After all the parameters were obtained for the individual component replacements, a rational procedure was adopted to select eco-friendly mixes to replace the greatest number of natural raw materials with recycled wastes while yielding a concrete mix with adequate properties required for structural applications.
3. Results
In this portion of the research, 51 mixes containing different percentages of replacement of wood ash, crumb rubber, fine crushed glass, crushed glass, and recycled concrete aggregates were prepared and tested for their slumps, compressive strengths, splitting tensile strengths, and moduli of elasticity. Eco-friendly mixes that can be used for structural purposes are defined to be mixed containing waste products as partial replacements of normal components and having a 28-day compressive strength greater than 18 MPa in accordance with ACI (Section 19.2.1.1) [38].
3.1. Slump Test Results
Figure 3 represents the slump test results for individual waste material replacement ratios conducted according to ASTM C143 [33]. The results indicated that increasing the replacement ratios of cement by WA caused a slight decrease in the slump ranging from 1% to 3%. Moving on to replacing sand by WA, as the percentages of replacements increased, the graphs indicate a variation in the slump values ranging from an increase of 1% to a decrease of 3%. Replacing sand by CR, as the percentages of replacements increased, the graphs indicated a variation in the slump values ranging from a decrease of 1% to an increase of 2%. Replacing sand by FCG, the slump test results indicated a variation of less than 1%. When gravel was replaced by CG, the workability increased as the slump increased from 16.5 cm for the control mix to reach 17.2 cm at 50% replacement. The slump hardly increased as the percentage of replacement increased, but the effect was negligible. Replacing gravel by recycled concrete showed similar results as the crushed glass by increasing the workability. However, the recycled concrete had a reduced effect on the workability as the slump result was increased proportionally to the percentage of replacement, reaching 17 cm at 100% replacement. Therefore, recycled concrete slightly increases the workability of the concrete but has a reduced effect over the crushed glass. Examining the slump test results for mixes with replacements of two waste materials, as shown in Figure 4, reveals that there is an insignificant decrease that varies from as high as 3% to an increase of up to 2%. However, for the slump test results for mixes with replacements of three waste materials, as shown in Figure 5, the results are either similar or show an increase of up to 4%. Thus, the variation in slump upon replacing different percentages of single or multiple waste types is negligible, which indicates that these replacements do not significantly affect the workability.
3.2. Compressive Strength Results
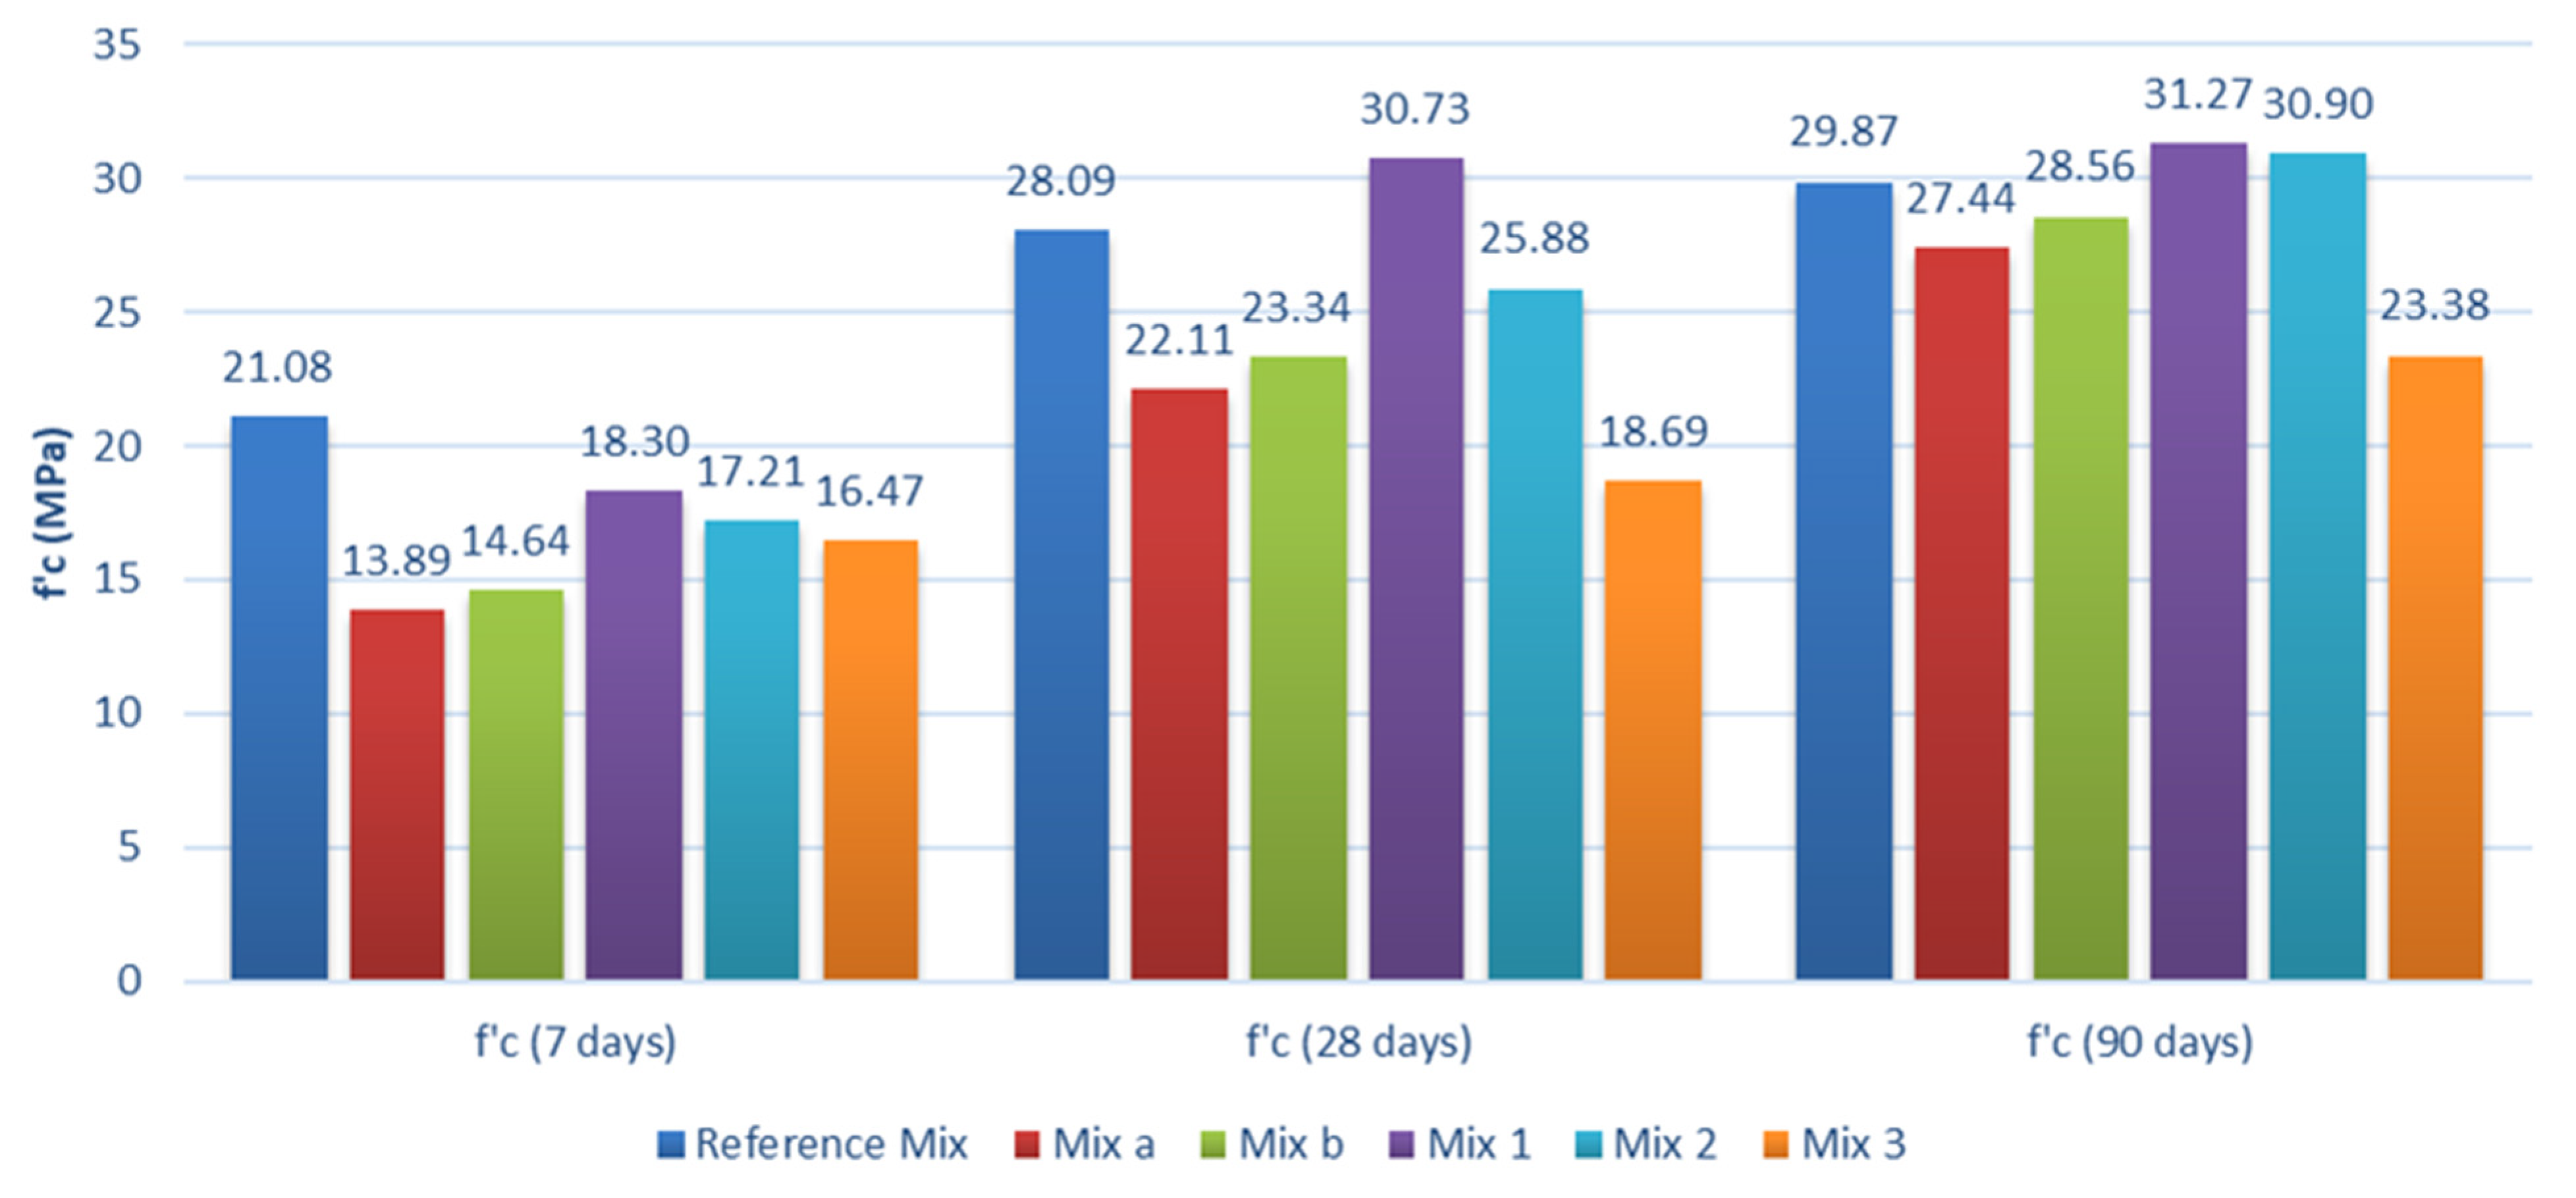
The compressive strength tests (Figure 6) were conducted according to ASTM C39 [34] at 7, 28, and 90 days after curing. Thus, the effects of these waste materials on early strength, effective strength, and long-term strength are explored. Figure 7, Figure 8 and Figure 9 represent the results for single-waste-material replacements. As the percentage of WA replacement for cement increased, the compressive strength decreased. However, it was noticed that the percentage decrease in the compressive strength in comparison with the control mix became less over time. At 7 days, a 5% replacement decreased the compressive strength by 64%, while at 90 days the decrease was 28%. This indicates that WA resulted in a relative increase in strength over the long term. The 5% replacement of cement by WA provided the best results and was chosen for the most eco-friendly mix. Upon replacing 10% of sand by WA, the compressive strength decreased. This was followed by a gradual increase in compressive strength as the replacement percentage reached 20%. Thus, 20% as the optimal replacement percentage was chosen because it resulted in a 90-day compressive strength greater than that of the control mix.
There was a very rapid decrease in the compressive strength when sand was replaced by CR at 90 days. A mere 5% replacement resulted in a 50% decrease in the compressive strength. Thus, for the optimum mix, a 2% sand replacement by CR was chosen. FCG results in an optimal strength for a 20% replacement of sand. It is noticed that the percentage difference of the compressive strength barely varied over time. At 10% replacement, the percentage decrease in compressive strength at 7, 28, and 90 days was 24%, and at 30% replacement it was 32%. Replacing 10% of the medium aggregates by CG decreased the compressive strength by 59%, 40%, and 18% at 7, 28, and 90 days, respectively, thus indicating that CG resulted in an increase in the compressive strength over time. Consequently, the 5% replacement was adopted to ensure that the compressive strength of the eco-friendly mix still resulted in a satisfactory strength. For up to 40% replacement of gravel by RC, the concrete mix compressive strength decreased, whereas an increase in the replacement ratio of more than 40% resulted in an increase in the compressive strength. At 90 days, the percentage difference in the compressive strength was merely 4% when all the coarse aggregates were replaced by RC.
Figure 10 and Figure 11 represent the compressive results for two- and three-waste-materials replacements. For two-waste-materials replacements, the combination of 10% WA replacing sand with 50% RC replacing gravel and 20% WA replacing sand with 100% RC replacing gravel had displayed an improved compressive strength compared to the reference mix. The best performance for three-waste-materials replacements was the combination of 2% WA for cement, 2% CR for sand, and 5% CG for gravel, but still it was less than the reference mix by 7.83%.
3.3. Modulus of Elasticity
The modulus of elasticity for concrete (Ec) is an important parameter that shows the ability of concrete to deform elastically. Building specifications often require that specific values of the modulus of elasticity must be met to ensure that the structural integrity of the building is satisfactory and to prevent unsatisfactory deformations. In this research, the modulus of elasticity was obtained using three different ways which are listed below:
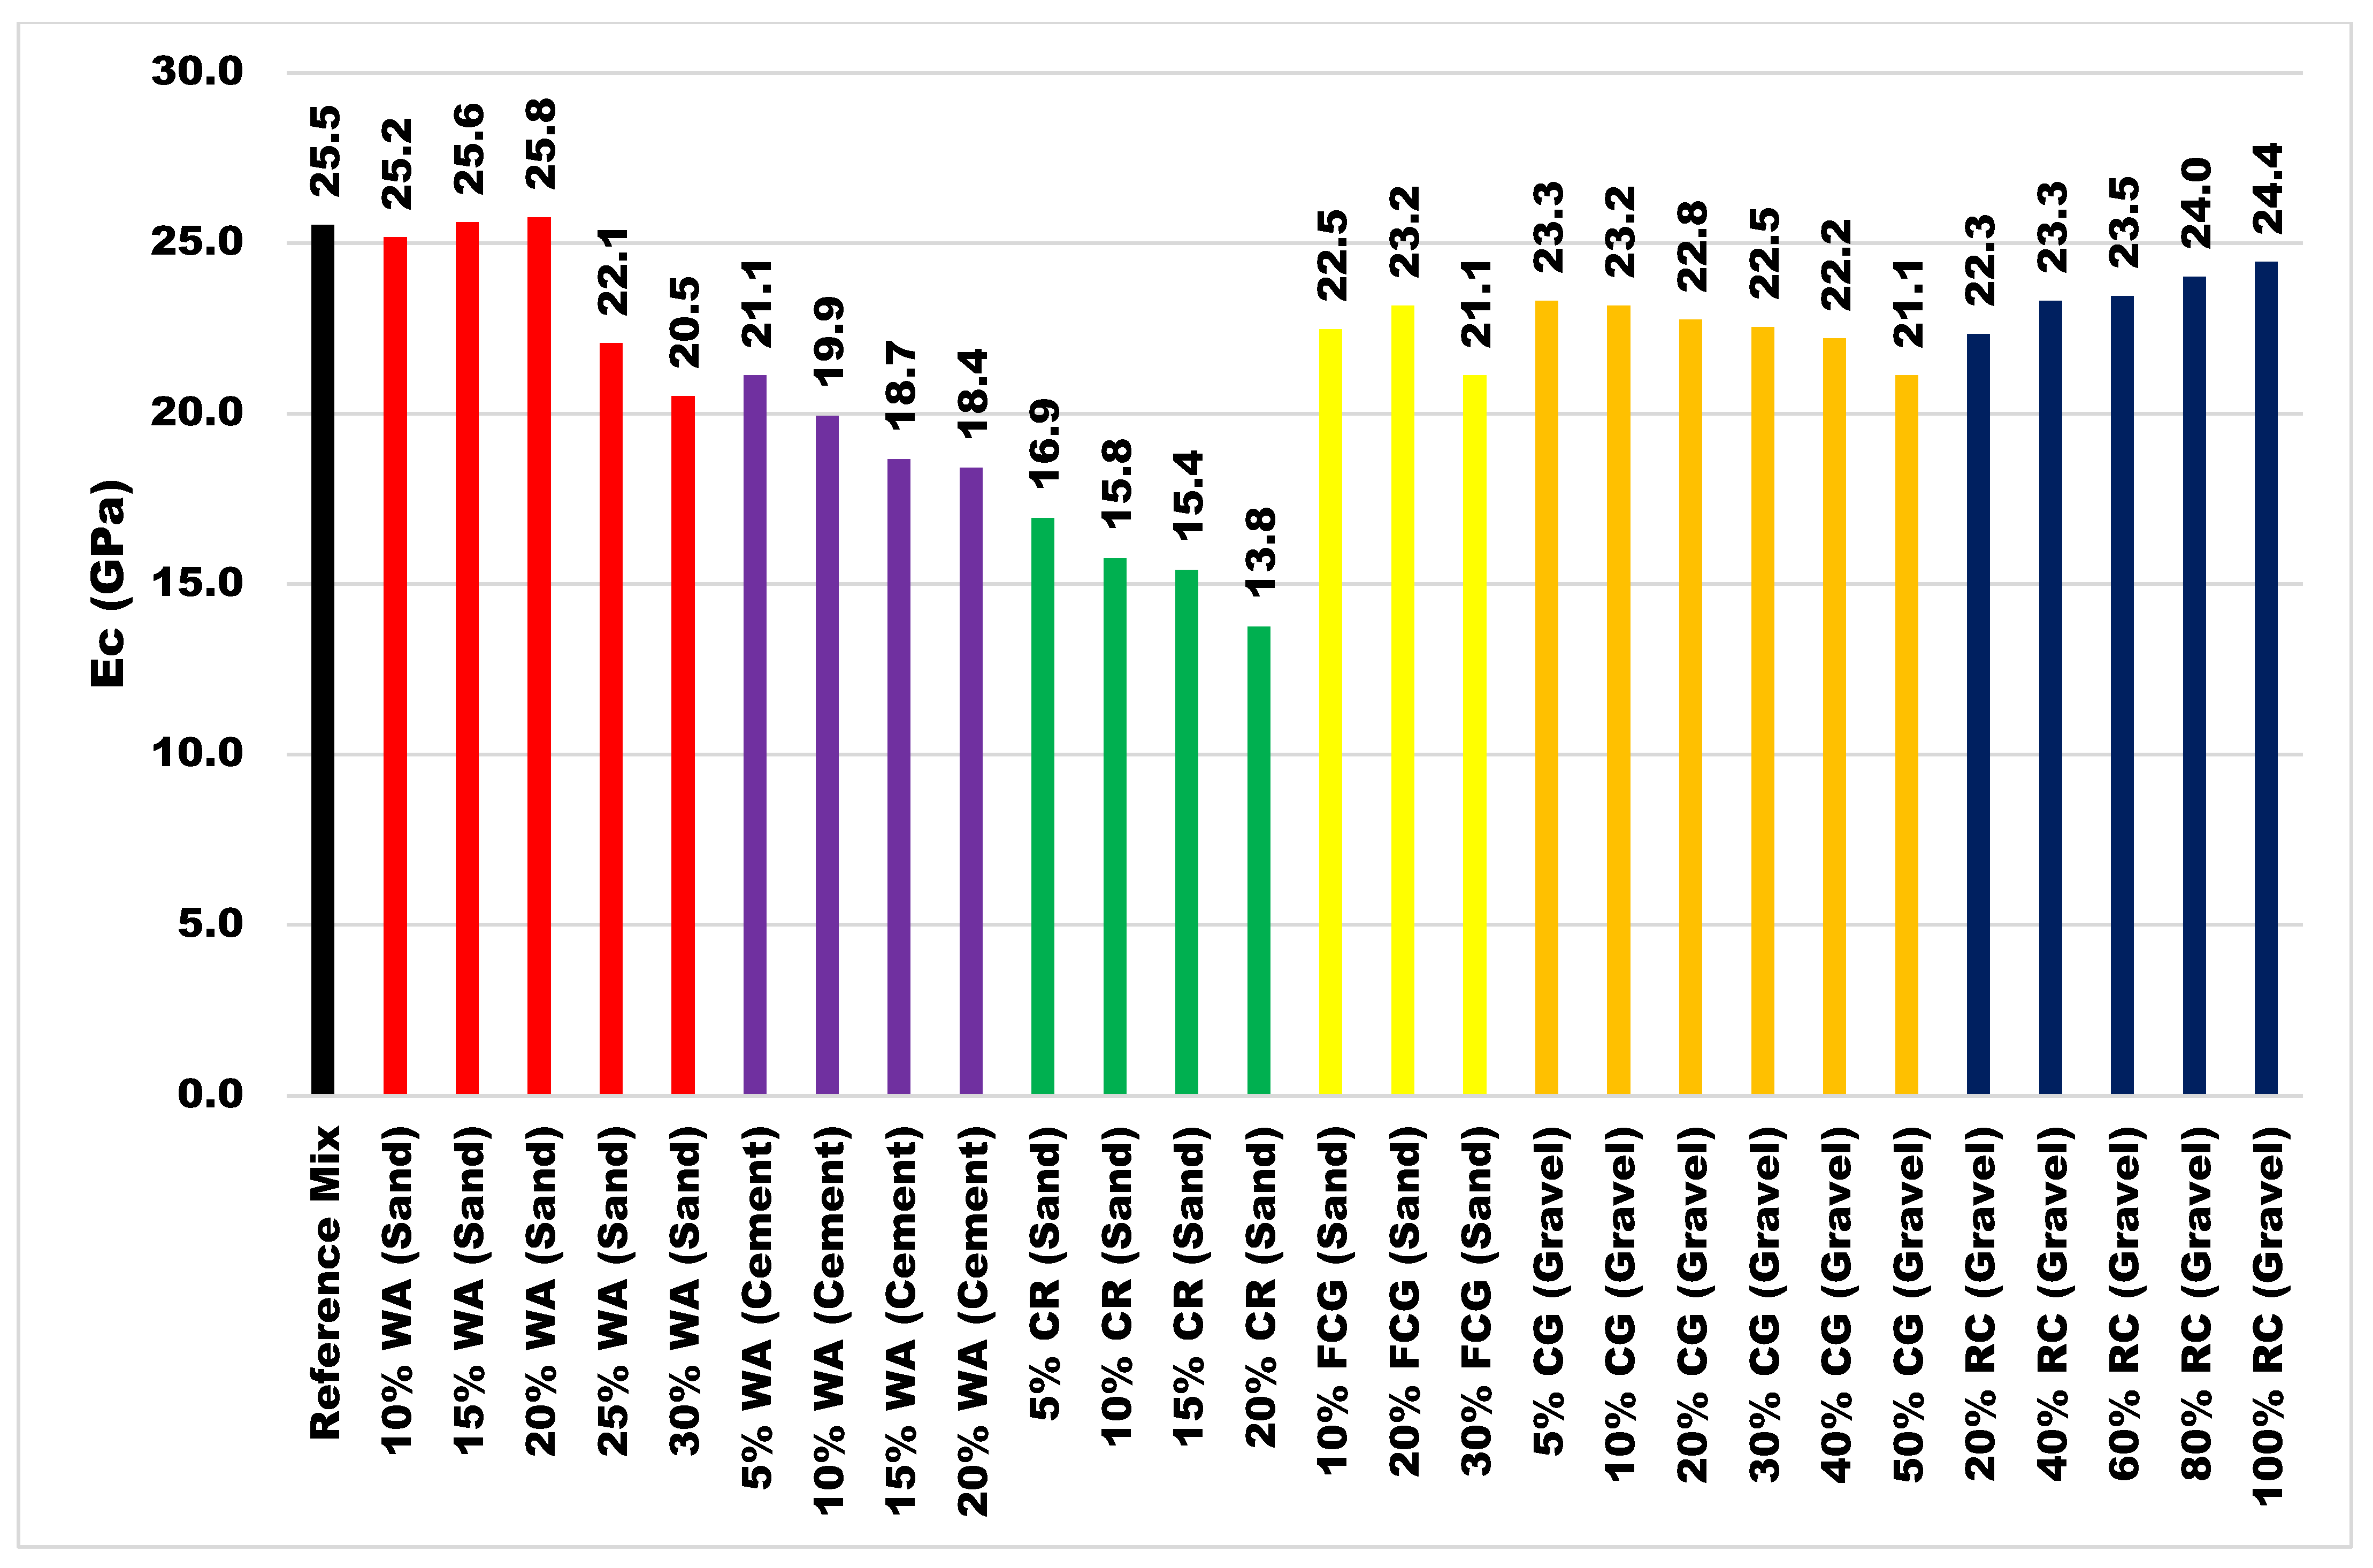
Figure 12, Figure 13 and Figure 14 represent the results of the three methods used to obtain the moduli of elasticity upon partially replacing the normal mix materials with the individual waste materials at different percentages. The graphs presented indicate that a replacement of sand by WA up to 20% would keep similar results for the modulus of elasticity. However, the values significantly decreased with 25% and 30% replacement. As for replacing cement by WA, a significant decrease was recorded between the control mix and the 5% replacement, and then slight decreases were recorded as the percentage of replacement increased to reach up to 20%. While replacing gravel by RCA, the value of the elastic modulus dropped significantly compared to a 20% replacement by the control mix and then increased as the percentage of replacement increased, almost matching the control mix results at 100% replacement. Replacing sand by FCG decreased the value of the modulus of elasticity by 10% with 10% and 20% displacement. A value of 30% replacement showed even less values for the modulus of elasticity. Using CG as a replacement for gravel, slight changes in the modulus of elasticity were recorded with a decrease that reached up to 20% of the value obtained by the control mix as the percentages of replacement varied from 5% to 50%. Replacing sand by CR recorded the greatest decrease in the modulus of elasticity with 5%, 10%, 15%, and 20%. The decrease in the value of the modulus of elasticity reached up to 50% with a 20% replacement.
3.4. Splitting Tensile Strength
Concrete is not normally designed to resist direct tension; however, the knowledge of the tensile strength of concrete is important because it determines the resistance to cracking. The splitting tensile strength (Figure 15) was conducted according to ASTM C496 [37]. Figure 16 represents the results for replacing individual waste materials at different percentages. Starting off by replacing sand by WA, the splitting strength decreased at 10%, 25%, and 30% replacement and increased at 15% and 20% replacement. As the control mix recorded a splitting strength of 2.85 MPa, the lowest value recorded was 1.96 MPa at 30% replacement, and the highest value recorded was 3.1 MPa at 20% replacement. Replacing cement by WA significantly decreased the splitting strength of the concrete as the percentage of replacement increased. The control mix recorded 2.85 MPa compared to a sample with 20% replacement of cement by WA at 1.17 MPa. Replacing sand by CR decreased the splitting strength as well: 2.85 MPa for the control mix down to 0.9 MPa for 20% replacement. This sharp decrease should be taken into consideration while choosing the replacement percentage of sand by CR. Replacing sand by FCG decreased the splitting strength of the concrete but to a lesser extent compared to the effect of replacing sand by CR and WA. Replacing gravel by CG decreased the splitting strength to a value of 1.24 MP at 50% replacement and resulted in a 56% reduction compared to the control mix. The decrease in the splitting strength increased as the percentage of replacement increased. Finally, replacing gravel by RC displayed a decrease in the splitting strength to 2.06 MPa at 20% replacement. However, the splitting strength increased as the percentage of replacement increased, reaching a value of 2.87 MPa at 100% replacement.
Figure 17 represents the splitting tensile strength results for replacing two waste materials at different percentages and combinations. Three mixed replacement combinations exceeded the values obtained for the reference mix, and they resulted from:
- A total of 5% WA for cement and 20% WA for sand with an increase of 6.6%;
- A total of 15% WA for cement and 75% RC for gravel with an increase of 6.6%;
- A total of 20% WA for cement and 100% RC for gravel with an increase of 7.9%;
- A total of 2% CR for cement and 50% RC for gravel with an increase of 2.4%
Figure 18 represents the splitting tensile strength results for replacing three waste materials at different percentages and combinations. The only mix replacement combination that exceeded the values obtained for the reference mix by 11.4% resulted from the replacement combination of 2% WA for cement, 5% CR for sand, and 5% CG for gravel.
4. Eco-Friendly Mixes
In this study, the most eco-friendly criteria were set for mixes containing more than 20% waste materials replacing normal materials. Table 5 explores the eco-friendly structural concrete mixes realized in this study. In the optimum eco-friendly concrete mix design, cement was replaced by mass at 5% by WA; sand was replaced by volume with 20% of WA, 2% with CR, and 20% by FCG; and gravel was replaced by 5% CG and 50% RCA by volume. These percentages were adopted, as they represented the highest percentage that each waste material attained individually. Figure 19 displays the slump test results, displaying a slight decrease in the slump compared to the control mix with a value of 0.1 cm. In Figure 20, the results for the compressive strength indicate a decrease compared to the control mix, which recorded 21.1 MPa, 28.1 MPa, and 29.9 MPa at 7, 28, and 90 days, and the most eco-friendly mix, which recorded 16.5 MPa, 18.7 MPa, and 23.4 MPa. However, mix 1 is superior to the reference mix at 28 and 90 days and is less at 7 days. Regardless, the limitation of using the concrete for structural applications requires maintaining compressive strength above 18 MPa at 28 days [33], which is met in the most eco-friendly mix. In Figure 21, the optimum eco-friendly mix records a decrease in the elastic modulus compared to the control mix. In Figure 22, the splitting tensile strength slightly decreases from 2.85 MPa for the control mix to 2.62 MPa for the most eco-friendly mix. This decrease is considered an acceptable reduction, taking into consideration the huge environmental impact realized by this mix.
5. Conclusions
This study investigated WA as a partial replacement for cement and sand, FCG and CR as partial replacements for sand, and CG and RC as partial replacements for gravel to reduce both the contribution of concrete to the carbon footprint and the depletion of the corresponding natural resources, along with the benefit of diverting wastes from landfills. The optimum mix or the most eco-friendly mix resulted from the replacement percentages of 2% CR, 50% RC, 20% FCG, 5% CG, and 20% WA for sand and 5% WA for cement, providing adequate results in terms of the mechanical properties producing structurally worthy concrete.
Some more comprehensive observations about of the key findings in these replacement ratios of single-, two-, and three-waste materials are:
- Slump
- ○
- An increase in the percentages of the RC replacement of gravel resulted in an increase in slump due to the irregularity of the RC shape.
- ○
- An increase in the percentages of the CG replacement of gravel resulted in an increase in slump as a result of a smooth surface and the angular shape of glass waste.
- ○
- An increase in the percentages of the WA replacement of cement resulted in a decrease in slump due to the additional absorption of WA, resulting in a decrease in the water–cement ratio.
- ○
- An increase in the percentages of the CR replacement of sand resulted in an increase in slump after an initial decrease at the lower replacement percentages due to the smooth surface of the CR.
- ○
- An increase in the percentages of the WA replacement of sand resulted in an increase in slump after an initial decrease at the lower replacement percentages due to the increase in the material that could be classified as binder.
- ○
- An increase in the percentages of the FCG replacement of sand resulted in an increase in slump due to the minute size of material allowing it to fill voids.
- ○
- For two-waste-materials replacement percentages, the slump was equal or exceeded the reference mix except for the cases where one of the waste materials was WA replacing sand, which resulted in lower slump values, as indicated previously for only WA replacement.
- ○
- For three-waste-materials replacement percentages, the slump was equal or exceeded the reference mix for the combinations, as the different materials were able to compensate for each other’s deficiencies.
- Compressive Strength
- ○
- For individual waste materials replacement: The seven-day tests for 20% WA replacing sand results achieved the maximum value but still less than the reference mix, with the 28-day results being almost identical to the reference mix. As for the 90-day results, the 15% and 20% WA replacing sand resulted in almost identical values as the reference mix. In addition, a great improvement in values for 5% CG for gravel and 100% RC for gravel were obtained. Both WA and CG had binder effects and RC added a residue of cement to the mixes.
- ○
- For two-waste-materials replacement: The test results at 90 days for 10%, 15%, and 20% WA replacing sand combined with 50%, 75%, and 100% RC replacing gravel reached greater values than those of the reference mix, whereas 5% WA for cement in combination with 25% WA for sand resulted in almost identical values as the reference mix at 90 days.
- ○
- For three-waste-materials replacement: The best test results were at 90 days for a combined mix of 2% WA replacing sand, 2% CR replacing sand, and 5% CG replacing gravel, which reached a value of almost 95% of the reference mix.
- Splitting Tensile Strength
- ○
- For individual waste materials replacement: The test results for 15% and 20% WA replacing sand achieved greater values than the reference mix, whereas the test results for 100% RC replacing gravel were almost identical to those of the reference mix.
- ○
- For two-waste-materials replacement: The test results for the combination of 5% WA replacing cement plus 25% WA replacing sand, 15% WA replacing sand plus 75% RC replacing gravel, 20% WA replacing sand plus 100% RC replacing gravel, and 2% CR replacing sand plus 50% RC replacing gravel reached greater values than the results of the reference mix.
- ○
- For three-waste-materials replacement: The only test results that were greater than those of the reference mix were realized from a combined mix of 2% WA replacing sand, 2% CR replacing sand, and 5% CG replacing gravel.
In the control mix, water, cement, sand, and gravel constituted, respectively, 7.05%, 14.1%, 49.79%, and 29.05% of the total mass of the concrete mix. In the optimum eco-friendly mix, and upon replacing cement by 5% of WA by mass, replacing sand by 2% of CR, 20% of WA, and 20% FCG by volume, and replacing gravel by 5% and 50% by the volume of CG and RC, respectively, the total replacement of wastes was 32% by mass and 34% by volume.
Author Contributions
Conceptualization and Methodology: N.N.G. and C.A.I. Experimental Work: S.A., J.S. and R.A. Validation: E.S. Supervision: M.A. All authors have read and agreed to the published version of the manuscript.
Funding
This research received no external funding.
Institutional Review Board Statement
Not applicable.
Informed Consent Statement
Not applicable.
Data Availability Statement
All data, models, and code generated or used during the study appear in the article.
Acknowledgments
The support of the Civil Engineering Laboratory at the University of Balamand is highly appreciated.
Conflicts of Interest
The authors declare no conflict of interest.
References
- UNECE. Air Pollution. Available online: https://unece.org/air-pollution-and-health (accessed on 24 February 2022).
- Lehne, J.; Preston, F. Making Concrete Change: Innovation in Low-Carbon Cement and Concrete. 2018. Available online: https://www.chathamhouse.org/2018/06/making-concrete-change-innovation-low-carbon-cement-and-concrete (accessed on 24 February 2022).
- Greenspec. Environmental Impacts of Concrete. Available online: https://www.greenspec.co.uk/building-design/environmental-impacts-of-concrete/ (accessed on 24 February 2022).
- Meyer, C. Concrete Materials and Sustainable Development in the United States. Struct. Eng. Int. 2004, 14, 203–207. [Google Scholar] [CrossRef]
- Sonibare, O.O.; Adeniran, J.A.; Bello, I.S. Landfill air and odor emissions from an integrated waste management facility. J. Environ. Health Sci. Eng. 2019, 17, 13–28. [Google Scholar] [CrossRef] [PubMed]
- WHO. Air Pollution. 2016. Available online: https://www.who.int/health-topics/air-pollution#tab=tab_2 (accessed on 24 February 2022).
- IPEC. Waste Tires Treatment Technologies. Available online: https://tdplant.com/news/waste-tires-conversion-technologies (accessed on 24 February 2022).
- Issa, C.A.; Salem, G. Utilization of recycled crumb rubber as fine aggregates in concrete mix design. Constr. Build. Mater. 2013, 42, 48–52. [Google Scholar] [CrossRef]
- Eldin, N.N.; Senouci, A.B. Rubber-tire particles as concrete aggregate. J. Mater. Civ. Eng. 1993, 5, 478–496. [Google Scholar] [CrossRef]
- Bušić, R.; Miličević, I.; Kalman Šipoš, T.; Jeleč, K. Recycled Rubber as an Aggregate Replacement in Self-Compacting Concrete. Materials 2018, 11, 1729. [Google Scholar] [CrossRef] [Green Version]
- Tripathi, A.; Baniya, M. Use of Recycled Tires as Partial replacement of Coarse Aggregate in the Production of Concrete. Int. J. Civ. Eng. 2017, 4. [Google Scholar]
- Gerges, N.N.; Issa, C.A.; Fawaz, S. Rubber Concrete: Mechanical and Dynamical Properties. J. Case Stud. Constr. Mater. 2018, 9, 13. [Google Scholar] [CrossRef]
- Huang, W.; Huang, X.; Xing, O.; Zhou, Z. Strength reduction factor of crumb rubber as fine aggregate replacement in concrete. J. Build. Eng. 2020, 32, 6. [Google Scholar] [CrossRef]
- Wang, J.; Du, B. Experimental studies of thermal and acoustic properties of recycled aggregate crumb rubber concrete. J. Build. Eng. 2020, 32, 7. [Google Scholar] [CrossRef]
- Amiri, M.; Hatami, F.; Golafshani, E.M. Evaluating the synergic effect of waste rubber powder and recycled concrete aggregate on mechanical properties and durability of concrete. J. Case Stud. Constr. Mater. 2021, 15, 8. [Google Scholar] [CrossRef]
- Environmental Protection Agency (EPA). Glass: Material-Specific Data. 2018. Available online: https://www.epa.gov/facts-and-figures-about-materials-waste-and-recycling/glass-material-specific-data (accessed on 24 February 2022).
- Gerges, N.N.; Issa, C.A.; Fawaz, S.A.; Jabbour, J.; Jreige, J.; Yacoub, A. Recycled Glass Concrete: Coarse and Fine Aggregates. Eur. J. Eng. Res. Sci. 2018, 3, 1–9. [Google Scholar] [CrossRef] [Green Version]
- Khan, M.N.N.; Saha, A.K.; Sarker, P.K. Reuse of waste glass as a supplementary binder and aggregate for sustainable cement-based construction materials: A review. J. Build. Eng. 2020, 28, 19. [Google Scholar] [CrossRef]
- Guo, P.; Meng, W.; Nassif, H.; Gou, H.; Bao, Y. New perspectives on recycling waste glass in manufacturing concrete for sustainable civil infrastructure. Constr. Build. Mater. 2020, 257, 15. [Google Scholar] [CrossRef]
- Abdelli, H.E.; Mokrani, L.; Salim Kennouche, S.; de Aguiar, B. Utilization of waste glass in the improvement of concrete performance: A mini review. Waste Manag. Res. 2020, 38, 1204–1213. [Google Scholar] [CrossRef]
- Environmental Protection Agency (EPA). Sustainable Management of Construction and Demolition Materials. Available online: https://www.epa.gov/smm/sustainable-management-construction-and-demolition-materials (accessed on 24 February 2022).
- Nováková, I.; Mikulica, K. Properties of concrete with partial replacement of natural aggregate by recycled concrete aggregates from precast production. Procedia Eng. 2016, 151, 360–367. [Google Scholar] [CrossRef] [Green Version]
- Pavlu, T.; Koci, V.; Hajek, P. Environmental Assessment of Two Use Cycles of Recycled Concrete Aggregates. Sustainability 2019, 11, 6185. [Google Scholar] [CrossRef] [Green Version]
- Veriana, K.P.; Cao, Y.; Ashraf, W. Properties of recycled concrete aggregate and their influence in new concrete production. Resour. Conserv. Recycl. 2018, 133, 30–49. [Google Scholar] [CrossRef]
- Tošić, N.; Marinković, S.; Dašić, T.; Stanić, M. Multicriteria optimization of natural and recycled aggregate concrete for structural use. J. Clean. Prod. 2015, 87, 766–776. [Google Scholar] [CrossRef]
- Taffese, W.Z. Suitability Investigation of Recycled Concrete Aggregates for Concrete Production: An Experimental Case Study. Adv. Civ. Eng. 2018, 1, 11. [Google Scholar] [CrossRef]
- Chowdhury, S.; Mishra, M.; Suganya, O.M. The incorporation of wood waste ash as a partial cement replacement material for making structural grade concrete: An overview. Ain Shams Eng. J. 2015, 6, 429–437. [Google Scholar] [CrossRef] [Green Version]
- Siddique, R. Utilization of wood ash in concrete manufacturing. Resour. Conserv. Recycl. 2012, 67, 27–33. [Google Scholar] [CrossRef]
- Naik, T.R. Tests of Wood Ash as a Potential Source for Construction Materials; Report No. CBU-1999-09; Department of Civil Engineering and Mechanics, University of Wisconsin-Milwaukee: Milwaukee, MI, USA, 1999; p. 61. [Google Scholar]
- Naik, T.R.; Kraus, R.N.; Siddique, R. Use of wood ash in cement-based materials. ACI Mater. J. 2003, 100, 208–215. [Google Scholar]
- ASTM C136/C136M-14; Standard Test Method for Sieve Analysis of Fine and Coarse Aggregates. American Society for Testing and Materials: West Conshohocken, PA, USA, 2014.
- ASTM C192/C192M-19; Standard Practice for Making and Curing Concrete Test Specimens in the Laboratory. American Society for Testing and Materials: West Conshohocken, PA, USA, 2019.
- ASTM C143/C143M; Standard Test Method for Slump of Hydraulic-Cement Concrete. ASTM International: West Conshohocken, PA, USA, 2020.
- ASTM C39/C39M; Standard Test Method for Compressive Strength of Cylindrical Concrete Specimens. ASTM International: West Conshohocken, PA, USA, 2021.
- ASTM C597; Standard Test Method for Pulse Velocity through Concrete. ASTM International: West Conshohocken, PA, USA, 2016.
- ASTM C469/C469M; Standard Test Method for Static Modulus of Elasticity and Poisson’s Ratio of Concrete in Compression. ASTM International: West Conshohocken, PA, USA, 2014.
- ASTM C496/C496M; Standard Test Method for Splitting Tensile Strength of Cylindrical Concrete Specimens. ASTM International: West Conshohocken, PA, USA, 2017.
- ACI CODE-318; Building Code Requirements for Structural Concrete and Commentary. American Concrete Institute: Farmington Hills, MI, USA, 2019.
Figure 1.
The Five Waste Materials used in the Mortar Mix Design. (a) Wood Ash (WA). (b) Fine Crushed Glass (FCG). (c) Crumb Rubber (CR). (d) Crushed Glass (CG). (e) Recycled Concrete (RC).
Figure 1.
The Five Waste Materials used in the Mortar Mix Design. (a) Wood Ash (WA). (b) Fine Crushed Glass (FCG). (c) Crumb Rubber (CR). (d) Crushed Glass (CG). (e) Recycled Concrete (RC).

Figure 2.
Sieve Analysis Results for the Coarse and Fine Aggregates Materials.
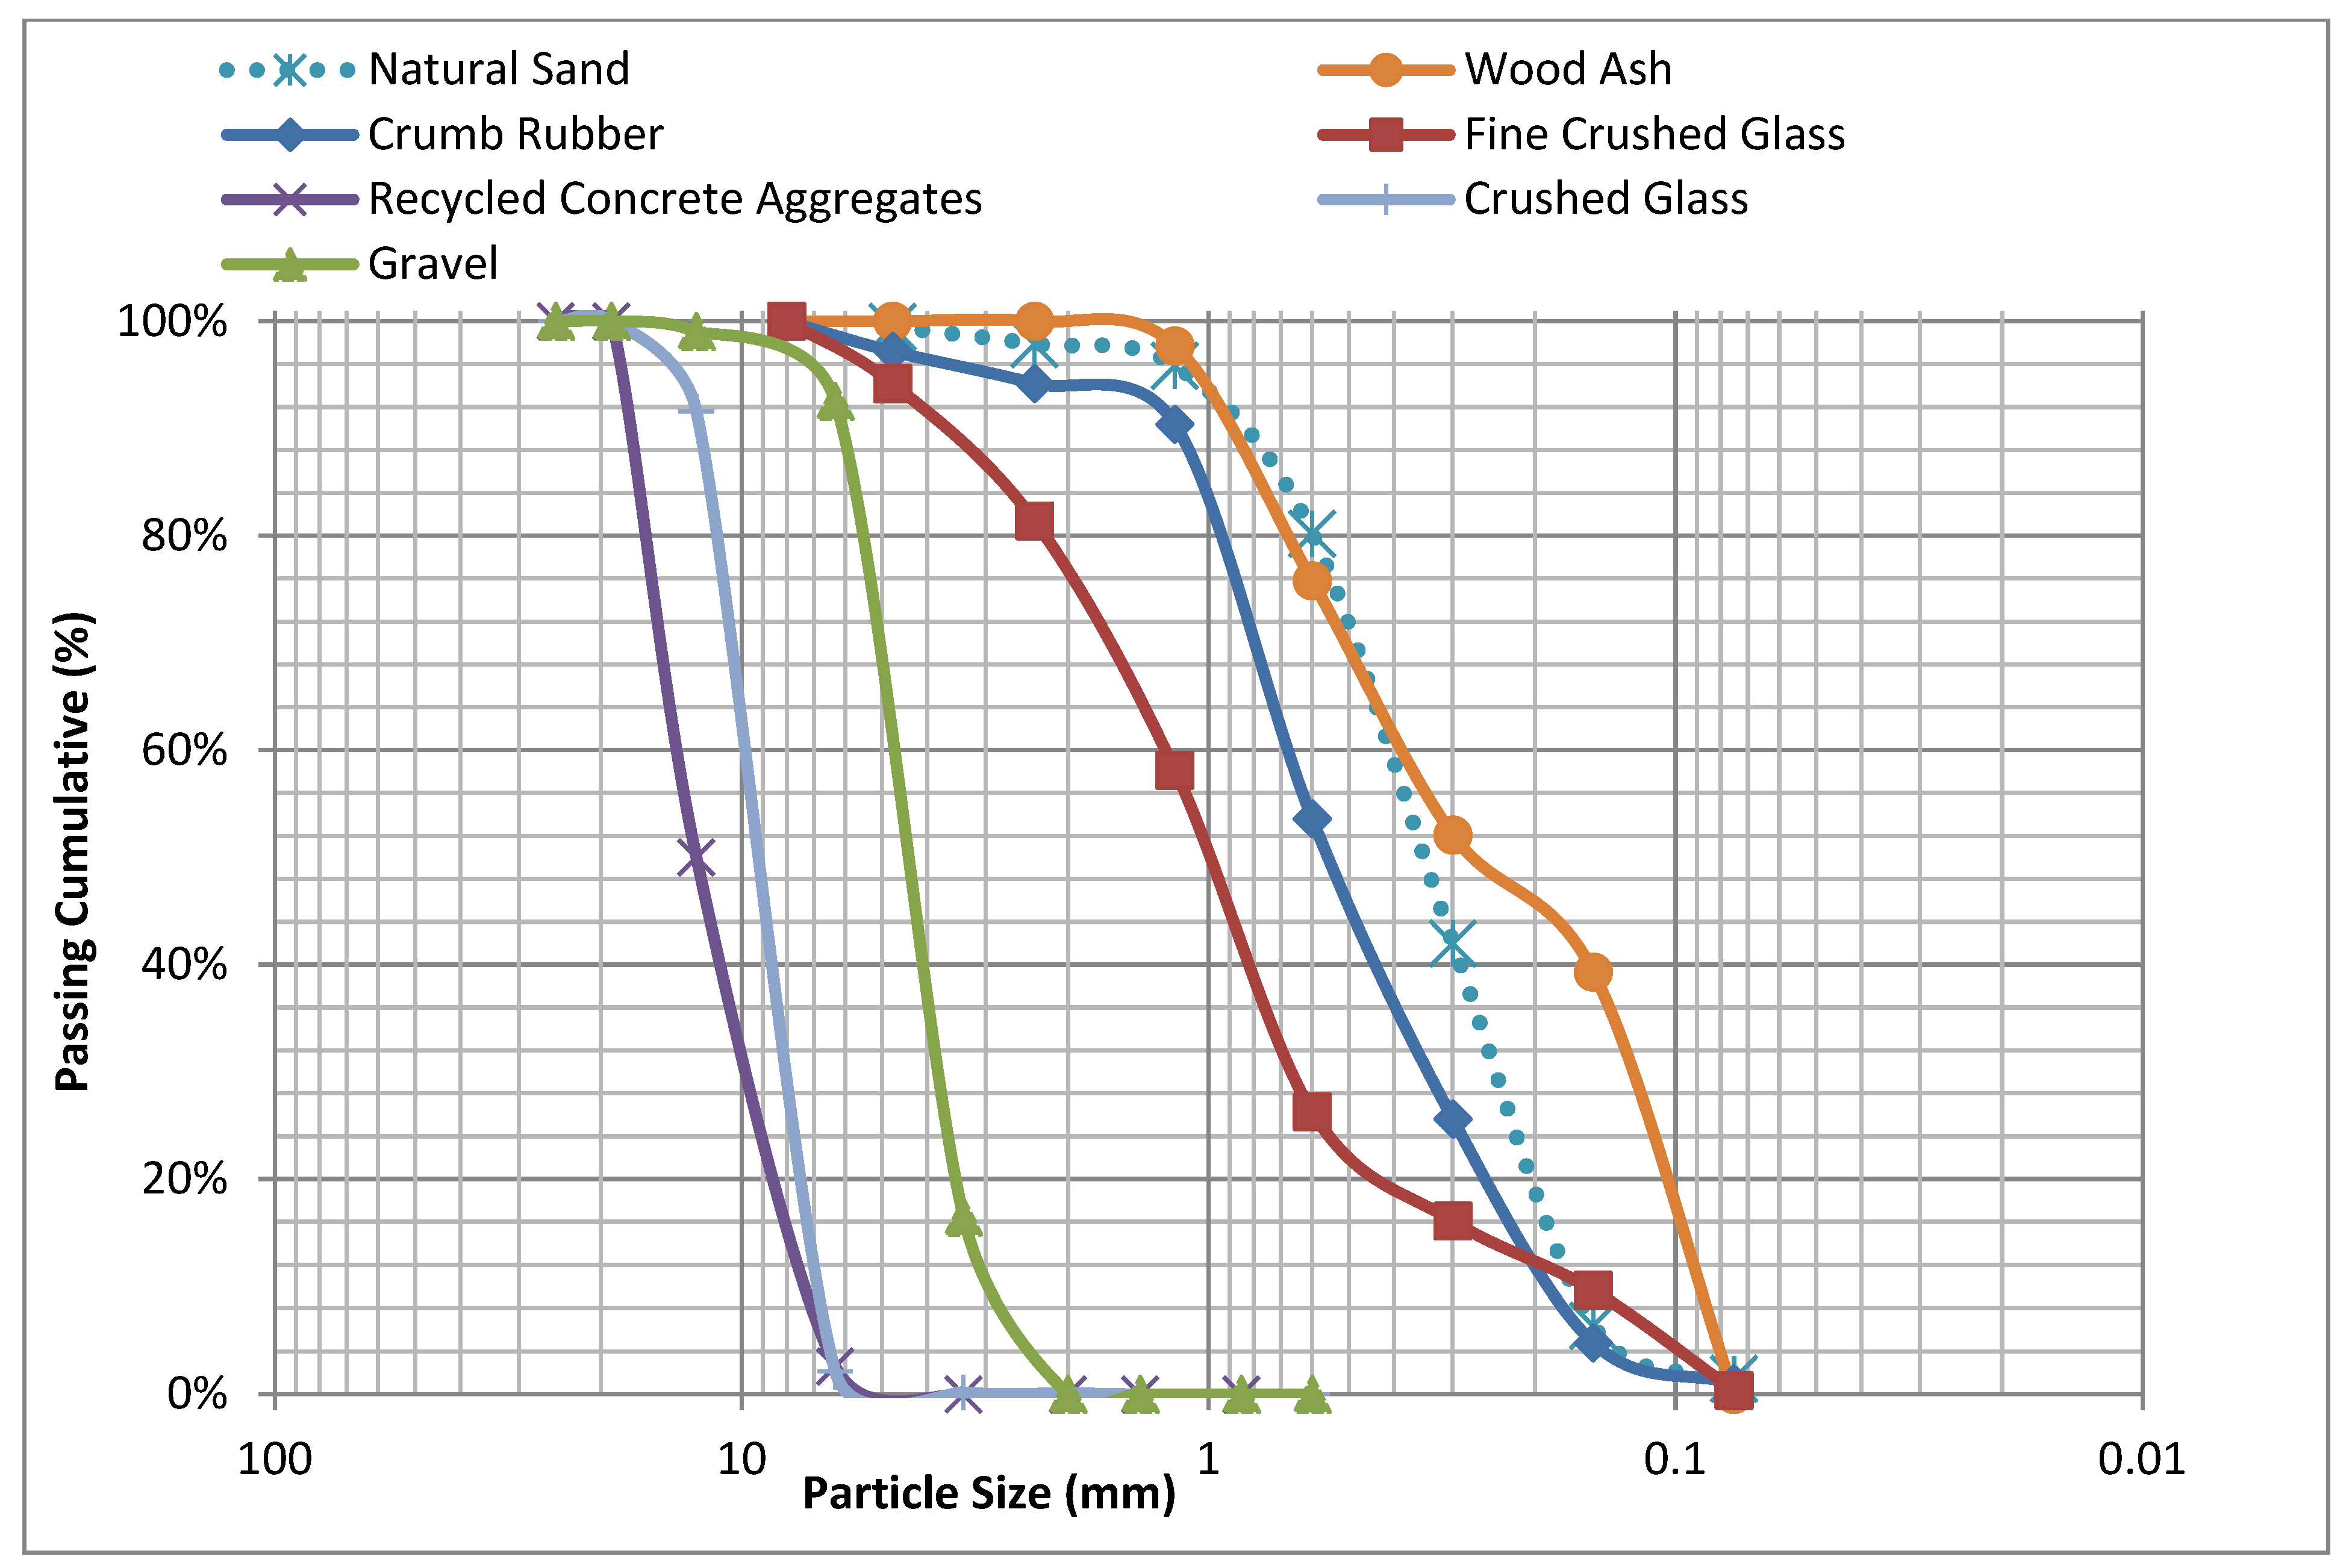
Figure 3.
Slump (cm) for Single-Waste-Material Replacement.
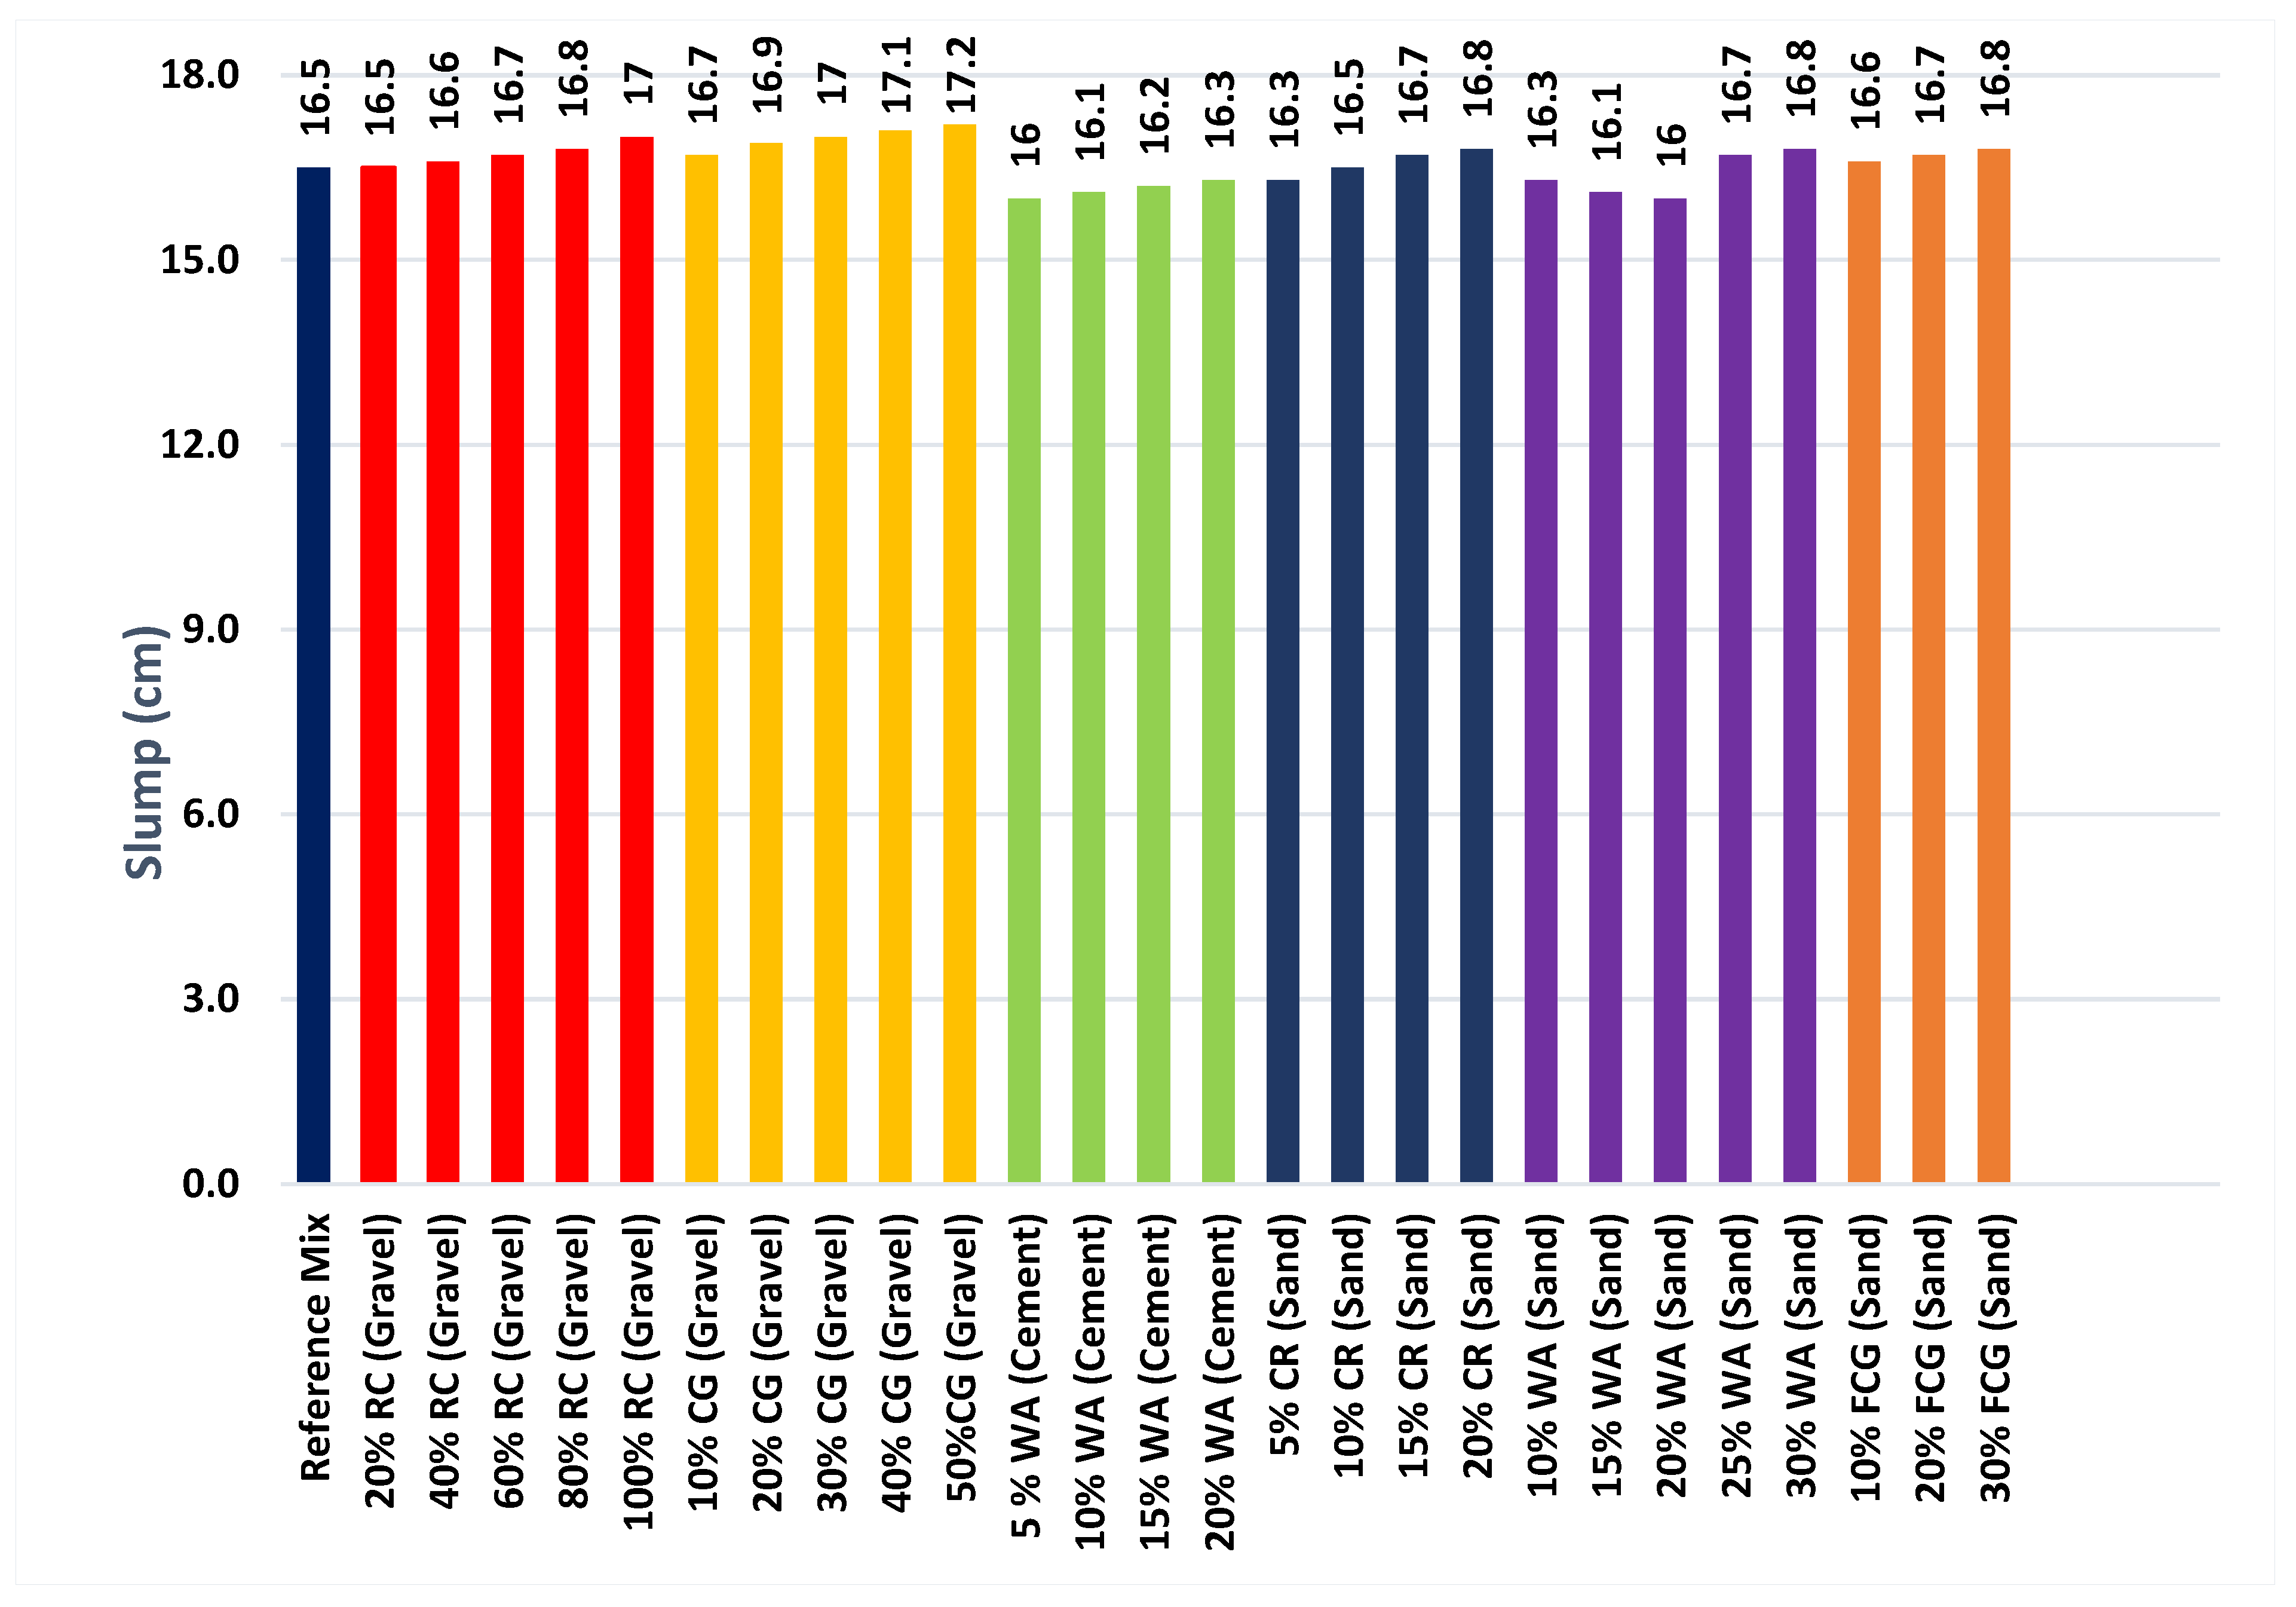
Figure 4.
Slump (cm) for Two-Types-of-Waste Replacements.
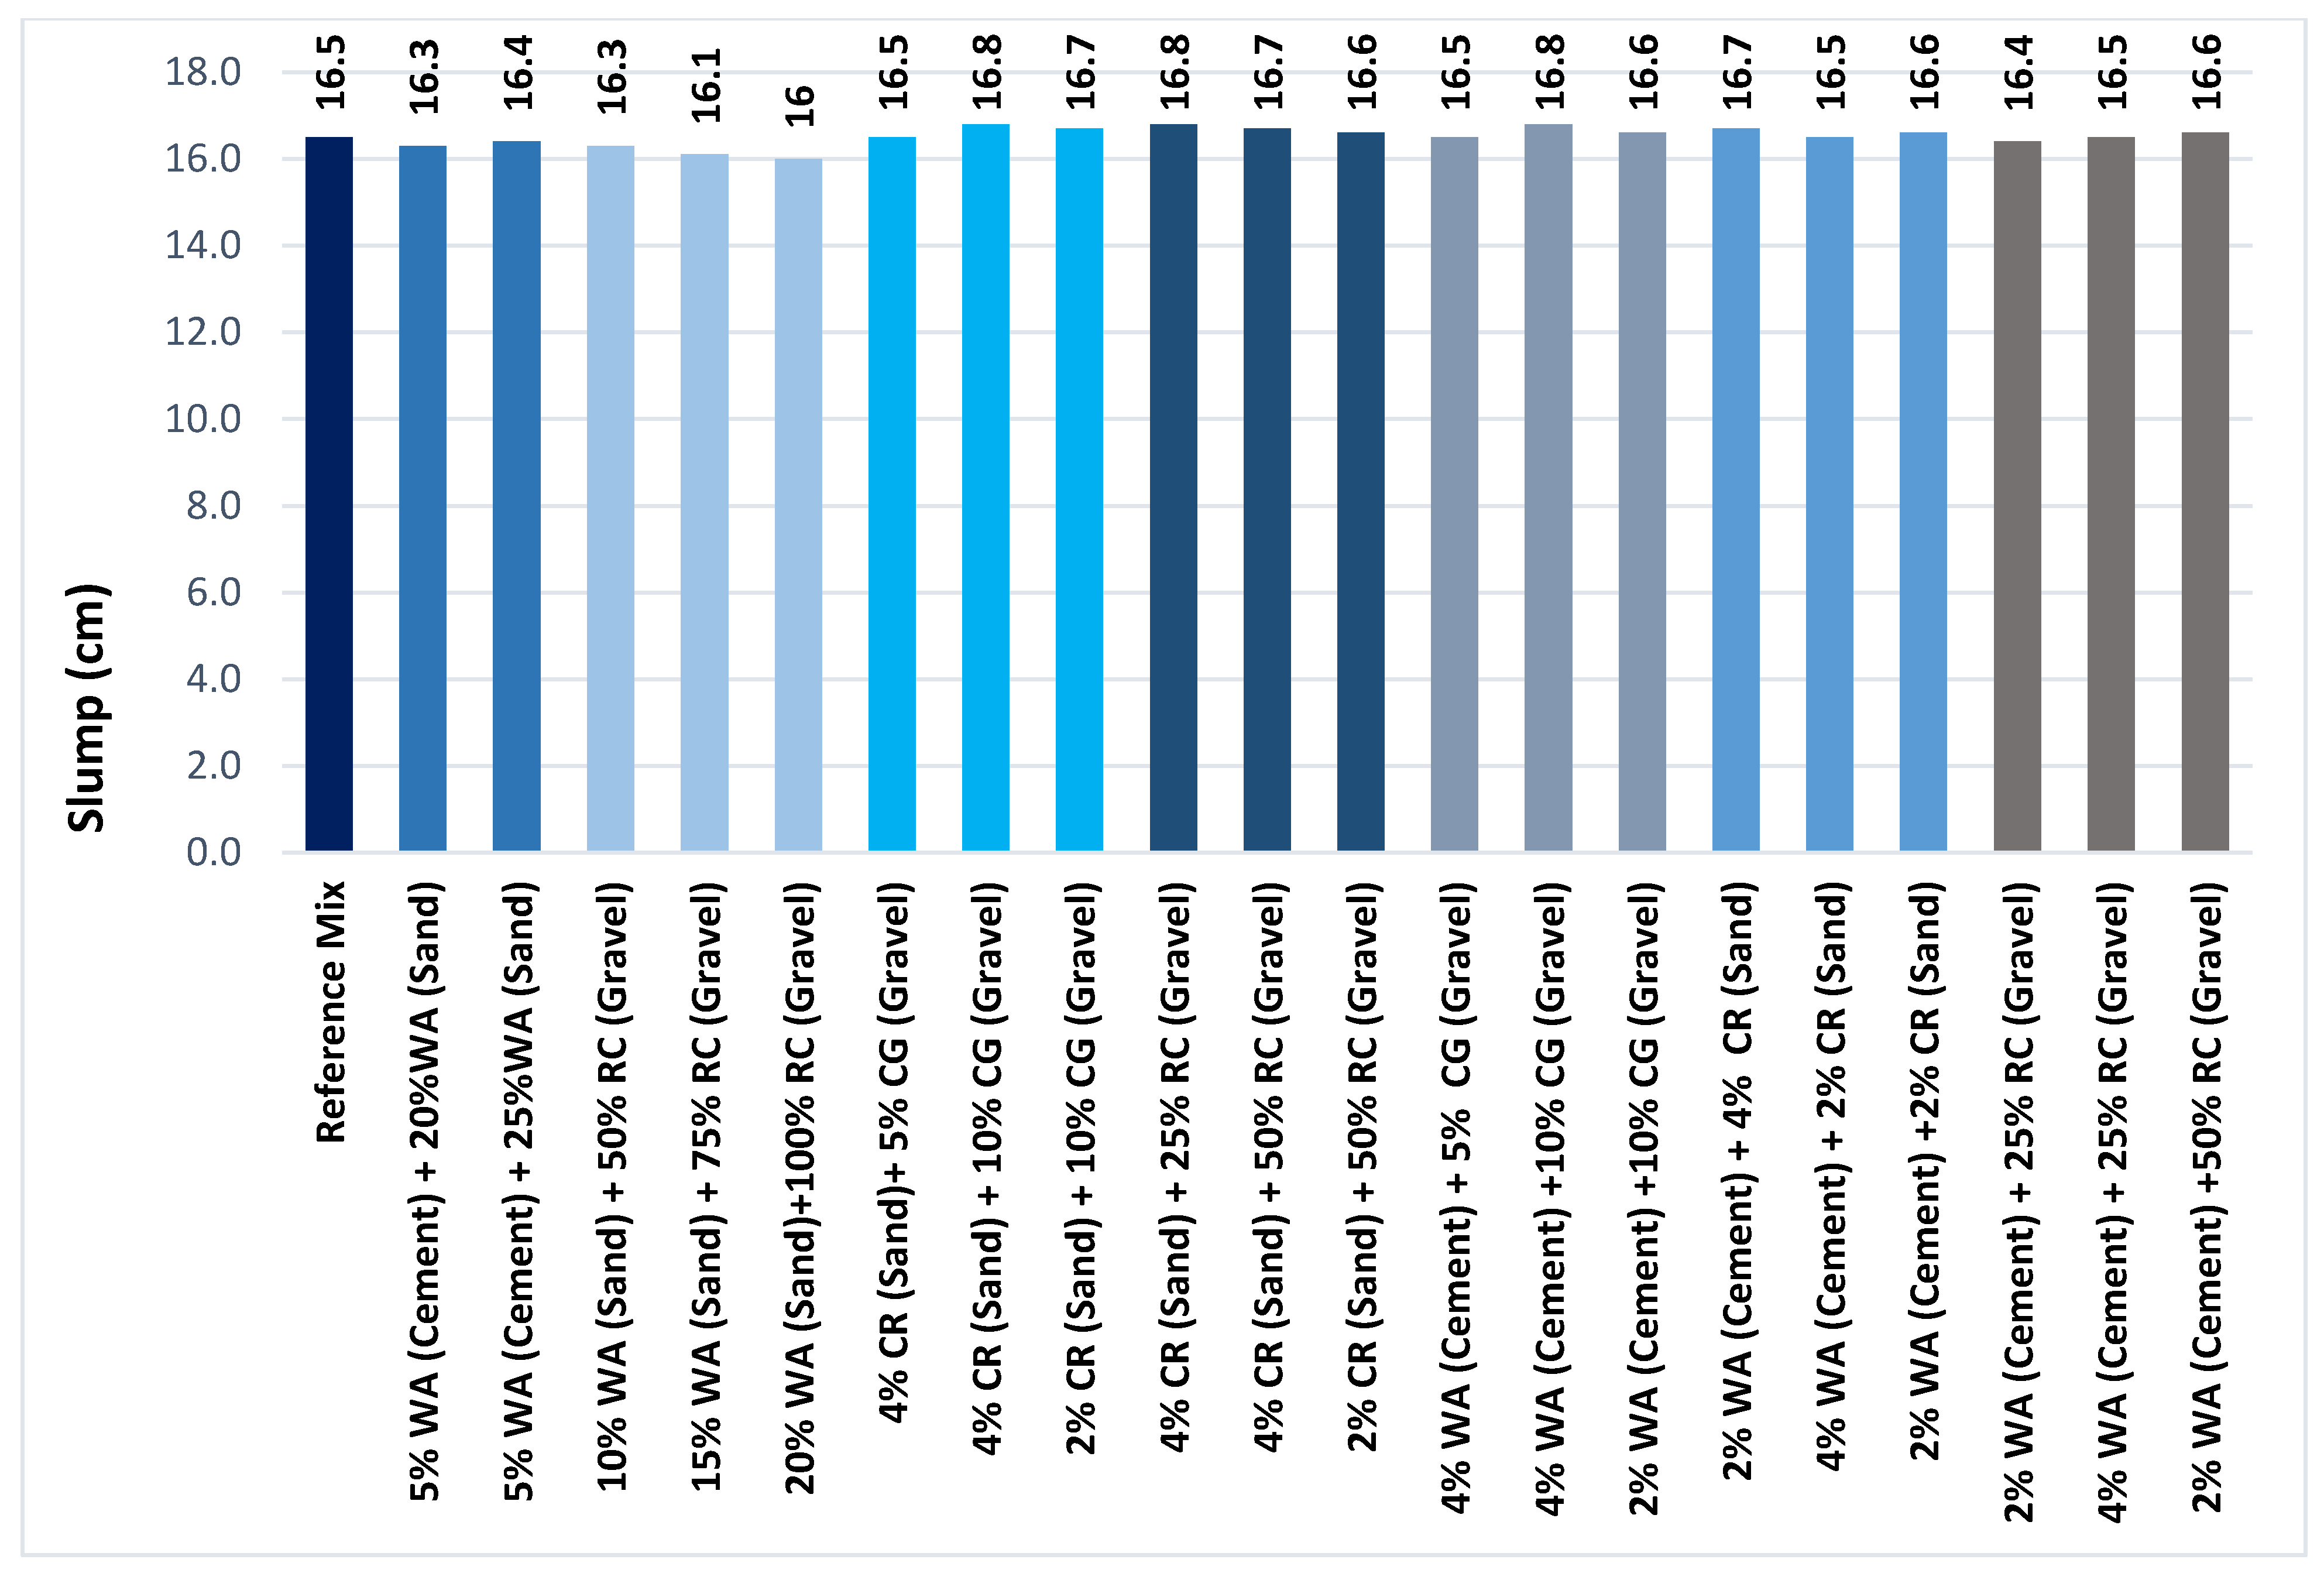
Figure 5.
Slump Test for Three-Types-of-Waste Replacements.

Figure 6.
Concrete Cylinder Tested in Compression.
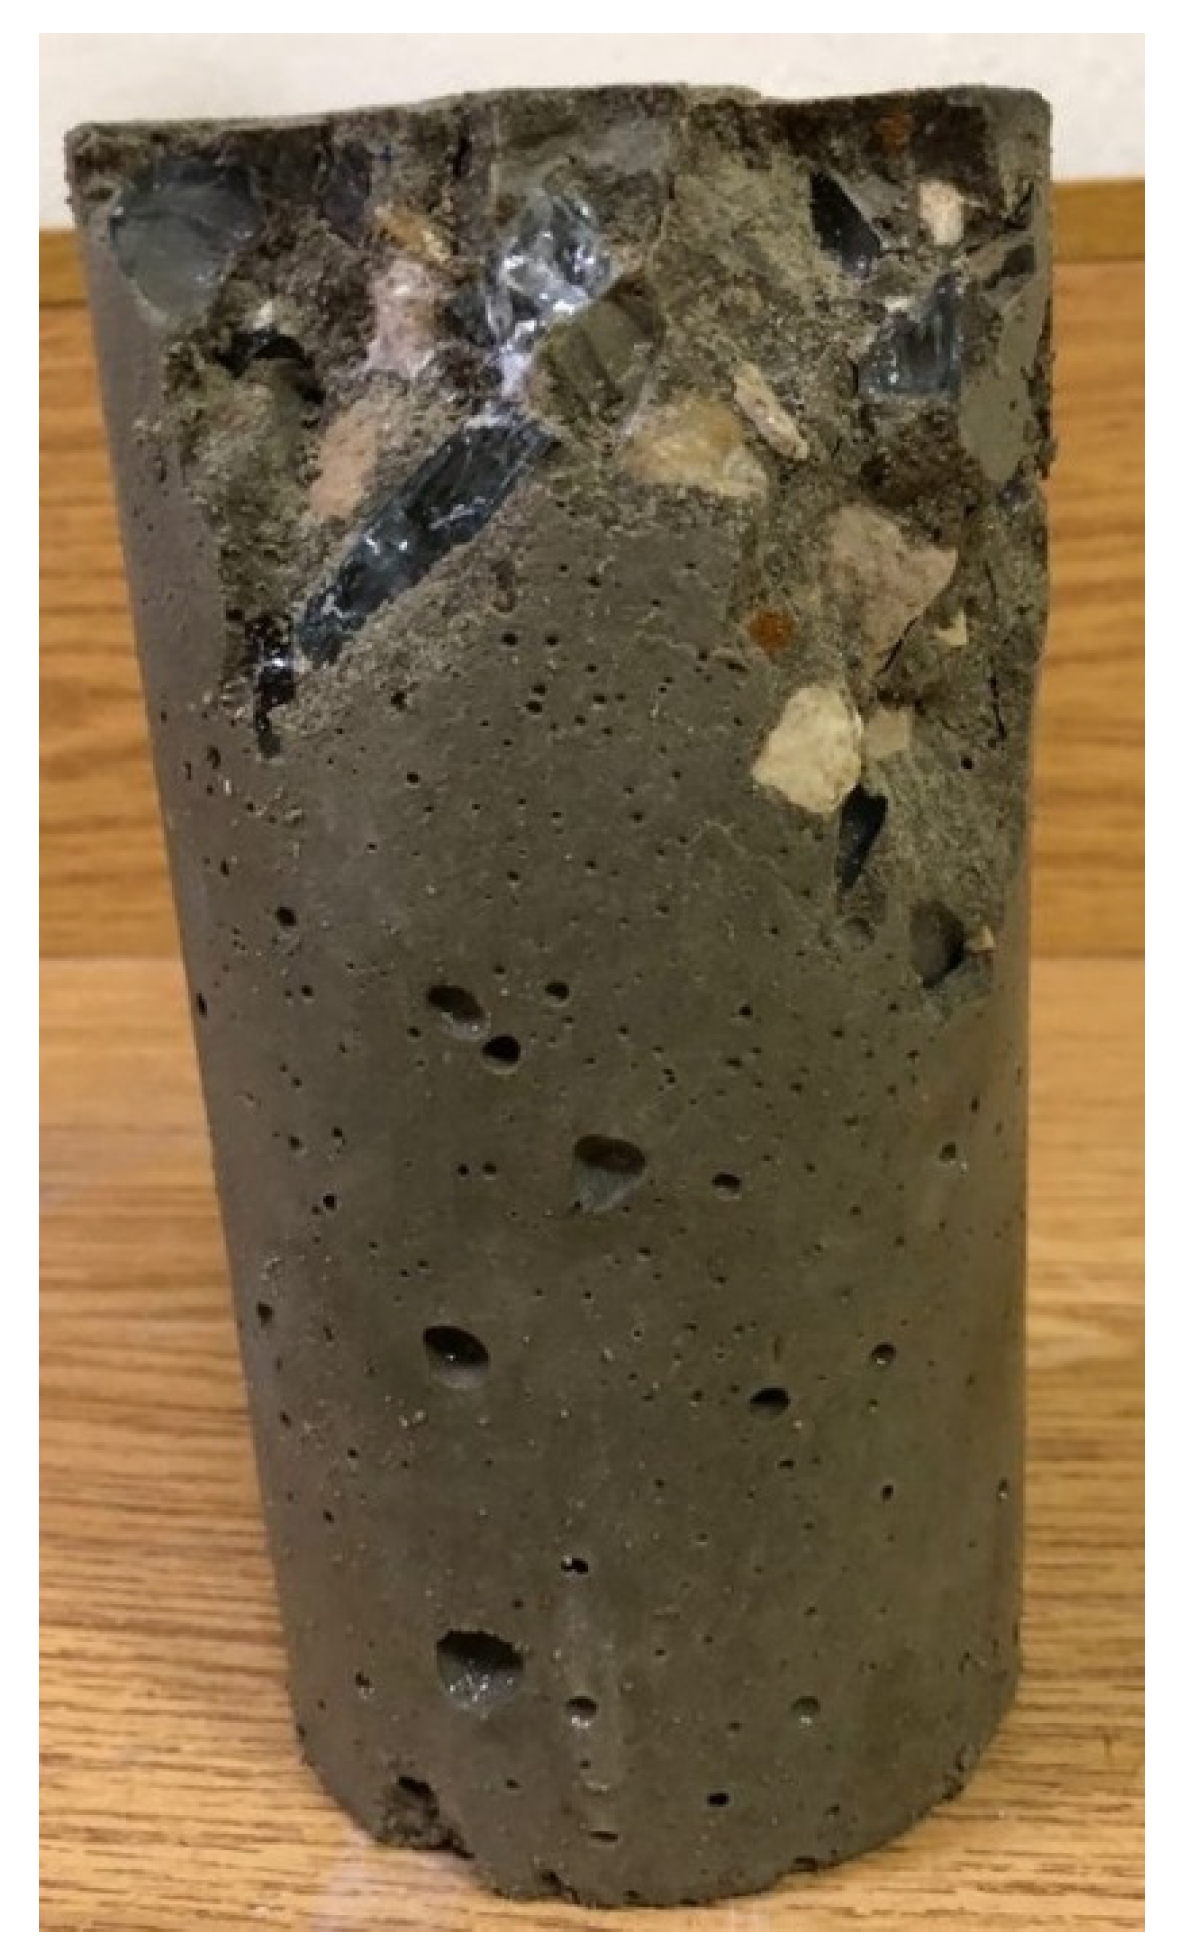
Figure 7.
Histogram of Compressive Strength Results for Single-Waste-Material Replacement at 7 Days.
Figure 7.
Histogram of Compressive Strength Results for Single-Waste-Material Replacement at 7 Days.
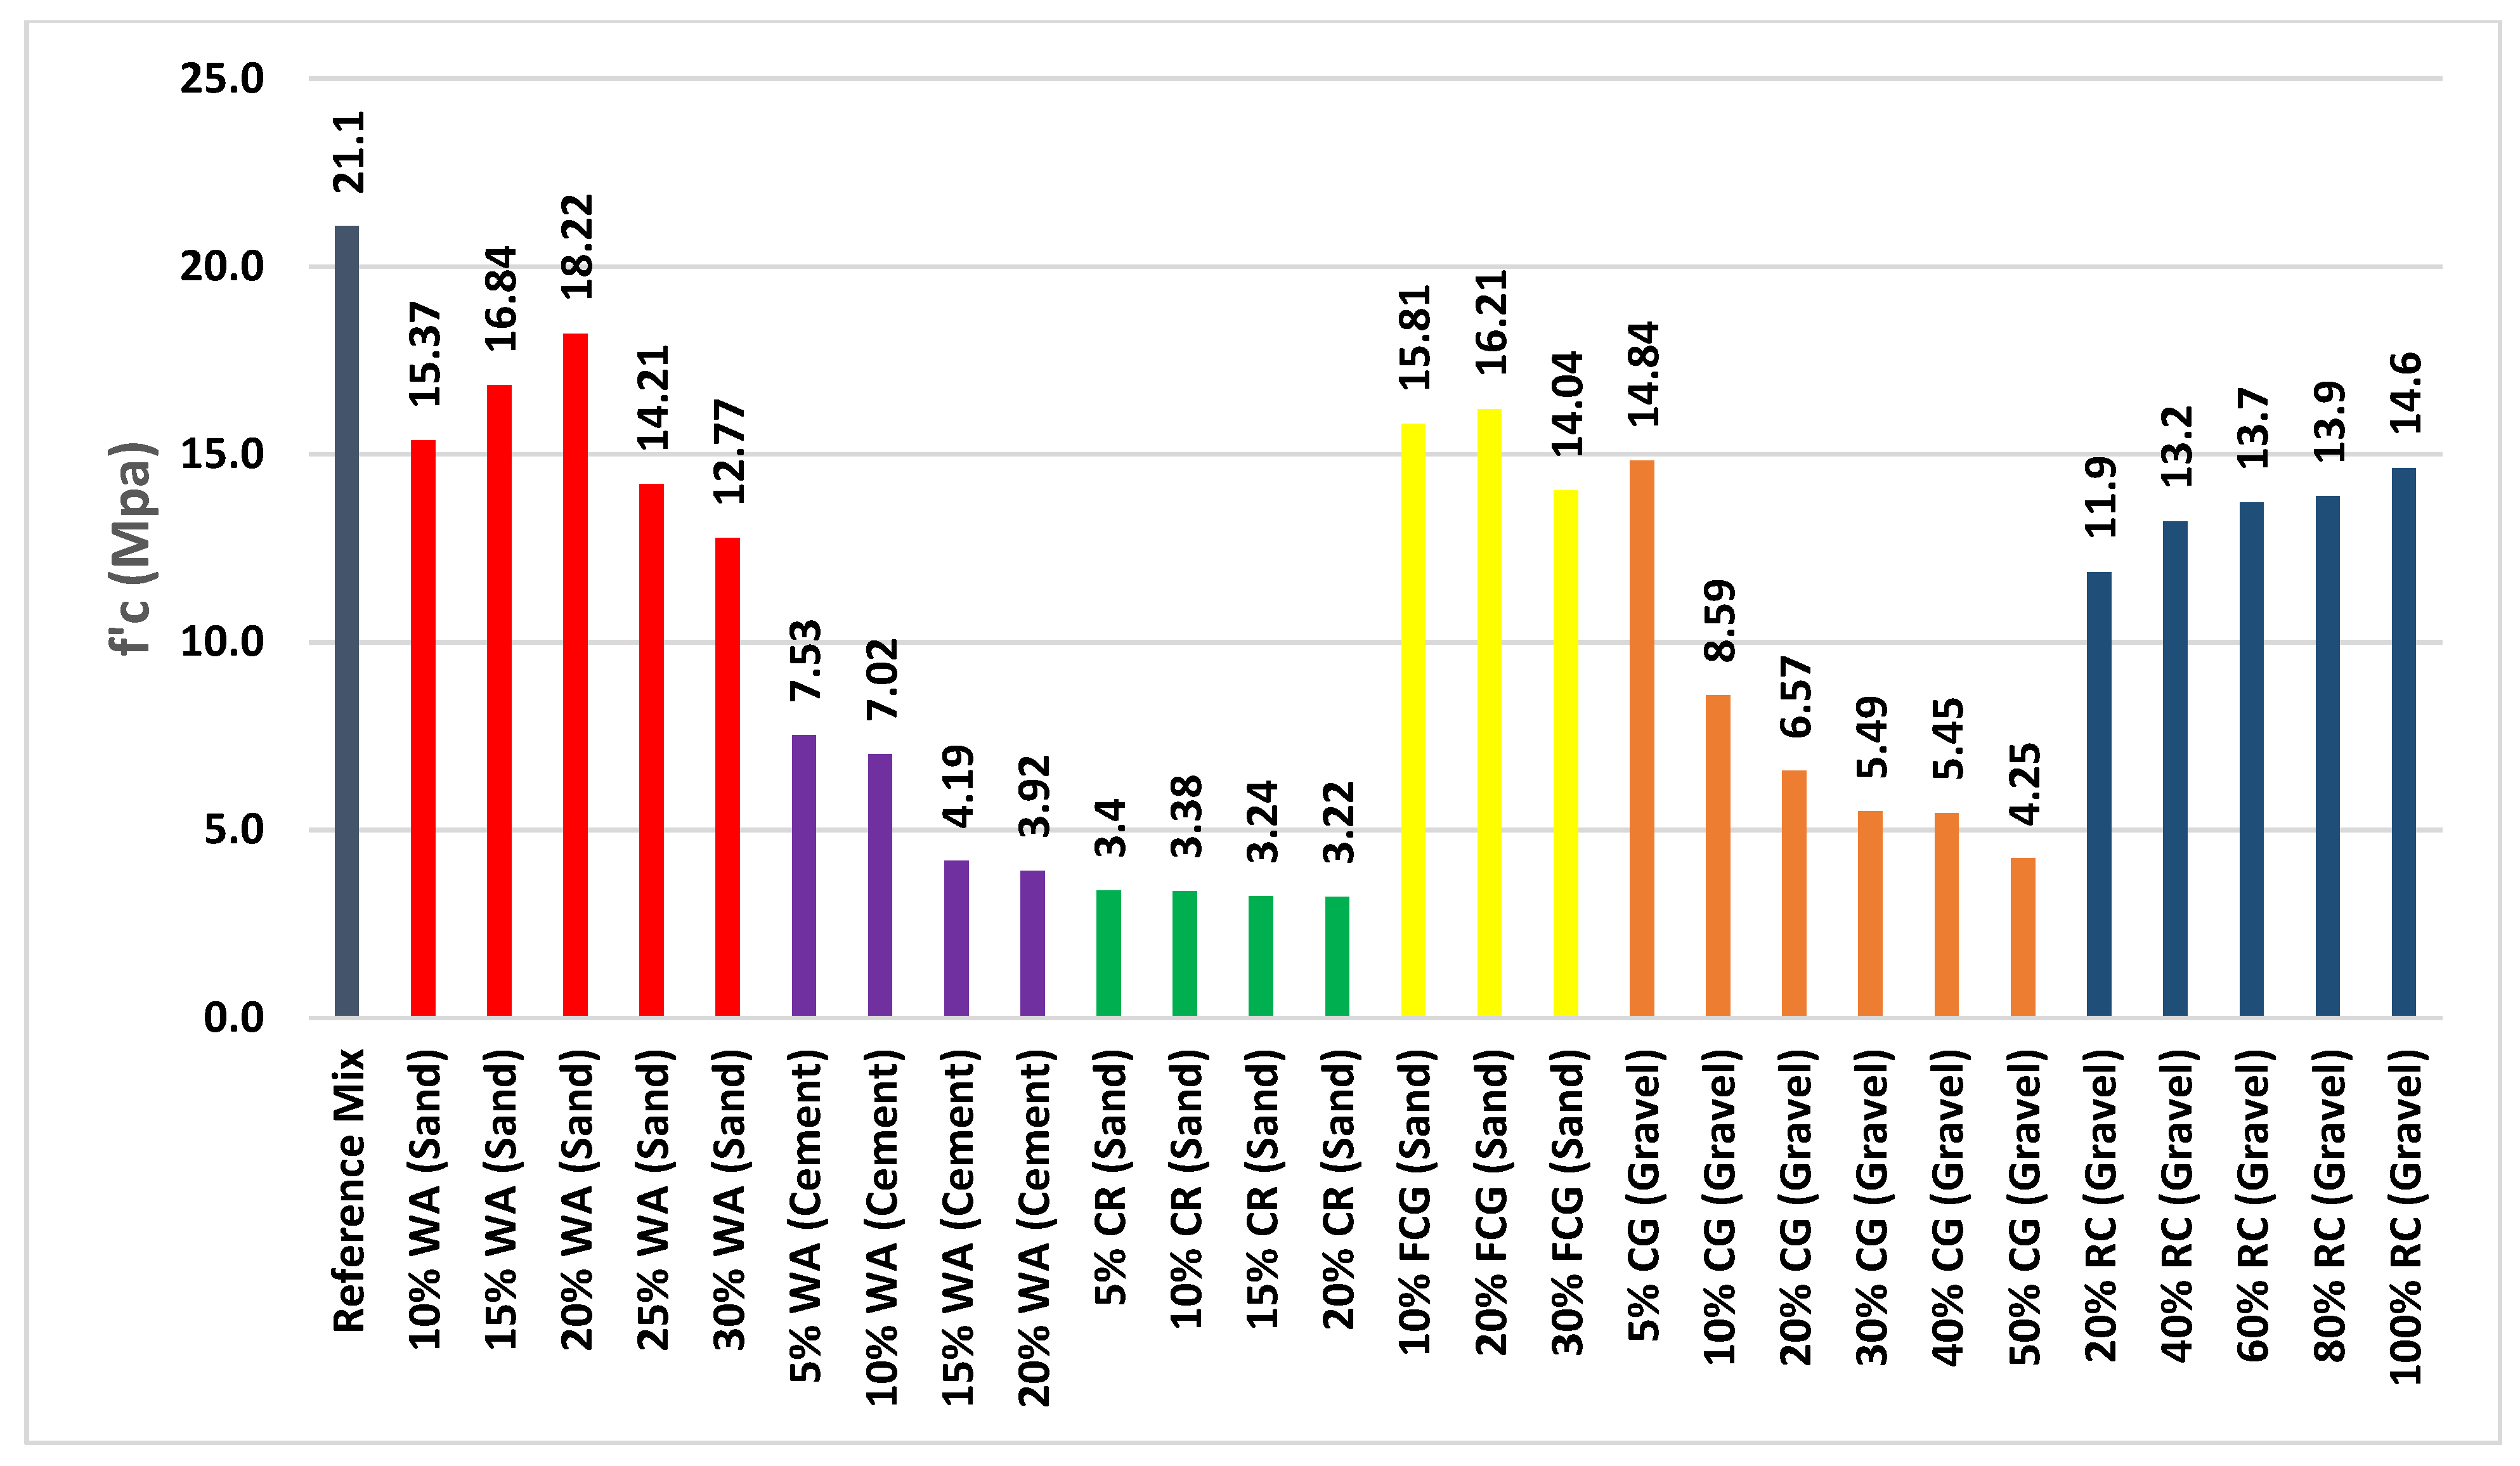
Figure 8.
Histogram of Compressive Strength Results for Single-Waste-Material Replacement at 28 Days.
Figure 8.
Histogram of Compressive Strength Results for Single-Waste-Material Replacement at 28 Days.
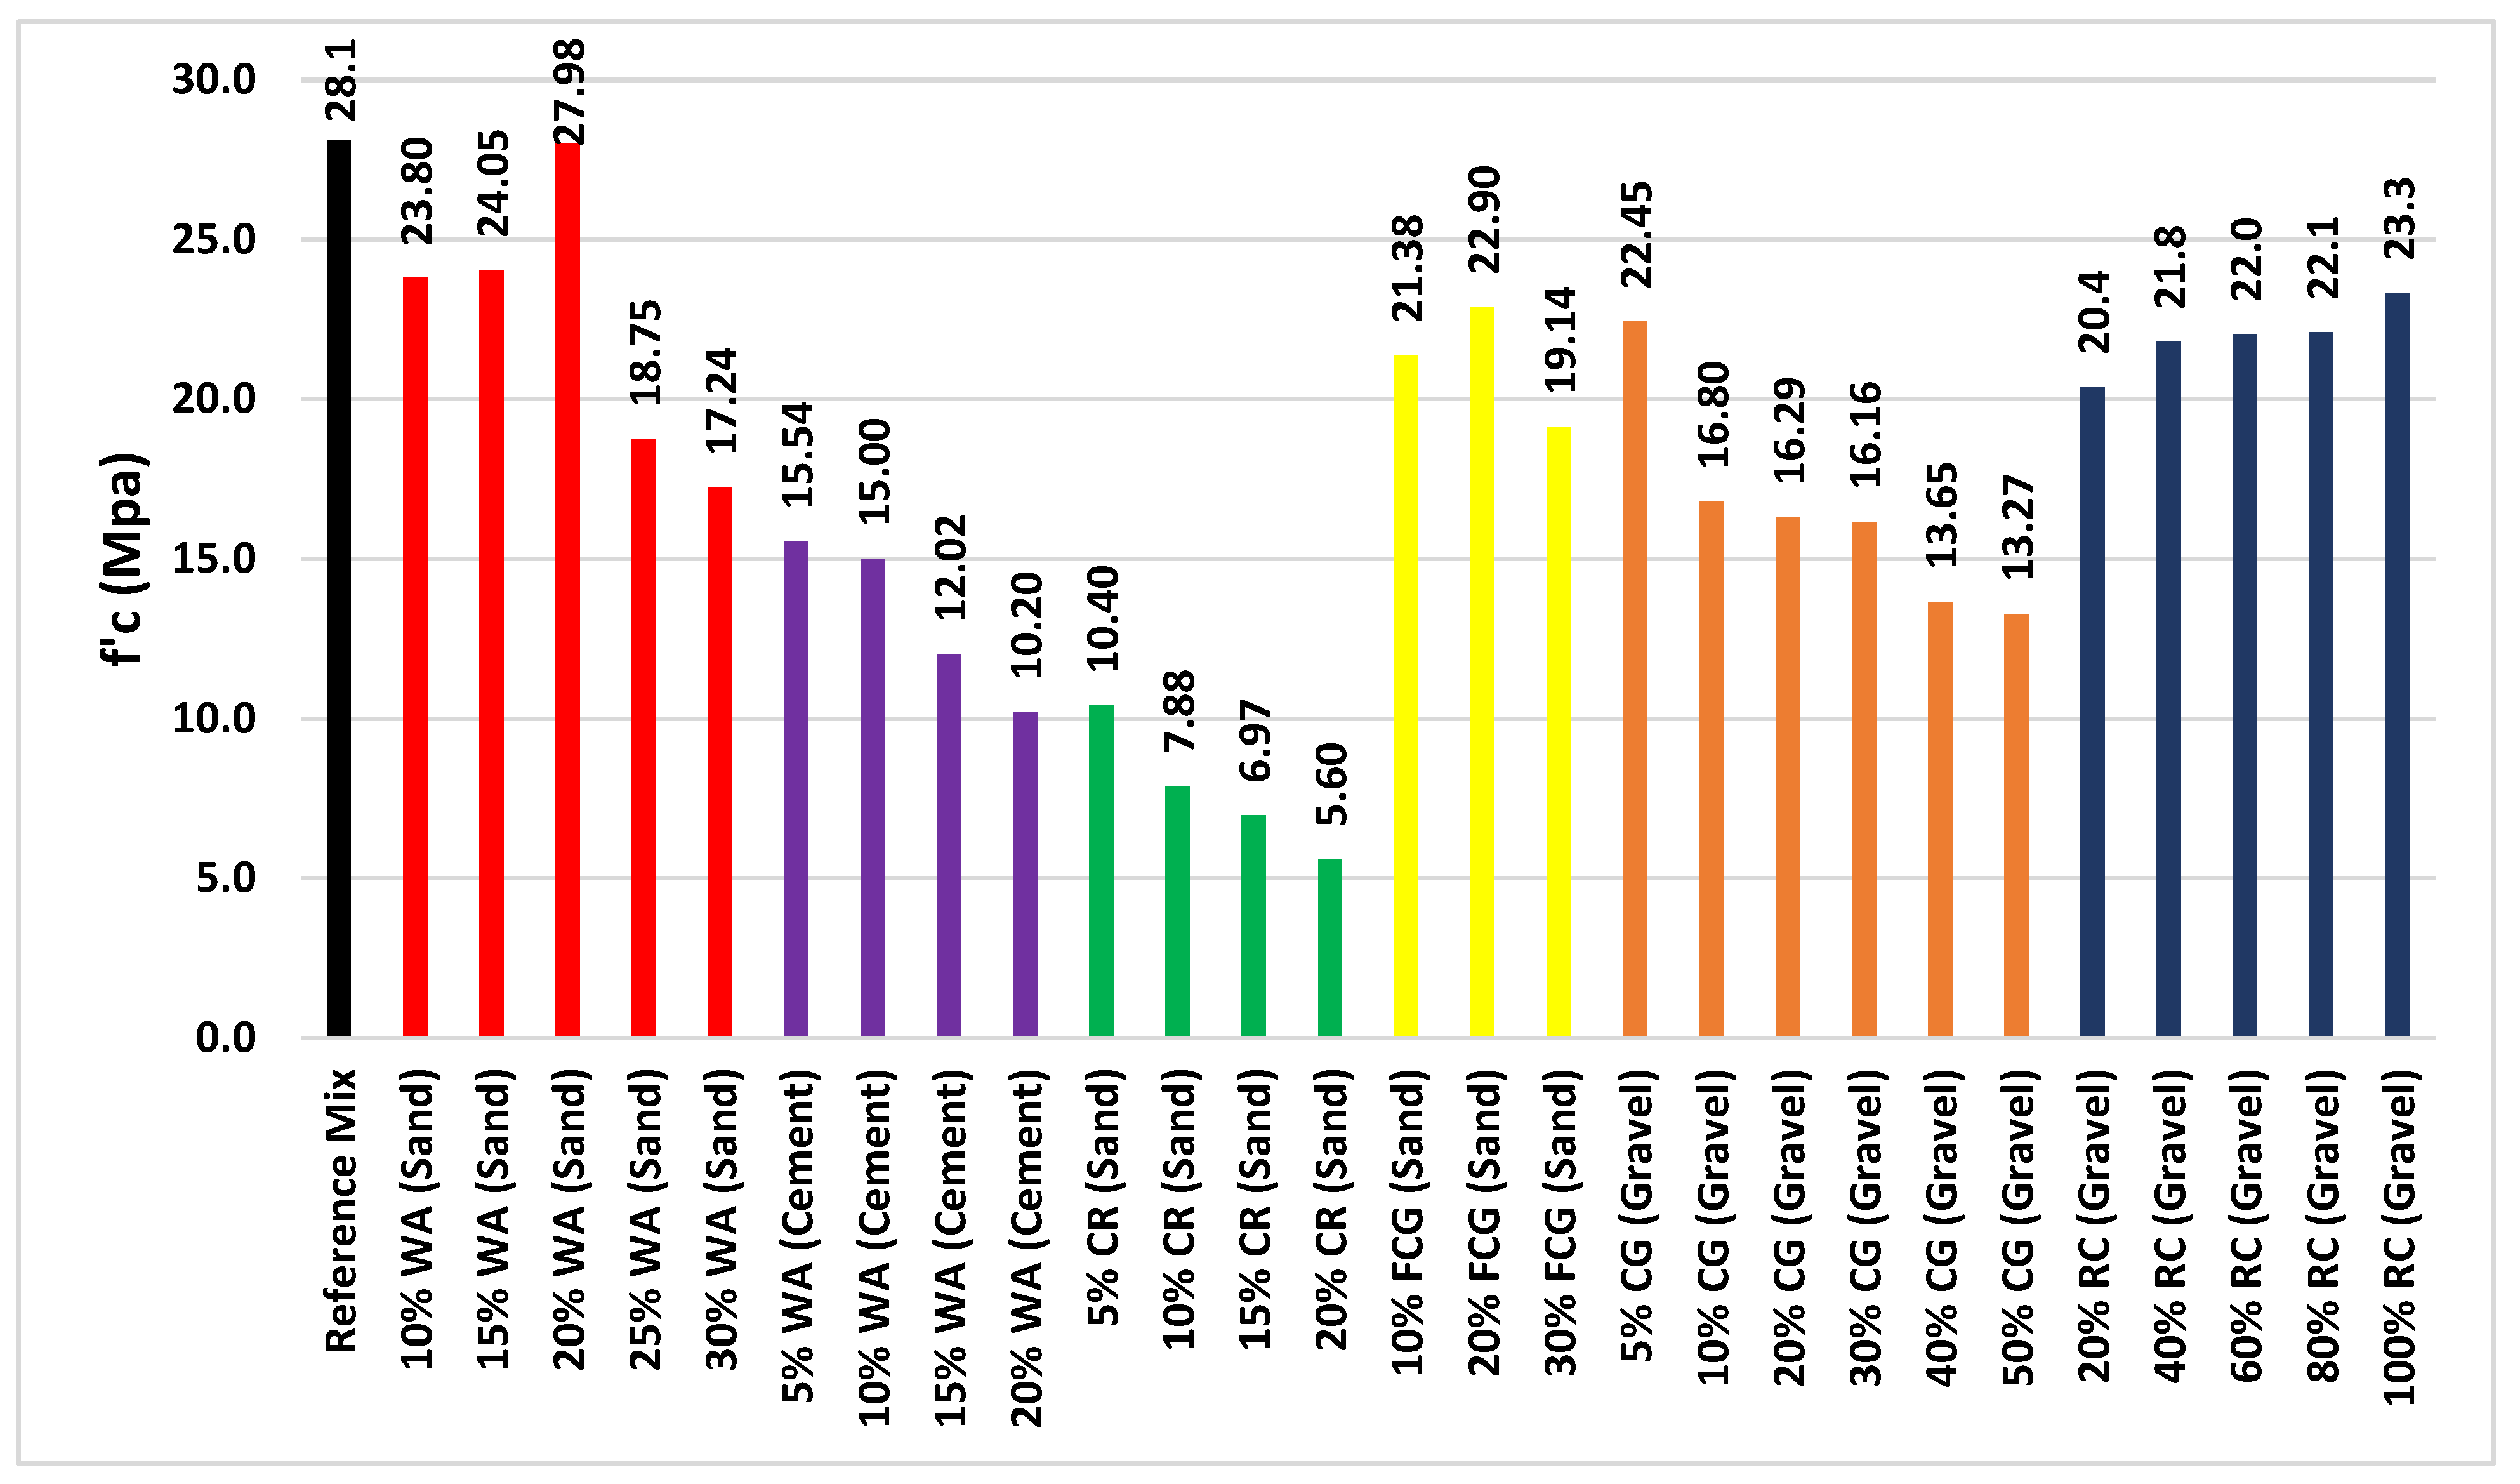
Figure 9.
Histogram of Compressive Strength Results for Single-Waste-Material Replacement at 90 Days.
Figure 9.
Histogram of Compressive Strength Results for Single-Waste-Material Replacement at 90 Days.
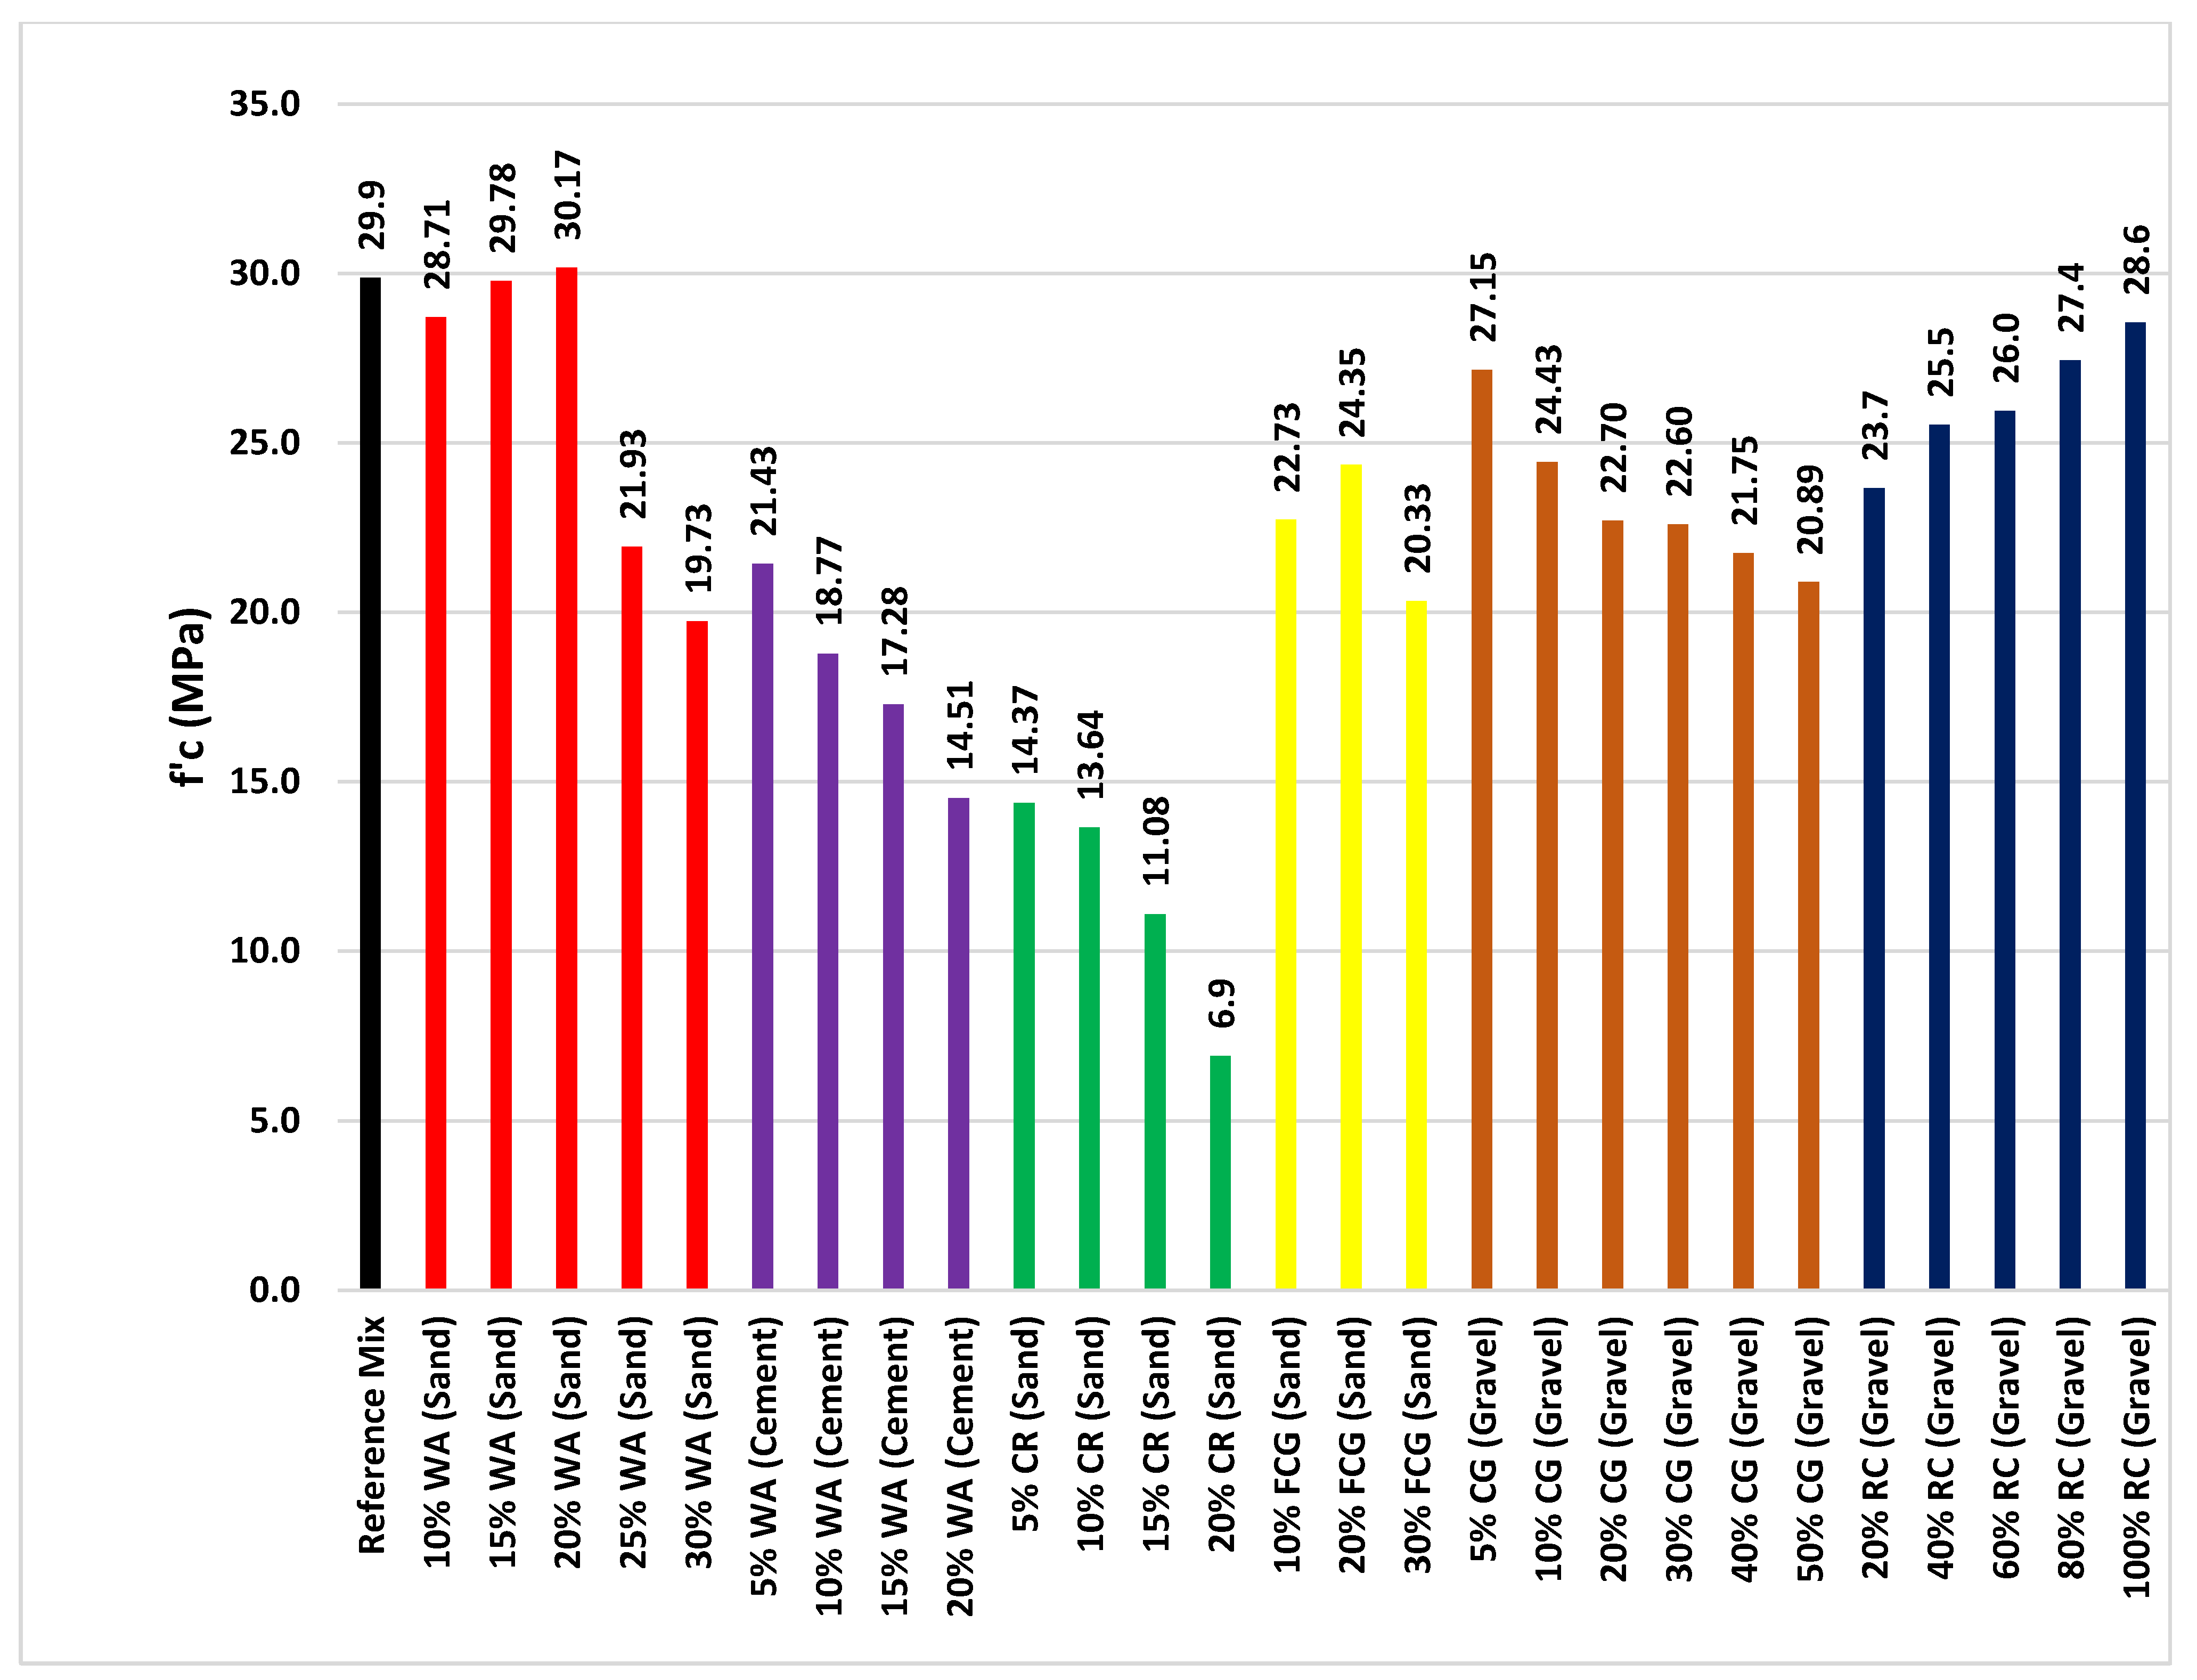
Figure 10.
Compressive Strength for Two-Waste-Materials Replacements at 7, 28, and 90 days.
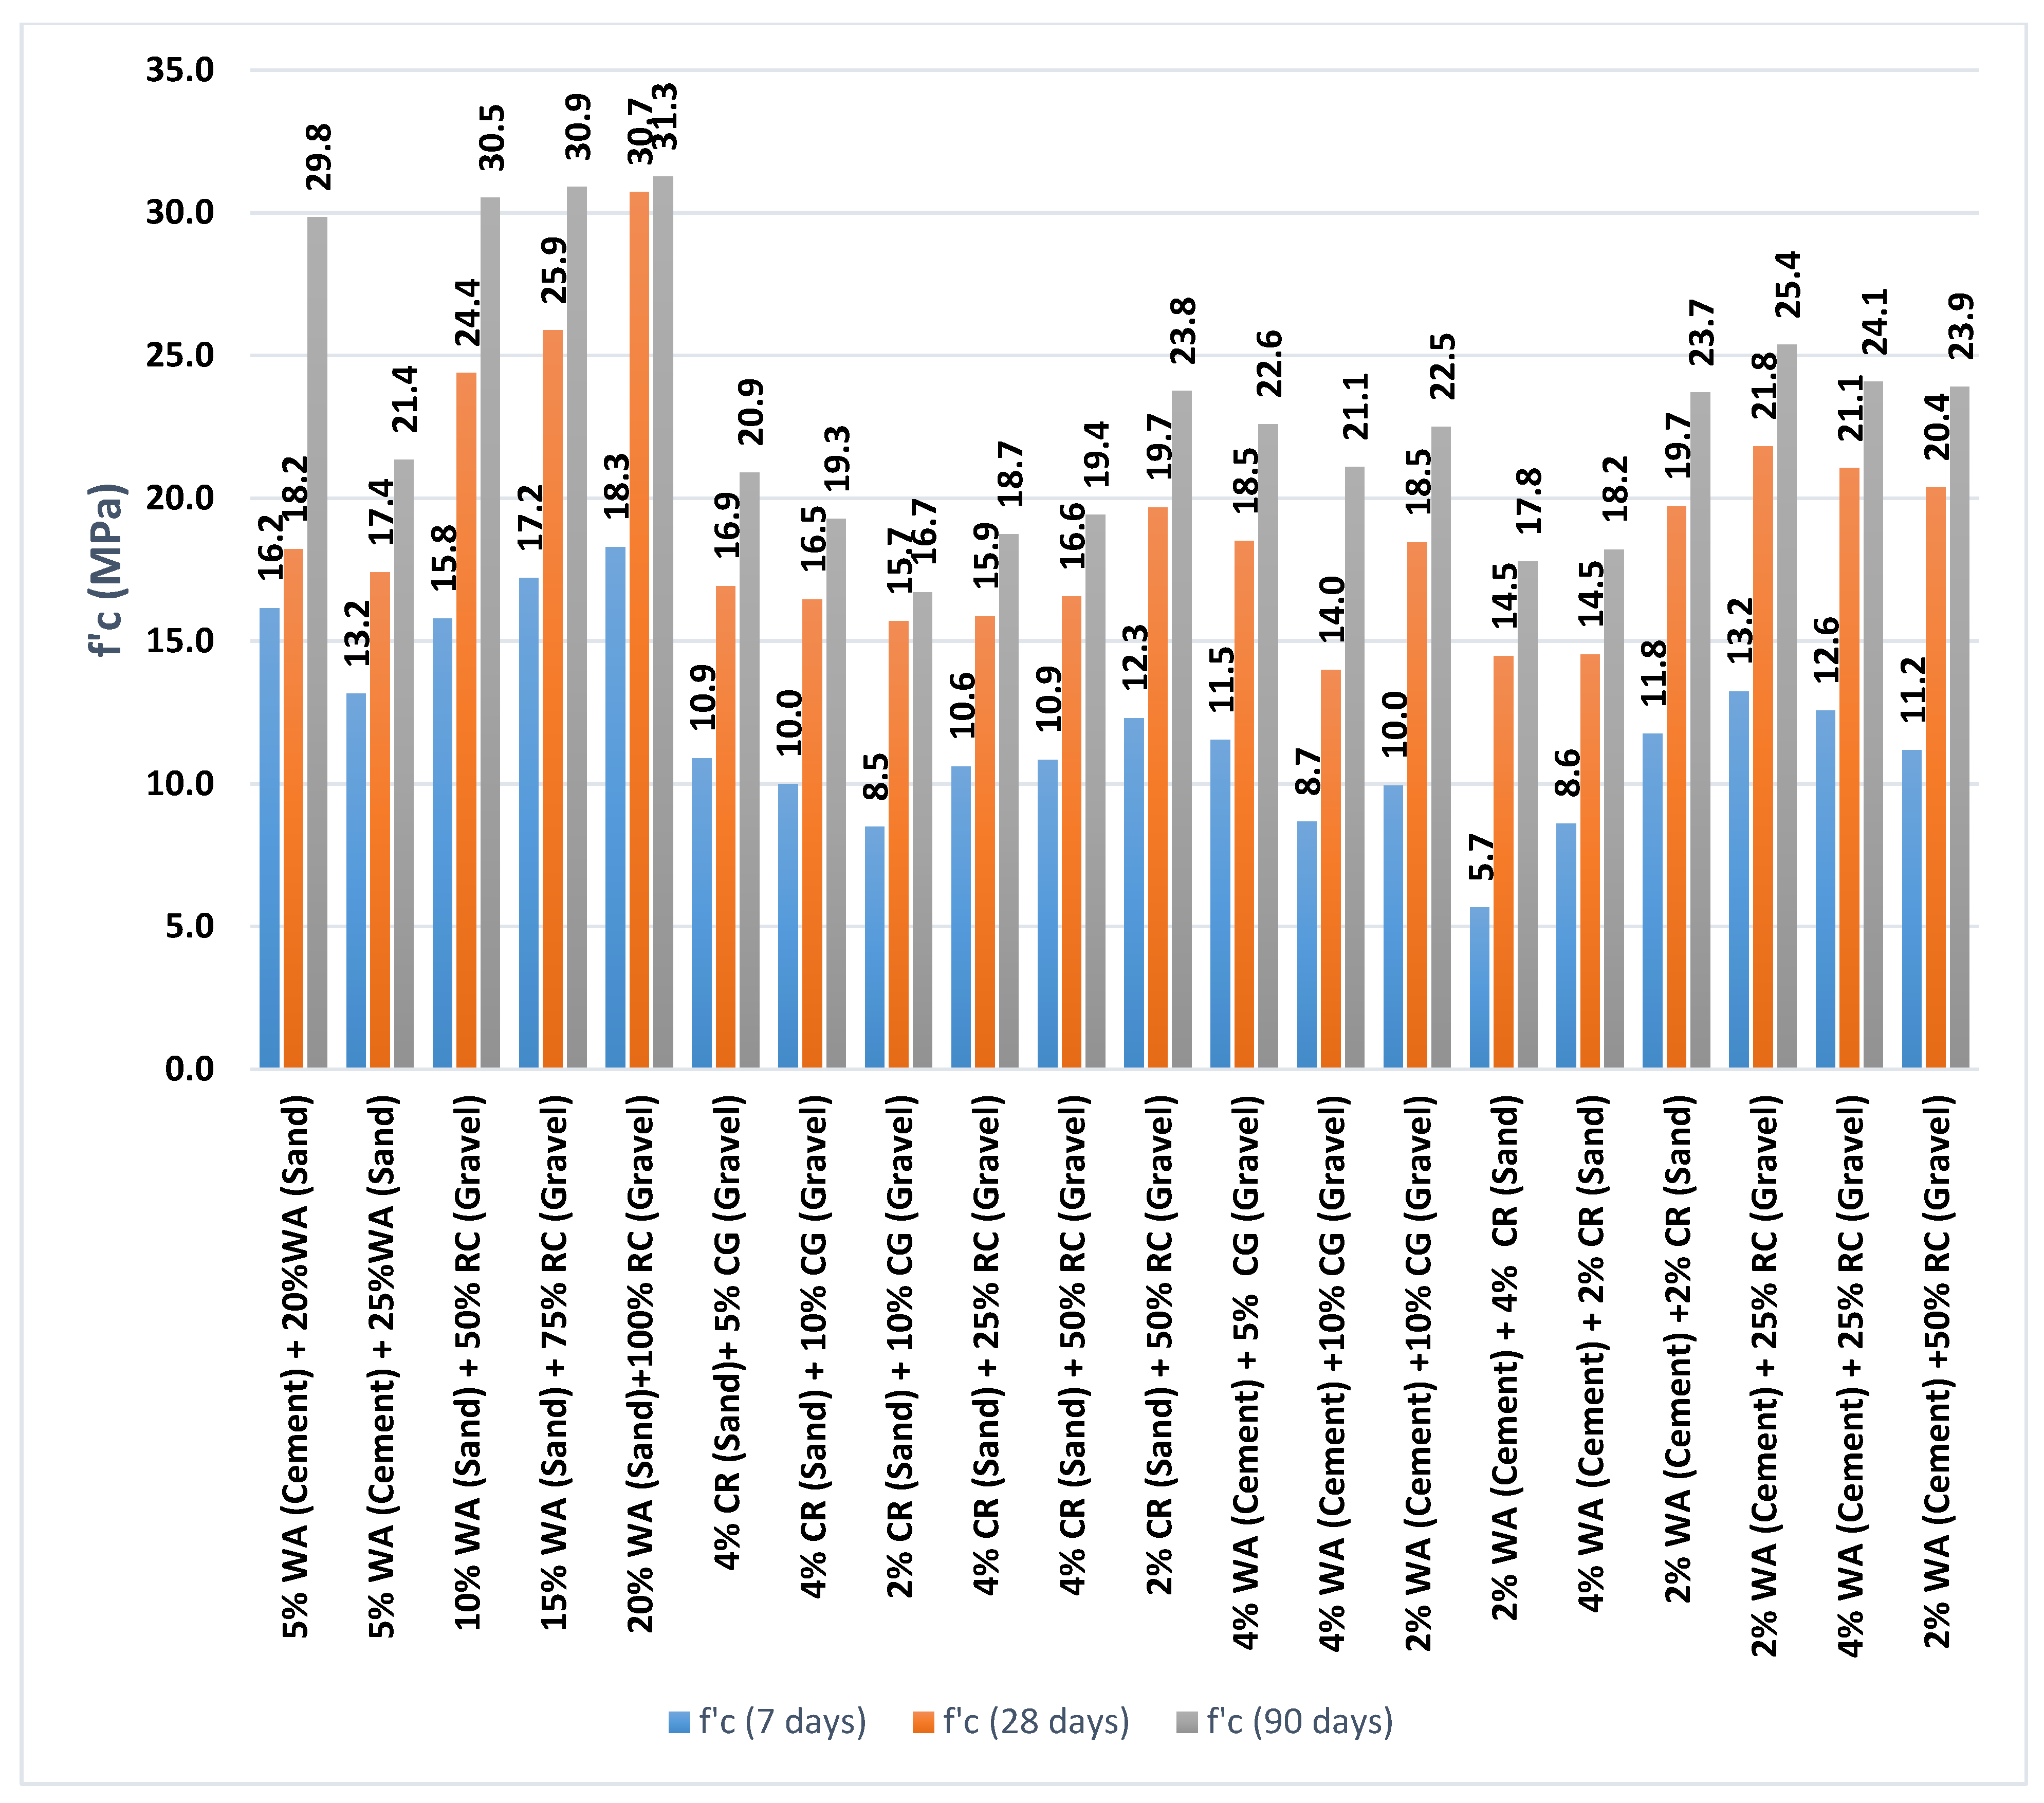
Figure 11.
Compressive Strength for Three-Waste-Materials Replacements at 7, 28, and 90 days.
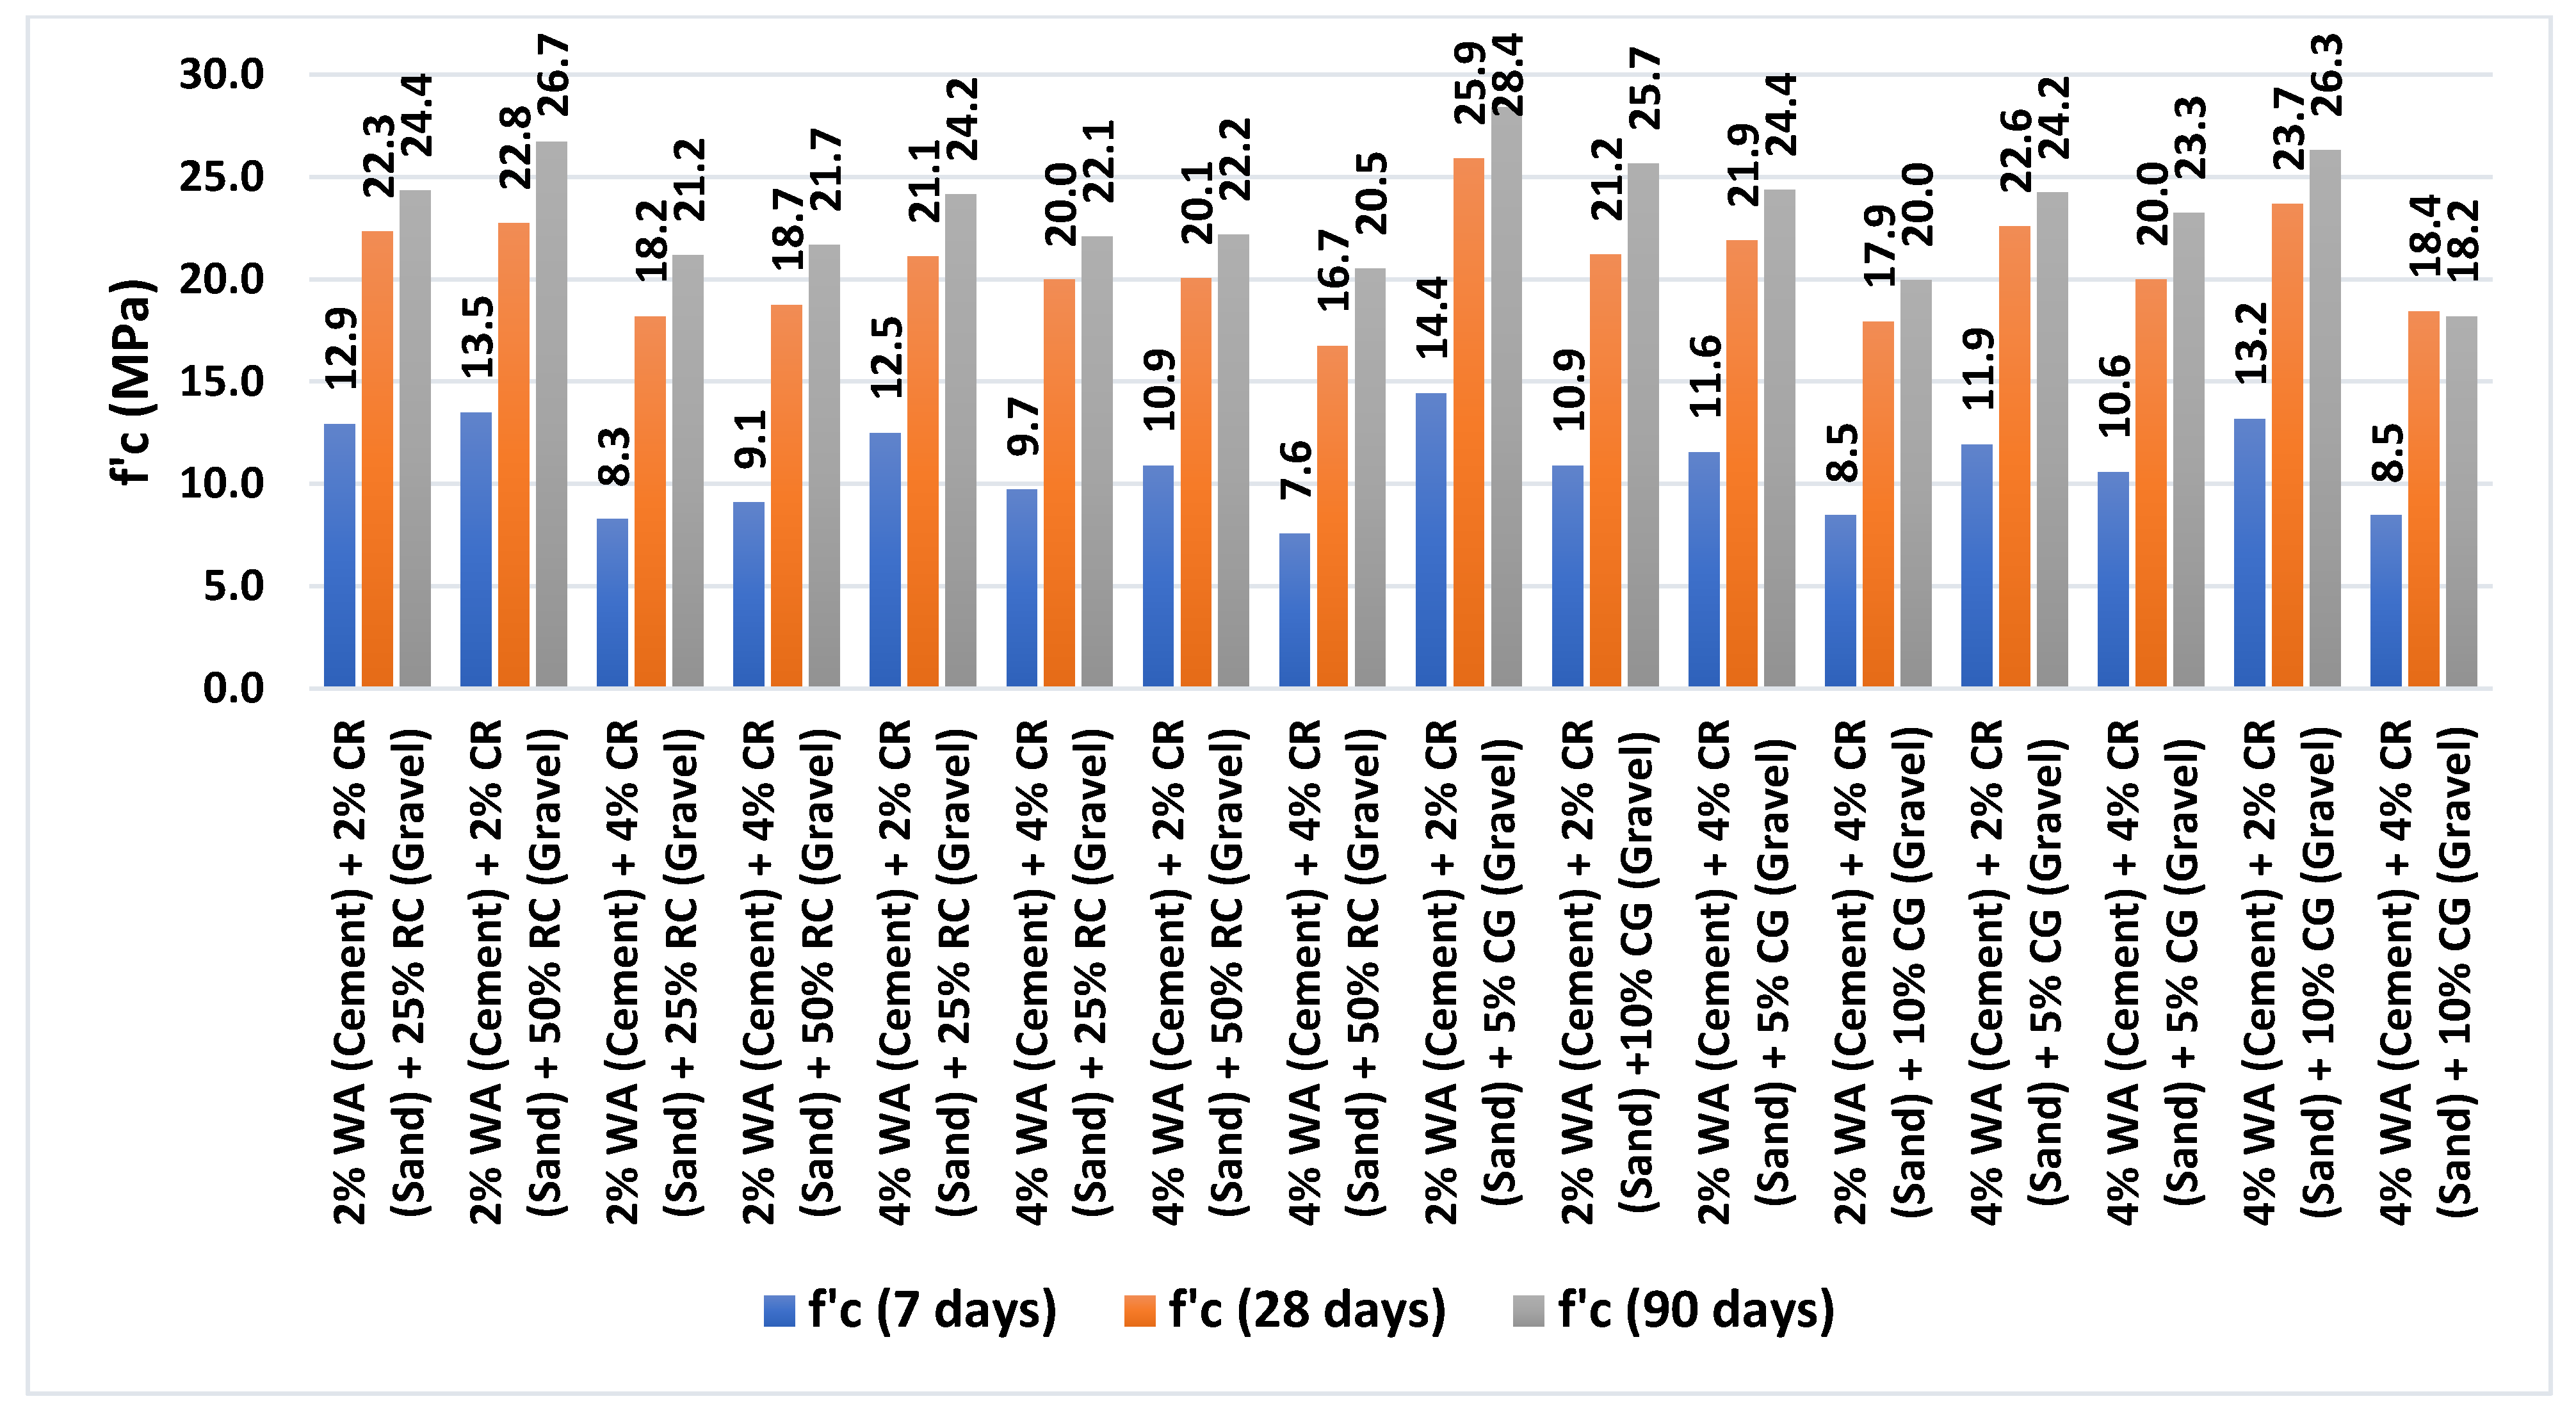
Figure 12.
Modulus of Elasticity using UPV Method for Single-Waste-Material Replacement.

Figure 13.
Modulus of Elasticity using ACI Method for Single-Waste-Material Replacement.

Figure 14.
Modulus of Elasticity using Stress–Strain Curve for Single-Waste-Material Replacement.
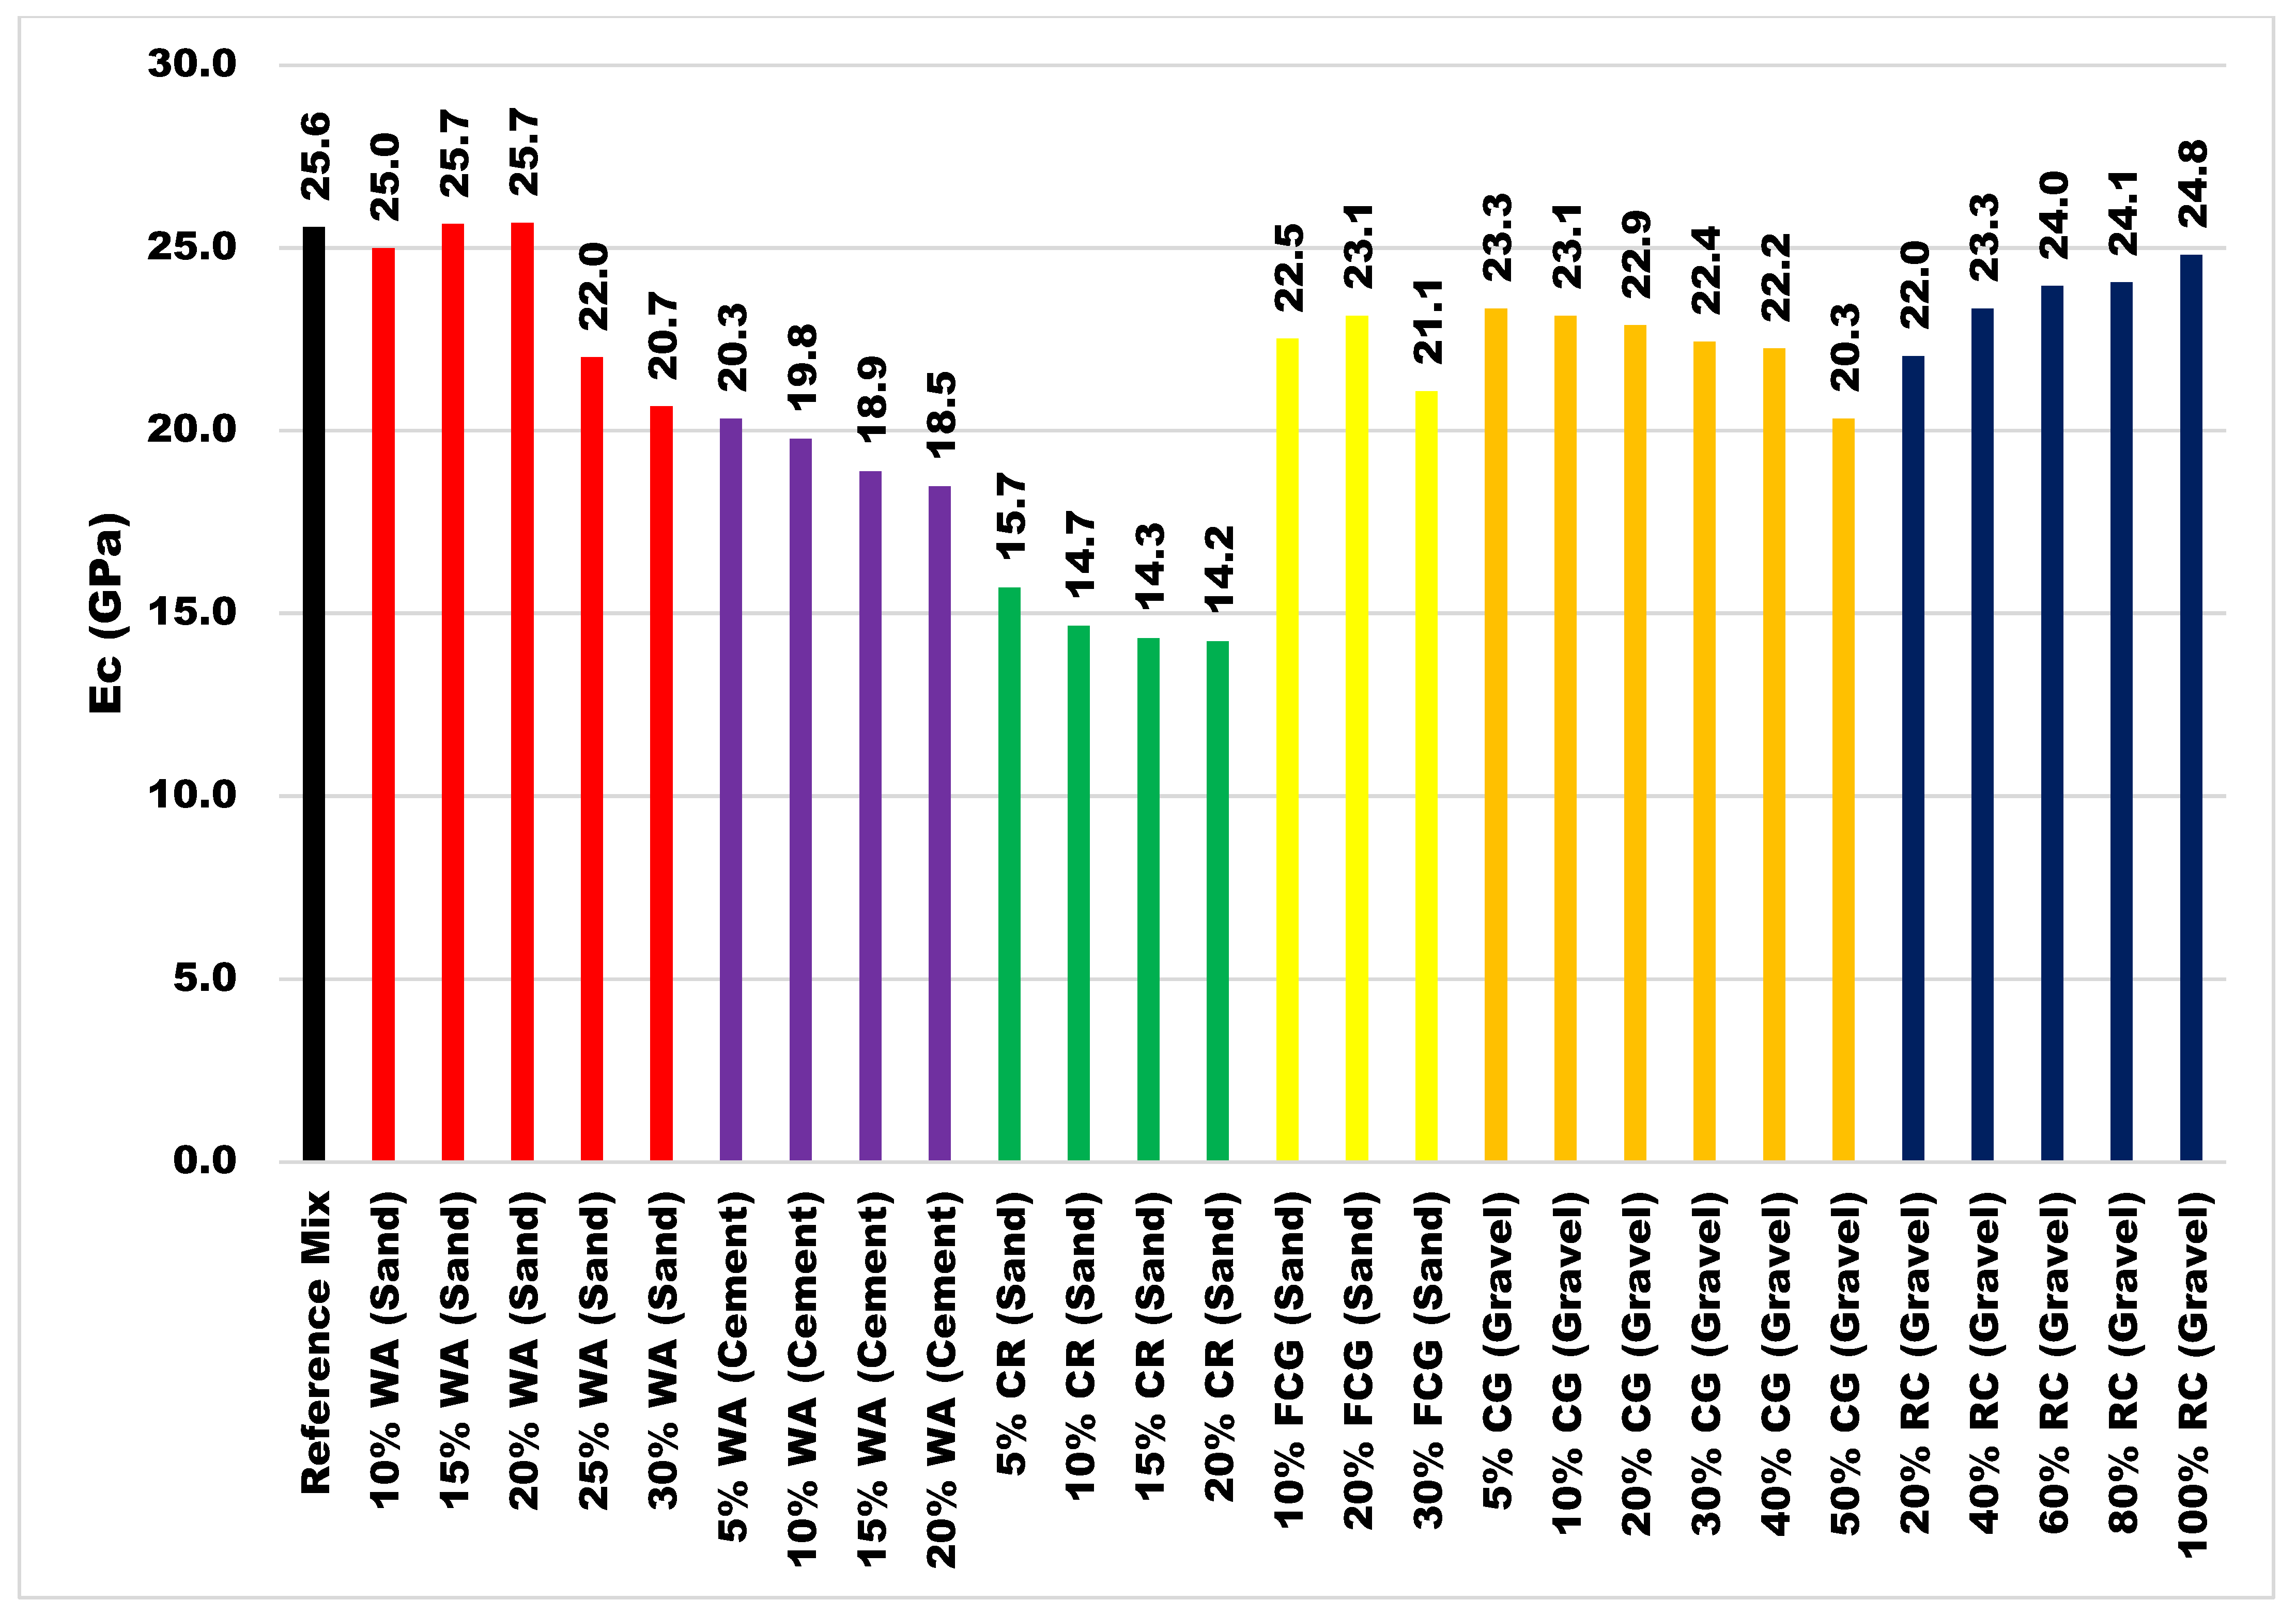
Figure 15.
Splitting Tensile Test Samples.
Figure 16.
Splitting Tensile Strength for Single-Waste-Material Replacement.

Figure 17.
Splitting Tensile Strength for Two-Types-of-Waste-Materials Replacements.
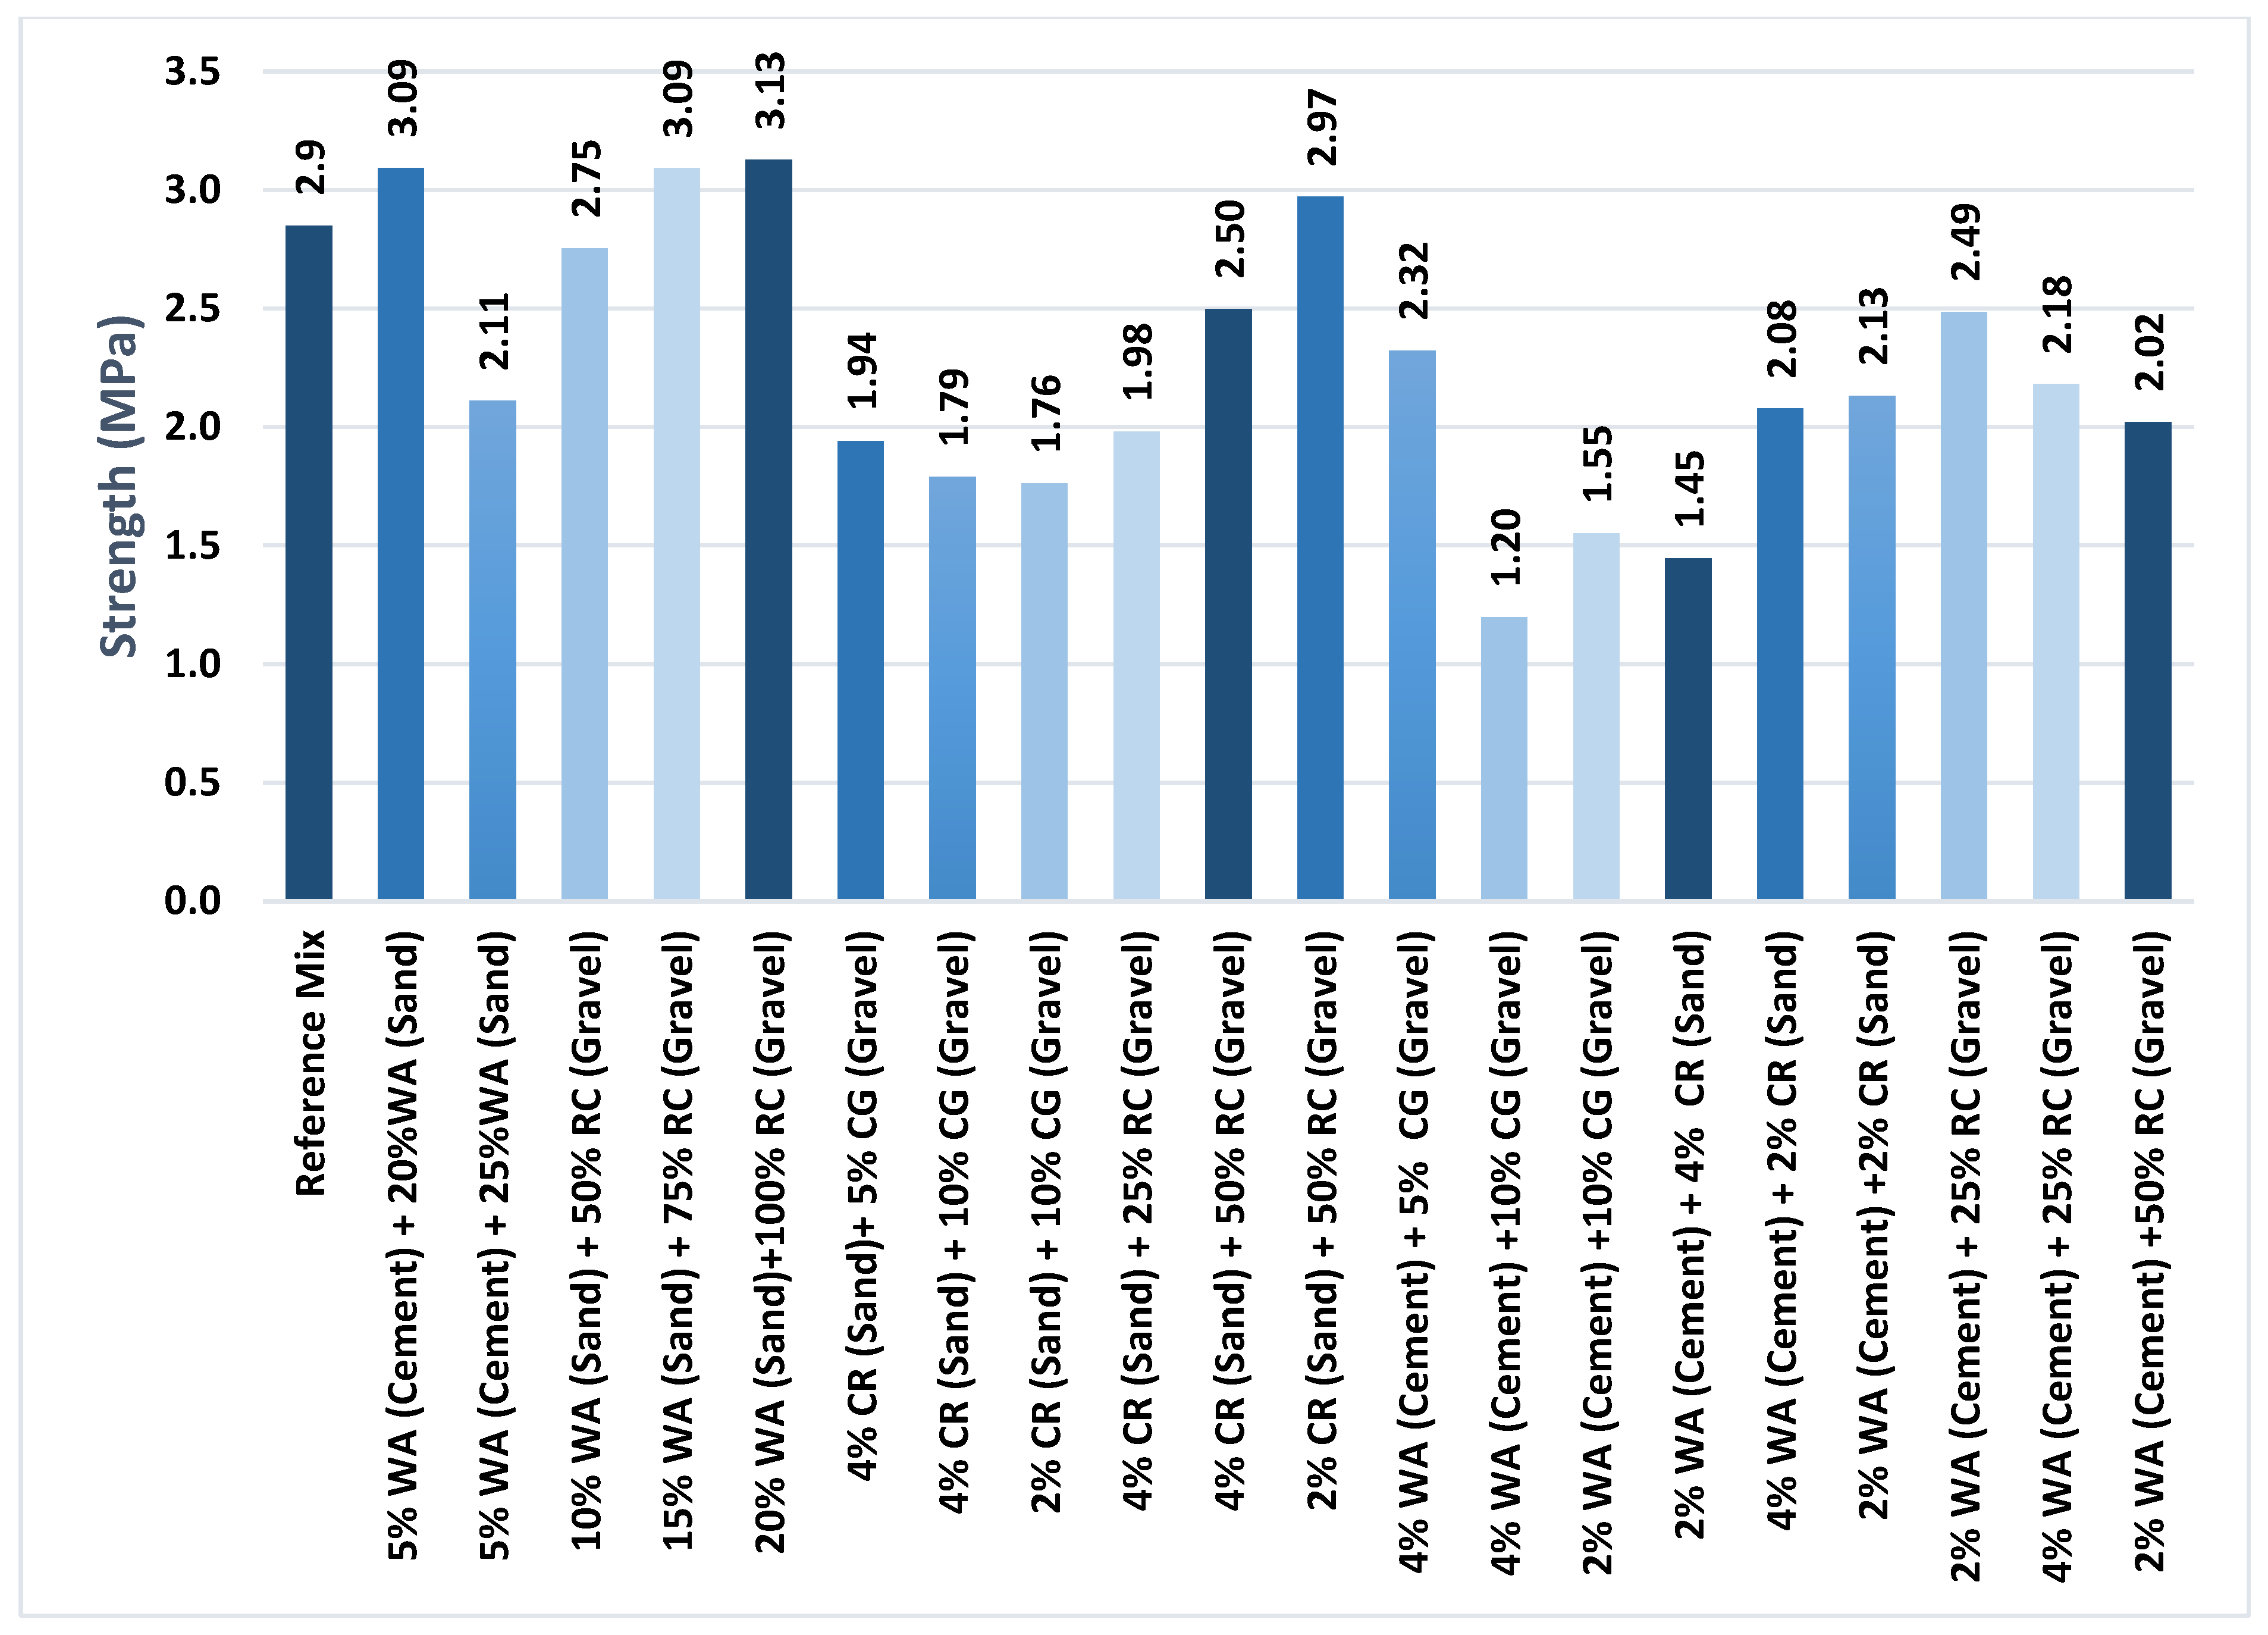
Figure 18.
Splitting Tensile Strength for Three-Types-of-Waste-Materials Replacements.

Figure 19.
Slump Test for Eco-Friendly Mixes.

Figure 20.
Compressive Strength for Eco-Friendly Concrete Mixes.

Figure 21.
Modulus of Elasticity for Eco-Friendly Concrete Mixes.
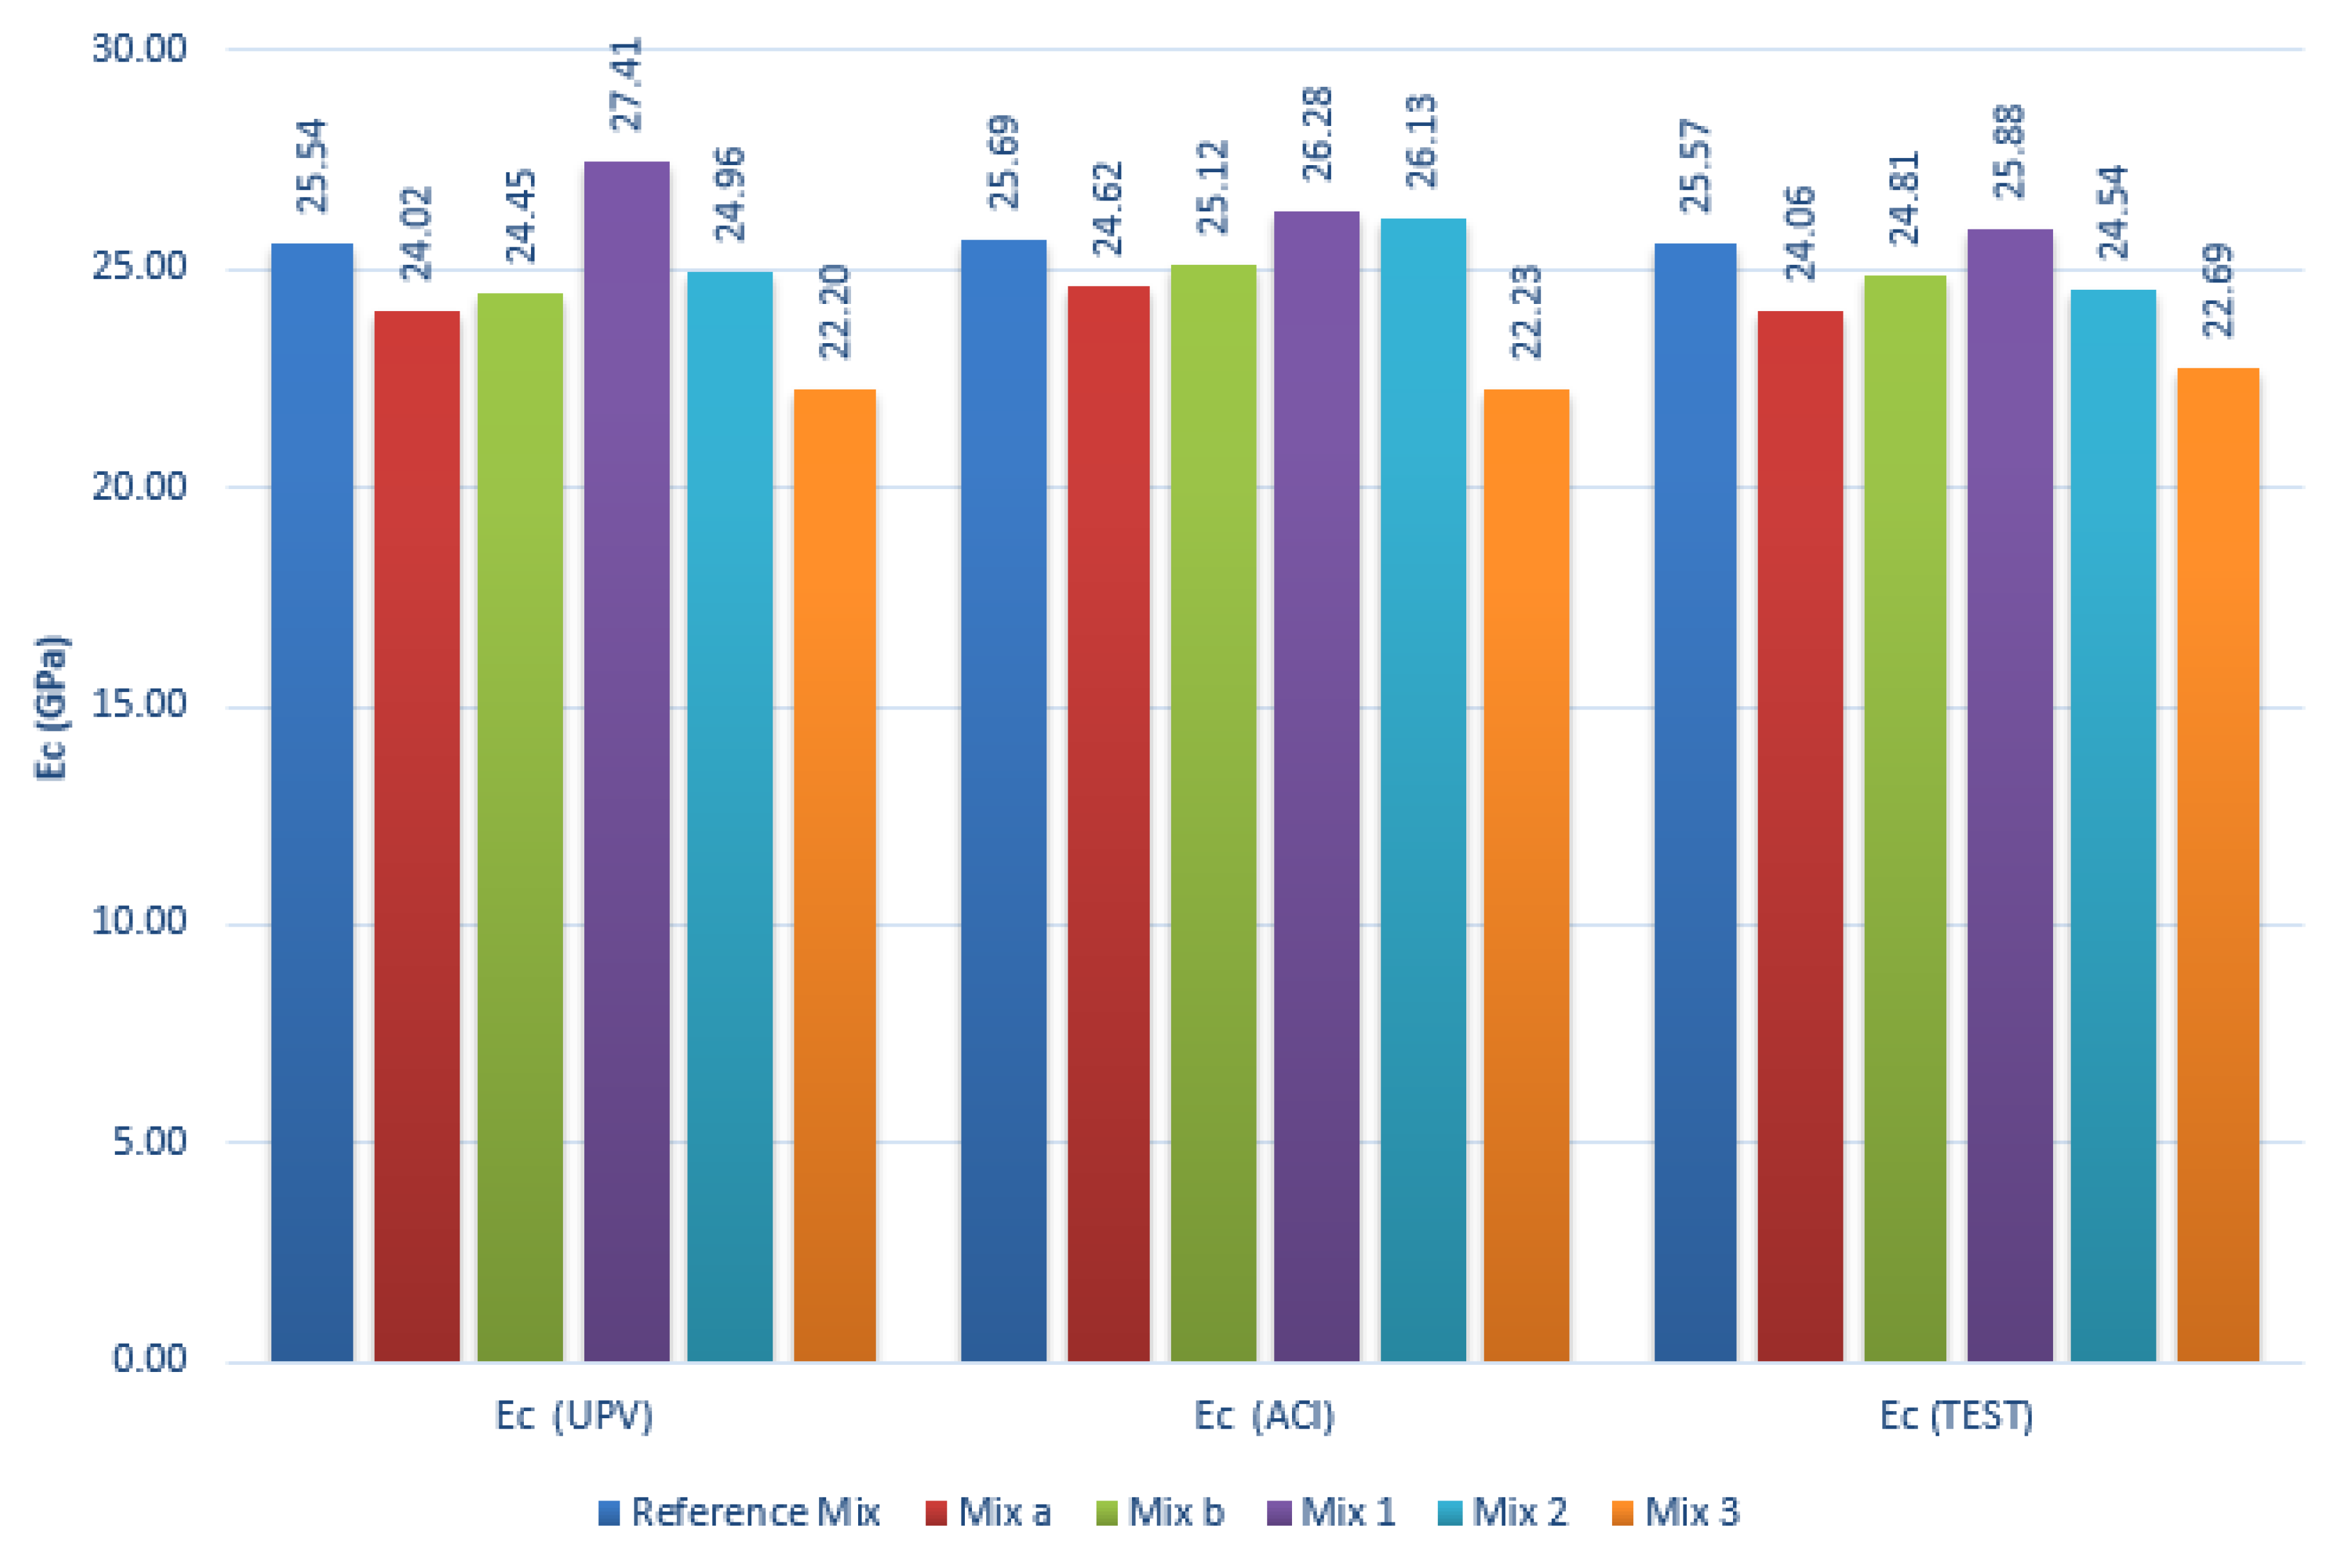
Figure 22.
Splitting Tensile Test for Eco-Friendly Concrete Mixes.


Table 1.
Chemical Composition of Fine Crushed Glass. Wood Ash, Crumb Rubber, and Crushed Glass.
| Composition | % FCG | % WA | % CR | % CG |
|---|---|---|---|---|
| SiO2 | 70.56 | 37.86 | 26.5 | 72.61 |
| Al2O3 | 1.54 | 13.24 | 8.7 | 1.38 |
| Fe2O3 | 0.42 | 6.91 | 9.3 | 0.48 |
| CaO | 10.38 | 18.83 | 12.9 | 11.70 |
| MgO | 1.95 | 4.11 | 6.4 | 0.56 |
| Na2O | 14.14 | 1.39 | 1.4 | 13.12 |
| K2O | 0.36 | 2.36 | 1.1 | 0.38 |
| SO3 | --------- | ---------- | 1.6 | 0.09 |
| TiO2 | --------- | ---------- | 1.0 | --------- |
| CI | ---------- | ---------- | 0.1 | --------- |
| Zn | ----------- | ----------- | 20.2 | --------- |
| Loss on Ignition | 0.65 | 15.3 | 10.8 | 0.22 |
Table 2.
Mix Component Replacement Percentages with Individual Waste Type.
| Waste Type | Replaced Component | Percentage Replacements |
|---|---|---|
| WA | Cement | 2%, 4%, 6%, 8%, 10%, 15%, and 20% |
| WA | NS | 2%, 10%, 15%, 20%, 25%, and 30% |
| CR | NS | 1%, 2%, 3%, 4%, and 5% |
| FCG | NS | 10%, 20%, and 30% |
| CG | Gravel | 5%, 10%, 20%, 30%, 40%, and 50% |
| RC | Gravel | 20%, 25%, 40%, 50%, 60%, 75%, 80%, and 100% |
Table 3.
Mix Component Replacement Percentages with Two Waste Types.
| Material | WA: Cement RC: Gravel | WA: Cement CR: NS | WA: Cement CG: Gravel | CR: NS RC: Gravel | CR: NS CG: Gravel | WA: NS RC: Gravel |
|---|---|---|---|---|---|---|
| % Replacement | 2% WA | 2% WA | 4% WA | 4% CR | 4% CR | 10% WA |
| 25% RC | 4% CR | 5% CG | 25% RC | 5% CG | 50% RC | |
| 4% WA | 4% WA | 4% WA | 4% CR | 4% CR | 15% WA | |
| 25% RC | 2% CR | 10% CG | 50% RC | 10% CG | 75% RC | |
| 2% WA | 2% WA | 2% WA | 2% CR | 2% CR | 20% WA | |
| 50% RC | 2% CR | 10% CG | 50% RC | 10% CG | 100% RC |
Table 4.
Mix Component Replacement Percentages with Three Waste Types.
| Material | WA: Cement, CR: NS, and RC: Gravel | WA: Cement, CR: NS, and CG: Gravel |
|---|---|---|
| % Replacement | 2% WA + 2% CR + 25% RC | 2% WA + 2% CR + 5% CG |
| 2% WA + 2% CR + 50% RC | 2% WA + 2% CR + 10% CG | |
| 2% WA + 4% CR + 25% RC | 2% WA + 4% CR + 5% CG | |
| 2% WA + 4% CR + 50% RC | 2% WA + 4% CR + 10% CG | |
| 4% WA + 2% CR + 25% RC | 4% WA + 2% CR + 5% CG | |
| 4% WA + 4% CR + 25% RC | 4% WA + 4% CR + 5% CG | |
| 4% WA + 2% CR + 50% RC | 4% WA + 2% CR + 10% CG | |
| 4% WA + 4% CR + 50% RC | 4% WA + 4% CR + 10% CG |
Table 5.
Eco-Friendly Mixes.
| Mix Number | Mix Waste Components | f’c28 (MPa) | % Replacement by Volume |
|---|---|---|---|
| RC Replacing Gravel | |||
| Mix a | 80% RC | 22.11 | 20.95 |
| Mix b | 100% RC | 23.34 | 26.19 |
| WA Replacing Sand + RC Replacing Gravel | |||
| Mix 1 | 20% WA, 100% RC | 30.73 | 35.33 |
| Mix 2 | 15% WA, 75% RC | 25.88 | 26.5 |
| WA Replacing Cement + CR and WA Replacing Sand + RC Replacing Gravel | |||
| Mix 3 | Optimum Eco-Friendly Mix | 18.69 | 34.63 |
Publisher’s Note: MDPI stays neutral with regard to jurisdictional claims in published maps and institutional affiliations. |
© 2022 by the authors. Licensee MDPI, Basel, Switzerland. This article is an open access article distributed under the terms and conditions of the Creative Commons Attribution (CC BY) license (https://creativecommons.org/licenses/by/4.0/).
Share and Cite
MDPI and ACS Style
Gerges, N.N.; Issa, C.A.; Sleiman, E.; Aintrazi, S.; Saadeddine, J.; Abboud, R.; Antoun, M. Eco-Friendly Optimum Structural Concrete Mix Design. Sustainability 2022, 14, 8660. https://doi.org/10.3390/su14148660
AMA Style
Gerges NN, Issa CA, Sleiman E, Aintrazi S, Saadeddine J, Abboud R, Antoun M. Eco-Friendly Optimum Structural Concrete Mix Design. Sustainability. 2022; 14(14):8660. https://doi.org/10.3390/su14148660
Chicago/Turabian StyleGerges, Najib N., Camille A. Issa, Elias Sleiman, Sara Aintrazi, Jad Saadeddine, Remi Abboud, and Marc Antoun. 2022. "Eco-Friendly Optimum Structural Concrete Mix Design" Sustainability 14, no. 14: 8660. https://doi.org/10.3390/su14148660
Note that from the first issue of 2016, this journal uses article numbers instead of page numbers. See further details here.