Article

Penetration Behavior of the Footing of Jack-Up Vessel of OWTs in Thin Stiff over NC Clay

1
State Key Laboratory of Subtropical Building Science, South China Institute of Geotechnical Engineering, South China University of Technology, 381 Wushan Road, Guangzhou 510640, China
2
Nanjing Hydraulic Research Institute (NHRI), Nanjing 210029, China
3
Key Laboratory of Environment Protection & Safety of Communication Foundation Engineering, CCCC, Guangzhou 510230, China
4
Guangzhou Urban Planning & Design Survey Research Institute, Guangzhou 510060, China
5
Guangdong Enterprise Key Laboratory for Urban Sensing, Monitoring and Early Warning, Guangzhou 510060, China
*
Author to whom correspondence should be addressed.
Sustainability 2022, 14(14), 8618; https://doi.org/10.3390/su14148618
Submission received: 27 May 2022 / Revised: 7 July 2022 / Accepted: 11 July 2022 / Published: 14 July 2022

Abstract

:
This study investigated the behavior of the spudcan foundation of jack-up vessels of offshore wind turbines during the undrained vertical penetration into thin stiff-over-normally consolidated clay. Large deformation finite element (LDFE) analyses were used to simulate the continuous spudcan penetration into the seabed surface. Detailed parametric analysis was performed to explore a range of normalized soil properties and layer geometry and roughness of the soil–spudcan interface. The results were validated against previously reported data. The LDFE results were consistent with those of centrifuge tests. The evolving soil-failure patterns revealed soil backflow and the trapping of stronger top-layer material beneath the spudcan. The plug shape was influenced by the top layer thickness, the strength gradient of the bottom layer, and the relative strength ratio, which also affected the penetration resistance of soils. In this study, an expression was derived to quantify the plug shape with the aim of providing a theoretical basis for the design of spudcan footings with penetration resistance suitable for thin stiff-over-soft clay.

1. Introduction

Several countries are increasingly developing clean renewable energy to overcome the persistent global shortage of fossil fuels and environmental pollution [1,2,3,4]. Offshore wind is attracting increased attention as an energy source owing to its high speed, low wind shear, low turbulence, high yield, and less impact on human life [5,6]. To enhance the reliability of lifting blades, offshore wind turbines are typically installed using jack-up vessels that are supported by four or six legs connected to spudcan or plate footings to ensure the stability of the crane; however, the mechanism of spudcan penetration is uncertain, and has led to several failure cases, especially the mechanism of penetration into layered soil deposits, that is, stiff-over-soft soil deposits. Spudcan penetration may also lead to punch-through failure that can cause substantial structural damage (illustrated in Figure 1), such as the buckling of the legs, decommissioning of the platform, toppling of the unit, and risks to the safety of on-board staff [7,8,9]; however, punch-through failure does not occur in the thin stiff-over–normally consolidated (NC) clay layer. The spudcan penetrates the underneath layer and reaches the sensitive stiff clay layer, so that it can support the weight of the jack-up vessel that weighs 5000–30,000 tons. Therefore, plug effect occurs in the bottom layer causing an increase in the penetration resistance of the spudcan in the bottom layer, as revealed by centrifuge tests and numerical simulations [10,11,12]. Predicting the penetration resistance of the spudcan in the underneath NC clay layer is challenging because the design does not account for plug effect. To evaluate penetration resistance, the mechanism of the failures in thin stiff-over-NC clay caused by spudcan penetration should be determined.

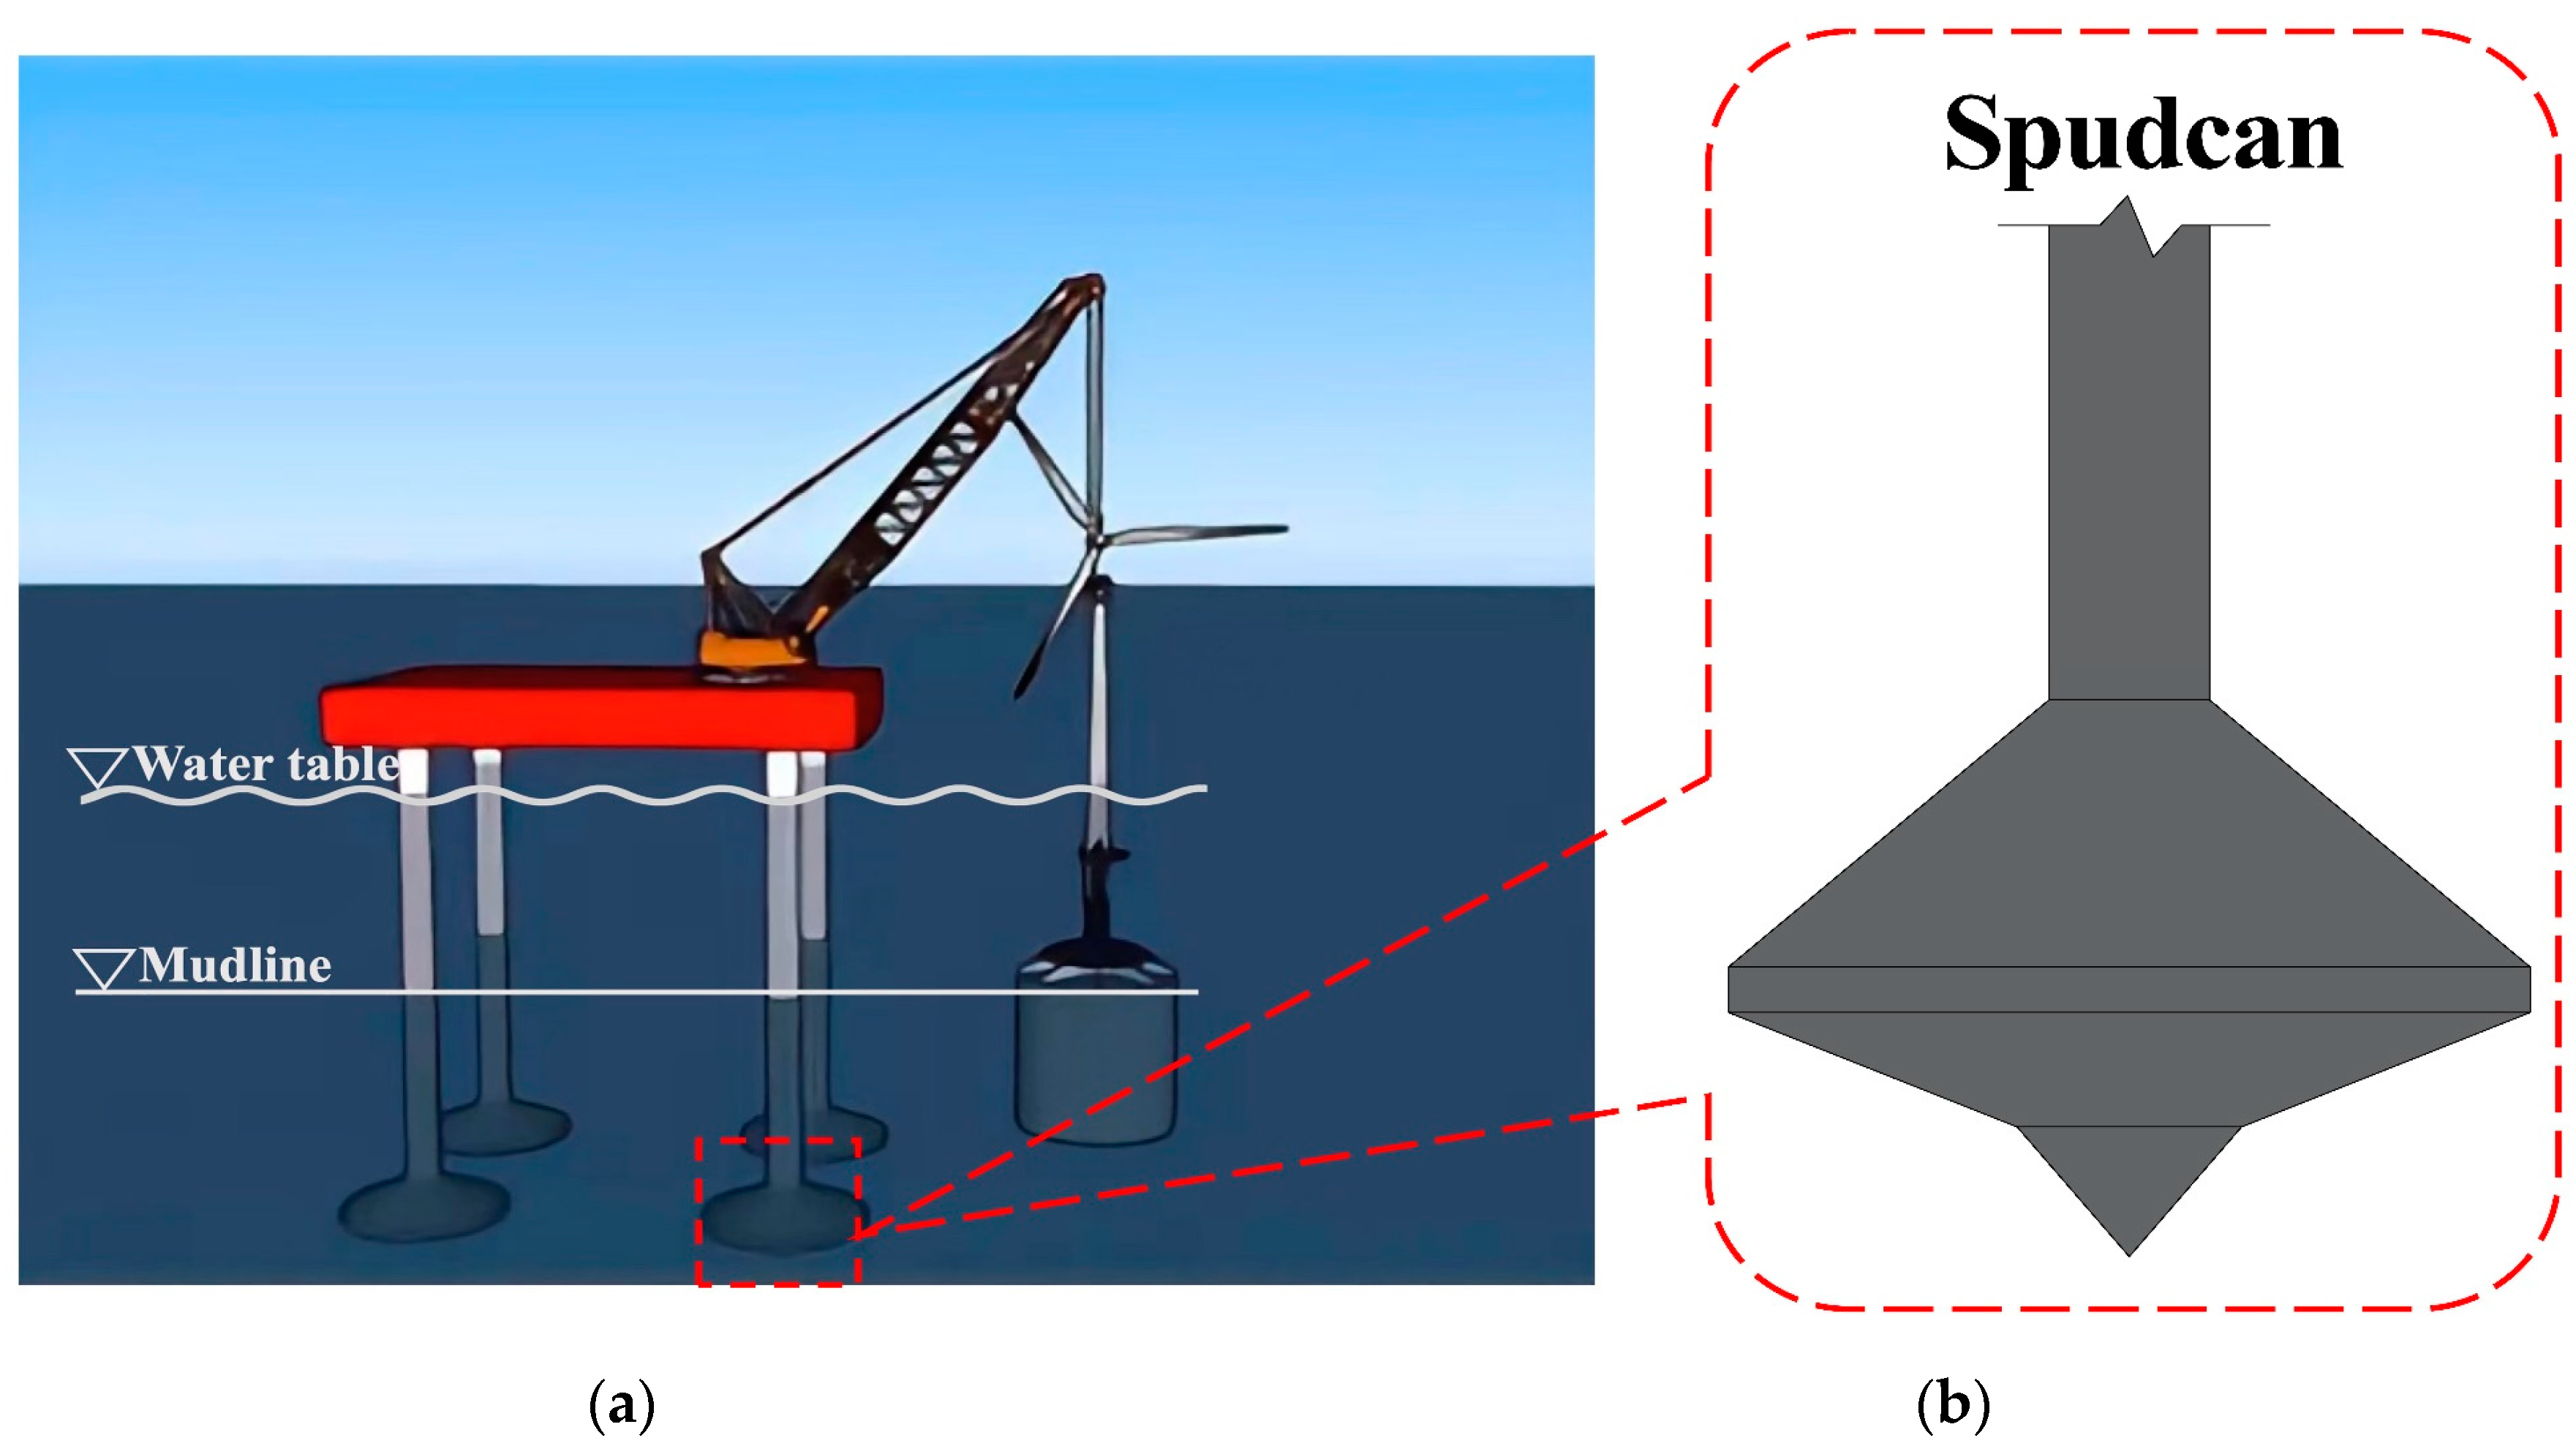
1.1. Steps and Methods of Jack-Up Vessel Installation

Floating structures with multiple legs are used as wind-farm-installation vessels that can be classified into two types: jack-up barge and self-propelled vessel. Jack-up barges typically have four legs, significantly differ in size, and are not self-propelled, for example, the Sea Jack manufactured by A2SEA. Another type of installation vessel with 4–6 legs can self-propel and travel at 8–12 knots [13,14]. When the vessel arrives at the work location, it can complete the exact placement all by itself owing to the tandem between the positioning system and the propeller. The vessel then transforms into an ocean engineering platform by projecting the legs from the ship’s bottom to the seabed and raising the entire body of the vessel. As a result, as illustrated in Figure 2a, the vessel can raise its hull from the ocean’s surface to provide a solid platform for heavy lifting and massive component replacement. Each independent leg comprises a structural truss fitted with a spudcan of approximately circular, square, or polygonal shape or with a tubular leg at the bottom. The spudcans can be reasonably considered equivalent circular footings with shallow conical bases and tops. The geometry of the spudcan used in this study commonly employed in offshore engineering and are displayed in Figure 2b.

1.2. Previous Work

Previous studies have mainly investigated the failure mechanism and corresponding resistance of spudcan in single-layer soil [15,16,17] and in layered soil [18,19,20,21].
To analyze spudcan penetrating behavior in single-layer soil, studies have mainly focused on resistance to develop a design method involving the use of uniform clay, NC clay, and the sand soil profile. Hossain and Hu analyzed the penetration of spudcan foundation into uniform clay through drum centrifuge model tests and finite element (FE) analysis [16]. The rotational soil failure mechanism of the soil around the spudcan is observed, but not induced by the cavity failure mechanism; they also determined the corresponding stability numbers for ‘flow failure’ and ‘wall failure’. Hossain and Randolph proposed a method for interpolating the failure mechanism and resistance profile of spudcan installation in a single NC clay layer through large deformation finite element (LDFE) analyses and centrifuge tests [17]; they demonstrated that the process of spudcan installation in single NC clay starts with cavity formation and increases in surface heave behavior at shallow penetration; the flow gradually transforms into a rotational soil flow that causes the backflow of the soil underneath the spudcan. Chua and Craig employed centrifuge testing to investigate the deep penetration of spudcan foundation into the single sand layer [15]; they demonstrated the cavity formation above the spudcan and discussed the limiting depth of the cavity, and also revealed a considerable lateral displacement of sand in the upper layer before the footing and under-plug were isolated because of gross displacement.
Punch-through failure during the spudcan installation in the layered soil has been investigated for the accurate prediction of the peak value of the soil resistance and location of the failure. Liu et al. analyzed the spudcan penetration behavior in a rigid soil layer overlaying a soft soil layer through LDFE analysis [18]; they discovered that the critical distance of spudcan penetration in layered soil is an indication of punch-through failure. Hossain and Randolph demonstrated critical rotational backflow of soil onto the top layer during the spudcan penetration into stiff-over-soft clay through centrifuge tests and numerical analyses [22]. Severe punch-through failure occurs because of vertically downward soil displacements beneath the spudcan in the top layer, and thus, a soil plug shaped like an inverted truncated cone finally submerges in the bottom soft layer. Zheng analyzed the deep spudcan penetration into multi-layered clay through (3D) LDFE numerical analyses and centrifuge tests [21]; they demonstrated that the trapped soil plug beneath the advancing spudcan, after the penetration into the top stiff layer, causes the bottom stiff layer to be sensed earlier and the limiting squeezing depth to be enhanced. Through centrifuge tests and LDFE analyses, Hu et al. investigated the potential effects of the soil plug on the double sand-over-clay layer [20]; they demonstrated that the soil plug affects the failure mechanism of the soil around spudcan and hence increase the penetration resistance.
For the installation of footing of the jack-up vessel in the thin stiff-over-NC clay layer, the spudcan was required to penetrate deeper to sensitize more soil of the bottom layer to support the considerably large weight of the vessel; thus, a soil plug was formed, increasing the penetration resistance of the spudcan in the bottom NC clay. Owing to the soil plug effect, the penetration depth suitable for reaching the bearing capacity to support the weight of the vessel was uncertain.

1.3. Objective of the Present Study

This study investigated the ‘ground truth’ of spudcan foundation penetration into thin stiff-over-soft clay through LDFE analysis. An extensive parametric investigation was conducted to address the failure mechanism. Finally, a new failure mechanism was established to assess the plug shape of the thin stiff clay trapped underneath the spudcan during the penetration into the thin stiff-over-soft clay.

2. Method: LDFE Analyses

2.1. Soil Profile

A spudcan of diameter D was used to penetrate a thin stiff-over-NC clay deposit, as illustrated in Figure 3. The undrained shear strength of the top stiff clay (sut) and the undrained shear strength of the underneath NC clay (sub) increased linearly with depth, as indicated by the mudline intercept of the sum with a gradient of k.
Large LDFE analyses were performed through the method of remeshing and interpolation technique with small strain (RITSS) implemented using the finite element (FE) package AFENA [23,24]. The RITSS method is an arbitrary Lagrangian–Eulerian (ALE) finite element method [25], where in a series of small strain analyses are combined with frequent fully automatic remeshing of the entire domain, followed by the interpolation of all field variables (including stresses and material properties) from the old mesh to the new mesh (Figure 4). Six-noded triangular elements with three internal Gauss points were used in all FE analyses. The spudcan structure and soil interfaces were simulated using elastoplastic nodal joint elements distributed along the spudcan–soil interface [26]. The shear strength of the nodal joint elements is limited to αsu, where α is the interface friction coefficient of soil and su is the local undrained shear strength of the soil. Figure 4a–d illustrate a group of meshes at various penetration depths (Z = 0, 5, 10, and 25 m). In the updated mesh method, the grid topology of the mesh was updated for each remeshing step. The spudcan penetration process was controlled by a continuous small displacement, which contains 50 incremental displacement (dt = 0.5 mm), which is reasonable for spudcan penetration undertaken by RITSS method [27]. In addition, the area with large strain and stress was covered by a dense mesh with remeshing (especially for the region around the spudcan). Hence, no torsion occurred in the mesh, and the meshes around the structure were sufficiently fine for high accuracy. In the process of simulation, the interface between the spudcan and the soil could be separated.
An axisymmetric soil domain with 10D radius and 10D depth was selected to ensure that the domain boundaries were sufficiently outside the plastic zone to avoid boundary effects. Hinge and roller conditions were applied along the base and vertical sides of the soil domain, respectively. The soil was modelled as an elastoplastic material obeying the Tresca yield criterion. For the spudcan penetrating into clay soil profiles, no consolidation issue is needed to be considered, because the penetration is very fast within several hours for one footing and the permeability of the clay is pretty low, hence extremely no excess pore water pressure dissipation happened. Therefore, the penetration process is carried out under undrained soil condition. Lots of previous work have proven that, for the simulation of the offshore structures, including ball penetrometer [28], cone penetrometer [29], spudcan [17,30], penetration in clay, the Tresca model is reasonable, because the consolidation issue can be ignored. All the analyses were performed by simulating total stress, considering undrained soil conditions, a Poisson’s ratio of ν = 0.49 (sufficiently high to yield minimal volumetric strains, while maintaining numerical stability), friction and dilation angles ϕ = ψ = 0, and a uniform stiffness ratio E/su = 500 (where E is the Young’s modulus) throughout the soil domain. The stiffness ratio was within the commonly adopted range for soft clays. In engineering applications, the value of stiffness ratio typically varies from 200 to 700, and the ratio of E/su has no effects on the bearing capacity of the structure. Therefore, the average value of 500 was selected [18,19,20,21,31,32], and an effective unit weight of 6 kN/m3 was assigned to the soils. The geostatic stress conditions were modeled considering K0 = 1.

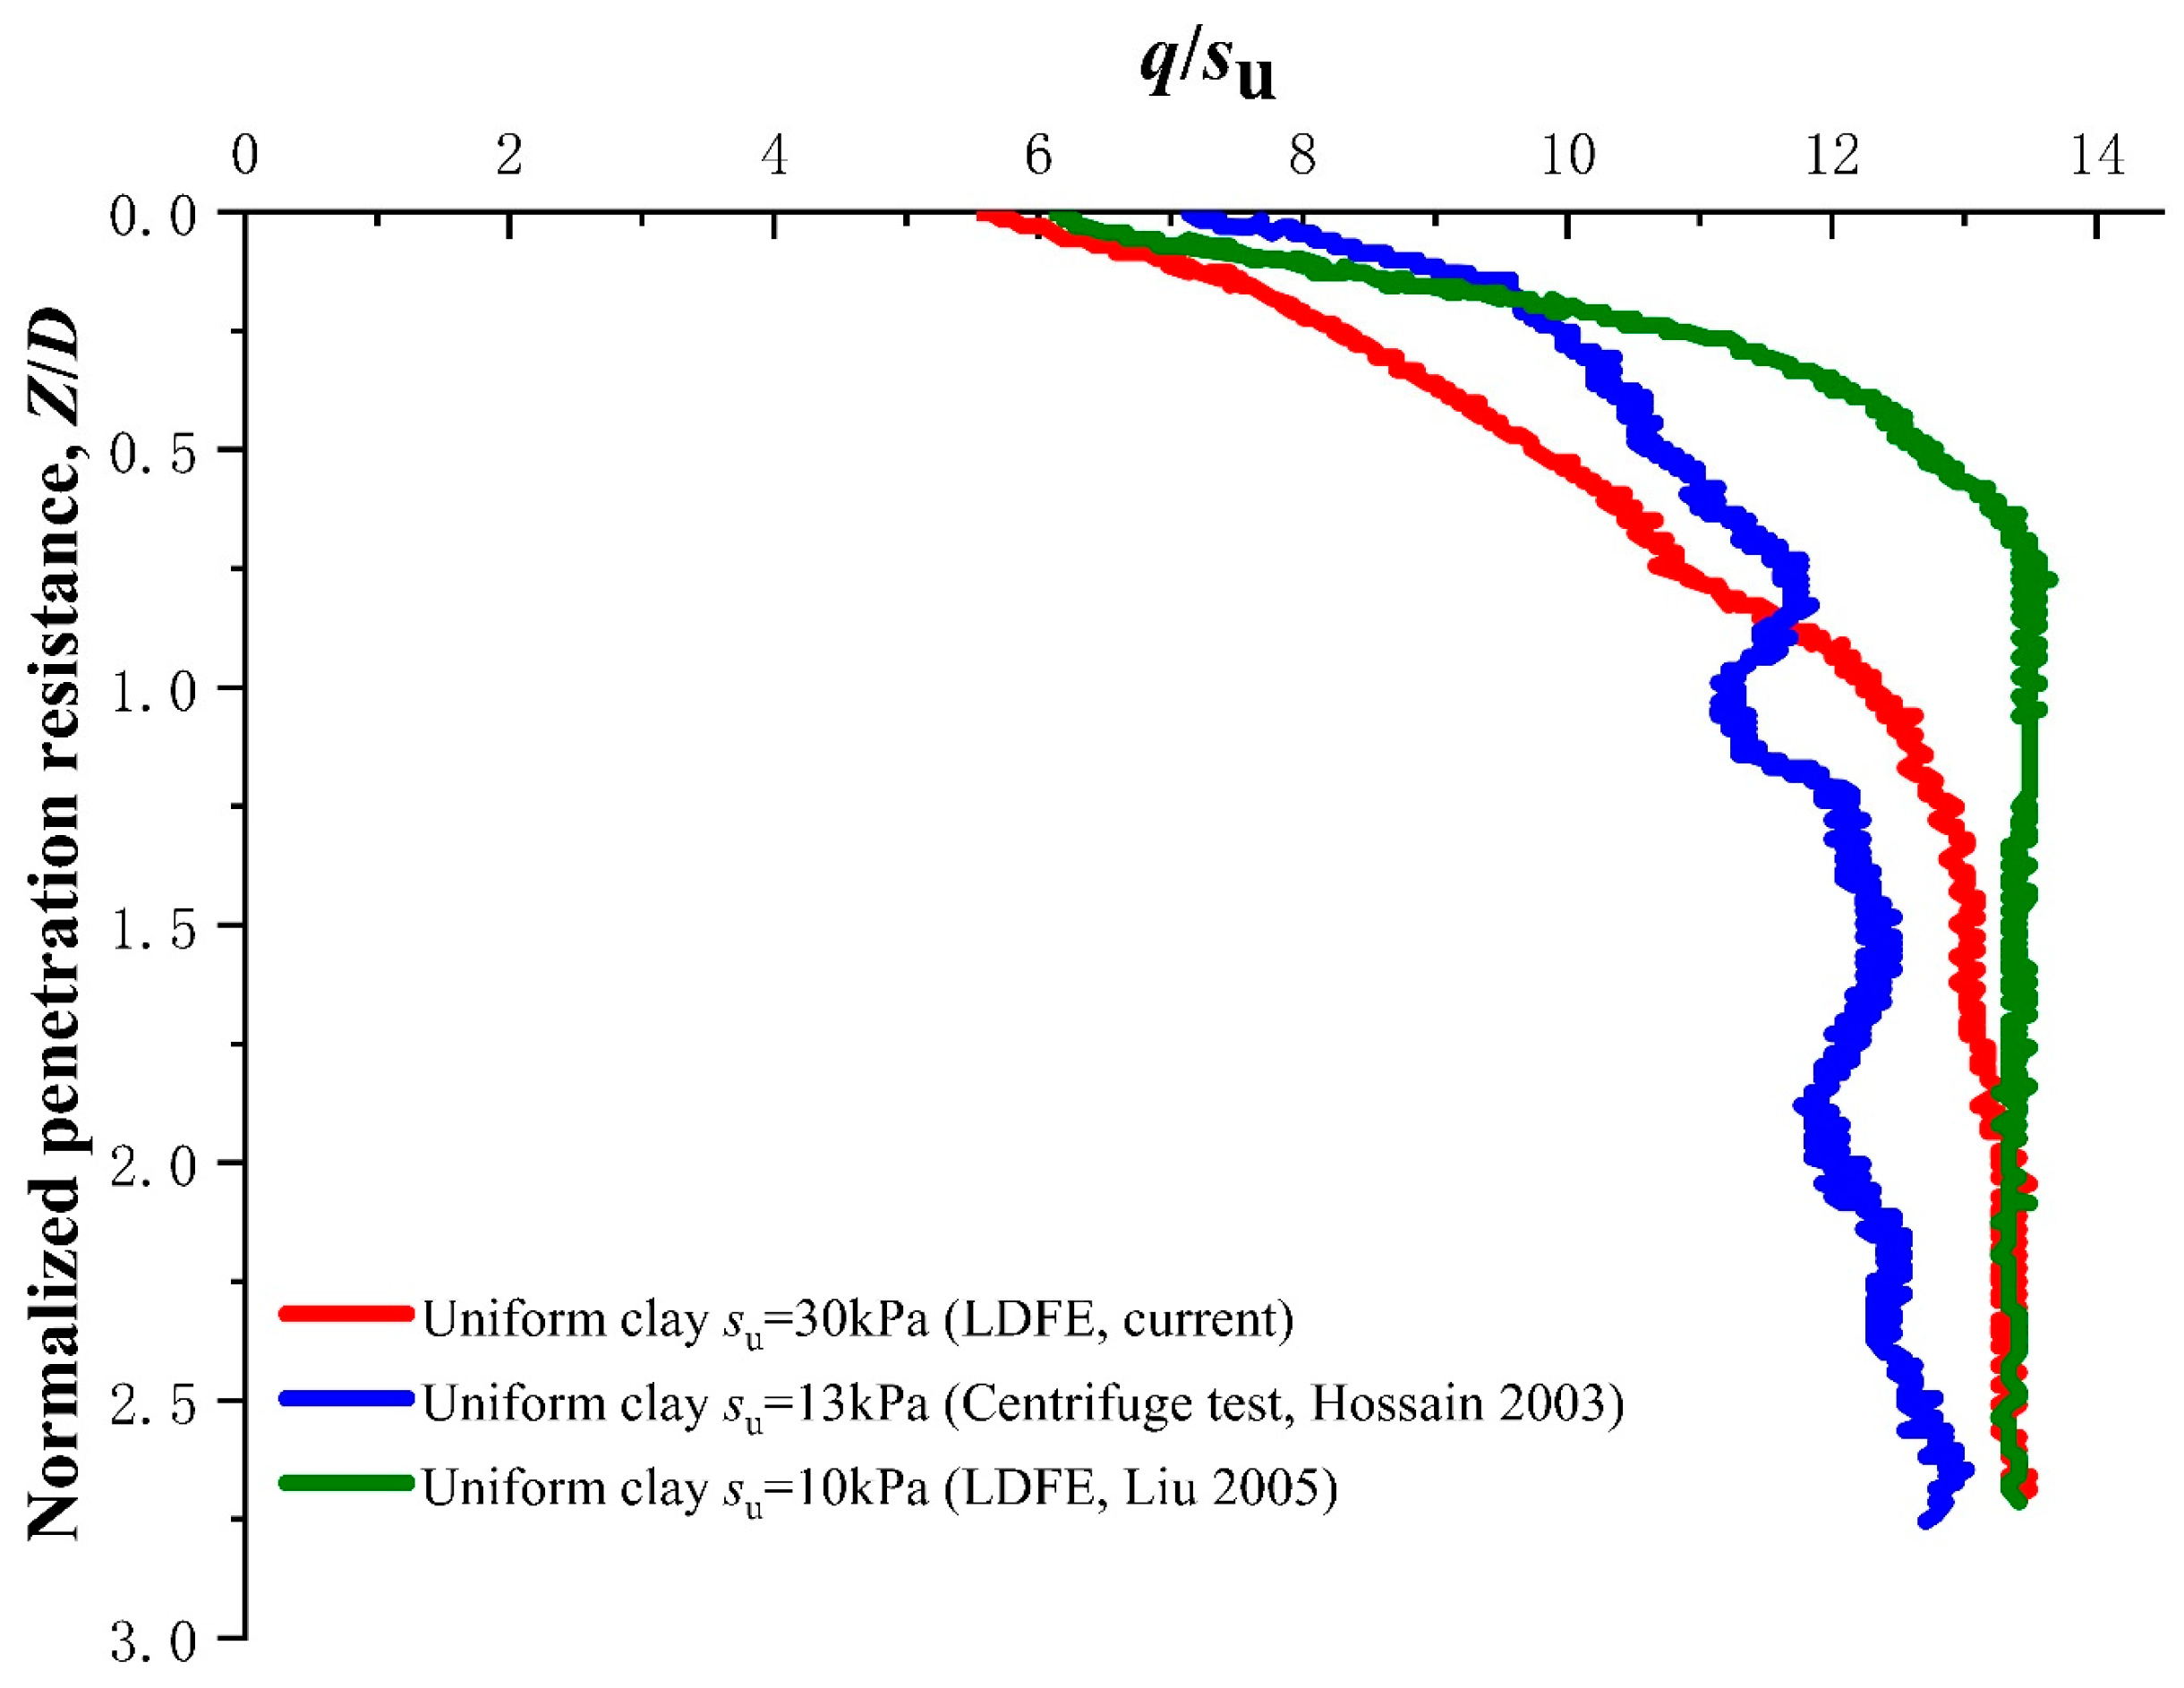
2.2. Model Validation

The results of the LDFE/RITSS analyses were validated against the data on soil flow mechanisms reported by Hossain and Randolph [22]—in their study, the physical model of the spudcan penetration into a stiff-over-soft clay layer was validated according to the soil movement observed through particle image velocimetry (PIV) analysis and centrifuge tests [30]. In all simulations, the thickness of the top thin stiff-clay layer varied from 2 to 6 m. The top layer soil strength varied from 20 to 60 kPa, and the strength of the bottom layer soil varied from 5 to 15 kPa. The strength gradient of the bottom layer can be represented using this sequence: 0.6, 1, 2. The coefficients of friction were designed to be 0.2, 0.3, 0.5, and 0.8. The validation analysis for Group 1 is depicted in Table 1, with the spudcan (D = 6 m, α = 1) penetrating the double-layered clay (H/D = 1, sut/γ′D = 0.45, sut/sui = 1.6, k = 0). The soil flow pattern at the normalized penetration depth Z/D = 0.38 was compared between the LDFE results and Hossain’s results, as illustrated in Figure 5a. The observed soil heave and soil flow mechanisms were roughly identical to those observed in the centrifuge tests. The results of this study and Hossain’s study indicated that the interface of the two-layered soil moved downward because the spudcan penetrated the bottom layer, and the flow trend and values for the soil movement were similar. With deeper penetration, Z/D = 1.15 (as illustrated in Figure 5b), the soil plug and soil flow mechanism observed in this study were similar to those reported by Hossain, with similar rotational soil backflow and approximately identical plug thickness and shape; thus, the soil flow patterns, plug shape, and corresponding cavity formations were consistent.
In Figure 6, another validation case was carried out, which compared with centrifuge test and LDFE test in the terms of penetration resistance. The validation analysis for Group 2 was depicted in Table 1, with the spudcan (D = 14 m, α = 0.3) penetrating the double-layered clay (H/D = 1, sut/γ′D = 0.31, sut/sui = 0.5, k = 0). The normalized bearing pressure (q/su) of spudcan penetrating into uniform clay was deposited against the exiting results in Figure 6. It can be seen that the ultimate bearing resistance from current LDFE analysis was close to the [16,18] and the variation tendency of three curves was similar, indicating that good agreement is obtained for the resistance profile.

3. Results

Parametric analyses were performed by varying (i) the thickness of the top thin stiff clay layer (H/D), (ii) the normalized strength of the top layer soil (sut/γ′D), (iii) the strength ratio of the layers (sut/sui), (iv) the strength gradient of the bottom layer (k), and (v) the coefficient of friction (α).

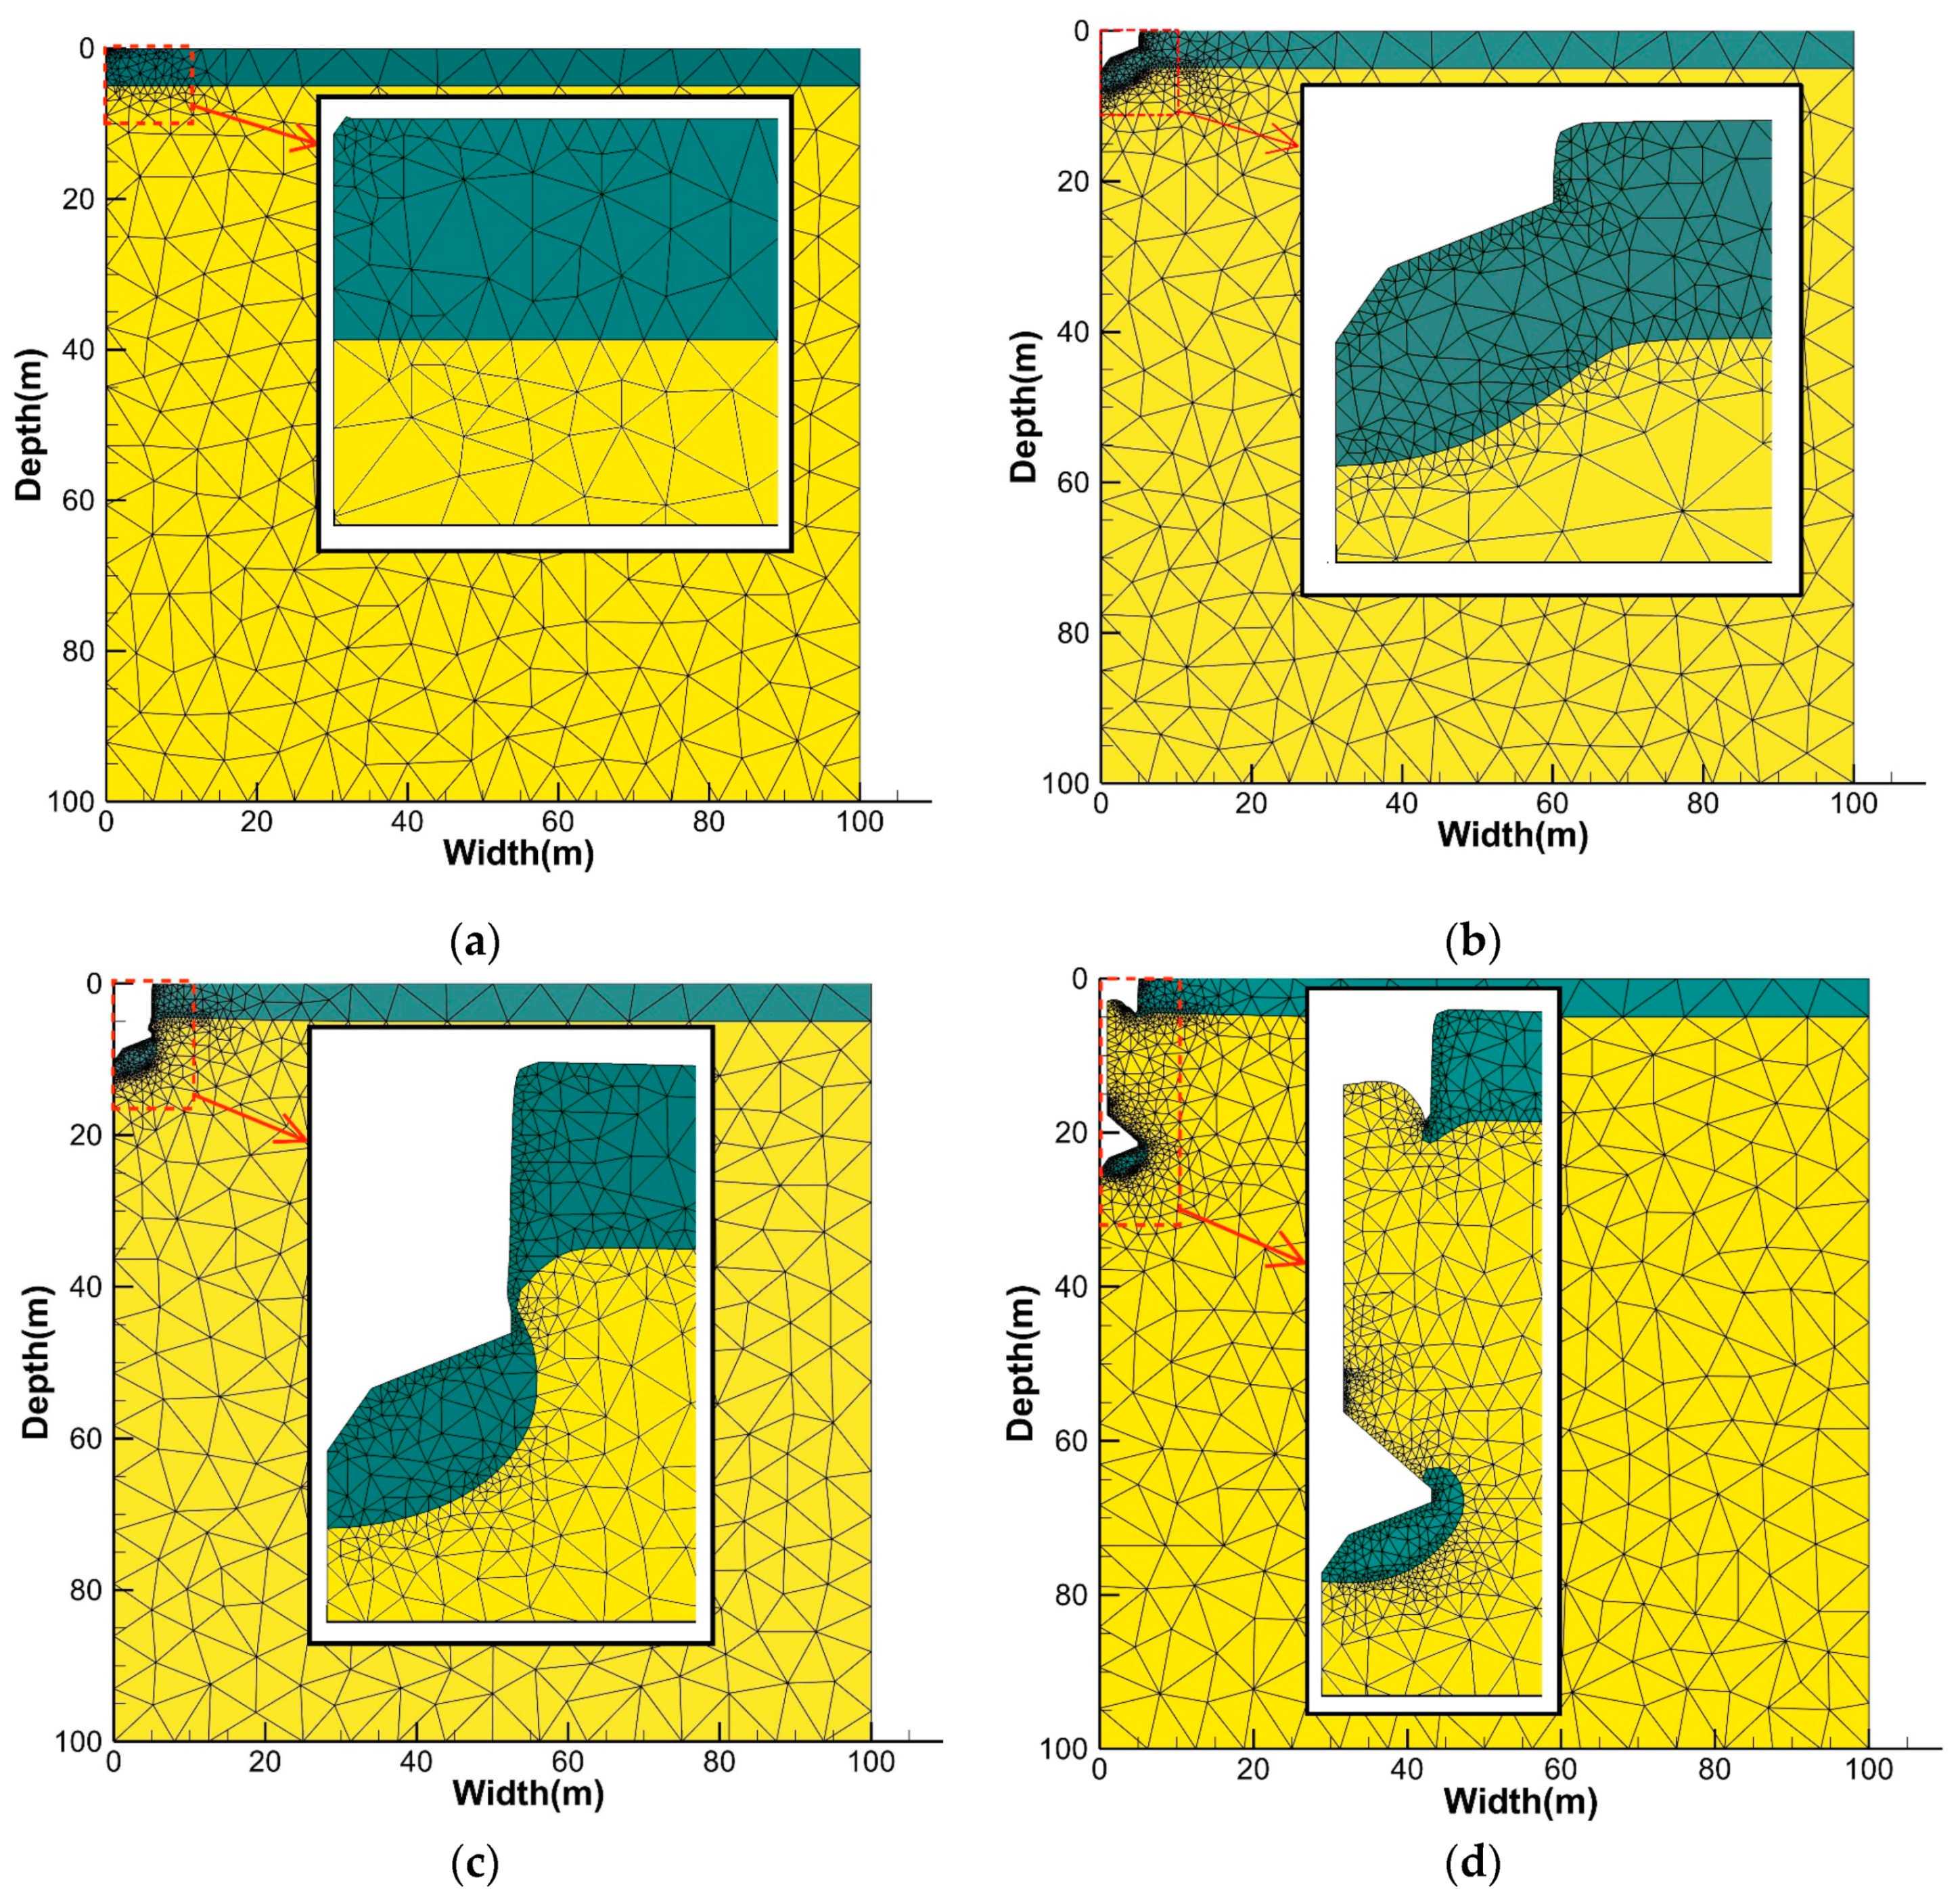
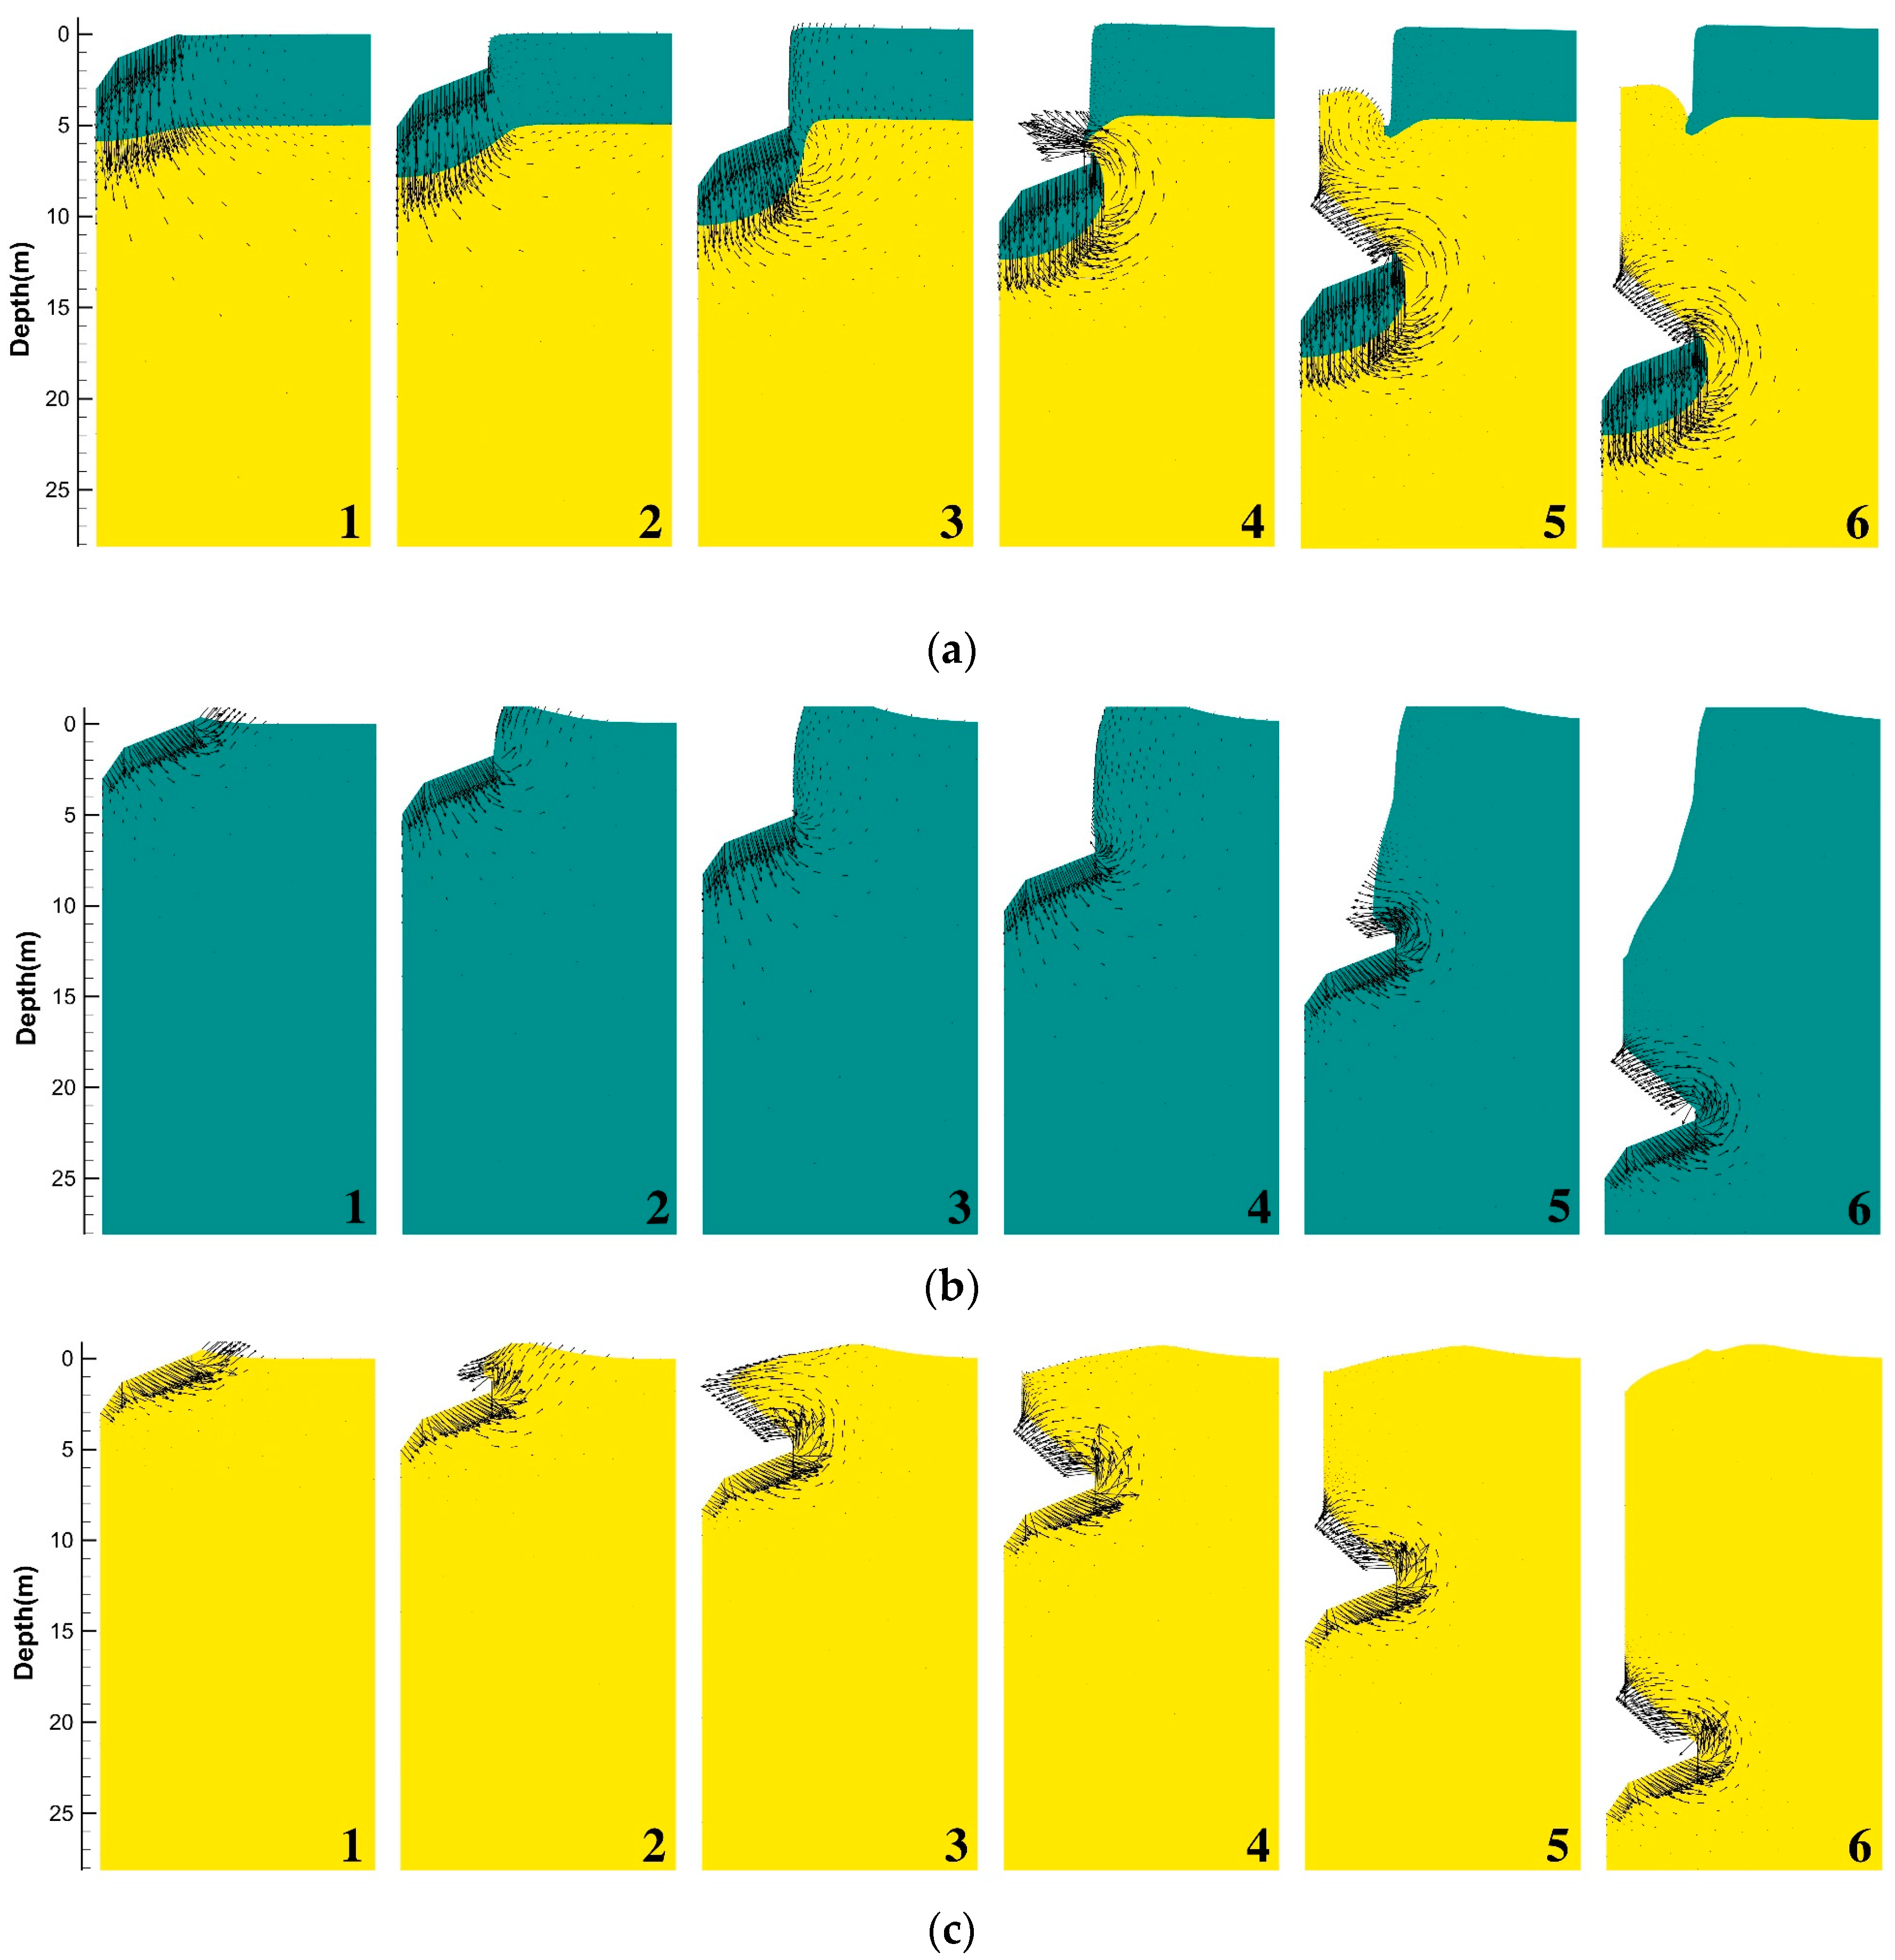
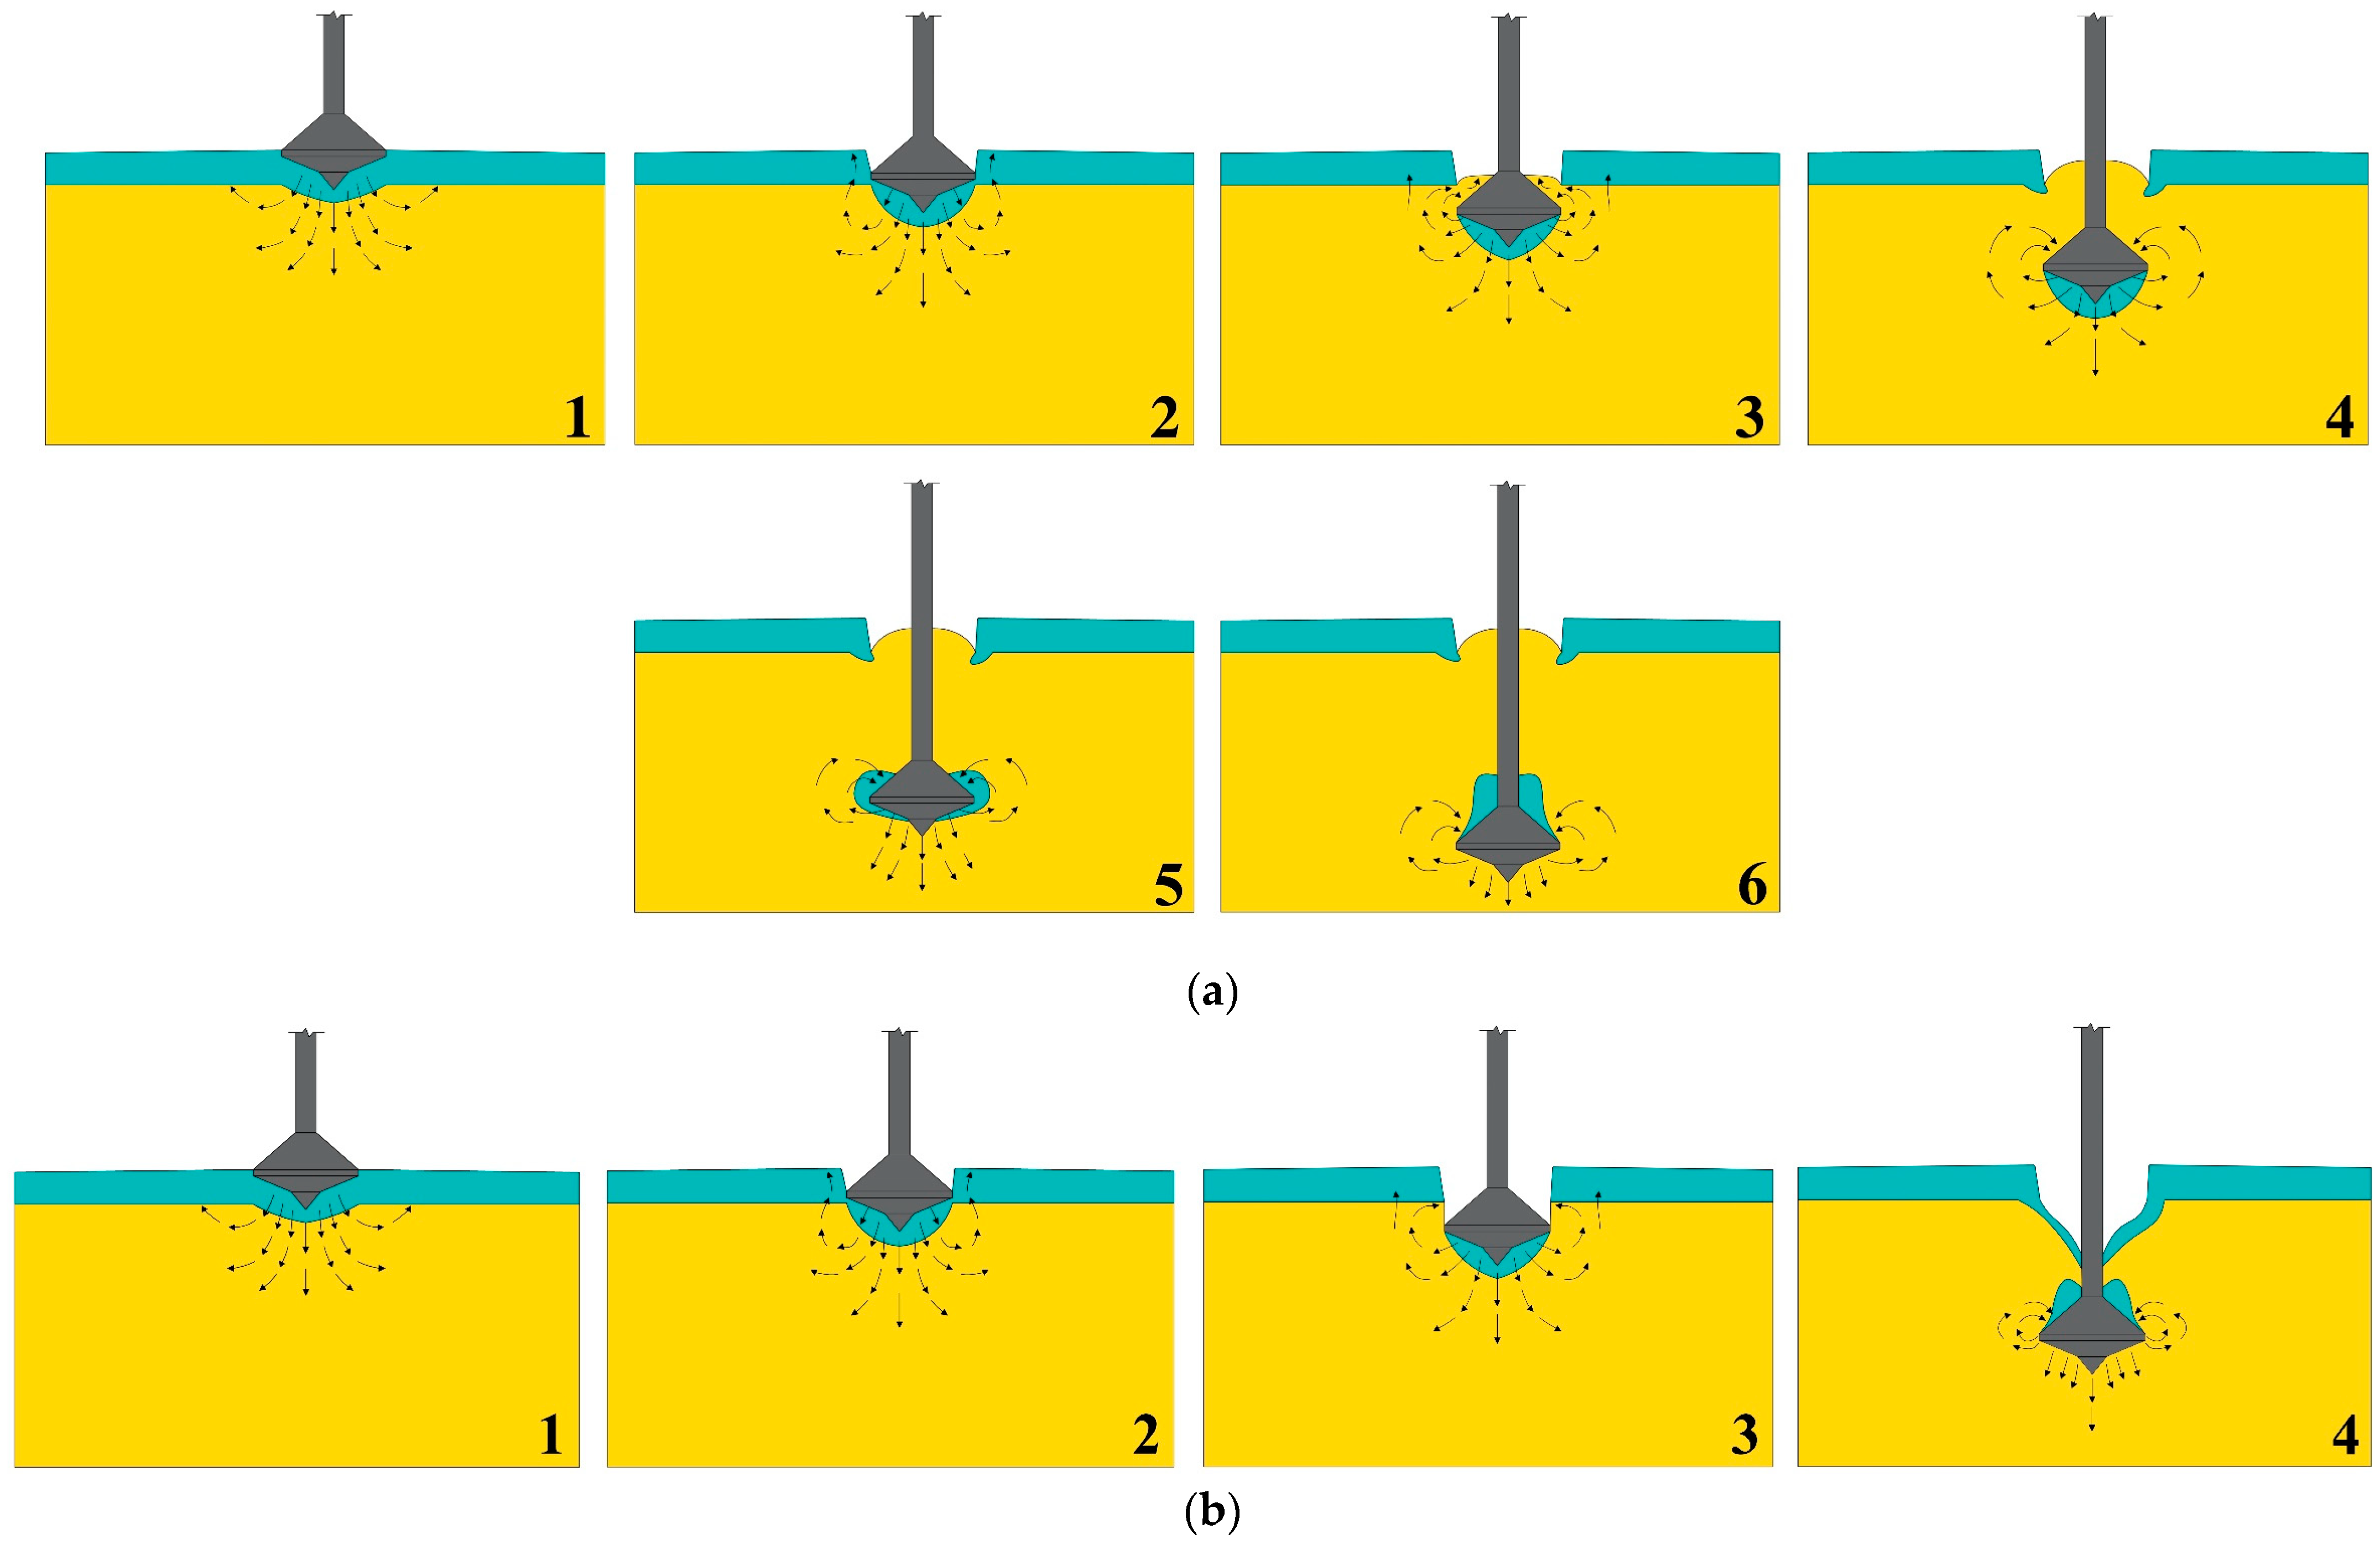
3.1. Typical Soil Failure Mechanism

To investigate the typical soil failure mechanisms of the spudcan penetration into the thin stiff-over-NC clay, a typical case was designed by varying the penetration depth from 0 to 25 m, (H/D = 0.5, sut/γ’D = 0.83, kD/sui = 1.2, sut/sui = 10, α = 0.3, γ’ = 6 kN/m3; Standard group, Table 1). In addition to this case, two other cases of single layer uniform and NC clays were designed for comparison. For spudcan penetration into stiff-over-NC clay, with initial penetration (Z = 3 m; Figure 7(a1)), the top layer stiff clay tended to move vertically and the bottom NC clay was mobilized by the above stiff clay, resulting in vertical and slightly horizontal movements. With deeper penetration (Z = 5 m; Figure 7(a2)), when the conical tip reached the initial interface of the two-layered soil, the soil below the spudcan tended to combine with the structure as a rigid body and then move vertically. In this stage, the underneath NC clay around spudcan tended to move vertically and horizontally, and an initial plug formed. Furthermore, a vertical stand wall was above the spudcan, forming a cavity due to the high strength of the top layer. A similar phenomenon was revealed by centrifuge test. With further penetration (Z = 8 m; Figure 7(a3)), when the largest cross-sectional area of spudcan started to move below the original location of the interface between the two soil layers, the entire plug was formed and was stable, and a rotational soil failure mechanism was observed around the interface of the spudcan and the plug. At the depth of 10 m, the underneath soil cut the top layer material, gradually filled the cavity (Figure 7(a4)], and then reached the shaft of the spudcan (the soil and shaft are considered to have mutual contact if the distance between the two is less than 0.05 hmin, where hmin is the minimum element size) and formed a new cavity (Z = 15.5 m; Figure 7(a5)]. Finally, a plug was trapped underneath the spudcan (Z = 25 m; Figure 7(a6)). As the plug was formed, the resistance was larger than that in NC clay, as displayed in Figure 8. In this study, the spudcan penetrated the soil layer to a position of 25 m because the ranges of the penetration depth are 15 m to 30 m, which can support the vessel with 5000 Tons to 30,000 Tons.
Figure 7b illustrates the mechanism of soil flow around the spudcan in uniform stiff clay with the same shear strength of the top layer of the stiff-over-NC clay. Owing to the large shear strength of uniform stiff clay, the backflow of the soil stopped, and the soil layer stood vertically and formed a large cavity (Z = 3 m; Figure 7(b1)). In addition, the stiff uniform clay layer below the spudcan tended to move vertically down and slightly vertically around the corner of the conical shape. With further penetration (Z = 5–10 m; Figure 7(b2–b4)), the uniform clay continued to move downward and the size of cavity gradually increased; however, when the spudcan penetrated into a certain depth (Z = 15.5 m; Figure 7(b5)), rotational failure was observed, and the cavity was gradually filled. Finally, with deeper penetration, the backflow of the soil reached the spudcan shaft and the cavity stability (Figure 7(b6)). Hossian reported a similar finding indicating that the stability of the cavity is correlated with its normalized shear strength (su/γ’D) [22].
The mechanism of soil flow around the spudcan in soft NC clay with the same shear strength as that of the bottom stiff-over-NC clay layer is illustrated in Figure 7c. The soil in NC clay layer tended to move vertically and horizontally, clinging to the surface of spudcan with initial penetration that led to the filling of the cavity (Z = 3 m; Figure 7(c1)). With deeper penetration (Z = 5 m; Figure 7(c2)), the soil tended to have a round flow, which is referred to as rotational soil flow and leads to the sharp filling and stabilization of the cavity (Figure 7(c4–c6)). A few studies have investigated the flow mechanism using T-bar and ball penetrometers that are full-flow penetrometers used in offshore engineering to interpolate soil strength in centrifuge tests and in field tests [32,33]. The penetration mechanism detected using full flow penetrometers was similar to that demonstrated experimentally.
As illustrated in Figure 8, the black line represents the soil resistance during the spudcan penetration into the thin stiff-over-NC clay; cases of NC clay and uniform stiff clay were included for comparison. Within shallow penetration depth, the resistance profiles of the NC clay and thin stiff-over-NC clay converged and started appearing different because of spudcan penetration into the bottom soft NC clay; however, with further penetration (Z = 3 m), the soil resistance reached a peak value for the thin stiff-over-NC clay, then dramatically decreased as the spudcan penetrated the bottom soft NC clay, and finally increased gradually because of an increase in the soil strength. The results were consistent with the resistance profiles of spudcan penetration into sand over clay reported by Hu [20]; however, in the predicted profiles, the soil resistance sharply reduced after reaching the peak value for the sand over clay, whereas the reduction is more subtle for stiff sand-over-NC clay.

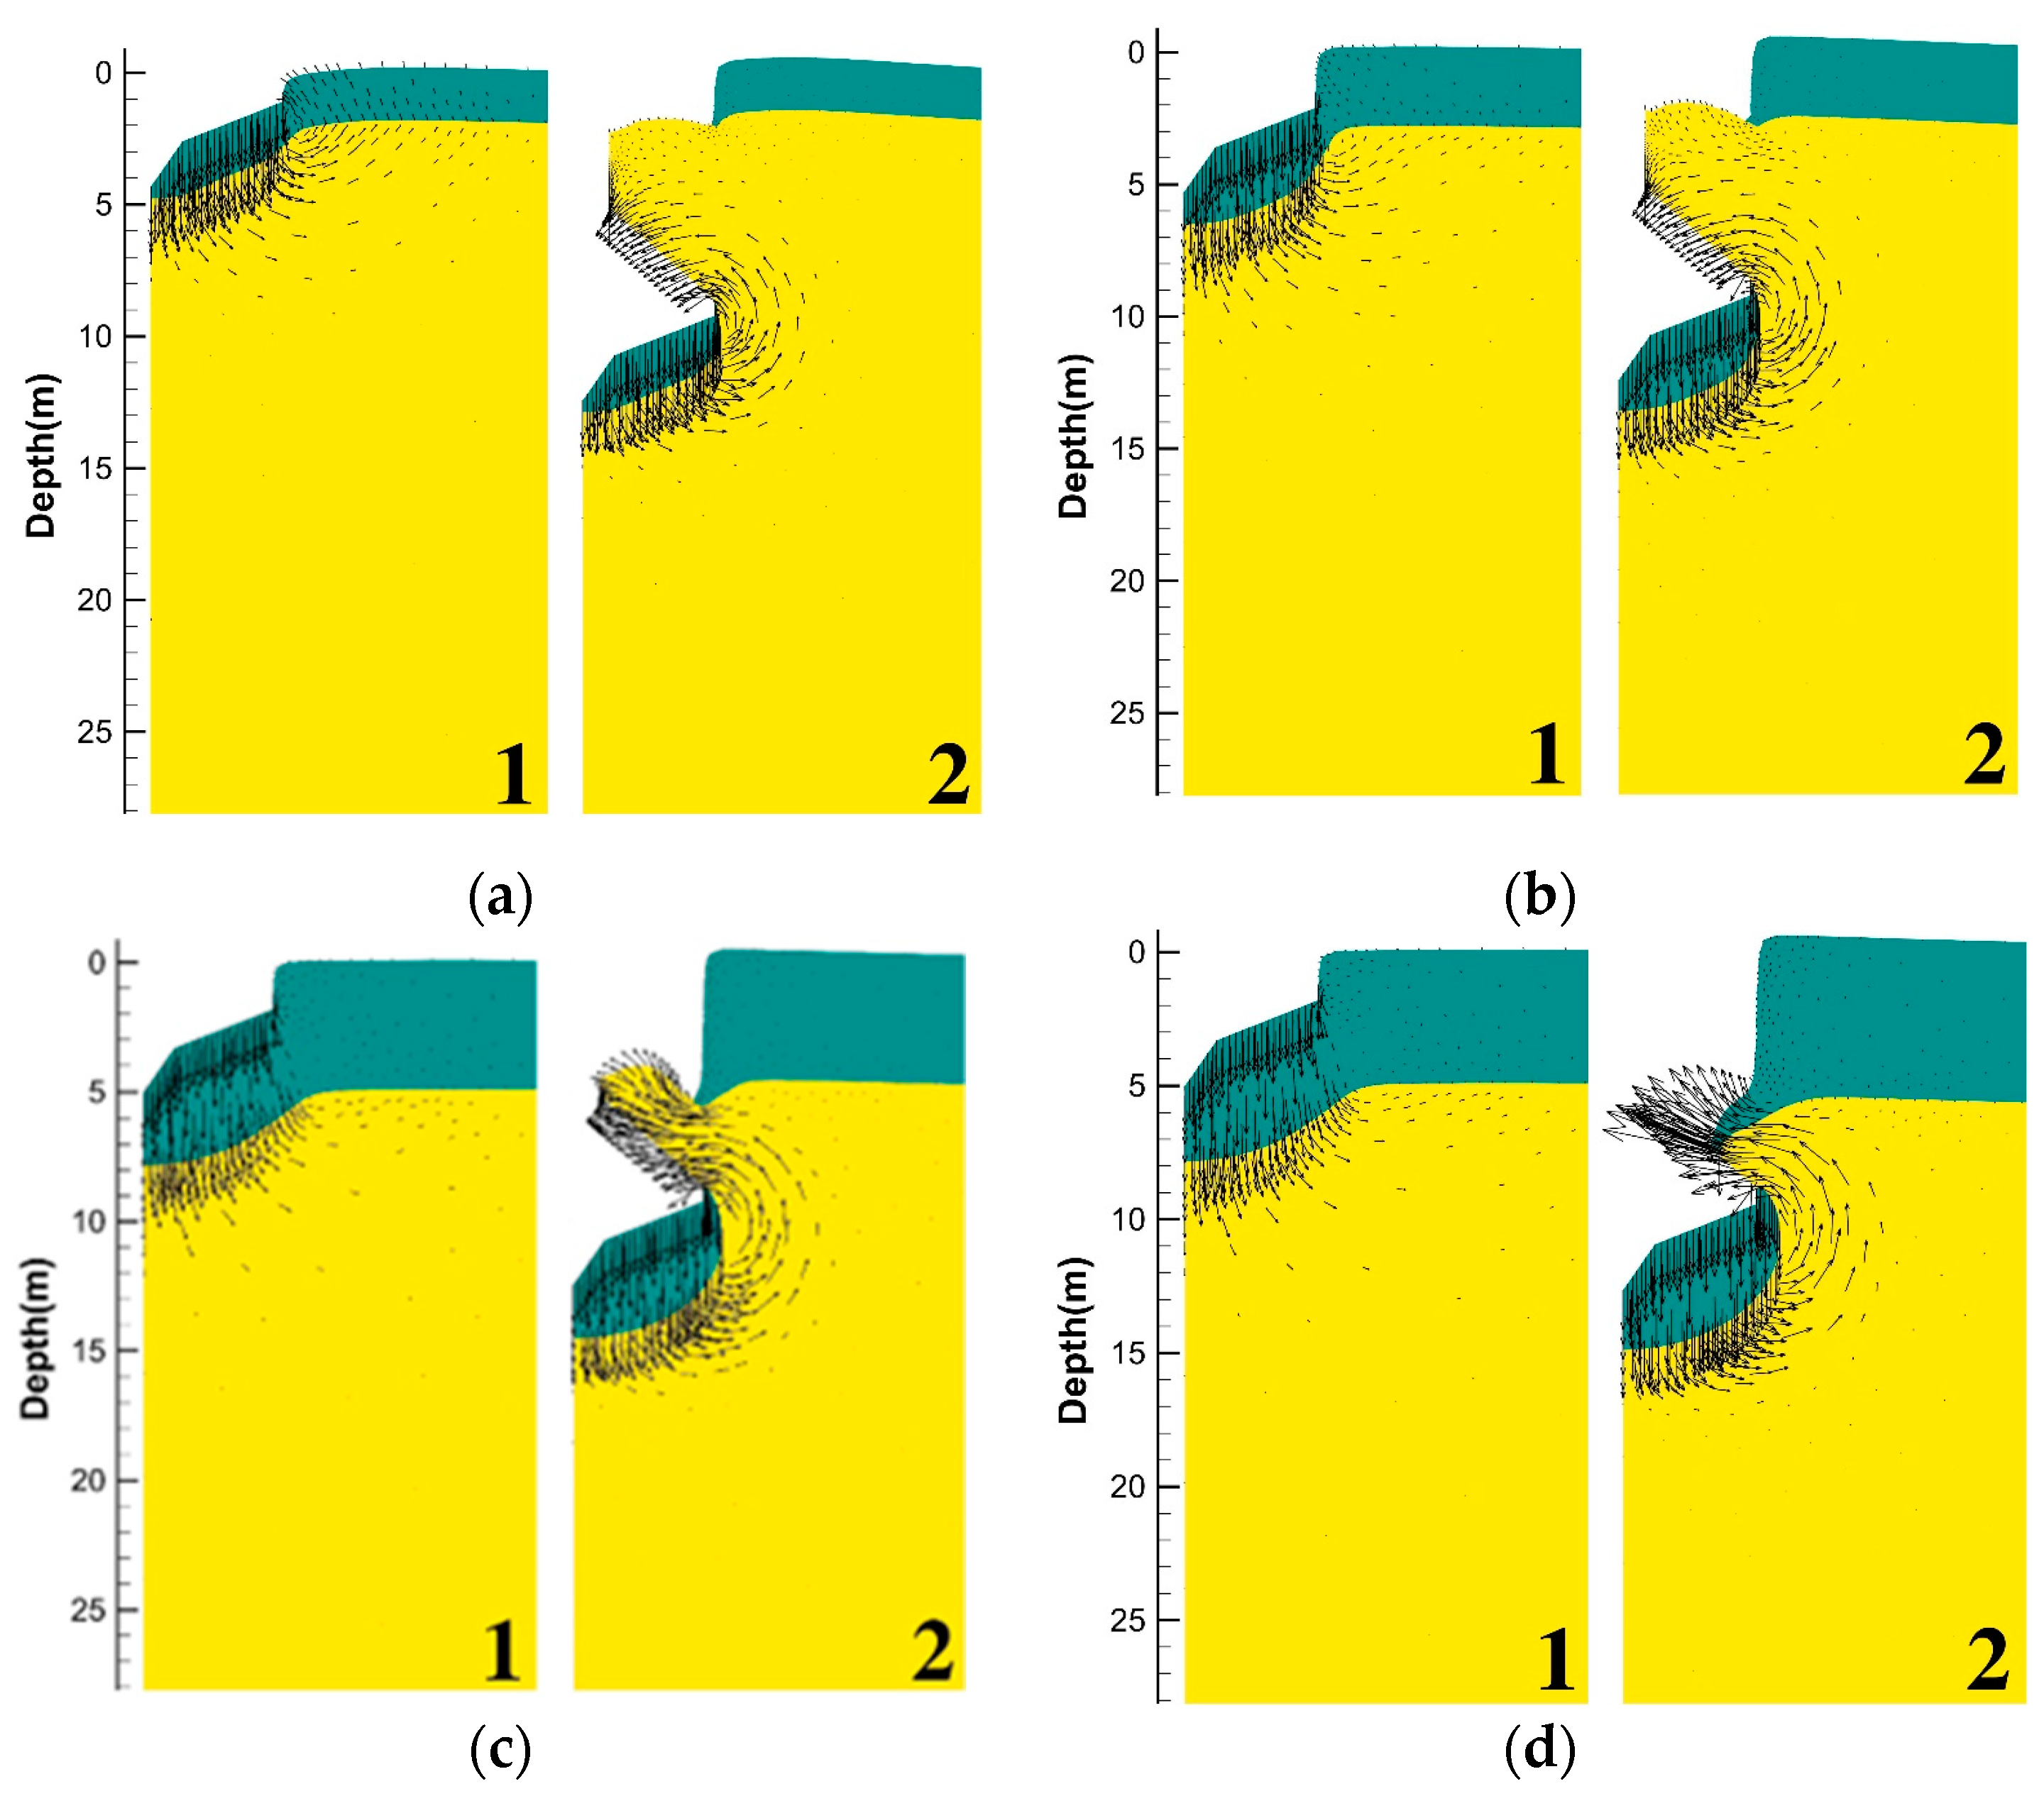
3.2. Influence of H/D

To explore the influence of H/D on the resistance to spudcan penetration into thin stiff-over-NC clay, four typical cases were designed by varying the depth from 5 m to 12.5 m (H/D = 0.2 to 0.6, sut/γ’D = 0.83, kD/sui = 1.2, sut/sui = 10, α = 0.3, and γ’ = 6 kN/m3; Group 3; Table 1). When the largest cross-sectional area of the spudcan reached the original location of the interface lines of the two layers (H/D = 0.2; Z = 5 and 12.5 m; Figure 9(a1,a2)), the top layer stiff clay tended to move vertically, and the bottom NC clay layer was mobilized because of the movement of the spudcan and the plug underneath, leading to vertical and horizontal movements. A cavity was formed in the top layer, and a preliminary soil backflow appeared in the bottom layer. With deeper penetration, the top layer stiff clay is cut through the rotational failure mechanism, leading to the flow of soft clay into the cavity and movement toward the shaft, thereby stabilizing the cavity and changing the orientation of the top stiff clay to vertical.
The thickness of the plug increased with increasing top-layer thickness. In the thin top layer (typically less than 5 m, with H/D < 0.5), the thickness of the plug increased linearly; this finding is consistent with the results for the sand over clay obtained through numerical simulations and centrifuge tests [21]; however, when the top layer thickness was considerably large, the plug thickness stabilized and tended to a maximum value, as demonstrated through centrifuge tests; however, the case with considerably large thickness of the top layer was beyond the scope of this study.

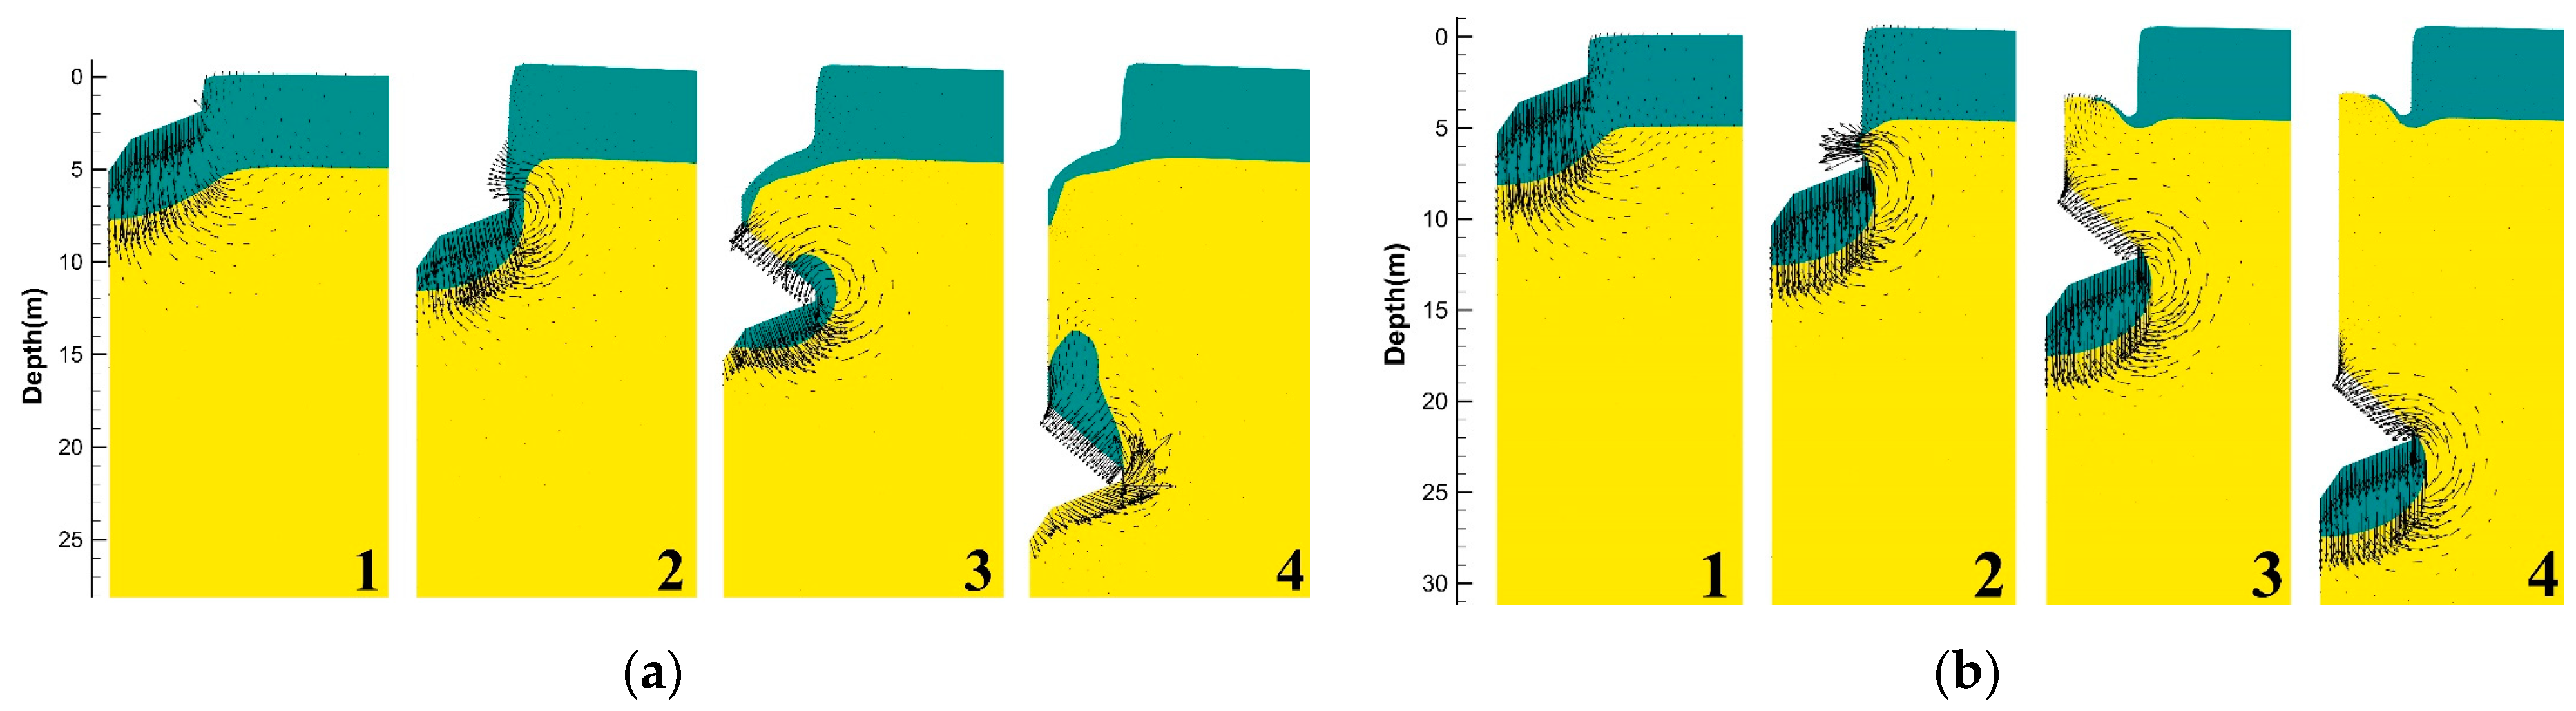
3.3. Influence of sut /γ’D

To explore the influence of sut/γ’D on the failure due to the spudcan penetration into thin stiff-over-NC clay; two typical cases were designed by varying the depth from 5 to 25 m (H/D = 0.5, sut/γ’D = 0.5, 1, kD/sui = 1.2, sut/sui = 10, α = 0.3 and γ’ = 6 kN/m3; Group 3, Table 1). The failure mechanism in the four stages of soil movement and the plug evolution are illustrated in Figure 10a. With initial penetration, in case of the top layer with lower strength, sut/γ’D = 0.5 (Z = 5 m; Figure 10(a1)), the soil underneath the spudcan tended to move downward with a slight horizontal displacement, causing the heave to increase. With deeper penetration, the bottom NC clay layer was mobilized because of the advancing movement of the spudcan and the plug. When the spudcan was fully embedded in the bottom layer (Z = 10 m; Figure 10(a2)), the underlying NC clay exhibited backflow through rotational soil flow, and the plug tended to gradually move upwards and above the spudcan (Figure 10(a3)). Furthermore, the top uniform clay flowed down, filled the cavity, reached the shaft of the spudcan, and finally stabilized. With further spudcan penetration (sut /γ’D = 0.5; Z = 25 m; Figure 10(a4)), the soil plug gradually disappeared because of the trapped stiff soil flowing around and moving onto the spudcan to gradually fill the gap. The previous soil plug would eventually disappear, and the stiff clay would appear on the top side wall of the spudcan, resulting in the formation of a new soil plug.
However, the stiffer top layer clay (sut/γ’D = 1) exhibited a different soil flow mechanism with sut /γ’D = 0.5. With initial penetration (Z < 5 m; Figure 10(b1)), a stand wall formed in the stiff layer because of higher stiffness, and the bottom layer soil underneath the spudcan was mobilized to flow downward and in the horizontal direction. With deeper penetration (Z = 10 m; Figure 10(b2)), the soft NC-clay cut the top stiff layer and started filling the cavity through rotational soil flow, indicating that the soil plug was completely formed and stable. With further penetration of the spudcan (Z = 15 m; Figure 10(b3)), the underlying NC clay formed a heave on the surface and reached the shaft of the spudcan; the different stages of soil plug evolution has also been demonstrated in the figure. Even with deeper penetration (Z = 25 m; Figure 10(b4)), the trapped stiff uniform clay did not flow onto the spudcan for sut /γ’D = 1; however, this did not indicate that the soil plug would remain stable underneath the spudcan. When the spudcan penetrated deeper, with increasing sub, the soil plug tended to flow upward because sub was higher than sut; this is not depicted in Figure 10 because such a penetration depth is not required in practical applications (typically penetrating depths range within 15–30 m).
The different normalized top stiff shear strengths indicated different types of soil plug formation. With larger normalized strength of the top stiff layer, the plug underneath the spudcan stabilized at depths within the practical range for engineering applications; the clay flowed upward at a sufficient depth and finally formed a new plug over the spudcan—sub increased to a higher value than that of sut. For the top stiff layer with lower normalized strength, the trapped soil flowed upward and formed a new plug above the spudcan because the soil underneath the spudcan moved above the spudcan with rotational flow when the strength of the plug was roughly identical to that of the surrounding soil; this is consistent with the findings of Hossain and Randolph [19].

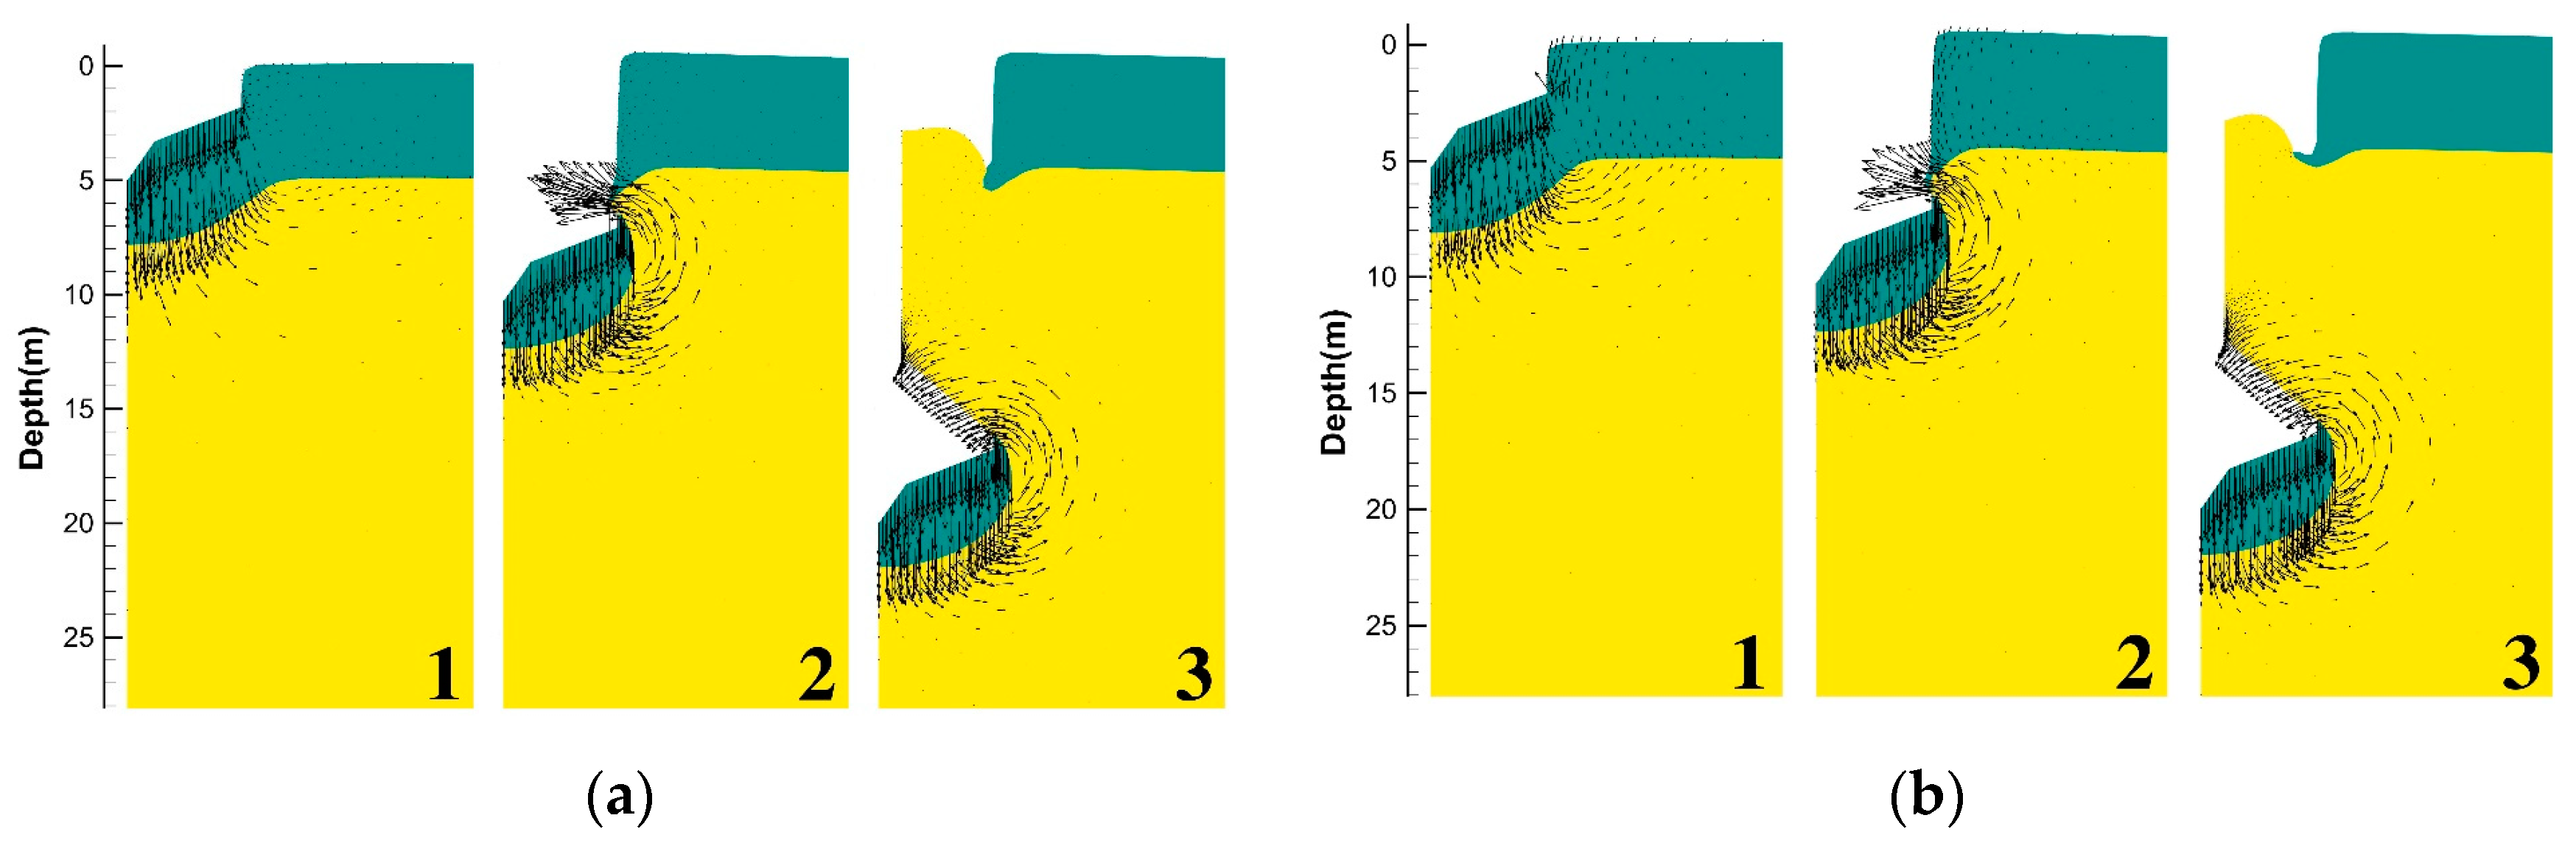
3.4. Influence of kD/sui

To investigate the influence of the k (the gradient strength of the bottom layer) on the soil flow mechanism, two analyses were performed by varying k and Z with kD/sui = 1.2 and 4, Z = 10 m and 20 m; other parameters were identical to those in the standard case of H/D = 0.5, sut/γ′ D = 0.83, sut/sui = 10, α = 0.3, and γ’ = 6 kN/m3 (Group 5; Table 1). The soil profile of kD/sui = 1.2 exhibited nearly the same flow mechanism as that of kD/sui = 4 (Z = 5 m) when the spudcan penetrated the top layer (Figure 11(a1,b1)). When the spudcan penetrated the bottom layer (Figure 11(a2,b2)), with larger kD/sui, the plug tended to rapidly flow back onto the above of the spudcan because the shear strength of the trapped soil was nearly identical to that of the soil surrounding the plug in the bottom of the NC clay; however, when kD/sui was lower, deeper penetration depth was required to facilitate the backflow of the soil to the top of the spudcan because the strength of the NC clay surrounding the spudcan was not sufficiently high to squeeze the trapped stiff clay. When the spudcan penetrated deeper (Figure 11(a3) and Figure 10(b3)), trapped soil flowed upward and filled the gap above the spudcan, forming a new plug for kD/sui = 4 while the soil plug remained stable for kD/sui = 1.2; however, with deeper penetration (out of practical engineering range), the soil plug underneath the spudcan disappeared because the trapped soil gradually flowed upward with increasing sub. Furthermore, a new plug was formed above the spudcan.

3.5. Influence of sut/sui

To explore the influence of the soil strength ratio on the soil flow mechanism, cases with the standard soil strength ratio sut/sui = 10 and 3.33 were designed (Group 6) with identical parameters (H/D = 0.5, sut/γ′ D = 0.83, kD/sui = 1.2, α = 0.3 and γ’ = 6 kN/m3; Group 6, Table 1). For sut/sui = 10, with initial penetration (Z = 5 m; Figure 12(a1)), the top layer stiff clay tended to move vertically, and the bottom NC clay was mobilized by the above stiff clay, thereby causing vertical and slightly horizontal movements; a cavity was also formed. With deeper penetration (Z = 10 m; Figure 12(a2)), the bottom NC clay exhibited rotational backflow, gradually filling the gap and causing the complete formation of a soil plug. With further penetration (Z = 20 m; Figure 12(a3)), a soil heave on the surface of the top stiff clay layer and a new cavity were observed. Furthermore, the soil plug underneath the spudcan tended to move onto the spudcan, indicating that a new plug would be formed above the spudcan at sufficient depth. For sut/sui = 3.33, with initial penetration (Z = 5 m; Figure 12(b1)), the soil failure mechanism was similar to that for sut/sui = 10. With deeper penetration (Z = 10 m; Figure 12(b2)), the bottom NC clay exhibited rotational backflow but without cutting the top stiff clay. Besides, the entire soil plug was formed. With further penetration (Z = 20 m; Figure 12(b3)), a new cavity was observed, but no soil heave occurred; meanwhile, the trapped uniform clay flowed onto the spudcan, forming a new plug. Thus, sut/sui has a significant influence on the soil flow mechanism and thus influenced the hmax of the soil plug, which is similar to the behavior of ball penetrometers in uniform double-layer clay reported by Zhou [31]; that is, strength ratio has a significant influence on the failure mechanism.

3.6. Influence of α

To examine the influence of the coefficient of friction between the spudcan and the soil on the spudcan penetration behavior in doubled-layered soil, one case was designed (α = 0.2–0.8, H/D = 0.5, sut/γ’D = 0.83, kD/sui = 1.2, sut/sui = 10, and γ’ = 6 kN/m3; Group 7 in Table 1) by varying the depth from 5 to 20 m. The soil flow mechanism for α = 0.8 (Figure 13a) was nearly the same as that for α = 0.3 (Figure 13b), indicating that the coefficient of friction had minimal influence on the soil flow mechanism and hmax of the soil plug.

4. Discussion

4.1. Evolution of the Soil Failure Mechanism

Figure 14 depicts the evolution of the soil failure mechanism using two patterns. In failure mechanism type 1, when the spudcan began penetrating the top stiff soil (Figure 14(a1)), the bottom NC clay rapidly bended downward under applied pressure. The top uniform clay and a major portion of the NC clay flowed vertically, and a small part of the NC clay flowed horizontally. With further penetration (Figure 14(a2)), when the spudcan initially penetrated the bottom layer, the NC clay started to flow back gradually, but no obvious rotational backflow was observed. Simultaneously, the bottom NC clay layer was compressed by the top stiff layer, resulting in the preliminary formation of a soil plug. When the largest area of spudcan was below the original location of the interface between the two layers (Figure 14(a3)), most of the bottom NC clay flowed back to the upper side wall of the spudcan, resulting in critical rotational backflow, cut the top stiff soil layer, filled the cavity, and reached the shaft of the spudcan. The shape of the trapped top stiff uniform clay underneath the spudcan was stable, indicating that the entire soil plug was formed; meanwhile, a soil heave and a new cavity started forming because of the NC clay flowing onto the spudcan upper side wall. When the spudcan completely penetrated to a certain depth (Figure 14(a4)), only critical rotational backflow occurred, indicating that the entire soil heave was formed. Stage 4 represented the largest penetration depth of the spudcan in practical applications; however, with deeper penetration (Figure 14(a5)), the soil trapped underneath the spudcan tended to flow upward and the soil plug gradually disappeared with increasing sub. When the spudcan penetrated even deeper (Figure 14(a6)), the previous soil plug eventually disappeared, and a new plug was formed above the spudcan.
In the soil failure mechanism type 2, the first two steps were similar to those in the failure mechanism type 1 (Figure 14(b1,b2)). With deeper penetration (Figure 14(b3)), unlike the influence of the cutting of the top stiff layer, the bottom NC clay flowed vertically and horizontally without rotational backflow, thereby leading to the enlargement of the cavity. Furthermore, the trapped stiff clay moved down vertically. With further penetration (Figure 14(b4)), the trapped stiff uniform clay flowed onto the spudcan, leading to the formation of a new soil plug above the spudcan. The vectors in the figure indicate that the NC clay under the spudcan moved vertically downward, and the NC clay at the boundary of the largest area of the spudcan flowed with a rotational backflow; moreover, the top stiff clay flowed down, reached the shaft of the spudcan, and covered the bottom NC clay layer, indicating the complete formation of a stable cavity with a triangular bottom.

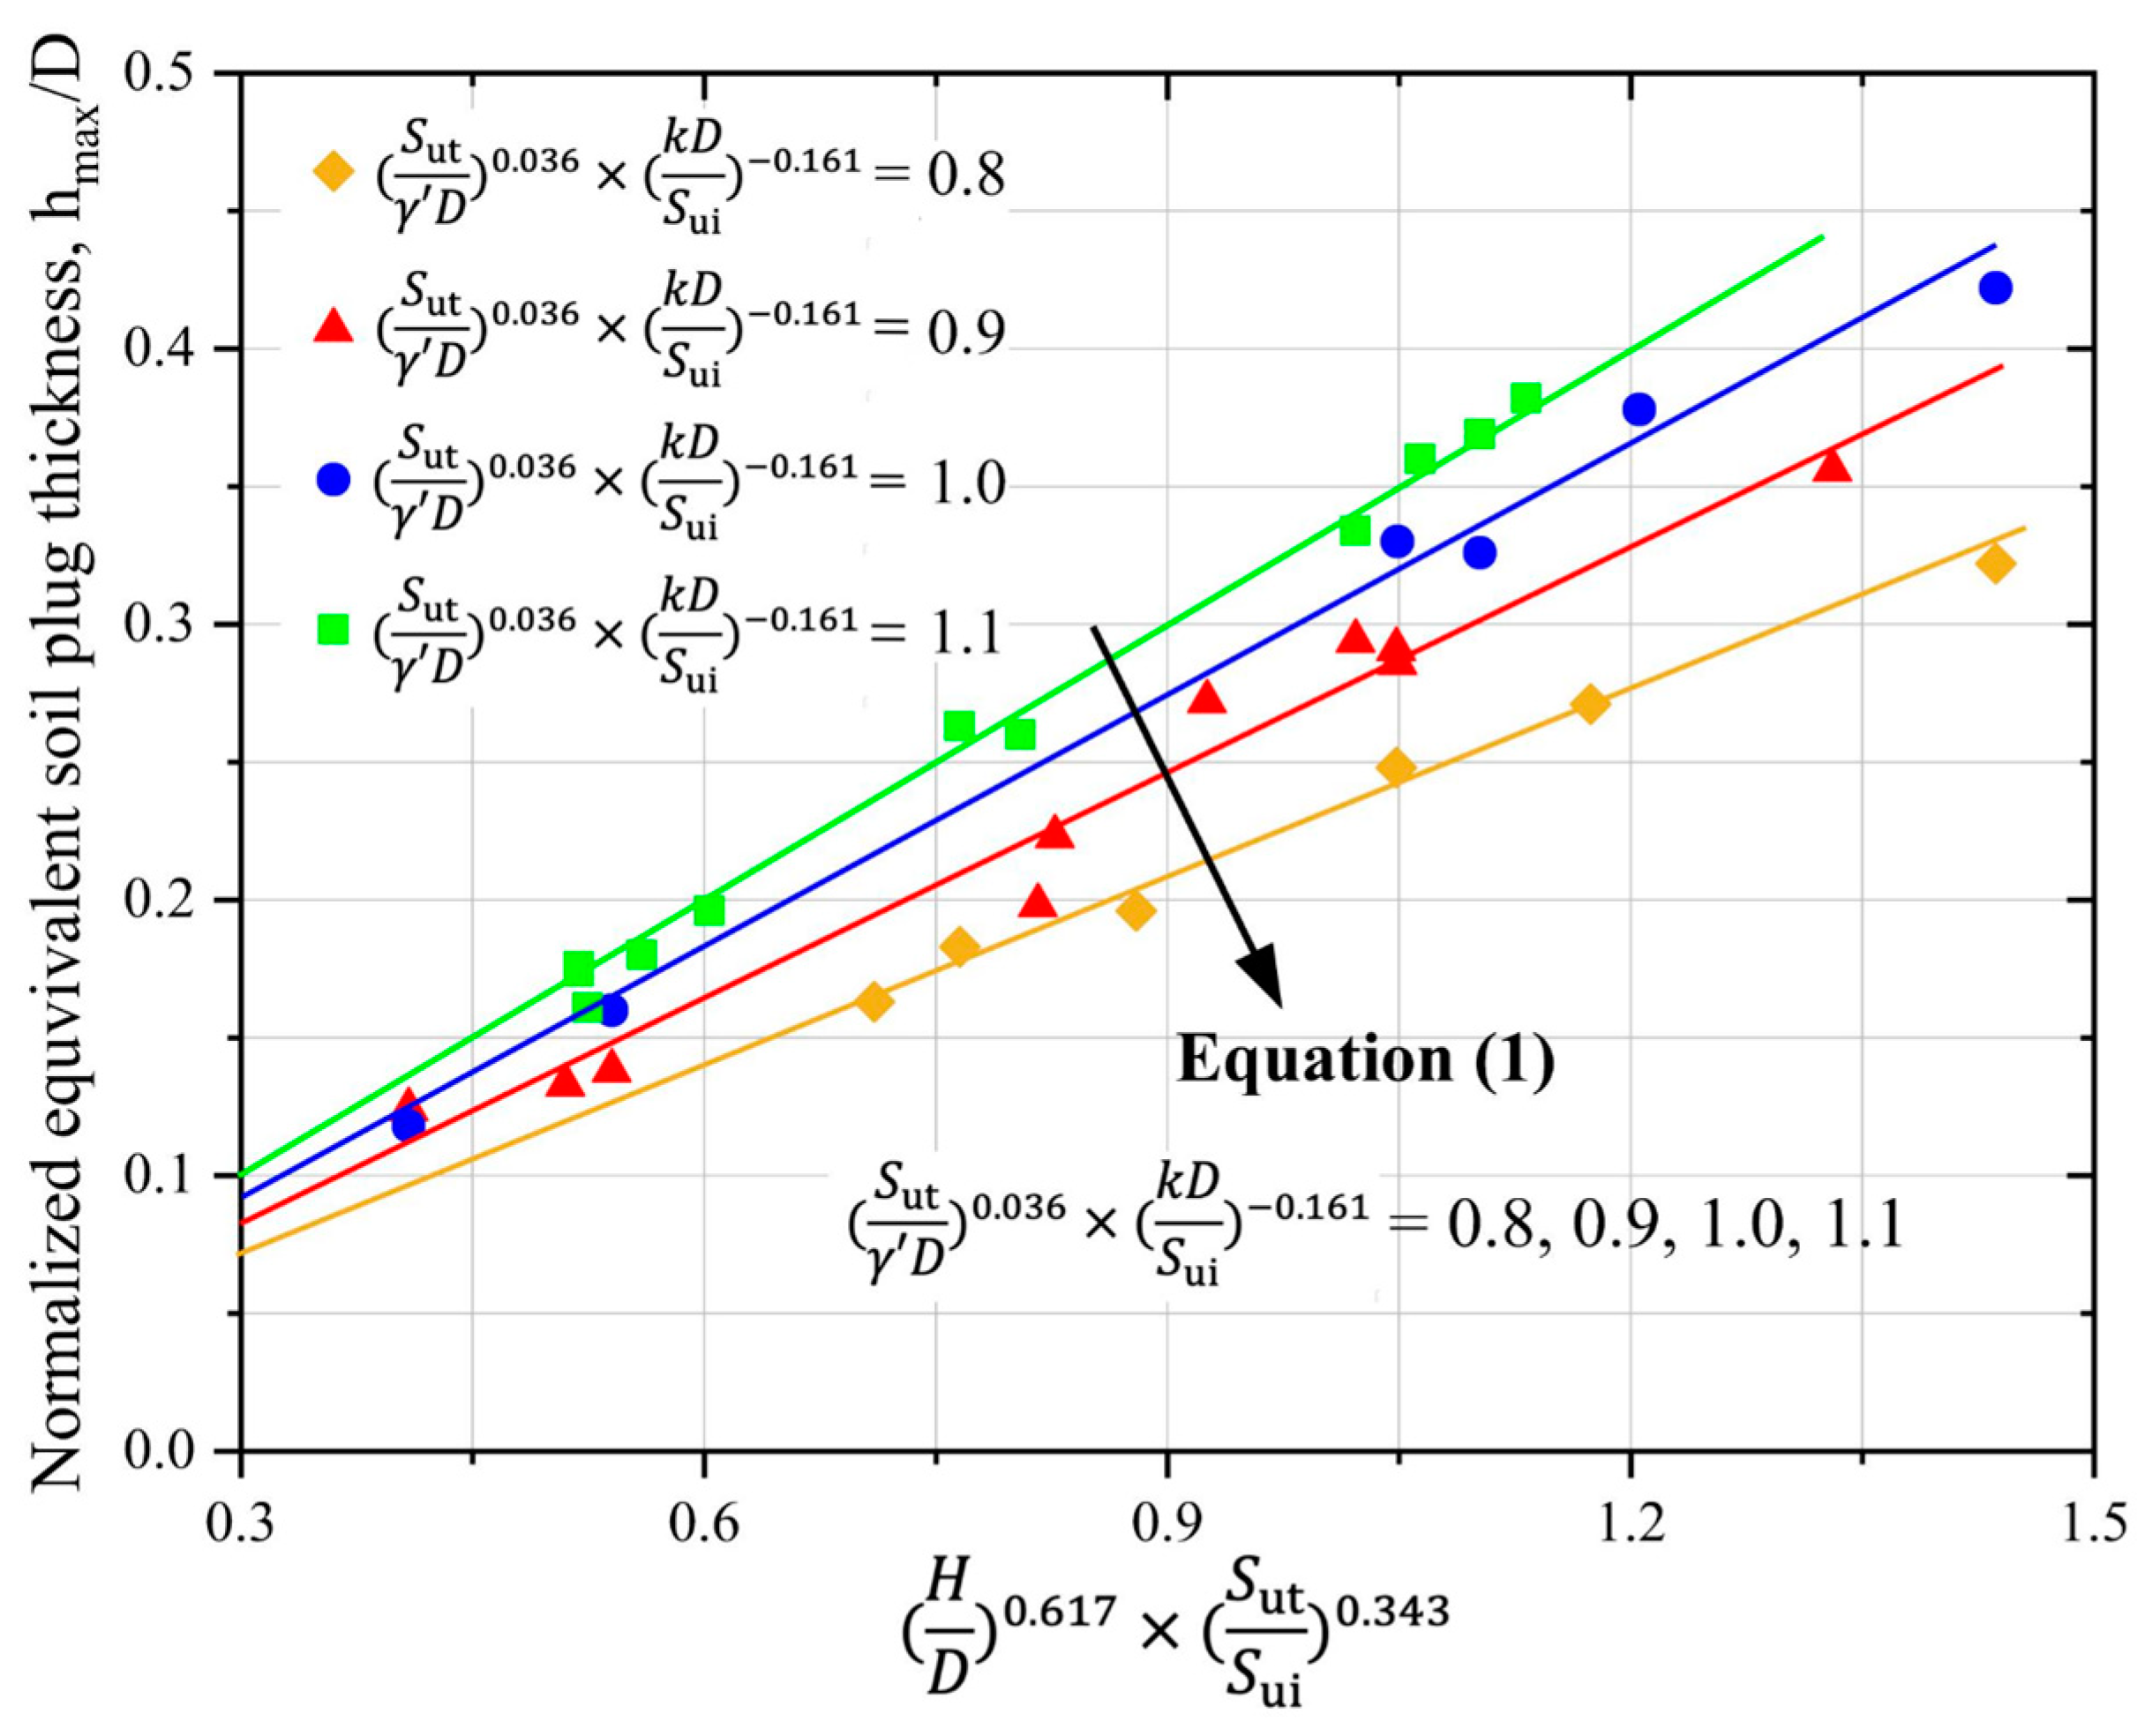
4.2. hmax of Trapped Soil

This study considered the maximum thickness of soil plug underneath the spudcan because of its contribution to the increase in soil resistance. The maximum thickness of the soil plug above the spudcan was not taken into account. Based on the aforementioned analyses, the main factors influencing soil plug with thin stiff-over-NC clay were the thickness of the top thin stiff clay layer (H/D), normalized top layer soil strength (sut/γ′D), shear strength ratio (sut/sui) of the layer, and strength gradient of the bottom layer (k). Therefore, an approximate expression was established to predict the maximum thickness of the soil plug (hmax/D) in thin stiff-over-NC clay using a function of H/D, sut/γ′D, sut/sui, and k, as depicted in (1) (R2 = 0.9). The prediction curves plotted using (1) and the corresponding numerical analysis results are displayed in Figure 15. The predictions using (1) and the LDFE analysis were basically correlated with a linear function of one variable, indicating that the results were consistent.
( h max D ) = 0.303 × ( H D ) 0.617 × ( s ut γ D ) 0.036 × ( s ut s ui ) 0.343 × ( k D s ui ) 0.161  
This study covered large practical ranges of spudcan dimensions (D = 10 m) for offshore applications involving thin stiff-over-NC clay (H/D = 0.2–0.6, sut/γ′D = 0.33–1, sut/sui = 1.33–10, k = 0.6–2), and the soil plug corresponded less than 0.5D. For any spudcan design and soil profiles outside the range considered in this study, the prediction formulas should be used with caution.

5. Conclusions

This study investigated the characteristics of soil plugs formed during the spudcan penetration into double-layer thin stiff-over-NC clay through extensive parametric LDFE analyses. The results indicated that soil strength, top layer thickness, soil strength ratio, and rate of the increase in the strength of the bottom layer soil have significant influence on soil flow mechanisms in thin stiff-over-NC clay. A soil failure mechanism and corresponding prediction model for the size of the soil plug were established as a foundational framework for the design of spudcan footings, which penetrate thin stiff-over-NC clay, for jack-up vessels for offshore wind turbines. The established model can be used to effectively predict the maximum thickness of the soil plug in deep locations, as validated experimentally and against previous reports. Future studies are warranted to investigate the relationship between bearing capacity and soil plug formation. The findings of this study provide a guidance for the evolutionary mechanism of the shape and dimension of the plug when spudcan penetration into the thin stiff clay over NC clay, which can interpolate the penetration resistance of spudcan in the bottom NC clay; however, the previous work mainly focused on the plug issue for sand over clay, which aimed to provide better understanding of the peak resistance.

Author Contributions

Conceptualization, M.Z. and D.W.; methodology, S.X.; software, S.X.; validation, X.W.; formal analysis, S.X.; investigation, S.X.; resources, M.Z.; data curation, W.P.; writing—original draft preparation, S.X.; writing—review and editing M.Z.; visualization, S.X.; supervision, M.Z.; project administration, M.Z.; and W.P.; funding acquisition, M.Z.; and W.P. All authors have read and agreed to the published version of the manuscript.

Funding

The completion of this work was supported by Special Fund Project of Six Major Marine Industries in 2022 (GDNRC[2022]27), Key-Area Research and Development Program of Guangdong Province (NO.2020B0101130009), and Guangdong Enterprise Key Laboratory for Urban Sensing, Monitoring and Early Warning (No.2020B121202019). These support are gratefully acknowledged.

Institutional Review Board Statement

Not applicable.

Informed Consent Statement

Not applicable.

Data Availability Statement

All data can be providing by contact with the corresponding author.

Conflicts of Interest

The authors declare no conflict of interest.

Notations

Ddiameter of spudcan
Hthickness of top layer(stiff soil)
hminthe minimum element size
hmaxmaximum thickness of soil plug
kgradient shear strength of bottom layer
K0geostatic stress condition
qusoil resistance of spudcan penetration
Rcoefficient of association
subundrained shear strength of bottom layer
suiundrained shear strength of interface
sutundrained shear strength of top layer
Zdepth below soil surface
αcoefficient of interface friction
γ′effective unit weight of soil
νPoisson’s ratio
φfriction angle
ψdilation angle

References

  1. Huang, Y.; Wan, D. Investigation of interference effects between wind turbine and spar-type floating platform under combined wind-wave excitation. Sustainability 2019, 12, 246. [Google Scholar] [CrossRef] [Green Version]
  2. Lian, J.; Cai, O.; Dong, X.; Jiang, Q.; Zhao, Y. Health monitoring and safety evaluation of the offshore wind turbine structure: A review and discussion of future development. Sustainability 2019, 11, 494. [Google Scholar] [CrossRef] [Green Version]
  3. Nassar, W.M.; Anaya-Lara, O.; Ahmed, K.H.; Campos-Gaona, D.; Elgenedy, M. Assessment of multi-use offshore platforms: Structure classification and design challenges. Sustainability 2020, 12, 1860. [Google Scholar] [CrossRef] [Green Version]
  4. Chou, J.-S.; Liao, P.-C.; Yeh, C.-D. Risk Analysis and Management of Construction and Operations in Offshore Wind Power Project. Sustainability 2021, 13, 7473. [Google Scholar] [CrossRef]
  5. Esteban, M.; Leary, D. Current developments and future prospects of offshore wind and ocean energy. Appl. Energy 2012, 90, 128–136. [Google Scholar] [CrossRef]
  6. Wei, Q.; Wu, B.; Xu, D.; Zargari, N. Overview of offshore wind farm configurations. In Proceedings of the IOP Conference Series: Earth and Environmental Science, Kunming, China, 22 September 2017; p. 012009. [Google Scholar]
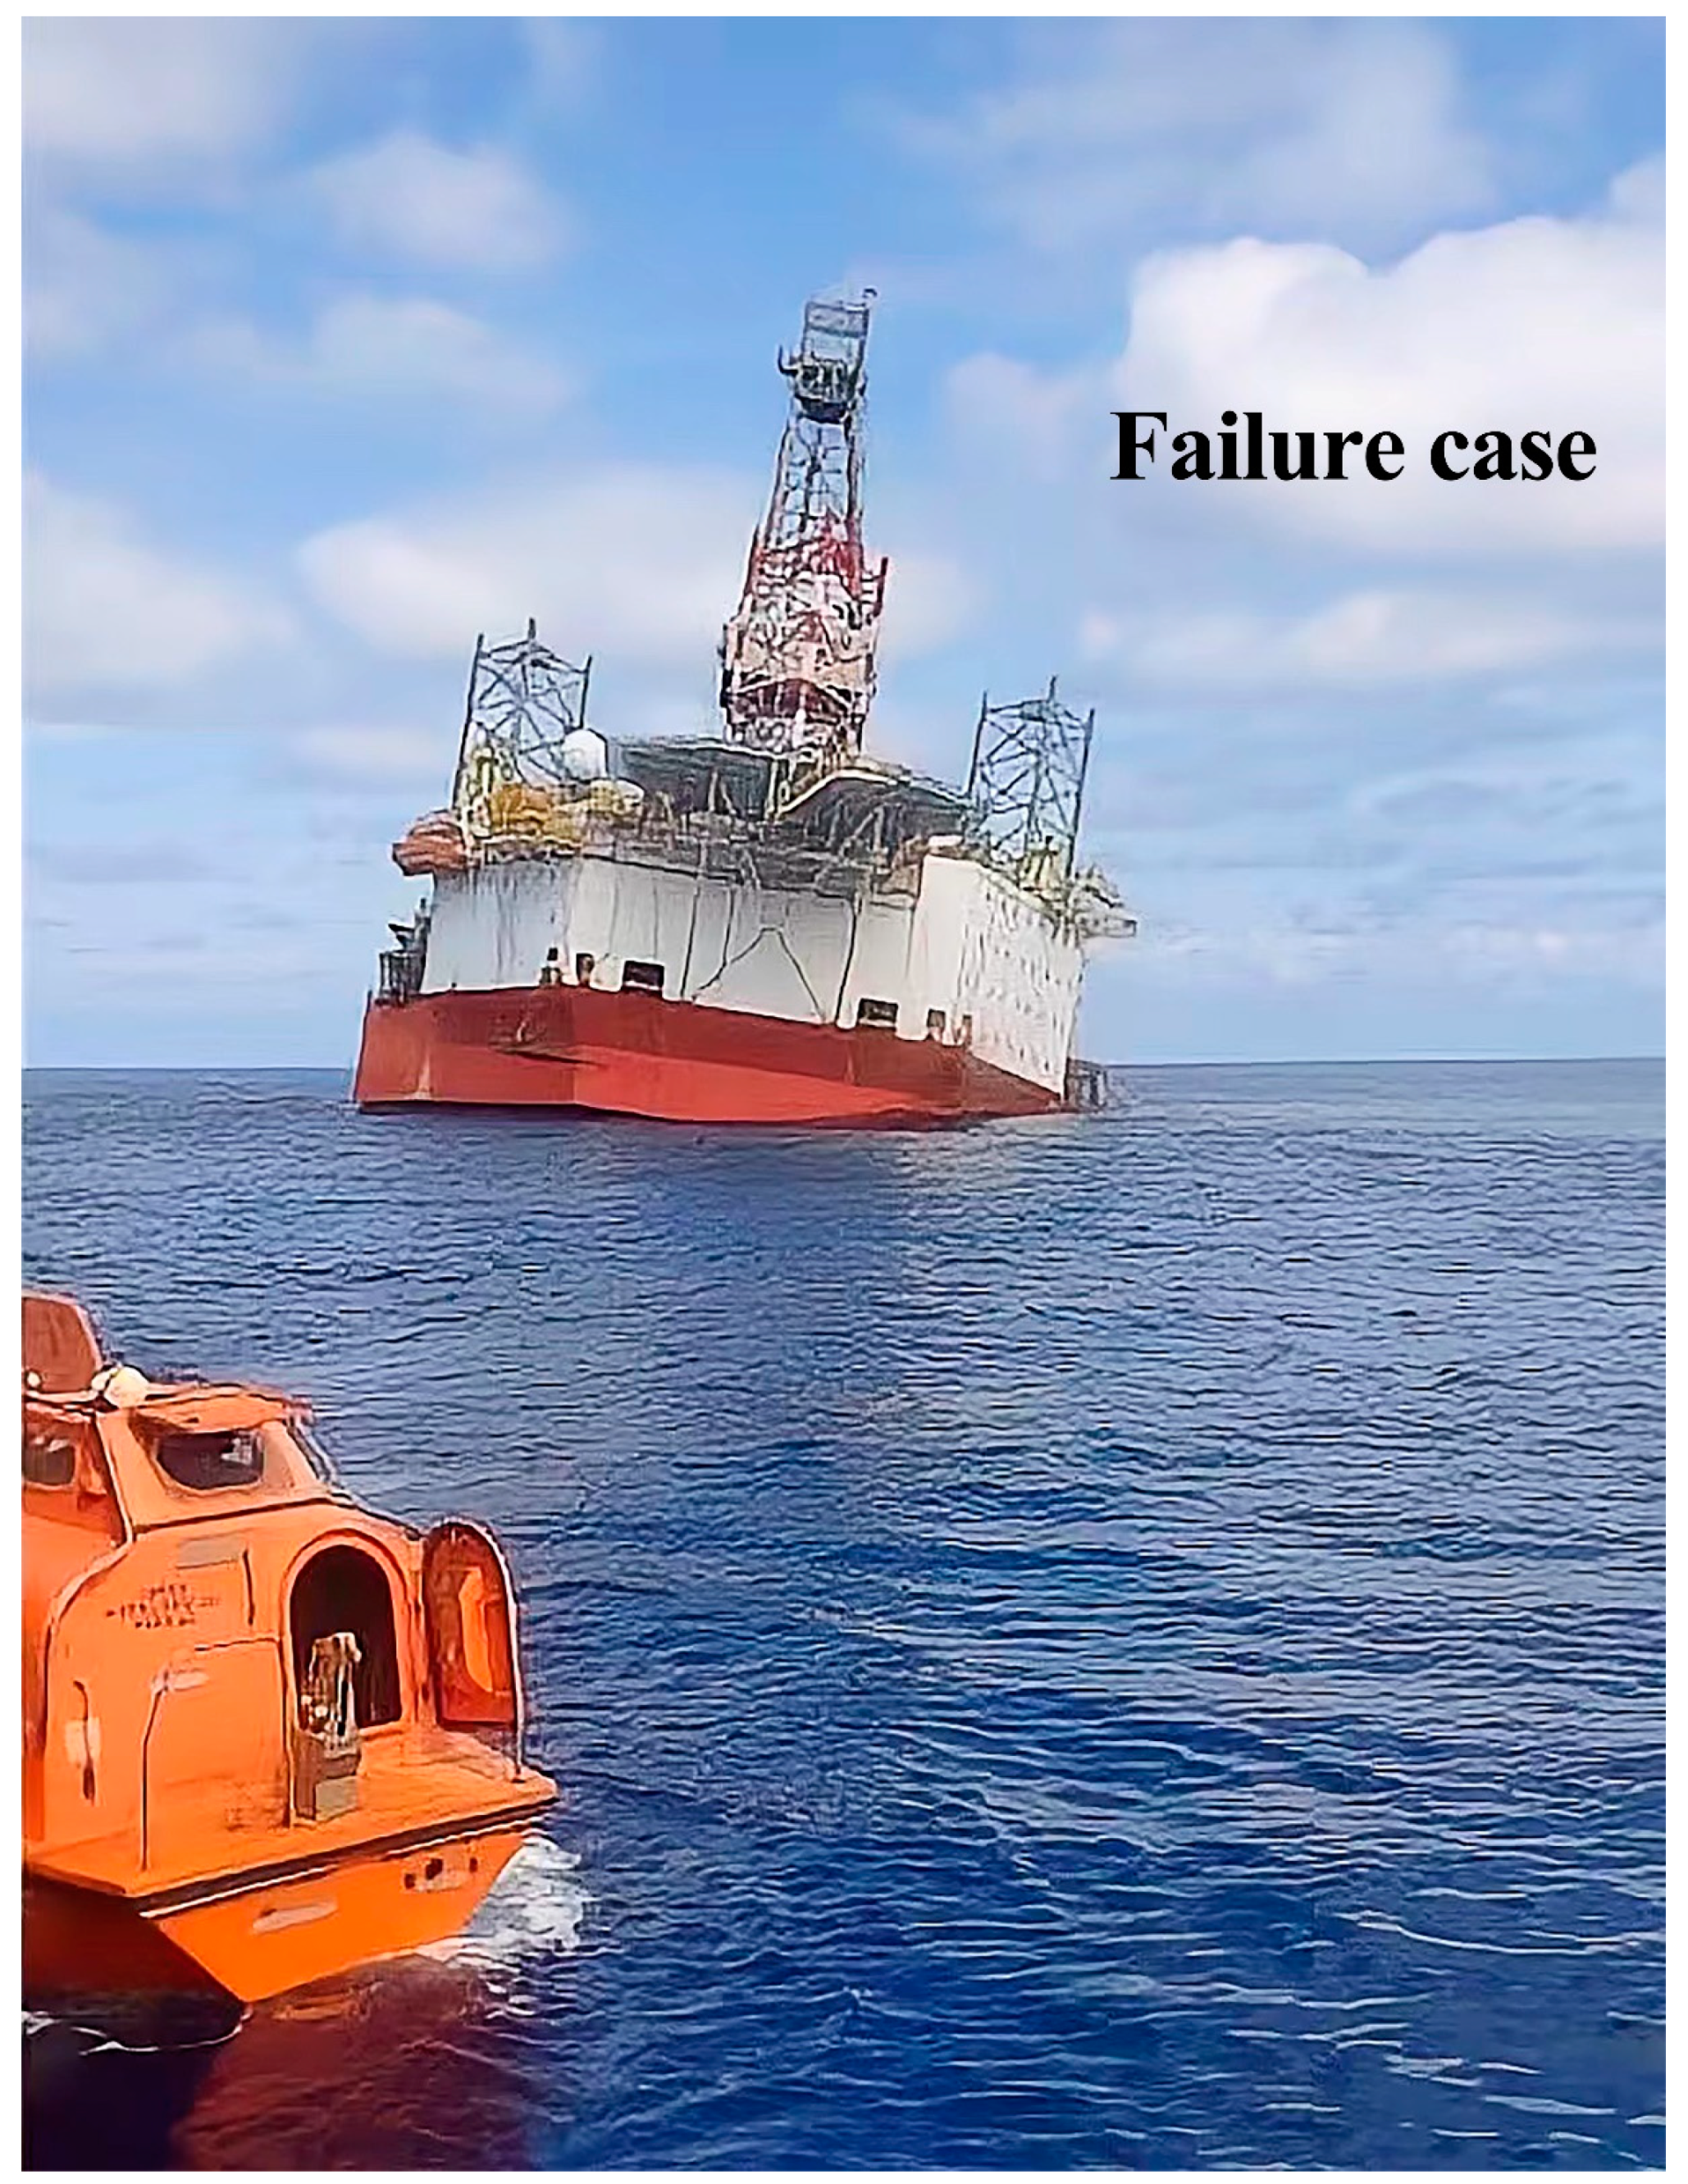
  7. Aust, T. Accident to the Mobile Offshore Drilling Unit Maersk Victory on November 16 1996; Mines and Energy Resources: Adelaide, Australia, 1997. [Google Scholar]
  8. Maung, U.M.; Ahmad, C.K.M. Swiss cheesing to bring in a jack-up rig at Anding location. In Proceedings of the IADC/SPE Asia Pacific Drilling Technology, Kuala Lumpur, Malaysia, 11 September 2000. [Google Scholar]
  9. Brennan, R.; Diana, H.; Stonor, R.; Hoyle, M.; Cheng, C.-P.; Roper, R. Installing jackups in punch-through-sensitive clays. In Proceedings of the Offshore Technology Conference, Houston, TX, USA, 1 May 2006. [Google Scholar]
  10. Teh, K.; Cassidy, M.; Leung, C.; Chow, Y.; Randolph, M.; Quah, C. Revealing the bearing capacity mechanisms of a penetrating spudcan through sand overlying clay. Géotechnique 2008, 58, 793–804. [Google Scholar] [CrossRef]
  11. Teh, K.; Leung, C. Centrifuge model study of spudcan penetration in sand overlying clay. Géotechnique 2010, 60, 825–842. [Google Scholar] [CrossRef]
  12. Zhao, J.; Jang, B.-S.; Duan, M. On spudcan deep penetration using Eulerian finite element in multi-layer sediments: Soil plug mechanism. Ships Offshore Struct. 2017, 12, 715–721. [Google Scholar] [CrossRef]
  13. Kaiser, M.J.; Snyder, B.F. Empirical models of jackup rig lightship displacement. Ships Offshore Struct. 2013, 8, 468–476. [Google Scholar] [CrossRef]
  14. Wu, H.L.; Chen, X.J.; Huang, Y.X.; Wang, B. Influence of the legs underwater on the hydrodynamic response of the multi-leg floating structure. Ships Offshore Struct. 2014, 9, 578–595. [Google Scholar] [CrossRef]
  15. Craig, W.; Chua, K. Deep penetration of spud-can foundations on sand and clay. Géotechnique 1990, 40, 541–556. [Google Scholar] [CrossRef]
  16. Hossain, M.; Hu, Y.; Randolph, M. Spudcan foundation penetration into uniform clay. In Proceedings of the Thirteenth International Offshore and Polar Engineering Conference, Honolulu, HI, USA, 25 May 2003. [Google Scholar]
  17. Hossain, M.S.; Randolph, M.F. New mechanism-based design approach for spudcan foundations on single layer clay. J. Geotech. Geoenviron. Eng. 2009, 135, 1264–1274. [Google Scholar] [CrossRef]
  18. Liu, J.; Hu, Y.-X.; Kong, X.-J. Deep penetration of spudcan foundation into double layered soils. China Ocean Eng. 2005, 19, 309–324. [Google Scholar]
  19. Hossain, M.S.; Randolph, M.F. Deep-penetrating spudcan foundations on layered clays: Numerical analysis. Geotechnique 2010, 60, 171–184. [Google Scholar] [CrossRef] [Green Version]
  20. Hu, P.; Wang, D.; Cassidy, M.J.; Stanier, S.A. Predicting the resistance profile of a spudcan penetrating sand overlying clay. Can. Geotech. J. 2014, 51, 1151–1164. [Google Scholar] [CrossRef]
  21. Zheng, J.; Hossain, M.S.; Wang, D. New design approach for spudcan penetration in nonuniform clay with an interbedded stiff layer. J. Geotech. Geoenviron. Eng. 2015, 141, 04015003. [Google Scholar] [CrossRef]
  22. Hossain, M.S.; Randolph, M.F. Deep-penetrating spudcan foundations on layered clays: Centrifuge tests. Geotechnique 2010, 60, 157–170. [Google Scholar] [CrossRef]
  23. Carter, J.; Balaam, N. AFENA Users’ Manual; Centre for Geotechnical Research, Department of Civil Engineering, University of Sydney: Sydney, Australia, 1995. [Google Scholar]
  24. Hu, Y.; Randolph, M. A practical numerical approach for large deformation problems in soil. Int. J. Numer. Anal. Methods Geomech. 1998, 22, 327–350. [Google Scholar] [CrossRef]
  25. Ghosh, S.; Kikuchi, N. An arbitrary Lagrangian-Eulerian finite element method for large deformation analysis of elastic-viscoplastic solids. Comput. Methods Appl. Mech. Eng. 1991, 86, 127–188. [Google Scholar] [CrossRef] [Green Version]
  26. Herrmann, L.R. Finite element analysis of contact problems. J. Eng. Mech. Div. 1978, 104, 1043–1057. [Google Scholar] [CrossRef]
  27. Hossain, M. Experimental investigation of spudcan penetration in multi-layer clays with interbedded sand layers. Géotechnique 2014, 64, 258–276. [Google Scholar] [CrossRef]
  28. Zhou, H.; Randolph, M.F. Numerical investigations into cycling of full-flow penetrometers in soft clay. Géotechnique 2009, 59, 801–812. [Google Scholar] [CrossRef]
  29. Bienen, B.; Qiu, G. Numerical analysis of large penetration of a cone and a large diameter footing into dense sand overlying clay. In Proceedings of the 14th International Conference of the International Association for Computer Methods and Advances in Geomechanics, Kyoto, Japan, 22 September 2014. [Google Scholar]
  30. White, D.; Take, W.; Bolton, M. Soil deformation measurement using particle image velocimetry (PIV) and photogrammetry. Geotechnique 2003, 53, 619–631. [Google Scholar] [CrossRef]
  31. Zhou, M.; Hossain, M.; Hu, Y.; Liu, H. Behaviour of ball penetrometer in uniform single-and double-layer clays. Géotechnique 2013, 63, 682–694. [Google Scholar] [CrossRef]
  32. Zhou, M.; Hossain, M.S.; Hu, Y.; Liu, H. Scale issues and interpretation of ball penetration in stratified deposits in centrifuge testing. J. Geotech. Geoenviron. Eng. 2016, 142, 04015103. [Google Scholar] [CrossRef] [Green Version]
  33. Wang, Y.; Hu, Y.; Hossain, M.S.; Zhou, M. Effect of trapped cavity mechanism on interpretation of T-Bar penetrometer data in uniform clay. J. Geotech. Geoenviron. Eng. 2020, 146, 04020078. [Google Scholar] [CrossRef]
Figure 1. Substantial structural damage of the jack-up vessel.
Sustainability 14 08618 g001
Figure 2. Jack-up vessel and spudcan foundation: (a) 3D model of the jack-up vessel; (b) geometrical shape of the spudcan.
Sustainability 14 08618 g002
Figure 3. Soil Profile.
Sustainability 14 08618 g003
Figure 4. Meshes at different penetration depths: (a) Z = 0 m; (b) Z = 5 m; (c) Z = 10 m; (d) Z = 25 m.
Sustainability 14 08618 g004
Figure 5. Model validation 1 against centrifuge test data: (a) Z/D = 0.38; (b) Z/D = 1.15.
Sustainability 14 08618 g005
Figure 6. Model validation 2 against centrifuge test data and LDFE test data [16,18].
Sustainability 14 08618 g006
Figure 7. Typical soil flow mechanism: (a) stiff over soft clay; (b) uniform clay; (c) NC-clay.
Sustainability 14 08618 g007
Figure 8. Typical soil resistance.
Sustainability 14 08618 g008
Figure 9. Influence of the thickness of the top thin stiff clay layer on soil flow mechanism: (a) H/D = 0.2; (b) H/D = 0.3; (c) H/D = 0.5; (d) H/D = 0.6.
Sustainability 14 08618 g009
Figure 10. Influence of the normalized top layer soil strength on soil flow mechanism: (a) sut/γ’D = 0.5; (b) sut/γ’D = 1.
Sustainability 14 08618 g010
Figure 11. Influence of the strength gradient of the bottom layer on soil flow mechanism: (a) kD/sui = 1.2; (b) kD/sui = 4.
Sustainability 14 08618 g011
Figure 12. Influence of the layer shear strength ratio on soil flow mechanism: (a) sut/sui = 10; (b) sut/sui = 3.33.
Sustainability 14 08618 g012
Figure 13. Influence of the coefficient of friction on soil flow mechanism: (a) α = 0.3; (b) α = 0.8.
Sustainability 14 08618 g013
Figure 14. Evolution of soil failure mechanism: (a) failure mechanism type 1; (b) failure mechanism type 2.
Sustainability 14 08618 g014
Figure 15. Performance of the design formula for a maximum thickness of soil plug formed during the spudcan penetration into thin stiff-over-NC clay.
Sustainability 14 08618 g015
Table 1. A summary of the LDFE analyses performed on different models of thin stiff-over-NC clay.
AnalysisH/Dsut/γ’DkD/suisut/suiαNotes
Group 110.4501.61Validation model 1
Group 210.3100.50.3Validation model 2
Group 30.2, 0.3, 0.5, 0.60.831.2100.3Investigation of the effect of the top layer thickness
Group 40.50.33, 0.5, 0.67, 0.83, 11.2100.3Investigation of the effect of the top layer shear strength
Group 50.50.831.2, 2, 4100.3Investigation of the effect of the gradient strength of the bottom layer
Group 60.50.831.210, 5, 3.330.3Investigation of the effect of the shear strength ratio
Group 70.50.831.2100.2, 0.3, 0.5, 0.8Investigation of the effect of the coefficient of friction
Group 80.2, 0.3, 0.5, 0.60.33, 0.5, 0.67, 0.83, 11.2, 2, 410, 5, 3.330.2, 0.3, 0.5, 0.8Random cases
Standard Group: H/D = 0.5, sut/γ’D = 0.83, kD/sui = 1.2, sut/sui = 10, α = 0.3. Constant: D = 10 m, γ’ = 6 kN/m3.
Publisher’s Note: MDPI stays neutral with regard to jurisdictional claims in published maps and institutional affiliations.

