Article

Phenotypic Variability of Wheat and Environmental Share in Soil Salinity Stress [3S] Conditions

1
Faculty of Agriculture, University of Novi Sad, Sq. Dositeja Obradovića 8, 21000 Novi Sad, Serbia
2
Institute Tamiš, Novoseljanski put 33, 26000 Pančevo, Serbia
3
Institute of Field and Vegetable Crops, Maksima Gorkog 30, 21000 Novi Sad, Serbia
*
Author to whom correspondence should be addressed.
Sustainability 2022, 14(14), 8598; https://doi.org/10.3390/su14148598
Submission received: 13 June 2022 / Revised: 9 July 2022 / Accepted: 11 July 2022 / Published: 14 July 2022
(This article belongs to the Special Issue Plant Breeding Supporting the Sustainable Field Crop Production)

Abstract

:
Through choosing bread wheat genotypes that can be cultivated in less productive areas, one can increase the economic worth of those lands, and increase the area under cultivation for this strategic crop. As a result, more food sources will be available for the growing global population. The phenotypic variation of ear mass and grain mass per ear, as well as the genotype × environment interaction, were studied in 11 wheat (Triticum aestivum L.) cultivars and 1 triticale (Triticosecale W.) cultivar grown under soil salinity stress (3S) during three vegetation seasons. The results of the experiment set on the control variant (solonetz) were compared to the results obtained from soil reclaimed by phosphogypsum in the amount of 25 t × ha−1 and 50 t × ha−1. Using the AMMI analysis of variance, there was found to be a statistically significant influence of additive and non-additive sources of variation on the phenotypic variation of the analyzed traits. Although the local landrace Banatka and the old variety Bankut 1205 did not have high enough genetic capacity to exhibit high values of ear mass, they were well-adapted to 3S. The highest average values of grain mass per ear and the lowest average values of the coefficient of variation were obtained in all test variants under microclimatic condition B. On soil reclaimed by 25 t × ha−1 and 50 t × ha−1 of phosphogypsum, in microclimate C, the genotypes showed the highest stability. The most stable genotypes were Rapsodija and Renesansa. Under 3S, genotype Simonida produced one of the most stable reactions for grain mass per ear.

1. Introduction

Wheat (Triticum sp.) is one of the most significant plant species worldwide. It has played an important role in the development of mankind, participating not only in human nutrition, but in the development of many human activities as well. There is a crucial need to improve the production of wheat for a growing population [1]. Wheat grain yield is a so-called super-trait, a highly quantitative trait that depends on many components that determine it, as well as on environmental factors [2,3,4,5].
Soil, as the medium for crop production, can be the limiting factor in crop establishment and in achieving an adequate yield [6]. This is mostly in reference to soils with high concentrations of different salt types. Representatives of such soils belong to halomorphic soils, among which is solonetz [7]. Due to their poor chemical and physical properties, these soils limit plant growth, and lead to reduced yields in arid and semi-arid areas [8,9,10]. For these reasons, there is a need to increase crop productivity in this type of soil, with the application of different management practices (primarily fertilization) by analyzing plants’ responses to applied measures. These actions would lead to increased wheat production and the development of cultivars that could be grown successfully in such conditions. Sairam, et al. [11], emphasized that there are a few identified bread wheat genotypes tolerant to 3S. In Serbia, however, there is a lack of commercial wheat cultivars for production on salt-affected soils. Some of the responses to abiotic stress include chromatin changes; possible phenotypic alterations are temporary, and sometimes return to baseline levels when non-stress conditions have been restored, if possible [12].
Considering that grain is the result of the plant’s tendency to reproduce, it can be said that the yield is a consequence of the total phenotype variation of a certain genotype for the purpose of reproduction. Since selection per yield is not possible in early generations of selection per se, phenotypic markers become more important in indirect selection per yield under abiotic stress conditions. This applies in particular to those traits that are highly quantitative, where the application of selection based on molecular markers (МАS—Marker-Assisted Selection) is difficult. Therefore, the successful breeder’s choice depends on the information on the genetic variability of each yield component [13]. Testing ear traits has a significant place in wheat breeding. Ear mass is the total mass of wheat generative plant part and, as a highly quantitative trait, it is inherited by the minor genes. This genes system allows significant phenotypic variation under the effect of environmental factors, which is most often reflected in significant genotype × environment interaction [4,14,15]. Grain mass per ear is a highly quantitative component of wheat phenotypic variability, and is a consequence of the minor genes’ activity [16,17]. Therefore, the degree of their activity is conditioned by mutual interaction and the effect of the environment [18]. Grain mass per ear is an influential component of wheat yield when grown on solonetz. Generally, salt stress affects plant metabolic processes by impairing cell water potential, membrane function, and uptake of nutrients, and in total reduces predicted crop yields [19].
Wheat grain yield and its components are under not only the influence, but also the interaction, of genotype and environmental factors (G × E interaction). A widely used multivariate method for studying G × E interaction is AMMI (Additive Main Effects and Multiplicative Interaction) [4,20,21,22]. This multivariate data analysis firstly calculates genotype and environmental effects (additive source of variation), using analysis of variance (ANOVA), and then analyzes residual effects (G × E interaction), using principal component analysis (PCA) [23]. Therefore, the AMMI method is an effective tool, because it considers a large part of the G × E sum of the squares, and provides an adequate interpretation of the genotypes’ stability [24].
Conducting the AMMI analysis in different agro-ecological environments, Petrović, et al. [25], Banjac, et al. [26], and Neisse, et al. [27], concluded that the multiplicative variation of ear characteristics and total grain yield was more pronounced than the additive variation, whereby genotypes with high specific stability in the given agro-ecological environments could be singled out as favorable. Therefore, experiments set up in different agro-ecological environments are of great importance in evaluating the stability of genotypes under varying environmental conditions [20,28].
The breeding process aims to improve the traits of existing cultivars, and to develop new genetic variability which will achieve the best possible economic effect. Therefore, the present study investigates the evaluation of the yield of wheat genotypes as a response to 3S. The objectives of this study were: (i) to evaluate ear mass and grain mass per ear of 11 wheat genotypes grown on salinity soil; (ii) to evaluate ear traits of those genotypes under different levels of reclamation; (iii) to compare the responses of important grain yield components to different growing conditions, and to identify genotypes with adequate traits for cultivation under stressed environments.
The findings of this research help to increase the economic worth of lower grade land by taking into account the ongoing degradation of arable lands caused by numerous variables of the modern age. This study helps to consider the possibility of growing wheat on solonetz after its repair by appropriate reclamation measures, and improves our understanding of how crops react to these types of stress, because solonetz does not provide favorable conditions for growing wheat, and is primarily used as a pasture. The study’s findings painted a clear picture of wheat behavior under the influence of climate change. These findings could help to produce new genetic diversity, but they also suggest that growing wheat in a low bonitet class of soil has a bioremediation function that increases the land’s economic worth, and also increases the area used for cultivating wheat.

2. Materials and Methods

2.1. Plant Material and Field Exams

Twelve genotypes were studied, including 10 cultivars, one local population of hexaploid (2n = 6× = 42) wheat (Triticum aestivum ssp. aestivum L.), and one cultivar of triticale (Triticosecale W.). The tested wheat cultivars included eight winter cultivars (Renesansa, Pobeda, Evropa 90, Novosadska rana 5, Dragana, Rapsodija, Simonida and Cipovka), while cultivar Nevesinjka was optional. Newer cultivars were also considered, in order to assess their utility in abiotic stress situations, which are mostly induced by soil type. Two older wheat genotypes, that were present in the Serbian area, were used in the experiment (Banatka and Bankut 1205, which originated from Hungary), as shown in Table 1. The sample was selected based on previous studies of the existing genetic variability [15,29,30]. Triticale cultivar Odisej was sown. Triticale was used as a test plant to determine how wheat tolerated the abiotic stress conditions, because it is a synthetic hybrid with a high degree of resistance to abiotic stress factors.
The experiment was set up in Banat (Autonomous Province of Vojvodina, Republic of Serbia) at Kumane site (45,539° N, 20,228° E, 72 m altitude), on stressed halomorphic soil of solonetz type, on an experimental area of 2 ha. The experiment was performed during three vegetation periods, marked as microclimate conditions A, B and C. A field trial was conducted according to randomized complete block design (RCBD), with three replications. The cultivars were sown in 155 m-long rows, using machines, with an interrow distance of 12.5 cm. Every cultivar was sown in 8 rows. During sowing, 134 kg × ha−1 of mineral fertilizer NPK 15:15:15 was applied. Depending on weather conditions, the crops were fertilized during vegetation seasons in late March or early April, using mineral fertilizer KАN in the amount of 200 kg × ha−1. A total of 30 plants per treatment were analyzed. They were represented by the primary stem (10 primary stems × 3 repetitions) in order to evaluate the phenotypic variation of the yield components: ear mass and grain mass per ear. In all vegetation seasons, the harvest was performed and samples were taken when caryopsis was hard (could no longer be dented by thumb-nail) at physiological maturity, Zadoks growth stage 92 [31]. Solonetz is a halomorphic soil with more than 15% sodium ion-Na+ adsorbed in the exchange complex. As a result, it is alkalized (pH > 9) and unfavorable for crops. The heavy mechanical composition of the compacted and impermeable Bt, na horizon severely limits solonetz’s production capability, as shown in Table 2, Figure 1.
The results from soil with two reclamation levels, from 25 t × ha−1 and 50 t × ha−1 of phosphogypsum, were processed in addition to the control results (soil without reclamation—natural pasture). The soil in the investigated plot was drained, to allow salts to leak into the neighboring drainage canals.
Each treatment was studied as a separate agro-ecological habitat for plant growth and development for one growing period. As a result, 9 alternative agro-ecological growing conditions were obtained, all of which were similar in terms of agro-technical circumstances, but differed in terms of phosphogypsum treatments (Table 3).
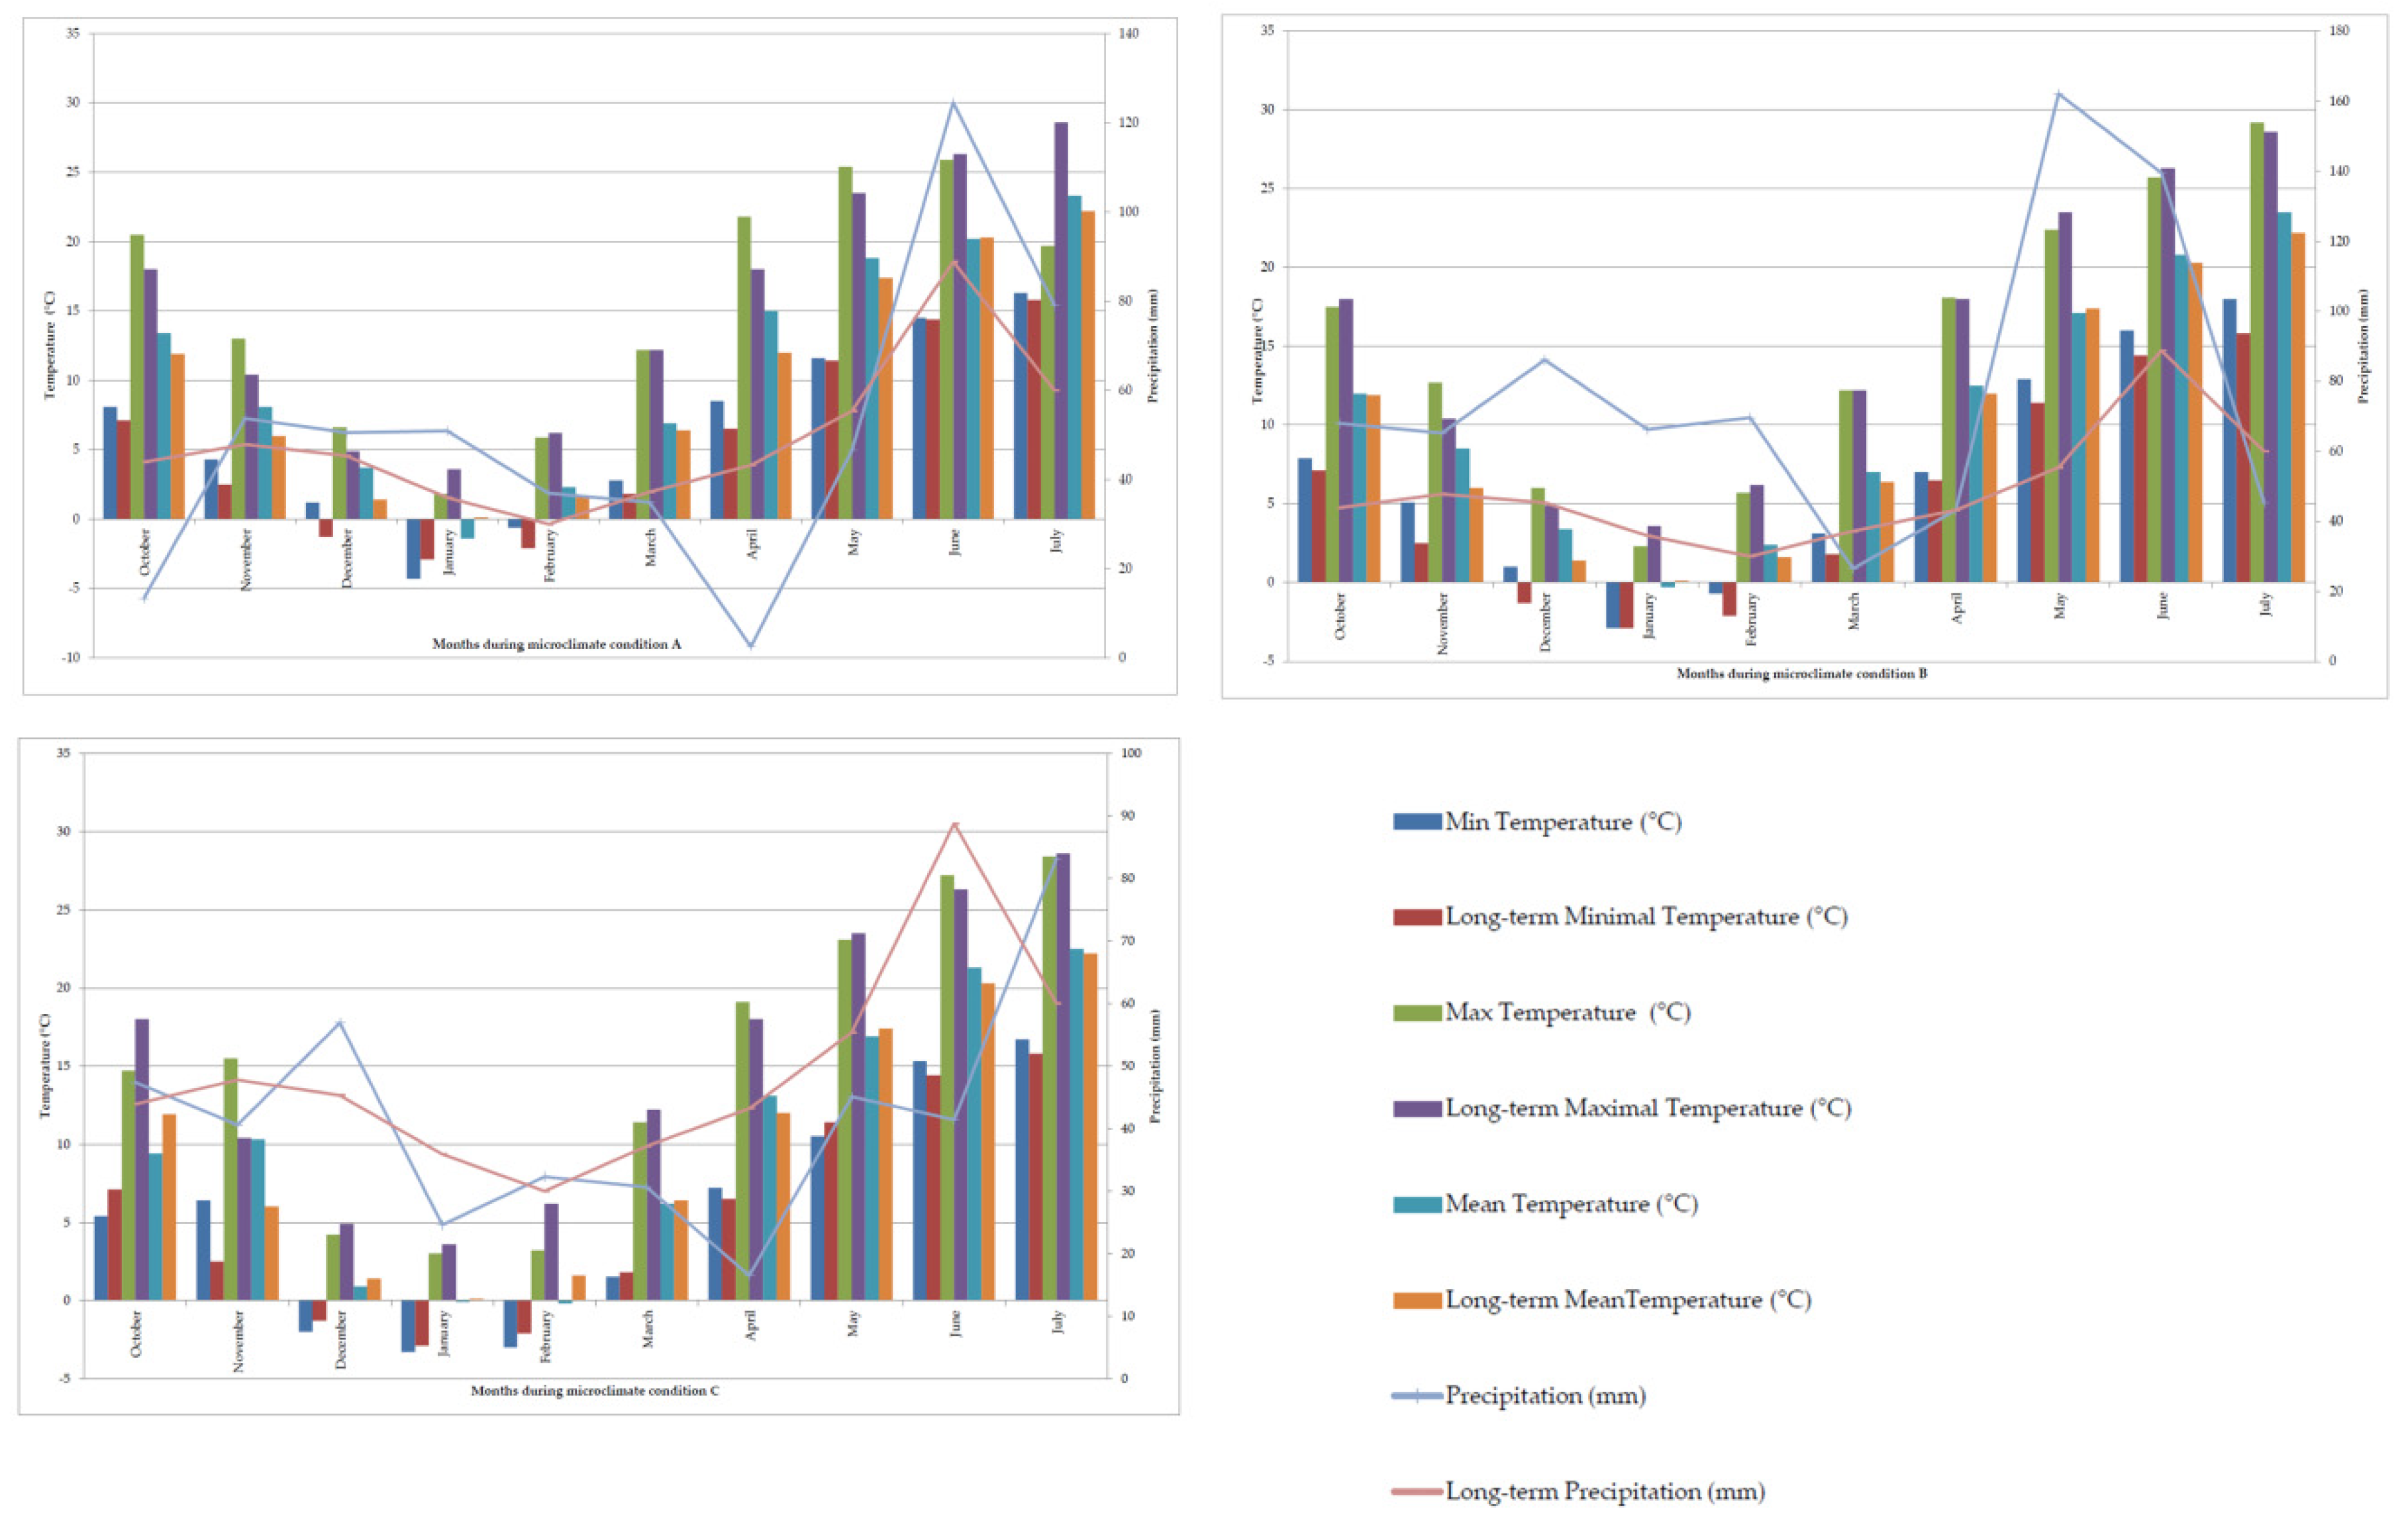
Apart from the unfavorable characteristics of solonetz soil, there were other abiotic stress conditions at the Kumane site. The joint action of the steppes, clearly expressed temperature changes and extremes, strong winds and water retention on the plot surface had an effect on the selection of this site. Weather conditions at the Kumane experimental field throughout the vegetation season, when wheat was produced, were, for the most part, typical of that environment. Sowing wheat was accompanied by a deficit of precipitation. Winters were marked by very cold weather, strong ground frosts and lack of snow cover. The extreme minimum temperature was −17.8 °C. May set a record for precipitation (microclimate condition B, 162.1 mm). Weak precipitation, relatively high air temperatures and frequent winds caused the drying of the surface layer of the soil, as shown in Figure 2.

2.2. Statistical Tools

For each investigated trait, the parameters of the descriptive statistics were calculated: mean value and coefficient of variation. Analysis of variation in the experiment, its quantification, and identification of sources of variation were performed using the AMMI model (Additive Main Effects and Multiplicative Interaction). Thus, AMMI ANOVA presented the main additive components, and then the multivariate source of variation (non-additive component of variance) was reflected. The genotype x environment interaction was further decomposed by a multivariate model PCA analysis [24].
Genotype × environment interaction was tested using the AMMI analysis by [23]. Data processing was performed in GenStat 9th Edition (trial ver.) VSN International Ltd., (www.vsn-intl.com/ accessed on 12 June 2022) [32]. All biplots were generated in Microsoft Excel, 2013.
The mean squares (MS) from analysis of variance were used to estimate components of the variance (genotypic variance σ2g, phenotypic variance σ2p, interaction variance σ2g×y×t, and ecological variance σ2e), as follows [33]:
Genotypic variance:
σ g 2 = M S 1 M S 2   r × y × t
Ecological variance:
σ e 2 = M S e  
Variance of interaction:
σ g × y × t 2 = M S 2 M S 3 r  
Phenotypic variance:
σ p 2 = σ g 2 + σ g × y × t 2 + σ e 2
where: MS1= mean square for genotype; MS2 = mean square for genotype × year × treatment; MS3 = mean square for error; r = replications; y = years; t = treatments.
Mean values ( x ¯ ) were used for genetic analyses, to determine the genotypic coefficient of variation (CVg) and the phenotypic coefficient of variation (CVp), according to Singh and Chaudhary [34]:
C V g ( % ) = σ g 2 x ¯ × 100 ;   C V p ( % ) = σ p 2 x ¯ × 100
Heritability in broad sense (h2) for all traits was computed using the formula given as [35]:
h 2 = σ g 2 σ p 2   ×   100
Heatmap analysis of Pearson moment correlation coefficients and correlation matrix analysis by the principal components method (PCA) were performed, in order to express the relationships between examined traits and grain yield, using the R Project for Statistical Computing, Version 4.2.0, 22 April 2022 ucrt [36].

3. Results

3.1. Ear Mass

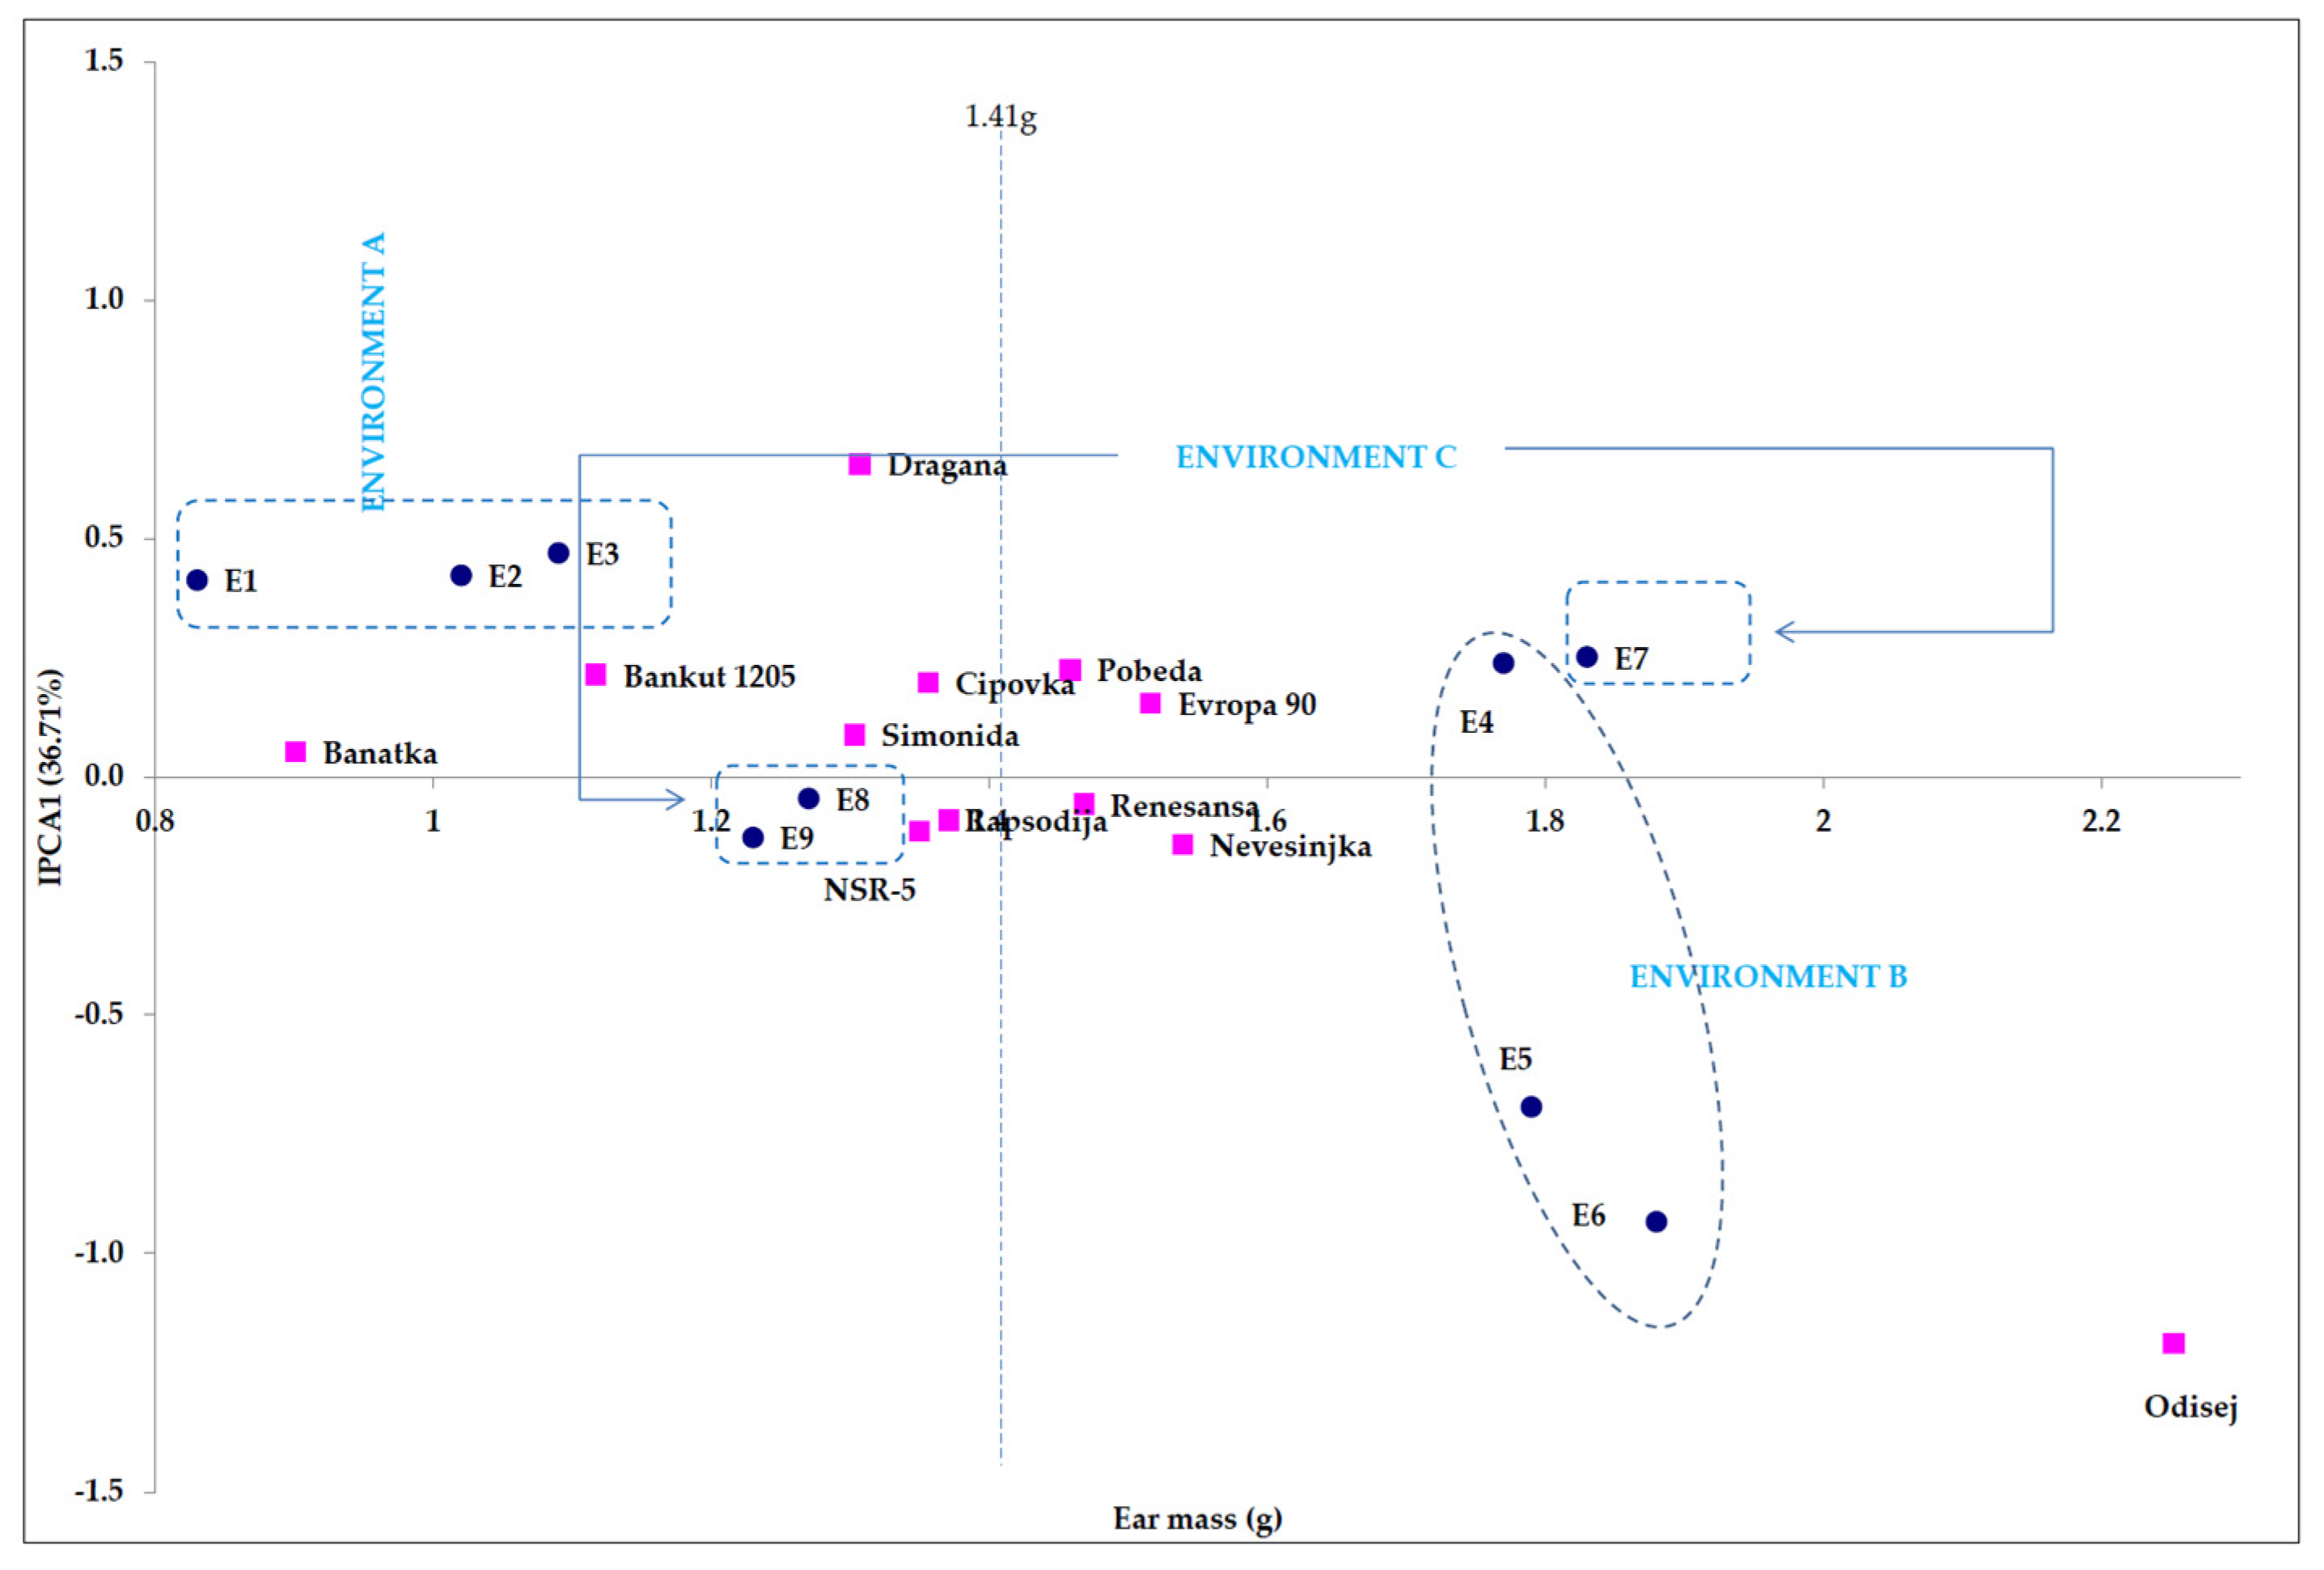
The average value of ear mass per agro-ecological environments was 1.41 g, i.e., on soil without reclamation and two treatments during the experiment. The highest deviations from that average were recorded in cultivars Banatka ( x ¯ = 0.90 g) and Odisej ( x ¯ = 2.25 g), Table 4, Figure 2.
The analysis of variance showed that environmental share had a great influence on phenotype formation. This was a result of the significant share of the environment sum of squares—as an additive effect—and the genotype × environment interaction— which had a multivariate nature—in the total variation of the experiment. The genotype response to variations in the actions of environmental factors was reflected in a statistically highly significant value of mean squares of genotype × environment interaction. This interaction was 26.64% of the share of total variation in the experiment sum of squares (Table 5).
In addition to this significance, the variance analysis of ear mass for the total sample showed high significances of mean squares value for both genotypes and environments. Thereby, in the experiment total variation, the main effects of the variance analysis, genotype and environments, had a 59.97% share of the experiment sum of squares. A large share of the sum of squares within the main effects of the variance analysis belonged to agro-ecological factors (36.78%), while a smaller share belonged to the genotype sum of squares (23.19%), Table 5.
Although most of the total variability was explained by the first major component (IPCA1 36.71%), the statistical significance of the remainder indicated that, after the isolation of its influence, part of the variance remained unexplained; the other main components were therefore also analyzed. A total of six statistically significant main axes were distinguished, the second of which covered the largest part.
Almost all genotypes showed a stable reaction for the ear mass. Genotype Dragana showed less stability than the others. Triticale Odisej, with the largest ear mass, had the highest genotype × environment interaction, i.e., the lowest stability of all the genotypes. Although the local population, Banatka, proved to be one of the most stable, and the old cultivar, Bankut 1205, a fairly stable genotype, their average values of ear mass were the lowest, compared to the others. The position of the points for these two genotypes, which were grouped around the middle E1, indicated that these old cultivars were well-adapted to the unfavorable conditions of solonetz soil, but without any potential for high ear mass in tested conditions (Figure 3).
The biplot clearly shows the group of points that represent different microclimate conditions. Points E1 (solonetz without reclamation), E2 (solonetz with applied 25 t × ha−1 of phosphogypsum) and E3 (solonetz with applied 50 t × ha−1 of phosphogypsum) form one group (Environment A). Microclimate condition A was characterized by low genotype × environment interaction and the great effect of the additive component. In this group, the lowest trait value was on solonetz without reclamation, so that it increased slightly with increasing doses of phosphogypsum. This indicated the visible effect of repaired solonetz in that season. During the second year of the experiment (points E4, E5 and E6), difference in the multivariate part of the variation was manifested, while it was absent in the additive part. This was the reason why the average values of ear mass in all treatments were approximately the same. In the third vegetation season, similar to the previous season, the predominant source of variation was in the additive component. During this season, the genotypes had the best results of the ear mass on solonetz without repair (E7). Considering the positions of points E8 and E9, it can be concluded that the cultivars were most stable on the soil with applied 25 t × ha−1 of phosphogypsum and 50 t × ha−1 phosphogypsum in microclimate condition C. The first vegetation season did not contribute to the decrease of genotype × environment interaction for the ear mass. During this season, regardless of treatment, the genotypes had the lowest ear mass averages, as shown in Figure 3.

3.2. Grain Mass per Ear

The average value of grain mass per ear during the three-year experiment ranged from x ¯ = 1.0 g in the treatment of 25 t × ha−1 phosphogypsum to x ¯ = 1.1 g in the soil without repair and in the treatment of 50 t × ha−1 phosphogypsum. The uniformity of variation of grain mass per ear was indicated by similar values of average coefficient of variation (V = 10.2–10.7%) during the three experimental seasons, as shown in Table 6.
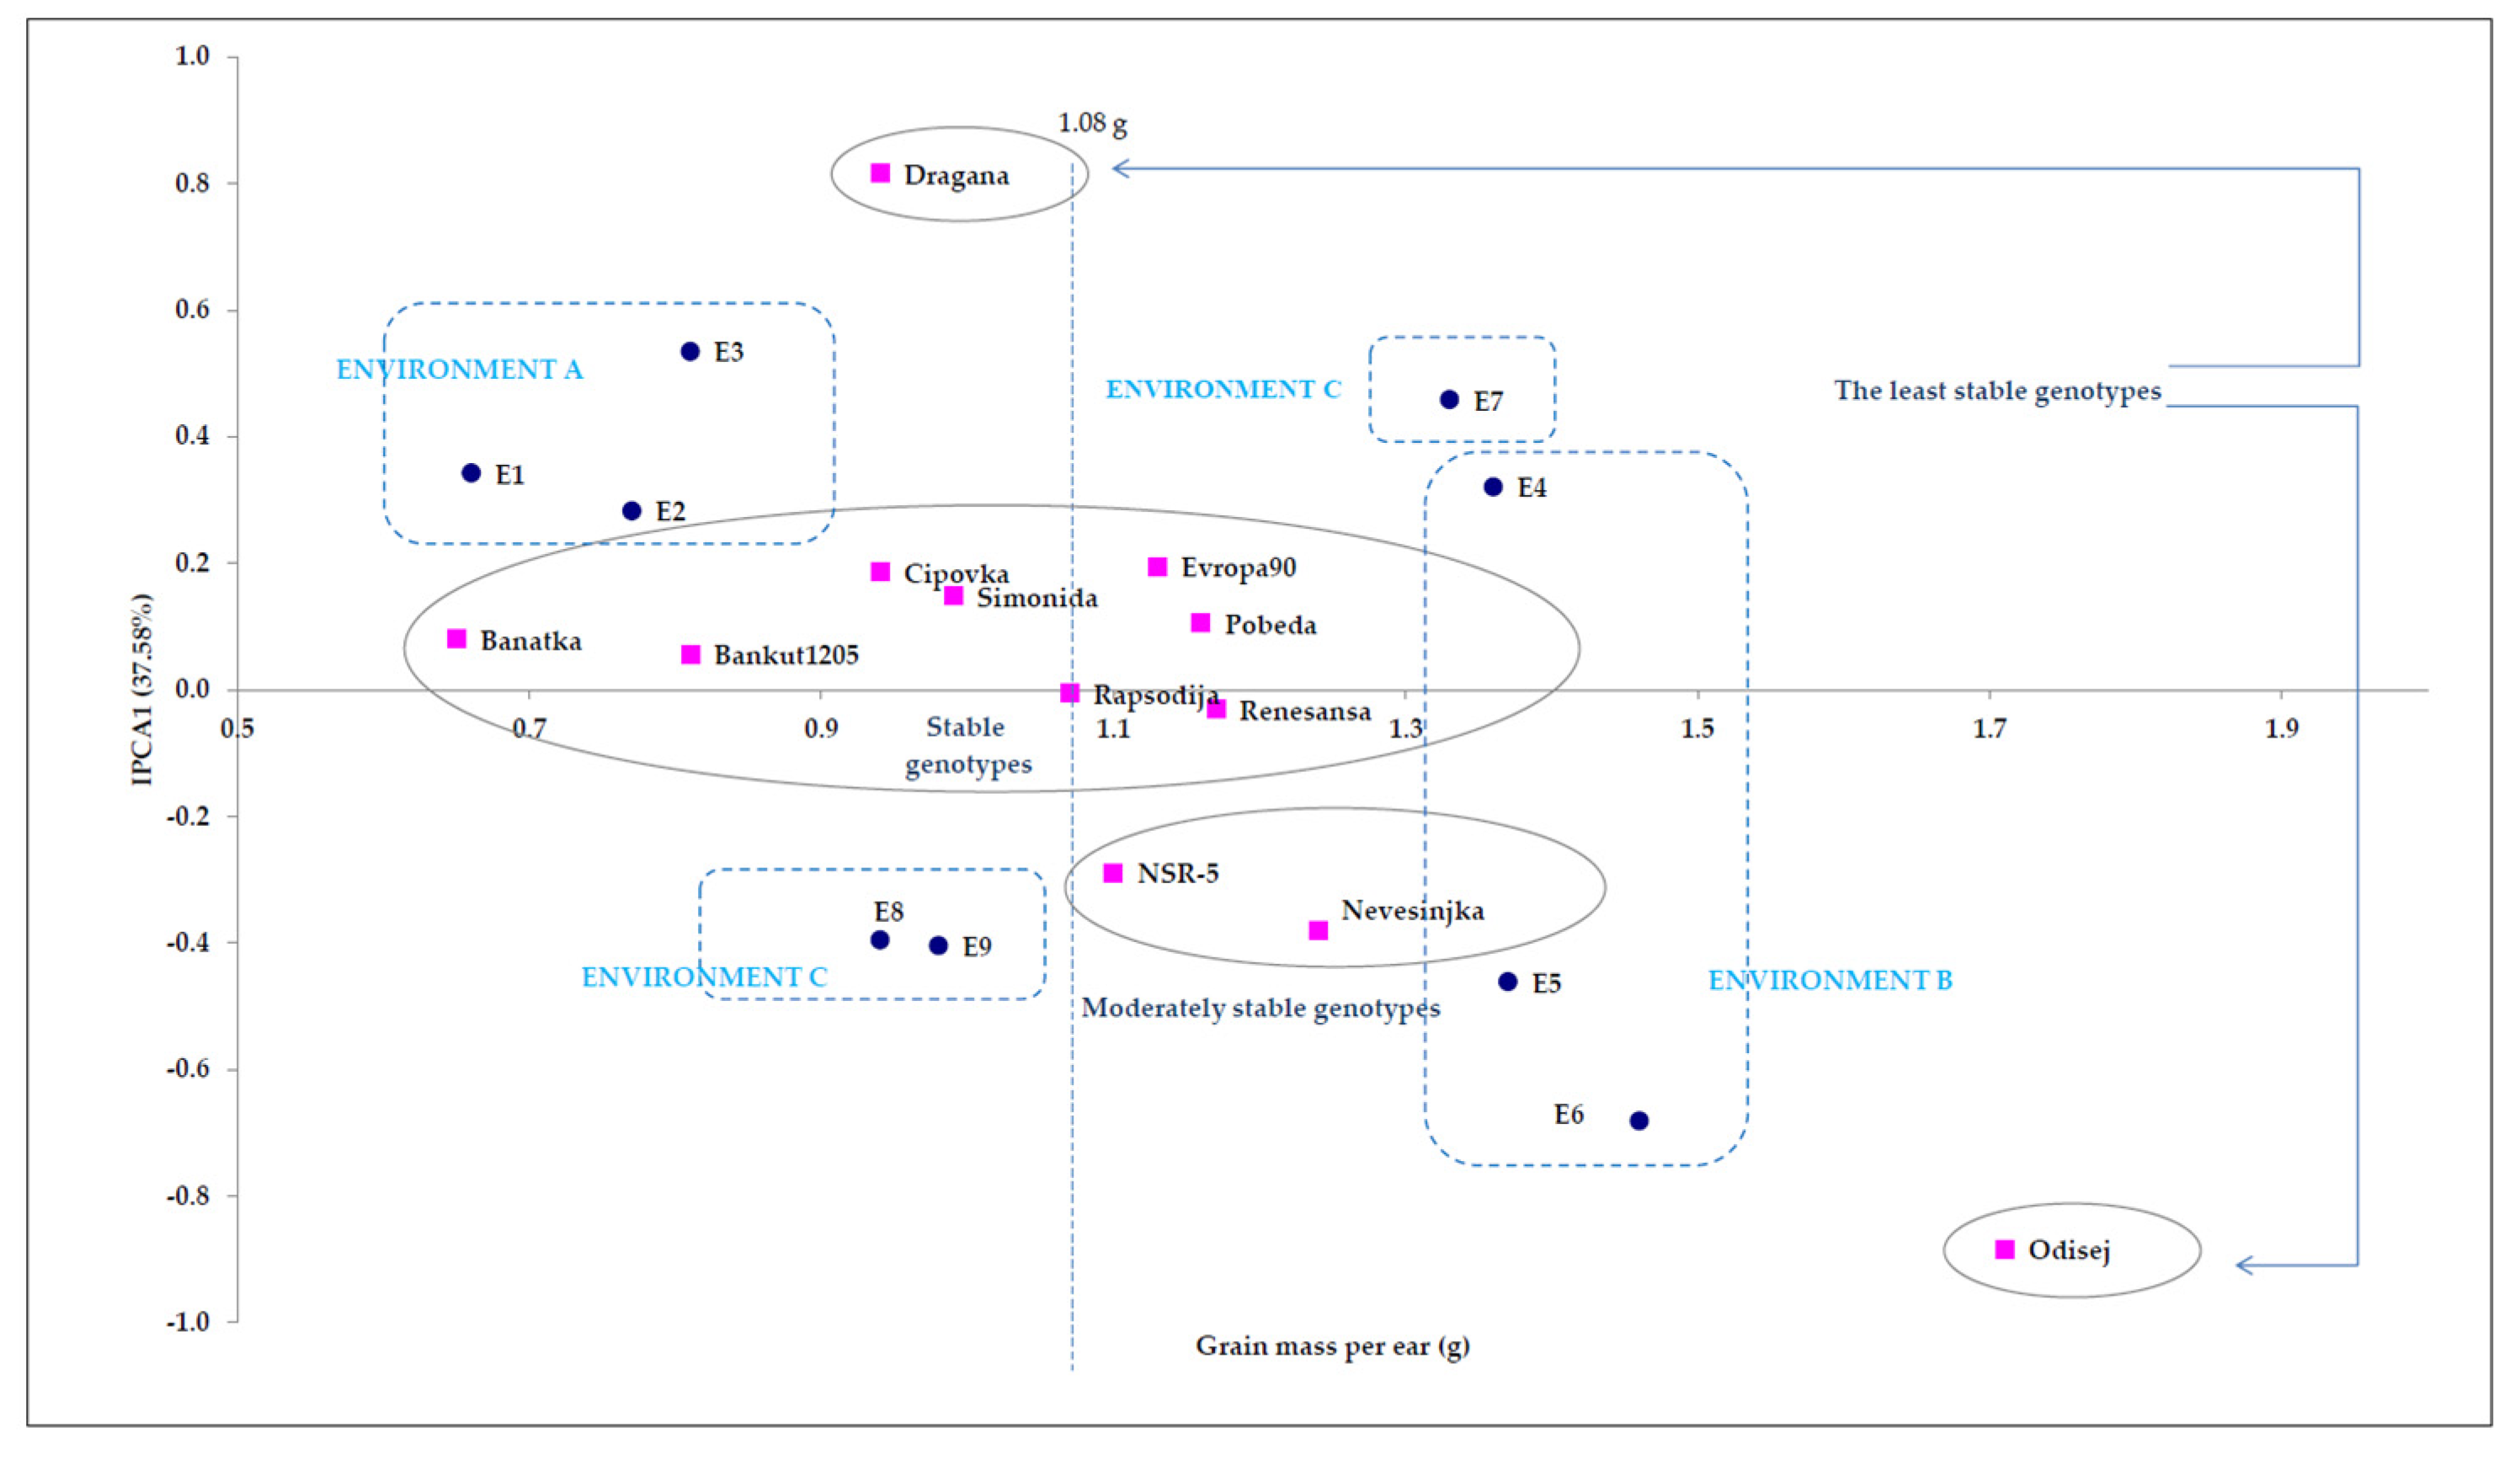
In addition to the highly significant mean of squares of the environments, high statistical significance of the mean of squares of the genotype × environment interaction was also recorded. By analyzing the variance of grain mass per ear for the total sample, it was calculated that the main effects, genotype and environments, had a 55.74% share of the experiment sum of squares in the total experiment variation. Within the main effects of the variance analysis, most of the sum of squares belonged to the environmental share (31.89%), while a smaller share belonged to the genotype sum of squares (23.85%). Genotype × environment interaction had a 30.30% share in the experiment sum of squares, and showed high statistical significance. A total of six main components were distinguished, out of which the first five were statistically significant, as shown in Table 7. The IPCA1 accounted for most of the interaction (37.58%), which is why the АММI 1 biplot is also shown, in Figure 4.
According to the achieved interaction values, i.e., the distance from zero axis, the genotypes were grouped towards stability. Genotypes Rapsodija, Renesansa, Bankut 1205 and Banatka showed the most stable response, relative to the first main component, and after them: Pobeda, Simonida, Cipovka and Evropa 90. Medium stable genotypes were Novosadska rana 5 and Nevesinjka, while genotypes Dragana and triticale Odisej were evaluated as the least stable, as shown in Figure 4.
The distribution of points of the agro-ecological environments indicates a great similarity in conditions for achieving grain mass stability per ear. However, Е2 was singled out as the most stable. Even so, this does not make this environment the most favorable in relation to the others, since the genotypes that were part of it had a mean value of grain mass per ear lower than the total mean value of the experiment for this trait. Agro-ecological environment E6 had the highest interaction score, i.e., it was the environment where genotypes could not show their stable response.
Cultivars Rapsodija and Renesansa stood out as the most stable, compared to the first interaction axis, and with average values higher than the general average (Figure 4).

3.3. Genetic Parameters

The phenotypic coefficient of variation (CVp) was higher than the genotypic coefficient of variation (CVg) for both analyzed traits. This indicates that the present variation was not only due to genotypes, but also due to the influence of the environment. For all tested microclimates combined, low broad sense heritability values were observed for both traits (31.98% for ear mass and 29.69% for grain mass per ear), as shown in Table 8.
Lower genotypic than phenotypic variance values are often present when genetic factors are examined in connection to microclimates. This outcome also contributed to the lower-than-expected heritability values in a more general sense. This was due to the significant treatment differences (solonetz, natural pasture and treatments by phosphogypsum), which resulted in high interaction values that were considered when evaluating heritability. However, microclimate B stood out, due to having the most favorable conditions for plant development and the expression of the examined traits. As a result, it can be inferred that more favorable microclimate conditions minimized the differences between the investigated treatments. Higher heritability values for the ear mass (59.74%) and the grain mass per ear (59.16%) were calculated in microclimate B than in microclimates A and C.

3.4. Correlations between Studied Parameters and Grain Yield of Wheat under 3S Conditions

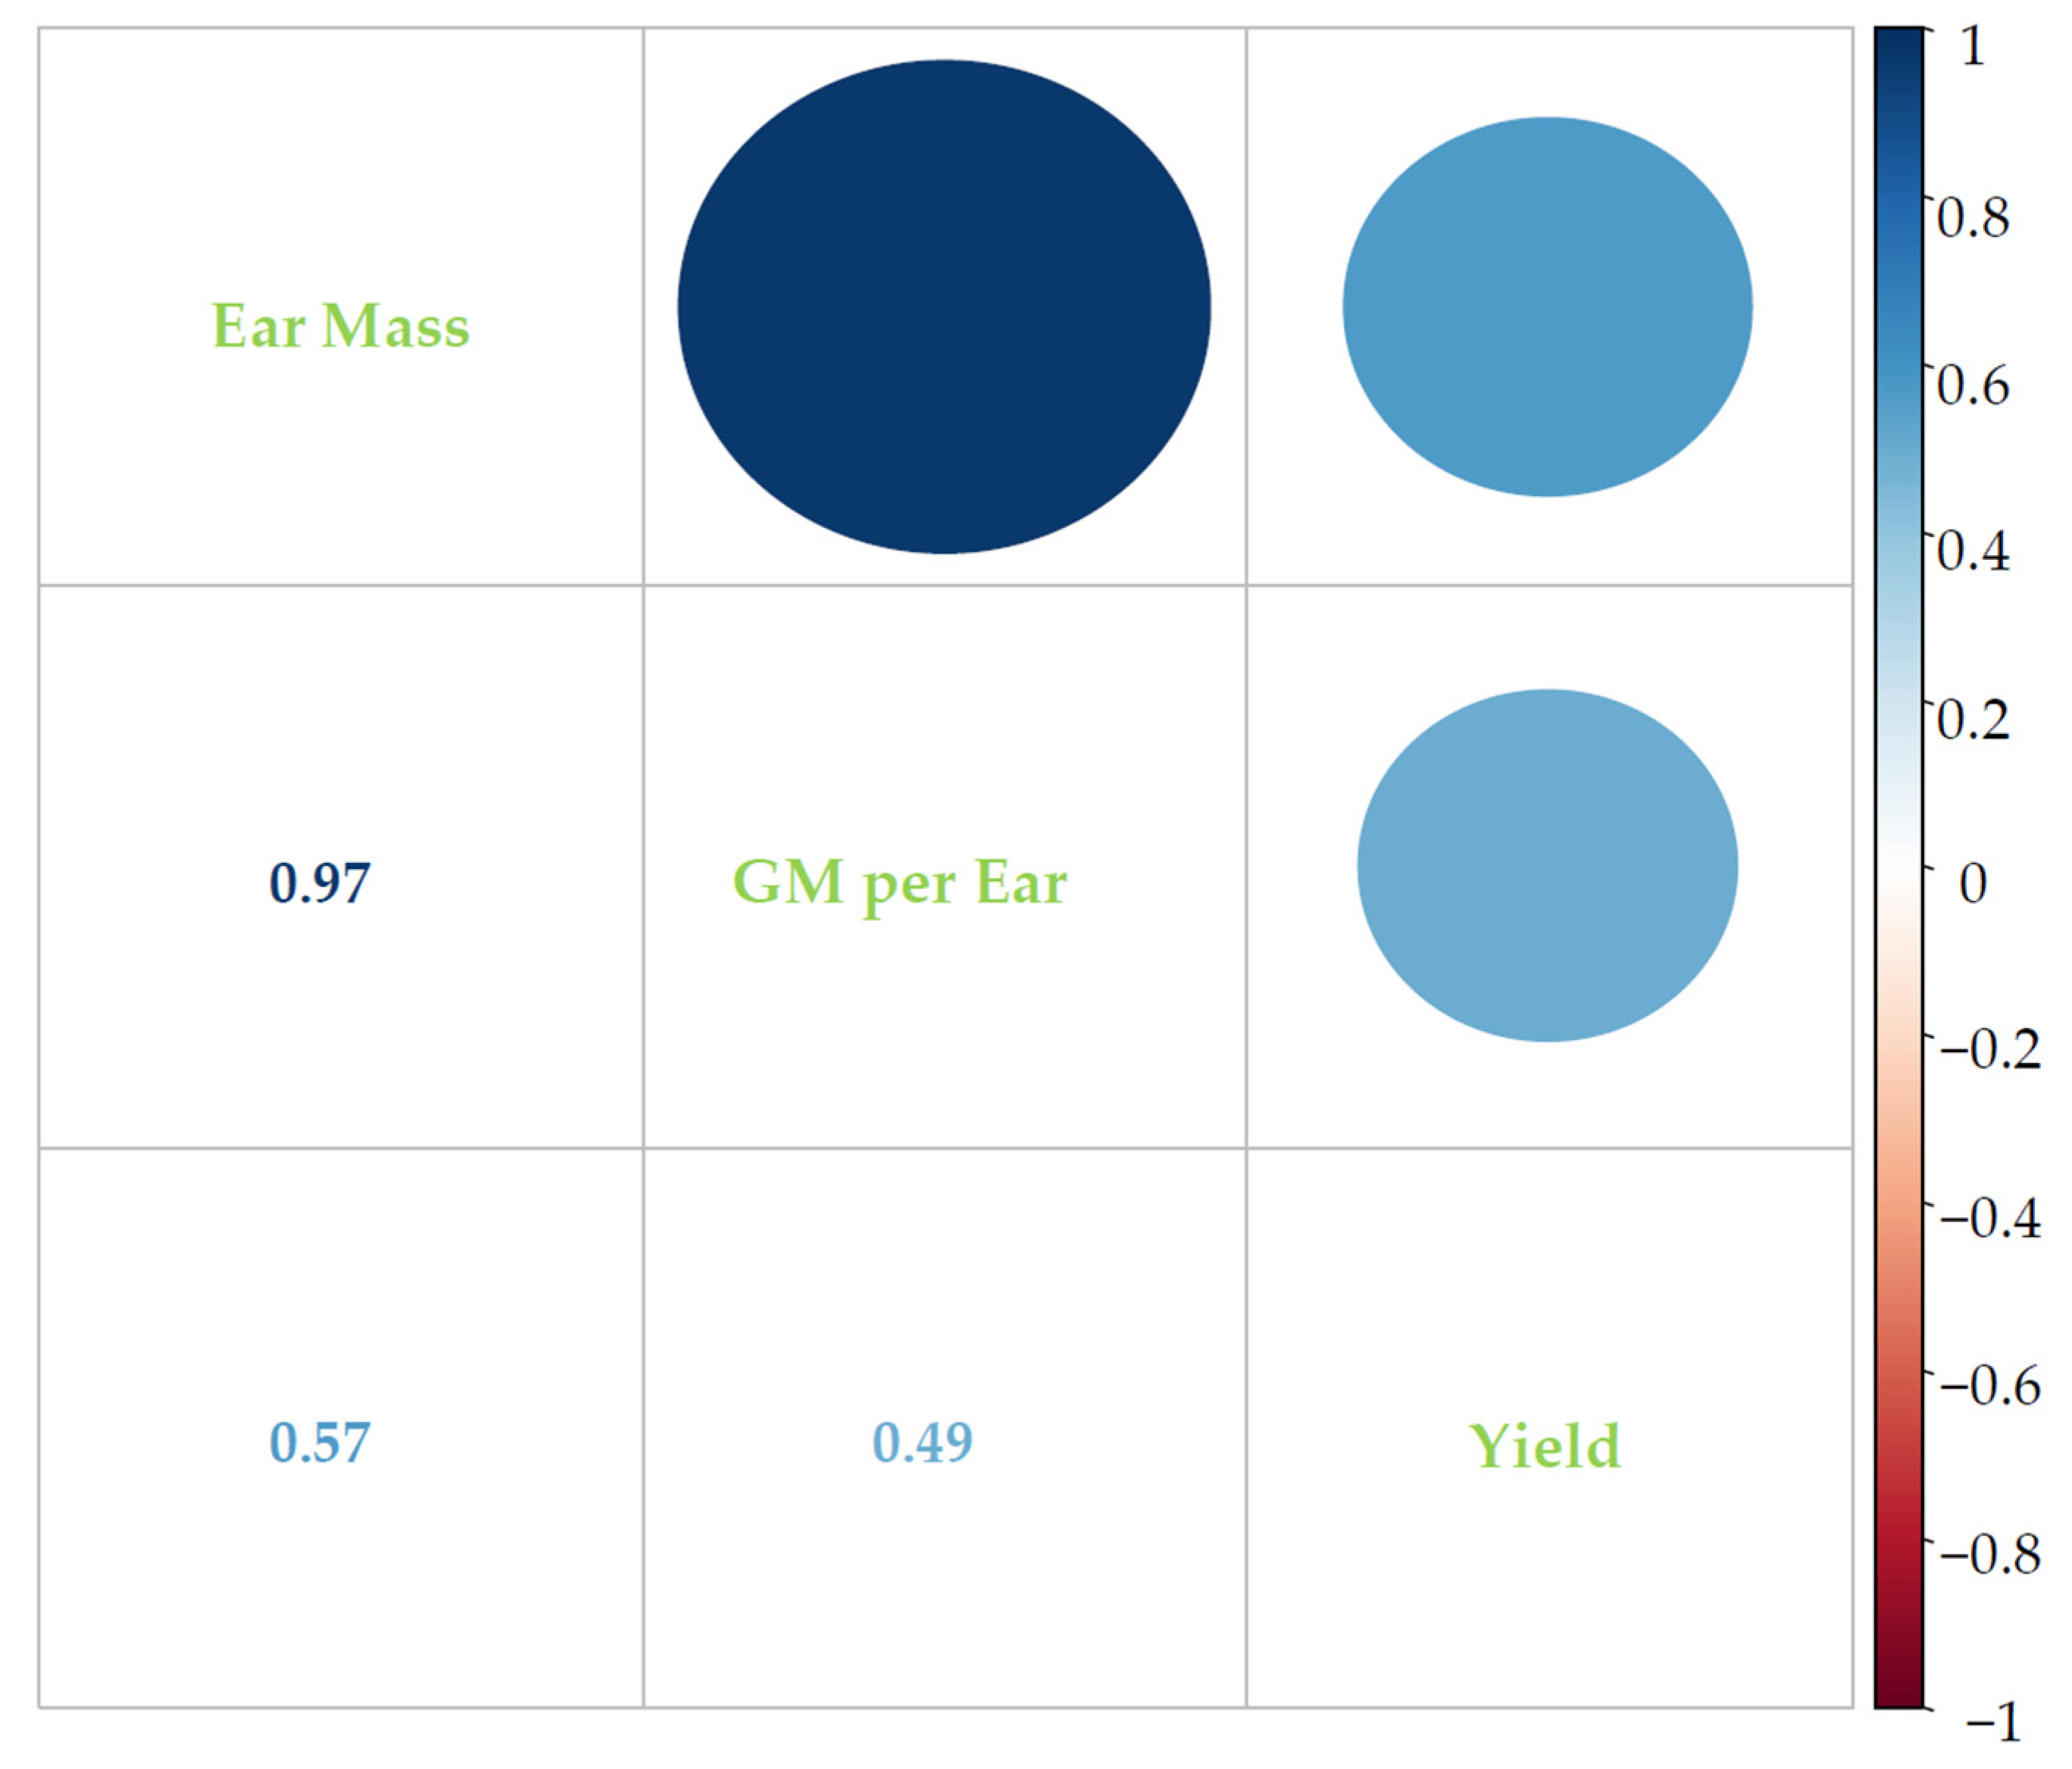
In wheat breeding, analyzing the correlation dependency across yield components is crucial, as selection within one feature influences the change of another variable. Single Pearson coefficients are most frequently calculated for correlation analysis, and are shown in the heatmap (Figure 5). The association assessment is also shown by the biplot obtained by PCA analysis, as shown in Figure 6.
Given that there was a positive correlation between the studied parameters and grain yield, this indicates that there was a tendency for an increase in one component to result in an increase in another component—in this case, grain yield, which is important for breeding efforts. This is particularly important because the experiment was conducted in 3S conditions brought on by an increase in the amount of sodium ions in the soil.
The association between analyzed parameters and grain yield was estimated in more detail through the principal components method, presented by a biplot (Figure 6).
By comparing the values of the first (Dim1) and second (Dim2) principal components of PCA for ear parameters and grain yield, as well as genotypes, a biplot analysis was conducted to explore multivariate associations between the examined variables. The importance of the acquired data is shown by the fact that the first two axes together explained 99.2% of the variation. Acute angles that overlapped the vectors of the investigated traits indicated that there were positive correlations between them, which is also consistent with the reported correlation study (Figure 5 and Figure 6).

4. Discussion

4.1. Point Distribution of Genotype and Environmental Share: Markers of Genotype Stability

An assessment of the stability of different wheat genotypes, in terms of their grain yield and grain yield components, provides valuable information about genotype adaptation to specific environments, such as environments with increased soil salinity [25,37,38]. The results of this three-year experiment showed the extremely complex nature of the tested traits of phenotypic variation, which were considered components of the wheat grain yield. Besides the high level of monitored phenotypic characteristics in the tested cultivars, the stability of their reaction was also observed. However, when discussing stable reaction, i.e., the level of genotype × environment interaction, it is necessary to emphasize that this interaction was observed in two ways. A low level of genotype × environment interaction was observed and evaluated favorably, with the highest mean value of the observed trait, which indicated stability. At the same time, the nature of this interaction at high level was also assessed in cases where a marked change in rank occurred (“cross over” interaction). This was because the experiment was set up in the conditions of control and two levels of solonetz repair, so in some cases the high level of genotype × environment interaction indicated a favorable reaction of the cultivar to land reclamation measures. Therefore, in addition to accepting a stable reaction at average trait values higher than the average of the experiment, some cases of so-called unstable reaction were evaluated as favorable, if that reaction meant that the cultivar reacted violently to land reclamation measures by increasing the mean value of the observed trait. In that way, cultivars with low interaction and stable reaction to variation of agro-ecological conditions were separated. This research confirms that the local population, Banatka, and the ancient variety, Bankut 1205, have successfully adapted to 3S, which accords with Gharib, et al. [39], who found that local populations and old varieties of wheat could be a useful genetic resource for increasing genetic variability and specific adaptation to 3S conditions, as well as suitable parental material in breeding programs.
Still, a priori is not dismissed without detailed analysis, as with any reaction that would be assessed as unstable and unfavorable in normal growing conditions. The aspiration follows, from the above, to obtain the most complete and realistic variation scores, as well as the source of the experiment variation, especially on the level and the nature of genotype × environment interaction. This would describe the total or average stability of the genotype, so it is of utmost importance to analyze the complex nature of genotype × environment interaction in more details. Over the last few decades, several studies have been carried out to understand plant biology in response to 3S, with a major emphasis on genetic and other hereditary components [9,12,29]. Based on the outcome of these studies, several approaches are being followed, to enhance plants’ ability to tolerate salt stress while still maintaining reasonable levels of crop yields [40,41]. This research indicates the importance of studying the correlations between yield components and wheat grain yield in 3S, which is in accordance with Matković Stojšin, et al. [42].
The complex nature of genotype × environment interaction was reflected in the large number of interaction axes, i.e., main axes from the main components analysis, which were applied in the AMMI model for more detailed analysis of genotype × environment interaction. The larger number of main interaction axes, which proved to be statistically significant, meant that the variance of the genotype × environment interaction was influenced by several agronomically significant and explanatory sources of variation. Due to this, the tested yield components showed a genotype × environment interaction that could not be explained only by the first interaction axis (IPCA1).

4.2. The External Environment: Sculptor of Genetic Expression of Examined Traits

The ear mass showed a great dependence on the action of environmental factors, as the genetic share in the phenotypic variation was not high, nor the calculated heritability. This result was expected, given the distinct quantitative basis of this wheat yield component—for the expression of which, polygene groups are responsible—but also its dependence on grain mass per ear and number of grains per ear. The genotypes had the lowest averages of ear mass in microclimate condition A, regardless of treatment. Although this season was characterized by certain deviations in terms of climatic parameters, it was still observed as a whole, and had more favorable climate conditions. This resulted in a reduction of the differences in genotype response to the measures of solonetz repair for the ear mass. However, the average values of ear mass had a tendency to increase from control to treatment, with 50 t × ha−1 of phosphogypsum. The effect of reclamation measures was absent in the third vegetation season, because the highest average value of ear mass was obtained on the control variant of solonetz ( x ¯ = 1.8 g). Thus, during the second vegetation season, the highest average value of this trait was achieved ( x ¯ = 1.9 g on treatment with 50 t × ha−1 of phosphogypsum). This indicated that the high average value of the ear mass in such conditions could only be achieved due to the favorable reaction of genotypes to the measures of solonetz repair. Similar results were obtained by Ljubičić, et al. [43], who found that the basic source of ear mass variation is reclamation measure.
Ear mass stability analysis showed that there were differences between the genotypes, which were quantified by a statistically highly significant value of mean squares of genotype × environment interaction. However, the distribution points of the genotypes, and considerable agro-ecological environments that were more scattered by abscissa than by ordinate on the biplot, could lead to the conclusion that variation of the additive part of the total variance was more pronounced than the multivariate for the ear mass. This resulted in a stable reaction of almost all genotypes for the ear mass. Measures to repair solonetz contributed to the increase in stability and the decrease in interaction values. The highest genotype × environment interaction was observed in triticale cultivar Odisej, so this genotype was characterized as the least stable, which is consistent with the results of Purchase, et al. [44].
The grain mass per ear was characterized by low heritability and significant phenotypic variation, depending on the variation of environmental factors. The lower genotype × environment interaction of this trait was a good basis for selection for stable wheat yield. By analyzing the grain mass per ear, a high variability of this wheat yield component could be noticed, in relation to the examined microclimate conditions and different phosphogypsum treatments. The grain mass per ear showed complex genotype × environment interaction, whereby it was possible to group genotypes according to stability. The highest average values of grain mass per ear ( x ¯ = 1.5 g on treatment with 50 t × ha−1 of phosphogypsum) were achieved by genotypes in the season when the most unfavorable environmental conditions prevailed, especially in stages crucial for ear formation and grain filling. Differences in the mean values of the examined trait during different vegetation seasons were in accordance with the previous results, where the speed and completeness of the flowering, pollination and fertilization processes were determined by environmental conditions, above all by temperatures and humidity [26,45]. Microclimate condition A did not favor the development of grain mass per ear, as with the ear mass, just as the solonetz repair measures did not have a significant impact. However, the AMMI analysis determined that this season, in all three variants of the experiment, was the most favorable for achieving a stable reaction for grain mass per ear. In the same location, seed yield was tested, and its expression, controlled with multiple genes and traits, suffered decrease, compared to non-stressed conditions [26]. The great influence of the external environment on the grain mass per ear, and the number of grains per ear, has been confirmed by the research of [43,46], as has the high difference between the phenotypic and genotypic coefficient of variation, especially for grain mass per ear, indicating the greater influence of the environment. Dimitrijević, et al. [47], Knežević, et al. [16], Knežević, et al. [17], and Matković Stojšin, et al. [48], found a high share of the environment in the variation of grain mass per ear. Similar results were obtained by Matković Stojšin, et al. [42], for ear mass.
For both examined traits, values of genetic variance were almost equal to values of environmental variance. The consequence of this phenomenon was low heritability of these yield components, which could indicate that environmental factors could be attributed as epigenetics. Testing genotypes under abiotic stress is critical, because it allows researchers to analyze their first response to a particular situation, i.e., to primary stress [49]. Assessment of a genotype’s tolerance to abiotic stress, in situ, is of great importance for forming a realistic picture because, in addition to 3S, all other abiotic factors also affect the plant [42,50,51,52].
When genotypes are tested at different phases of development, determining the response to primary stress makes sense. Better epigenetic mechanisms, which allow them to recall stress, are defined by varieties that respond best to primary stress with the least harm in the early stages of development, and then give the same response to the source of abiotic stress in the later stages of development. Because genotypes are not formed for specific growing circumstances, this response is not encoded in their genetic code, so it is hypothesized that DNA methylation and/or histone modification are responsible for this reaction, which is the focus of new research. In this research, phenotypic evaluation of genotypes was carried out at various phases of development, in order to show that genotypes with the best assessment of primary stress had the greatest mean values of the attributes studied in the whole physiological maturity phase.
Through three separate stages of plant cultivation, the memory of stress at the vertical level was examined in this experiment. This brings up the prospect of answering the question: “Can a seed remember?”—that is to say—“Can epigenetic factors be fixed in the genome?”—which will be a good parent for developing new genetic variability specific for growing under stressful conditions.

5. Conclusions

In experiments where the interaction of climate conditions, soil conditions and appropriate treatments is examined, it is important to consider the genetic potential of selected cultivars and factors that interfere. This is particularly important if the environmental conditions are the sources of abiotic stress as well, because this gives a clearer picture of the potential breeding usability of the cultivars. In this investigation, the stability of wheat genotypes, grown in the stressful conditions of solonetz soil type and steppe microclimate, was assessed. By comparing the results that analyzed genotypes had on the control treatment (without application of phosphogypsum) with the results that genotypes achieved on the treatments with phosphogypsum, potential gene donors for the creation of new genetic variability were selected from the existing germplasm.
Regardless of treatment, the genotypes in microclimate A had the lowest averages of ear mass. The genotype Odisej, on solonetz reclaimed by 50 t × ha−1 of phosphogypsum, in microclimate B, recorded the greatest ear mass values. Agro-ecological factors significantly controlled how ear mass was expressed. Genotypes Banatka, Renesansa, Rapsodija and Simonida demonstrated the most stable reactions. The effect of the applied amelioration measure depended on the meteorological conditions of the growing season. On solonetz reclaimed by 25 t × ha−1 and 50 t × ha−1 of phosphogypsum, in microclimate C, the genotypes showed the highest stability. It was found that the local population, Banatka, and the ancient variety, Bankut 1205, had successfully adapted to 3S, and that they could be good parents for new wheat cultivars for growing under those conditions. In all of the experiment’s versions, microclimate B produced the greatest average values of grain mass per ear and the lowest average values of the coefficient of variation. In the microclimate A, solonetz reclaimed by 25 t × ha−1 of phosphogypsum came out as the ideal setting for obtaining a stable reaction of the genotypes. The most stable genotypes were Rapsodija and Renesansa. In less favorable circumstances, under 3S, genotype Simonida produced one of the most steady reactions for grain mass per ear.
The results obtained by this research may be important for the further process of creating stable wheat genotypes, both for 3S conditions and abiotic stress in general.

Author Contributions

Conceptualization, Methodology, Software, Validation, Investigation, Resources, Writing—original draft, Writing—review & editing, Visualization, Funding acquisition, B.B.; Validation, Visualization, Funding acquisition, V.M.; Methodology, Validation, Visualization, Funding acquisition, S.P.; Software, Validation, Visualization, Funding acquisition, M.M.-S.; Validation, Data curation, Visualization, Funding acquisition, Đ.K.; Validation, Visualization, Funding acquisition, S.V.; Validation, Visualization, Funding acquisition, K.M.; Validation, Visualization, Funding acquisition, B.K., Validation, Visualization, Funding acquisition, D.B. (Dušana Banjac); Validation, Visualization, Funding acquisition, S.J.; Validation, Visualization, Funding acquisition, D.B. (Danilo Begić), Validation, Visualization, Funding acquisition, R.Š. All authors have read and agreed to the published version of the manuscript.

Funding

This research received no external funding.

Institutional Review Board Statement

Not applicable.

Informed Consent Statement

Not applicable.

Data Availability Statement

Not applicable.

Acknowledgments

Ministry of Education, Science and Technological Development, Serbia, 451-03-68/2022-14/200117.

Conflicts of Interest

The authors declare no conflict of interest.

References

  1. Shiferaw, B.; Smale, M.; Braun, H.J.; Duveiller, E.; Reynolds, M.; Mauricho, G. Crops that feed the world 10. Past scuccesses and future challenges to the role played by wheat in global food security. Food Secur. 2013, 5, 291–317. [Google Scholar] [CrossRef] [Green Version]
  2. Knežević, D.; Zečcević, V.; Dukić, N.; Dodig, D. Genetic and phenotypic variability of grain mass per spike of winter wheat genotypes (Triticum aestivum L.). Kragujev. J. Sci. 2008, 30, 131–136. [Google Scholar]
  3. Li, T.; Deng, G.; Tang, Y.; Su, Y.; Wang, J.; Cheng, J. Identification and Validation of a Novel Locus Controlling Spikelet Number in Bread Wheat (Triticum aestivum L.). Front. Plant Sci. 2021, 12, 611106. [Google Scholar] [CrossRef] [PubMed]
  4. Popović, V.; Ljubičić, N.; Kostić, M.; Radulović, M.; Blagojević, D.; Ugrenović, V.; Popović, D.; Ivošević, B. Genotype × Environment Interaction for Wheat Yield Traits Suitable for Selection in Different Seed Priming Conditions. Plants 2020, 9, 1804. [Google Scholar] [CrossRef]
  5. Sheoran, S.; Jaiswal, S.; Raghav, N.; Sharma, R.; Sabhyata; Gaur, A.; Jaisri, J.; Gitanjali, T.; Singh, S.; Sharma, P.; et al. Genome-Wide Association Study and Post-genome-Wide Association Study Analysis for Spike Fertility and Yield Related Traits in Bread Wheat. Front. Plant Sci. 2022, 12, 820761. [Google Scholar] [CrossRef]
  6. Delvet, A. Crop Production and Yield Limiting Factors. MAS J. Appl. Sci. 2021, 6, 325–349. [Google Scholar]
  7. Tóth, G.; Montanarella, L.; Stolbovoy, V.; Máté, F.; Bódis, K.; Jones, A.; Panagos, P.; Van, M.; Liedekerke, M. Soils of the European Union; Office for Official publications of the European Communities: Luxembourg, 2008; p. 85. [Google Scholar]
  8. Bai, R.; Zhang, Z.; Hu, Y.; Fan, M.; Schmidhalter, U. Improving the salt tolerance of Chinese spring wheat through an evaluation of genotype genetic variation. Aust. J. Crop Sci. 2011, 5, 1173–1178. [Google Scholar]
  9. Borzouei, A.; Kafi, M.; Akbari-Ghogdi, E.; Mousavi-Shalmani, M. Long term salinity stress in relation to lipid peroxidation, superoxide dismutase activity and proline content of saltsensitive and salt-tolerant wheat cultivars. Chil. J. Agric. Res. 2012, 72, 476–482. [Google Scholar] [CrossRef]
  10. Liu, X.; Chen, D.; Yang, T.; Huang, F.; Fu, S.; Li, L. Changes in soil labile and recalcitrant carbon pools after land-use change in a semi-arid agro-pastoral ecotone in Central Asia. Ecol. Indic. 2020, 110, 105925. [Google Scholar] [CrossRef]
  11. Sairam, R.K.; Rao, K.V.; Srivastava, G.C. Differential response of wheat genotypes to long term salinity stress in relation to oxidative stress, antioxidant activity and osmolyte concentration. Plant Sci. 2002, 163, 1037–1046. [Google Scholar] [CrossRef]
  12. Mladenov, V.; Fotopoulos, V.; Kaiserli, E.; Karalija, E.; Maury, S.; Baranek, M.; Segal, N.; Testillano, P.S.; Vassileva, V.; Pinto, G.; et al. Deciphering the Epigenetic Alphabet Involved in Transgenerational Stress Memory in Crops. Int. J. Mol. Sci. 2021, 22, 7118. [Google Scholar] [CrossRef] [PubMed]
  13. Ullah, K.; Khan, S.J.; Muhammad, S.; Irfaq, M.; Muhammad, T. Genotypic and phenotypic variability, heritability and genetic diversity for yield components in bread wheat (Triticum aestivum L.) germplasm. Afr. J. Agric. Res. 2011, 6, 5204–5207. [Google Scholar]
  14. Azarbad, H.; Tremblay, J.; Giard-Laliberté, C.; Bainard, L.D.; Yergeau, E. Four decades of soil water stress history together with host genotype constrain the response of the wheat microbiome to soil moisture. FEMS Microbiol Ecol. 2020, 96, fiaa098. [Google Scholar] [CrossRef] [PubMed]
  15. Petrović, S.; Dimitrijević, M.; Kraljević-Balalić, M. Stabilnost mase klasa divergentnih genotipova pšenice [Stability of spike weight of divergent wheat genotypes]. Letop. Naučnih Rad. Poljopr. Fak. 2001, 25, 32–39. [Google Scholar]
  16. Knežević, D.; Zečević, V.; Kondić, D.; Marković, S.; Šekularac, A. Genetic and phenotypic variability of grain mass per spike in wheat under different dose of nitrogen nutrition. Tur. J. Agric. Nat. Sci. 2014, 1, 805–810. [Google Scholar]
  17. Knežević, D.; Radosavac, A.; Zelenika, M. Variability of grain weight per spike of wheat grown in different ecological conditions. Acta Agric. Serb. 2015, 20, 85–95. [Google Scholar] [CrossRef]
  18. Jiang, T.; Dou, Z.; Liu, J.; Gao, Y.; Malone, R.W.; Chen, S.; Feng, H.; Yu, Q.; Xue, G.; He, J. Simulating the Influences of Soil Water Stress on Leaf Expansion and Senescence of Winter Wheat. Agric. For. Meteorol. 2020, 291, 108061. [Google Scholar] [CrossRef]
  19. Arzani, A.; Ashraf, M. Smart engineering of genetic resources for enhanced salinity tolerance in crop plants. Crit. Rev. Plant Sci. 2016, 35, 146–189. [Google Scholar] [CrossRef]
  20. Mohammadi, R.; Armion, M.; Zadhasan, E.; Ahamdi, M.M.; Amir, A. The use of AMMI model for interpreting genotype × environment interaction in durum wheat. Exp. Agric. 2018, 54, 670–683. [Google Scholar] [CrossRef]
  21. Verma, A.; Singh, G.P. AMMI with BLUP analysis for stability assessment of wheat genotypes under multi locations timely sown trials in Central Zone of India. J. Agric. Sc. Food Technol. 2021, 7, 118–124. [Google Scholar]
  22. Sime, B.; Tesfaye, S.M. Stability performance of bread wheat (Triticum aestivum L.) genotype for yield and yield components in Oromia, Ethiopia. J. Agric. Res. Dev. 2021, 12, 625. [Google Scholar]
  23. Zobel, R.W.; Wright, M.J.; Gauch, H.G. Statistical analysis of a yield trial. Agron. J. 1988, 80, 388–393. [Google Scholar] [CrossRef]
  24. Gauch, H.G. A simple protocol for AMMI analysis of yield trials. Crop. Sci. 2013, 53, 1860. [Google Scholar] [CrossRef]
  25. Petrović, S.; Dimitrijevic, M.; Belić, M.; Banjac, B.; Boškovic, J.; Zečević, V.; Pejić, B. The variation of yield components in wheat (Triticum aestivum L.) in response to stressful growing conditions of alkaline soil. Genetika 2010, 42, 545–555. [Google Scholar] [CrossRef]
  26. Banjac, B.; Mladenov, V.; Dimitrijević, M.; Petrović, S.; Boćanski, J. Genotype x environment interactions and phenotypic stability for wheat grown in stressful conditions. Genetika 2014, 46, 799–806. [Google Scholar] [CrossRef]
  27. Neisse, A.C.; Kirch, J.L.; Hongyu, K. AMMI and GGE Biplot for genotype × environment interaction: A medoid–based hierarchical cluster analysis approach for high–dimensional data. Biom. Lett. 2018, 55, 97–121. [Google Scholar] [CrossRef] [Green Version]
  28. Hongyu, K. Adaptability, stability and genotype by environment interaction using the AMMI model for multienvironmental trials. Biodiversity 2018, 17, 10–21. [Google Scholar]
  29. Dimitrijević, M.; Petrović, S.; Belić, M.; Mladenov, N.; Banjac, B.; Vukosavljev, M.; Hristov, N. Utjecaj limitirajućih uvjeta solonjeca na variranje uroda krušne pšenice [The influence of solonetz soil limited growth conditions on bread wheat yield]. In Proceedings of the 45th Croatian & 5th International Symposium on Agriculture, Opatija, Croatia, 15–19 February 2010; Faculty of Agriculture, University of Josip Juraj Strossmayer: Osijek, Croatia, 2010; pp. 394–398. [Google Scholar]
  30. Petrović, S.; Dimitrijević, M.; Kraljević-Balalić, M.; Crnobarac, J.; Lalić, B.; Arsenić, I. Uticaj genotipova i spoljne sredine na komponente prinosa novosadskih sorti pšenice [The effect of genotype and the environment on yield components in Novi Sad wheat varieties]. Zb. Rad. Naučnog Inst. Za Ratar. I Povrtarsvo 2005, 41, 199–206. [Google Scholar]
  31. Zadoks, J.C.; Chang, T.T.; Konzak, C.F. A decimal code for the growth stage of cereals. Weed Res. 1974, 14, 415–421. [Google Scholar] [CrossRef]
  32. GENSTAT 9th Edition, Trial Version; VSN International Ltd.: Indore, India, 2009.
  33. Comstock, R.R.; Robinson, H.F. Genetic parameters, their estimation and significance. In Proceedings of the 6th International Grassland Congress, State College, PA, USA, 17–23 August 1952; National Publishing Company: Washington, DC, USA, 1952; Volume 1, pp. 248–291. [Google Scholar]
  34. Singh, R.K.; Chaudhary, B.D. Biometrical Methods in Quantitative Genetic Analysis; Kalyani Publishers: New Delhi/Ludhiana, India, 1985; pp. 39–78. [Google Scholar]
  35. Falconer, D.S. Introduction to Quantitative Genetics, 3rd ed.; Longman Scientific and Technical: New York, NY, USA, 1989; p. 438. [Google Scholar]
  36. R Project for Statistical Computing, Version 4.2.0 (2022-04-22 ucrt); R Foundation for Statistical Computing: Vienna, Austria, 2022. Available online: https://www.R-project.org/(accessed on 3 July 2022).
  37. Banjac, B.; Dimitrijević, M.; Petrović, S.; Mladenov, V.; Banjac, D.; Kiprovski, B. Antioxidant variability of eheat genotypes under salinity stress. Genetika 2020, 52, 1145–1160. [Google Scholar] [CrossRef]
  38. Matković Stojšin, M.; Petrović, S.; Dimitrijević, M.; Šućur Elez, J.; Malenčić, Đ.; Zečević, V.; Banjac, B.; Knežević, D. Effect of salinity stress on antioxidant activitz and grain yield of different wheat genotypes. Turk. J. Field Crops 2022, 27, 33–40. [Google Scholar] [CrossRef]
  39. Gharib, M.; Qabil, N.; Salem, A.; Ali, M.; Awaad, H.; Mansour, E. Characterization of wheat landraces and commercial cultivars based on morpho-phenological and agronomic traits. Cereal Res. Commun. 2020, 49, 149–159. [Google Scholar] [CrossRef]
  40. Saradadevi, G.P.; Das, D.; Mangrauthia, S.K.; Mohapatra, S.; Chikkaputtaiah, C.; Roorkiwal, M.; Solanki, M.; Sundaram, R.M.; Chirravuri, N.N.; Sakhare, A.S.; et al. Genetic, Epigenetic, Genomic and Microbial Approaches to Enhance Salt Tolerance of Plants: A Comprehensive Review. Biology 2021, 10, 1255. [Google Scholar] [CrossRef] [PubMed]
  41. Denčić, S.; Kastori, R.; Kobiljski, B.; Duggan, B. Evaluation of grain yield and its components in wheat cultivars and landraces under near optimal and drought conditions. Euphytica 2000, 113, 43–52. [Google Scholar] [CrossRef]
  42. Matković Stojšin, M.; Petrović, S.; Banjac, B.; Zečević, V.; Roljević Nikolić, S.; Majstorović, H.; Đorđević, R.; Knežević, D. Assessment of genotype stress tolerance as an effective way to sustain wheat production under salinity stress conditions. Sustainability 2022, 14, 6973. [Google Scholar] [CrossRef]
  43. Ljubičić, N.; Popović, V.; Ćirić, V.; Kostić, M.; Ivošević, B.; Popivić, D.; Pandžić, M.; El Musafah, S.; Janković, S. Multivariate Interaction Analaysis of Winter Wheat Grown in Environmen of Limited Soil Conditions. Plants 2021, 10, 604. [Google Scholar] [CrossRef]
  44. Purchase, J.L.; Hatting, H.; van Deventer, C.S. Genotype × environment interaction of winter wheat (Triticum aestivum L.) in South Africa: II. Stability analysis of yield performance. S. Afr. J. Plant Soil 2000, 17, 101–107. [Google Scholar] [CrossRef]
  45. Hagos, H.G.; Abay, F. AMMI and GGE biplot analysis of bread wheat genotypes in the northern part of Ethiopia. J. Plant Breed. Genet. 2013, 1, 12–18. [Google Scholar]
  46. Zhao, C.; Liu, B.; Piao, S.; Wang, X.; Lobell, D.B.; Huang, Y.; Huang, M.; Yao, Y.; Bassu, S.; Ciais, P.; et al. Temperature increase reduces global yields of major crops in four independent estimates. Proc. Natl. Acad. Sci. USA 2017, 114, 9326–9331. [Google Scholar] [CrossRef] [Green Version]
  47. Dimitrijević, M.; Petrović, S.; Banjac, B. Wheat breeding in abiotic stress conditions of solonetz. Genetika 2012, 44, 91–100. [Google Scholar] [CrossRef]
  48. Matković Stojšin, M.; Zečević, V.; Petrović, S.; Dimitrijević, M.; Mićanović, D.; Banjac, B.; Knežević, D. Variability, correlation, path analysis and stepwise regression for yield components of different wheat genotypes. Genetika 2018, 50, 817–828. [Google Scholar] [CrossRef] [Green Version]
  49. Kakoulidou, I.; Avramidou, E.V.; Baranek, M.; Brunel-Muguet, S.; Farrona, S.; Johannes, F.; Kaiserli, E.; Lieberman-Lazarovich, M.; Martinelli, F.; Mladenov, V.; et al. Epigenetics for crops improvement of global change. Biology 2021, 10, 766. [Google Scholar] [CrossRef]
  50. El-Hendawy, S.E.; Hassan, W.M.; Al-Suhaibani, N.A.; Refay, Y.; Abdella, K.A. Comparative performance of multivariable agro-physiological parameters for detecting salt tolerance of wheat cultivars under simulated saline field growing conditions. Front. Plant Sci. 2017, 8, 435. [Google Scholar] [CrossRef] [Green Version]
  51. El-Hendawy, S.; Al-Suhaibani, N.; Mubushar, M.; Tahir, M.U.; Refay, Y.; Tola, E. Potential use of hyperspectral reflectance as a high-throughput nondestructive phenotypic tool for assessing salt tolerance in advanced spring wheat lines under field conditions. Plants 2021, 10, 2512. [Google Scholar] [CrossRef]
  52. Mansour, E.; Moustafa, E.S.; Desoky, E.S.M.; Ali, M.; Yasin, M.A.; Attia, A.; Alsuhaibani, N.; Tahir, M.U.; El-Hendawy, S. Multidimensional evaluation for detecting salt tolerance of bread wheat genotypes under actual saline field growing conditions. Plants 2020, 9, 1324. [Google Scholar] [CrossRef]
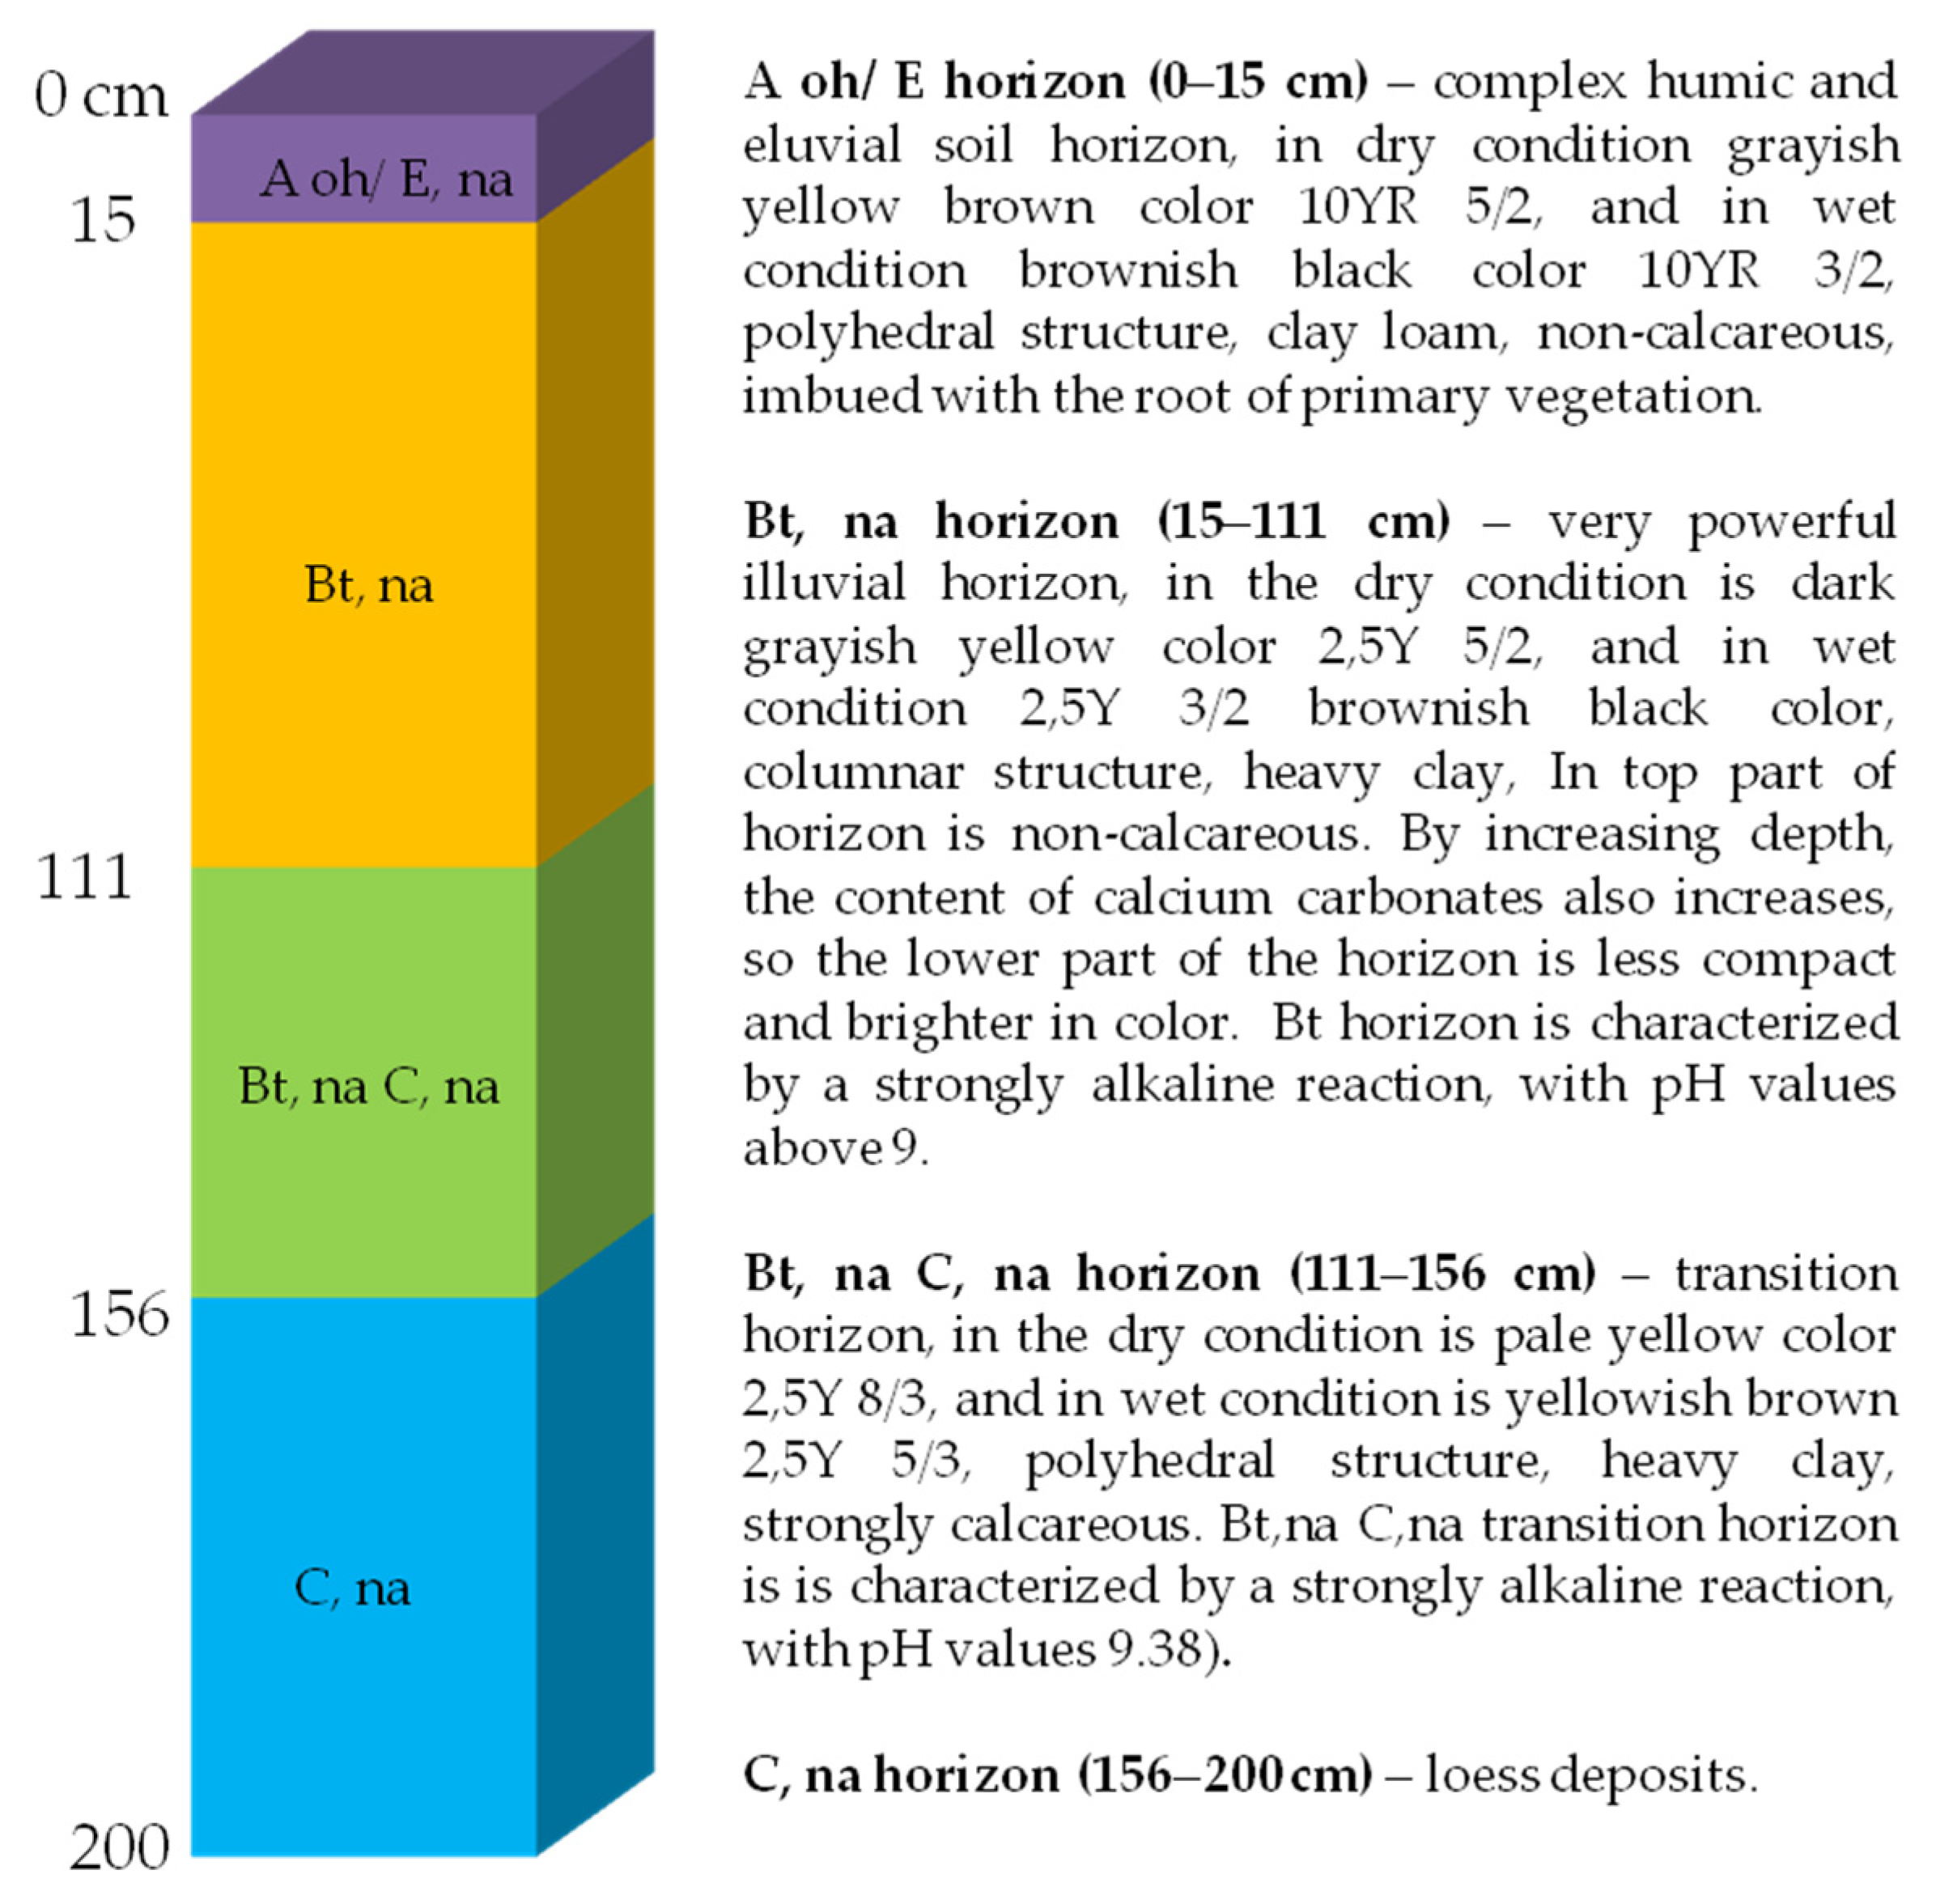
Figure 1. Soil profile description of solonetz soil type in Kumane.
Sustainability 14 08598 g001
Figure 2. Minimum, maximum and mean values monthly temperature (°C) and monthly precipitation (mm) during the field trial at microclimate conditions A, B and C in the Kumane site.
Sustainability 14 08598 g002
Figure 3. AMMI 1 biplot of 11 wheat and 1 triticale cultivars across nine environments for the estimation of G × E interaction for ear mass. Legend: codes E1, E4 and E7 = solonetz; natural pasture in microclimate conditions A, B and C; codes E2, E5 and E8 = soil reclaimed by 25 t × ha−1 phosphogypsum in microclimate conditions A, B and C; codes E3, E6 and E9 = soil reclaimed by 50 t × ha−1 phosphogypsum in microclimate conditions A, B and C.
Sustainability 14 08598 g003
Figure 4. AMMI 1 biplot of 11 wheat and 1 triticale cultivars across nine environments for the estimation of G × E interaction for grain mass per ear. Legend: codes E1, E4 and E7= solonetz; natural pasture in microclimate conditions A, B and C; codes E2, E5 and E8 = soil reclaimed by 25 t × ha−1 phosphogypsum in microclimate conditions A, B and C; codes E3, E6 and E9 = soil reclaimed by 50 t × ha−1 phosphogypsum in microclimate conditions A, B and C.
Sustainability 14 08598 g004
Figure 5. Heatmap of Pearson correlation coefficient for ear mass (EarMass), grain mass per ear (GM per Ear) and grain yield (Yield) for examined genotypes grown under 3S, during microclimate conditions A, B and C.
Sustainability 14 08598 g005
Figure 6. Principal component analysis for ear mass (EarMass), grain mass per ear (GM per Ear) and grain yield (Yield) for examined genotypes grown under 3S, during microclimate conditions A, B and C.
Sustainability 14 08598 g006
Table 1. Pedigree of examined genotypes (11 wheat genotypes and 1 triticale genotype).
Genotype DescriptionGenotype NameGenotype Pedigree
Winter wheat cultivarRenesansaJugoslavija/NS 55–25
Winter wheat cultivarPobedaSremica/Balkan
Winter wheat cultivarEvropa 90Talent/NSR2
Winter wheat cultivarNovosadska rana 5NSR1/Tisa//Partizanka/3/Mačvanka 1
Winter wheat cultivarDraganaSremka 2/Francuska
Winter wheat cultivarRapsodijaAgri/Nacozari F76//Nizija
Winter wheat cultivarSimonidaNS 63–25/Rodna//NS-3288
Winter wheat cultivarCipovkaNS 3288/Rodna
Local population; old winter wheatBanatkaLV-Banat
Winter wheat cultivar; old winter wheatBankut 1205Bankut 5/Marquis
Optional wheat cultivarNevesinjkaDugoklasа/Jarka
Triticosecale cultivarOdisejLT 338.75/BL. 517
Table 2. Adsorbed cations content and salinity properties of solonetz at Kumane.
Horizon
(Depth cm)
Adsorbed CationsSalinity Properties
Ca++
(mg/100 g Soil)
Mg++
(mg/100 g Soil)
K+
(mg/100 g Soil)
Na+
(mg/100 g Soil)
Ca++
(%) *
Na+
(%) *
ECe 25 °C **
(mS/cm)
Total Salts
(%)
pH
Soil Extract
Aoh/E, na
(0–15)
128.2637.9274.6820.6953.147.910.620.035.41
Bt, na
(15–111)
392.98136.7426.98269.6758.9232.902.160.157.72
Bt, na C, na
(111–156)
707.81143.7919.16214.0461.1618.061.100.178.89
C, na
(156–200)
658.51136.5015.64152.6563.8014.491.030.128.79
* percentage in relation to the total ions content in the exchange complex of soil, ** ECe 25 °C = electrical conductivity of soil extract (ECe at 25 °C).
Table 3. Description of examined environments.
Environments
Microclimate condition Acode E1solonetz; natural pasture
code E2Soil reclaimed by 25 t × ha−1 phosphogypsum
code E3Soil reclaimed by 50 t × ha−1 phosphogypsum
Microclimate condition Bcode E4solonetz; natural pasture
code E5Soil reclaimed by 25 t × ha−1 phosphogypsum
code E6Soil reclaimed by 50 t × ha−1 phosphogypsum
Microclimate condition Ccode E7solonetz; natural pasture
code E8Soil reclaimed by 25 t × ha−1 phosphogypsum
code E9Soil reclaimed by 50 t × ha−1 phosphogypsum
Table 4. Average values ( x ¯ ) and coefficient of variation (V) of ear mass for examined genotypes (11 wheat genotypes and 1 triticale genotype) in nine agro-ecological growing conditions.
Environments
GenotypeSolonetz;Soil Reclaimed by PhosphogypsumAverage
Value
Natural Pasture25 t × ha−150 t × ha−1
Codes E1; E4 and E7Codes E2; E5 and E8Codes E3; E6 and E9
x ¯ (g) V (%) x ¯ (g) V (%) x ¯ (g) V (%) x ¯ ¯ (g) V (%)
Renesansa1.413.61.62.81.410.21.58.9
Pobeda1.66.91.625.41.211.01.514.4
Evropa 901.75.31.33.01.615.81.58.0
NSR5 1.56.81.212.01.46.31.48.4
Dragana1.89.51.09.81.117.81.312.4
Rapsodija1.511.01.413.31.210.91.411.7
Simonida1.411.01.310.41.37.51.39.6
Cipovka1.59.61.313.21.35.31.49.4
Banatka0.88.60.87.01.03.80.96.5
Bankut 12051.17.41.16.41.27.71.17.2
Nevesinjka1.35.11.613.31.711.81.510.1
Odisej 2.15.52.212.92.44.42.27.6
Average value1.58.41.410.81.49.4
LSD0.05 = 0.180
LSD0.01 = 0.236
Table 5. AMMI analysis of variance for the ear mass of 11 wheat and 1 triticale cultivars examined across nine environments.
Source of Variation 1df 2MS 3F ValueF TableThe Share of Total Variation
0.050.01
Total3230.4---100
Treatments1071.1** 13.031.001.0086.60
Genotypes112.7** 33.931.832.3223.19
Environments85.9** 75.541.942.5136.78
Blocks180.10.981.571.871.10
Interactions880.4** 4.871.001.0026.64
IPCA1 4180.7** 8.741.571.8736.71
IPCA2160.5** 6.391.571.8723.85
IPCA3140.4** 4.981.752.1816.26
IPCA4120.3** 3.221.752.189.00
IPCA5100.3** 3.281.832.327.64
IPCA680.2* 2.451.942.514.56
IPCA760.11.322.092.801.85
Residuals40.010.132.373.32-
Error1980.08----
1 All sources were tested in relation to the error; 2 degree of freedom; 3 mean of square; 4 extracted interaction axes; *. F value is statistical significant at 0.05 possibility; **. F value is statistical significant at 0.01 possibility.
Table 6. Average value ( x ¯ ) and coefficient of variation (V) of grain mass per ear for examined genotypes (11 wheat genotypes and 1 triticale genotype) in nine agro-ecological growing conditions.
Environments
GenotypeSolonetz;Soil Reclaimed by PhosphogypsumAverage
Value
Natural Pasture25 t × ha−150 t × ha−1
Codes E1; E4 and E7Codes E2; E5 and E8Codes E3; E6 and E9
x ¯ (g) V (%) x ¯ (g) V (%) x ¯ (g) V (%) x ¯ ¯ (g) V (%)
Renesansa1.112.41.212.31.215.31.213.3
Pobeda1.35.31.221.20.99.41.112.0
Evropa 901.35.10.93.71.313.91.27.6
NSR51.112.51.010.71.29.11.110.8
Dragana1.49.60.65.30.810.20.98.4
Rapsodija1.113.31.19.81.014.11.112.4
Simonida1.114.61.06.00.98.01.09.5
Cipovka1.022.60.813.11.04.00.913.2
Banatka0.610.00.68.90.719.70.612.9
Bankut 12050.82.10.87.70.88.20.86.0
Nevesinjka1.06.41.314.31.311.61.210.8
Odisej 1.58.21.715.81.92.01.78.7
Average value1.110.21.010.71.110.5
LSD0.05 = 0.142
LSD0.01 = 0.187
Table 7. AMMI analysis of variance for the grain mass per ear of 11 wheat and 1 triticale cultivars, examined across nine environments.
Source of Variation 1df 2MS 3F ValueF TableThe Share of Total Variation
0.050.01
Total3230.3---100
Treatments1070.7** 13.101.001.0086.04
Genotypes111.8** 35.311.832.3223.85
Environments83.4** 39.551.942.5131.89
Blocks180.1* 1.641.571.871.82
Interactions880.3** 5.611.001.0030.30
IPCA1 4180.5** 10.301.571.8737.58
IPCA2160.4** 8.411.571.8727.26
IPCA3140.3** 5.281.752.1814.95
IPCA4120.2** 3.771.752.189.15
IPCA5100.2** 2.841.832.325.76
IPCA680.11.901.942.513.08
Residuals100.061.081.832.32-
Error1980.05----
1 All sources were tested in relation to the error; 2 degree of freedom; 3 mean of square; 4 extracted interaction axes; * F value is statistical significant at 0.05 possibility; **. F value is statistical significant at 0.01 possibility.
Table 8. The mean value, estimates of variance components, genotypic and phenotypic variance, and heritability of ear mass and grain mass per ear.
Traits aMean ValuesEstimates of Variance Components bGenotypes Mean of SquareCVg (%)CVp (%)h2
(%)
σ2gσ2pσ2iσ2e
All tested microclimates combined
EM1.410.0870.2720.1040.0812.744 **20.9236.9831.98
GMpE1.080.0570.1920.0790.0561.837 **22.1140.5729.69
Microclimate A
EM0.980.0210.0740.0080.0450.256 **14.8427.8428.38
GMpE0.750.0080.0540.0140.0320.150 **12.0031.1914.81
Microclimate B
EM1.820.2330.3900.1160.0412.484 **26.5934.4159.74
GMpE1.400.1550.2620.0790.0281.665 **28.1436.5959.16
Microclimate C
EM1.440.0720.3530.1250.1561.176 **18.5941.1720.40
GMpE1.080.0460.2560.1050.1050.837 **19.8246.7617.97
a EM = ear mass (g); GMpE = grain mass per ear (g); b σ2g-genotypic variance, σ2p-phenotypic variance, σ2i -interaction variance, σ2e-ecological variance; CVg = genotypic coefficient of variation; CVp = phenotypic coefficient of variation; h2 = heritability in broad sense. **. Tested value is statistical significant at 0.01 possibility.
Publisher’s Note: MDPI stays neutral with regard to jurisdictional claims in published maps and institutional affiliations.