Article

Dimensionless Analysis of the Effects of Junction Angle on the Gas-Liquid Two-Phase Flow Transition and the Scaling Law of the Microbubble Generation Characteristics in Y-Junctions

R&D Institute of Fluid and Powder Engineering, Dalian University of Technology, Dalian 116024, China
*
Authors to whom correspondence should be addressed.
Sustainability 2022, 14(14), 8592; https://doi.org/10.3390/su14148592
Submission received: 23 June 2022 / Revised: 6 July 2022 / Accepted: 11 July 2022 / Published: 13 July 2022

Abstract

:
Gas-liquid two-phase flow patterns and gas slug hydrodynamics were experimentally studied in three Y-junctions with different junction angles of 60°, 90° and 120°. Microbubbles were generated in the sodium alginate aqueous solution with the surfactant Tween20. Four main flow patterns were observed, i.e., stratified flow, annular flow, dispersed bubble flow and slug bubble flow. The formation mechanism of the bubble flow was explained by a force analysis, which was based on the dimensionless analysis regarding Capillary number, Weber number and Euler number. The transition criteria of the gas-liquid two-phase flow patterns was set up by these three dimensionless numbers. Additionally, the characteristics of the slug bubble were investigated, which made a scaling criterion for eliminating the influence of the angle factor become possible. A new scaling law (validity range within 2.88 < Re1 < 14.38, 0.0068 < We1 < 0.1723) was proposed to predict the bubble size and it showed a good agreement with the experimental results.

1. Introduction

Microfluidic technology is attracting considerable interest in varied areas, e.g., chemical, biochemical and pharmaceutical technology [1,2,3,4]. The characteristics, namely large ratios between surface and volume and large coefficients of heat and mass transfer, make microchannel become desirable for these applications [5,6,7,8]. Due to the scale miniaturization and efficient and controllable generation process, one of the key points of the microfluidic devices is to generate micro-bubble/droplet with specific characteristics which strongly depends on the two-phase flow patterns. Therefore, it is of great importance to observe the formation mechanism of two-phase flow and microbubble hydrodynamics when the two phases are injected into the microchannels. While in the past investigations, considerable work has been devoted to the study of two-phase flow in the basic Y-junction microchannel applicable in pharmaceutical and biomedical industry [9,10,11,12]. However, only a few work [13,14,15] considered the effect of junction angle on the gas-liquid two-phase flow patterns and micro-bubble/droplet generation characteristics which determine the controllable application range of the micro-products. Therefore, more attention is paid to the influence of the Y-junction angle on the gas-liquid two-phase flow and bubble characteristics in this study.
The gas-liquid two-phase flow patterns in microchannels with different geometries are roughly divided into: stratified flow, annular flow, bubble flow and slug flow [16,17,18]. Fourar et al. [19] paralleled the gas-liquid two-phase into the microchannel by controlling the gas phase pressure and the liquid phase flow rate, and observed the flow patterns such as bubble flow, droplet flow and annular flow. Meanwhile, the study also figured out the flow pattern distribution and transformation boundaries. Although the microchannel used by Fourar et al. was similar in geometry to the one in the investigation conducted by Mandhane et al. [20], the distribution of gas-liquid two-phase flow patterns was not completely consistent with the results of the experiments conducted by Mandhane et al. The reason for the different conclusions were probably due to the liquid properties and size parameter of the microchannel. Triplett et al. [21] observed the bubble flow, churn flow, slug flow, slug-annular flow and annular flow in the investigations. Relevant experiments were conducted in microchannels of circular and semi-triangular cross-sections with different hydraulic diameters. The pattern maps of gas and liquid superficial velocities were brought up and the transition boundaries were obtained. The effects of the geometry of mixer, the inlet section, the cross-section and diameter of the microchannel, the wetting ability of the microchannel wall and liquid properties on the two-phase flow patterns were already comprehensively studied by Rebrov et al. [22]. Recently, Yan et al. [23] investigated the influence of liquid properties on gas-liquid two-phase flow patterns with the combination of experimental and numerical methods in a 60° Y-junction. The authors found that the transition line of flow pattern changed to the direction of lower gas velocity and higher liquid velocity with decreasing liquid surface tension. However, the increase of liquid viscosity had no obvious influence on the flow pattern transition line. According to the investigation results in previous studies, the gas-liquid two-phase flow pattern in the microchannel was mainly controlled by the microchannel geometry, microchannel surface characteristics, flow ratio of gas-liquid phases and fluid properties. However, most of the experiments only stayed in the confirmation of different flow types. There were few studies focusing on the transition mechanism between streams and how two-phase flows acted when they met with different angles. The quantification of the transition boundary also needs further study.
As mentioned above, two-phase flow patterns were influenced by many factors. In fact, grasping the forces involved in the formation process of the two-phase flow is pivotal to control the generation characteristics of bubble slug. The dimensionless analysis is an effective method to develop general transition criteria considering all the forces. Waelchli et al. [24] investigated the distribution of the gas-liquid two-phase flow patterns using Reynolds number and Weber number of liquid and gas phase, respectively. The transition boundaries were obtained and compared among three kinds of liquid and several channel sizes. Dessimoz et al. [25] who introduced Capillary number and Reynolds number into the slug and parallel flows believed that the viscous force and interfacial force played a crucial role in the formation of the slug and parallel flows. In the study of Cao et al. [26], a detailed force analysis was conducted. They obtained some conclusions, such as that the slug flow and droplet flow were dominated by the interfacial force and the shear force, respectively. The Reynolds number, Capillary number and Weber number were used in the dimensionless analysis to deliver the transition model of annular flow, slug flow and droplet flow. Many influence factors have been reported to set up the general rule for flow pattern transition, however, the influence of the junction angle on the two-phase flow patterns needs further investigation.
The microbubble is one of the important productions generated by microfluidic devices. The microbubble size and generation frequency seem similar to the most attractive aspects to the observers. Garstecki et al. [27] reported that the microbubble size was primarily dependent on the ratio of the gas-liquid flow rates in a T-junction. Wang et al. [28] concluded that the average microbubble diameters were dominated by the gas/liquid flow rates, the liquid phase viscosity and the experimental temperature, but independent with the gas component. An equation organized by the Capillary number of the liquid phase and the ratio of two-phase flow rates was suggested to predict the dimensionless microbubble diameters. Parhizkar et al. [29] studied the effect of the gas pressure, the liquid flow rate, the ratio of gas-liquid flow rate and liquid properties on the microbubble size in a T-junction. Sobieszuk at al. [30] brought forward measurements of the bubble and slug lengths using three Y-junction microchannels with different materials (polydimethyloxosilane (PDMS); glass; glycol (PETg)) and four different liquids (water, ethanol, propanol and heptane). Rodríguez-Rodríguez et al. [31] summarized the relationship between the generation frequency and the gas/liquid inlet conditions. It appeared that the inlet conditions of the two-phase, such as gas pressure, gas/liquid flow rate, the ratio of gas-liquid flow rates and liquid properties were the most common factors taken into account by the investigators about the size of microbubble. Recently, Peng et al. [32] innovatively investigated the gas-liquid-solid three-phase flow characteristics, and concluded a new scaling law of slug length and microbubble size. To the best of our knowledge, the effect of the junction angle on the microbubble size was hardly studied to some extent. Therefore, a modified scaling law is required to describe the influence of the angle factor in the microbubble formation process and predict microbubble size by taking all these parameters into account.
As stated above, although there were plenty of studies on gas-liquid two-phase flow and generation characteristics of microbubble in the microfluidic devices, few of them focused on the angle factor of junctions. In addition, only a few investigations considered the force exerted on the two-phase interface and applied dimensionless analysis in the qualitative analysis of the forces. In this study, flow patterns and generation characteristics of microbubble were experimentally studied in Y-junctions with the crossed angle (φ) of 60°, 90° and 120°. A qualitative force analysis was carried out. The transition criteria of the gas-liquid two-phase flow patterns was put forward and expressed with dimensionless parameters. Additionally, the generation characteristics of the microbubble were investigated, considering the effect of the crossed angle, and a scaling criterion for eliminating the influence of the angle factor was set up. A new scaling law was proposed to predict the microbubble size and it showed a good agreement with the experimental data.

2. Materials and Methods

2.1. Experimental Material Preparation

Sodium alginate is a natural polysaccharide extracted from brown algae or sargassum, with good solubility, stability and high safety, which makes it widely used in the field of drug delivery. The sodium alginate (SA; Sigma Aldrich, Gillingham, UK) with the concentration of 0.1% and the surfactant Tween20 (Damao Chemical Reagent Factory, Tianjin, China) with the concentration of 0.1% were added to the deionized water to prepare the continuous liquid phase. The mixture was stirred for 40 minutes by a RHB1S25 magnetic stirrer (IKA, Stauffen, Germany). The dispersed phase was air. The density of the aqueous solutions was 999 kg·m−3 measured by a DIN ISO 3507-Gay-Lussac type standard density bottle. The viscosity was 1.58 mPa·s measured by Brookfield DV2TLVTJ0 Rheometer (Brookfield Engineering Laboratory Inc., Middleborough, MA, USA) and the surface tension was 34.17 mN·m measured by a Drop Shape Analysis System, Model DSA100 (Kruss GmbH, Hamburg, Germany). All the measurements above were performed at ambient temperature.

2.2. Experimental Procedure and Data Analysis

Figure 1 shows the schematic of the experimental setup. It mainly consists of three parts. The MFCZTM-EZ microfluidic sample pump was the part aiming to deliver fluids. The Y-junctions were the main dispersed systems to generate gas-liquid two-phase flow and the microscopy image system aimed to visualize the flow patterns and record the generation characteristics of the slug bubbles. The MFCZTM-EZ microfluidic sample pump (Fluigent Co., Le Kremlin-Bicêtre, France) contained one flow measurement module and two fluid reservoirs. The three Y-junctions had the junction angle (φ) of 60°, 90° and 120°, respectively. The Y-junctions were manufactured by Suzhou Wen Hao Technology Company. The microchips were constructed by glass, and the microchannels were formed by hydrofluoric acid etching. After etching by hydrofluoric acid, the contact angle of the microchannels were 140° measured using the ImageJ software program. In addition, the dimensions of the microchannels were 150 μm in width and 75 μm in depth. XSZ optical microscope (Shangxin New Optical Technology Co., Shanghai, China) equipped with FASTCAM SA4 high speed camera (PHOTRON Co., Tokyo, Japan) or YM1600 high-definition digital camera (Shangxin New Optical Technology Co., Shanghai, China) was applied to capture the gas-liquid two-phase flow and collect the images of the microbubbles on the slide glass, respectively. The shooting speed of the FASTCAM SA4 high-speed camera was 125~5 × 10⁵ fps. The frame rate was chosen to be 2 × 10³ fps in this study to meet the experimental needs. The diameter of the microbubble was measured using the ImageJ software program. The multiple linear regression of dimensionless parameters was conducted by MatlabR2018a.
It should be noted that the errors in the experiments were mainly random errors of the measurement. This study used the Bessel calculation formula [33] which were commonly used in error analysis,
M = i = 1 n ( x i x ¯ ) 2 / ( n 1 )
to calculate the experimental standard deviation of multiple experiments and the deviations were given in the form of error bars in the text to account for the uncertainty of the experiments.

3. Results

3.1. Flow Patterns and Force Analysis of the Formation of Slug Bubbles

Figure 2 shows the main flow patterns occurred in the experiments. The dispersed bubble flow, the slug bubble flow, the annular flow and the stratified flow existed in all of the three Y-junctions with different crossed angle of 60°, 90° and 120°. The dispersed bubble flow generated microbubbles with low generation frequency (almost 10 per second). However, the microbubbles were generated with the frequency at least upon 100 per second when the slug bubble flow occurred. Meanwhile, there appeared size difference between the dispersed bubble and the slug bubble. The ratio of the axial and radial length of dispersed-bubble slugs were always less than 2 according to the experimental observations. As for slug bubbles, the ratios were always larger than 2. The much higher generation frequency and the bigger volume of air bulk made it necessary to distinguish the slug bubble flow from the dispersed bubble flow. Annular flow has liquid surrounding the gas column. The gas slugs were generated so fast that they coalesced together to form a column, which might explain the formation of annular flow. There appeared obvious boundary separating the gas phase from the liquid phase once the stratified flow occurred. The distributions of the four flow patterns were different in the 60°, 90° and 120° Y-junction systems and it could be detailed in the next section.
In the experiments, the liquid phase was first injected into the microchannels and filled the entire channels. Then, the gas phase was pumped into the other side of the Y-junctions with increasing air pressure. The dispersed bubble occurred when the gas phase penetrated into the liquid phase and a gaseous thread began to expand in the axial direction of the main channel until a neck appeared, and the liquid from the other side of the channel pinched off the gaseous thread in the main channel and entrained the bubble downstream. Continuing increasing the gas-phase pressure, the slug bubbles appeared with higher generation frequency upon 100 Hz. The formation mechanism of the slug bubble could be explained by the perspective of the forces exerted on the gas thread. Figure 3 provides qualitative force analysis. The pressure field around the thread was first set up. The pressure of the liquid phase (Pc), the pressure of the gas phase in the thread (PD) and the shear stress(τc,shear) played a crucial role in the pinching-off process of the gas slug to resist the interfacial pressure. Based on the pressure analysis, the forces exerted on the thread are shown in Figure 3b. There were forces due to the flow of gas phase (FD), liquid phase (Fc) and shear force (Fc,shear). The force Fc made the thread extend and causes the Rayleigh-Plateau instability in which phenomenon a liquid column could always break up into little droplets and the minimization of surface energy could be achieved. The force FD pinched off the thread and the shear force carried the slug downstream. The angle of the Y-junctions affected the distribution and magnitude of the forces when they were divided in the x-direction and y-direction. The annular flow was observed as the gas pressure continued increasing. However, in some situations, small waviness caused by the Kelvin-Helmholtz instability appeared on the interface of gas-liquid phase because of interfacial tension effect. The Kelvin-Helmholtz instability always occurs between two immiscible fluids with different velocity and leads to the unstable interfacial vortex street over their interface. Continuing increasing the gas pressure, the stratified flow was observed with obvious boundary between gas phase and liquid phase. The pressure in the two-phase flow were comparable.

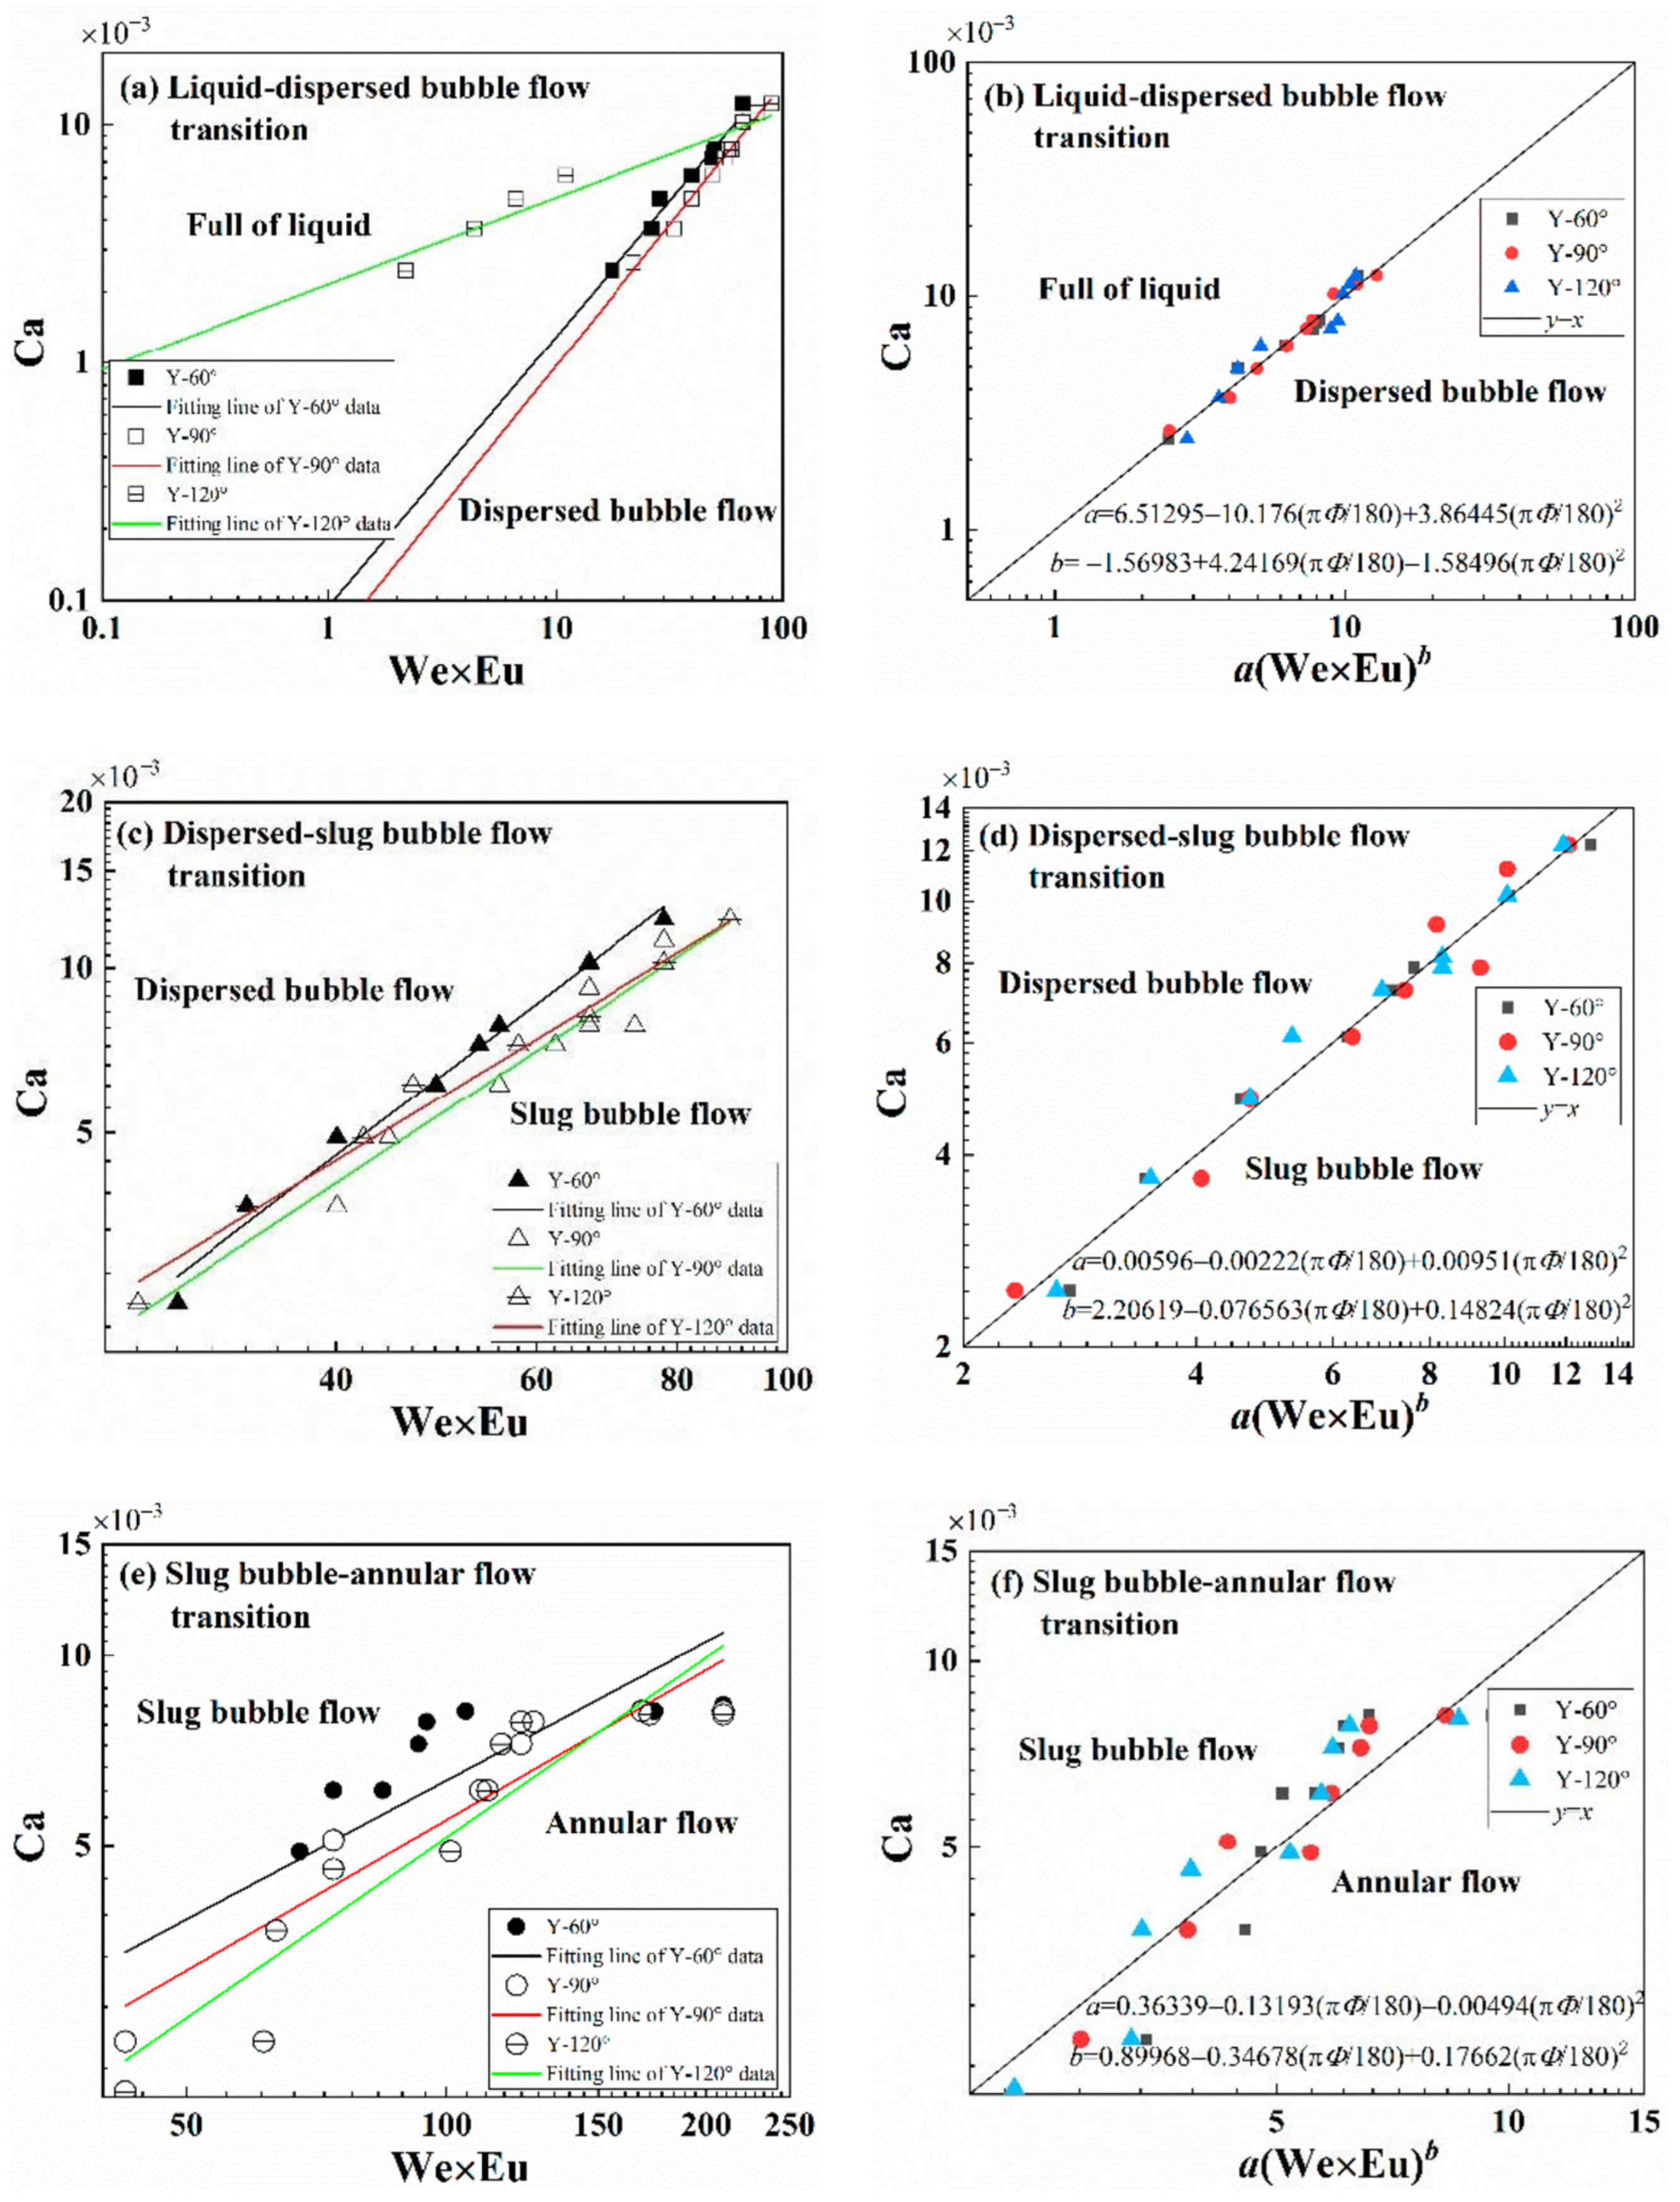
3.2. Flow Pattern Maps and the Transition Criteria of Dimensionless Analysis

Flow pattern maps of Y-junctions with the junction angles (φ) 60°, 90° and 120° are shown in Figure 4a–c, respectively. Obviously, the dispersed bubble flow and annular flow took up the smallest area in the flow pattern maps. In another word, the dispersed bubble flow and annular flow seemed more likely the transition state of the slug bubble flow with lower or higher gas pressures at constant liquid flow rates. Dispersed bubble flow occurred as gas pressure was not large enough to generate bubbles with high frequency. However, annular flow appeared with unstable waviness on the interface of the two phases when gas pressure was much higher. In the flow pattern map of Y-120° system, there was a little bigger area for the dispersed bubble flow. It is because that once the injection conditions of gas and liquid phases (Pg ~ 0–100 kPa, QL ~ 0–120 µL/min) changed, the variation rate of the forces in x-direction of the Y-120° system was the smallest due to the biggest value of φ/2, which led to a bigger area of the transition zone (the region of dispersed bubble flow). Different from the annular flow and dispersed bubble flow, the slug bubble flow occupied larger areas in the three flow pattern maps. The largest area of slug bubble flow appeared in the Y-90° system and the smallest area of slug bubble flow appeared in the Y-60° system. In contrast, the stratified flow occupied the largest area in the flow pattern map of the Y-60° system and the smallest area of the Y-120° system. The reason is that the forces in the Y-60° system were the smallest in y-direction and largest in x-direction, which made the two phases more likely to flow along the wall of the main channel instead of acting to form gas slug.
The two-phase flow patterns were affected by many factors, and the main parameters affecting the gas-liquid two-phase flows were microchannel equivalent diameter l, air pressure Pg, liquid flow rate QL, liquid viscosity μl, liquid density ρl and surface tension σ. In this study, the ∏ theorem was used to analyze the relationship between each physical quantity. The physical quantities vl, ρl and σ with different basic dimensions were selected as basic quantities, and the remaining physical quantities were taken as derived quantities. Then, the expressions of the basic quantities were established,
Π i = v l a i ρ l b i σ c i X
X = [ l   P g   μ l ] T  
The exponents in the expressions were solved by,
M 0 L 0 T 0 = ( LT 1 ) a i ( M L 3 ) b i ( M T 2 ) c i X 1  
X 1 = [ L   ML 1 T 2   ML 1 T 1 ] T  
The values of ai, bi and ci were obtained, and the expressions of dimensionless parameters were,
Π 1 = ρ l v l 2 l σ = We , Π 2 = P g v l 2 ρ l = Eu , Π 3 = v l μ l σ = Ca  
The above ∏ theorem analysis involved the main parameters affecting the transition of the gas-liquid two-phase flows. Therefore, the Weber number, Euler number and Capillary number in Equation (6) were introduced to describe the transition boundaries of the gas-liquid two-phase flows. Furthermore, considering the force analysis in Section 3.1, the inertia force (Fc), shear force (Fc,shear), pressure force (FD) and surface tension force were involved. The surface tension force prevented the thread from pinching-off while the inertia force, shear force and pressure force helped the thread break up into gas slug. The Weber number represented for the ratio of Fc and surface tension force, the Euler number represented for the ratio of FD and Fc, while the Capillary number represented for the ratio of Fc,shear and surface tension force. Therefore, from the point of view of mechanical analysis, the correlation of We, Eu and Ca should be used to describe the dynamics of gas-liquid interaction in the microfluidic Y-junctions. Normally, a function f was proposed to describe the transitions of the flow patterns,
f (Ca, Eu, We) = 0
The coefficients in Figure 5 were obtained by the multiple linear regression method. Figure 5a,b show the transition criteria from full of liquid to dispersed bubble flow. In another word, the dispersed bubble flow occurred as Ca × 103 < a(We × Eu)b (a = 6.5130 − 10.176(πφ) + 3.8645(πφ)2, b = −1.5698 + 4.2417(πφ) − 1.5850(πφ)2) with 0.002 < Ca < 0.02. Figure 5c,d illustrate the proposed transition line of dispersed bubble flow to slug bubble flow could be expressed as Ca × 103 = a(We × Eu)b (a = 0.00596 − 0.00222(πφ) + 0.00951(πφ)2, b = 2.20619 − 0.07656(πφ) + 0.14824(πφ)2) with 0.002 < Ca < 0.015. Finally, the transition line of slug bubble flow to annular flow could be described by Ca × 103 = a(We × Eu)b (a = 0.3634 + 0.1319(πφ) − 0.0049(πφ)2, b = 0.8997 − 0.3468(πφ) − 0.1766(πφ)2) with 0.002 < Ca < 0.010. Generally speaking, the generation region of gas-liquid two-phase flow in Y-junction with different angle could be obtained by employing the transition criteria given above in this study.

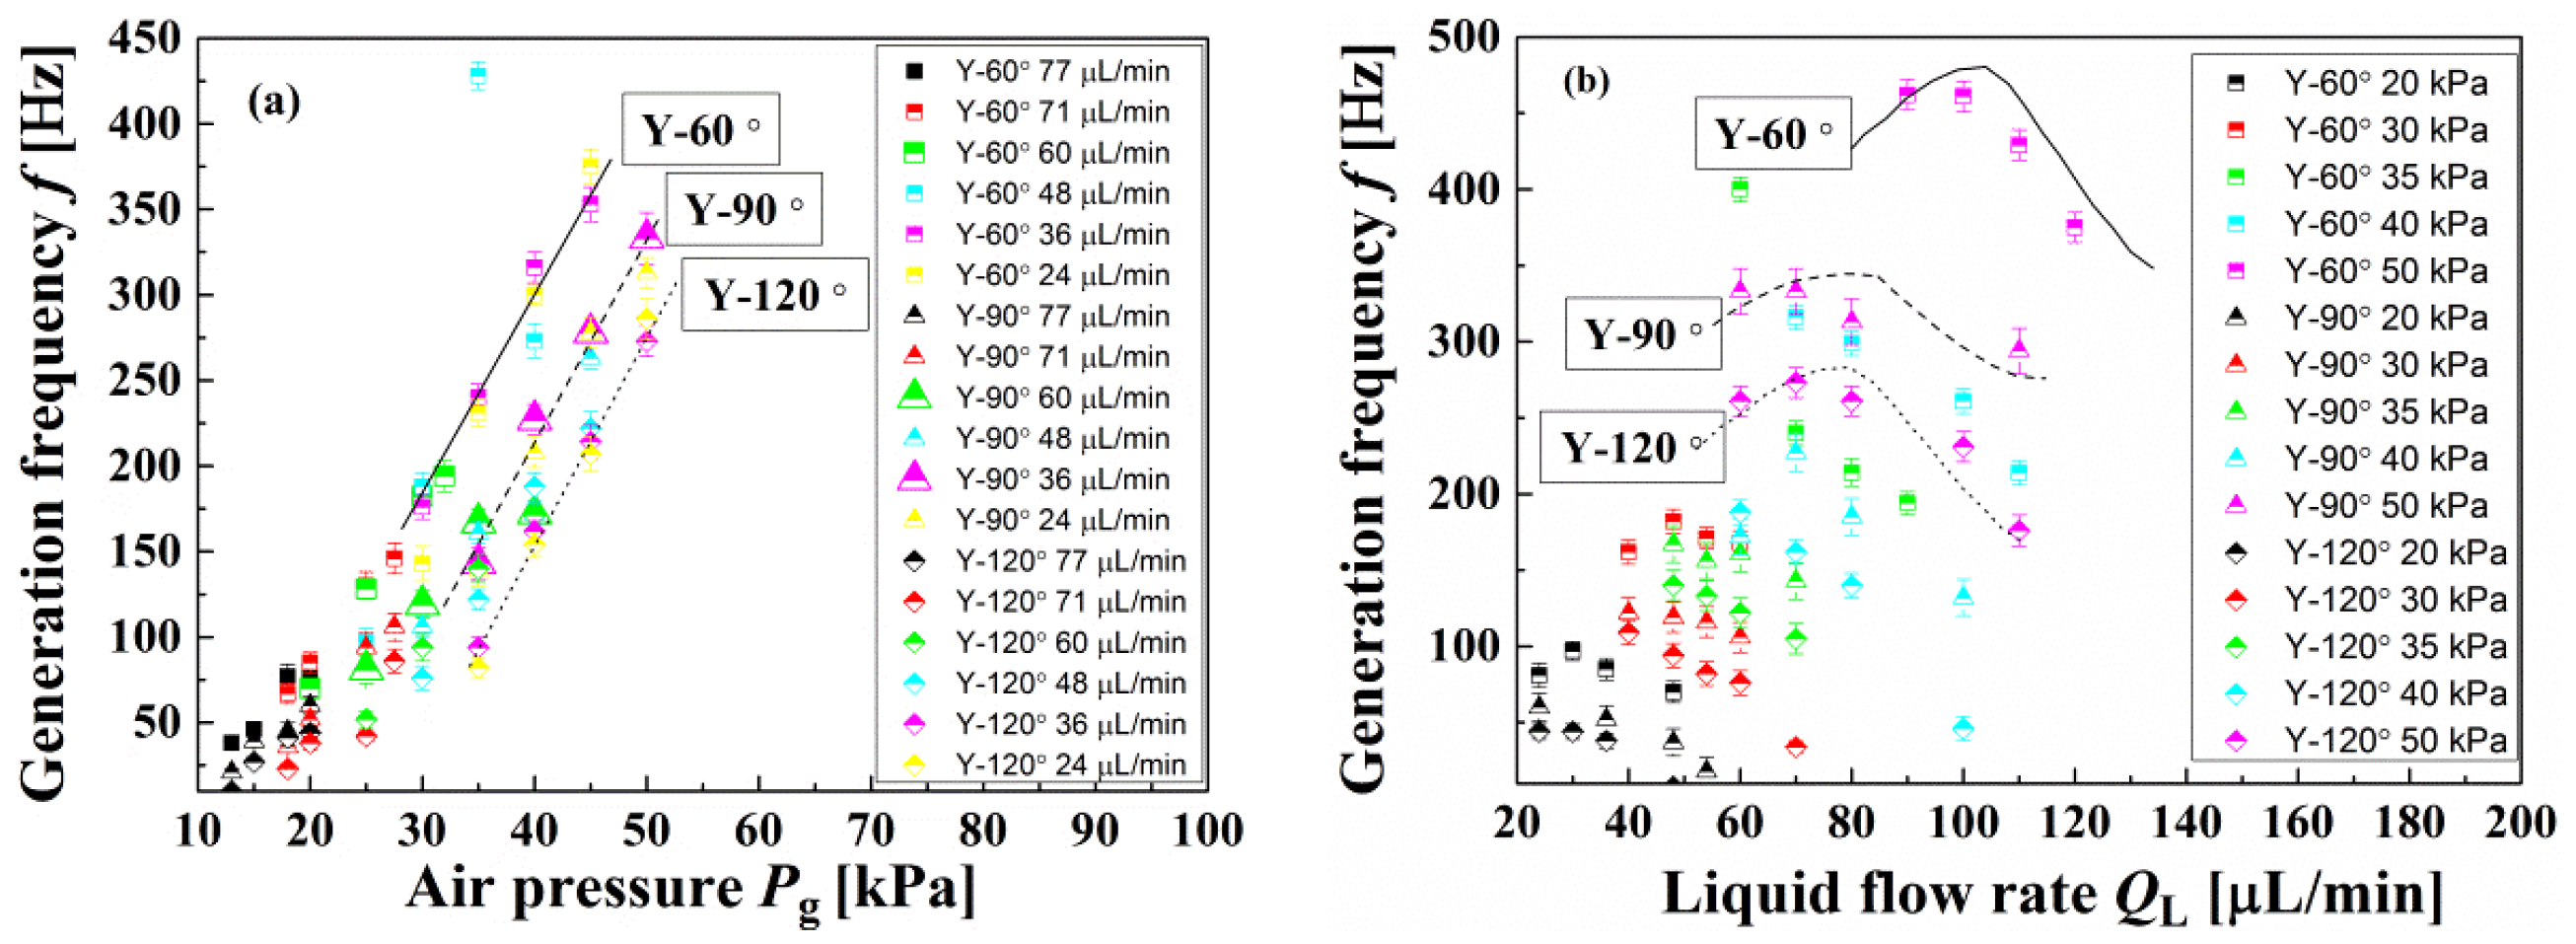
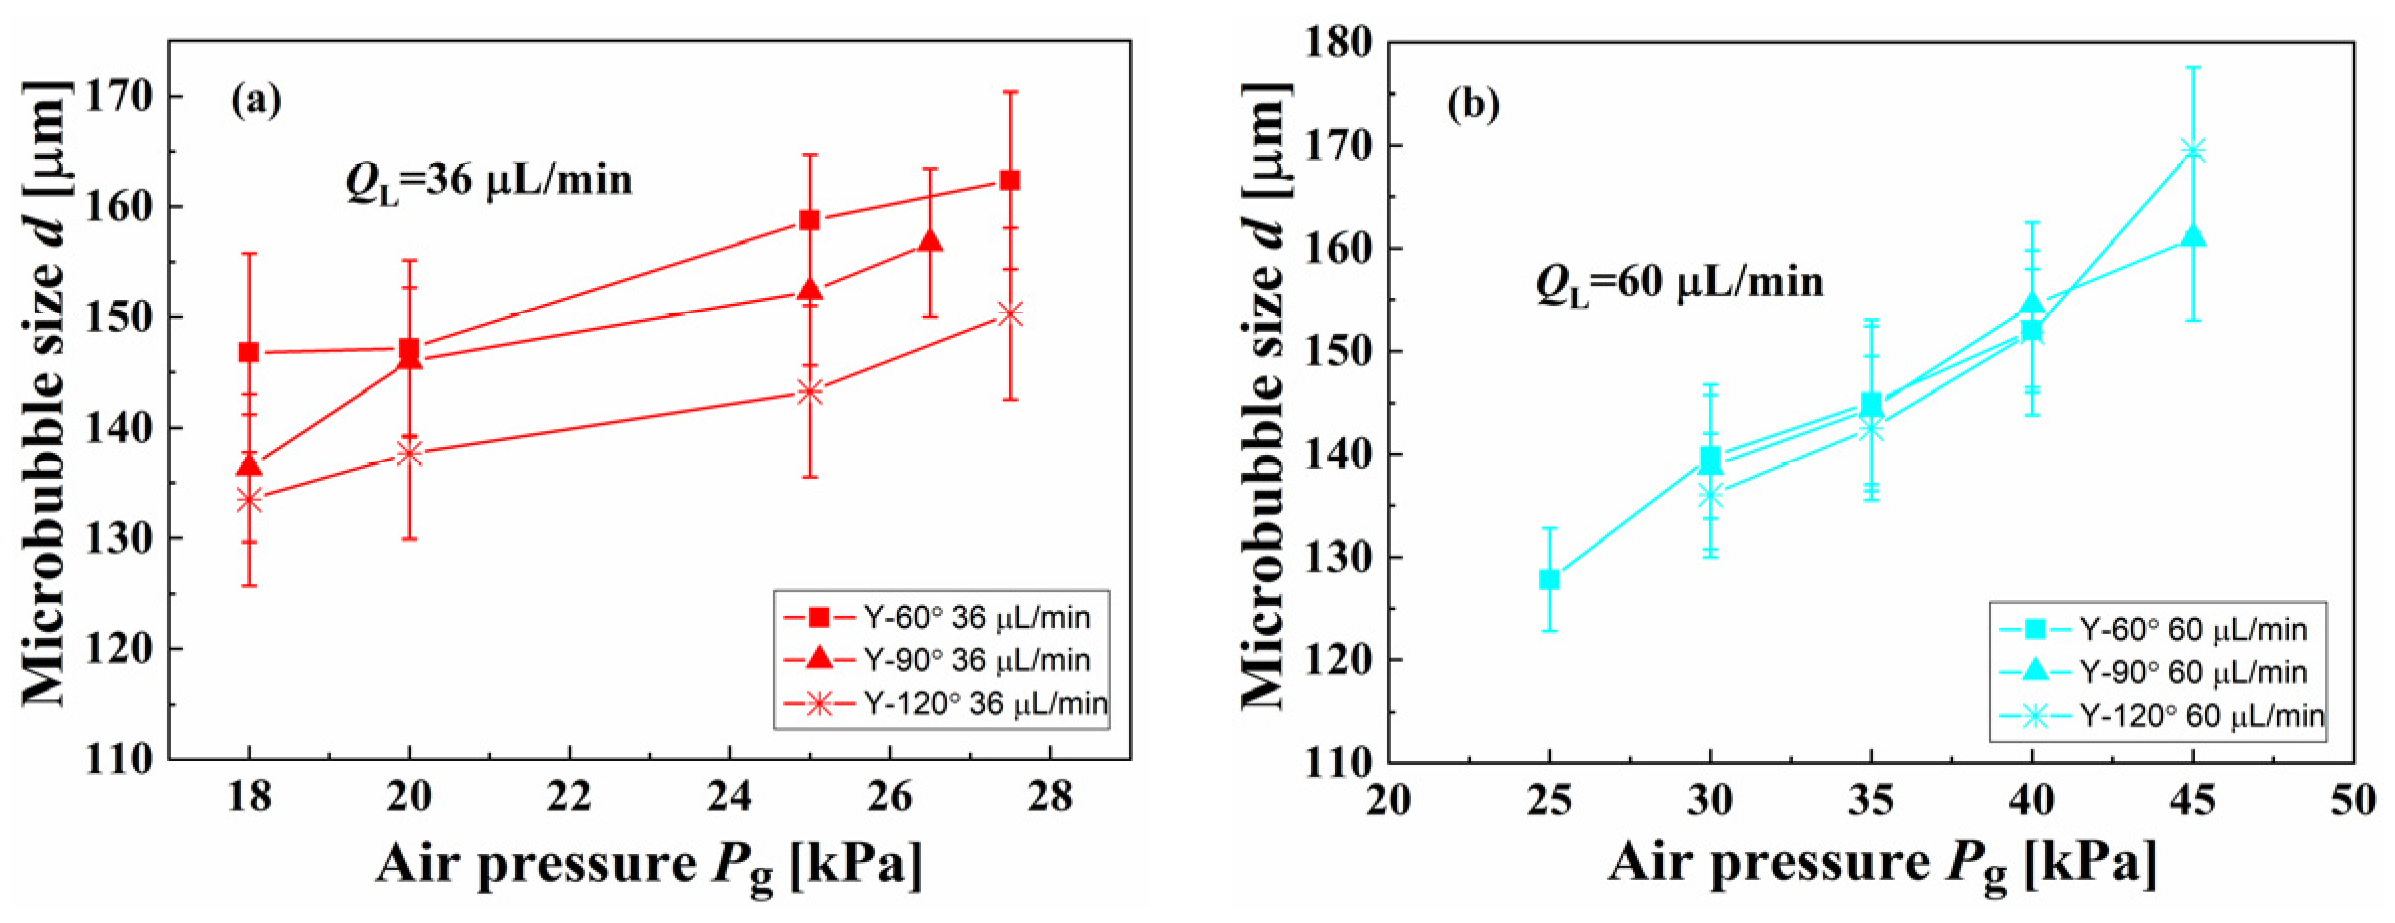
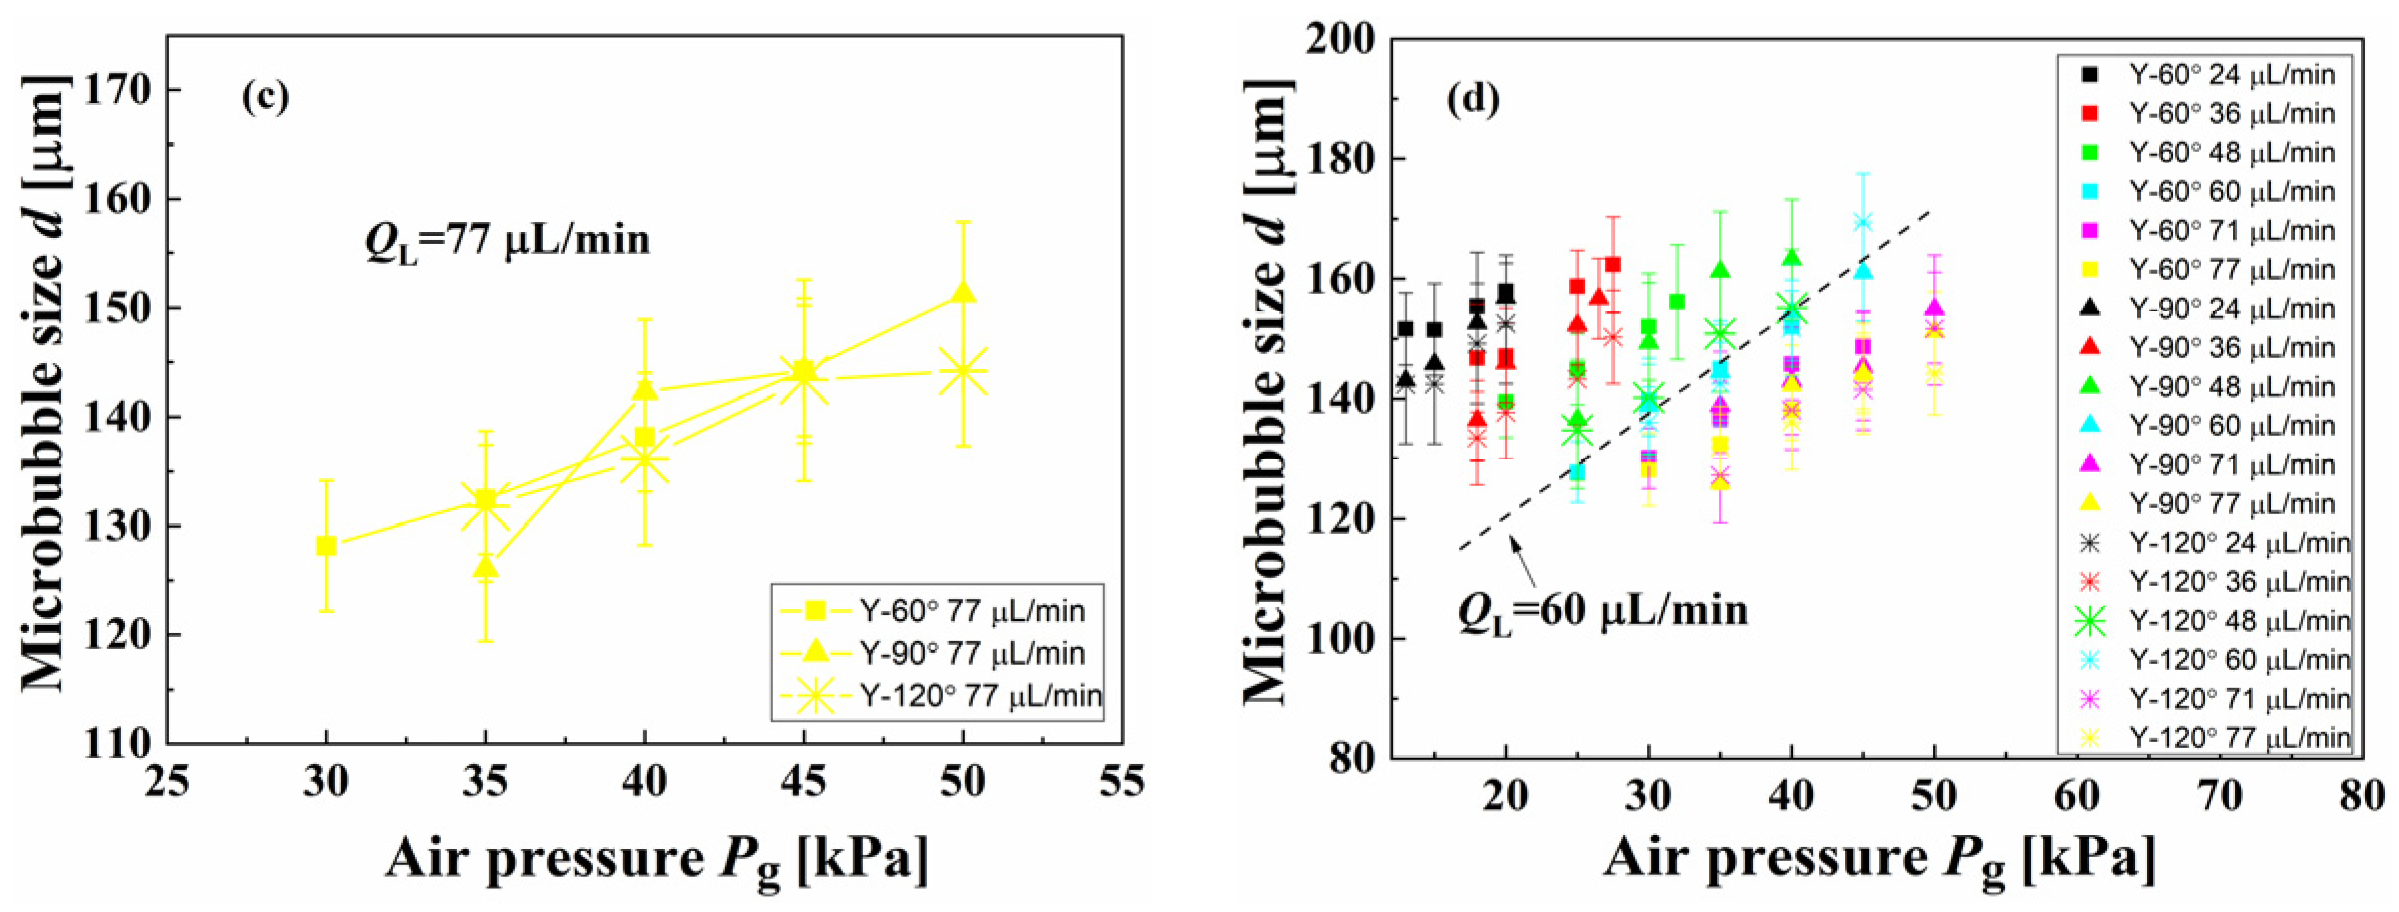
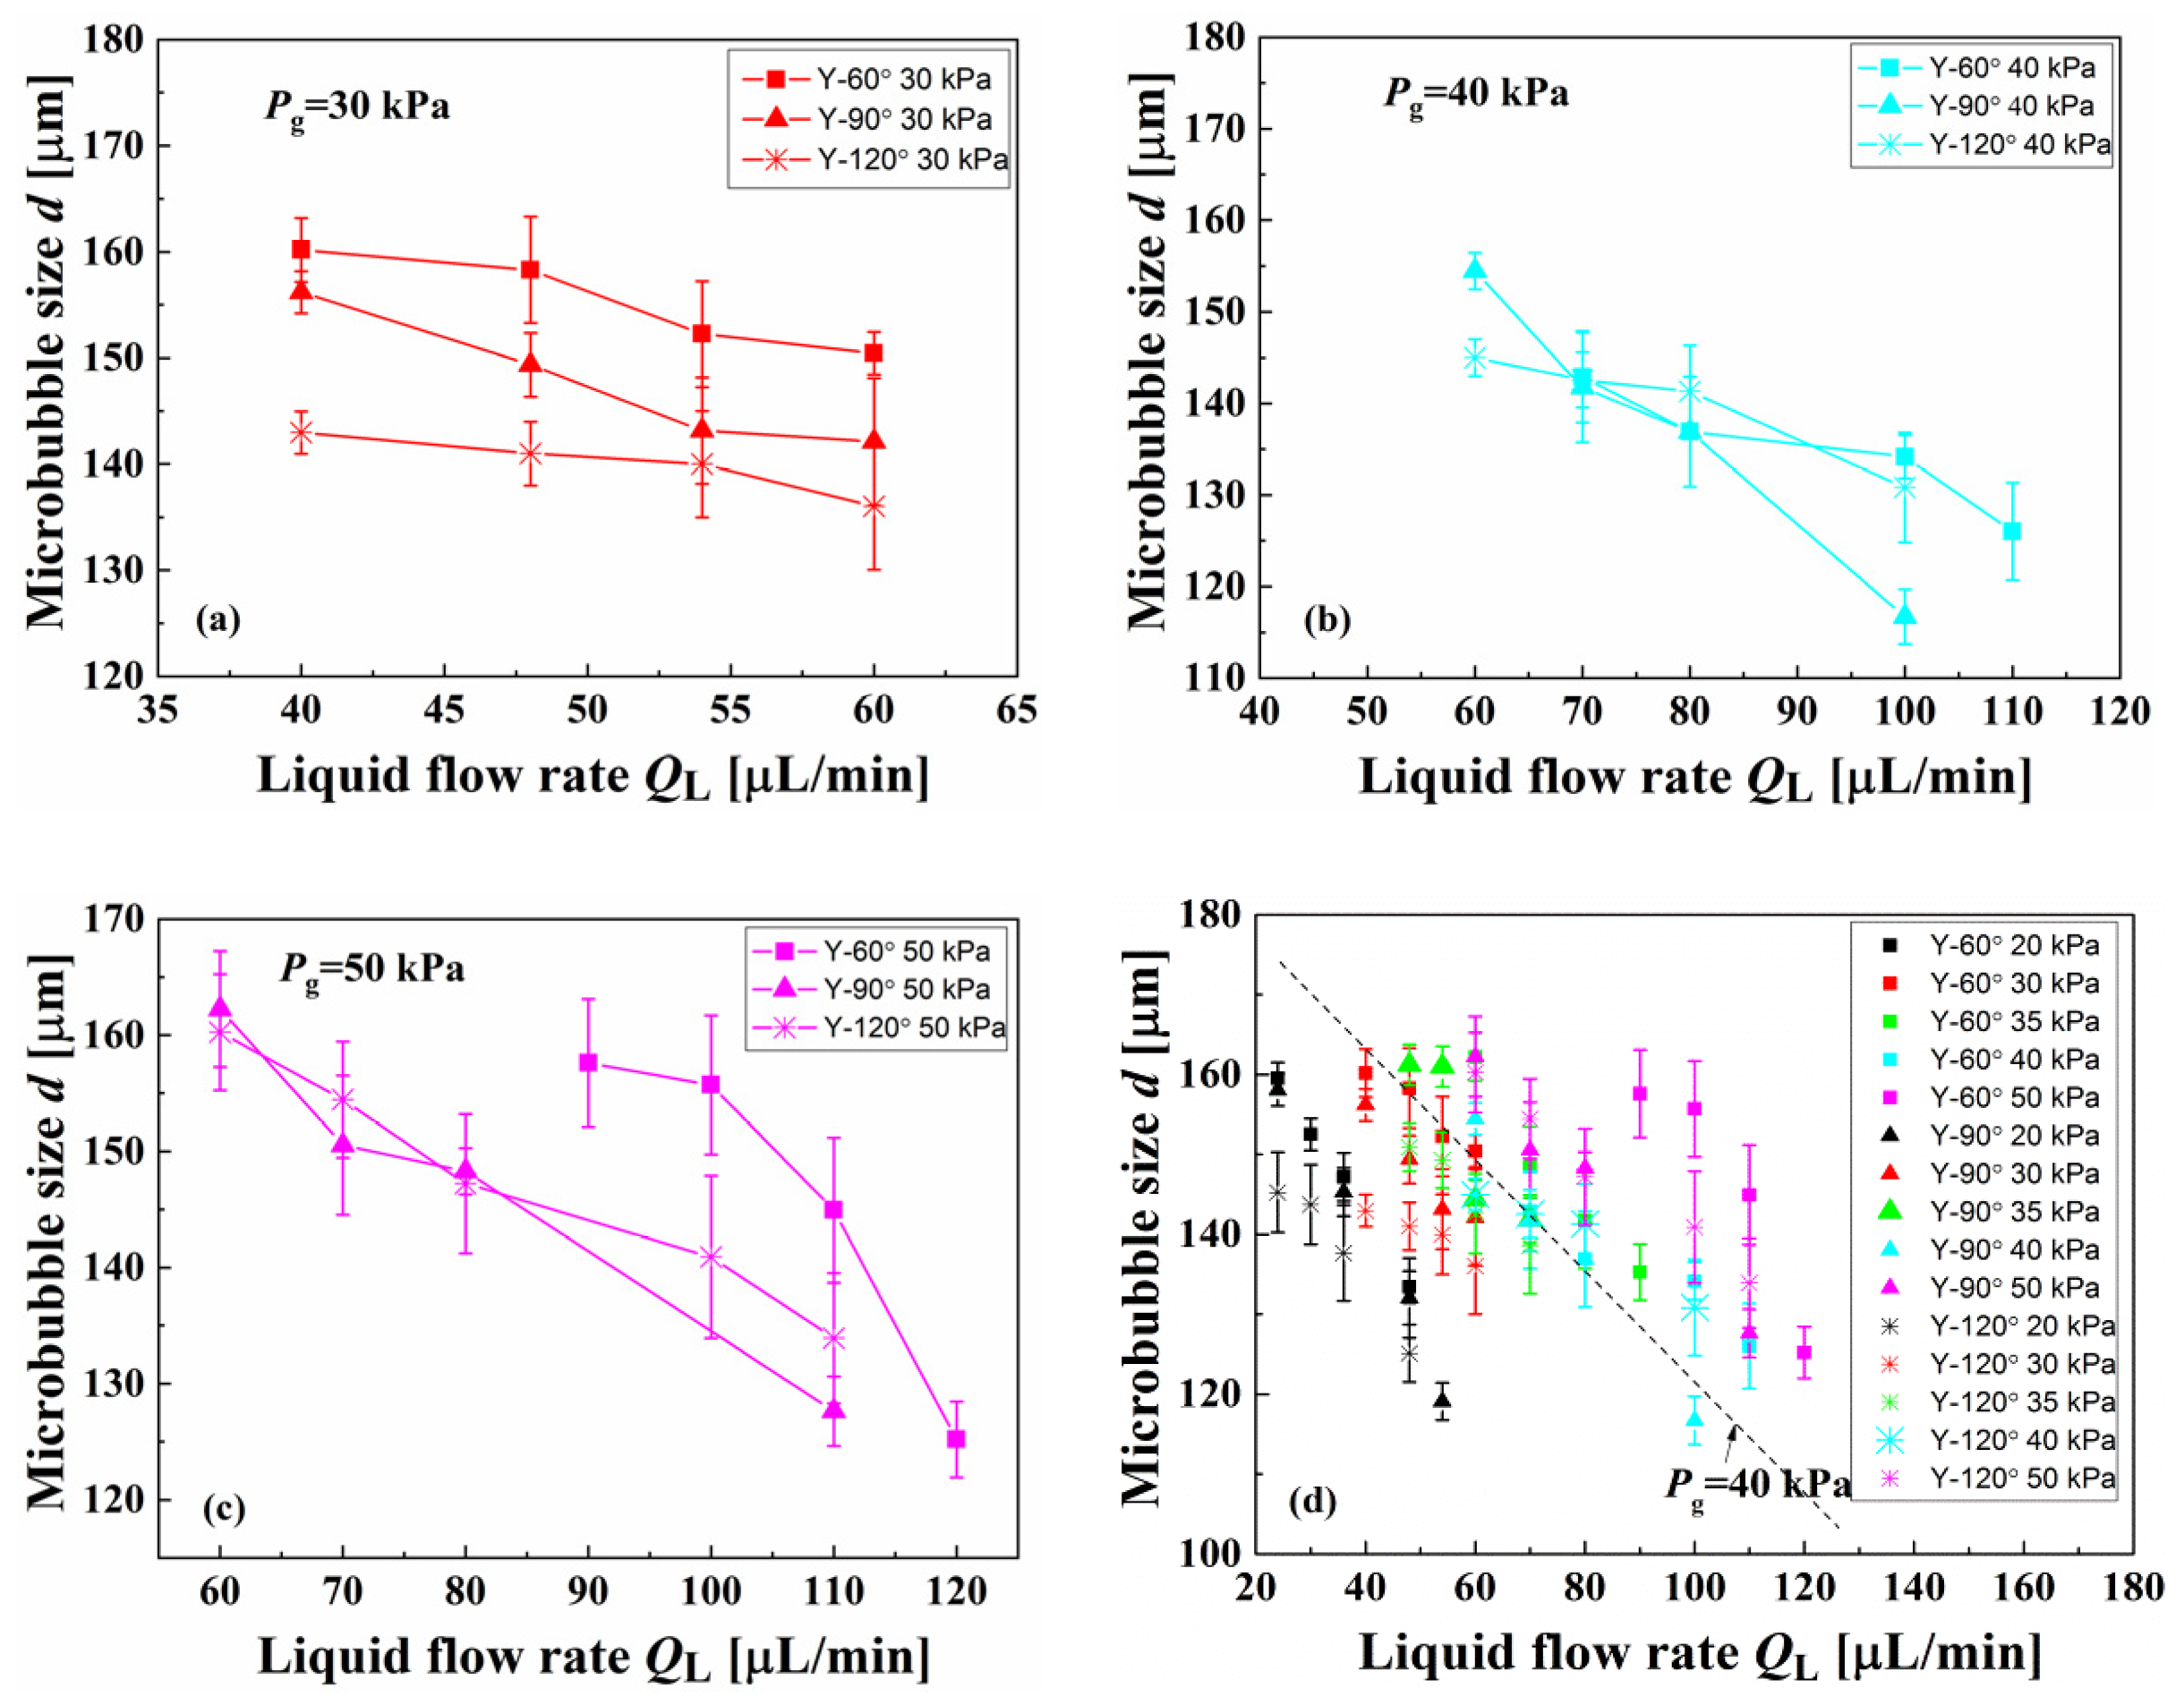
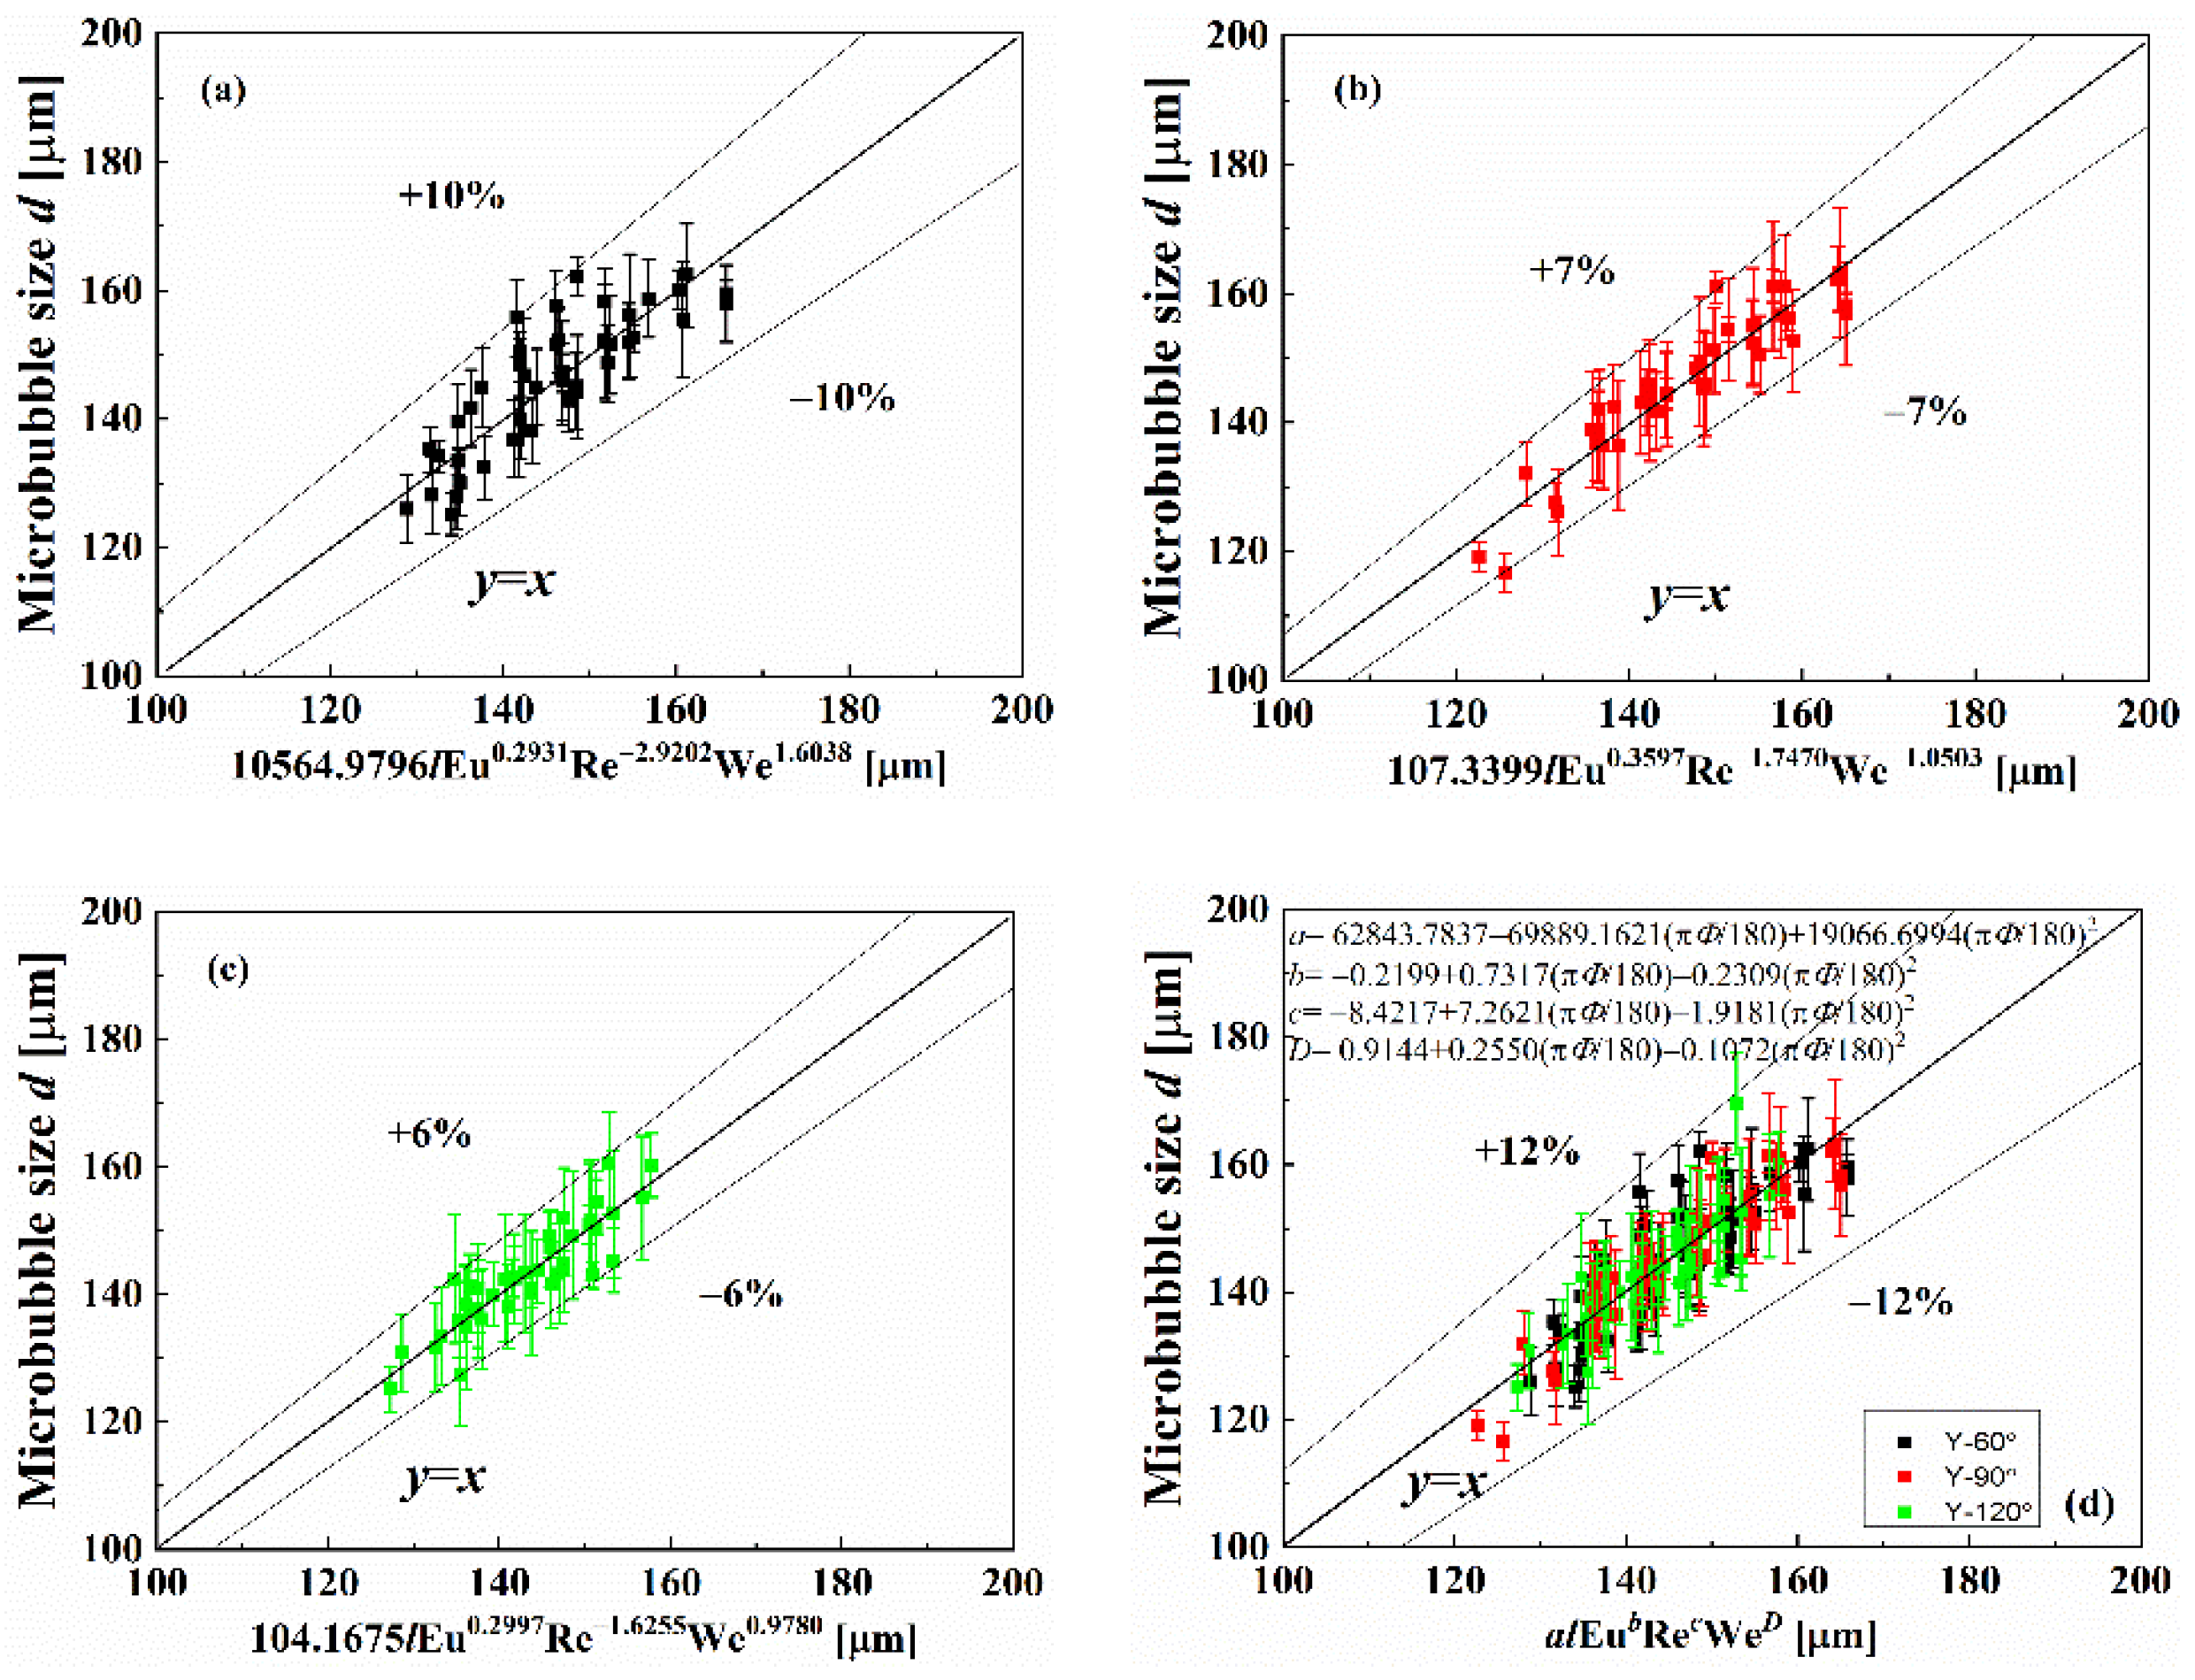
3.3. Effect of the Angle Factor on the Generation Characteristics of Microbubbles

In this section, the effects of the junction angle on the generation characteristics of microbubbles, including generation frequency f and diameter d, were investigated. The relationship between the microbubble generation frequency f and air pressure/liquid flow rate in Y-60°, Y-90° and Y-120° systems is demonstrated in Figure 6. The generation frequency f increased with increasing air pressure, however, it increased first and then decreased with increasing liquid flow rate. The increasing stages were profited from the increase of Fc and FD which acted more powerfully to shorten the pinching-off process. The decreasing stage occurred when the component of Fc in y-direction was so large that it acted not only to squeeze the gas thread but also prevent the gas phase from flowing into the main channel. In Figure 6, the generation frequency f obeyed the law that fY-60° > fY-90° > fY-120° at constant air pressures and liquid flow rates. It was deduced that the component of Fc caused by liquid inertia had the order of Fc-x-Y-60° > Fc-x-Y-90° > Fc-x-Y-120°, and the larger Fc-x caused the shorter generation time of gas slug.
Figure 7 shows the effects of the air pressure and angle factor on the microbubble size d. The microbubble size increased with increasing air pressure. At constant liquid flow rates and air pressures, the microbubble size obeyed the law of dY-60° > dY-90° > dY-120° until the liquid flow rate QL reached 60 μL/min, where the influence of the angle factor was weakened as the liquid flow rate was large enough to make the shear force Fc,shear play a crucial role in the pinching-off process. Lei et al. [34] experimentally and numerically studied the size of microdroplets generated in Y-junctions with different angles (30°–120°). The study also found that the junction angle has a significant effect on the droplet size and the variation of droplet length with inlet angle obeyed a regular law under the experimental conditions. Kucuk et al. [35] prepared microbubbles in Y-junctions with different angles (0°–60°) and reported a similar law that the microbubble size decreased with increasing inlet angle. However, in this work, the law of dY-60° > dY-90° > dY-120° was found to be broken up at large liquid flow rates when the shear force Fc,shear in x-direction dominated the generation process of the microbubble, as shown in Figure 7a–c. In contrast of air pressure, the microbubble size decreased with increasing liquid flow rate as shown in Figure 8. The microbubble size still obeyed the law of dY-60° > dY-90° > dY-120° until the air pressure Pg reached 40 kPa, where the influence of the angle factor was weakened as the air pressure was large enough to make the shear force FD play a crucial role in the pinching-off process. Generally speaking, the influence of the angle factor on microbubble generation characteristics only existed in a certain range of injection conditions, once the air pressure/liquid flow rate was large enough, the influence of the angle was weakened and vanished then. The applicable conditions of dY-60° > dY-90° > dY-120° needed to be determined.
In order to obtain the applicable conditions of dY-60° > dY-90° > dY-120° and measure the relation of the forces involved in the law, a dimensionless analysis of Capillary number, Weber number and Euler number was conducted. Figure 9 shows the relationship between the microbubble size and dimensionless parameters Ca and (We·Eu). The boundary line was obtained by projecting the boundary points to the surface of x(We·Eu)/y(Ca). Then, it could be seen obviously that the law was suitable for Ca < (148.52 × 10⁻³)·(We·Eu)−0.69 when Ca ranging from 0.002 to 0.02. In other words, the effect of the angle factor on the microbubble size became complicated out of this range.
As mentioned above, the microbubble size d was significantly affected by the air pressure and liquid flow rate. Different from the previous studies considering only two-phase flow rates and Capillary number, dimensionless analysis was employed here to develop scaling laws considering the forces involved in the generation process of the microbubble. The main parameters affecting the generation of microbubbles were microchannel equivalent diameter l, air pressure Pg, liquid flow rate QL, liquid viscosity μl, liquid density ρl and surface tension σ. The microbubble diameter could be expressed as,
d = F ( l , P g , Q l , μ l , σ , ρ l )
The microchannel equivalent diameter l, liquid phase flow rate QL and liquid phase density ρl were chosen to be the independent basic quantities with different basic dimensions of length, time and mass. Took the other physical quantities as derived quantities, and the following expressions were obtained,
Π i = l a i Q L b i ρ l c i Y
Y = [ d   P g   μ l   σ ] T
Then, the exponents in the Π expressions were solved by,
M 0 L 0 T 0 = L a i ( L 3 T 1 ) b i ( M L 3 ) c i Y 1
Y 1 = [ L   ML 1 T 2   ML 1 T 1   MT 2 ] T
The exponents ai, bi, ci were obtained, and the expressions of ∏i were,
Π 1 = d l ,   Π 2 = P g l 4 Q L 2 ρ l = Eu 1 ,   Π 3 = μ l l Q L ρ l = Re 1 1 ,   Π 4 = σ l 3 ρ l Q L 2 = We 1 1
Therefore, d/l was considered to be the function of Eu1, Re1−1 and We1−1 as,
d l = f ( Eu , Re 1 ,   We 1 ) = a Eu 1 b R e 1 c W e 1 D
Took the logarithm of both sides of the Equation (14) and a multiple linear regression was performed to obtain the values of the coefficients with 2.88 < Re1 < 14.38 and 0.0068 < We1 < 0.1723. Figure 10a–c shows the comparison of the experimental data d with dimensionless expressions. The results show a good agreement with a maximum deviation within ±10%.
As analyzed above, the relation of d and the other parameters could be expressed as d = alEu1bRe1cWe1D, where a = 62,843.7837−69,889.1621(πφ/180) + 19,066.6994(πφ/180)2, b = −0.2199 + 0.7317(πφ/180) − 0.2309(πφ/180), c = −8.4217 + 7.2621(πφ/180) − 1.9181(πφ/180)2, D = 0.9144 + 0.2550(πφ/180) − 0.1072(πφ/180)2. Figure 10 compares the microbubble diameter d between experimental values and predicted values. It shows a good agreement and the deviation is within ±12%.

4. Conclusions

In this study, the effect of the junction angle on the gas-liquid two-phase flow were conducted. The dispersed bubble flow, the slug bubble flow, the annular flow and the stratified flow were obtained in the Y-junctions with the junction angle of 60°, 90° and 120°. The flow pattern maps of the Y-60°, Y-90° and Y-120° systems were provided and compared. Based on force analysis, dimensionless analysis was performed to develop the general transition criteria using the Capillary number, Weber number and Euler number. The characteristics of the microbubbles generated in the Y-60°, Y-90° and Y-120° systems were investigated subsequently. The following conclusions were drawn:
The dispersed bubble flow and annular flow occupied the smallest area in the flow pattern maps, however, the slug bubble flow distributed in larger region in the pattern maps.
The generation frequency of microbubbles increased with increasing air pressure, however, it increased first and then decreased with the increasing liquid flow rate. Meanwhile, the generation frequency obeyed the law that fY-60° > fY-90° > fY-120° at constant air pressures and liquid flow rates.
The microbubble size increased with increasing air pressure and decreased with increasing liquid flow rate. However, the law of dY-60° > dY-90° > dY-120° could be broken in inapplicable conditions. In other words, the effect of the junction angle on the microbubble size became complicated as the liquid flow rate or air pressure rose up to a constant, which has never been reported by the previous studies. The applicable region of the law could be expressed using the equation of Capillary number, Weber number and Euler number as Ca < (148.52 × 10⁻³)·(We·Eu)−0.69 with Ca ranging from 0.002 to 0.02.
Finally, a new scaling law considering the forces involved in the formation process of the slug bubble was brought up to predict the microbubble size. The prediction model agreed well with the experimental data.

Author Contributions

Y.H.: conceptualization, software, validation, formal analysis, investigation, data curation, writing—original draft, writing—review and editing, visualization. X.X.: resources, writing—review and editing, project administration, funding acquisition. F.L.: writing—review and editing. W.W.: writing—review and editing. Z.L.: conceptualization, writing—review and editing, supervision. All authors have read and agreed to the published version of the manuscript.

Funding

This work was funded by the Fundamental Research Funds for the central universities [DUT16QY39].

Institutional Review Board Statement

“Not applicable” for studies not involving humans or animals.

Informed Consent Statement

Not applicable.

Conflicts of Interest

The authors declare no conflict of interest.

Nomenclature

Symbols
aithe exponent of the Πi expression
bithe exponent of the Πi expression
cithe exponent of the Πi expression
CaCapillary number
dmicrobubble diameter [μm]
EuEuler number
fmicrobubble generation frequency [Hz]
FDthe force exerted by dispersed phase [N]
Fcthe force exerted by continuous phase [N]
Fc,shearshear force [N]
lmicrochannel equivalent diameter [μm]
Pgair pressure [kPa]
QLliquid phase flow rate [μL/min]
ReReynolds number
vlliquid phase flow velocity [m/s]
WeWeber number
Greek
µlliquid phase viscosity [Pa·s]
ρlliquid phase density [kg/m3]
σsurface tension [N/m]

References

  1. Vladisavljević, G.T.; Ekanem, E.E.; Zhang, Z.; Khalid, N.; Kobayashi, I.; Nakajima, M. Long-term stability of droplet production by microchannel (step) emulsification in microfluidic silicon chips with large number of terraced microchannels. Chem. Eng. J. 2018, 333, 380–391. [Google Scholar] [CrossRef] [Green Version]
  2. Charmet, J.; Arosio, P.; Knowles, T. Microfluidics for Protein Biophysics. J. Mol. Biol. 2018, 430, 565–580. [Google Scholar] [CrossRef] [PubMed] [Green Version]
  3. Rong, N.; Zhou, H.; Liu, R.; Wang, Y.; Fan, Z. Ultrasound and microbubble mediated plasmid DNA uptake: A fast, global and multi-mechanisms involved process. J. Control. Release 2018, 273, 40–50. [Google Scholar] [CrossRef] [PubMed]
  4. Liu, P.; Zhong, Y.; Luo, Y. Preparation of monodisperse biodegradable magnetic microspheres using a T-shaped microchannel reactor. Mater. Lett. 2014, 117, 37–40. [Google Scholar] [CrossRef]
  5. Ansari, M.; Bokhari, H.H.; Turney, D.E. Energy efficiency and performance of bubble generating systems. Chem. Eng. Process. 2018, 125, 44–55. [Google Scholar] [CrossRef]
  6. Walunj, A.; Sathyabhama, A. Comparative study of pool boiling heat transfer from various microchannel geometries. Appl. Therm. Eng. 2018, 128, 672–683. [Google Scholar] [CrossRef]
  7. Wang, S.; Chen, H.; Chen, C. Enhanced flow boiling in silicon nanowire-coated manifold microchannels. Appl. Therm. Eng. 2019, 148, 1043–1057. [Google Scholar] [CrossRef]
  8. Guo, R.; Fu, T.; Zhu, C.; Yin, Y.; Ma, Y. The effect of flow distribution on mass transfer of gas-liquid two-phase flow in two parallelized microchannels in a microfluidic loop. Int. J. Heat Mass Trans. 2019, 130, 266–273. [Google Scholar] [CrossRef]
  9. Marques, M.; Boyd, A.S.; Polizzi, K.; Szita, N. Microfluidic devices towards personalized health and wellbeing. J. Chem. Technol. Biotechnol. 2019, 94, 2412–2415. [Google Scholar] [CrossRef]
  10. Zhu, L.-L.; Zhu, C.-T.; Xiong, M.; Jin, C.-Q.; Sheng, S.; Wu, F.-A.; Wang, J. Enzyme immobilization on photopatterned temperature-response poly (N-isopropylacrylamide) for microfluidic biocatalysis. J. Chem. Technol. Biotechnol. 2019, 94, 1670–1678. [Google Scholar] [CrossRef]
  11. Zhu, Y.; Bai, Z.; Luo, W.; Wang, B.; Zhai, L. A facile ion imprinted synthesis of selective biosorbent for Cu2+ via microfluidic technology. J. Chem. Technol. Biotechnol. 2017, 92, 2009–2022. [Google Scholar] [CrossRef]
  12. Chiu, F.W.Y.; Bagci, H.; Fisher, A.G.; Demello, A.J.; Elvira, K.S. A microfluidic toolbox for cell fusion. J. Chem. Technol. Biotechnol. 2016, 91, 16–24. [Google Scholar] [CrossRef] [Green Version]
  13. Yu, W.; Liu, X.; Li, B.; Chen, Y. Experiment and prediction of droplet formation in microfluidic cross-junctions with different bifurcation angles. Int. J. Multiph. Flow 2022, 149, 103973. [Google Scholar] [CrossRef]
  14. Yu, W.; Liu, X.; Zhao, Y.; Chen, Y. Droplet generation hydrodynamics in the microfluidic cross-junction with different junction angles. Chem. Eng. Sci. 2019, 203, 259–284. [Google Scholar] [CrossRef]
  15. Yin, Y.; Chen, K.; Qiao, X.; Lin, M.; Lin, Z.; Wang, Q. Mean pressure distributions on the vanes and flow loss in the branch in a T pipe junction with different angles. Energy Procedia 2017, 105, 3239–3244. [Google Scholar] [CrossRef]
  16. Yue, J.; Luo, L.; Gonthier, Y.; Chen, G.; Yuan, Q. An experimental investigation of gas-liquid two-phase flow in single microchannel contactors. Chem. Eng. Sci. 2008, 63, 4189–4202. [Google Scholar] [CrossRef]
  17. Zhao, C.; Middelberg, A.P.J. Two-phase microfluidic flows. Chem. Eng. Sci. 2011, 66, 1394–1411. [Google Scholar] [CrossRef]
  18. Liu, Y.; Hansen, A.; Block, E.; Morrow, N.R.; Squier, J.; Oakey, J. Two-phase displacements in microchannels of triangular cross-section. J. Colloid Interface Sci. 2017, 507, 234–241. [Google Scholar] [CrossRef]
  19. Fourar, M.; Bories, S. Experimental study of air-water two-phase flow through a fracture (narrow channel). Int. J. Multiph. Flow 1995, 21, 621–637. [Google Scholar] [CrossRef]
  20. Mandhane, J.M.; Gregory, G.A.; Aziz, K. A flow pattern map for gas-liquid flow in horizontal pipes. Int. J. Multiph. Flow 1974, 1, 537–553. [Google Scholar] [CrossRef]
  21. Triplett, K.; Ghiaasiaan, S.; Abdel-Khalik, S.; Sadowski, D. Gas-liquid two-phase flow in microchannels Part I: Two-phase flow patterns. Int. J. Multiph. Flow 1999, 25, 377–394. [Google Scholar] [CrossRef]
  22. Rebrov, E.V. Two-phase flow regimes in microchannels. Theor. Found. Chem. Eng. 2010, 44, 355–367. [Google Scholar] [CrossRef]
  23. Yan, P.; Jin, H.; Tao, F.; He, G.; Guo, X.; Ma, L.; Yang, S.; Zhang, R. Flow characterization of gas-liquid with different liquid properties in a Y-type microchannel using electrical resistance tomography and volume of fluid model. J. Taiwan Inst. Chem. Eng. 2022, 136, 104390. [Google Scholar] [CrossRef]
  24. Waelchli, S.; Rudolf Von Rohr, P. Two-phase flow characteristics in gas-liquid microreactors. Int. J. Multiph. Flow 2006, 32, 791–806. [Google Scholar] [CrossRef]
  25. Essimoz, A.-L.; Cavin, L.; Renken, A.; Kiwi-Minsker, L. Liquid-liquid two-phase flow patterns and mass transfer characteristics in rectangular glass microreactors. Chem. Eng. Sci. 2008, 63, 4035–4044. [Google Scholar] [CrossRef] [Green Version]
  26. Cao, Z.; Wu, Z.; Sundén, B. Dimensionless analysis on liquid-liquid flow patterns and scaling law on slug hydrodynamics in cross-junction microchannels. Chem. Eng. J. 2018, 344, 604–615. [Google Scholar] [CrossRef]
  27. Garstecki, P.; Fuerstman, M.J.; Stone, H.A.; Whitesides, G.M. Formation of droplets and bubbles in a microfluidic T-junction-scaling and mechanism of break-up. Lab. Chip 2006, 6, 437. [Google Scholar] [CrossRef]
  28. Wang, K.; Xie, L.; Lu, Y.; Luo, G. Generating microbubbles in a co-flowing microfluidic device. Chem. Eng. Sci. 2013, 100, 486–495. [Google Scholar] [CrossRef]
  29. Parhizkar, M.; Edirisinghe, M.; Stride, E. Effect of operating conditions and liquid physical properties on the size of monodisperse microbubbles produced in a capillary embedded T-junction device. Microfluid. Nanofluid. 2013, 14, 797–808. [Google Scholar] [CrossRef]
  30. Sobieszuk, P.; Cygański, P.; Pohorecki, R. Bubble lengths in the gas-liquid Taylor flow in microchannels. Chem. Eng. Res. Des. 2010, 88, 263–269. [Google Scholar] [CrossRef]
  31. Rodríguez-Rodríguez, J.; Sevilla, A.; Martínez-Bazán, C.; Gordillo, J.M. Generation of microbubbles with applications to industry and medicine. Annu. Rev. Fluid Mech. 2015, 47, 405–429. [Google Scholar] [CrossRef]
  32. Peng, Z.; Gai, S.; Barma, M.; Rahman, M.M.; Moghtaderi, B.; Doroodchi, E. Experimental study of gas-liquid-solid flow characteristics in slurry Taylor flow-based multiphase microreactors. Chem. Eng. J. 2021, 405, 126646. [Google Scholar] [CrossRef]
  33. Taylor, J.R. Introduction to Error Analysis: The Study of Uncertainties in Physical Measurements, 2nd ed.; University Science Books: Boulder, CO, USA, 1997. [Google Scholar]
  34. Lei, L.; Zhao, Y.; Wang, X.; Xin, G.; Zhang, J. Experimental and numerical studies of liquid-liquid slug flows in micro channels with Y-junction inlets. Chem. Eng. Sci. 2022, 252, 117289. [Google Scholar] [CrossRef]
  35. Kucuk, I.; Yilmaz, N.F.; Sinan, A. Effects of junction angle and gas pressure on polymer nanosphere preparation from microbubbles bursted in a combined microfluidic device with thin capillaries. J. Mol. Struct. 2018, 1173, 422–427. [Google Scholar] [CrossRef]
Figure 1. Schematic of the experimental setup.
Sustainability 14 08592 g001
Figure 2. Photographs of gas-liquid two-phase flows.
Sustainability 14 08592 g002
Figure 3. A schematic of slug formation process corresponding with forces: (a) The pressure field around the gas thread; (b) The force analysis of the gas slug formation.
Sustainability 14 08592 g003
Figure 4. The flow pattern maps of the three Y-junctions with (a) φ = 60°; (b) φ = 90°; (c) φ = 120°.
Sustainability 14 08592 g004
Figure 5. The comparisons of experimental data and proposed flow transition model: (a,b) The transition from full of liquid to dispersed bubble flow; (c,d) The transition from dispersed bubble flow to slug bubble flow; (e,f) The transition from slug bubble flow to annular flow.
Sustainability 14 08592 g005
Figure 6. Effects of air pressure and liquid flow rate on microbubble generation frequency: (a) Variation of the generation frequency with air pressure; (b) Variation of the generation frequency with liquid flow rate.
Sustainability 14 08592 g006
Figure 7. The variation of the microbubble size (diameter) with air pressure and angle factor at constant liquid flow rates: (a) QL = 36 μL/min; (b) QL = 60 μL/min; (c) QL = 77 μL/min; (d) QL = 24~77 μL/min.
Sustainability 14 08592 g007aSustainability 14 08592 g007b
Figure 8. The variation of the microbubble size (diameter) with liquid flow rate and angle factor at constant air pressures: (a) Pg = 30 kPa; (b) Pg = 40 kPa; (c) Pg = 50 kPa; (d) Pg = 20~50 kPa.
Sustainability 14 08592 g008
Figure 9. The variations of the microbubble size(diameter) with Capillary number Ca and dimensionless parameter (We·Eu) in the Y-60°, Y-90° and Y-120° systems.
Sustainability 14 08592 g009
Figure 10. Microbubble size d as a function of the dimensionless parameters: (a) φ = 60°; (b) φ = 90°; (c) φ = 120°; (d) function with angle factor coefficients.
Sustainability 14 08592 g010
Publisher’s Note: MDPI stays neutral with regard to jurisdictional claims in published maps and institutional affiliations.

