
Decarbonization of Nitrogen Fertilizer: A Transition Engineering Desk Study for Agriculture in Germany


1
International Centre for Island Technology, Heriot-Watt University, Orkney Campus, Stromness KW16 3AN, UK
2
Global Association for Transition Engineering, Chelmsford CM1 1HT, UK
*
Authors to whom correspondence should be addressed.
†
These authors contributed equally to this work.
Sustainability 2022, 14(14), 8564; https://doi.org/10.3390/su14148564
Submission received: 15 June 2022
/
Revised: 5 July 2022
/
Accepted: 6 July 2022
/
Published: 13 July 2022
(This article belongs to the Special Issue Energy Transition Engineering)
Abstract
:The use of fossil fuel and artificial nitrogen fertilizer in German agriculture is a wicked problem. The incumbent system allows access to nutrition, but relies on unsustainable fossil fuel, produces greenhouse gas emissions along the whole production chain, and nitrogen pollution. This article uses the Interdisciplinary Transition Innovation, Engineering, and Management (InTIME) method for German agriculture systems with data from FAO and the German Ministry For Food And Agriculture. The purpose of this article is a rigorous analysis of the complex agriculture system and the development of feasible opportunities for sustainable carbon downshifting. Sustainability indicators are biodiversity loss, fossil-fuel use, mineral depletion, energy use, carbon emissions and eutrophication. The results indicate that the technology-based solution of “green hydrogen” as a substitute for fossil hydrogen in the fertilizer production decreases the sustainability of the agriculture system. The most promising results arise from shifting consumption of meat and animal-based products to a more plant based diet, and transitioning to organic agriculture. Net-zero sustainability goals and a reduction in eutrophication are achieved by 75% downshift of animal products and the upscaling of organic agriculture. Strategic scenarios to achieve the results are developed and recommendations for policy implementation to ease the transition are examined.
1. Introduction
Climate scientists claim with high confidence that the rapid downshift of unsustainable hydrocarbon fuel and energy-intensive materials is required [1,2,3]. This statement, of downshifting unsustainable practices by the amount required by science to mitigate climate change risks, is not common in policy or business strategies. The more common approach seeks substitutions of more sustainable fuels or materials without affecting current practices [4,5]. The Transition Engineering approach has recently emerged from roots in energy, waste, and travel-demand management [6]. Transition Engineering methods, tools, and standards of practice have been developing to deal with the particularly complex problems of rapidly achieving net-zero requirements. To mitigate global warming below 1.5 °C with a 50% probability means keeping cumulative world CO2 emissions since 1850 below 3000 GtCO2 [3]. At the current rate of 38 GtCO2/a and a cumulative of around 2500 GtCO2, a minimum downshift of 7% per year in carbon-equivalent emissions, and thus fossil fuel extraction, is necessary to meet climate targets. Transition Engineering requirements are an 80% downshift of fossil-fuel production and pollution by 2030, while creating new real values by increasing resilience, biocapacity and social wellbeing [6]. In moving beyond energy-substitution strategies for improving sustainability, the complexities of whole systems become the overriding challenge [7].
Transition Engineering addresses so-called wicked problems. A problem is said to be wicked when there are no technically implementable and economically viable solutions [8]. Policy pathways and roadmaps usually look at future potential technology uptake [4,5,9,10,11,12], but Transition Engineering focuses on immediately implementable projects. Firstly, a wicked problem involves assets, products, activities, and practices that are successful but not sustainable. A wicked problem has origins in the historical interplay of actions and decisions where no apparent mistake was made, thus no clear corrective measure was indicated. A wicked problem is systemic; there may be harms arising from the practice that are disconnected from the upstream or downstream benefits of the practice. Wicked problems are complex and challenging to address locally because of global value chains. They are immune to typical linear problem solving found in engineering due to their circular nature and urgent time scale [6,13]. Finally, wicked problems involve emergent systems behaviour and thus resist energy or technology substitutions imposed by policy or planning [14]. A complex emergent system changes organically, as actors create and build new artifacts and organizations (in much the same way plants grow new roots, branches and leaves, and the whole plant’s systems accommodate and integrate the new structures). Current practices and products that use fossil fuels oftentimes pose wicked problems [6]. A new energy technology cannot substitute into a complex emergent system without adaptations in the incumbent system and integration of new operational conditions. The Transition Engineering approach represents an advancement in the prevalent energy substitution assumptions and uses a strategic analysis of complex systems in the context of their emergent behaviour [15].
The Transition Engineering approach is used in this article to investigate the wicked problem of the reliance of German agriculture on artificial nitrogen fertilizer manufactured from fossil natural gas. The issue of fossil-fuel use in food production is of high importance [16,17,18]. The aim of this article is to identify the opportunities for the transition of unsustainable material flows and activities in German agriculture. The results are based on investigations of strategic options for downshifting fossil natural gas in fertilizer use and the identification of clear pathways for achieving agricultural sustainability. The objectives are the analysis of both material and energy flows through the agricultural system; the study of the historical development of fertilizer use; and the breakdown of the scientific literature and policies on national and European levels on decreasing unsustainable resource use in agriculture. A new systemic perspective for downshifting carbon emissions in German agriculture allows to connect both upstream and downstream processes from fertilizer production to food output. Numerical investigations evaluate the sustainability of multiple agricultural pathways involving technological solutions, agricultural practices, and behavioural changes. Scenarios are graded according to their harm mitigation potential for emissions, eutrophication, energy, land, and mineral use. The assumption of fossil-fuel substitution with “green hydrogen” for nitrogen-fertilizer production is quantitively evaluated and criticised. The application of the Transition Engineering approach, tools and methods to this case study is a useful addition to the growing experience in the emerging field.
The article begins with an in-depth review of the issue of the unsustainability of German-agriculture fertilizer use, the food production system, and related complex problems. The unsustainability issue is described by defining the wicked problem in Section 2. Then, German agriculture practices and material inputs are quantitively analysed and metrics are presented, reviewing historic and current aspects of German agriculture, and its fertilizer use in Section 3. The strategic scenario analysis of pathways for carbon-emissions downshift is carried out in Section 4. The results of the analysis and a future shift project are discussed in Section 5, followed by the summary and final conclusions.
Methods
The InTIME method (Interdisciplinary Transition Innovation, Engineering, and Management) has been developed to address wicked energy-transition problems [6] and applied in a number of studies for industry and government [19,20,21]. Gallardo [22] used Transition Engineering methods in freight-supply-chain strategy development on the North Island of New Zealand. Bai [23] applied the InTIME method to personal transport transition in cities using Beijing, China, as a case study. Results highlighted the high risk associated with scenarios relying entirely on technological solutions. The safest and most readily implementable scenarios involved demand-side management and downshifts in energy and resources use. For example, it has been assessed that the energy supply for a remote research facility is too expensive with a combination of wind turbines and batteries. The economically and ecologically more favourable solution was demand-side management to adapt to wind-speed patterns and thus rule out the need for additional energy storage [21]. The restrictions of certain licence plates in Beijing did not lead to an increase in more sustainable transport mode shares. Whereas it was demonstrated that the re-design of sub-districts to allow for shorter commuting distances decreased car and fuel dependency by the habitants [23].
The InTIME method is a process for dealing with complex wicked problems. The method is used for the Transition Engineering of existing systems to low-energy, mineral, and natural resource consumption while uplifting quality of life, environmental capacity and real value [6]. The seven steps of the InTIME method are depicted in Figure 1. The preliminary stage is to define the wicked problem for a specific place and a particular essential activity. In this study, the place is the country of Germany, and the essential activity is agricultural food production for the current population using the existing agricultural land area.
The first step in the InTIME method is to examine the history of the essential activity in the location, starting in 1911. Knowledge of historical trends allows the understanding of how past systems fulfilled the studied essential need while using less energy. Observing dynamic changes and their implications over time creates new insight for potential solutions. The second step is taking stock of the current system and gathering the necessary data to understand the interconnectivity of economics, social and political aspects of the system. Step three is the analytical exploration of the near future as assumed in current popular culture, science, and policy. The third step is called “crash testing” the scenarios of current solution ideas, technologies, and policies. A crash test estimates technical feasibility, based on thermodynamics, materials, assembly, infrastructure, and energy return on energy invested. Crash testing new or proposed technologies uses the development vector analysis tool to evaluate the probability of overcoming all of the development hurdles within the time needed to meet climate-safe conditions [6]. Step four is a pathbreak exercise for the place and essential activity in a future, where the identified unsustainable energy and material flows of today have downshifted to the safe levels identified by science. In step five, the timeline is again set to today and the necessary changes in today’s system, initiated by triggers, are examined [24]. This leads to step six, in which shift projects are developed iteratively to safely and gradually retreat from fossil fuels. In the seventh step, the implications and consequences of the realisation of the shift project are examined. The future economic opportunities, social capital, and environmental regeneration that would follow from the transition project are estimated. The structure of this article follows the InTIME method steps with the sections indicated in Figure 1.
Another Transition-Engineering tool used in this study is the strategic analysis of complex systems (SACS) [6]. This tool can be used in concept-generation, back-casting, and scenario-development stages. The SACS tool has three steps. The first step creates the Possibility Space. This includes brainstorming of all the levers that stakeholders believe could be pulled in the system to change its behaviour to a more sustainable future. The possibilities are classified and arranged in a matrix according to whether they involve infrastructure and energy supply (columns) or end-use technology and behaviour (rows). The intersections of rows and columns define a candidate and are referred to as a strategic scenario. In step two, the Feasibility Space is built by assessing the technical practicability and the resource availability of the strategic scenarios in the Possibility Space. Step three is the generation of the Opportunity Space. This step analyses the strategic scenarios according to quantitative metrics of merit. The combination of technical feasibility; probability of development in the target timeframe; availability of materials and resources; risks; costs; energy return on energy invested; and any other metrics of merit facilitate consideration of complexity. The strategy poses an analytical engineering analysis of development opportunities.
2. Wicked Problem of Artificial Fertilizer in Germany
The fossil fuel embedded in artificial fertilizer use is a wicked problem, as illustrated by the circular analysis tool in Figure 2.
Here, the essential activity is providing access to nutrition to people in Germany. Artificial fertilizers work excellently, the production is legal, meets health and safety standards and is profitable. As fossil gas is required for manufacture, the system will continue to draw down a finite resource and is, thus, not sustainable. The need for nutrition in Germany is being met by using artificial fertilizer. Nutrient poverty in Germany is one of the lowest in global comparison [25]. There are alternative Bio and organic products on the market [26], at a higher price [27]. There is pressure to change the system to meet government emissions targets and to reduce pollution and reliance on imported natural gas [10,28]. Substantive changes remain challenging due to a locked-in infrastructure and debt in conventional agricultural practices, with 47% of loans for working-capital purposes and a liability-to-asset ratio of around 30%. Total outstanding loans in the German agricultural sector amount to EUR 52 billion [29]. Additionally, 40% of the revenue structure comes from animal output [30].
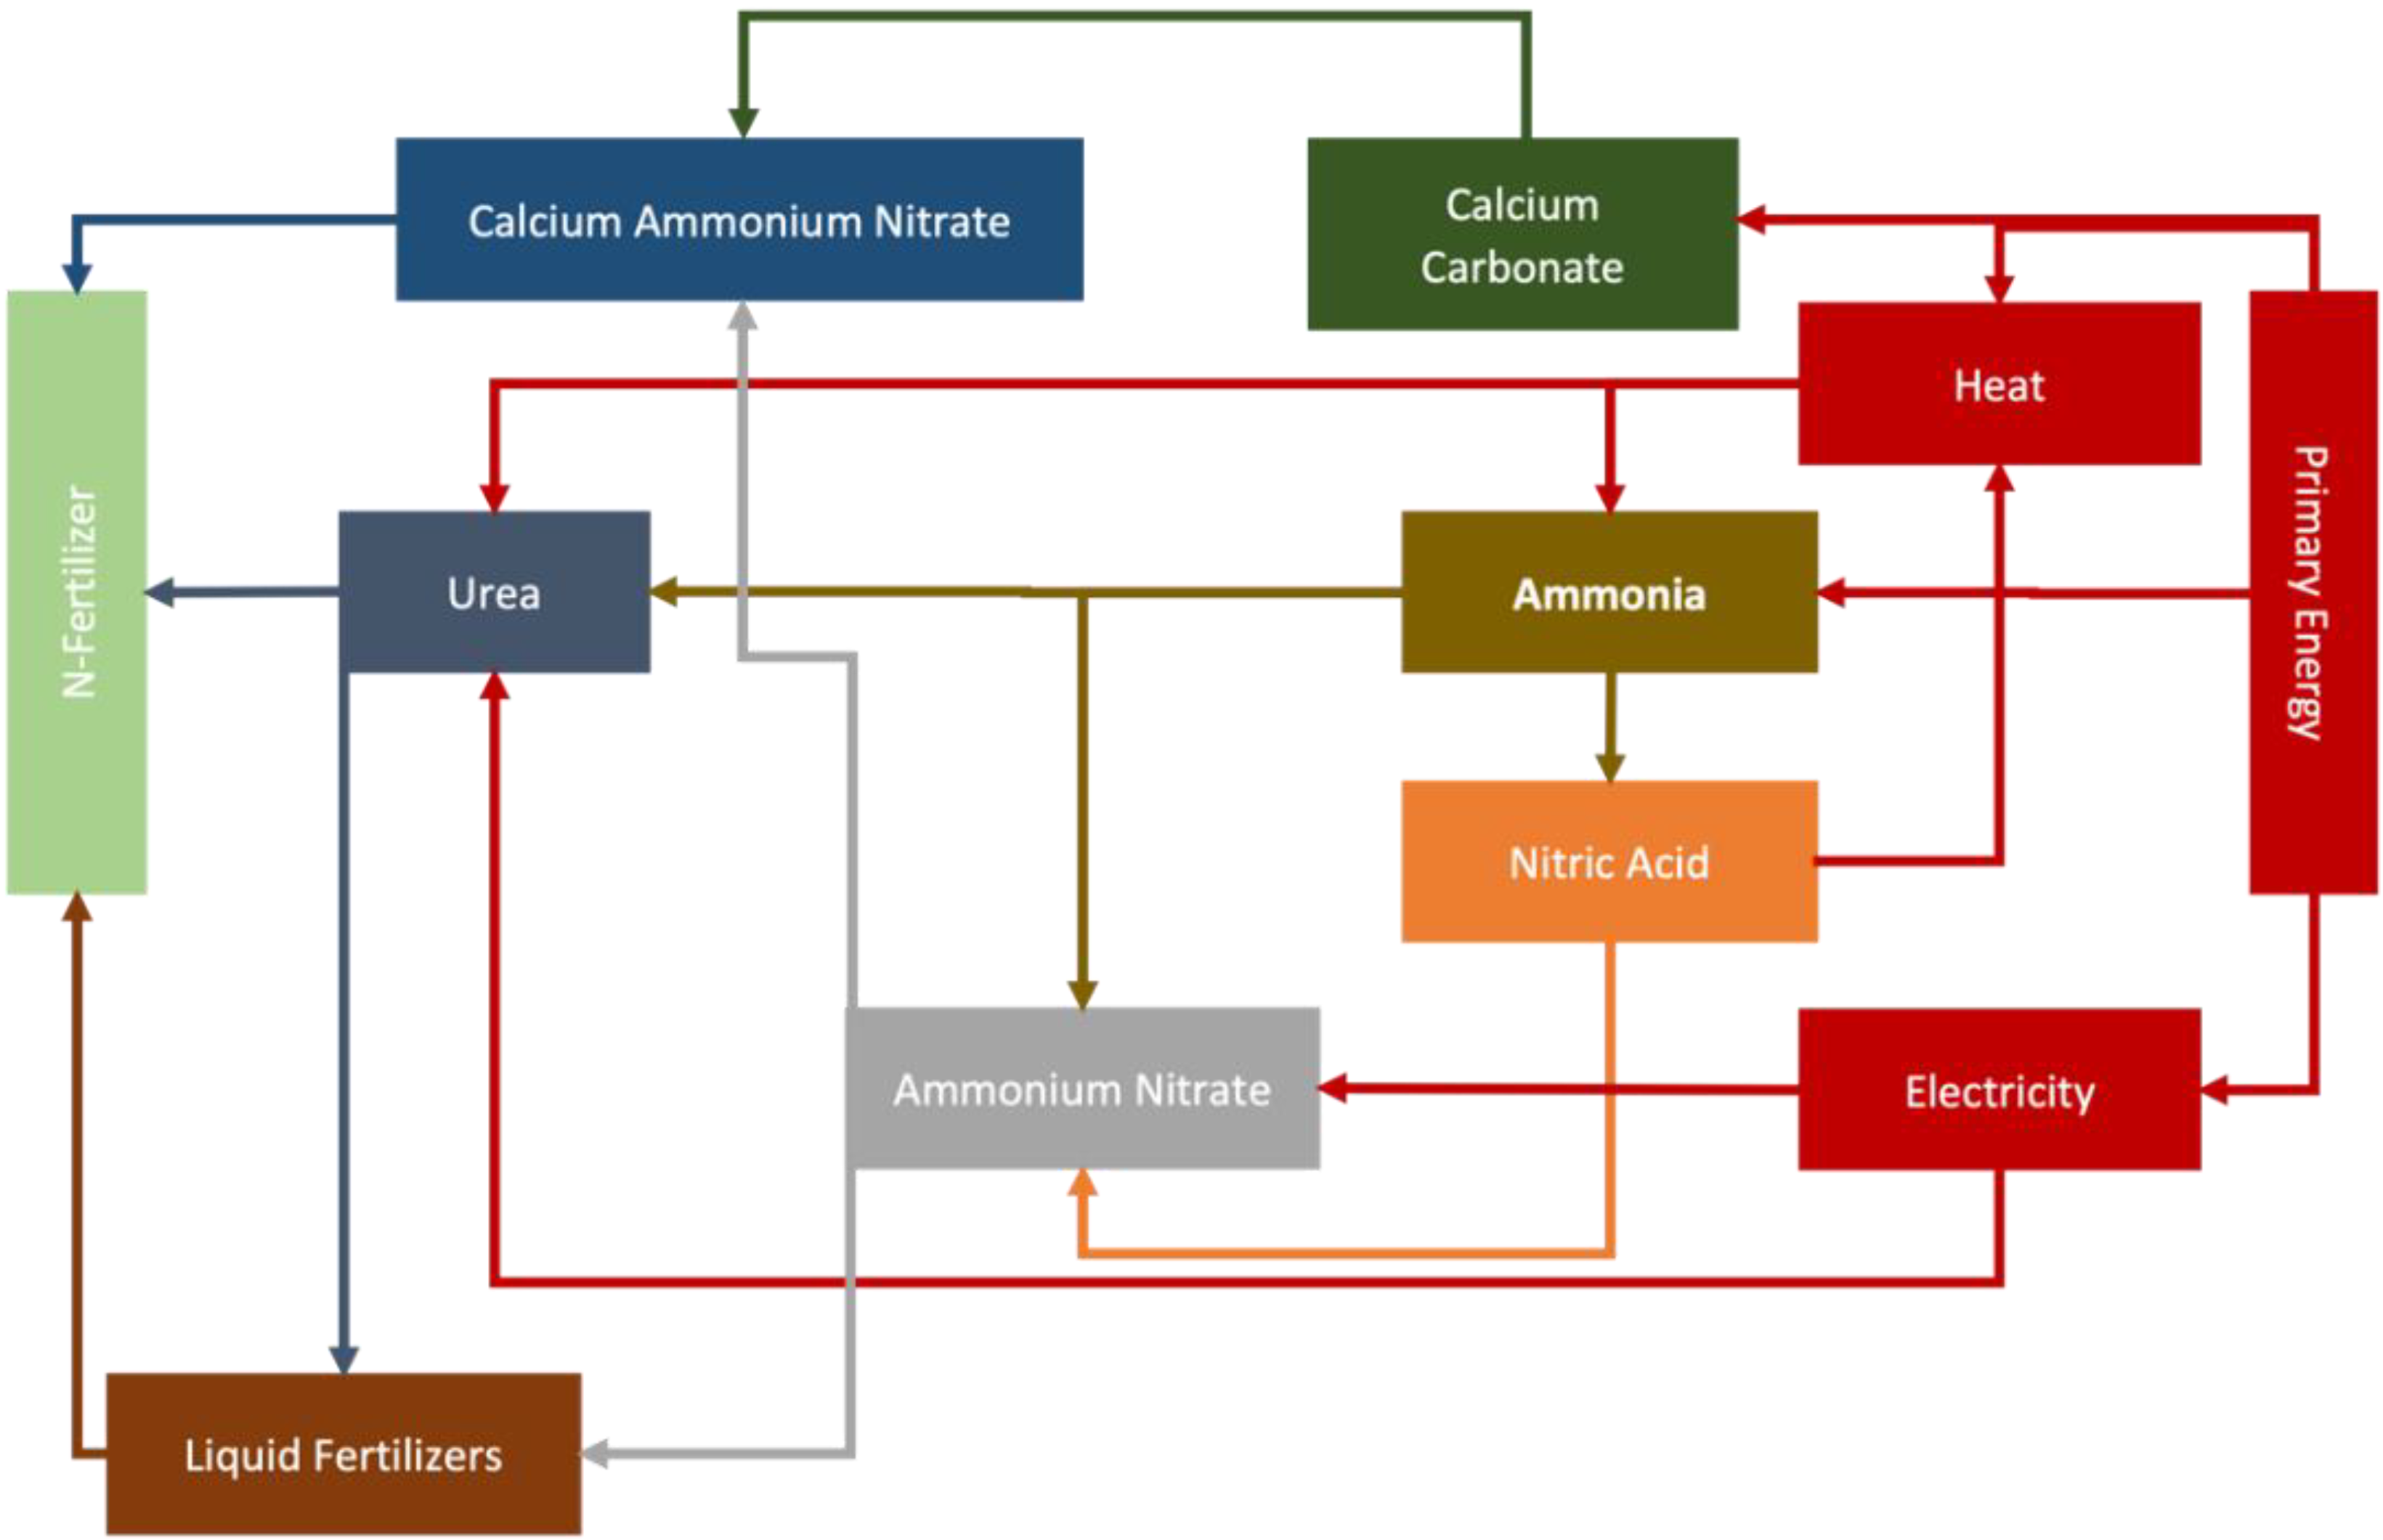
In the year 2020, Germany emitted a total of 739 Mt of greenhouse gases [31]. In 2019, agriculture was responsible for 60.6 Mt of greenhouse gas emissions or 8.2% of total national emissions. The emissions from agriculture arise from energetic fermentation in the gut of animals, N2O volatilising and leaching from agricultural soil, manure management and the production of nitrogen fertilizer (see Figure A1a) [32,33,34]. The main source of fertilizer is nitrogen (56%) followed by potash (17%), kalium (14%), phosphate (9%), and phosphor (4%). Thus, nitrogen accounts for the highest share in fertilizers [35]. Nitrogen fertilizers can be artificial (ammonium nitrate, urea, sulphate of ammonia, anhydrous/aqueous ammonia) or organic (compost, manure, sodium nitrate, industrial by-products). Artificial nitrogen fertilizer is mostly synthesized by the Haber–Bosch process, using natural gas as a fuel and as feedstock. More than half of nitrogen fertilizers are synthesized from natural gas (see Figure A1b) [36,37].
Figure 3 gives German agriculture nitrogen-fertilizer inputs of fossil hydrocarbon and the related outputs including pollution.
In the Haber–Bosch process, one part of nitrogen and three parts of hydrogen are stoichiometrically converted to produce two parts of ammonia. Thereby, nitrogen accounts for a mass fraction of and hydrogen accounts for a mass fraction of [38]. Ammonia is the main source of nitrogen for the further fertilizer production. Hydrogen as an integral educt for the Haber–Bosch process is currently mostly refined from natural gas by steam methane reformation, which produces greenhouse-gas emissions [39].
In German agriculture, the overall nitrogen-based fertilizer use is 4920 kt/a, with 47% calcium ammonium nitrate, 15% urea, 13% fluid fertilizers (a mixture of urea and ammonium nitrate), 14% others, and 11% mixture with potash and phosphorous fertilizers [39,40,41,42,43]. The share of ammonia is 1821 kt (stoichiometrically calculated from total nitrogen intake). The mass and energy flows of the fertilizer production are depicted in Figure A2. The total annual energy demand for nitrogen-fertilizer production is . Ammonia accounts for , ammonium nitrate accounts for , calcium carbonate accounts for , urea accounts for , and nitric acid releases by the recoverable waste heat of its production process [39,41,42,43].
The fertilizers, both artificial and organic, are spread on crops and fields. Germany uses 1500 kt of artificial nitrogen, of which 450 kt leach into soils and waterways and 150 kt volatilize in the form of N2O. In parallel, the animal stock produces 1240 kt of nitrogen from manure, of which 992 kt is recovered and treated and the rest (248 kt) is left on pastures. Of the treated manure, 694 kt of nitrogen are applied on crops, of which 144 kt volatilize and 216 kt leach (see Figure 4) [36,37].
3. Management Study of Past, Present and Future Scenarios
This section works through the first three steps of the InTIME Method, taking a systemic perspective and relying on research of the literature and government sources. First, the metrics are set out for the analysis, then, different future scenarios to the business-as-usual (BAU) case in the literature are compared and possible, less unsustainable future courses identified.
Fossil Fuel Use Index
The Fossil Fuel Use Index describes to the amount of fossil fuel used by a scenario related to the fossil-fuel use of the BAU case. The system boundaries include the fossil fuel needed to produce ammonia by fuel and feedstock.
Energy Use Index
The Energy Use Index analyses the ratio of energy used in a scenario to the energy use of the BAU case. Included energy expenditures account for the necessary primary energy to produce artificial-fertilizer and energy investments in new infrastructure.
Mineral Depletion Index
The Mineral Depletion Index specifically aims to demonstrate the demanded new material mining for technology scenarios. It is assumed that Germany is assigned a share of the global mineral stocks in proportion of its GDP. Mineral extraction rates will be considered.
Biodiversity Loss Index
The Biodiversity Loss Index analyses the agricultural land use of a scenario in relation to the BAU. This includes the land use for growing crops as well as the land use dedicated to animal farming and meadows and pastures.
Carbon Emission Index
As for the Carbon Emission Index, here, the relation of carbon equivalent emissions of a scenario to the BAU carbon equivalent emissions are to be explored. The emissions of agricultural soils, fertilizer production, energetic fermentation of stockbreeding and manure management are considered.
Eutrophication Index
The Eutrophication Index describes the ratio of leaching nitrogen in a scenario to the BAU case. The relative share of leaching nitrogen is assumed to be the same and the absolute values are compared. This metric deals with the overall fertilizer use of a scenario and the implied eutrophication issues.
3.1. Historical Development of Artificial Fertilizers in Germany
The historic evaluation of the role of nitrogen fertilizer in German agriculture aims to deliver an enhanced understanding of the evolution of the wicked problem over time. This evaluation begins with the non-industrialized agriculture of Europe in the 19th century and focusses on their nitrogen supply, agricultural practices, and dietary aspects.
At the beginning of the 19th century, three different ways of supplying agricultural land with nitrogen were in use: the application of manure and bone meal, the enrichment of manure with forest litter or hay and the cultivation of legumes in between crop rotation. The need for further fertilization raised with a growing population, an already close to maximum land use and increasing nutrient poverty in soils. Before the end of the 19th century, three different methods to produce mineral fertilizer were discovered. Coke oven gas (commonly used for lighting purposes) from the gasification of coal contained 0.7–1.5% ammonia in the form of ammonium nitrate with a nitrogen content of 21%. In South America, natural nitrogen sources occurred too. The extraction of sodium nitrate in the Atacama Desert in Chile showed a nitrogen content of 15–16% but was energy- and water-intensive in its production. Another source of nitrogen was the dung of sea birds from islands near Peru, which contained 14% nitrogen but the dung stocks were depleted in just 35 years [40,44,45].
In 1895, Frank and Caro synthesized lime nitrogen from calcium carbide at 1000–1100 °C (later 700 °C) with nitrogen from air. In 1903, Birkeland and Eyde were able to synthesize nitric acid from nitrogen oxide and water. The nitrogen oxide was produced by an air stream through an electric arc at 3500 °C. Both processes were energy intensive and could only be maintained with cheap hydropower [40]. In 1908, Haber patented his ammonia synthesis from nitrogen and hydrogen. It took 5 years for the first industrial ammonia reactor to be built with the help of Bosch [40]. Since 1913, the production of synthetic nitrogen-based fertilizers has grown steadily. Nevertheless, the application of manure and bio-fixation accounted for the biggest intake of nitrogen in 1930, with a 20% share of synthetic nitrogen [45].
Since the 1950s, the nitrogen input (fertilizer and fodder) to output (protein supply to humans) ratio has been generally positive and witnessed a rise from 1 to 3 in the 1980s. The overall protein intake rose between the 1950s and the 1980s, with a threefold rise in the share of animal-based protein intake [46]. In 1960, natural gas replaced coal in the provision of hydrogen, following a massive saving in the energy consumption of the process and rising capacities. Those effects fuelled the rising share of artificial nitrogen fertilizers in Germany until the consumption peaked in the late 1980s. Since then, and with the fall of the Soviet Union, crop yields increased with the declining use of synthetic nitrogen-based fertilizers, due to a more efficient agriculture [45].
In combination with a more efficient agriculture and the ever-rising application of synthetic nitrogen-based fertilizers, Germany was able to overcome self-sufficiency for beef, sugar, rye, and wheat in 1980. Between 1990 and 2016, a 20% emission reduction in the agricultural sector was achieved. This was due to less stockbreeding in east Germany after reunification and better fertilizer management in general [10]. Today, the Haber–Bosch process makes up 80% of the world-wide industrial nitrogen production and uses four times less energy and land than in 1900 [40,44,45].
The conclusion is that even past methods of fertilizing were not necessarily sustainable. Agriculture evolved along inefficient industrial ammonia production towards the well-engineered system of today. Cheap natural gas enabled the production of generally efficient mineral fertilizer and the over-fertilization of fields. There has been research to optimize the necessary nitrogen intake. Today, agriculture is the most efficient with less land, less energy, and less fuel use per nutrient output. Agriculture relies on the Haber–Bosch process. However, this system is still wasteful due to over-fertilization, diets, consumption, and food waste.
3.2. Current Data
Germany has a total land area of 35 Mha. As shown in Figure 5, a third is covered by established or regenerating forest. Half of the country is used as agricultural land and the rest corresponds to man-made infrastructure including roads or buildings. Agricultural land can be divided in two main categories. Crop land covers 8.6 Mha or 46.9% of total agricultural land. Crop land has permanent uses, including fruit trees, and temporary uses, with crops harvested and sown on a yearly or less basis. Meadows and pastures occupy 7.7 Mha or 42.2% of total agricultural land. The number includes permanent and temporary pastures and grassland [47]. A total of 76% of the crop land is dedicated to grains and cereals (maize, wheat, barley). Oilseeds (rapeseed, sunflower) cover up 10%. Vegetables (potatoes, peas, beans) cover 7%, of which half is dedicated to potatoes. Sugar beet uses 5% of the crop land. The remaining 2% is used by fruits, shrubs, and berries (apples, grapes, strawberries) [48]. Fodder for farm animals takes up 57% of cereal production (around 25 million tons). A total of 10% of cereal production (4.5 Mt) is used as energy crops for bioethanol and biodiesel production. Only 20% (9 Mt) go to direct human consumption [49]. One third or 12 Mt of the overall food production is wasted across the production chain [50,51]. A total of 56% of the cumulated food waste is avoidable, whereas households account for 40% of avoidable wastage [51].
The animal stock head numbers are converted in livestock units (LSU) to allow comparison across animals. One LSU in Germany occupies 1.1 ha of agricultural land, on average [52]. A total of 50% of meadows and pastures are dedicated to dairy cows and cattle. Pigs use 39% of that land. The remaining land is covered by chickens (4%), laying hens (4%) and other animals (3%), including turkeys, ducks, sheep, goats, etc. [48]. From meadows and pastural land and considering the crop output going to farm animals, an estimated 11.4 Mha is dedicated to farm animals, which represents 62% of total agricultural land.
The agricultural sector produces 3559 kcal/capita/day with 105 gProtein/capita/day, 149 gFat/capita/day and 448 gCarbs/capita/day. Animal products (meat, dairy, and eggs) provide 1086 kcal/capita/day with 64 gProtein/capita/day and 81 gFat/capita/day. Meat and animal fats provide half of the calories and protein [53]. For reference, the British NHS recommends a daily calory intake of 2500 kcal/capita/day for men and 2000 kcal/capita/day for women depending on age, metabolism and levels of physical activity [54].
3.3. Future Expectations, Policies and Technology Scenarios
In this section, the range of proposed policies, technologies, and actions proposed in scenarios in the scientific literature, in the Climate Action Plan of the German government, and in the European Farm-To-Fork policy are reviewed. The objectives are limitations of nitrogen losses in the process of fertilizer application, of harvest and post-harvest losses, and of over-all food waste. Measures for a reduction in nitrogen-fertilizers use to mitigate the associated harms are:
The scientific literature on German agriculture addresses the need for a change in policy to reduce harms, and critically examines misleading policy [65,66]. Two suggested changes in policies are the limitation of nitrogen surplus per hectare and higher prices for nitrogen fertilizer [66]. Technical innovations have been proposed: chemical washing for the exhaust air of livestock breeding, substitution of urea with calcium ammonium nitrate, reduction in manure treatment losses and improved manure and artificial-fertilizer application [66,67]. It is suggested to recouple land use and livestock breeding, and to use low-protein pig food [65,67].
The agriculture component of the German Climate Action Plan for 2030 [10] aims to reduce emissions by 15% below the 2017 benchmark, and sets the following objectives:
- No limitation of production;
- Competitiveness of agriculture;
- Resource efficiency;
- Sector coupling;
- Digital technologies;
- Precision agriculture.
Furthermore, the Climate Action Plan sets the target for a nitrogen surplus reduction by 20% from 70 kgN/ha in 2021. The economic signal is to reduce emissions from ammonia production by making them subject to an emission trading scheme. Mainly technical measures are proposed: low-emission application techniques and fertilizer technology, gastight manure storage, research towards the interplay between NH3 and N2O from fertilizers, reduction in the energy demand of stationary and mobile agriculture technology and more renewable energies. An increase in organic agriculture from about 10% as of 2020 to 20% in 2030 is encouraged. Measures on the downshift of greenhouse gas emissions in stockbreeding are mentioned as well but are not sufficiently described in the Climate Action Plan for 2030.
The sustainability of agriculture is also well-represented on the European policy level in the Farm To Fork strategy [28], with the common objectives being:
- Reduction in fertilizer use;
- Reduction in emissions from stockbreeding;
- Increase in organic farming;
- Shift in diets and consumption patterns;
- Reduction in food waste
Similar to the German national targets, it is encouraged to generally reduce the use of fertilizer through improved nutrient management and precision agriculture. The emissions from stockbreeding are to be reduced through innovative feed additives. An increase in organic agriculture is incentivised through subsidies for sustainable farming practises under the Green Direct Payment policy [68]. In addition to the German national targets, the importance of a dietary transition and a shift in consumption patterns are highlighted. This policy angle aims to fight obesity and over-consumption. It acknowledges the unsustainability and health overshoot of current energy, meat, sugar, fat, and salt consumption. Plant-based diets with a higher share of fruits, and less red and processed meat is encouraged.
A shift to organic agriculture has been considered to be more sustainable by the scientific literature and policy strategies. The general advantages in comparison to conventional agriculture are environmental friendliness, increased soil carbon levels, decreased soil erosion, higher energy efficiency, and lower fossil-fuel consumption [63,69]. Nevertheless, there are issues about organic agriculture in comparison to conventional agriculture that need to be addressed:
The yields highly depend on crop rotation, weather conditions, and soil management practices [63,71]. Yields from organic agriculture outperform yields from conventional agriculture in droughts, because of improved water-holding capacity in the soil [63,69]. The overall costs are similar to conventional farming, while labour costs are increased [63,72]. If ecological externalities and the provision of ecosystem services are factored in, organic agriculture is more profitable than conventional agriculture [63]. Organic livestock farms often require less labour per head, whereas general cropping can require from 29% less to 68% more labour per hectare depending on the country [70]. Labour-intensity differences between organic and conventional farming also depend on farm size and structure [70]. In general, organic agriculture alone will not be able to supply sufficient nutrition to a growing population with current diets and consumption patterns [63,64,69]. Regarding the current interplay between organic and conventional farms, there is no clear evidence that organic farms are profiting from conventional pest control on nearby farms. Thereby, the high biodiversity in organic farming could benefit natural pest control [69].
Crash Test of the Hydrogen for Fertilizer Scenario
The first examined scenario investigates the potential of implementing technological solutions to downshift greenhouse gas emissions [73]. Substituting hydrogen from electrolysis of renewable electricity for natural gas in the artificial fertilizer manufacture is the most popular policy in Germany [73]. For the crash-test analysis, the population, agricultural production, and land area were set at current levels. Since wind power is Germany’s largest renewable energy source [74], new offshore wind farms and new energy-storage and conversion facilities are assumed to provide the electricity [75,76]. It is expected that the electrolyser is operated throughout the whole year and that the batteries compensate the necessary daily renewable energy fluctuation and secure supply security. The electricity from wind power is converted to hydrogen in a proton-exchange membrane (PEM)-type electrolyser. The PEM technology is more suited to ramping than technologies such as alkaline or solid oxide electrolysers [77]. Li-Ion battery technology with a nickel–manganese–cobalt (NMC) cell chemistry was chosen with respect to applications in similar supply security projects [78].
The rated power of the electrolyser is calculated from the yearly needed hydrogen output using typical offshore-wind utilization factors. The capacity of the battery storage system is derived from the daily energy that is needed to be supplied with respect to a limited depth of discharge and the mean round-trip efficiency. The lifetime of the capital plant is set to be the lifetime of the wind turbines and is assumed to be 20 years [79]. The construction of new Haber–Bosch plants is not considered. The full explanation of modelling assumptions and references for the assumptions of this scenario are listed in Table A2, Table A3, Table A4 and Table A5.
The results show that 16.1 GWh/a of energy is required for the electrolysis. This translates into 6.12 GW of installed wind power, 3.06 GW of electrolysis capacity and 116.6 GWh battery capacity. The lifetime-levelized embodied energy in the capital equipment is 3132 TJ/a for wind turbines, 253 TJ/a for electrolysers and 233,223 TJ/a for batteries. The GHG emissions reduction compared to the methane-fed Haber–Bosch process is 4.6 MtCO2eq/a, whereas the added lifecycle emissions from the new capital equipment are 0.25 MtCO2eq/a for wind turbines, 0.04 MtCO2eq/a for electrolysers, and 0.94 MtCO2eq/a for batteries. The capital investments are EUR 25,713 million for the wind turbines, EUR 1041 million for the electrolysers, and EUR 58,307 million for the batteries. The most critical material, iridium, is required for the electrolysis with a total loading of 2.3 t. The batteries require a cobalt loading of 56 kt and graphite loading of 187 kt.
The hydrogen scenario reduces the natural-gas consumption for nitrogen fertilizer production to zero. The primary energy for the other production processes, as for ammonium nitrate, urea, calcium carbonate, and nitric acid, are not considered due to their relatively insignificant shares compared to the energy consumption of the ammonia production. The scenario has the same biodiversity loss and eutrophication as in the BAU current system, since no change in diet, fertilizer use, population size, or agricultural practice are assumed.
Results show that emissions increase to 102% for the hydrogen scenario over the BAU. The energy use index rises to 214% over the BAU scenario. The cost of the new infrastructure is more than one-hundred times (12,753%) that of today’s German agriculture GDP. The mineral depletion results are shown in years of production in Table 1. Both iridium and cobalt need more than seven years of global production. It should be further noted that emissions from the production of ammonia are significantly lower than emissions from fertilizer application and meat and dairy animals.
The crash-test results show that the hydrogen scenario for fertilizer production is not feasible for immediate massive decarbonisation. The costs are high, and the scenario depletes precious materials and consumes more energy than the current system. Calculations are available in the Supplementary Materials Excel Workbook.
4. Strategic Scenario Analysis for Future German Agriculture
This section executes the strategic scenario analysis for the emissions reduction from German agriculture and its nitrogen use. Firstly, scenarios are developed and will be tested on their general feasibility in the second part. In the third segment, the feasible scenarios will be evaluated by the predefined metrics in detail. The outcome will form the opportunity space for the future of German agriculture and food.
4.1. The Possibility Spaces
From the system overview of German agriculture in Figure 6, scenarios for analysis are identified.
- (1)
- Hydrogen substitution. Replacing fossil gas with renewable hydrogen was already examined in depth by the crash test.
- (2)
- Ammonia production efficiency optimisation. This is an efficiency scenario, since the Haber–Bosch plant could be thermodynamically optimized to reduce the natural gas intake and thus lower the energy use and emissions.
- (3)
- Improvements in use and storage of fertilizer. The nitrogen surplus per hectare is to be limited through improved practice and the measurement of leaching and volatilizing nitrogen.
- (4)
- Agriculture practices transition to organic. This includes switching from conventional to organic agriculture and using state-of-the-art best practice.
- (5)
- Diet transition. The share of animal products in the diet consumption is reduced.
Nutrition production capacities will remain constant, any reduction in food waste is considered to be surplus that can be sold in international markets.
4.2. Feasibility Analysis
The proposed measures in the possibility analysis are categorized as technological solutions, changes in agricultural practice, and changes in dietary aspects. The research review in the historical section provides the analysis for technical efficiency improvement in the Haber–Bosch process, and for decrease in nitrogen surplus on the fields. In addition, the historical development showed no significant reduction in fertilizer use despite parallel rising efficiencies (rebound effect or Jevons’ Paradox). The effects of sustainable agricultural practices and the reduced consumption of animal products are well-researched in the literature, and the positive environmental impacts have been assessed but not yet implemented (see Section 3.3). The hydrogen scenario was assessed as not feasible in the crash-test analysis.
4.3. Opportunity Analysis
Three scenarios were analytically investigated and compared to BAU: the vegetarian, the vegan, and the organic scenario. The detailed calculations can be extracted from the Excel Workbook. The BAU scenario acts as a benchmark. The vegetarian scenario assumes that no more meat is produced and consumed. Still, this enables the consumption of animal-based products such as cheese, milk, or eggs. Laying hens and dairy cows are still bred. Wheat is used as a proxy for protein production and canola as a proxy for fat production. The vegan scenario assumes that no more meat and no other animal-based products are produced and consumed. Protein and fat are supplied as in the vegetarian scenario. Soy acts as a proxy for the combined fat and protein production from the remaining vegetarian products. This simplifies nutrient intake but serves as an indicator for the changes implied by a vegetarian or vegan diet. The organic scenario assumes that German agriculture shifts from 10% organic agriculture as of today to 100% in the future. This implies no more use of artificial fertilizer. The soil is supplied with nitrogen by growing integrated Leguminosae, the application of manure and other natural sources. Regulations for livestock breeding are also enforced. The assumptions for the vegetarian, vegan and organic scenarios are listed in Table A6 and Table A7.
In Table 2, the results of the strategic scenario analysis are presented (the technology scenario is added just for the sake of completeness). The vegetarian scenario shows a land gain of 26%, a 48% reduction in carbon emissions, and a reduction by 11% in eutrophication. The fossil-fuel use and the energy use are both increased by 47%. The vegan scenario reduces the land use by 33% and the carbon emissions by 63% and decreases eutrophication by 6%. The fossil-fuel use and energy use are increased by 71%. The organic scenario completely withdraws from fossil fuel, but it needs a 29% increase in land use, which is unfeasible in the boundaries of Germany. Still, organic agriculture would lower the emissions by 33% and the eutrophication by 74%. For comparison, the technology scenario with electrolytic H2 eliminates fossil-fuel dependence but does not improve, and even worsens, the BAU Scenario.
It is demonstrated that no single scenario can lead to an over-all decrease in today’s unsustainability without violating natural boundaries. A combination of scenarios must be taken into consideration. The vegetarian, vegan and organic scenarios do yield promising results on some metrics—thus, the advanced analysis aims to identify scenarios in which all metrics can be improved. The advanced scenarios incorporate the positive effects of organic agriculture on fossil-fuel use, energy use, carbon emissions, and eutrophication and the positive effects of fewer animal products on biodiversity loss, carbon emissions, and eutrophication. The advanced scenario analysis examines how the share of animal products in an organic agriculture context influence the biodiversity loss, the carbon emissions, and the eutrophication. Fossil-fuel use and energy use in fertilizer production are non-existent in organic scenarios, since no artificial fertilizers are applied. Different shares of animal products in an organic context are examined as shown in Figure 7. It is important to highlight that the x axis intentionally truncates at 20%, because organic agriculture still relies on animal integration.
An agricultural system with the same land use as the BAU scenario but with significantly lower carbon and nitrogen emissions is obtained with at least 60% reduction in animal products. Land use acts as a hard boundary condition, since deforestation is seen as unacceptable in Germany [80]. Another boundary is the extent to which carbon emissions must be downshifted. The common goal of 80% decarbonization across sectors would allow maintaining 25% of the current animal products in the diet. Table 3 further lists the indices for a share of 40% and 25% animal products. The 60%-reduction option cuts carbon emissions by 69% and the eutrophication by 81%. The 75% reduction reduces carbon emissions by 81% and the eutrophication by 93%.
5. Discussion
5.1. Results of the Opportunity Analysis
The Opportunity Analysis uncovered that a pure vegetarian or vegan diet, or a change to organic agriculture with maintaining the BAU diet, are not sustainable opportunities for German agriculture and its nitrogen-fertilizer use. For the vegetarian and vegan scenarios, land gain is enabled by the reduced animal livestock and the related fodder cultivation. The reduction in carbon emissions and eutrophication is a combination of lower energetic fermentation and lower fertilizer use in general due to the decreased land that needs fertilizing. The increase in energy use and fossil-fuel consumption is due to the increased need for artificial fertilizer with declining manure availability. For the organic scenario, the increase in land use is rooted in the higher land use per animal in organic farming for current diets. In addition, changes in the fertilizing technique require more land use for crops than conventional agriculture. Since no more artificial fertilizer is used, carbon footprint and eutrophication are eradicated. The technology scenario showed that a substitution of fossil fuel in the fertilizer production system decreases the sustainability. This result highlights that the reason for the associated harms of German agriculture do not solely arise from fossil-fuel use embedded in artificial fertilizer.
The fossil-fuel use and energy expenditure of the dietary scenarios and the land use of the organic scenario are too high. The issues of fossil-fuel use and energy consumption are overcome by the co-application of organic agriculture and dietary changes. Thus, a certain reduction in animal products is an important part of the transition. The results show that at least a 60% reduction in meat and animal-based products is possible with no fossil-fuel or energy expenditures, and significant carbon and nitrogen emission downshifts while at least maintaining the current land use. This enables the consumption of almost half of the animal products of today while consequently increasing agriculture’s sustainability. A 75% reduction in animal products would lead to an 80% downshift in carbon emissions. These findings go along with the main recommendations of the literature (see Section 3.3), stating that a change in diet and a shift towards more organic agriculture are powerful measures for the decarbonization of agriculture and fertilizer use. A 60–75% reduction in meat products would result in consumption diets similar to the 1960s–1970s [46].
5.2. Shift Project
Shift projects are necessary to safely retreat from fossil-fuel use and to deliver the scenarios that are deemed as feasible opportunities for carbon downshift. Shift projects allow to address the wicked problem directly. The wicked problem is defined as the use of energy, supplied by either fossil fuels or renewable energies, and the associated agricultural practices and consumption patterns. A successful sustainable shift project must have a multi-capital outcome. Two of the most important outcomes are economical capital (revenue, business opportunities) and social capital (trust, cooperation) [6,14].
Our propositions to policy makers on the national level is the investigation of a large-scale introduction of organic agriculture with an at least 60% reduction in animal products. Two basic transitions arise: shifting today’s mostly conventional agriculture to organic agriculture and reducing the animal product consumption while maintaining the high level of the present nutrient supply. It is recommended to set the aim to reach these goals by 2050 to meet policy climate targets. This translates into a 3 percentage point increase in organic agriculture and a 1.5 percentage point reduction in animal-product consumption per year from now on (2022). The resulting challenges for today’s take off of future change are:
- A shift to organic agriculture is expensive considering embedded infrastructure investments, certifications, and labour [63];
- The debt accumulated from previous investments in BAU infrastructure [29];
- The loss of income from German animal-product exports [81];
- A change in diet is an engagement in behavioural aspects of people [82];
- The loss of international market competitiveness [29].
To overcome the challenge of the cost of conversion from conventional to organic agriculture, governmental modelling and research support, plus subsidies, should be used as an incentive for farmers to change their agricultural practice. It is suggested to put forward grants to reduce debt from previous BAU infrastructure investments and coupling them to farmers’ willingness to change their practice in the future. For example, a 50% shift to organic could provide debt relief of 50%. Further economic measures should focus on reducing energy dependence in other sectors, such as individual transportation, to free up household spending that can be redirected towards better but more expensive food. Farm cooperatives (in German, Genossenschaften) are encouraged, which can secure long-term social and financial capital with potential increased community involvement and shorter production circuits [83].
The challenge of the dietary change can support the agriculture transition. In recent years, the revenues of animal-product substitutes has increased significantly [84]. This supports the theory of Anthropogenic System Dynamics; the availability of affordable alternatives to unsustainable practices enables people to shift their behaviour [85]. Conversion of industrial animal-product facilities to produce meat substitutes is suggested. Meeting targets to limit over-consumption, avoidable waste and over-fertilization will positively influence the commercial balance to finance the shift. At the moment, prices in German supermarkets are one of the lowest in Europe relatively to the mean income per capita [86]. Even so, the needs for the healthy nutrition of people with a smaller income and reliance on social care must still be met if food prices increase in the future. Still, a decrease in food waste and over-consumption lead to freed up spending.
Nevertheless, any change of the current system puts Germany’s competitivity at risk. The influx of cheaper, non-organic produce would negate the country’s efforts to reach sustainability. European strategies remain committed to increase sustainability, and the implementation of a protective “Carbon Border Adjustment Mechanism”, as proposed in the Fit-For-55 strategy, would be advantageous [87].
Ramping up the incentives for increased organic farming is suggested, according to the necessary annual 3 percentage point rise in the share of organic farming. New policies should include control and correction mechanisms for meeting annual targets. Similarly, the financial situation of food prices should be monitored in parallel to adapt the support according to price changes. In parallel, impulses for food-waste reduction and lowering of over-consumption can be given by education in schools or awareness campaigns in food stores. A monitoring system for food waste should be implemented to keep track of the effectiveness of incentives. An already-declining trend in animal-product consumption is acknowledged [88], so the rate of increase in alternatives to animal products should be kept high to meet the annual 1.5 percentage point target.
6. Summary and Conclusions
This article developed and evaluated scenarios for the decarbonization of German agriculture and its nitrogen-fertilizer use. The methods to accomplish the analysis are the InTIME Method and the strategic scenario analysis. The evaluation of the fertilizer use of German agriculture reveals that the core of unsustainability lies in the use of energy, either supplied by fossil-fuel or renewable energies, to produce nitrogen fertilizer. This efficient and currently affordable system enables unsustainable agricultural practices and behaviour. The harms of the system manifest in carbon emissions from energetic fermentation and artificial-fertilizer production, in N2O emissions from soils and manure treatment, in eutrophication from leaching nitrogen, in biodiversity loss, and in energy dependence. The results of the strategic scenario analysis indicate that technological solutions are not sustainable and do not decrease harms. Said solutions are substituting fossil fuels with hydrogen from electrolysis with renewable energies and efficiency increases in industrial fertilizer production. The use of “green hydrogen” as a fossil-fuel substitute does not succeed in achieving sustainability. The sources of unsustainability and the harms are stretched out throughout the whole production chain of agriculture and must be tackled with more systemic approaches. It is concluded that the problem does not revolve around the production methods of artificial fertilizer but the activities that are carried out by using it.
The findings show that at least a 60% reduction in animal-product consumption with a shift to organic agriculture can be operated without increasing current land use. This will significantly decrease the harms of carbon emissions and eutrophication. Change will move the fertilizer supply of German agriculture away from fossil fuel, making it independent of natural gas imports. Five pivotal recommendations with consideration of economic- and social-capital generation were compiled to ease the reduction in meat consumption and a change to organic agriculture: subsidies and debt relief for farmers to change toward organic agriculture, the formation of agriculture cooperatives, the encouragement of plant-protein meat substitutes, the adaptation of the financial support system for lower income households, and regulations to decrease waste and over-consumption.
Future research should focus on the implementation of the recommendations. This involves the careful analysis of the regulatory system and policies of German agriculture. It should be researched how the recommendations fit into existing frameworks and how new frameworks for regulations and policies need to be designed to incorporate a more sustainable agriculture. The influence of geo-political events in recent history in Europe affecting the fossil-fuel supply should be researched, to determine their role as triggers for agricultural system change. The large-scale application of organic agriculture is challenging and needs proper place-based research and development. Perhaps the biggest challenge of changing policies that assume renewable hydrogen will substitute fossil fuels can be assisted by the results of this study.
Supplementary Materials
The following supporting information can be downloaded at: https://www.mdpi.com/article/10.3390/su14148564/s1. The supplementary Excel Workbook can be obtained from the MDPI website.
Author Contributions
Conceptualization, validation, F.A., J.L. and S.K.; methodology, S.K.; software, formal analysis, investigation, resources, data curation, visualisation, F.A. and J.L.; writing—original draft preparation, F.A. and J.L.; writing—review and editing, F.A., J.L. and S.K.; supervision, S.K.; project administration, F.A. and J.L. All authors have read and agreed to the published version of the manuscript.
Funding
This research received no external funding.
Institutional Review Board Statement
Not applicable.
Informed Consent Statement
Not applicable.
Data Availability Statement
The Supplementary Excel Workbook can be obtained from the MDPI website.
Acknowledgments
The authors would like to thank the anonymous reviewers for their valuable insights.
Conflicts of Interest
The authors declare no conflict of interest.
Appendix A
Appendix A.1. Figures
Figure A1.
(a) Emissions from German agriculture (data obtained from [32,33,34]) and (b) fossil-fuel dependence of nitrogen fertilizer (data obtained from [36,37]).

Appendix A.2. Tables

Table A1.
Detailed nutritional overview of German agriculture (data obtained from [53]).
Table A1.
Detailed nutritional overview of German agriculture (data obtained from [53]).
| Type | Organic Coefficient |
|---|---|
| BAU calorie production(kcal/capita/day) | |
| Total | 3554 |
| From animal products | 1086 |
| Dairy products and eggs | 442 |
| Meat and animal fat | 607 |
| Other | 2468 |
| BAU protein production (g/capita/day) | |
| Total | 105.4 |
| From animal products | 64.03 |
| Dairy products and eggs | 33.86 |
| Meat | 25.89 |
| Other | 41.37 |
| BAU fat production (g/capita/day) | |
| Total | 149.05 |
| From animal products | 80.67 |
| Dairy products and eggs | 23.66 |
| Meat and animal fat | 54.94 |
| Other | 68.38 |
| BAU carbs production (g/capita/day) | |
| Total | 447.74 |
Table A2.
General assumptions for the technology scenario.
| Amount NH3 | Lifetime Offshore Wind [89] | Full Load Hours Offshore Wind [76] | Lifetime PEM Electrolysis System (Stack) [90] |
|---|---|---|---|
| 1821 kT | 20 a | 4380 h/a | 10 a |
| Maximum equivalent full cycles NMC battery | Calendric lifetime NMC battery | Lower heating value H2 | Full load hours PEM electrolysis system |
| 5000 | 10 a | 33.3 kWh/kg | 8760 h |
Table A3.
Energy-related assumptions for the technology scenario.
| Energy Impact NH3 [91] | Embodied Energy Offshore Wind [92] | Embodied Energy PEM Electrolysis System [93] | Embodied Energy NMC Battery [94] |
|---|---|---|---|
| 31.8 kJ/kT | 2,842,500 kWh/MW | 230,000 kWh/MW | 0.56 kWh/MWh |
| Efficiency PEM electrolysis system | Efficiency NMC battery | Depth of Discharge NMC battery | |
| 60% | 90% | 20–90% SOC |
Table A4.
Cost and environmental assumptions for the technology scenarios.
| Emission Factor Haber Bosch Process (Methane Fed) [33] | Emission Factor Off-Shore Wind [79] | Specific Investment Cost Offshore Wind [95] | Emission Factor PEM Electrolysis System [93] |
|---|---|---|---|
| 2.55 tCO2/tNH3 | 9.3 gCO2/kWh | 4.2 M€/MW | 122 kgCO2/kW |
| Specific investment cost PEM electrolysis system [96] | Emission factor NMC battery [94] | Specific investment cost NMC battery system [78] | German agriculture GDP |
| 170 €/kW | 80.4 kgCO2/kWh | 250 €/kWh | 6670 M€ |
Table A5.
Relevant material uses for the technology scenario.
| PEM Electrolysis System Material Use [90] | Wind Turbine Material Use [79] | NMC Battery Material Use [94] |
|---|---|---|
| Ir: 0.75 kg/MW, Pt: 0.075 kg/MW, Cu: 4.5 kg/MW | Cu: 397.6 t/MW | Graphite: 1.6 Mt/GWh, Ni: 1.44 Mt/GWh, Mn: 0.5 Mt/GWh, Co: 0.48 Mt/GWh |
| Worldwide material production [97,98,99,100,101,102] | ||
| Ir: 6.86 t/a, Pt: 180 t/a, Cu: 19.1 Mt/a, Graphite: 1.1 Mt/a, Ni: 2.44 Mt/a, Mn: 70.83 Mt/a, Co: 0.14 Mt/a | ||
Table A6.
Organic land use Coefficients (data obtained from [103]).
Table A6.
Organic land use Coefficients (data obtained from [103]).
| Type | Organic Land Use Coefficient |
|---|---|
| Fruits and Berries | 1.31 |
| Vegetables and Legumes | 1.19 |
| Grains and Cereals | 1.27 |
| Oil Seeds | 1.23 |
| Sugar Beet | 0.95 |
| Buffaloes | 1.67 |
| Cattle (excluding dairy) | 1.67 |
| Dairy cows | 1.40 |
| Goats | 1.68 |
| Pigs | 1.85 |
| Sheep | 1.68 |
| Chickens (excluding laying hens) | 3.05 |
| Laying Hens | 2.51 |
| Turkey | 1.68 |
| Ducks | 1.68 |
| Geese | 1.68 |
Table A7.
Production replacement factors for vegetarian and vegan diets (data obtained from [53]).
Table A7.
Production replacement factors for vegetarian and vegan diets (data obtained from [53]).
| Production Replacement | kcal/Person/Day/ha | gCarbs/Person/Day/ha | gFat/Person/Day/ha | gProtein/Capita/Day/ha |
|---|---|---|---|---|
| Wheat | ||||
| Canola | / | / | ||
| Soy |
References
- Rockström, J.; Steffen, W.; Noone, K.; Persson, Å.; Chapin, F.S.I.; Lambin, E.; Lenton, T.M.; Scheffer, M.; Folke, C.; Schellnhuber, H.J.; et al. Planetary Boundaries: Exploring the Safe Operating Space for Humanity. Ecol. Soc. 2009, 14, 32. [Google Scholar] [CrossRef]
- Hansen, J.; Sato, M.; Hearty, P.; Ruedy, R.; Kelley, M.; Masson-Delmotte, V.; Russell, G.; Tselioudis, G.; Cao, J.; Rignot, E.; et al. Ice Melt, Sea Level Rise and Superstorms: Evidence from Paleoclimate Data, Climate Modeling, and Modern Observations That 2 °C Global Warming Could Be Dangerous. Atmos. Chem. Phys. 2016, 16, 3761–3812. [Google Scholar] [CrossRef] [Green Version]
- IPCC. IPCC Summary for Policymakers. In Climate Change 2021: The Physical Science Basis. Contribution of Working Group I to the Sixth Assessment Report of the Intergovernmental Panel on Climate Change; Cambridge University Press: Cambridge, UK; New York, NY, USA, 2021; pp. 3–32. [Google Scholar]
- Haberl, H.; Wiedenhofer, D.; Virág, D.; Kalt, G.; Plank, B.; Brockway, P.; Fishman, T.; Hausknost, D.; Krausmann, F.; Leon-Gruchalski, B.; et al. A Systematic Review of the Evidence on Decoupling of GDP, Resource Use and GHG Emissions, Part II: Synthesizing the Insights. Environ. Res. Lett. 2020, 15, 065003. [Google Scholar] [CrossRef]
- Hickel, J.; Kallis, G. Is Green Growth Possible? New Political Econ. 2020, 25, 469–486. [Google Scholar] [CrossRef]
- Krumdieck, S. Transition Engineering: Building a Sustainable Future, 1st ed.; CRC Press: Boca Raton, FL, USA, 2019; ISBN 978-0-367-34126-8. [Google Scholar]
- Creutzig, F.; Niamir, L.; Bai, X.; Callaghan, M.; Cullen, J.; Díaz-José, J.; Figueroa, M.; Grubler, A.; Lamb, W.F.; Leip, A.; et al. Demand-Side Solutions to Climate Change Mitigation Consistent with High Levels of Well-Being. Nat. Clim. Chang. 2022, 12, 36–46. [Google Scholar] [CrossRef]
- Rittel, H.W.J.; Webber, M.M. Dilemmas in a General Theory of Planning. Policy Sci. 1973, 4, 155–169. [Google Scholar] [CrossRef]
- Stéphanie, B.; Fernandez, P.A.; Christophe, M.; Uwe, R.; Brent, W.; Laszlo, V.; Davide, D.; Thomas, S. IEA Net Zero by 2050—A Roadmap for the Global Energy Sector 2021. Policy Document. Available online: https://www.iea.org/reports/net-zero-by-2050 (accessed on 1 August 2021).
- Federal Ministry for the Environment. Nature Conservation and Nuclear Safety Klimaschutzprogramm 2030 der Bundesregierung zur Umsetzung des Klimaschutzplans 2050; Federal Ministry for the Environment: Bonn, Germany, 2019. [Google Scholar]
- European Commission. Our Vision for a Clean Planet for All; European Commission: Maastricht, The Netherlands, 2018. [Google Scholar]
- Mundaca, L.; Ürge-Vorsatz, D.; Wilson, C. Demand-Side Approaches for Limiting Global Warming to 1.5 °C. Energy Effic. 2019, 12, 343–362. [Google Scholar] [CrossRef] [Green Version]
- Levin, K.; Cashore, B.; Bernstein, S.; Auld, G. Overcoming the Tragedy of Super Wicked Problems: Constraining Our Future Selves to Ameliorate Global Climate Change. Policy Sci. 2012, 45, 123–152. [Google Scholar] [CrossRef]
- Hassan, Z. The Social Labs Revolution: A New Approach to Solving Our Most Complex Challenges, 1st ed.; Berrett-Koehler Publishers, Inc.: San Francisco, CA, USA, 2014; ISBN 978-1-62656-073-4. [Google Scholar]
- McMahon, C.; Krumdieck, S. Transitioning to Sustainable Engineering Systems. In Handbook of Engineering Systems Design; Maier, A., Oehmen, J., Vermaas, P.E., Eds.; Springer: Cham, Switzerland, 2022; pp. 1–23. ISBN 978-3-030-46054-9. [Google Scholar]
- Bajan, B.; Łukasiewicz, J.; Poczta-Wajda, A.; Poczta, W. Edible Energy Production and Energy Return on Investment—Long-Term Analysis of Global Changes. Energies 2021, 14, 1011. [Google Scholar] [CrossRef]
- Ramírez, C.A.; Worrell, E. Feeding Fossil Fuels to the Soil. Resour. Conserv. Recycl. 2006, 46, 75–93. [Google Scholar] [CrossRef]
- Markussen, M.; Østergård, H. Energy Analysis of the Danish Food Production System: Food-EROI and Fossil Fuel Dependency. Energies 2013, 6, 4170–4186. [Google Scholar] [CrossRef] [Green Version]
- Krumdieck, S. Peak Oil Vulnerability Assessment for Dunedin. Research Report. 2015. Available online: https://www.researchgate.net/publication/277668208_Peak_Oil_Vulnerability_Assessment_for_Dunedin#read (accessed on 1 August 2021).
- Krumdieck, S.; Abley, S.; McDonald, G. New Zealand a Future with Less Oil: A Risk Management Study for Palmerston North. Research Report. 2015. Available online: https://www.researchgate.net/publication/277668351_New_Zealand_a_future_with_less_oil_A_risk_management_study_for_Palmerston_North (accessed on 1 August 2021).
- Krumdieck, S.; Frye, J. Optimizing Wind-Diesel Hybrid Energy Systems Including a Demand Side Management Strategy. In Proceedings of the 1st International e-Conference on Energies, Online, 14–31 March 2014; p. c008. [Google Scholar]
- Gallardo, P.; Murray, R.; Krumdieck, S. A Sequential Optimization-Simulation Approach for Planning the Transition to the Low Carbon Freight System with Case Study in the North Island of New Zealand. Energies 2021, 14, 3339. [Google Scholar] [CrossRef]
- Bai, M.; Krumdieck, S. Transition Engineering of Transport in Megacities with Case Study on Commuting in Beijing. Cities 2020, 96, 102452. [Google Scholar] [CrossRef]
- Krumdieck, S. Survival Is the Driver for Adaptation: Safety Engineering Changed the Future, Security Engineering Prevented Disasters and Transition Engineering Navigates the Pathway to the Climate-Safe Future. Phys. Sci. Rev. 2022. [Google Scholar] [CrossRef]
- Heinrich Böll Stiftung Armut Macht Hunger: Fakten Zur Globalen Ernährung 2021. Policy Document. 2021. Available online: https://www.boell.de/sites/default/files/2022-01/Boell-Armut-macht-Hunger_V01_kommentierbar.pdf (accessed on 1 March 2022).
- Ahrens, S. Anteil von Bio-Lebensmitteln am Lebensmittelumsatz in Deutschland in Den Jahren 2010 Bis 2021. Statista. 2022. Available online: https://de.statista.com/statistik/daten/studie/360581/umfrage/marktanteil-von-biolebensmitteln-in-deutschland/ (accessed on 1 March 2022).
- Janson, M. So Viel Teurer Sind Bio-Lebensmittel 2021. Available online: https://de.statista.com/infografik/24615/preisaufschlaege-fuer-bio-lebensmittel-in-deutschland/ (accessed on 1 March 2022).
- European Commission. Farm to Fork Strategy; European Commission: Maastricht, The Netherlands, 2020. [Google Scholar]
- European Commission. Financial Needs in the Agriculture and Agri-Food Sectors in Germany; European Commission: Maastricht, The Netherlands, 2020. [Google Scholar]
- European Commission. Statistical Factsheet Germany; European Commission: Maastricht, The Netherlands, 2021. [Google Scholar]
- Breitkopf, A. Höhe der Treibhausgas-Emissionen in Deutschland in den Jahren 1990 bis 2020. Online Statistic. 2022. Available online: https://de.statista.com/statistik/daten/studie/76558/umfrage/entwicklung-der-treibhausgas-emissionen-in-deutschland/ (accessed on 1 March 2022).
- Rösemann, C.; Haenel, H.-D.; Vos, C. Calculations of Gaseous and Particulate Emissions from German Agriculture 1990–2019: Report on Methods and Data (RMD) Submission 2021; Johann Heinrich von Thünen-Institut: Braunschweig, Germany, 2021. [Google Scholar]
- Liu, X.; Elgowainy, A.; Wang, M. Life Cycle Energy Use and Greenhouse Gas Emissions of Ammonia Production from Renewable Resources and Industrial By-Products. Green Chem. 2020, 22, 5751–5761. [Google Scholar] [CrossRef]
- Ahrens, S. Ausstoß von Treibhausgasen in der Landwirtschaft in Deutschland bis 2018. Online Statistic. 2021. Available online: https://de.statista.com/statistik/daten/studie/165444/umfrage/treibhausgase-in-der-deutschen-landwirtschaft-2006/ (accessed on 1 March 2022).
- Hohmann, M. Verbrauch von Düngemitteln in der Landwirtschaft in Deutschland Nach Nährstoffart 2020. Online Statistic. Available online: https://de.statista.com/statistik/daten/studie/161842/umfrage/verbrauch-ausgewaehlter-duenger-in-der-landwirtschaft-in-deutschland/ (accessed on 1 March 2022).
- FAOSTAT. Livestock Manure Germany; FAOSTAT: Rome, Italy, 2019. [Google Scholar]
- FAOSTAT. Synthetic Fertilizer Germany; FAOSTAT: Rome, Italy, 2019. [Google Scholar]
- Singh, V.; Dincer, I.; Rosen, M.A. Life Cycle Assessment of Ammonia Production Methods. In Exergetic, Energetic and Environmental Dimensions; Elsevier: Amsterdam, The Netherlands, 2018; pp. 935–959. ISBN 978-0-12-813734-5. [Google Scholar]
- Prozessorientierte Basisdaten für Umweltmanagementsysteme Prozessdetails: Chem-AnorgAmmoniak-DE-2000. Available online: https://www.probas.umweltbundesamt.de/php/prozessdetails.php?id={0E0B2723-9043-11D3-B2C8-0080C8941B49} (accessed on 1 August 2021).
- Industrieverband Agrar. Stickstoff-Grundlagen des Stickstoffeinsatzes in der Landwirtschaft 2006. Online Resource. Available online: https://www.iva.de/publikationen/stickstoff-grundlagen-des-stickstoffeinsatzes-der-landwirtschaft (accessed on 1 March 2022).
- Prozessorientierte Basisdaten für Umweltmanagementsysteme Prozessdetails: Chem-OrgHarnstoff-DE-2000. Available online: https://www.probas.umweltbundesamt.de/php/prozessdetails.php?id={0E0B274E-9043-11D3-B2C8-0080C8941B49} (accessed on 1 August 2021).
- Prozessorientierte Basisdaten für Umweltmanagementsysteme Prozessdetails: Chem-AnorgSalpetersäure-2000. Available online: https://www.probas.umweltbundesamt.de/php/prozessdetails.php?id={0E0B273B-9043-11D3-B2C8-0080C8941B49} (accessed on 1 August 2021).
- Prozessorientierte Basisdaten für Umweltmanagementsysteme, Umweltbundesamt Prozessdetails: Chem-AnorgAmmoniumnitrat-DE-2000. Available online: https://www.probas.umweltbundesamt.de/php/prozessdetails.php?id={0E0B2724-9043-11D3-B2C8-0080C8941B49} (accessed on 1 August 2021).
- Bork, H.-R. Umweltgeschichte Deutschlands; Springer: Berlin/Heidelberg, Germany, 2020; ISBN 978-3-662-61131-9. [Google Scholar]
- Smil, V. Nitrogen in Modern European Agriculture. In Land, Shops and Kitchens: Technology and the Food Chain in Twentieth-Century Europe; Comparative Rural History of the North Sea Area; Scholliers, P., Van Molle, L., Sarasúa, C., Eds.; Brepols: Turnhout, Belgium, 2005; Volume 7, pp. 110–119. ISBN 978-2-503-51780-3. [Google Scholar]
- van der Ploeg, R.R.; Schweigert, R.P.; Bachmann, R.J. Use and Misuse of Nitrogen in Agriculture: The German Story. Sci. World J. 2001, 1, 737–744. [Google Scholar] [CrossRef]
- FAOSTAT. Land Use Germany; FAOSTAT: Rome, Italy, 2019. [Google Scholar]
- FAOSTAT. Crops and Livestock Products Germany; FAOSTAT: Rome, Italy, 2019. [Google Scholar]
- Federal Ministry of Food and Agriculture. Understanding Farming Facts and Figures about German Farming; Federal Ministry of Food and Agriculture: Berlin, Germany, 2020; p. 36. [Google Scholar]
- Umweltbundesamt ein Drittel der Lebensmittel Wird Verschwendet. Available online: https://www.umweltbundesamt.de/themen/ein-drittel-der-lebensmittel-wird-verschwendet (accessed on 27 April 2022).
- Schmidt, T.; Schneider, F.; Leverenz, D.; Hafner, G. Food Waste in Germany-Baseline 2015. 2019. Available online: https://www.bmel.de/SharedDocs/Downloads/DE/_Ernaehrung/Lebensmittelverschwendung/TI-Studie2019_Lebensmittelabfaelle_summary.pdf?__blob=publicationFile&v=3 (accessed on 1 March 2022).
- FAOSTAT. Livestock Patterns Germany; FAOSTAT: Rome, Italy, 2019. [Google Scholar]
- FAOSTAT. Food Balances Germany; FAOSTAT: Rome, Italy, 2019. [Google Scholar]
- NHS. What Should My Daily Intake of Calories Be? Available online: https://www.nhs.uk/common-health-questions/food-and-diet/what-should-my-daily-intake-of-calories-be/ (accessed on 27 April 2022).
- Smil, V. Nitrogen Cycle and World Food Production. World Agric. 2011, 5, 9–13. [Google Scholar]
- Smil, V. Improving Efficiency and Reducing Waste in Our Food System. Environ. Sci. 2004, 1, 17–26. [Google Scholar] [CrossRef] [Green Version]
- Naylor, R.; Steinfeld, H.; Falcon, W.; Galloway, J.; Smil, V.; Bradford, E.; Alder, J.; Mooney, H. Losing the Links Between Livestock and Land. Science 2005, 310, 1621–1622. [Google Scholar] [CrossRef] [Green Version]
- Smil, V. Eating Meat: Constants and Changes. Glob. Food Secur. 2014, 3, 67–71. [Google Scholar] [CrossRef]
- Prag, A.; Henriksen, C. Transition from Animal-Based to Plant-Based Food Production to Reduce Greenhouse Gas Emissions from Agriculture—The Case of Denmark. Sustainability 2020, 12, 8228. [Google Scholar] [CrossRef]
- Smith, C.; Hill, A.K.; Torrente-Murciano, L. Current and Future Role of Haber–Bosch Ammonia in a Carbon-Free Energy Landscape. Energy Environ. Sci. 2020, 13, 331–344. [Google Scholar] [CrossRef]
- Smil, V. Some Unorthodox Perspectives on Agricultural Biodiversity. The Case of Legume Cultivation. Agric. Ecosyst. Environ. 1997, 62, 135–144. [Google Scholar] [CrossRef]
- Smith, L.G.; Kirk, G.J.D.; Jones, P.J.; Williams, A.G. The Greenhouse Gas Impacts of Converting Food Production in England and Wales to Organic Methods. Nat. Commun. 2019, 10, 4641. [Google Scholar] [CrossRef] [Green Version]
- Reganold, J.P.; Wachter, J.M. Organic Agriculture in the Twenty-First Century. Nat. Plants 2016, 2, 15221. [Google Scholar] [CrossRef]
- Muller, A.; Schader, C.; El-Hage Scialabba, N.; Brüggemann, J.; Isensee, A.; Erb, K.-H.; Smith, P.; Klocke, P.; Leiber, F.; Stolze, M.; et al. Strategies for Feeding the World More Sustainably with Organic Agriculture. Nat. Commun. 2017, 8, 1290. [Google Scholar] [CrossRef] [Green Version]
- Möckel, S. Germany’s Excessive Agricultural Nitrogen Emissions and the Need for Improving Existing Regulatory Concepts. J. Eur. Environ. Plan. Law 2019, 16, 279–303. [Google Scholar] [CrossRef]
- Isermeyer, F.; Schleef, K.-H. Policies to Reduce Nitrogen Surplus in German Agriculture. Mar. Pollut. Bull. 1994, 29, 464–470. [Google Scholar] [CrossRef]
- Wagner, S.; Angenendt, E.; Beletskaya, O.; Zeddies, J. Costs and Benefits of Ammonia and Particulate Matter Abatement in German Agriculture Including Interactions with Greenhouse Gas Emissions. Agric. Syst. 2015, 141, 58–68. [Google Scholar] [CrossRef]
- European Commission. Sustainable Land Use (Greening). Available online: https://ec.europa.eu/info/food-farming-fisheries/key-policies/common-agricultural-policy/income-support/greening_en (accessed on 1 July 2022).
- Seufert, V.; Ramankutty, N. Many Shades of Gray—The Context-Dependent Performance of Organic Agriculture. Sci. Adv. 2017, 3, e1602638. [Google Scholar] [CrossRef] [Green Version]
- Orsini, S.; Padel, S.; Lampkin, N. Labour Use on Organic Farms: A Review of Research since 2000. Org. Farming 2018, 4, 7–15. [Google Scholar] [CrossRef]
- Knapp, S.; van der Heijden, M.G.A. A Global Meta-Analysis of Yield Stability in Organic and Conservation Agriculture. Nat. Commun. 2018, 9, 3632. [Google Scholar] [CrossRef] [PubMed]
- Durham, T.C.; Mizik, T. Comparative Economics of Conventional, Organic, and Alternative Agricultural Production Systems. Economies 2021, 9, 64. [Google Scholar] [CrossRef]
- Hebling, C.; Ragwitz, M.; Fleiter, T.; Groos, U.; Härle, D.; Held, A.; Jahn, M.; Müller, N.; Pfeifer, T.; Plötz, P.; et al. Eine Wasserstoff-Roadmap für Deutschland. Fraunhofer-Institut für System- und Innovationsforschung ISI und das Fraunhofer-Institut für Solare Energiesysteme ISE. 2019. Available online: https://www.ise.fraunhofer.de/de/veroeffentlichungen/studien/wasserstoff-roadmap-deutschland.html (accessed on 1 August 2021).
- Federal Ministry for the Environment. Nature Conservation and Nuclear Safety Erneuerbare Energien. Available online: https://www.bmwi.de/Redaktion/DE/Dossier/erneuerbare-energien.html (accessed on 15 August 2021).
- Federal Ministry for the Environment. Nature Conservation and Nuclear Safety Informationsportal Erneuerbare Energien. Available online: https://www.erneuerbare-energien.de/EE/Navigation/DE/Technologien/Windenergie-auf-See/Ziele/ziele.html (accessed on 15 August 2021).
- IEA. Offshore Wind Outlook 2019: World Energy Outlook Special Report. Offshore Wind. 2019. Available online: https://www.iea.org/reports/offshore-wind-outlook-2019 (accessed on 1 August 2021).
- Moseley, P.T.; Garche, J. Electrochemical Energy Storage for Renewable Sources and Grid Balancing; Elsevier: Amsterdam, The Netherlands, 2015; ISBN 978-0-444-62616-5. [Google Scholar]
- Figgener, J.; Stenzel, P.; Kairies, K.-P.; Linßen, J.; Haberschusz, D.; Wessels, O.; Angenendt, G.; Robinius, M.; Stolten, D.; Sauer, D.U. The Development of Stationary Battery Storage Systems in Germany—A Market Review. J. Energy Storage 2020, 29, 101153. [Google Scholar] [CrossRef]
- Bonou, A.; Laurent, A.; Olsen, S.I. Life Cycle Assessment of Onshore and Offshore Wind Energy-from Theory to Application. Appl. Energy 2016, 180, 327–337. [Google Scholar] [CrossRef] [Green Version]
- Federal Ministry of Food and Agriculture. Waldstrategie 2050: Nachhaltige Waldbewirtschaftung—Herausforderungen und Chancen für Mensch, Natur und Klima 2021; Federal Ministry of Food and Agriculture: Berlin, Germany, 2021. [Google Scholar]
- Federal Ministry of Food and Agriculture. Agrarexporte Verstehen—Fakten und Hintergründe; Federal Ministry of Food and Agriculture: Berlin, Germany, 2018. [Google Scholar]
- Sanchez-Sabate, R.; Badilla-Briones, Y.; Sabaté, J. Understanding Attitudes towards Reducing Meat Consumption for Environmental Reasons. A Qualitative Synthesis Review. Sustainability 2019, 11, 6295. [Google Scholar] [CrossRef] [Green Version]
- Candemir, A.; Duvaleix, S.; Latruffe, L. Agricultural cooperatives and farm sustainability—A literature review. J. Econ. Surv. 2021, 35, 1118–1144. [Google Scholar] [CrossRef]
- Federal Statistical Office of Germany Press Release: Upward Trend for Meat Substitutes Continued: Production Increased by 17% in 2021 Year on Year 2022. Available online: https://www.destatis.de/EN/Press/2022/05/PE22_N025_42.html;jsessionid=6317A95EA3DD0AAFA2BA88A16E4D9540.live712 (accessed on 1 March 2022).
- Krumdieck, S.; Hamm, A. Strategic Analysis Methodology for Energy Systems with Remote Island Case Study. Energy Policy 2009, 37, 3301–3313. [Google Scholar] [CrossRef]
- Ahrens, S. Preisniveauindex für Lebensmittel in Europa Nach Ländern 2020. 2021. Available online: https://de.statista.com/statistik/daten/studie/36336/umfrage/preisniveau-fuer-nahrungsmittel-und-alkoholfreie-getraenke-in-europa/ (accessed on 1 March 2022).
- European Commission. Carbon Border Adjustment Mechanism as Part of The European Green Deal: Legislative Train 06.22; European Commission: Maastricht, The Netherlands, 2022. [Google Scholar]
- Federal Ministry of Food and Agriculture. Ernährung, Fischerei Versorgungsbilanzen. Available online: https://www.bmel-statistik.de/ernaehrung-fischerei/versorgungsbilanzen/fleisch (accessed on 6 June 2022).
- Pakenham, B.; Ermakova, A.; Mehmanparast, A. A Review of Life Extension Strategies for Offshore Wind Farms Using Techno-Economic Assessments. Energies 2021, 14, 1936. [Google Scholar] [CrossRef]
- Bareiß, K.; de la Rua, C.; Möckl, M.; Hamacher, T. Life Cycle Assessment of Hydrogen from Proton Exchange Membrane Water Electrolysis in Future Energy Systems. Appl. Energy 2019, 237, 862–872. [Google Scholar] [CrossRef]
- Kirovayordanova, Z. Exergy Analysis of Industrial Ammonia Synthesis. Energy 2004, 29, 2373–2384. [Google Scholar] [CrossRef]
- Dupont, E.; Koppelaar, R.; Jeanmart, H. Global Available Wind Energy with Physical and Energy Return on Investment Constraints. Appl. Energy 2018, 209, 322–338. [Google Scholar] [CrossRef]
- Stropnik, R.; Lotrič, A.; Bernad Montenegro, A.; Sekavčnik, M.; Mori, M. Critical Materials in PEMFC Systems and a LCA Analysis for the Potential Reduction of Environmental Impacts with EoL Strategies. Energy Sci. Eng. 2019, 7, 2519–2539. [Google Scholar] [CrossRef]
- Carvalho, M.L.; Temporelli, A.; Girardi, P. Life Cycle Assessment of Stationary Storage Systems within the Italian Electric Network. Energies 2021, 14, 2047. [Google Scholar] [CrossRef]
- Federal Ministry for the Environment. Nature Conservation and Nuclear Safety Stromgestehungskosten der Offshore-Windenergie in Deutschland. Available online: https://www.erneuerbare-energien.de/EE/Navigation/DE/Technologien/Windenergie-auf-See/Wirtschaftliche_Aspekte/Stromgestehungskosten/stromgestehungskosten.html (accessed on 15 August 2021).
- Wissenschaftlicher Dienst des Deutschen Bundestages Kosten der Produktion von Grünem Wasserstoff 2020. Available online: https://www.bundestag.de/resource/blob/691748/01a954b2b2d7c70259b19662ae37a575/WD-5-029-20-pdf-data.pdf (accessed on 1 March 2022).
- Garside, M. Refinery Production of Cobalt Worldwide from 2011 to 2020. 2021. Available online: https://www.statista.com/statistics/339748/global-cobalt-refinery-production/ (accessed on 1 March 2022).
- Garside, M. Production Volume of Manganese Worldwide from 2011 to 2020. 2021. Available online: https://www.statista.com/statistics/1003518/global-manganese-production-volume/ (accessed on 1 March 2022).
- Garside, M. Major Countries in Worldwide Nickel Mine Production in 2020. 2021. Available online: https://www.statista.com/statistics/264642/nickel-mine-production-by-country/ (accessed on 1 March 2022).
- Garside, M. Major Countries in Worldwide Graphite Mine Production in 2020. 2021. Available online: https://www.statista.com/statistics/267366/world-graphite-production/ (accessed on 1 March 2022).
- Garside, M. Refinery Production of Copper Worldwide from 2000 to 2020. 2021. Available online: https://www.statista.com/statistics/254917/total-global-copper-production-since-2006/ (accessed on 1 March 2022).
- Garside, M. Mine Production of Platinum-Group Metals Worldwide from 2010 to 2020 (in Metric Tons). 2022. Available online: https://www.statista.com/statistics/591665/mine-production-of-platinum-group-metals-worldwide/ (accessed on 1 March 2022).
- Treu, H.; Nordborg, M.; Cederberg, C.; Heuer, T.; Claupein, E.; Hoffmann, H.; Berndes, G. Carbon Footprints and Land Use of Conventional and Organic Diets in Germany. J. Clean. Prod. 2017, 161, 127–142. [Google Scholar] [CrossRef]
Figure 1.
The InTIME method (adapted from [6]) in correspondence to this article.
Figure 1.
The InTIME method (adapted from [6]) in correspondence to this article.
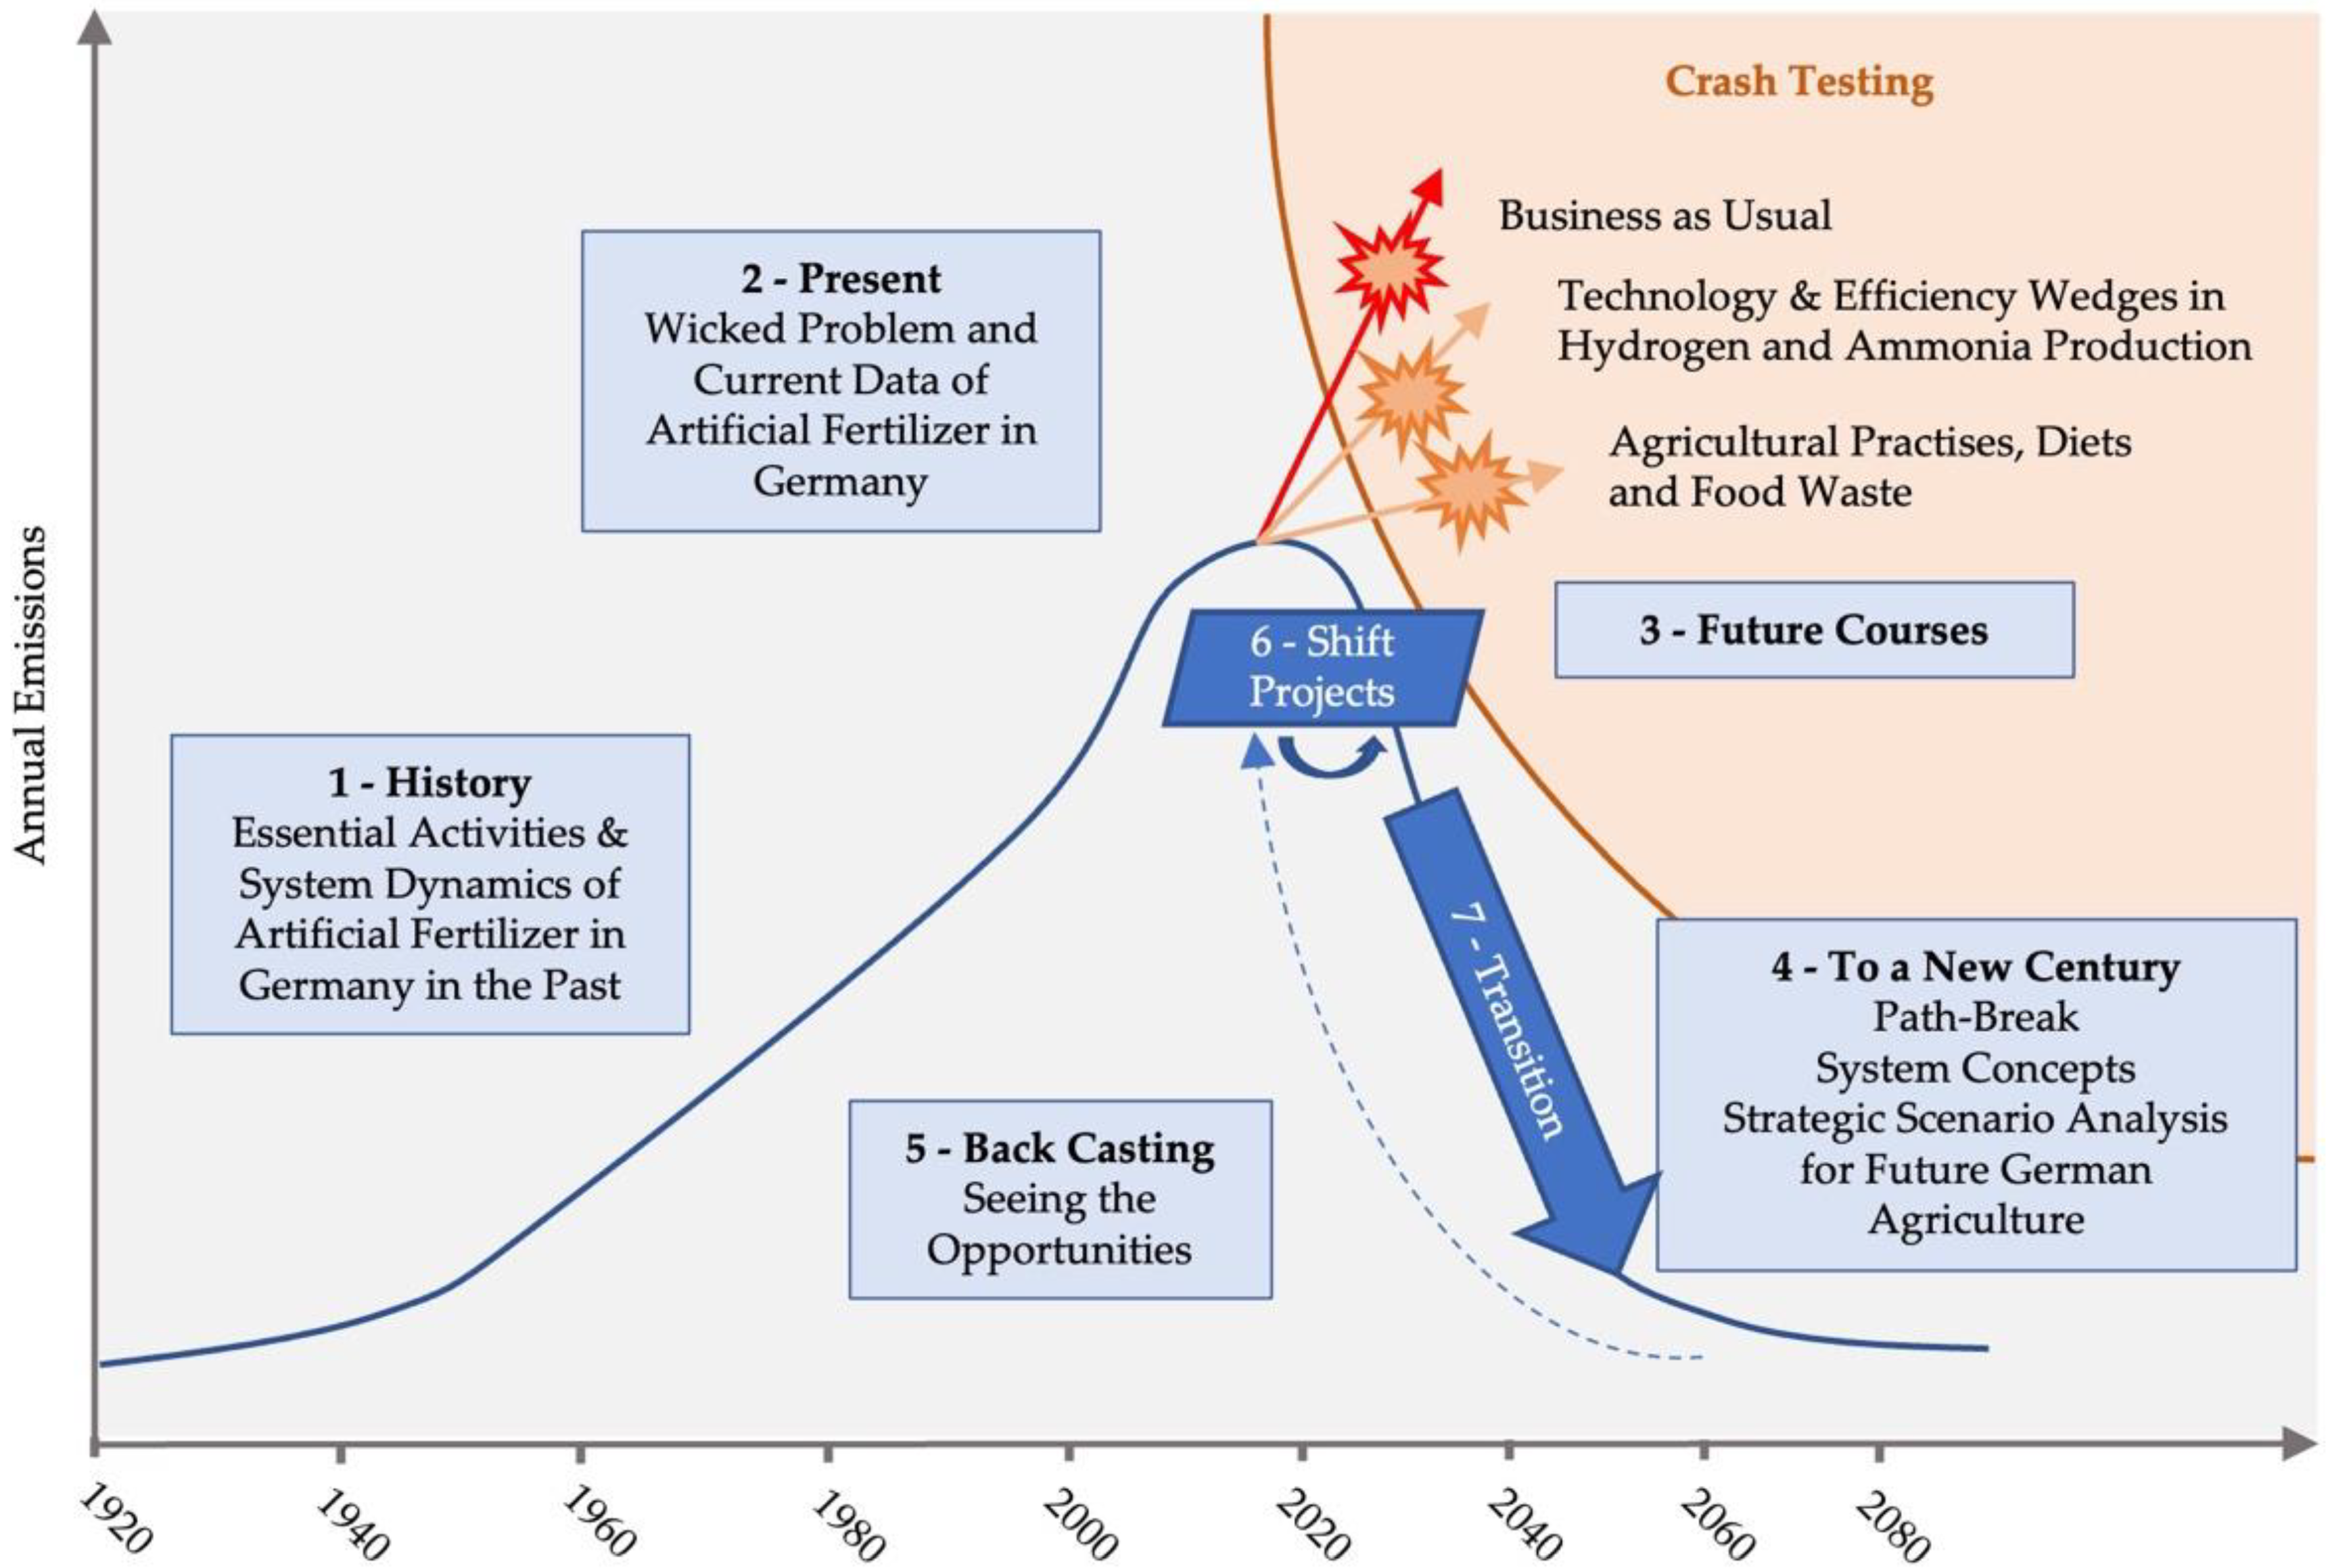
Figure 2.
The wicked problem cycle of artificial fertilizers.
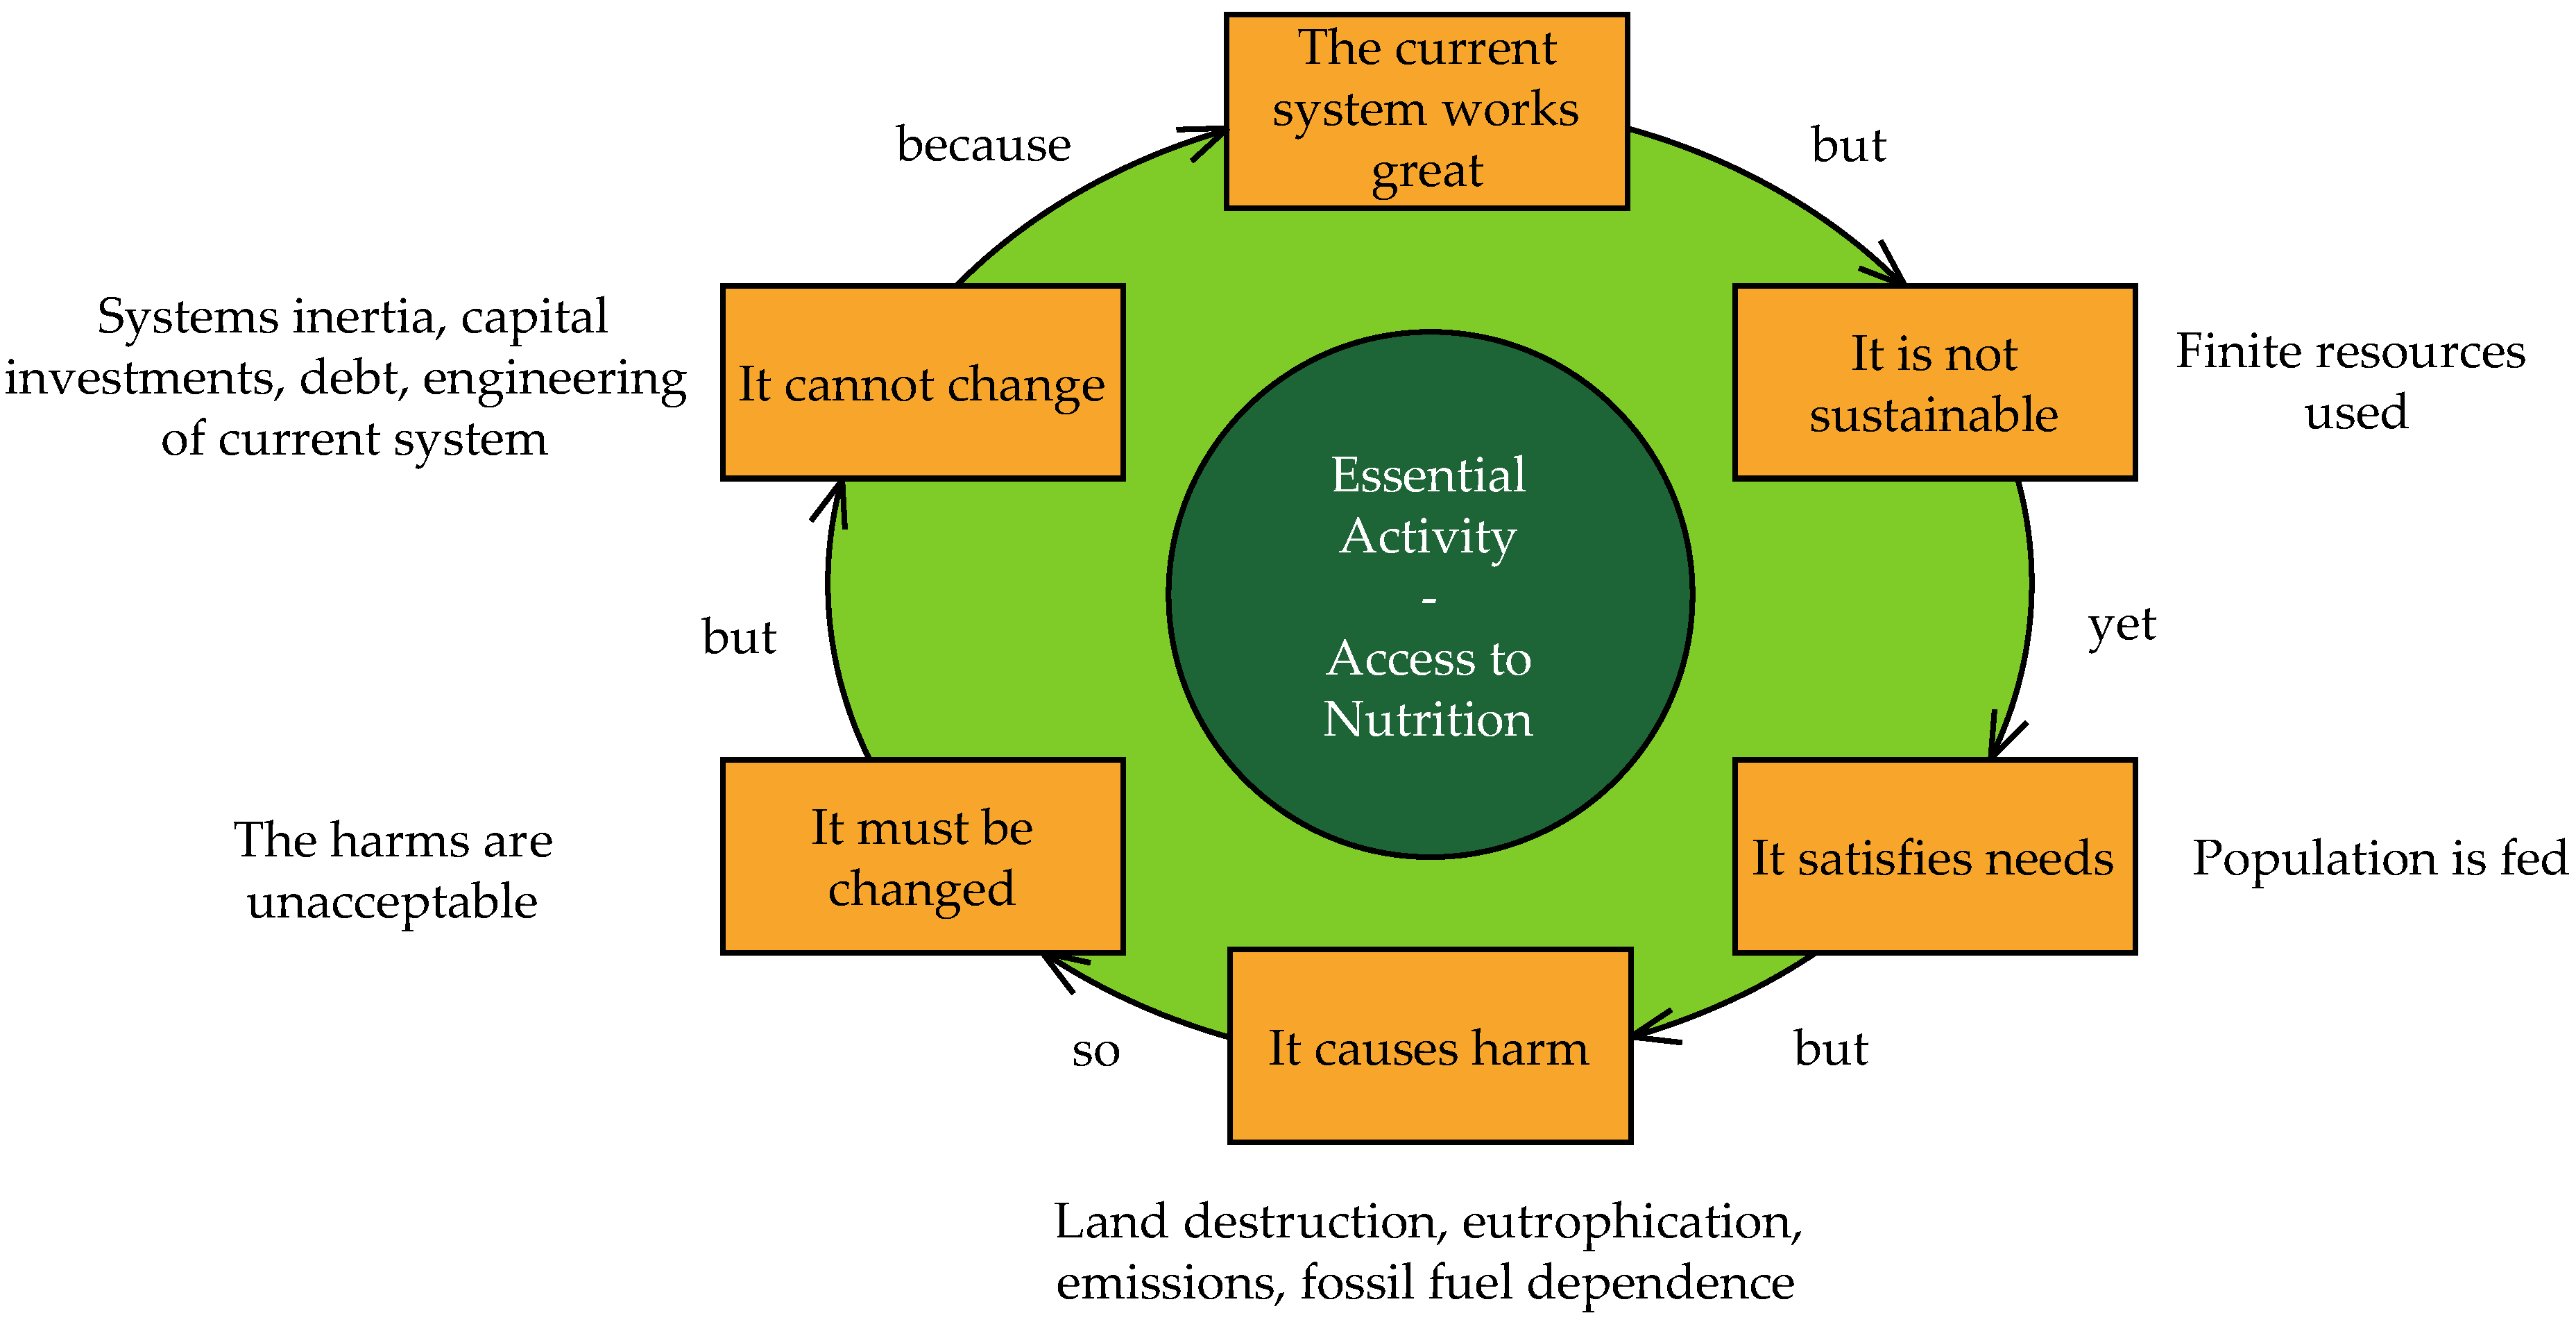
Figure 3.
Fossil-carbon inputs (orange) in nitrogen-fertilizer processing and the resulting food outputs and environmental harms (red).
Figure 3.
Fossil-carbon inputs (orange) in nitrogen-fertilizer processing and the resulting food outputs and environmental harms (red).

Figure 4.
Artificial and organic nitrogen fertilizer used and emitted in German agriculture (data obtained from [36,37]).
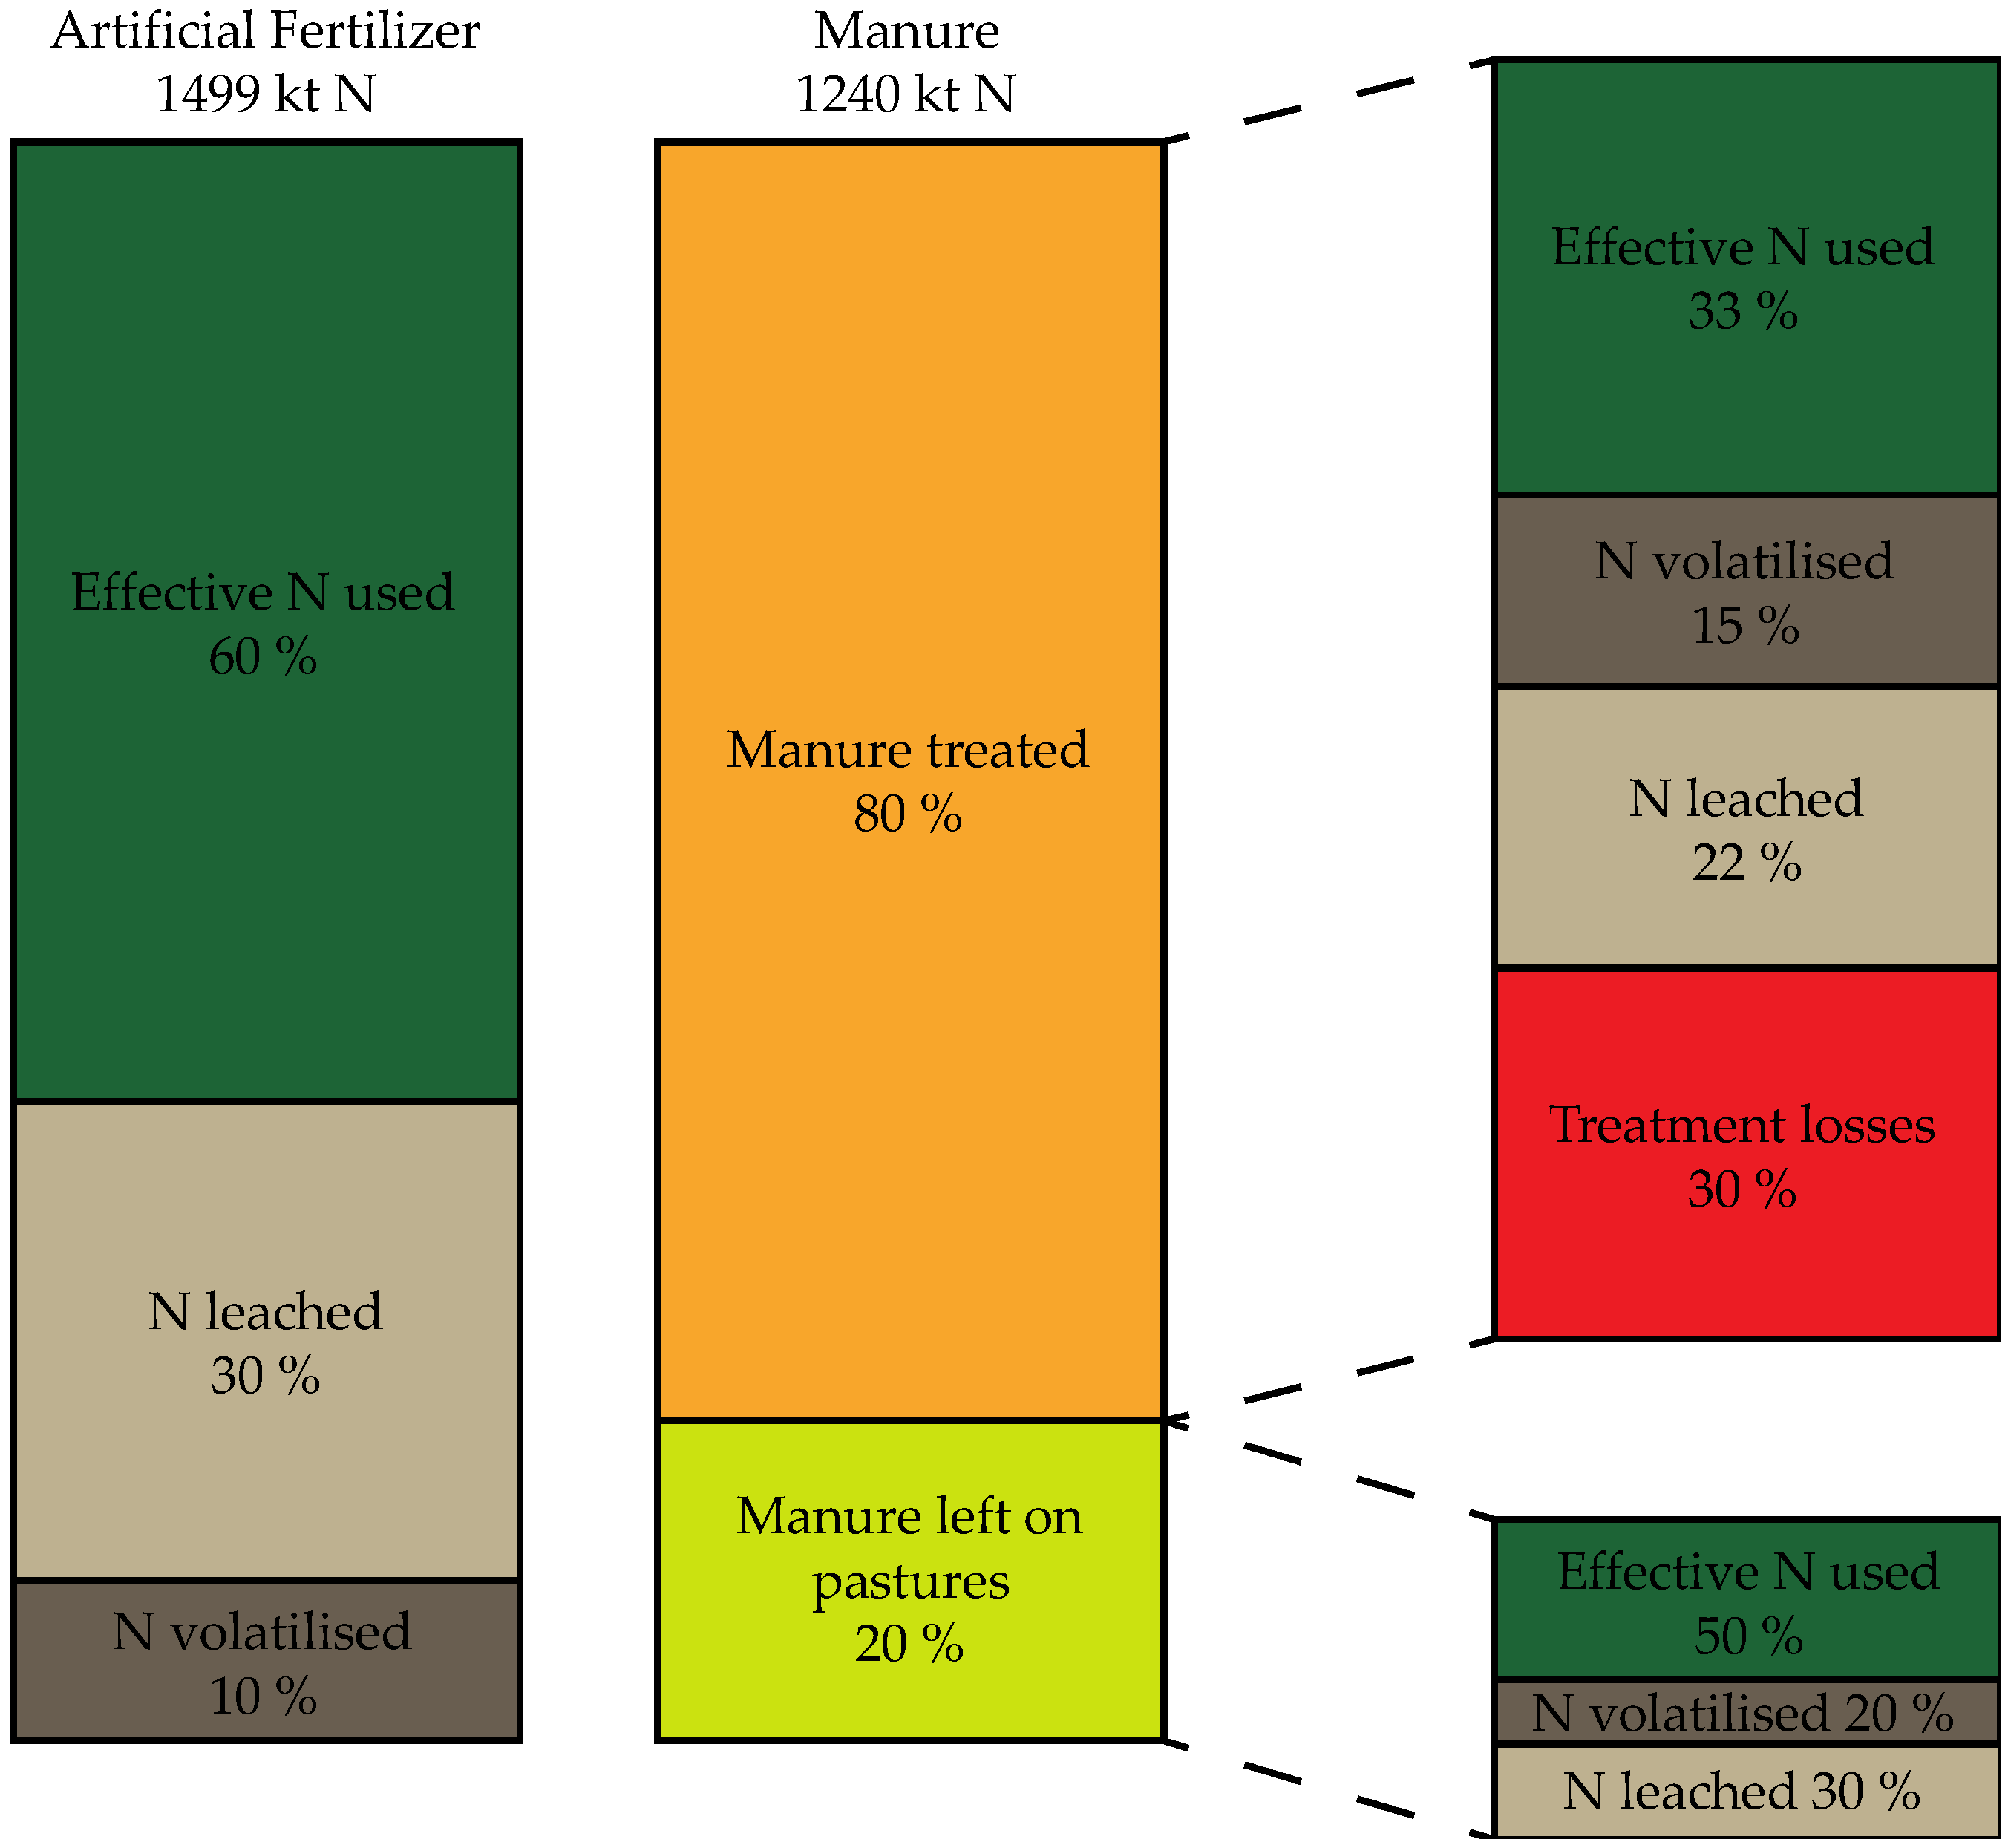
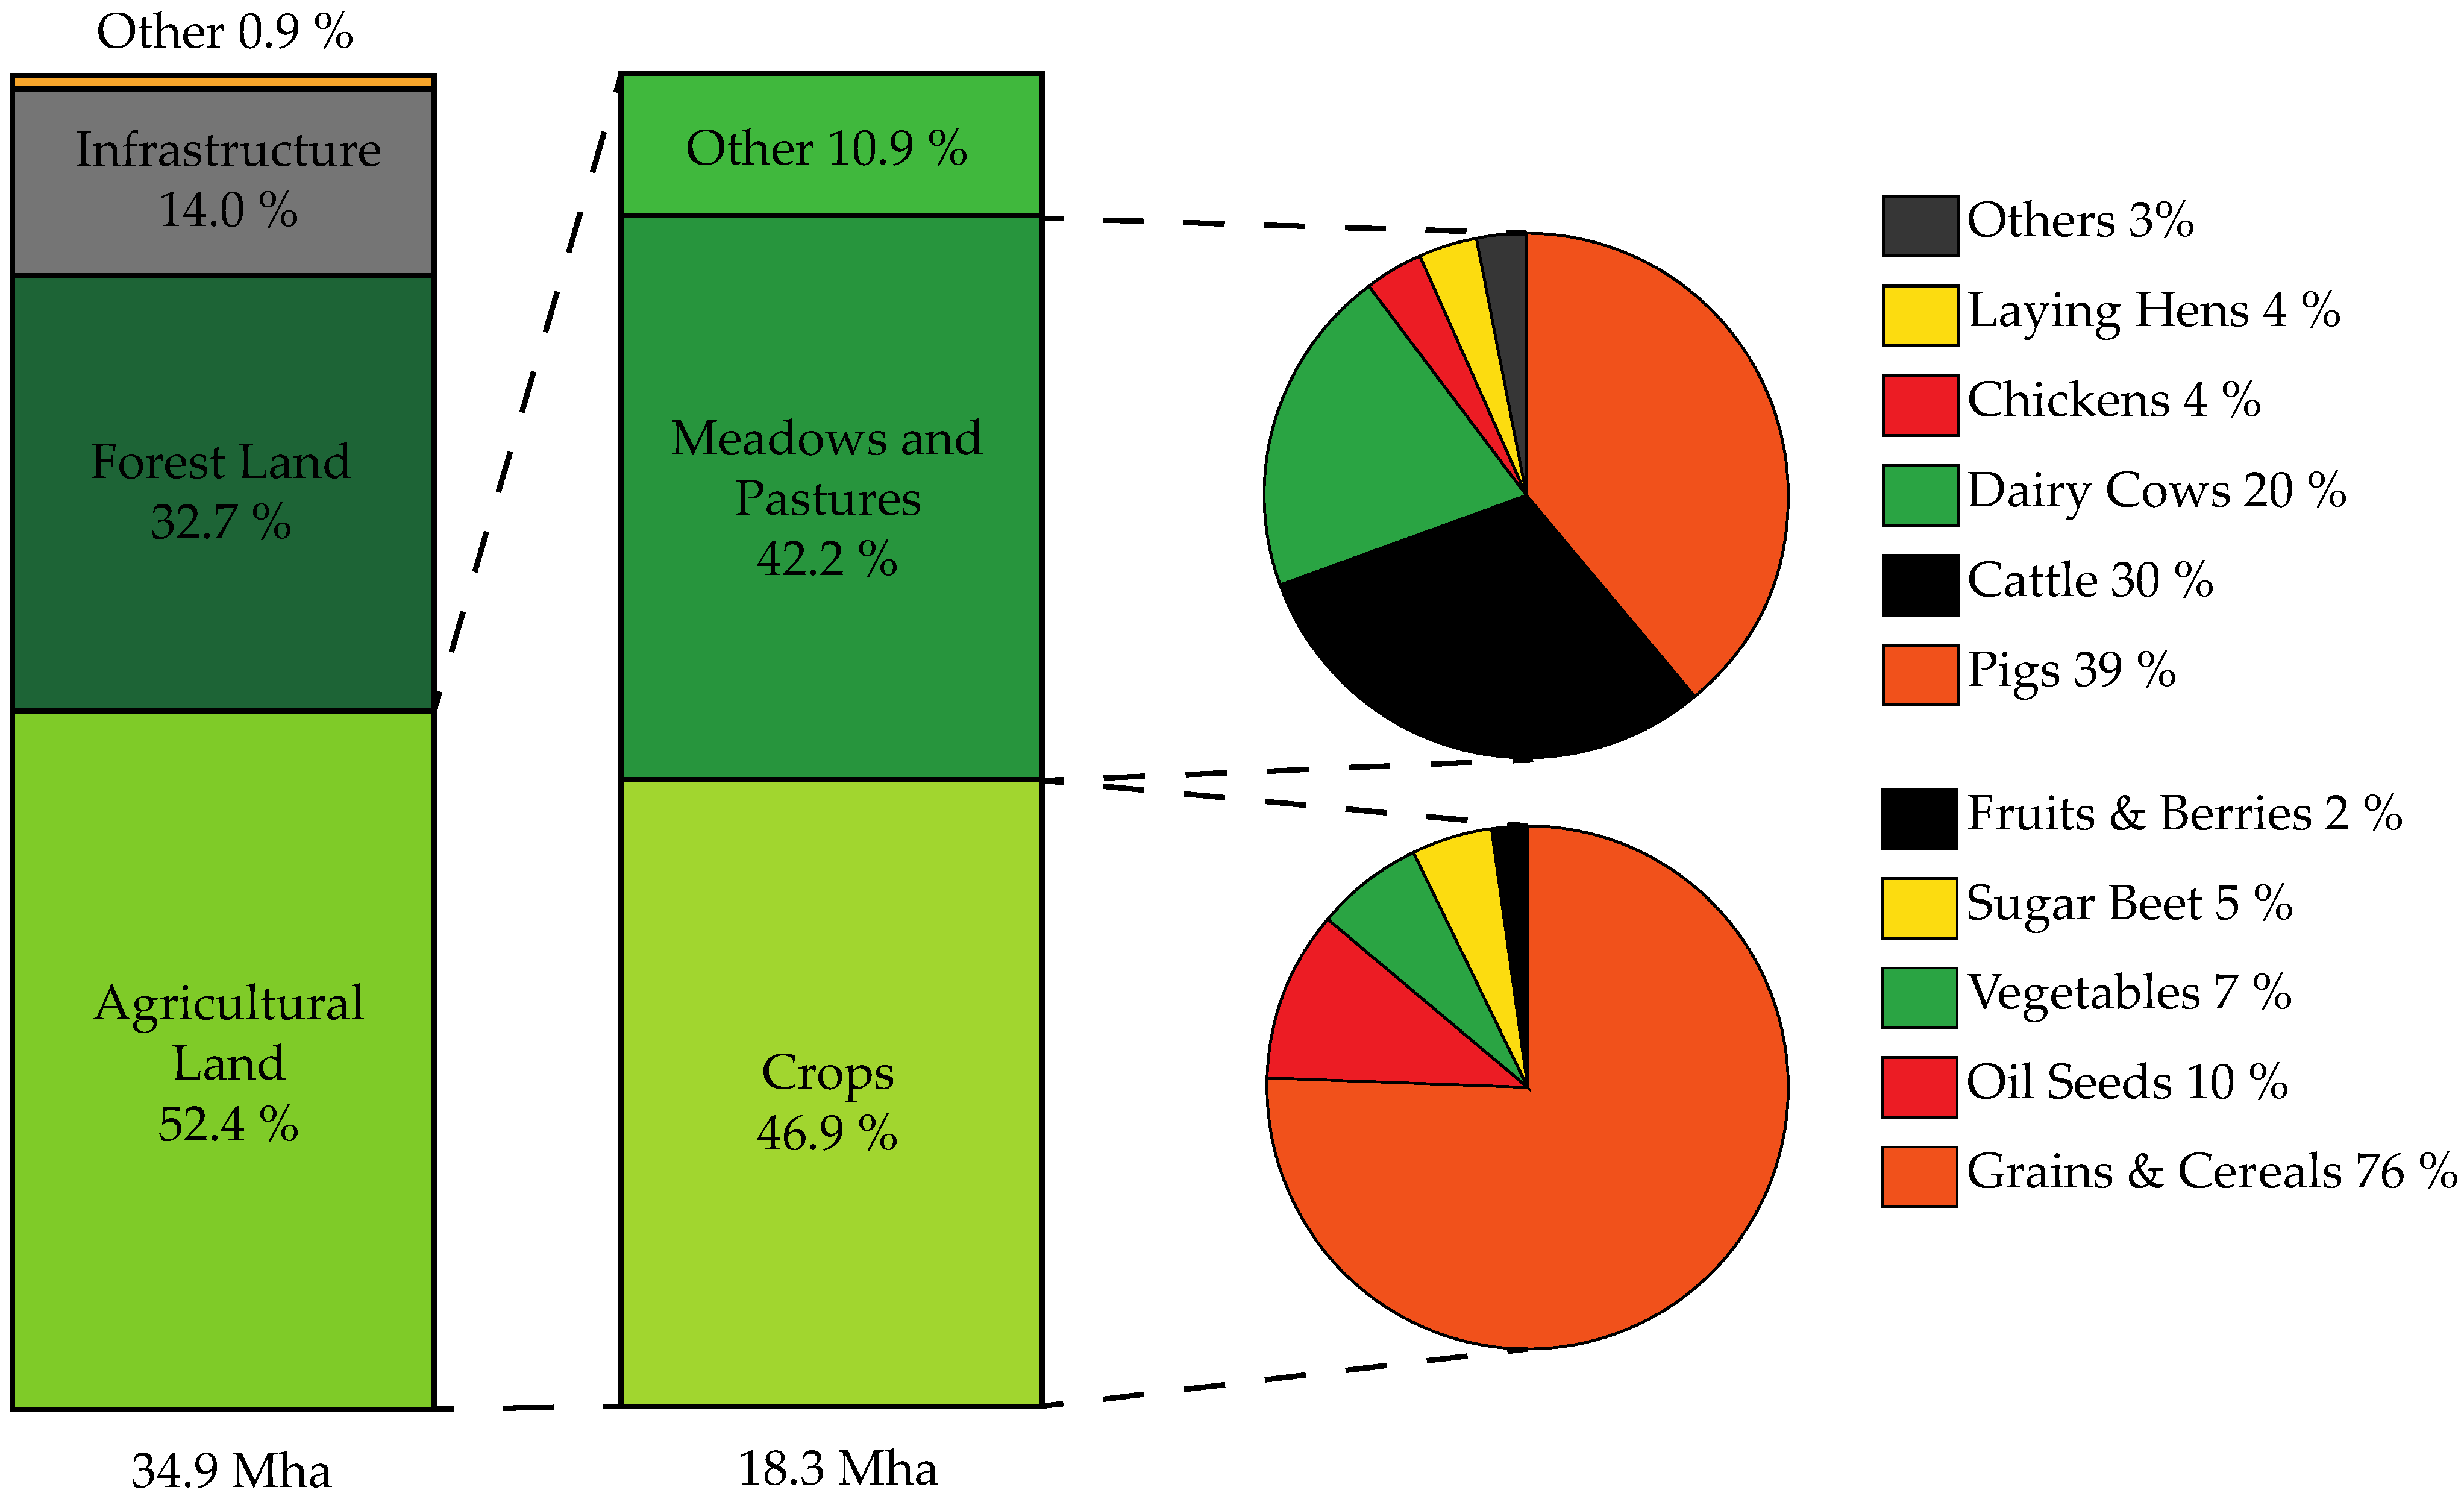
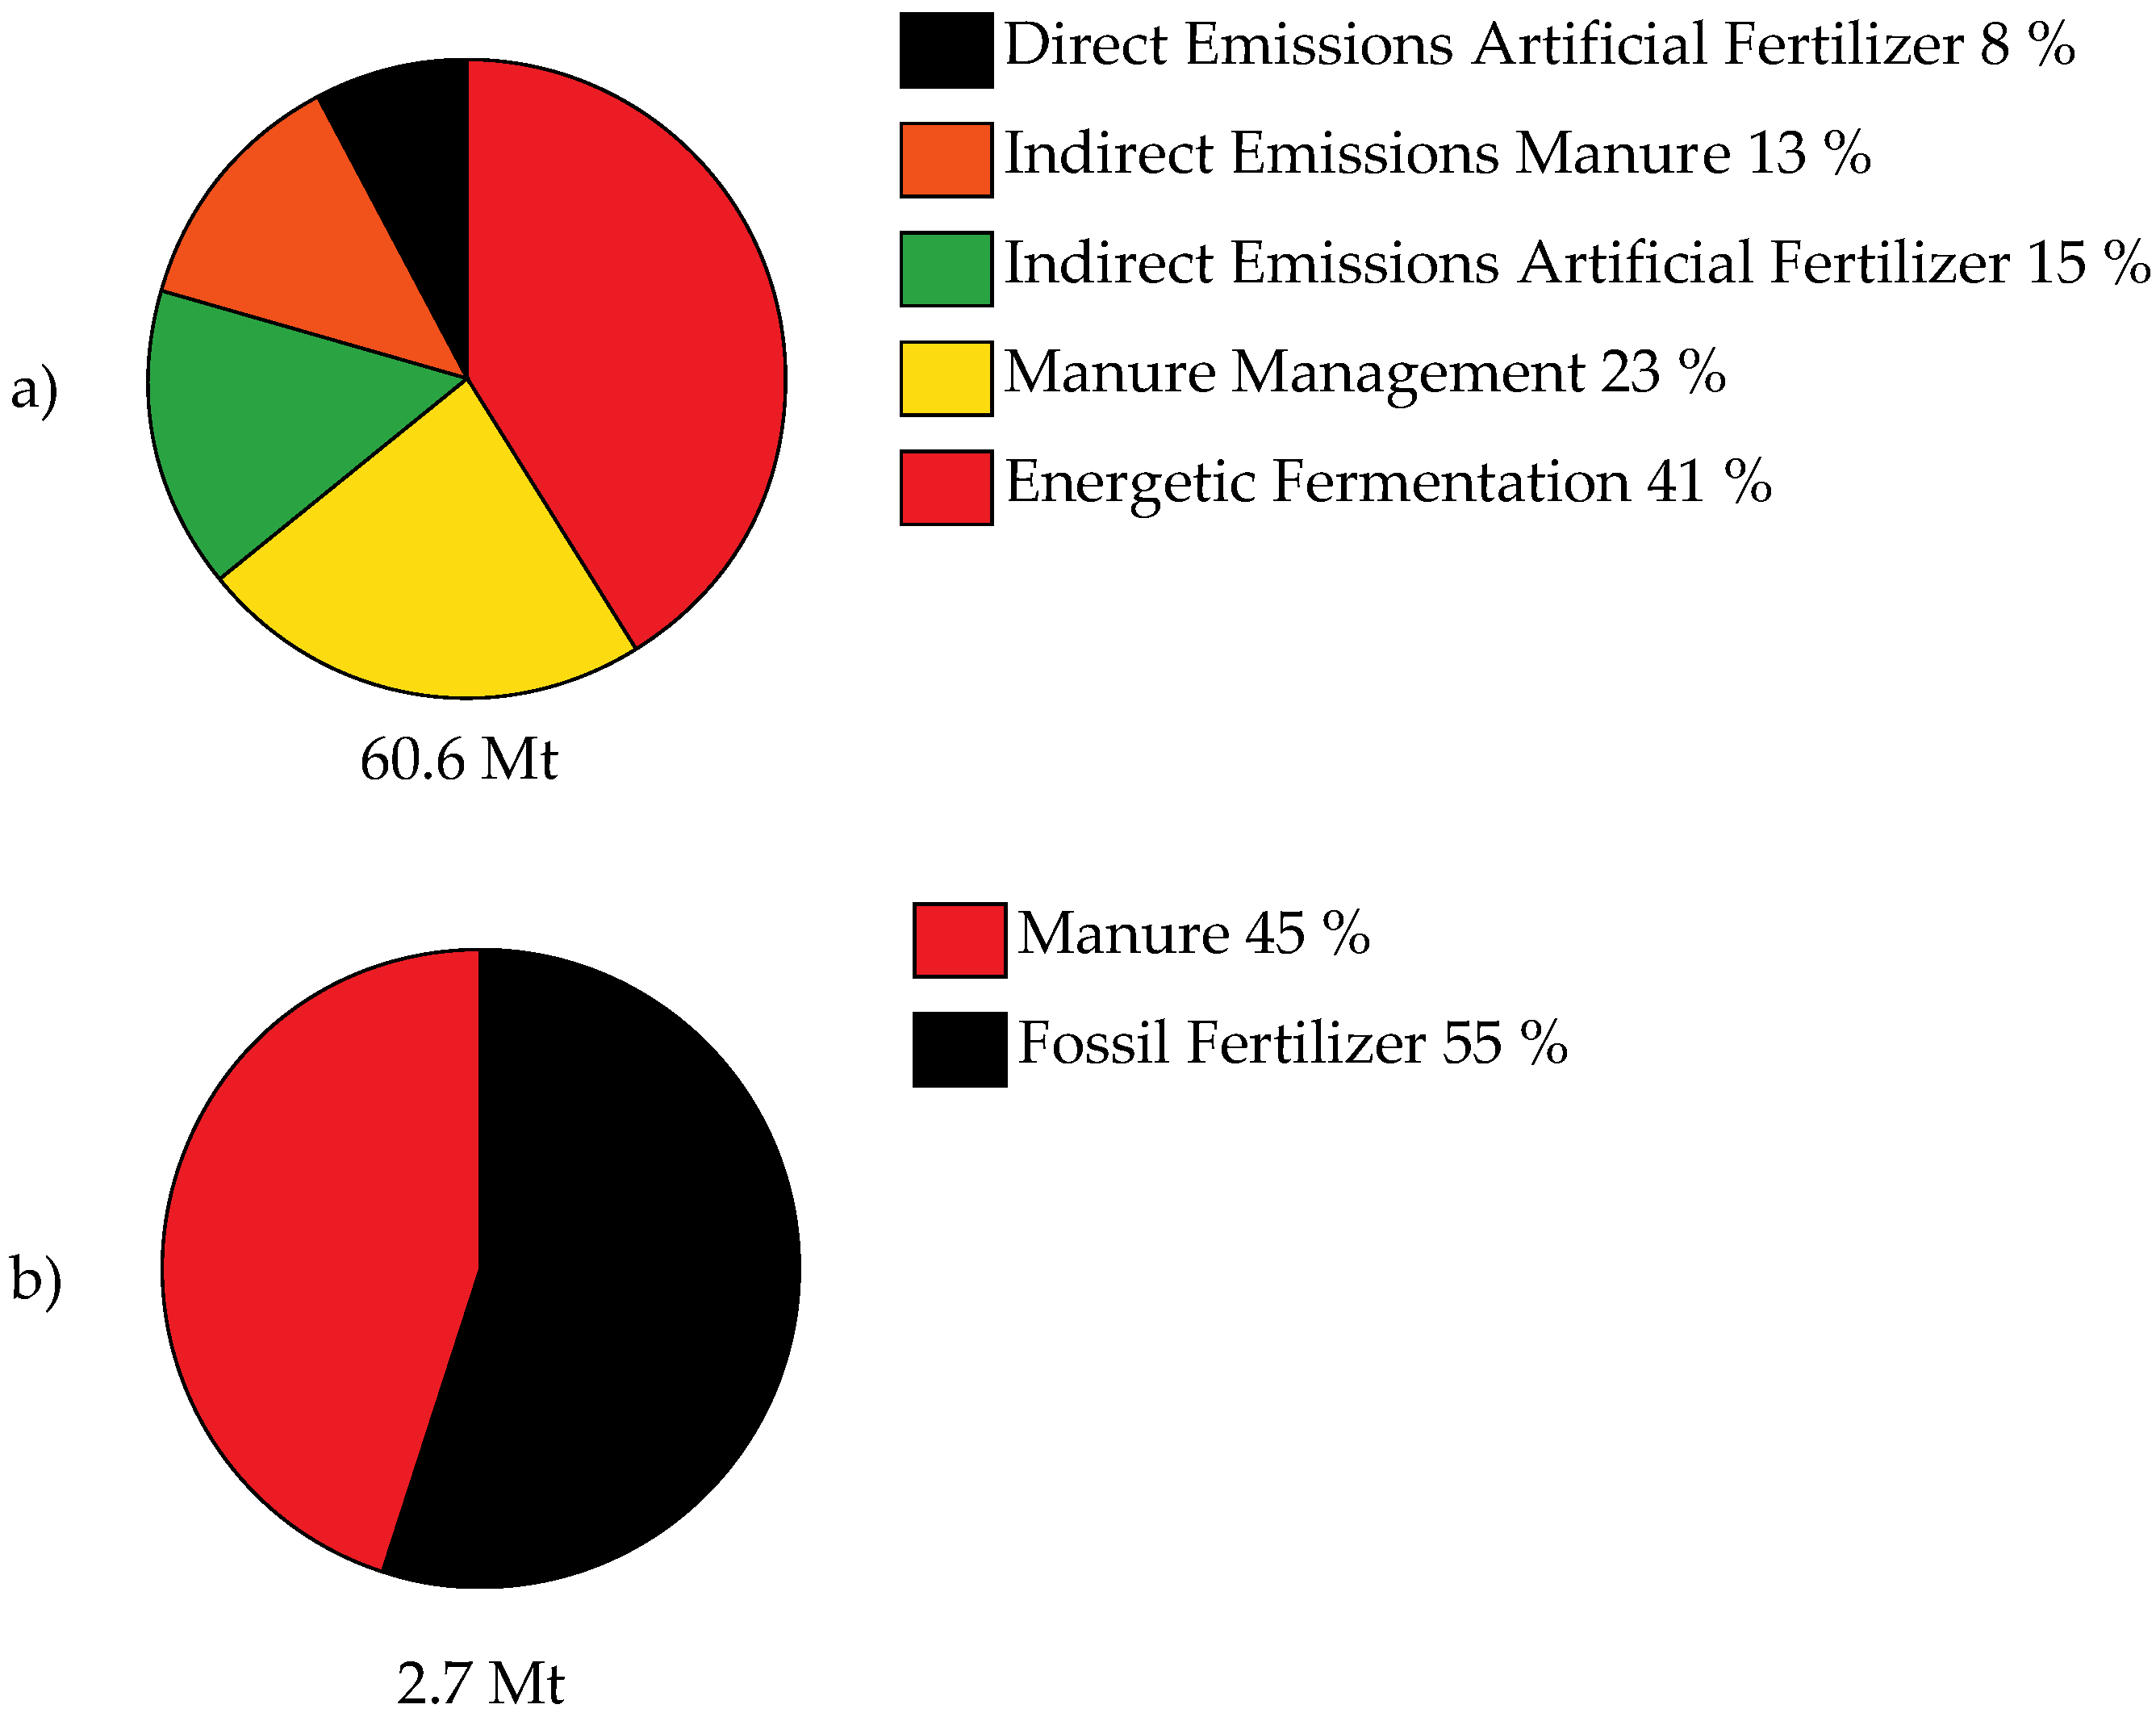
Figure 6.
The Possibility Space of German agriculture and its nitrogen fertilizer use.
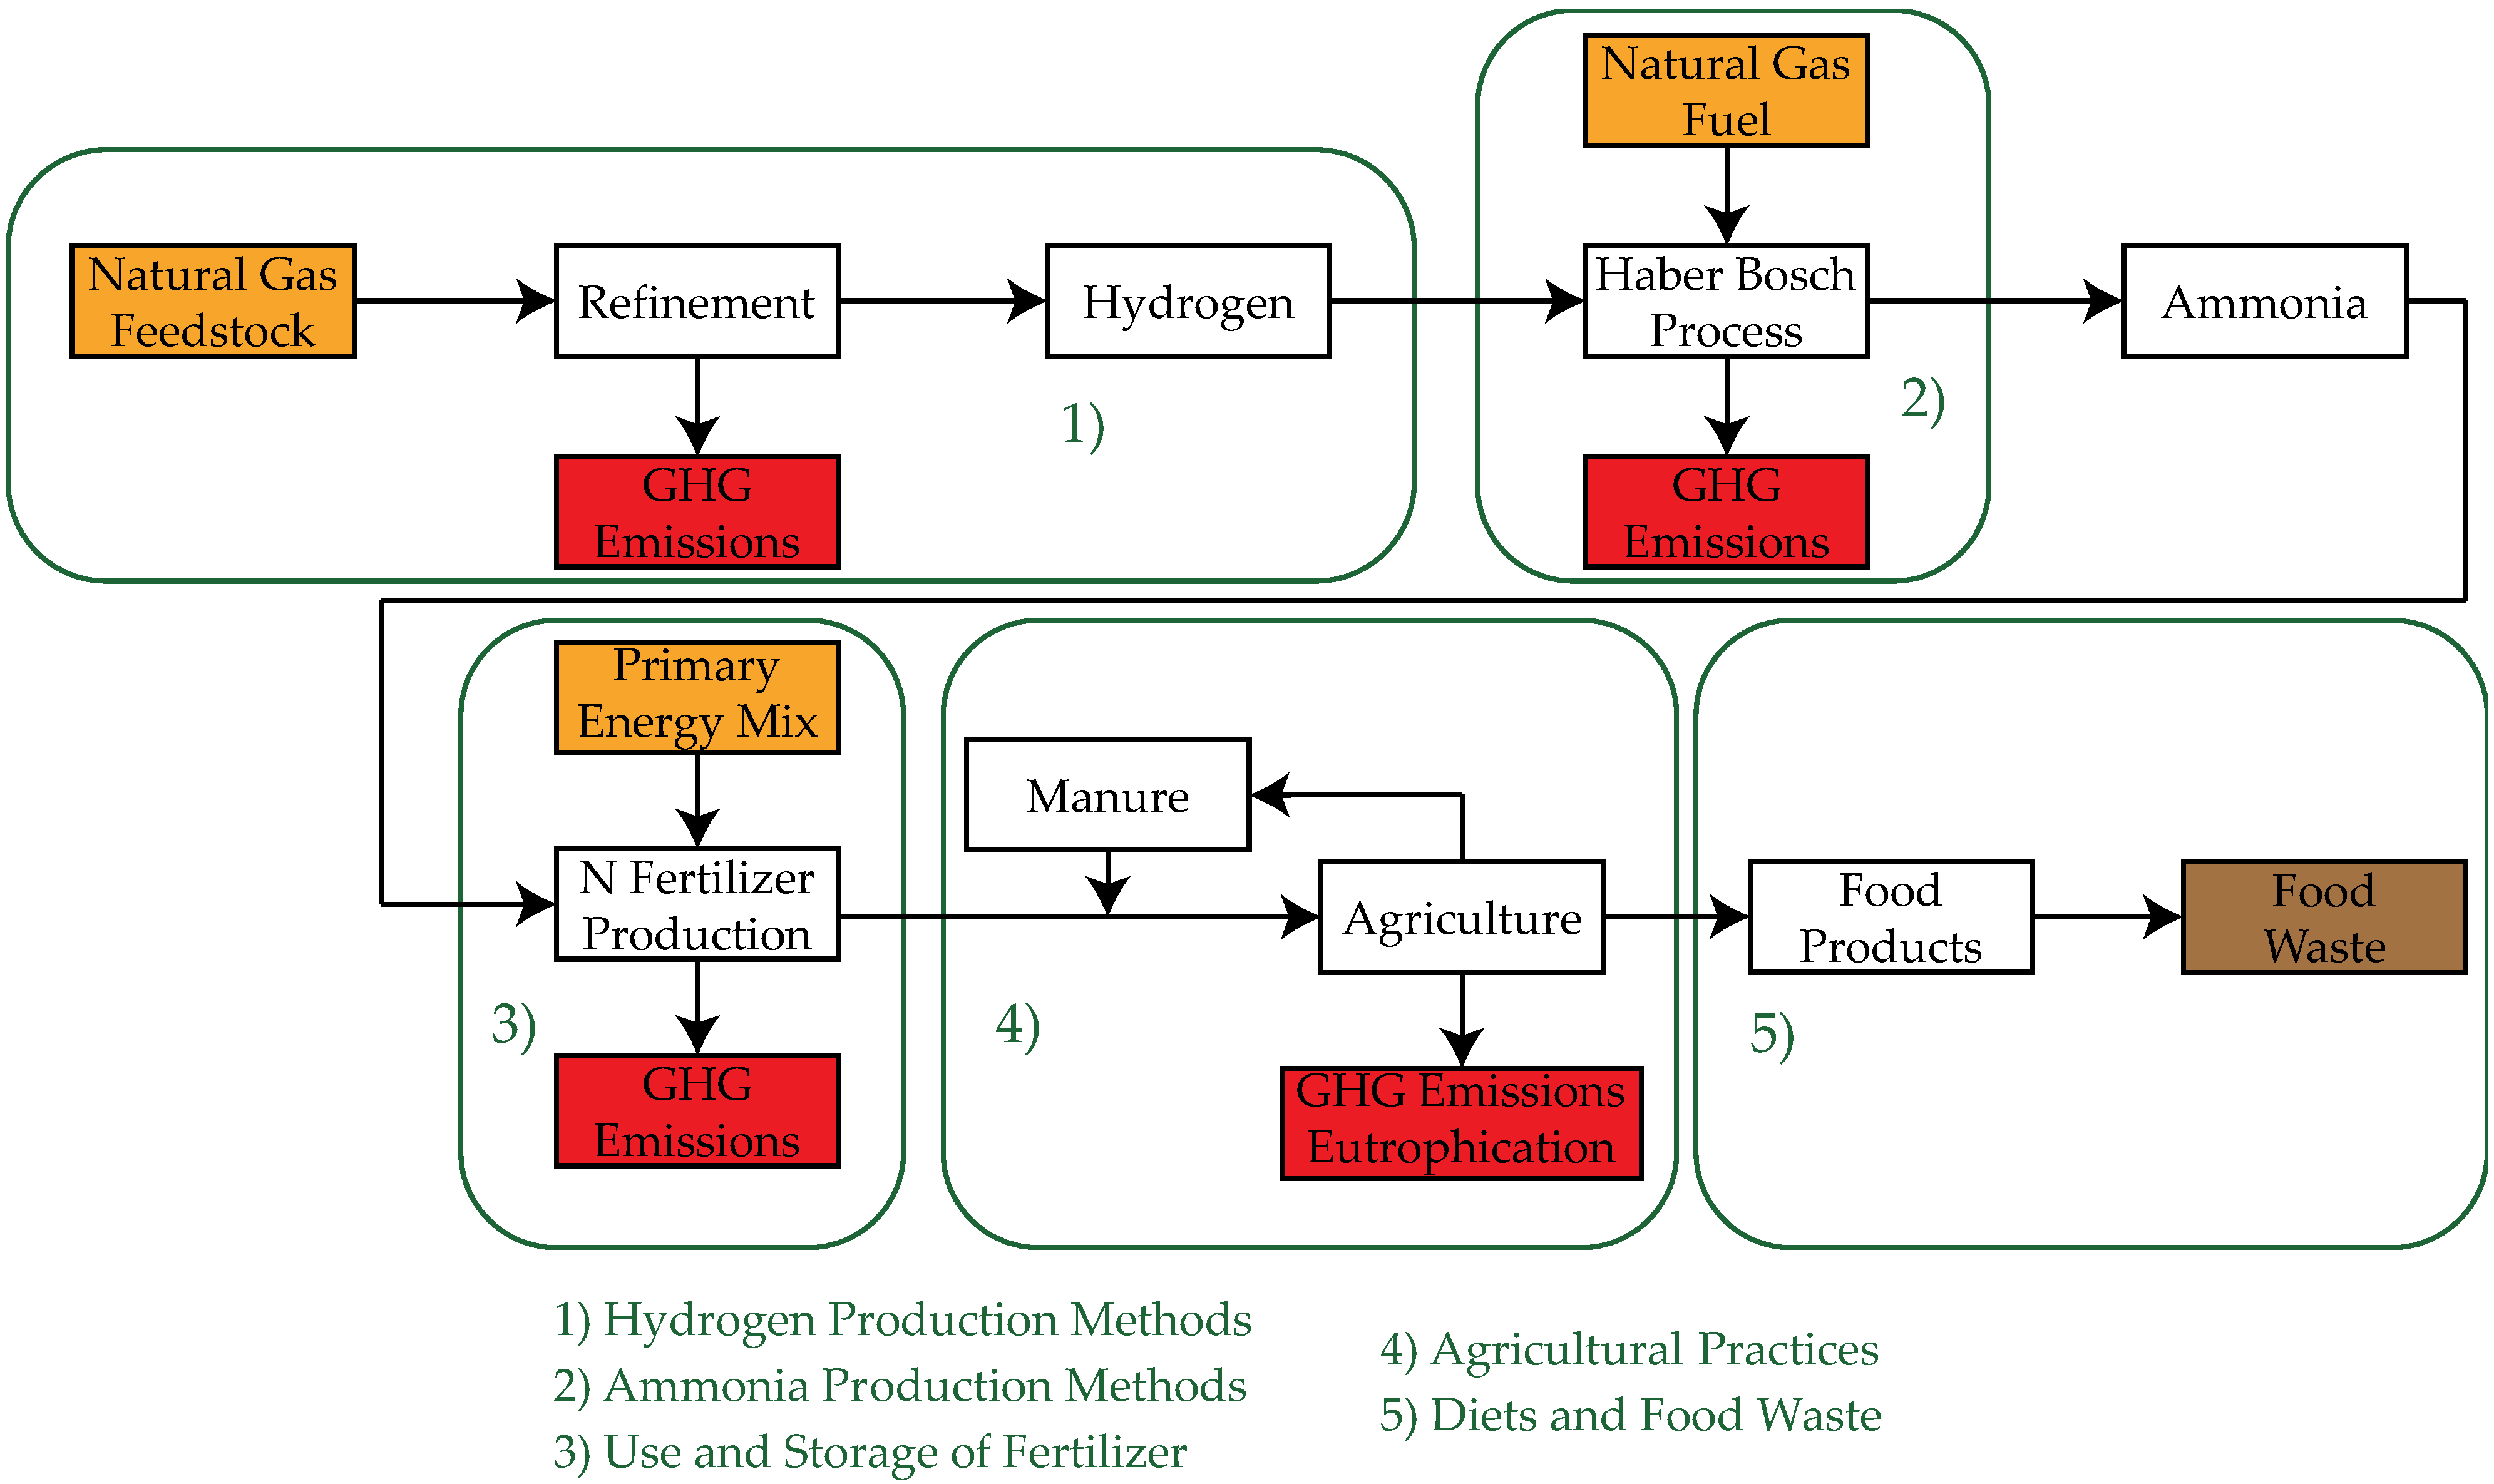
Figure 7.
Metrics as a function of animal product share for organic agriculture.
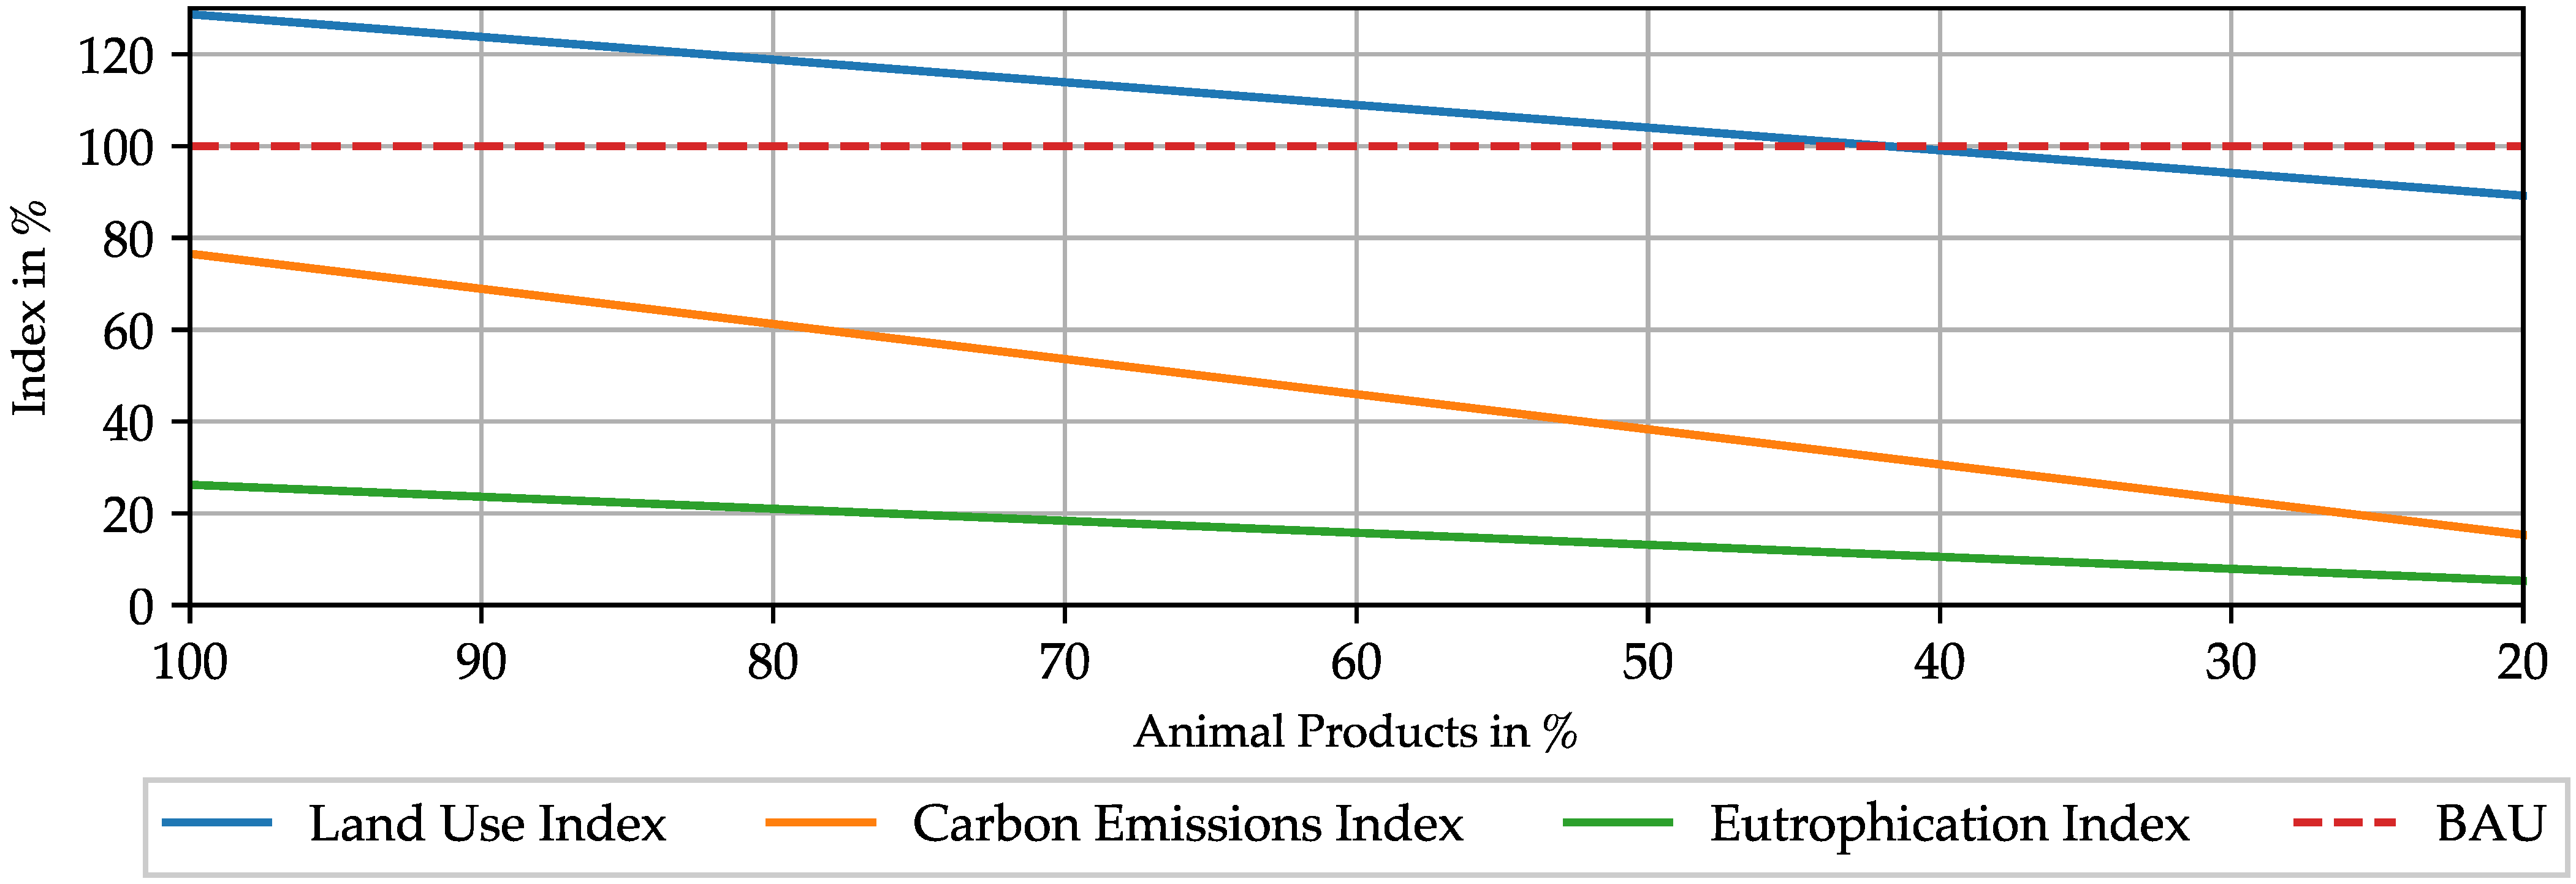
Table 1.
Mineral depletion of the technology scenario.
| Iridium | Copper | Graphite | Nickel | Cobalt | |
|---|---|---|---|---|---|
| Production years | 7.63 | 2.17 | 3.78 | 1.53 | 8.90 |
Table 2.
Opportunity Analysis of the basic scenarios.
| Scenario | Fossil Fuel Use Index | Energy Use Index | Biodiversity Loss Index | Carbon Emission Index | Eutrophication Index | Sum |
|---|---|---|---|---|---|---|
| BAU | 1.00 | 1.00 | 1.00 | 1.00 | 1.00 | 5.0 |
| Vegetarian | 1.47 | 1.47 | 0.74 | 0.52 | 0.89 | 5.1 |
| Vegan | 1.71 | 1.71 | 0.67 | 0.37 | 0.94 | 5.5 |
| Organic | 0.00 | 0.00 | 1.29 | 0.77 | 0.26 | 2.3 |
| Electrolytic H2 | 0.00 | 2.14 | 1.00 | 1.02 | 1.00 | 5.2 |
Table 3.
Opportunity Analysis of advanced scenarios.
| Scenario | Fossil Fuel Use Index | Energy Use Index | Biodiversity Loss Index | Carbon Emission Index | Eutrophication Index | Sum |
|---|---|---|---|---|---|---|
| Organic, 25% Animal Products | 0.00 | 0.00 | 0.92 | 0.19 | 0.07 | 1.17 |
| Organic, 40% Animal Products | 0.00 | 0.00 | 0.99 | 0.31 | 0.11 | 1.40 |
Publisher’s Note: MDPI stays neutral with regard to jurisdictional claims in published maps and institutional affiliations. |
© 2022 by the authors. Licensee MDPI, Basel, Switzerland. This article is an open access article distributed under the terms and conditions of the Creative Commons Attribution (CC BY) license (https://creativecommons.org/licenses/by/4.0/).
Share and Cite
MDPI and ACS Style
Ahrens, F.; Land, J.; Krumdieck, S. Decarbonization of Nitrogen Fertilizer: A Transition Engineering Desk Study for Agriculture in Germany. Sustainability 2022, 14, 8564. https://doi.org/10.3390/su14148564
AMA Style
Ahrens F, Land J, Krumdieck S. Decarbonization of Nitrogen Fertilizer: A Transition Engineering Desk Study for Agriculture in Germany. Sustainability. 2022; 14(14):8564. https://doi.org/10.3390/su14148564
Chicago/Turabian StyleAhrens, Florian, Johann Land, and Susan Krumdieck. 2022. "Decarbonization of Nitrogen Fertilizer: A Transition Engineering Desk Study for Agriculture in Germany" Sustainability 14, no. 14: 8564. https://doi.org/10.3390/su14148564
Note that from the first issue of 2016, this journal uses article numbers instead of page numbers. See further details here.