Article

Famous Chinese Traditional Dishes: Spatial Diffusion of Roast Duck in Mainland China and Spatial Association Characteristics of Chain Stores

1
School of Earth Science and Engineering, Hebei University of Engineering, Handan 056038, China
2
State Key Laboratory of Resources and Environmental Information System, Institute of Geographic Sciences and Natural Resources Research, CAS—Chinese Academy of Sciences, Beijing 100101, China
3
Shandong Zhengyuan Digital City Construction Co., Ltd., Yantai 264670, China
4
Yantai Smart City and Internet of Facilities Engineering Research Center, Yantai 264670, China
*
Author to whom correspondence should be addressed.
Sustainability 2022, 14(14), 8554; https://doi.org/10.3390/su14148554
Submission received: 25 May 2022 / Revised: 7 July 2022 / Accepted: 8 July 2022 / Published: 13 July 2022

Abstract

:
The spatial pattern and geographical diffusion of Chinese traditional food culture are important manifestations of population migration and cultural chain remodeling. Taking the national roast duck stores and Beijing Quanjude and Bianyifang brand chain roast duck stores as the research objects, the spatial distribution characteristics and geographic diffusion patterns of roast duck stores, and the spatial association characteristics of the chain stores are analyzed by using spatial analysis methods and mathematical statistics. The results of the study showed that: (1) The roast duck stores in the mainland show an overall northeast-southwest direction, and the spatial distribution is extremely uneven. The eastern coast of China shows a high-value continuous distribution, from the Bohai Bay Economic Circle and the Yangtze River Delta Economic Circle, gradually radiating westward to the middle and showing the clustering characteristics of “point + surface”. (2) Using the point cluster analysis method, the diffusion pattern of roast duck stores in the three major economic zones of China is explored, and roast duck stores in the western region show the characteristics of contact diffusion combined with hierarchical diffusion. Contact diffusion is the main diffusion mode of roast duck stores in the east. The central region shows the diffusion characteristics of contact diffusion combined with hierarchical diffusion. Overall, the roast duck stores in mainland China show a composite diffusion pattern. (3) Quanjude and Bianyifang stores have spatial agglomeration characteristics, Quanjude chain stores have a slightly stronger central pointing, while Bianyifang roast duck chain stores have slightly wider spatial diffusion. Both brands significantly show spatial orientation close to transportation facilities and high consumption markets. The street population has a slightly weaker influence on the spatial distribution of the two brands. (4) Through the multivariate spatial analysis method, it is found that the spatial correlation of mutual attraction between Quanjude and Bianyifang roast duck chain stores is presented, but there are differences in the formation mechanism and weak asymmetry in the attraction intensity, which is related to the consumer population and corporate positioning of Quanjude and Bianyifang. With the advent of the big data era, it is possible to obtain and use big data analysis methods to reshape the deep information under the surface logic. Attention should be paid to the location choice of traditional restaurant chains in the new era, to explore the possibilities of enterprise development, and to improve the efficiency of urban space.

1. Introduction

In previous societies, before the concept of space, space was just a “place”, but this space and place, after human practice and creation, formed a complex space with intertwined geography and culture, and in this space, eating is not only a necessary physical activity but also an active cultural activity. In the process of population migration, local food has interrupted the original traditional cultural chain, facing the challenge of reconstruction of food culture, and at the same time, the phenomenon of local food culture diffusion has also occurred [1,2].
China’s research on food geography and food consumption on food geography originated in the 1980s, and Tian gave a terse overview of the research objects and tasks of food geography [3]. In 2013, China released the Revitalization Plan of the Catering and Accommodation Industry, followed by the entrance of the catering industry into booming development, and the research on food geography has become richer, mainly involving the spatial distribution pattern of food culture, the analysis of the diffusion pattern of food culture, and the study of food consumption behavior. The current research on the spatial pattern of food and drink is richer and more extensive. Neal used the cluster prime generated by hierarchical clustering as a starting point and iterative k-means algorithm clusters to re-cluster 243 cities in the United States, defining cities with different food and drink cultures as food oasis, McDonald’s cultural oasis, and food desert in terms of the number of restaurants dimension and the qualitative cultural dimension [4]. Ye et al. used restaurant POI data to analyze the spatial distribution of small restaurants in Shenzhen from the perspectives of “neighborhoods” and “strips” [5]. Zhang et al. analyzed the spatial pattern of “one core, five strips, and multiple points” of the restaurant industry in Guiyang [6]. Tang et al. used POI to portray the spatial pattern of restaurants in Shanghai, showing a block-like clustering and multi-center development pattern [7]. Zhang et al. visualized and analyzed the urban food service hotspots in Jinan, Shandong Province from the perspective of geo-information mapping by using the POI of food and beverage as well [8]. In addition, other scholars have identified urban functional centers, POI distribution clustering patterns [9], and urban vitality based on POI data from the perspective of analysis and application [10]. The application of methods involved in the study of the spatial pattern of the restaurant industry is also relatively mature. In summarizing the existing literature, we found that some scholars have used the nearest neighbor distance to analyze the spatial distribution of old Beijing restaurants [11], and some other scholars have used kernel density estimation [12], locational entropy index and hierarchical clustering [13], Ripley’s K function [14] and other analytical methods to analyze the spatial pattern of POI from the perspective of industry spatial differentiation. However, most of the current research on the restaurant industry in China has focused on Netflix restaurants, large multinational chain restaurants, etc. Little attention has been paid to the study of China’s long-established restaurants, and the literature studying the spatial association characteristics among competing stores from a geographic perspective is even rarer. With the arrival of big data, information on latitude and longitude of points of interest, consumer preferences, etc., obtained through popular reviews [15], Baidu maps, and Gaode maps [16], have also provided new ideas for scholars to study food geography in China’s vast territory, which has preserved characteristic local food cultures under the long-term historical process. In the context of the new era, the interventions of transportation, population movement, and multimedia have accelerated the spread of traditional food culture and, at the same time, changed the mode of spatial diffusion of food. Spatial diffusion was first proposed by Hgerstrand and quantitatively studied the laws of spatial diffusion, followed by a large number of case studies by Chinese and Western scholars [17]. Thomas analyzed the effects of markets and trade on the diffusion of supermarkets in developing countries [18]. Graff et al. took Walmart supermarkets in the United States as the object of their study and found that in its early years, the company opened stores mainly in small towns, and to serve the U.S. market, it expanded into metropolitan areas with expansion patterns characterized by neighborhood contagion diffusion and reverse stratified diffusion [19]. Holmes argues that Walmart has maintained a high store density and a contiguous store network [20]. Domestic scholars targeting store expansion mainly focus on chain stores. Zhu et al. analyzed the spatial distribution of the Chinese supermarket chain Yonghui Supermarket and concluded that the spatial expansion patterns can be summarized into four types: regional deep-dive, contact, jump, and compound expansion [21]. Ding et al. analyzed Walmart’s diffusion pattern in China and concluded that a combination of penetration and jump expansion patterns was adopted in the Chinese market [22]. Li et al. concluded that large companies have channel expansion in addition to contact diffusion and hierarchical diffusion in spatial expansion [23]. Through reading the literature, we found that domestic and foreign scholars mostly focus on multinational chain brands [24,25] and retail stores in the era of the digital economy [26], and the existing studies provide an important reference for the study of this paper, but it is found that there is little to summarize the geographic and spatial diffusion pattern of traditional Chinese famous food or food culture, and the traditional specialties of Chinese food have obvious geographical characteristics and are more based on regional culture. The traditional Chinese specialties have obvious geopolitical characteristics and are more based on regional culture as the bond of dissemination, so they have important research value and significance. By exploring the diffusion pattern of roast duck culture, it helps to study the reconstruction of traditional Chinese food culture in the process of historical changes on the one hand, and enriches the research cases on traditional Chinese food culture on the other. Initially, about competition is the competition model proposed by western scholars. Hotelling believes that consumers will choose the service facilities nearby and price constraints [27], Reilly believes that the attractiveness of competition is directly proportional to the population and inversely proportional to the distance of the competition object [28]. Huff, based on Lilly’s model, believes that the larger the area of the commercial center, the more attractive it is to consumers [29]. Regarding the study of the spatial relationship between competitive elements, there are two general possibilities for the location choice of two similar firms; one is that they will want the two firms to be far enough away from each other in order to maximize the market power effect and establish a local monopoly. On the other hand, both can also increase their market share by being close to each other and thus gain more profits [30]. Currently and in real life, besides the voluntary proximity of the two enterprises, there is also a policy influence where the controlling plan constrains the land class attributes, which also further promotes the mutual proximity of the two enterprises [31]. With the advent of the era of big data, the study of business competition has also entered a new stage, and currently, for the spatial association relationship between competing firms, some scholars think from the perspective of consumers, and Hideo argues that more concentrated firms or stores can attract more consumers with different tastes [32], while leading to intense price competition and producing a price reduction effect, in addition to the fact that the clustering of firms can largely. In addition, the clustering of businesses can largely reduce consumers’ spatial resistance [33] and satisfy consumer demand. However, from the firm’s point of view, the clustering of firms creates a “high food effect” while reducing spatial resistance, making it more difficult for firms to grow, but Murry et al. [34] argue that the heterogeneity of products brought about by the clustering of firms enhances consumers’ desire to buy. In addition, Robert argues that there is a high agglomeration pattern in coffee and tobacco stores, even reversing the price reduction effect, which is associated with transportation costs or high machine costs [35].
Studies on the spatial relationships of traditional Chinese restaurant chains are not yet available. With population migration and historical changes, culture, customs, and food habits spread around the world through convenient transportation. With population migration and merchants taking advantage of people’s desire for good food, roast duck food culture began to spread across its original geographical boundaries, and in the process of spreading, cultural reproduction took place and reshaped people’s sense of cultural identity [36]. The preliminary search of the spatial location and wide distribution of roast duck stores through the Gaode map can be called “Chinese traditional famous dishes”. Both Quanjude and Bianyifang, as the most famous roast duck chain stores in China, have their headquarters locations in Beijing, and Bianyifang and Quanjude, like KFC and McDonald’s in the United States, are a pair of rivals in the business world, and the competition between the two brands started in 1864 AD [37,38,39], and both traditional stores have never fallen in their historical development. Therefore, this study takes Quanjude and Bianyifang as typical representatives of roast duck chain stores and summarizes the relevant experiences and patterns from the location choices of the stores of the two enterprises so as to provide decision references for the future development and expansion of the enterprises. Based on this, the geographic phenomenon of roast duck culture is taken as the research object, firstly, we analyze the spatial distribution pattern of roast duck stores POI in mainland China on a macro level to understand the current situation of roast duck stores, and use mathematical statistics and spatial analysis methods to explore the spatial diffusion pattern of roast duck stores in mainland China from the perspectives of commercial geography and human geography. Factors affecting the location of Quanjude and Bianyifang stores are analyzed on a micro level, and a new multivariate spatial analysis method is used to empirically demonstrate the spatial correlation between the two, to provide scientific references for the development of traditional culture and the commercial expansion of traditional cuisine. The study of the spatial characteristics and attraction relationships of chain store restaurants will help restaurants to choose their locations accurately and optimize the commercial space of the city.

2. Research Methods and Data Sources

2.1. Research Data Sources

In this paper, we will analyze the spatial distribution of roast duck stores and the trend of their proliferation on a national scale. In addition, Beijing, as a city featuring roast duck culture, will be used as the study area to analyze the spatial association characteristics and attraction of Quanjude and Bianyifang roast duck stores within the city. A total of 59,396 data of national roast duck stores were obtained through Gaode Map API, and there are 49 Quanjude stores and 35 Bianyifang stores in Beijing (the statistical time ends in January 2022). The street population data of Beijing is based on the data of the 7th national census, and the data of shopping malls and transportation facilities were obtained through the corresponding POI obtained through the Gaode Map API interface in the same period.

2.2. Research Methods

2.2.1. Single-Factor Spatial Analysis

The spatial pattern of POI was analyzed from a global perspective, and the spatial distribution of roast duck restaurants was measured by various spatial analysis methods. The relevant models and geographical significance are shown in Table 1.

2.2.2. Multiple Point Model Approach

One of the most commonly used statistics for estimating spatial models of univariate agglomeration is Ripley’s K-function (Ripley 1977) and L-function, both of which measure clustering or dispersion within a set of points. In order to measure spatial interactions between two or more types of stores, a multi-spatial analysis method is required. This paper uses a new statistical method proposed by Nilsson in 2016, which not only measures spatial interactions (attraction/avoidance) between firms with limited vocational options but also enables the assessment of spatial dependence within each firm’s locational strategy. Nilsson considers six types of mutual attraction relations between two types of points. Figure 1a,b,e shows the positive interaction association characteristics of points, and Figure 1c,d,f shows the negative interaction.
In addition, Nilsson uses Thiessen polygons to construct an attraction area. The steps for constructing an attraction area are as follows:
First, let P be denoted as a joint population with f different classes of sample size N. Assuming a binary pattern, f = 2, where point A is represented as   P i A , (i = 1, 2, 3, …, n), Point B is represented as   P i B , (i = 1, 2, 3, …, n). Assuming a fixed Class B point, a Thiessen polygon T j B (j = 1, 2, 3, …, n) is produced around the B point of interest. Thiessen polygons are derived around each point B, then find the vertices of each Thiessen polygon V j , e B , e = (1, 2, 3, …, k). Then connect Midpoint m j , e B of the vertex V j , e B forming a relative attraction zone.
To determine whether the relationship between points A and B is one of attraction or avoidance, count the number of points A located in the attraction area h j B of point B. C A B = C i A represents the number and the number of points A within the attraction area of B, in: C i A = { 1   p i A h B   0   p i A   h B , the statistic is then defined as the proportion of observations where point A lies within the relative attraction region of B. If for all i, statistically C i A independent or strong mixing conditions are met, Then the central limit theorem implies that Q A B conforms to the asymptotically normal distribution, and Q A B N ( c , c 1 c n A ) , So get Z Q A B = Q A B E [ Q A B ] E [ Q A B ] ( 1 E [ Q A B / n A ] ) , The z-statistic indicates that if A and B have a positive correlation of attraction, then a large portion of the A-like points should lie within the B-attraction zone, so the following equation should hold.
Z Q A B { < 0   A   a n d   B   a r e   e x c l u s i o n a r y 0   A   a n d   B   a r e   n e i t h e r   e x c l u s i v e   n o r   a t t r a c t i n g > 0   A   a n d   B   a r e   i n   a n   a t t r a c t i o n   r e l a t i o n s h i p
Finally, to test the significance of the statistic, for smaller sample sizes, Monte Carlo simulations were used to generate empirical distributions, assuming that point B was fixed and point A was randomly assigned for 600 iterations, finally making the statistic satisfy a 95% confidence level and calculating its confidence interval.

3. The Spatial Distribution of Roast Duck Shops in Mainland China

3.1. Quartile Distribution Density of Roast Duck Restaurants

ArcGIS software was used to obtain China’s national boundary from the data published by the National Basic Geographic Information Center. As of October 2021, a total of 59,396 roast duck stores were obtained from Gaode Map, and the number of roast duck stores in Jiangsu Province was found to be 5944, ranking first, which is also in line with the “legendary origin” of the roast duck, which was introduced to Beijing from Nanjing, Jiangsu Province during the Ming Dynasty. The number of roast duck stores was aggregated according to municipal units, and the results showed that Beijing has 2877 roast duck stores, making it the city with the highest density of roast duck stores under municipal units.
Spatial overlay analysis of the POI data of national roast duck stores with municipal administrative divisions, using the natural break method and choosing the quartile analysis method to classify the distribution of the number of roast duck stores nationwide (Figure 2), The results show that the spatial pattern of roast duck restaurants has obvious regional characteristics and an uneven spatial distribution. From the east-west direction, the national roast duck stores are mainly distributed in the eastern coastal region, and the number of distributions in the western interior region is very small, and the density of roast duck stores is extremely low. The cities with a number of roast duck stores between 698 and 2877 belong to the first level, with 20 municipal administrative units. From Figure 2, we can see that the number of cities in the first tier is mainly located in China’s first-tier cities or provincial capitals with high economic development, such as Beijing, Tianjin, Shanghai, Guangzhou, Nanjing, Wuhan, Chongqing, Kunming, etc. The high-density areas are mainly concentrated in the east-central region of China and gradually extend from the eastern coastal areas to the interior. The cities with a number of roast duck stores between 318 and 697 belong to the second tier, and the distribution of the second tier is closely adjacent to the first-tier cities. The third and fourth levels are mainly the vast western economic region, while parts of the northeast and the southwest mountainous region also belong to the fourth level. On the whole, the first and second high-density distribution of roast duck restaurants shows a contiguous feature, mainly distributed in three major economic zones: the Beijing–Tianjin–Hebei Capital Economic Circle, the Chengdu-Chongqing Twin Cities Economic Circle, and the Yangtze River Delta City Cluster. It is found that the number of roast duck restaurants is closely related to the level of economic development and the degree of market opening in each region.

3.2. Roast Duck Restaurant Proliferation Trend and Clustering Characteristics

From the macro distribution structure, the POI data of 59,360 roast duck stores are widely distributed in 31 provinces in China (except Hong Kong, Macau, and Taiwan), and there are significant differences between provinces. As shown in Figure 3, according to the standard deviation ellipse calculation, the standard deviation ellipse of the spatial distribution of roast duck stores nationwide has a shorter X-axis and a longer Y-axis, and the main development direction of the stores is in the north-south direction. The angle of rotation of the ellipse is 35.68°, and the overall distribution direction of the roast duck stores is north to the east pattern, the center of gravity coordinates of the ellipse is (114.747° E, 33.003° N), the geographical location is located in Zhumadian City, Henan Province, located at the border of Henan Province and Anhui Province. The ellipse with 979,514.96 m as the long semi-axis and 750,225.76 m as the short semi-axis can encompass about 68% of the roast duck stores POI in the country. Spatially, the long axis shows a northeast-southwest distribution direction and the short semi-axis represents the range of distribution, the figure shows that the roast duck is mainly distributed in the Bohai Bay economic circle and the Yangtze River Delta economic circle, and gradually radiates westward to the middle.
The spatial clustering characteristics of roast duck stores in 2021 were calculated by the nearest neighbor index, and the nearest neighbor index nearest neighbor rate was obtained as 0.1060 and Z = −416.849, p = 0, with 99% confidence level, indicating that the spatial distribution of roast duck stores in China showed significant clustering-type distribution characteristics. The Moran’s index was used to analyze the global association characteristics of the roast duck stores, show that the Moran’s I of the roast duck stores is greater than 0, and the Z score is 12.25, which is much greater than 2.58, and the p-value is 0, which is less than 0.01, indicating that there is only less than 1% possibility that the data distribution is randomly distributed, which satisfies the 99% confidence level and can significantly reject the null hypothesis (Table 2). This result indicates that the spatial distribution of roast duck stores has a significant positive spatial correlation, and cities with more stores and cities with fewer stores show a clustering distribution.
Food culture is formed under specific natural and humanistic environments, which gives rise to the well-known “southern rice and northern noodles”, “southern sweet and northern salty”, and “eastern spicy and western sour” in China. Although these food cultures with regional characteristics may be spatially diffused, they do not affect the regional differences in food on a large scale. Therefore, in order to investigate the differences in the distribution of roast duck culture in China, we identified the spatial clustering characteristics of roast duck food culture from the perspective of roast duck stores and conducted a hot spot analysis (Getis-Ord Gi*) to understand the acceptance and preference of roast duck by residents of different regions. It was found that the distribution of both hot spot areas and cold spot areas of roast duck stores showed a faceted distribution, but the cold spot areas were more dispersed and the hot spot areas were more concentrated, and the two types of areas differed in spatial distribution. The hot spot areas are mainly distributed in Beijing, Tianjin, Hebei Province, Shandong Province, Shanghai, Jiangsu Province, Anhui Province, and Zhejiang Province, and show a significant band shape, extending in a northwest-southeast direction along with northeastern China. The secondary hot spot areas are mainly distributed in Henan and Shanxi provinces. The cold spot area is mainly distributed in Gansu Province, Hainan Province, and Qinghai Province, and the sub-cold spot area is mainly distributed in the western part of the Inner Mongolia Autonomous Region, the eastern part of Qinghai Province, the northern part of the Xinjiang Uygur Autonomous Region, and the southern part of the Guangxi Zhuang Autonomous Region. Figure 4 illustrates that there is a huge spatial difference in the distribution of roast ducks between the eastern and southern parts of China. On the one hand, it is related to the dietary preferences of the population, which indicates that the northern and eastern regions of China are fonder of roast duck, and on the other hand, it also indicates that there is still a vast market to be exploited in the eastern and southern parts of China for the development of roast duck stores. The local dietary habits should be satisfied while retaining the characteristics of roast duck.

3.3. Spatial Diffusion Pattern of Roast Duck Restaurant

Current research on the geospatial diffusion patterns of firms commonly includes hierarchical diffusion, contact diffusion, and jump diffusion [40]. Analyzing the relationship between source and diffusion sites, contact diffusion is a geographical diffusion process that takes the source site as the diffusion center and starts from the center from near to far. This diffusion pattern is generally common in service-oriented enterprises, and this diffusion process is consistent with the content of the first law of geography. The other diffusion law is hierarchical diffusion, which starts from the source of diffusion, first to each economically developed urban center, and then to secondary urban centers, which is a hierarchical diffusion process from senior urban centers to lower urban centers, while jump diffusion refers to the fact that the source and the diffusion area are not continuous areas, and in order to maximize benefits, firms will expand across spatial and environmental constraints and directly diffuse to areas farther away from the source for development [41]. By comparing the spatial distribution of roast duck stores in October 2020 and June 2022, we screened out new roast duck stores during this period. Figure 5 shows the spatial relationship between the new roast duck stores in 2022 and the opening of roast duck stores in 2020, which facilitates the study of the diffusion pattern of roast duck stores at a finer-grained spatial scale.
The new roast duck stores added in the period from October 2020 to June 2022 were screened out, and the point clustering centers of the new roast ducks were overlaid with the national roast duck point clustering centers in 2020 for analysis, around areas that have already occupied part of the consumer market clearly shows that many of the new roast duck stores are spatially proximate to the existing stores, with contact diffusion as the main focus. The three economic zones in China are analyzed separately. In the western region of China, which is economically underdeveloped, roast duck restaurants, as consumer-oriented commercial service stores, will spread to provincial capitals with higher consumption levels and better economic development in order to obtain more economic benefits and attract more consumers. The eastern region of China, with better economic development and a high living standard of the people, has more original roast duck stores and higher local recognition of the roast duck catering business. Contact diffusion is the main diffusion method of roast duck stores in the eastern region. The central region is rich in resources, with several mountain ranges running across the central part of the country, which has a great influence on the expansion of stores. The jumping diffusion method is a good choice for the expansion of roast duck stores in central cities, with the clustering of similar enterprises brought about by the contact diffusion, coupled with the natural barrier effect of the natural environment, resulting in the expansion of roast duck stores in some central cities receiving obstacles. In order to open up a sustainable and profitable market environment, there is a jump in the proliferation of roast duck restaurants in the central region. In addition, central China is led by policy. Chengdu, Xi’an, Chongqing, Changsha, and other cities have rapid economic development and good consumer market prospects, thus, roast duck restaurants will appear as obvious characteristics of contact diffusion in a good market environment, so jump diffusion combined with contact diffusion has become the main diffusion mode of urban clusters in central China.
In summary, the expansion process of roast duck stores is a composite diffusion mode, which combines the characteristics of contact diffusion, jump diffusion, and grade diffusion, and adopts the development strategy of “face combined with point”, and this diffusion mode will be continued in the future development.

4. Spatial Association Characteristics of Roast Duck Chain Stores

4.1. Distribution of National Roast Duck Chain Stores

Roast duck chain stores are representative of the successful diffusion of roast duck culture. The distribution of roast duck chain stores on the provincial scale was visualized by classifying the roast duck stores in mainland China and combining the number of non-chain stores in roast duck stores with the distribution of the number of roast duck chain stores. The pie chart shows the number of urban roast duck chain stores and non-chain stores in mainland China, and the size of the pie chart’s diameter is shown by the number of chain stores on the city scale. The Figure 6 show that Beijing has several roast duck chain brands, and there are many chain store brands with a large number of outlets and a good reputation, such as Quanjude, Bianyifang, Dayali, Jin Bai Wan, Siji Minfu, Yulin Roast Duck, etc. At the time of data acquisition, the statistics show that Beijing has the largest number of roast duck chains, which is consistent with the claim that roast duck is a famous Beijing dish with a worldwide reputation.

4.2. Spatial Pattern and Driving Mechanism of Two Brands of Roast Duck Stores in Beijing

4.2.1. Spatial Distribution Characteristics of Branded Roast Duck Chain Stores

Through the above study, the POI data of roast duck stores nationwide were analyzed as a whole, and the distribution density, development trend, and spatial diffusion pattern of roast duck stores nationwide were explored. The spatial distribution of roast duck chain stores in the country is also shown in a pie chart. As the city with the largest number of roast duck chain stores, it is valuable and important to analyze the spatial relationship among famous roast duck chain stores in Beijing. In order to analyze the spatial relationship between roast duck stores more microscopically and to understand the competitiveness and specialization of enterprises dominated by roast duck food culture, this paper refines the spatial scale and selects Beijing, the city with the highest density of roast duck chain distribution, as the study area to explore the factors influencing the location choice and spatial association characteristics of the two best-developed roast duck brands in mainland China: Quanjude and Bianyifang chain stores, to provide a reference for enterprises to make scientific site selection and commercial expansion.
The visualization analysis of the store locations of Quanjude and Bianyifang in Beijing, the point data of store distribution, and the overlay with the administrative district map of Beijing, shows that both brands show significant clustering characteristics, but there are still differences in spatial pattern characteristics. Compared with the distribution of Quanjude stores in Beijing, the spatial distribution of Bianyifang chain stores is more dispersed, and the spatial proximity of the two brand chains is measured by the average nearest neighbor index, which shows that the average nearest neighbor index of Quanjude in Beijing is R = 0.575581 and Z = −5.683599, indicating that the data distribution is only less than 1% likely to be randomly distributed, satisfying a 99% confidence level and can significantly reject the null hypothesis. The average nearest neighbor index of Bianyifang is R = 0.8249 and Z = −1.980879, which indicates by comparison that Quanjude is more spatially clustered. Figure 7 shows the kernel density estimation of Quanjude and Bianyifang chain duck restaurants in Beijing shows that both famous brands of duck present hot spots of duck food culture clustering near the Xicheng and Dongcheng districts of Beijing, but there are still differences in the clustering of the two brands. The clustering center of Bianyifang chain restaurants in the left figure is smaller, the branch opening area is more extensive, and the spread is wider in Beijing. The hot spot area of Quanjude duck restaurants is shown in the right figure. The spatial distribution direction and structural characteristics of the two brands are analyzed, the standard deviation ellipse of Bargain Place has an obvious north-south extension, the long axis direction of Quanjude chain stores is also north-south direction, but obviously less significant than that of Bianyifang. Through comparison, we found that the spread of Quanjude roast duck chain stores in Beijing is small, but the agglomeration is very strong and there is an obvious central direction, while the Bianyifang has a weaker agglomeration, but the trend of north-south spread is obvious, which is obviously related to the customer orientation of the two brand chains.

4.2.2. Intrinsic Driving Mechanisms of Spatial Patterns

Chain stores are largely influenced by spatial demand and uneven economic development when they undergo spatial expansion. The location choice of chain stores belongs to the theoretical study of fine-grained scale, so this paper chooses the distribution of street population and shopping areas as the measure of market demand and uses the distribution of bus stations and subway stations to measure the traffic conditions around the roast duck stores [42]. Figure 8 shows the kernel density estimates for the traffic and commercial areas of Beijing and analyzes the population density in terms of streets. It adopts the spatial analysis method of kernel density estimation, considers the realistic market situation, and combines qualitative analysis with quantitative research at a finer-grained scale. The spatial distribution of Quanjude and Bianyifang roast duck stores is measured on a finer grain scale.
  • Impact of population distribution
Population distribution of a certain size or density is a key factor in the layout of commercial outlets. In order to understand the basic situation of the district population, data from the seventh national census of Beijing’s streets were obtained. Comparing the distribution of the two most famous roast duck chains in the study area with the street population data, it was found that the distribution of the two brands of roast duck chains almost coincided with the high population density distribution areas, but there were also differences, with the eastern part of Fangshan District, the northwestern part of Daxing, and Tongzhou District showing high population values, but Quanjude did not choose to open stores there. It was found that Quanjude and Bianyifang broke the tradition when choosing the location of their stores, and did not choose only the layout of the neighborhood with a large number of populations, on the one hand, as Beijing is the capital city, there is no lack of consumer crowd, so the location of roast duck stores need not show the need to be close to the crowded layout. On the other hand, in Beijing, as the gathering place of the culture of roast duck, roast duck stores can be found everywhere. As Quanjude and Bianyifang are the high-end brands of roast duck, the main brands for scene consumption and sentiment consumption, especially Quanjude, they need to be close to the shopping district, near the higher spending power, or near scenic spots with a more mobile population. The difference between the two brands is that Bargain Place, as a roast duck brand loved by residents, not only chooses to locate in areas with a good business atmosphere like Quanjude but also chooses to locate in areas where some residents gather, such as the densely populated areas in Daxing, Tongzhou, and Miyun Districts.
2.
Impact of the business district
The higher the grade of the business district, the more attractive it is to consumers, and the more mature the surrounding industries and facilities are; thus, the business district of the city has become an important factor influencing the layout of commercial outlets. Urban poi data has the unique ability to reflect human social activities. In this paper, we use POI data to obtain the shopping district data of Beijing and overlay it with the point data of two roast duck brand stores for analysis. The results show that municipal commercial centers have been formed with Xicheng District and Chaoyang District as the core, and the map shows that all the chain stores in Quanjude and Bianyifang are distributed in the areas with high or higher values of core density in the business district. As Quanjude and Bianyifang are well-known brands of roast duck in China, distributing them in commercial areas is good for both brand awareness and increasing benefits while meeting the flow of people. Quanjude and Bianyifang have a high reputation and also have slightly higher prices, which shows that the location of the chain roast duck spots is highly dependent on the business district.
3.
Impact on the traffic environment
The expansion of cities and the growing urban population make the surrounding traffic conditions the primary consideration for consumers when making offline purchases, so a good traffic environment can reduce the cost of spatial distance and time for consumers. In addition, with the advent of the online consumption era, convenient transportation also provides great convenience for the logistics and distribution of offline businesses. The POI data of bus stations and subway stations in Beijing were obtained, and the point-like layers of Quanjude and Bianyifang chains were overlaid with the kernel density estimation map, and it was found that both Quanjude and Bianyifang high-density distribution areas were located in the kernel density estimation high-value areas at the nodes of subway stations and bus stations. It not only reduces the time and transportation costs for consumers to purchase goods but also breaks through the limitation of the scope of offline roast duck goods for sale, thus meeting more consumer needs.

4.3. Spatial Association Characteristics

According to the spatial analysis method proposed by Nilsson for Quanjude and Bianyifang roast duck restaurants. As shown in Figure 9, thiessen polygons were established and the attraction zones of the two types of interest points were obtained, and the z-statistics and confidence zones within the attraction zones were counted. This metric makes it possible to distinguish whether the attraction relationship between two types of points of interest is due to a concentration of economic activity within a city or business district, or whether a specific type of point tends to cluster in favor of another type of point.
The results of the multivariate spatial analysis in Table 3 show that Quanjude and Bianyifang are mutually attractive and show a significant positive correlation, with 49 offline duck stores in Beijing and 35 offline duck stores in Beijing, mainly in the old urban areas within the third ring road. The attraction performance of Quanjude to Bianyifang is more significant, almost 55% of the branches of Bianyifang duck restaurant are located in the attraction area of Quanjude duck restaurant, and the z-statistic is 4.1233, which is much larger than 1, showing a significant positive attraction. The number of stores with Quanjude in the attraction area of Bianyifang accounts for about 25% of its total, which is not as strong as the attraction of Quanjude to Bianyifang, and the z-statistic is 0.1148, although it is greater than 0, showing the attraction relationship, the attraction strength is weak. There is a slight asymmetry in attractiveness between the two chains, with Quanjude having a strong market share along with a strong market power effect.
Although the Quanjude roast duck restaurant is late in development, it has developed rapidly, not only continuously innovating its dishes, with a series of dishes represented by the whole duck banquet, innovative banquet, and celebrity banquet, but also pushing out new flavors. In recent years, Quanjude has continuously taken advantage of its brand, combined with modern means such as express delivery, courier and cold chain transportation, to develop an online business, consolidating the consumer base, strengthening corporate publicity, and not only occupying more market share but also dominating the market. In comparison, although the development history of Bianyifang Duck Restaurant is longer, the implementation of corporate culture is not enough, resulting in brand awareness being improved, but the two enterprises have similar consumer groups, so both want to increase market share and market power can attract more consumer groups through corporate clustering to fundamentally increase potential revenue. There is a difference between Quanjude and Bianyifang in terms of attracting people. Quanjude has a high reputation, and in order to meet the demand of most tourists to experience, it needs to set up more stores in the attractions with a more mobile population, and these tourists are also potential customers of Bianyifang, so there are more than half of Bianyifang stores distributed in the attraction area of Quanjude. However, Bianyifang as a restaurant offering a traditional casserole roast duck in Beijing, the price is favorable, the taste is authentic, and it is loved by Beijing residents, needs to be part of the stores distributed in areas with a large residential population, such as Daxing District and Tongzhou District densely populated streets, but this part of the region there are less potential customers of Quanjude, so there is a low proportion of Bianyifang attracting areas to attract Quanjude stores, which is related to the target population and corporate positioning of the enterprise.

5. The Impact of Spatial and Temporal Pattern Study of Roast Duck Stores on Sustainable Urban Development

5.1. The Role of Spatial Pattern Research for Sustainable Urban Development

In the context of big data, regional food culture is undergoing this process of food culture chain reshaping, driven by urban transportation and the Internet. As a typical representative of Chinese traditional food culture, roast duck restaurants are one of the many food and beverage businesses in the city. The spatial pattern research methods such as kernel density estimation, standard deviation ellipse analysis, and mean nearest neighbor analysis used in this paper are not only applicable to roast duck stores, but also to any industry in the city, and this paper chooses roast duck food culture as the research object, aiming to enrich the research cases of Chinese traditional food culture. Any industry in the city does not exist as an independent economic factor, but conforms to the principle of regional wholeness, and each economic factor influences and interacts with each other, thus jointly promoting the development of the city. In terms of practical significance, studying the spatial pattern of points of interest is, firstly, conducive to urban industrial linkage. With a clear understanding of the geographical location of industrial clusters, the development of related industries near industrial clusters can be promoted. Taking the roast duck store cluster as an example, the development of derivative industries such as breeding, logistics, and food soup processing can be promoted to optimize the urban industrial structure. Second, it can optimize the distribution of jobs. Increasing family income is the urgent need of every family, and mapping the spatial pattern of POI is conducive to the reasonable distribution of jobs, which is beneficial to industrial development and also helps to solve urban livelihood problems. Spatial diffusion analysis for points of interest can predict the future development trend of industries and combine it with the results of future spatial planning of the city, the reasonable layout and management of industrial micro-sites, which is conducive to assisting urban management as well as achieving sustainable development of the city.

5.2. The Significance of Spatial Association Analysis of Chain Stores for Urban Spatial Structure Optimization

A city with a beautiful environment is not only the result of architectural design, but also the result of urban economy, urban management, and benign urban operation. Although the objects of this study are two well-known roast duck chains in Beijing, looking at the whole city, the spatial association feature approach has methodological universality for all chains. The competitive relationship between intra-city chains, as successful representatives of urban industrial diffusion, is a key concern for scholars. The spatial association feature analysis method used in this paper can analyze the spatial attraction relationship between chain stores in a city, and understand whether two stores attract or avoid each other, which is important for the optimization of urban spatial structure. There are two kinds of spatial attraction relationship between brands, one is the mutual attraction relationship between two brands, then the more attractive brand can assist the less attractive brand in a store location. Choosing to open a branch in the vicinity of the strong attractive store can improve the success rate of the new store. The other is the relationship of avoidance, that the two brands should pay attention to avoiding competitors when choosing a site to improve the economic benefits of the brand. The location of urban industries and urban spatial expansion are mechanisms that interact with each other. If there is benign guidance, the economic factors within the city will jointly promote the optimization of urban spatial structure. It should be recognized that urban spatial planning is the expectation of urban spatial expansion, which will further influence the siting of various urban businesses, and that good siting will promote regional development, clearly seeing that this study can assist in siting, which means that the use of this study has an important role in optimizing the urban structure and promoting the urban economy.

6. Discussion

With the development of big data, the information within the city is branded with big data, and the Internet, big data, and logistics have together changed the face of traditional catering. Although on a large scale, the restaurant industry is demographically and centrally oriented, on a specific level, but with the guidance of big data, people are beginning to receive multifaceted information delivered by the Internet, thus affecting the traditional spatial distribution of the restaurant industry, resulting in commercial centers and population centers slowly giving way to logistics centers and transportation hub centers. With the development of technology, on the one hand, the widespread use of the Internet to promote the restaurant industry’s space constraints is becoming smaller. On the other hand, the convenience of transportation also makes consumers less spatially resistant, which is not only caused by information technology’s promotion of changes brought about by the choice of commercial location, but also the new era of the new restaurant business philosophy, which has led to changes in business development strategies.
Taking roast duck stores as the research object, this paper firstly analyzes the spatial distribution characteristics and diffusion pattern of roast duck stores in the country from a macroscopic perspective and then analyzes the spatial association characteristics and location selection factors of Quanjude and Bianyifang in Beijing from a microscopic perspective, which provides theoretical and practical reference and reference significance for the study of the development of roast duck catering and the spatial relationship of chain stores. Based on previous studies, there are unique innovations and research significance. Most of the current studies on spatial diffusion start from time segmentation and study the stages of human–land relationship development based on the law of territorial development. This paper updates the research perspective of spatial diffusion patterns and takes the second law of geography as a guide to analyze the three major regions of China, namely, West, Central, and East, to explore the heterogeneity of spatial diffusion patterns in different regions. When exploring the diffusion pattern of roast duck stores in mainland China, the method of point clustering was used to measure the distance relationship between the clustering centers of new stores and the clustering centers of already opened stores, enriching the research method of spatial diffusion pattern of points of interest. When analyzing the spatial association characteristics of chain stores, the application of the multivariate spatial statistics method proposed by Nilsson scholars in 2016 to the restaurant industry in mainland China is tested. This method is not currently applied to the study of traditional restaurant chains in China, and this paper updates the research method on the spatial relationships of chain stores and demonstrates the practicability of the method. The spatial distribution pattern of traditional Chinese dietary roast duck stores is intuitively analyzed using POI big data. The diffusion of the traditional catering business is different from that of multinational chains, which mainly expand spatially by hierarchical diffusion, while from the results of the national study, there are differences in the diffusion patterns of roast duck in three major regions of China, which provides a case reference for studying the diffusion of traditional Chinese food culture. The proliferation of roast duck stores has a strong regional dimension, mainly attracting consumers from the north and some economically developed cities in the central part of the country. Due to the cultural differences and taste preferences between the north and the south, the roast duck culture has to consider the local food preferences when considering spreading to the central and southern parts of the country in order to break through the current scope limitation of the development of roast duck culture.
Due to the limitation of data acquisition and space, the national roast duck stores are still in the development stage, and the POI data have a strong phase and timeliness. This paper only studies the momentary data of roast duck stores, traffic, and population, and will pay attention to the long-time expansion process and the pattern of roast duck store development in future research. Second, the development of Quanjude and Bianyifang, as typical representatives of roast duck stores, is also subject to certain uncertainties, and the drivers of their development are intertwined with the complex urban elements within Beijing, and future research will pay attention to the multi-faceted quantitative analysis of the drivers of spatial patterns. In addition, with the arrival of the era of big data, the sales models for Quanjude and Bianyifang are also transforming, offline business combined with online services and the O2O service terminal era. Whether these changes will have an impact on the future store location and space attraction situation also needs to be further tracked and discussed. The emergence of diversified online service platforms will further weaken the spatial resistance and change the original traditional restaurant layout model and the theory of store competition. Therefore, how the combination of online services and express logistics will affect the expansion of traditional stores and how to meet the consumption demands of community living circles and scenic spots of the mobile population is a problem to be explored in the future.

7. Conclusions

This paper takes the roast duck stores in the national mainland and the chain stores of Quanjude and Bianyifang in Beijing as the research objects. Based on the global analysis of the spatial distribution characteristics of the roast duck stores in the country, it clarifies the commonality and individuality of the chain stores of Quanjude and Bianyifang in terms of location selection and explores the spatial association characteristics of the two chain stores concerning the multivariate spatial analysis method proposed by Nilsson scholars, and the research conclusions are as follows:
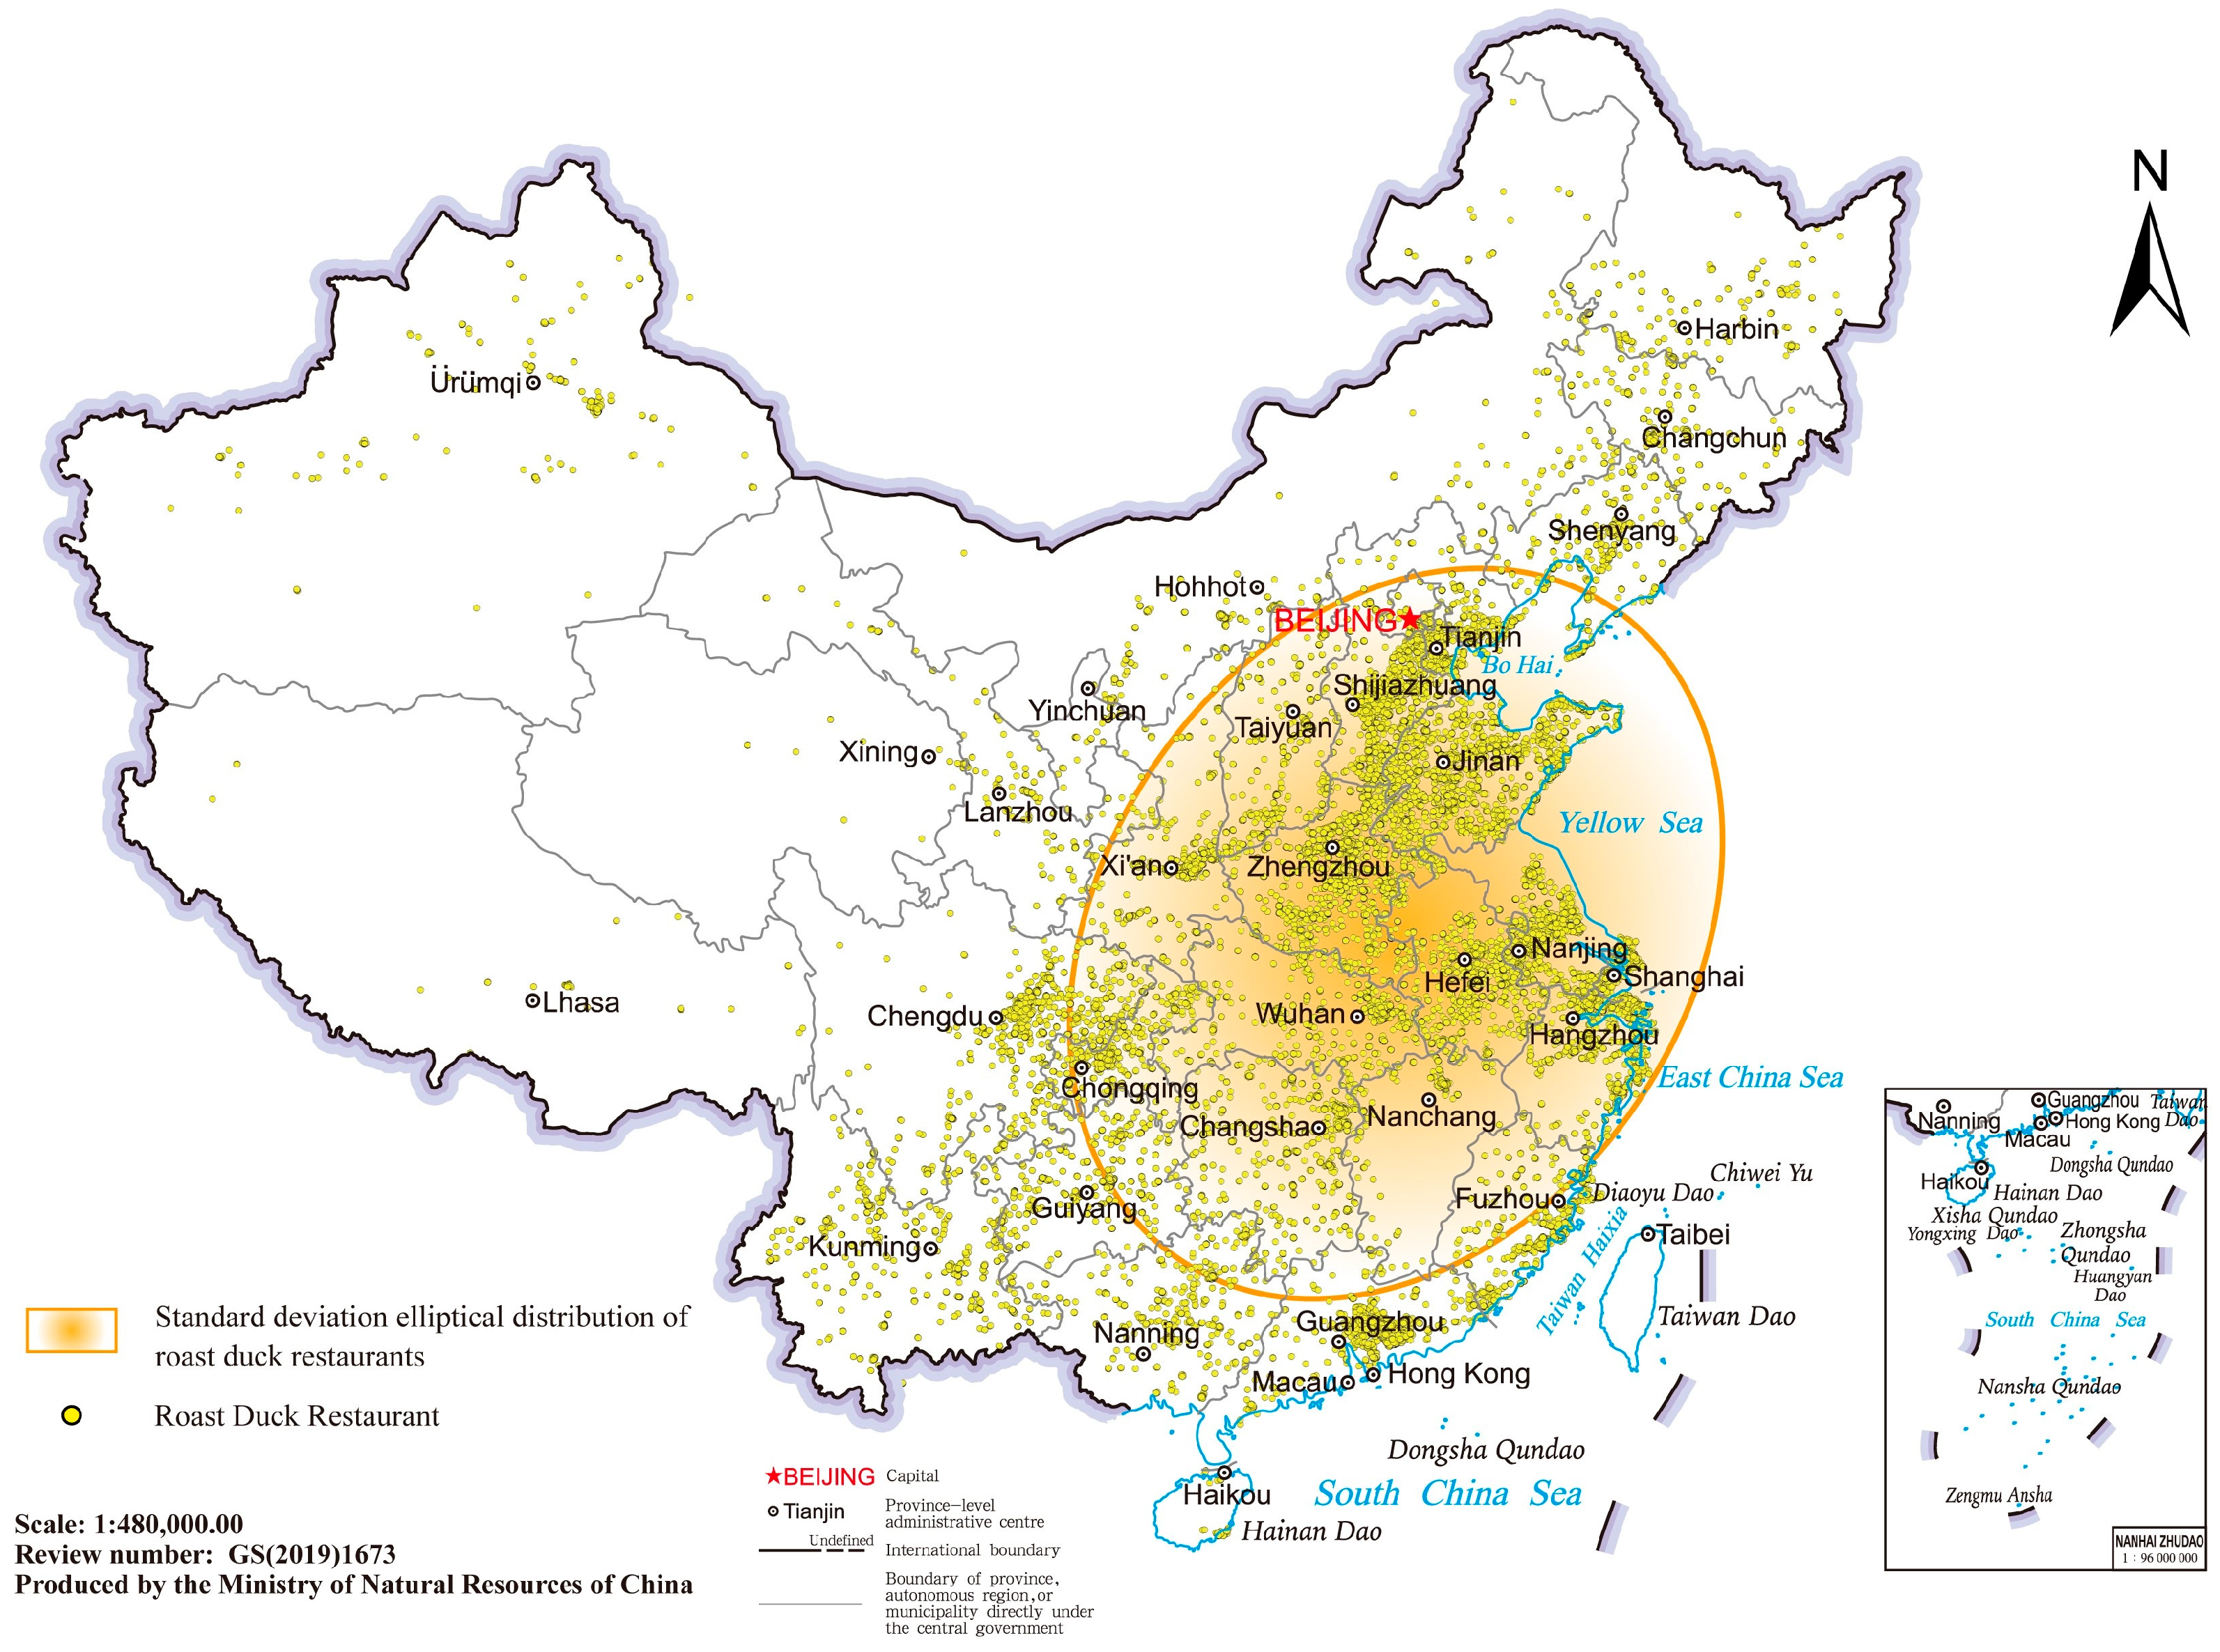
  • The spatial distribution characteristics of roast duck stores in mainland China: the spatial distribution of national roast duck stores is uneven, mainly distributed in the eastern coastal areas of China, showing obvious differences between the east and west, the high-density area of the eastern roast duck store distribution shows the characteristics of a continuous distribution, the spatial distribution trend of roast duck stores show a northeast-southwest direction, and from the Bohai Bay economic circle, the Yangtze River Delta economic circle, gradually westward to the middle radiation. The results of the global analysis of the spatial proximity index show that the national duck stores have obvious clustering characteristics, showing the clustering characteristics of multiple “points + surfaces”.
  • The spatial diffusion pattern of roast duck stores in mainland China: The spatial diffusion of roast duck stores in mainland China is characterized by a combination of contact diffusion, hierarchical diffusion, and jump diffusion, and shows obvious characteristics of source places, starting from source places for contact diffusion and gradually moving to economically developed sub-centers for hierarchical diffusion, and jump diffusion is the key choice of roast duck stores under strong market competition. The results show that in the eastern region of China, with better economic development and higher local recognition of the roast duck restaurant business, contact diffusion is the main diffusion mode of roast duck stores. The central region of China, which bears east and west, is influenced by natural factors, and jump diffusion combined with contact diffusion becomes the main diffusion mode of urban clusters in central China. In the western region of China, the economy is underdeveloped, and the roast duck stores are consumption-oriented commercial service stores. In order to obtain more economic benefits, the roast duck stores are diffused in the provincial capitals with better economic development, and contact diffusion combined with rank diffusion becomes the main diffusion mode of roast duck stores in the northwest region of China. Taken together, the roast duck stores on the mainland show a composite proliferation.
  • Analysis of the spatial pattern and drivers of chain stores: The spatial distributions of both Quanjude and Bianyifang duck stores at the city scale have a clear central orientation, with the main opening areas located within the third ring road of Beijing, but there are still differences in the clustering of the two brands. The Bianyifang chain stores have smaller gathering centers, but the trend of north-south diffusion is obvious, and the diffusion range is wider. The hot spot area of Quanjude roast duck restaurant is bigger, but the diffusion range is smaller, and the demand for city center location is stronger. There are also similarities and differences in the intrinsic driving mechanisms of the spatial distribution of the two brands, with both Quanjude and Bianyifang having a significant dependence on transportation facilities and business environments, and Quanjude having a stronger preference for business centers. The demographic data of the streets have a different impact on the location of the two brands’ stores, which is related to the target population and positioning of the two companies. Quanjude stores mainly focus on sentimental consumption and scene consumption, and the company takes scenic tourists and high-income people as its target customers. Bianyifang is cheaply priced and loved by residents, and the location of the store is also considered to be in the community’s crowded area when laying out.
  • Spatial correlation characteristics of Quanjude and Bianyifang: Quanjude and Bianyifang show the spatial correlation of mutual attraction, but there is a weak asymmetry in the strength of attraction. The same types of offline restaurants do not avoid each other when opening stores, the already opened stores have occupied the current consumer market, and the chain stores that enter the market later can be close to enjoying the current location bonus to reduce the risk of poor decision making. The statistical results show that Quanjude has a stronger attraction to Bianyifang, which is related to the consumer group of the enterprise. Quanjude mainly defines the consumer group as the mobile people who admire the experience, which is also one of the target groups of Bianyifang as a famous roast duck restaurant. Moreover, Bianyifang will also take part of the residential gathering area as the potential consumer area. Bianyifang’s more affordable price and having higher local recognition can make up for the disadvantage of its brand promotion to a certain extent.

Author Contributions

The idea is the result of the joint efforts of all co-authors within the framework of the cooperation between the School of Earth Science and Engineering of Hebei University of Engineering and the Engineering Technology Research Center for Smart Cities and IOT Facilities in Yantai, Shandong, China. Formal analysis, Y.Y.; Investigation, X.L.; Methodology, K.Z.; Software, K.Z.; Visualization, K.Z.; Writing—original draft, K.Z.; Writing—review & editing, Y.Q. All authors have read and agreed to the published version of the manuscript.

Funding

This research was funded by Hebei Natural Science Foundation, grant number D2021402006. And this work was supported by a grant from State Key Laboratory of Resources and Environmental Information System, China (Analysis on the spatial pattern and influencing factors of tourism agriculture in Beijing, Tianjin and Hebei based on big data).

Institutional Review Board Statement

No human or animal studies were involved in this study.

Informed Consent Statement

Informed consent was obtained from all subjects involved in the study.

Data Availability Statement

Not applicable.

Acknowledgments

We sincerely thank the Natural Science Foundation of Hebei Province (No. D2021402006) for supporting the research, and YanJunYe from the School of Earth Science and Engineering of Hebei University of Engineering for providing important ideas and guidance for the writing of this paper.

Conflicts of Interest

The authors declare that they have no known competing financial interests or personal relationships that could have appeared to influence the work reported in this paper.

References

  1. Fang, J.J.; Yuan, T.K. Space, Food and Social Transition: Skeletons of Theoretical Evolution. J. Northwest Minzu Univ. (Philos. Soc. Sci.) 2018, 2, 51–61. [Google Scholar]
  2. Zeng, G.J.; Wang, L.J. Sustainable food system: Review and research framework. Geograph. Res. 2019, 38, 2068–2084. [Google Scholar]
  3. Tian, H.M. A brief discussion on the emerging discipline—Dietetic geography. Hum. Geogr. 1993, 8, 1. [Google Scholar]
  4. Neal, Z.P. Culinary deserts, gastronomic oases: A classification of US cities. Urban Stud. 2006, 43, 1–21. [Google Scholar] [CrossRef]
  5. Ye, Y.; Li, D.; Liu, X. How block density and typology affect urban vitality: An exploratory analysis in Shenzhen, China. Urban Geograph. 2017, 39, 631–652. [Google Scholar] [CrossRef]
  6. Zhang, Y.J.; Xiong, T.X.; Han, H.Q. Study on spatial distribution characteristicsof catering in GuiYang city based on GIS. Yunnan Geograph. Environ. Res. 2020, 32, 17–27. [Google Scholar]
  7. Tang, J.Y.; He, Y.J.; Ta, N. Spatial Distribution Patterns and Factors Influencing the Shanghai Catering IndustryBased on POI Data. Trop. Geograph. 2020, 40, 1015–1025. [Google Scholar]
  8. Zhang, H.P.; Zhou, X.X.; Tang, G.A.; Zhou, L.; Ye, X.Y. Hotspot discovery and its spatial pattern analysis for catering ser-vice in cities based on field model in GIS. Geograph. Res. 2020, 39, 354–369. [Google Scholar]
  9. Shu, S.Y.; Wang, R.; Sun, Y.W.; Liu, J.; Xiao, L.S. Spatial Distribution of Urban Catering Industry and Its Influenced Factors: A Case Study of Xiamen City. Trop. Geograph. 2012, 32, 134–140. [Google Scholar]
  10. Luo, Z.Z.; Zhang, Y.Z. Analysis on spatial vitality layout of ChengDu city based on POI big data. Ind. Constr. 2021, 51, 53–61. [Google Scholar]
  11. Lei, Y.; Xu, P.W. The Classification, Spatial Pattern and Consumer’s Network Evaluation of Time-honored Catering Brands in Beijing. Mod. Urban Res. 2017, 2, 68–75. [Google Scholar]
  12. Liu, H.N.; Zhen, Y.Y. Research on the Spatial Layout and Influencing Factors of Hangzhou Catering Facilities Based on POI. Archit. Cult. 2020, 7, 49–50. [Google Scholar]
  13. Liu, R.K.; Li, J.Q. Spatial Distribution Characteristics and Influencing Factors of Physical Bookstores in Xi’an City: Based on DBSCAN Algorithm. Econ. Geogr. 2021, 41, 87–96. [Google Scholar]
  14. Ripley, B.D. Modelling Spatial Patterns. J. R. Stat. Soc. B 1977, 39, 171–192. [Google Scholar] [CrossRef]
  15. Zeng, K.Y. Study on the Spatial Pattern and Influencing Factors of Catering Industry in the Main District of Changchun Based on Web of Comments. Master’s Thesis, Northeast Normal University, Changchun, China, 2019. [Google Scholar]
  16. Gao, S. Research on Location Selection of Hot Pot Chain Stores Based on Data Mining. Master’s Thesis, Wuhan University of Technology, Wuhan, China, 2019. [Google Scholar]
  17. Hgerstrand, T. The propagation of innovation waves. In Readings in Cultural Geography; Wagner, P.L., Marvin, W., Mikesell, M.W., Eds.; University of Chicago Press: Chicago, IL, USA, 1962; pp. 355–368. [Google Scholar]
  18. Littmann, T.; Veste, M. Modelling Spatial Patterns of Vegetation in Desert Sand Dunes. For. Stud. China 2005, 4, 24–28. [Google Scholar] [CrossRef]
  19. Graff, T.; Ashton, D. Spatial Diffusion of Wal-Mart: Contagious and Reverse Hierarchical Elements. Prof. Geogr. 2010, 46, 19–29. [Google Scholar] [CrossRef]
  20. Holmes, T.J. The Diffusion of Wal-Mart and Economies of Density. Econometrica 2011, 79, 253–302. [Google Scholar]
  21. Zhu, B.Y.; Song, Y.X.; Li, G.Z. Expansion characteristics and spatial of chinese loacal chain supermarkets: A Case study of YongHui supermarket. Hum. Geogr. 2016, 31, 80–86+152. [Google Scholar]
  22. Ding, T.; Yang, Y.M. Walmart’s expansion in Chinese market: Mode, process and strategy change. Chin. Retail. Res. 2010, 2, 51–64. [Google Scholar]
  23. Li, X.J.; Wang, H. Locational evolutionin expansion of large companies. Areal Re. Dev. 2000, 1, 1–4, 12. [Google Scholar]
  24. Lei, J.R.; Wang, X.W.; Zhang, H.W.; Huang, C.C. Spatial diffusion and mechanism of multinational chain catering enter-prises. World Reg. Stud. 2018, 27, 93–104. [Google Scholar]
  25. Zeng, G.J.; Lu, R.R. Spatial expansion mode and its influencing factors ofStarbucks in mainland of China. Geograph. Res. 2017, 36, 188–202. [Google Scholar]
  26. Liu, X.D.; Liu, Y.S.; Chen, C.Z. Space Expansion and Competition Mechanism Innovation of ChainRetailers in the Age of Digital Economy. China Ind. Econ. 2019, 5, 80–98. [Google Scholar]
  27. Hotelling, H. Stability in Competition. Econ. J. 1929, 39, 41–57. [Google Scholar] [CrossRef]
  28. Reilly, W.J. Method for the Study of Retail Relationships; University of Texas: Austin, TX, USA, 1929. [Google Scholar]
  29. Hhff, D.L. Defining and Estimating a Trading Area. J. Mark. 1964, 28, 34–38. [Google Scholar] [CrossRef]
  30. Nilsson, I.M.; Smirnov, O.A. Clustering vs. relative location: Measuring spatial interaction between retail outlets. Pap. Reg. Sci. 2016, 96, 721–741. [Google Scholar] [CrossRef]
  31. Nilsson, I.M.; Smirnov, O.A. Limited Location Options: Measuring Spatial Interactions among Retailers Under Zoning Restrictions. Geogr. Anal. 2017, 50, 358–377. [Google Scholar] [CrossRef]
  32. Konishi, H. Concentration of competing retail stores. J. Urban Econ. 2005, 58, 488–512. [Google Scholar] [CrossRef] [Green Version]
  33. Aguirregabiria, V.; Vicentini, G. Dynamic Spatial Competition Between Multi-Store Retailers. J. Ind. Econ. 2016, 64, 710–754. [Google Scholar] [CrossRef]
  34. Murry, C.; Zhou, Y. Consumer Search and Automobile Dealer Co-Location. Manag. Sci. 2019, 66, 1909–1934. [Google Scholar] [CrossRef]
  35. Krider, R.E.; Putler, D.S. Which Birds of a Feather Flock Together? Clustering and Avoidance Patterns of Similar Retail Outlets. Geogr. Anal. 2013, 45, 123–149. [Google Scholar] [CrossRef]
  36. Yin, T.K. Analysis of the geographical factors of the differentiation of Chinese food culture. J. Taiyuan Urban Vocat. Coll. 2013, 5, 76–77. [Google Scholar]
  37. Zhao, J.M. Beijing Braised Duck and “Mo Zhi” in Han Dynasty. J. Res. Diet. Sci. Cult. 2013, 30, 11–13. [Google Scholar]
  38. Yang, N.Y. Beijing’s history of roast duck from Bianyifang. China Anim. Ind. 2017, 11, 87–89. [Google Scholar]
  39. Xing, Y.; Guan, W. Tradition and modernity of Quanjude commercial culture. Commer. Cult. Boutique Libr. 2001, 6, 199–211. [Google Scholar]
  40. Li, J.C.; Cheng, K.M. Grade diffusion or contagion diffusion—The expansion of gome chain stores and wal-mart comparison. Financ. Trade Econ. 2008, 3, 104–109. [Google Scholar]
  41. Zhu, B.Y.; Song, Y.X.; Li, G.Z.; Yu, T.T. Spatial Aggregation Pattern and Influencing Factors of “Taobao Village” in China Under the C2C E-commerce Mode. Econ. Geogr. 2016, 36, 92–98. [Google Scholar]
  42. Wang, F.; Lin, Y.X.; Wang, M.F. “Third space” or “infinite occasion”: Location choice and influencing factors of the new retail industry. Prog. Geog. 2020, 39, 1522–1531. [Google Scholar] [CrossRef]
Figure 1. Example diagram of multiple spatial point patterns. There are six types of mutual attraction relationships between two types of points, (a,b,e) shows the positive interaction association characteristics of points, (c,d,f) shows the negative interaction. (a) Asymmetric category association (Attraction); (b) Positive symmetric category association (Attraction); (c) Joint Population Clustering (Avoidance); (d) Negative correlation (circumvention); (e) Positive correlations of different scales (Attraction; (f) Extremely negative association (Avoidance).
Sustainability 14 08554 g001aSustainability 14 08554 g001b
Figure 2. Map of the distribution of the number of roast duck restaurants in mainland China. Considering the need to clearly show the distribution of roast duck restaurants in municipal units according to the quartile method, the number of roast duck restaurants in the first rank city is within the range of 698–2877, and the number of roast duck restaurants in the second rank city is within the range of 318–697, the number of roast duck restaurants in the third rank is within the range of 122–317, and the number of roast duck restaurants in the fourth rank is within the range of 1–121.
Sustainability 14 08554 g002
Figure 3. Standard deviation ellipse analysis of roast duck stores in mainland China. The center of gravity of the standard deviation ellipse is distributed in the central plain cities of China, and obvious differences in the distribution of POI of roast duck stores are observed. The ellipse is distributed in eastern China, and the long axis shows a northeast-southwest direction, and the spatial distribution pattern is still dominated by the south-north direction, and the influence of the east-west direction is weaker.
Sustainability 14 08554 g003
Figure 4. High and low clustering analysis of roast duck stores. By using Getis-Ord Gi* statistical analysis method, we analyzed the hot spot distribution area and cold spot distribution area of roast duck stores to explore the spatial clustering of roast duck stores.
Sustainability 14 08554 g004
Figure 5. Point cluster analysis graph of roast duck stores. Point clustering is performed on the roast duck stores in mainland China up to October 2020 to form the red layer in the figure. The location data of roast duck stores in mainland China up to June 2022 were obtained and the new roast duck stores in this period were filtered by symmetrical difference, and the same point clustering was performed for the new stores to form the blue layer. The numbers in the blue and red dotted cluster centers indicate the number of surrounding duck stores included in that cluster center. For ease of observation, three regions are intercepted from East, Central, and West China to facilitate the observation of the economic phenomenon of roast duck expansion within the region.
Sustainability 14 08554 g005
Figure 6. Pie chart of spatial distribution of roast duck chain stores and non-chain stores by province in China. The distribution of roast duck chain stores nationwide was filtered out by classifying the national roast duck store data, and the number of roast duck chain stores was counted on the municipal scale and visualized in a pie chart, and the results indicated that Beijing was the city with the largest number of roast duck chain stores, laying the foundation for exploring the spatial characteristics and association characteristics of chain stores in Beijing.
Sustainability 14 08554 g006
Figure 7. Analysis of the spatial distribution characteristics of Quanjude and Bianyifang. Through kernel density estimation, both Quanjude and Bianyifang appear to have a single high-value center. The spread of Quanjude roast duck chain stores in Beijing is small, but the agglomeration is very strong and there is a clear central direction, while Bianyifang has a weak agglomeration, but the trend of north-south spread is obvious. (a) Quanjude roast duck stores kernel density estimation distribution map; (b) Bianyifang roast duck kernel density estimation distribution map; (c) Standard deviation ellipse of Quanjude; (d) Standard deviation ellipse of Bianyifang.
Sustainability 14 08554 g007
Figure 8. Nucleus density map for each type of POI. There is a significant correlation between store layout site selection and the business district, subway station, and bus station, but not exactly according to the population density for store location, and there are differences between the distribution of the two brands. Bianyifang, as a popular brand of roast duck among residents, will choose the part of the area where residents gather for location, while Quanjude, need to be close to the higher spending power near the business district. (a) Beijing Bus Station kernel density estimation distribution map; (b) Beijing Subway Station kernel density estimation distribution map; (c) Beijing mall kernel density estimation distribution map; (d) Beijing street population density map.
Sustainability 14 08554 g008
Figure 9. Schematic diagram of Thiessen polygons (a,c) and attraction zones (b,d) of Quanjude and Bianyifang stores in Beijing. The dots in the first two columns represent the Bargain Place Duck Shop and Quanjude Duck Shop and a Thiessen polygon is constructed for each dot. The second column is to build the attraction area of the stores, connect each store with the vertices of the generated Thiessen polygon to generate multiple line segments, find the midpoint of each line segment and connect them to create the red polygon which is the attraction area of each store.
Sustainability 14 08554 g009
Table 1. Spatial analysis model and interpretation.
Name of the ModelFormulaModel ExplanationMeaningFormula Number
Kernel density estimation f ( x ) = 1 n h n i = 1 n k ( x x i h n ) n is equal to the total number of roast POI data; is the bandwidth: i.e., the search radius; and k   ( x x i / h n ) is the kernel function.The density of an element in its surrounding neighborhood can be calculated, and the larger the kernel density estimation value, the more clustered the spatial distribution.(1)
Standard deviation ellipse analysis S D E x = i = 1 n ( x i X ¯ ) 2 n
S D E y = i = 1 n ( y i Y ¯ ) 2 n
SDEx and SDEy are the axis lengths in the x-axis and y-axis directions of the standard devia-tion ellipse, respectively; xi and yi are the coordinates of the roast duck stores; { X ¯ , Y ¯ } is the mean center of the roast duck stores; and n is the total number of stores.The larger the difference between the values of the long and short half-axes (the larger the flatness), the more pronounced the directionality of the data.(2)
Average Nearest Neighbor Analysis A N N = D 0 D E D0 denotes the average observed distance between each element and the nearest neighboring element; DE denotes the expected average distance between elements in the random model.ANN > 1, then means discrete, and ANN < 1, then means aggregated.(3)
Global autocorrelation analysis I = n S 0 i = 1 n j = 1 n w i , j Z i Z j i = 1 n Z i 2 Zi is the deviation of the attribute of element i from the mean (XiX), w i , j is the spatial weight of elements i and j, n is equal to the element composite, and S0 is the aggregation of the left and right spatial weights.When the Moran’s I value is positive, there is a significant positive correlation and similar observations (high or low values) tend to be spatially clustered.
When Moran’s I value is negative, there is a significant negative correlation and similar observations tend to be distributed.
(4)
Table 2. Average Nearest Neighbor Analysis Results.
ParametersValue
Average observation distance/m936.5086
Expected average distance/m8827.9306
Nearest proximity ratio0.106085
Z score−416.849175
p values0.00000
Table 3. Multivariate spatial correlation analysis of Quanjude and Bianyifang in Beijing.
A/BQuanjudeBianyifang
Quanjude——0.5510, 4.1233 (A), (−0.1117, 0.7117)
Bianyifang0.2571, 0.1148 (A), (0.1056, 1.7565)——
The first statistic is the percentage of attracted points; the second statistic is the Z statistic; (A) indicates the “attraction relationship” (in other cases there is also an independent I or avoidance relationship R); the values in parentheses are the confidence intervals (at 5% significance level) derived from Monte Carlo simulations.
Publisher’s Note: MDPI stays neutral with regard to jurisdictional claims in published maps and institutional affiliations.

