Article

The Neuromarketing Concept in Artificial Neural Networks: A Case of Forecasting and Simulation from the Advertising Industry

by
Rizwan Raheem Ahmed
1,2,
Dalia Streimikiene
3,*,
Zahid Ali Channar
4,
Hassan Abbas Soomro
5,6,
Justas Streimikis
7,8 and
Grigorios L. Kyriakopoulos
9,*
1
Faculty of Management Sciences, Indus University, Karachi 75300, Pakistan
2
School of Business and Economics, State University of New York, Plattsburg, NY 12901, USA
3
Institute of Sport Science and Innovations, Lithuanian Sports University, Sporto g. 6, 44221 Kaunas, Lithuania
4
Department of Business Administration, Sindh Madressatul Islam University, Karachi 74000, Pakistan
5
Department of Business Administration, Sukkur IBA University, Sukkur 65200, Pakistan
6
Institute of Business Administration, Aix Marseille University, 13007 Marseille, France
7
Lithuanian Centre for Social Sciences, Institute of Economics and Rural Development, A. Vivulskio g. 4A-13, 03220 Vilnius, Lithuania
8
Faculty of Management and Finances, University of Economics and Human Science in Warsaw, Okopowa 59, 01-043 Warsaw, Poland
9
School of Electrical and Computer Engineering, National Technical University of Athens, 15780 Athens, Greece
*
Authors to whom correspondence should be addressed.
Sustainability 2022, 14(14), 8546; https://doi.org/10.3390/su14148546
Submission received: 15 June 2022 / Revised: 6 July 2022 / Accepted: 8 July 2022 / Published: 12 July 2022

Abstract

:
This research aims to examine a neural network (artificial intelligence) as an alternative model to examine the neuromarketing phenomenon. Neuromarketing is comparatively new as a technique for designing marketing strategies, especially advertising campaigns. Marketers have used a variety of different neuromarketing tools, for instance functional magnetic resonance imaging (fMRI), eye tracking, electroencephalography (EEG), steady-state probe topography (SSPT), and other expensive gadgets. Similarly, researchers have been using these devices to carry out their studies. Therefore, neuromarketing has been an expensive project for both companies and researchers. We employed 585 human responses and used the neural network (artificial intelligence) technique to examine the predictive consumer buying behavior of an effective advertisement. For this purpose, we employed two neural network applications (artificial intelligence) to examine consumer buying behavior, first taken from a 1–5 Likert scale. A second application was run to examine the predicted consumer buying behavior in light of the neuromarketing phenomenon. The findings suggest that a neural network (artificial intelligence) is a unique, cost-effective, and powerful alternative to traditional neuromarketing tools. This study has significant theoretical and practical implications for future researchers and brand managers in the service and manufacturing sectors.

1. Introduction

1.1. Neuromarketing

Neuromarketing is a newly emerging field in marketing, which measures the brain response using marketing activities through different medical devices.

1.2. Definition of Neuromarketing

Neuromarketing makes marketing processes more effective by measuring the response to marketing stimuli using various brain imaging and eye-tracking methods without resorting to consumer statements [1,2]. It measures and digitizes mental state, changes, first effect, level of attention, the level of recall of a message, and the nature of the emotions aroused by a given stimulus [3]. An example of these parameters measures a consumer’s attention paid to shelves during shopping, what consumers are afraid of, what they like, and what part of the visible ad or image remains in their mind [4].

1.3. The Birth of the Neuromarketing Concept

It is known that neuromarketing is a meaningful research technique after the start of neuroscience research. Neuroscience includes the brain’s functioning and the research that determines what is happening [5]. In order to obtain information about the functioning of the human brain in the 1800s, some studies were carried out on animals [6]. Then, the attention of scientists was attracted when an American railroad worker experienced an unusual accident [1]. This railroad worker, who lost a part of his brain in the incident, but managed to survive, demonstrated a change in character after a while, and the observations regarding this episode are thought to have contributed significantly to neuroscience studies [7,8]. Neuroscience studies improved and contributed to different research studies with the help of instruments that could measure various brain functions in the 1900s [4,9]. New marketing terminologies have been implemented by taking advantage of the technology age with the inadequacy of quantitative research methods used in marketing research to measure what goes through a consumer’s mind [10]. It is known that the history of neuromarketing research began with James Vicary, a marketing researcher, in 1957 in a movie theater in New Jersey, adding a mechanical slide to the projection for a single frame [11,12]. Sales of popcorn and Coca-Cola began to rise when he displayed the message “Eat popcorn” and “Drink Coca-Cola” [11,13]. At an international conference in 1990, Gerald Zaltman explained that he was using the fMRI device in marketing research, and the basis for neuromarketing was laid [4,14]. Meanwhile, Ale Smidts asked “can we use the science of neurology to understand people better and provide consumers with better solutions to their problems?” [9,15].
The concept of neuromarketing, a combination of the science of neurology and marketing, has emerged (Url-1) [16,17]. Several researchers established the basics of neuromarketing with the method of “selling to the old brain” within the scope of the studies initiated by conducting detailed research on sales, marketing, and neuroscience [18,19]. Products and services that require more than one decision in the market make people’s decision-making process difficult. Marketers aim to simplify and accelerate purchasing to make their products and services preferable [4,15]. For this reason, it is necessary to act according to customers’ minds to reach the company’s goal. Neuromarketing has arisen to answer these questions [20,21]. Some examples have been given to refer to the birth and development process of neuromarketing techniques: in 1991, Paul Lauterbur and Peter Mansfield in the United States conducted some research using imaging techniques financed by Coca-Cola, L-mart, Levi-Strauss, and Ford [13]. Regarding a more recent product, P&G’s success in the market with Febreze was achieved by utilizing research on neuromarketing [22]. Motorola has used the product placement technique and has contributed to neuromarketing findings [23]. Neuromarketing efforts were increased by 9 percent to 40 percent by using Buick company officials to increase the experience of their employees outside the field. In light of the importance of the customer experience, which is the output of this research, an increase in success was achieved by Delta Airlines [1,24]. The video game manufacturer THQ’s neuromarketing tests obtained from customer experience using the program design work have been a great success (Url-2) [22,25].

1.4. Importance of Neuromarketing

According to the quotation of John Wanamaker (1838–1922), “Half of the money I spend on advertising is wasted. The problem is, I do not know which half is wasted” [26,27]. It is one of the compelling statements that put forward the necessity of neuromarketing. Neuromarketing has emerged to allow the donor to predict the work that is intended to work [28,29]. We call a concept in the economy “Rational Human” [30,31]. It is expressed as if they were making decisions rationally; however, imperative research has exhibited that humans usually make emotional rather than rational decisions [17,32]. For example, we decide to buy something. We will not pay the four-digit price for a specific item like a shoe. Neuromarketing, therefore, deals with this emotional side of the brain (Url-3) [20,33]. Neuromarketing studies, in which brainwaves are measured, point to a new era in the shopping experience. Because academic studies show that what consumers say in focus groups may not always reflect the truth [10,34], consumers cannot express their subconscious reactions at the level of consciousness that they are unaware of [3,35]. On the other hand, the consumers’ first encounter with the product, i.e., the first look at the product to determine its effectiveness, also demonstrates the importance of change management in packaging design [15,36]. Neuromarketing is used to understand the antecedents responsible for the consumer’s inclination and reconstruct a similar connotation [37]. This emerging marketing field utilizes medical devices to examine the brain’s response toward the brand [38]. These medical devices explain how and which part of the brain is responsible for a particular movement, choice, decision making, and buying behavior [39,40].

1.5. Background, Justification, and Purpose of the Study

The concept of neuromarketing, a combination of the science of neurology and marketing, has emerged [16,17]. Crespo-Pereira et al. [18] and Renvoise and Morin [19] established the basics of neuromarketing with the method of “Selling to the old brain” within the scope of the studies initiated by conducting detailed research on sales, marketing, and neuroscience. Products and services that require more than one demand in the market make people’s decision-making process difficult. Marketers aim to simplify and accelerate purchasing to make their products and services preferable [4,15]. For this reason, it is necessary to act according to the customers’ minds to reach the company’s goal. Neuromarketing has arisen to answer these questions [20,21]. However, on the contrary, artificial neural networks have several superior properties compared to other systems. These are non-linearity, ability to learn from examples, generalization, adaptability, data distributed unified memory structure, parallel processing feature, debugging capability, easy to obtain hardware, fast calculation, analysis, design ease, and availability of ready-made package programs [41,42]. It is possible to count many advantages of artificial neural networks compared to the medical testing tools of neuromarketing such as positron emission tomography (PET), functional magnetic resonance imaging (fMRI), electroencephalography (EEG), steady-state probe topography (SSPT), eye-tracking, transcranial magnetic stimulation (TMS), and several other techniques and tests to gauge the decision making factors of the human brain. The artificial neural network method can produce more consistent results in proportion to the increase in the input data quantity [19,43]. Artificial neural networks have been studied comparatively in many studies with other methods. As a result, it has been observed to produce highly consistent and reliable results, especially in non-fixed and discrete data series [16,44]. This research examines the neural network (artificial intelligence) as an alternative model to examine the neuromarketing phenomenon. Neuromarketing is comparatively new for designing marketing strategies, especially for advertising campaigns. The findings suggested that a neural network (artificial intelligence) is a unique, cost-effective, and powerful alternative to traditional neuromarketing tools. The study has significant theoretical and practical implications for future researchers and brand managers of the services and manufacturing sectors.

2. Review of Literature

2.1. Neuromarketing and Human Decision-Making

Neuromarketing has provided the concept of individual decision-making due to unexplained factors of human decision-making factors. These factors cannot be examined by the naked eye; researchers use several medical tests and techniques to measure the human brain’s activity during decision-making.

2.2. Neuromarketing Main Tools

To clarify the concept of neuromarketing, it is helpful to know what brain scanning methods are used in neuromarketing [38]. In addition, biometric measurements should support neuromeric measurements to determine the specific meaning of emotional data [1,36]. The methods used in this concept are:

2.2.1. Positron Emission Tomography (PET)

Positron emission tomography is a high-level imaging technique using radioactive material and a particular type of camera [41]. Primarily, the PET device is used in nuclear medicine investigation in which experts identify the cancer cells through the PET device [42]. Through PET measurements, detailed information about the tumor presence could be detected via scanning [8].

2.2.2. Functional Magnetic Resonance Imaging (fMRI)

The FMRI method is used to determine what they react to when studying consumers’ behavior in neuromarketing. This technique is most commonly used in neuromarketing [34,43]. With this device, different stimuli are shown in the experiment, and it is determined which areas of the brain become active over time; and a brain scan is performed with a map showing their degrees [44,45]. Employing the FMRI device, the emotions generated by the stimulant in the consumer are determined by looking at the regions of the brain that are responsible for emotions such as reward, pleasure, and anxiety [14]. The fMRI technique provides more detailed data than the EEG device [29,46].

2.2.3. Electroencephalography (EEG)

EEG is an evaluation of the electrical activity of the brain. With this method, electrical signals from certain brain parts are passed through various formulations through mathematical values, giving us levels of attention, motivation, emotional attention, cognitive workload, and meditation [30]. Delta, theta, alpha, beta, and gamma waves correspond to emotions such as excitement, attention, fear, and dislike through electrical waves emitted from the lobe of the brain [47]. The change in brain waves obtained in the face of any stimulus is recorded on the computer. The experts then conclude the subjects’ emotional responses to the marketing stimulus [28].

2.2.4. Steady-State Probe Topography (SSPT)

SPTT technique, which was used in clinical cases in the first years of its use, began to be used in this field using brain imaging methods in neuromarketing [5]. It is a more advanced version of the EEG technique. The disadvantage of this method is that the device’s resolution in 3D imaging is low. The SSPT device identifies which side of the human brain is predominantly used [41].

2.2.5. Eye-Tracking

Eye-tracking is one of the most widely used techniques in the neuromarketing field. Eye-tracking is a device that spots where the consumer’s eyes concentrate on a stimulus or object [33]. In the eye-tracking device, the movement of the pupil, reduction, and enlargement levels are recorded. During eye-tracking experiments, pupils are measured through an infrared beam with a rate of 60 HTZ [32]. The movement of the human eye is both voluntary and involuntary movements. However, most eye movements are not controllable. The eye-tracking device is preferably used in marketing research due to its low cost. It examines where the human eye focuses, whether on packaging, features, or brand advertising [23].

2.2.6. Magnetoencephalography (MEG)

A MEG device has three dimensions, and its time-dependent resolution is very high. Therefore, it is one of the best imaging methods. It is not used frequently in neuromarketing research because of its high cost [4]. Thanks to this technology, we can read tiny electrical currents between brain cells. The MEG device is more advantageous in features and more valuable; however, because of the high research costs, this method is preferable in neuromarketing due to the outcomes [23,41].

2.2.7. Transcranial Magnetic Stimulation (TMS)

The TMS usually generates a magnetic field using an iron core, which can generate electrical currents in the underlying neurons when placed on the head [48]. The transcranial magnetic stimulation measures the causal role of temporarily detached parts of the deactivating brain regions [4].

2.2.8. Facial Action Coding System (FACS)

Thanks to the system developed by Ekman-Friese Davidson (FACS), it is possible to detect the emotions experienced by people by using the FACS in several videos of their facial expressions [35]. The system is based on 43 individual facial muscles that can produce thousands of different facial expressions by taking the combined movement of those 43 individuals. In many cases, this test must allow emotions or emotional expressions to flow out of sight too quickly [18].

2.2.9. Galvanic Skin Response (GSR)

Galvanic skin response is a technique that measures the effect rate (in an affective or emotional sense) against stimuli received from the nervous system [4,24]. The GSR techniques are used in marketing research to gauge the websites and advertisement responses [25]. With the advantages of being cheap, easy, and portable, galvanic skin conductivity is sometimes used to support neuromarketing research techniques. With this device attached, it can move, sit up and lift as desired during the experiment, and the data can be recorded [22,49].

2.2.10. Implicit Association Test (IAT)

The implicit association test (IAT) is one of the most widely used tests in the study of social psychology [26]. This test assumes that like-minded people’s brains involuntarily evoke each other [4].

2.3. Examples of Neuromarketing Applications

It is known that most of the global neuromarketing companies, which promise to provide neuromarketing solutions to commercial marketing problems, are located in the United States and Europe, and universities serve under the name of consumer behavior of neurosciences [23,40]. It is also known that the most comprehensive research among neuromarketing researchers is conducted by Martin Lindstrom, a Danish marketing researcher, on cigarette smokers [25]. The survey started in 2004 and lasted approximately three and a half years. At the Neuroimaging Science Center in London, Lindstrom investigated 32 cigarette smokers from the United States, England, Germany, Japan, and China and, with the help of fMRI technology, why health warnings on the cigarette pack affect smokers. As a result of the study, it was concluded that the warning messages on the front, back, and side of the cigarette pack did not affect the desire of smokers to smoke [22,50]. Montague conducted another study at Houston Baylor Medical School in 2013. The preference rates and reasons for Pepsi and Coca-Cola were investigated on 67 subjects, and the neuromarketing research revealed that the brain’s rational and emotional regions were in conflict, and Coca-Cola was preferred by the subjects [15,16,51].

2.4. Artificial Neural Networks

2.4.1. Definition of Artificial Neural Networks

An artificial neural network (ANN) consists of an organization inspired by the working principle of the human brain, working in parallel with each other, sending information to and receiving information from each other [52,53]. The work elements (artificial nerve cells) used for problem-solving are connected as a network. The information flows between cells is shown by connection values and relationships. The system’s learning ability and intelligent behavior are achieved by using connection values [54,55,56]. Scientists examined the neuro-physical structure of the brain-inspired by the characteristics of the human brain, and tried to extract the mathematical model [57,58]. Thus, they have developed many artificial cells and network models based on ideas of physical elements, which must be modeled under brain activity behavior. As a result, a different field of science has emerged, called artificial neural networks, which performs different operations from standard computers [52,59]. The multilayer network function of perception can be written as Equation (1) as follows:
Out ( x ) = g ( w T x ) = g ( j w j x j )

2.4.2. General Characteristics of Artificial Neural Networks

The properties of artificial neural networks vary according to the network model and algorithms used, but can be listed in general [57,60].
  • Artificial neural networks perform machine learning.
  • There is an information processing method utterly different from the methods in which traditional programming and artificial intelligence are applied [61].
  • Fault-tolerant; the ability to work with incomplete information allows them to tolerate errors. If some network cells become corrupted and fail to work, the network will continue to run. Traditional computers usually require complete data [62].
  • Can work with incomplete information; after being trained, artificial neural networks can produce results even with incomplete information in the new samples, while traditional systems cannot work with incomplete information [63].
  • The artificial neural networks can organize and learn themselves, and artificial neural networks can adapt to novel situations to learn innovative events regularly [64].
  • It has distributed memory; information in artificial neural networks is spread over the network. That is, the whole network characterizes the whole event [65].
  • It can only work with numerical information; the information indicated by symbolic expressions must be translated into numerical values [66].
  • It can detect events, shape and classify relationships, and pattern completion.

2.4.3. Advantages of Artificial Neural Networks

Artificial neural networks have several superior properties compared to other systems. These are non-linearity, ability to learn from examples, generalization, adaptability, data distributed unified memory structure, parallel processing feature, debugging capability, easy to obtain hardware, fast calculation, analysis, design ease, and availability of ready-made package programs [67,68]. It is possible to count many advantages of artificial neural networks, such as solving many problems that cannot be solved by traditional computer software technology. They have the ability to process abnormal missing and uncertain information, learn and generalize from their scattered parallel structure [66,69], and store the information they has learned in their distributed memory with the help of synaptic weights [70]. The artificial neural network method can produce more consistent results in proportion to the increase in the input data quantity [64]. Artificial neural networks have been studied comparatively in many studies with other methods. As a result, it has been observed to produce highly consistent and reliable results, especially in non-fixed and discrete data series [65,71,72].

3. Methods

3.1. Fundamental Elements and Structure of the Artificial Neural Network

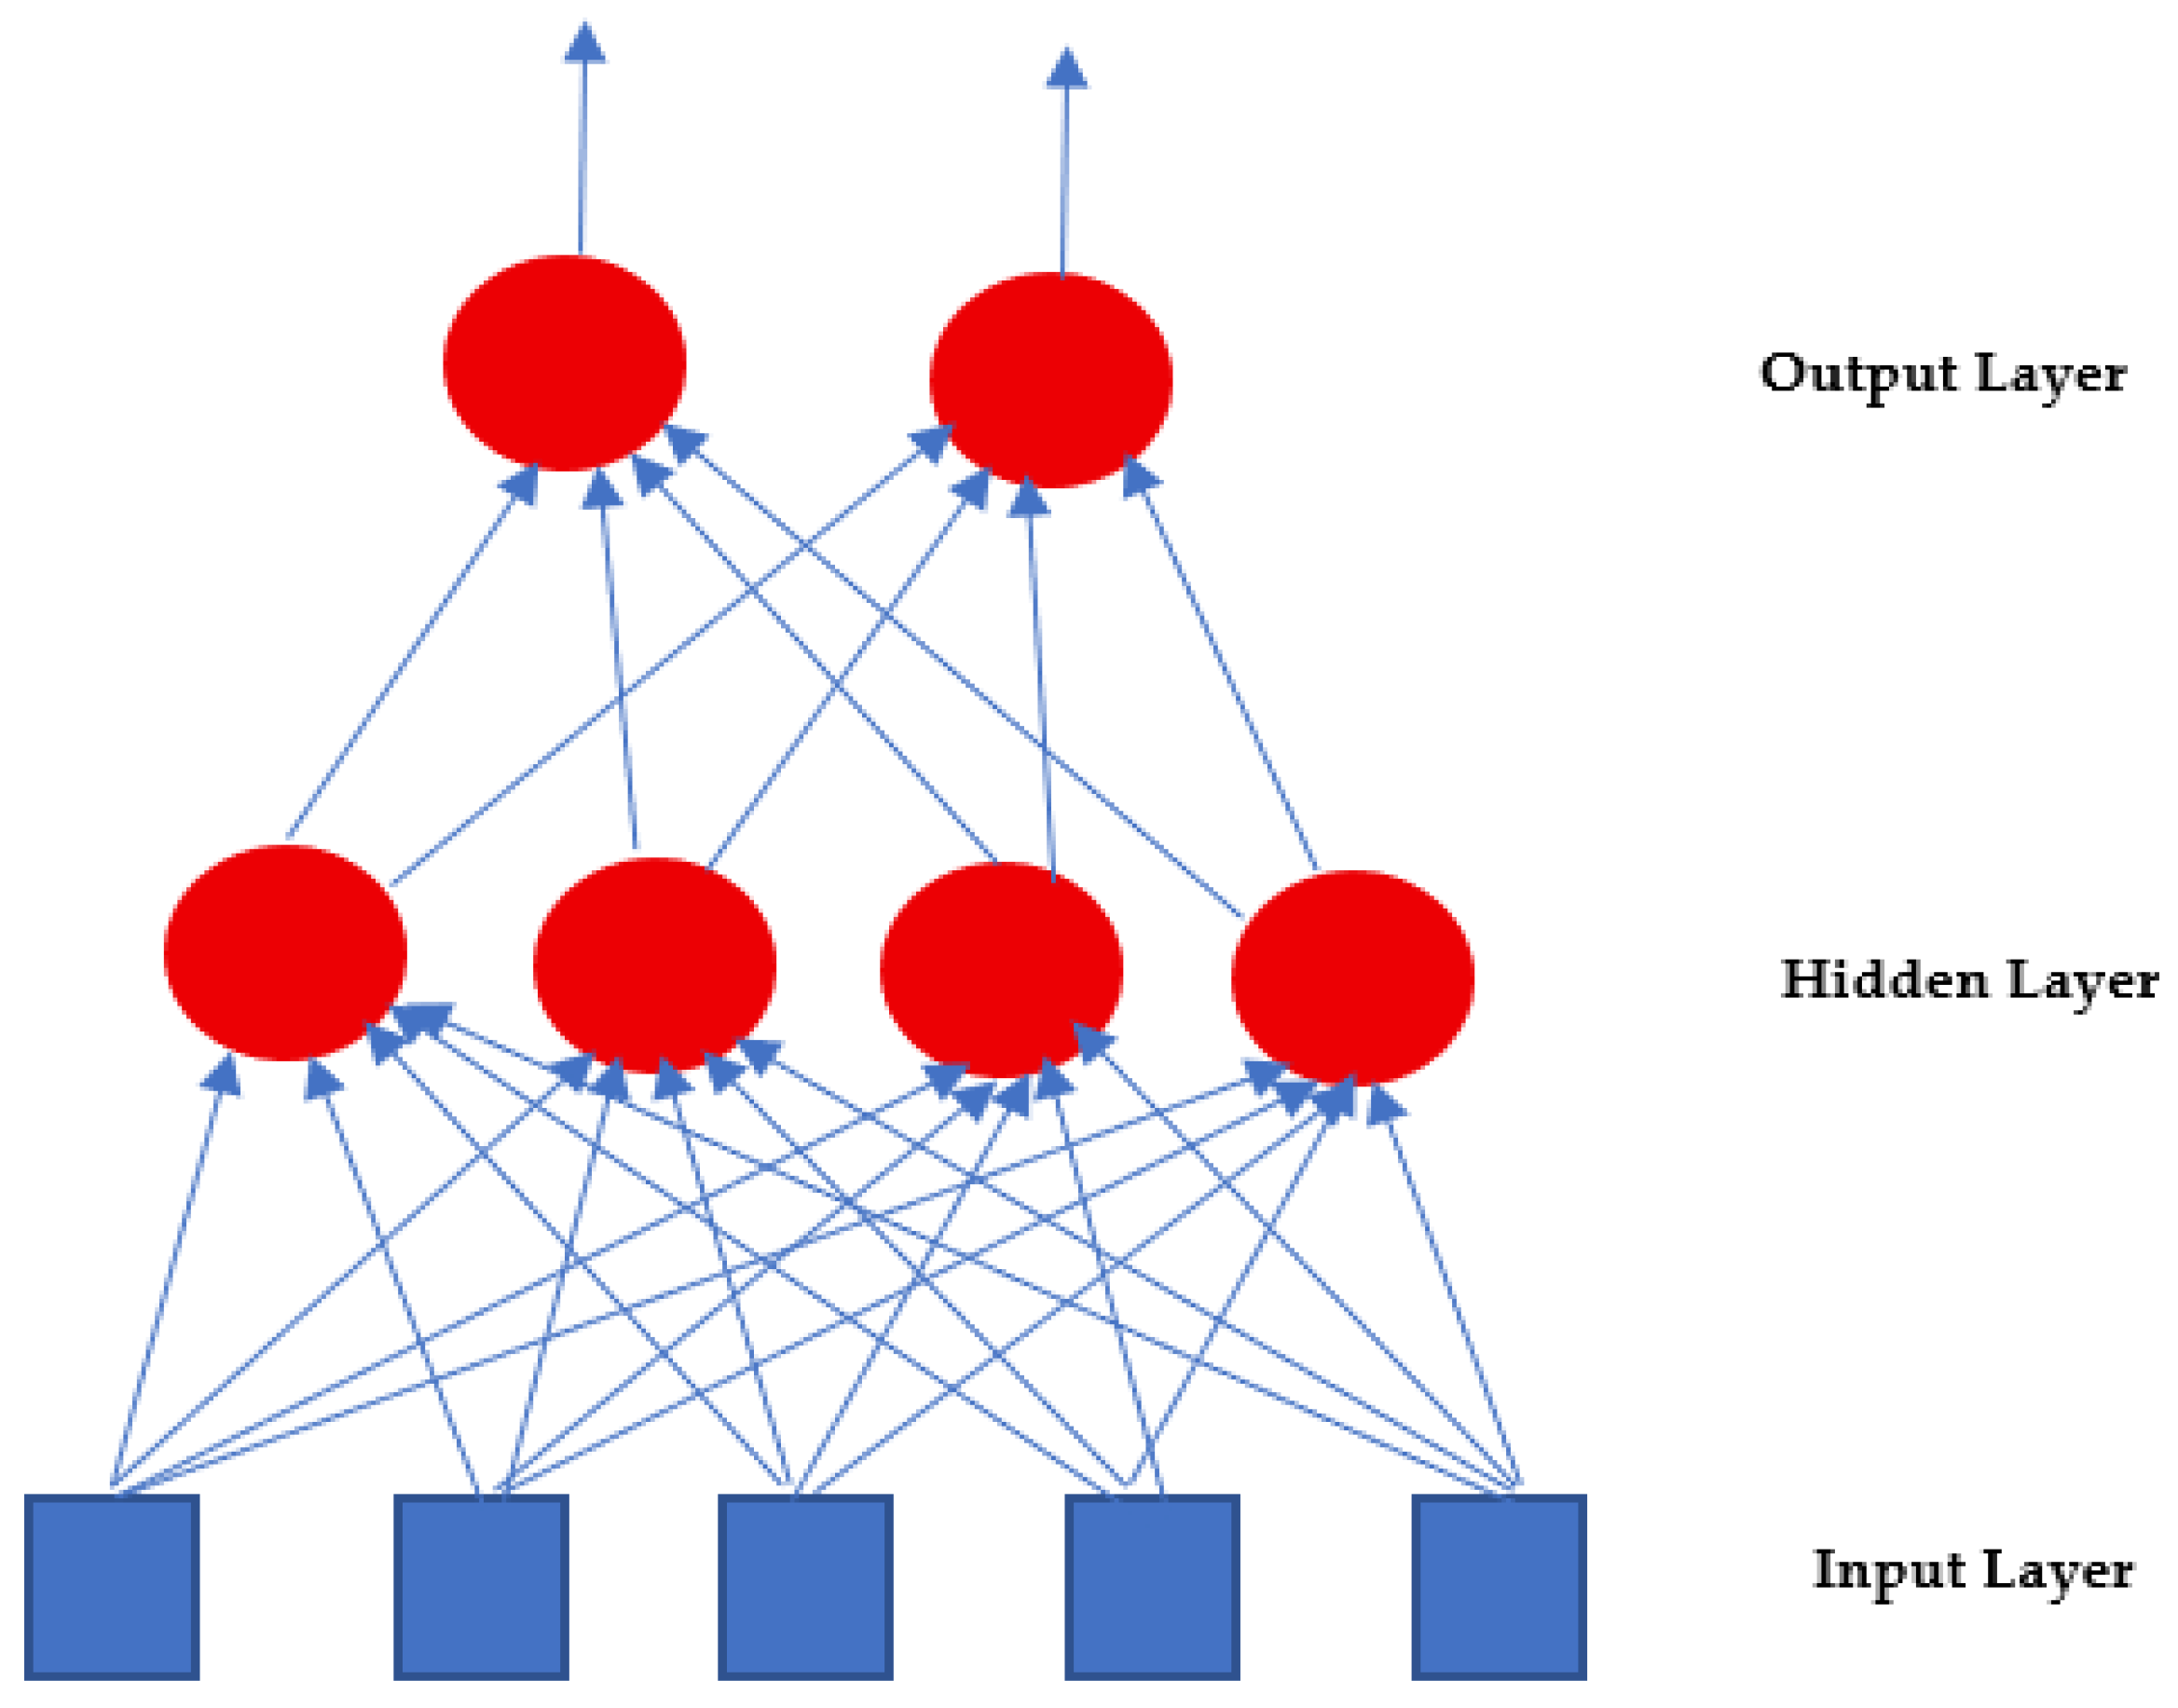
Artificial neural networks can be defined in Figure 1, in which multiple simple processor elements connected in a particular hierarchical structure produce output from the input data [62,66]. Figure 1 represents a mathematical function. This function of artificial neural networks does not have a mathematical equivalent [73]. In other words, the model needs examples, not mathematical equations [74]. The model only needs examples of the past to learn. Below is a simulation of Figure 1, which can generate results from the data entries of the past [73]. The neural networks, similar to Figure 1 seen above, can collect information from all cells and process this information to other elements. Various algorithms and approaches are involved [75].
Artificial neural networks consist of input, interlayer, and output layers. It is possible to explain these layers as follows [76,77]:
  • Input Layer: There must be at least one predictor or element from the raw data set in the input layer. The input layer generates similar values without processing any estimation [70].
  • Intermediate/Hidden Layer: This section or layer, also known as the hidden layer, is responsible for estimating and processing the raw data. The hidden or process layer has a specific function and structure, which could have variations as per the selected structure of networks. The middle or hidden layer could be comprised of one or more layers [78].
  • Output Layer: The output may comprise at least one or more outputs. However, it solely depends on the neural network’s structure and function. The estimation operation is processed in this layer, and the estimated output will be directed to the outside world [69].
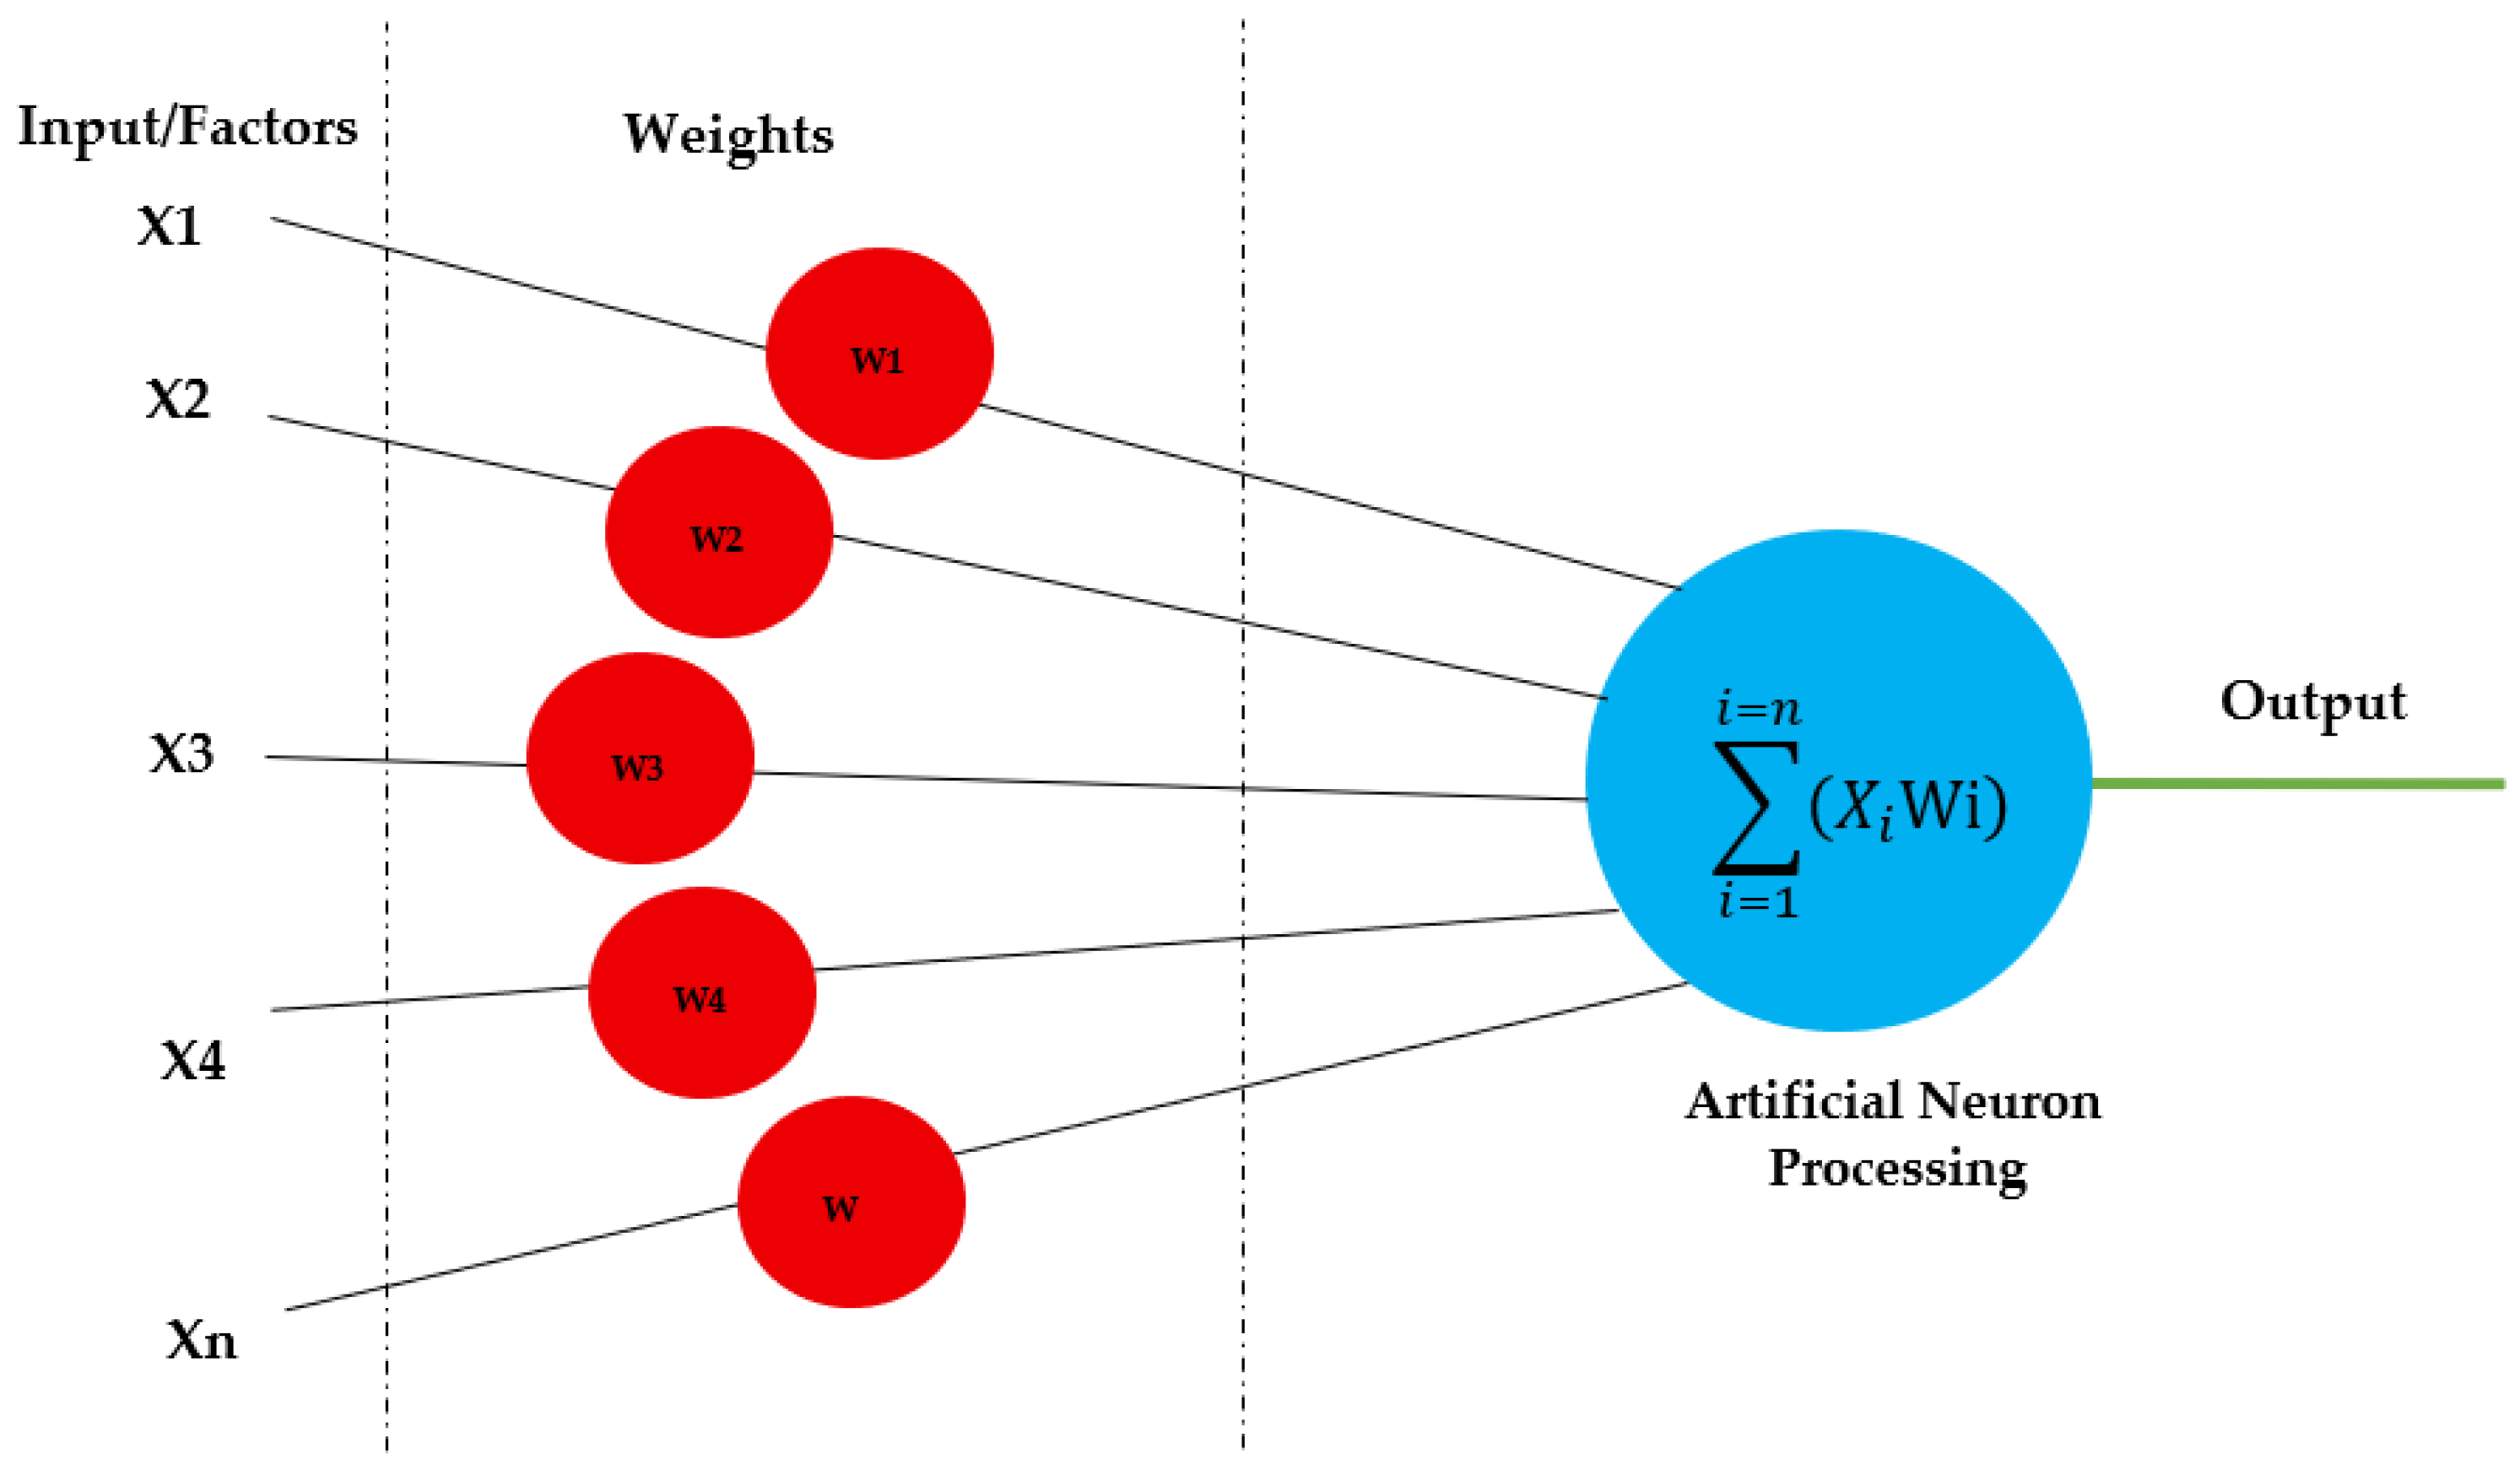
The process of artificial neural networks is shown in Figure 2, and it can be seen that after entering the data of the past time, the processor elements (neurons) and the connecting elements (axons) continue the process towards the exit [79].
According to the artificial neural network methodology, neurons, the central processing unit of the biological nervous system, can be modeled mathematically and associated with each other as in biological nervous systems [74]. When data is input from an artificial neural network, the artificial model, like the nervous system in humans, can process these inputs in mathematical artificial neurons and produce outputs [73,80]. Initially, the output values produced may be quite far from desired. However, as the learning process continues, synaptic weights between the artificial neurons are adjusted, an inevitable convergence is achieved, and the learning is completed [81]. Accordingly, artificial neural networks are a model in which biological neural networks are imitated. Figure 3 shows the mathematical functions of artificial nerve cells in layers [82]. As seen in Figure 3, the change in each input causes an inevitable change in the neuron’s output, and the magnitude of this change depends on the weight of the input [83].
The mathematical equation of input layers, hidden layers, and output layers can be computed as Equations (2) and (3) as follows:
ν 1 = g [ k = 1 N ( Ins ) ( w 1 k x k ) ] ,   ν 2 = g [ k = 1 N ( Ins ) ( w 2 k x k ) ] ,   ν 3 = g [ k = 1 N ( Ins ) ( w 3 k x k ) ]
Output = g ( k = 1 N ( ins ) w 0 k x k + k = 1 N ( Hid ) W k ν k )

3.2. Research Structure and Aim of the Project

As stated in the introduction part of the project, the research aims to train artificial neural networks with the inputs and outputs of the neuromarketing test performed on humans [72,84]. The data of 414 respondents were used for the training (414), and 171 to test artificial neural networks, obtained from 585 different respondents and regarding the characteristics of an effective advertisement on mainstream and online media. Although the data will first be tested and then used for artificial intelligence training, because the amount of data is enormous for deep learning, we employed the online method instead of batch-wise [84,85].

3.3. Input Criteria

As a result of the literature review and neuromarketing test, which included electroencephalography and eye-tracking methods, ten main criteria are determined to be appropriate [62,86]. The product packaging, features, advertisement content, target audience, celebrity endorsement, glamourization, creative value, memorizing value, conviction value, and time slot are taken.

3.4. Output Criteria

According to the neuromarketing test, two numerical outputs were measured; one main output and the main score within each of these two outputs, in the light of literature research [61,86]. The value is 1–5 on a five-point Likert scale, consumer buying behavior, and predicted behavior.
  • Consumer buying behavior: It is a metric indicative of the measured image that can gather respondents’ concentration on their own. However, consumer buying behavior is the core function of the human brain, which generates unique brainwave activity patterns towards the change of behavior for buying some brands due to the stimuli of brains because of some essential characteristics of an advertisement of any brand [85].
  • Predicted buying behavior: It is a neural network-generated predictive indicator that measures images that can influence respondents’ consumer buying behavior. It is a predictive function of the human brain, which generates unique brainwave activity patterns towards the change of behavior for buying the particular brand due to the stimuli of brains because of some essential characteristics of an advertisement of any brand [70].

3.5. Application

As stated in part of the first level out criteria, there are ten inputs: product packaging, product features, advertisement content, target audience, celebrity endorsement, glamourization, creative value, memorizing value, conviction value, and time slot criteria [57,80]. By way of example, the first and total focus of someone on a black dot over a white paper may be very different from other free spaces. Because of this reason, two different applications were made in this project [87]. One of the applications is the transition from consumer buying behavior. The second one is forecast consumer buying behavior criteria [83,88].

3.6. Creation of Artificial Neural Network Models

In the first model, consumer buying behavior, the input of neuromarketing research, was taken as the dependent variable. In addition, product packaging, product features, advertisement content, target audience, celebrity endorsement, glamourization, creative value, memorizing value, conviction value, and time slot were independent variables. In the second model, predicted consumer buying behavior of the relevant neuromarketing research were taken as dependent variables [58,89]. Similarly, product packaging, product features, advertisement content, target audience, celebrity endorsement, glamourization, creative value, memorizing value, conviction value, and time slot are considered independent variables unique to this model. Models in this project design have ten inputs; one and one dependent output. Overall, 70.8% of the data are foreseen for the training, and 29.2% are reserved for testing. The models have a single hidden layer for biased nodes and nine hidden layers for the feed-forward neural network [52]. The number of secret processor elements in the intermediate layer is 10. The number of cells in the hidden layer was determined using the literature studies’ data [55,60]. The transfer functions in the hidden and output layers are selected as sigmoid. Lastly, the rescaling method for covariates is standardized, and scale dependents are normalized [87]. In two models, an online training algorithm was used to train artificial neural networks. The sigmoid function can be represented in Equations (4)–(6) [53,57]:
g ( h ) = 1 1 + exp ( h )
i = 1 R y i Out ( x i ) 2 = i = 1 R y i g ( w T x i ) 2
The updated sigmoid rule can be written as follows:
w j w j + η i = 1 R δ i g i ( 1 g i ) x i j
where:
g i = g j = i m w j x i j δ i = y i g i

4. Results and Findings

4.1. First Application Using Model Training and Testing

We have the following algorithmic function as Equation (7) of our first application using model training and testing:
Output   ( CB ) = g ( k = 1 10 ( ins ) w 01 PF 1 + w 02 AC 2 + w 03 TA 3 + w 04 CE 4 + w 05 GL 5 + w 06 CV 6 + w 07 PP 7 + w 08 MV 8 + w 09 TS 9 + w 010 CNV 10 + ε + k = 1 10 ( Hid ) W k ν k )
where:
ν 1 = g [ k = 1 N ( Ins ) ( w 11 PF 1 ) ] ,   ν 2 = g [ k = 1 N ( Ins ) ( w 22 AC 2 ) ] ,   ν 3 = g [ k = 1 N ( Ins ) ( w 33 TA 3 ) ] ,   ν 4 = g [ k = 1 N ( Ins ) ( w 44 CE 4 ) ] ,   ν 5 = g [ k = 1 N ( Ins ) ( w 55 GL 5 ) ] ,   ν 6 = g [ k = 1 N ( Ins ) ( w 66 CV 6 ) ] ,   ν 7 = g [ k = 1 N ( Ins ) ( w 77 PP 7 ) ] ,   ν 8 = g [ k = 1 N ( Ins ) ( w 88 MV 8 ) ] ,   ν 9 = g [ k = 1 N ( Ins ) ( w 99 TS 9 ) ] , ν 10 = g [ k = 1 N ( Ins ) ( w 1010 CNV 10 ) ]
where:
K     N = 1 . 10
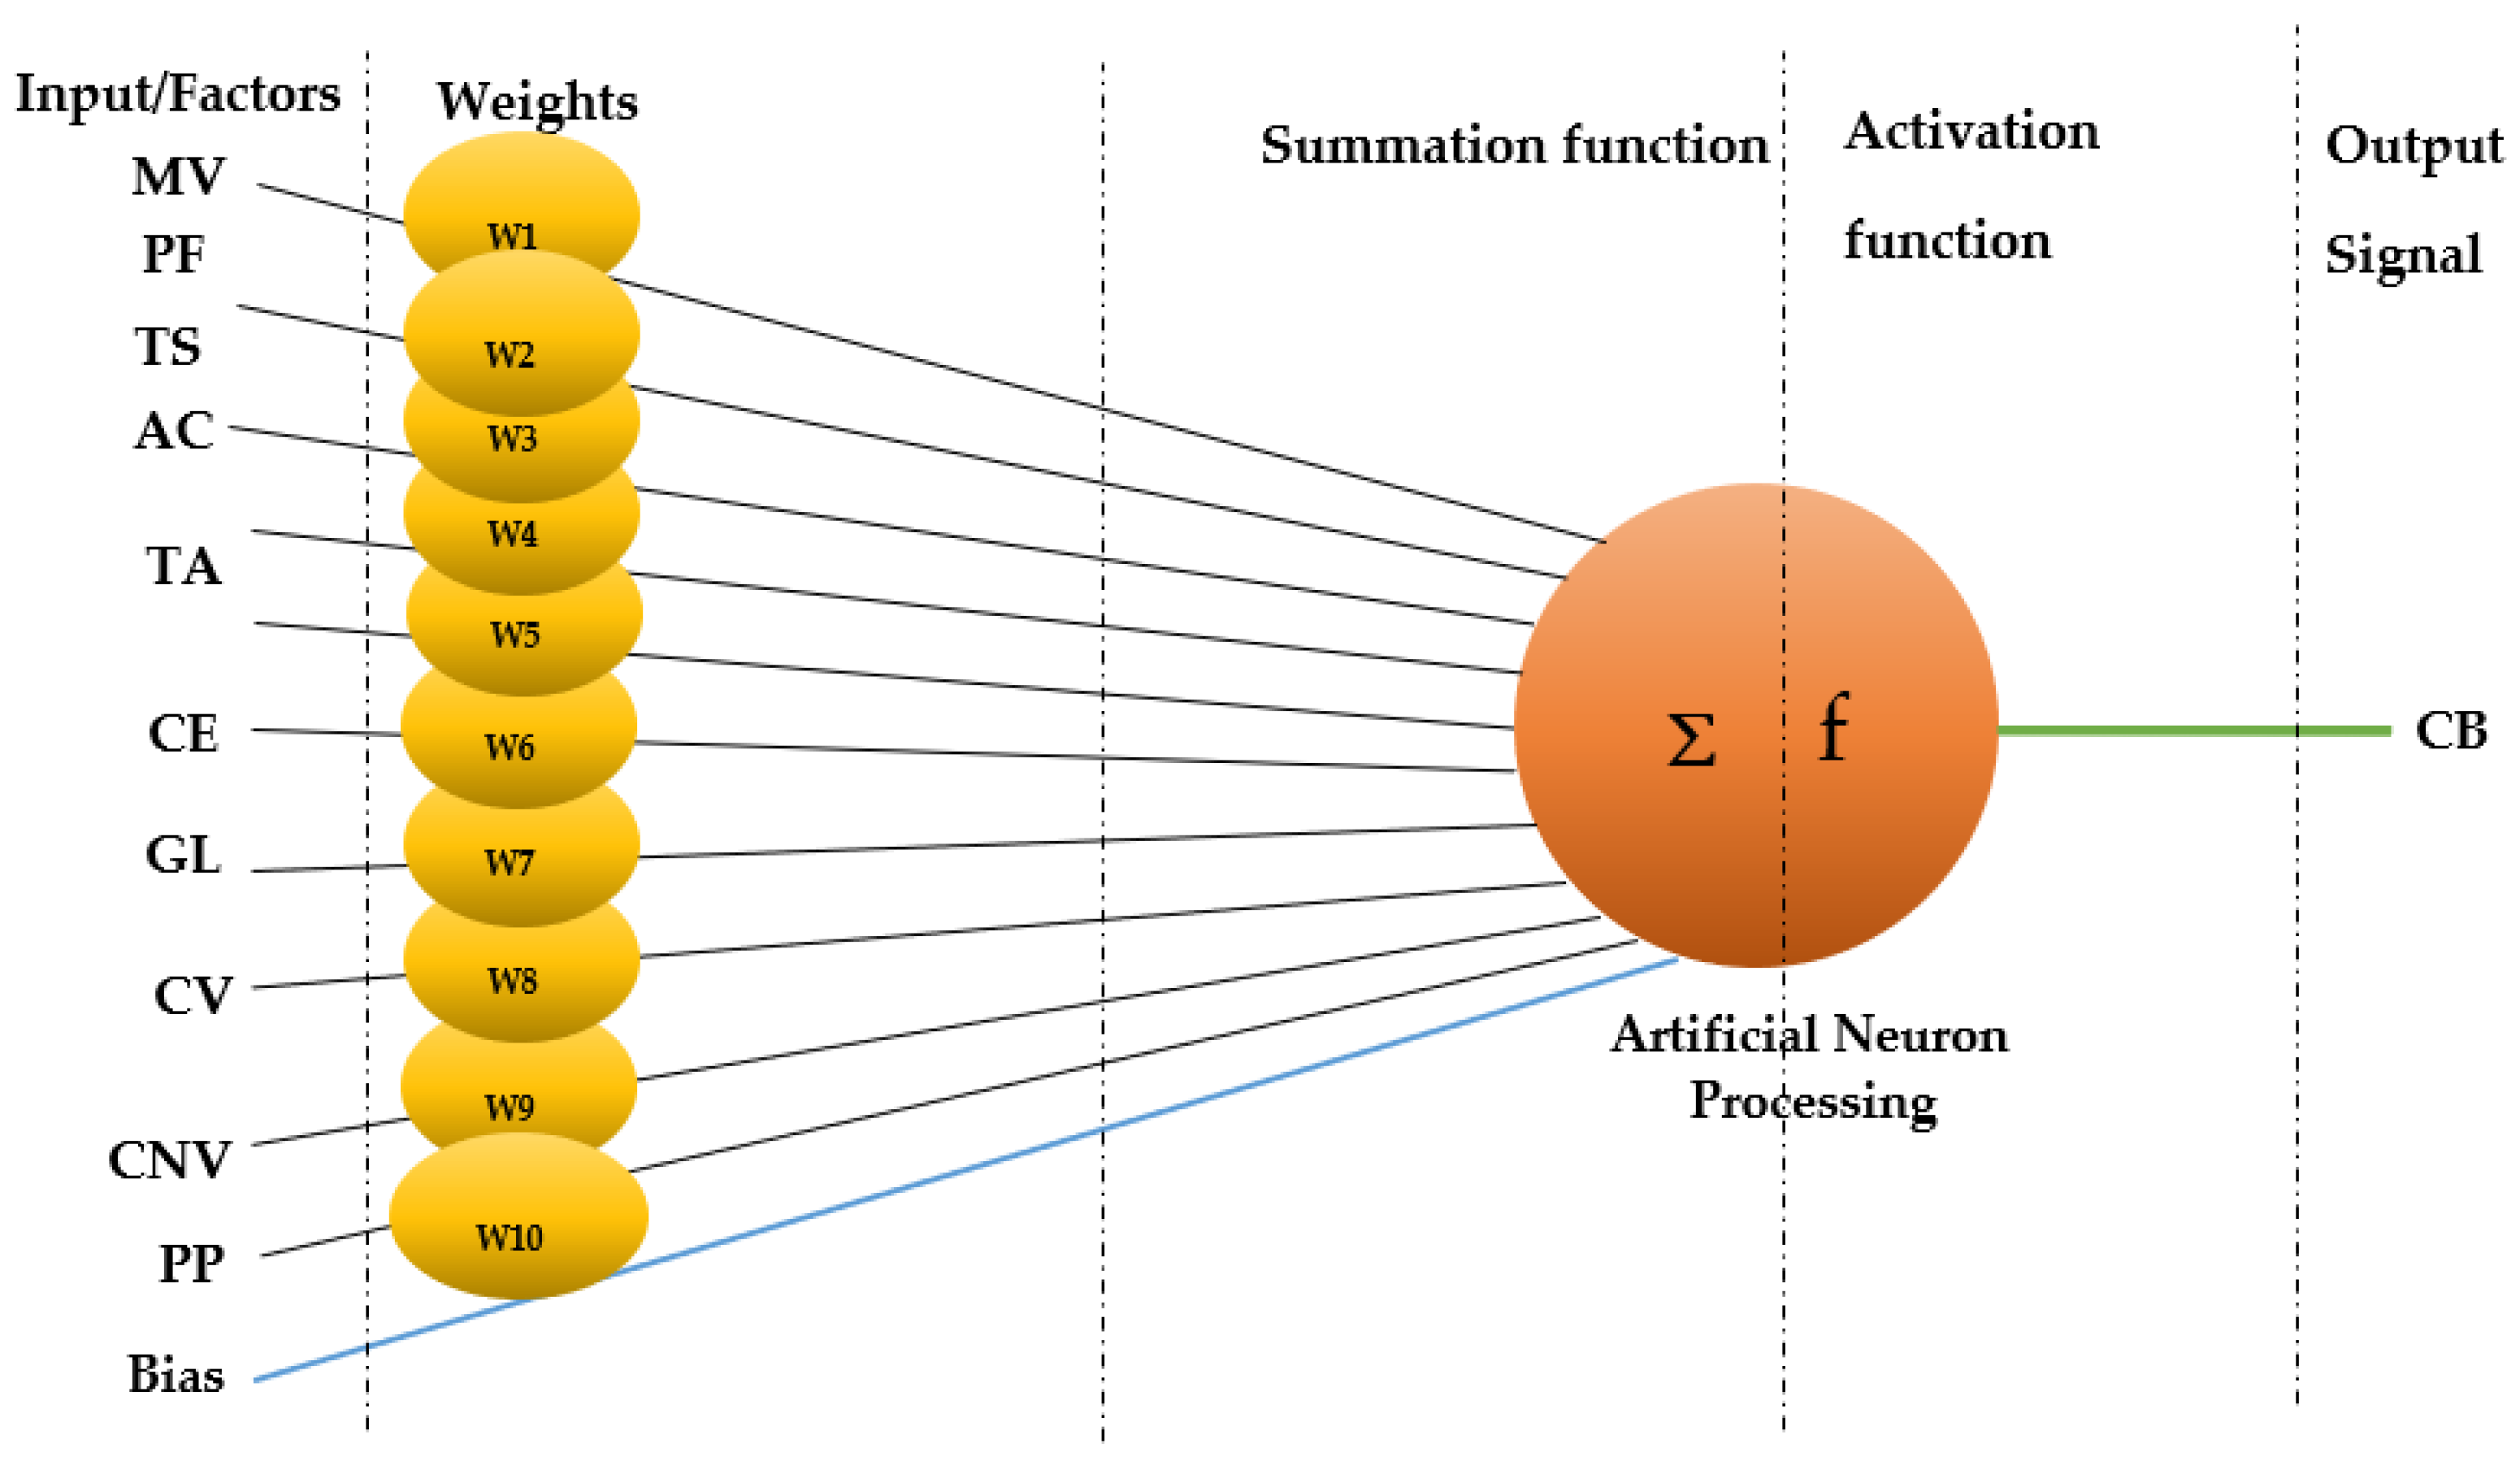
Similarly, we have Figure 4 is the architectural diagram of our considered first application using model training and testing:

4.2. Case Processing Summary of the First Application

According to Table 1 of the case processing summary, as mentioned below, 70.8% of data were used for training, and 29.2% were used for testing. In this case, excluded data did not exist for the missing value (see Table 1).

4.3. Model Summary of the First Application

In the first application, predicted consumer buying behavior is measured through an artificial neural network. Table 2 demonstrated that the sum of squares errors of training and testing data sets are 1.973 and 1.539. Training and testing data sets revealed a relative error of 0.010 and 0.019, showing a good number compared to the previous model summary of consumer buying behavior (see Table 2).

4.4. Model of the First Application

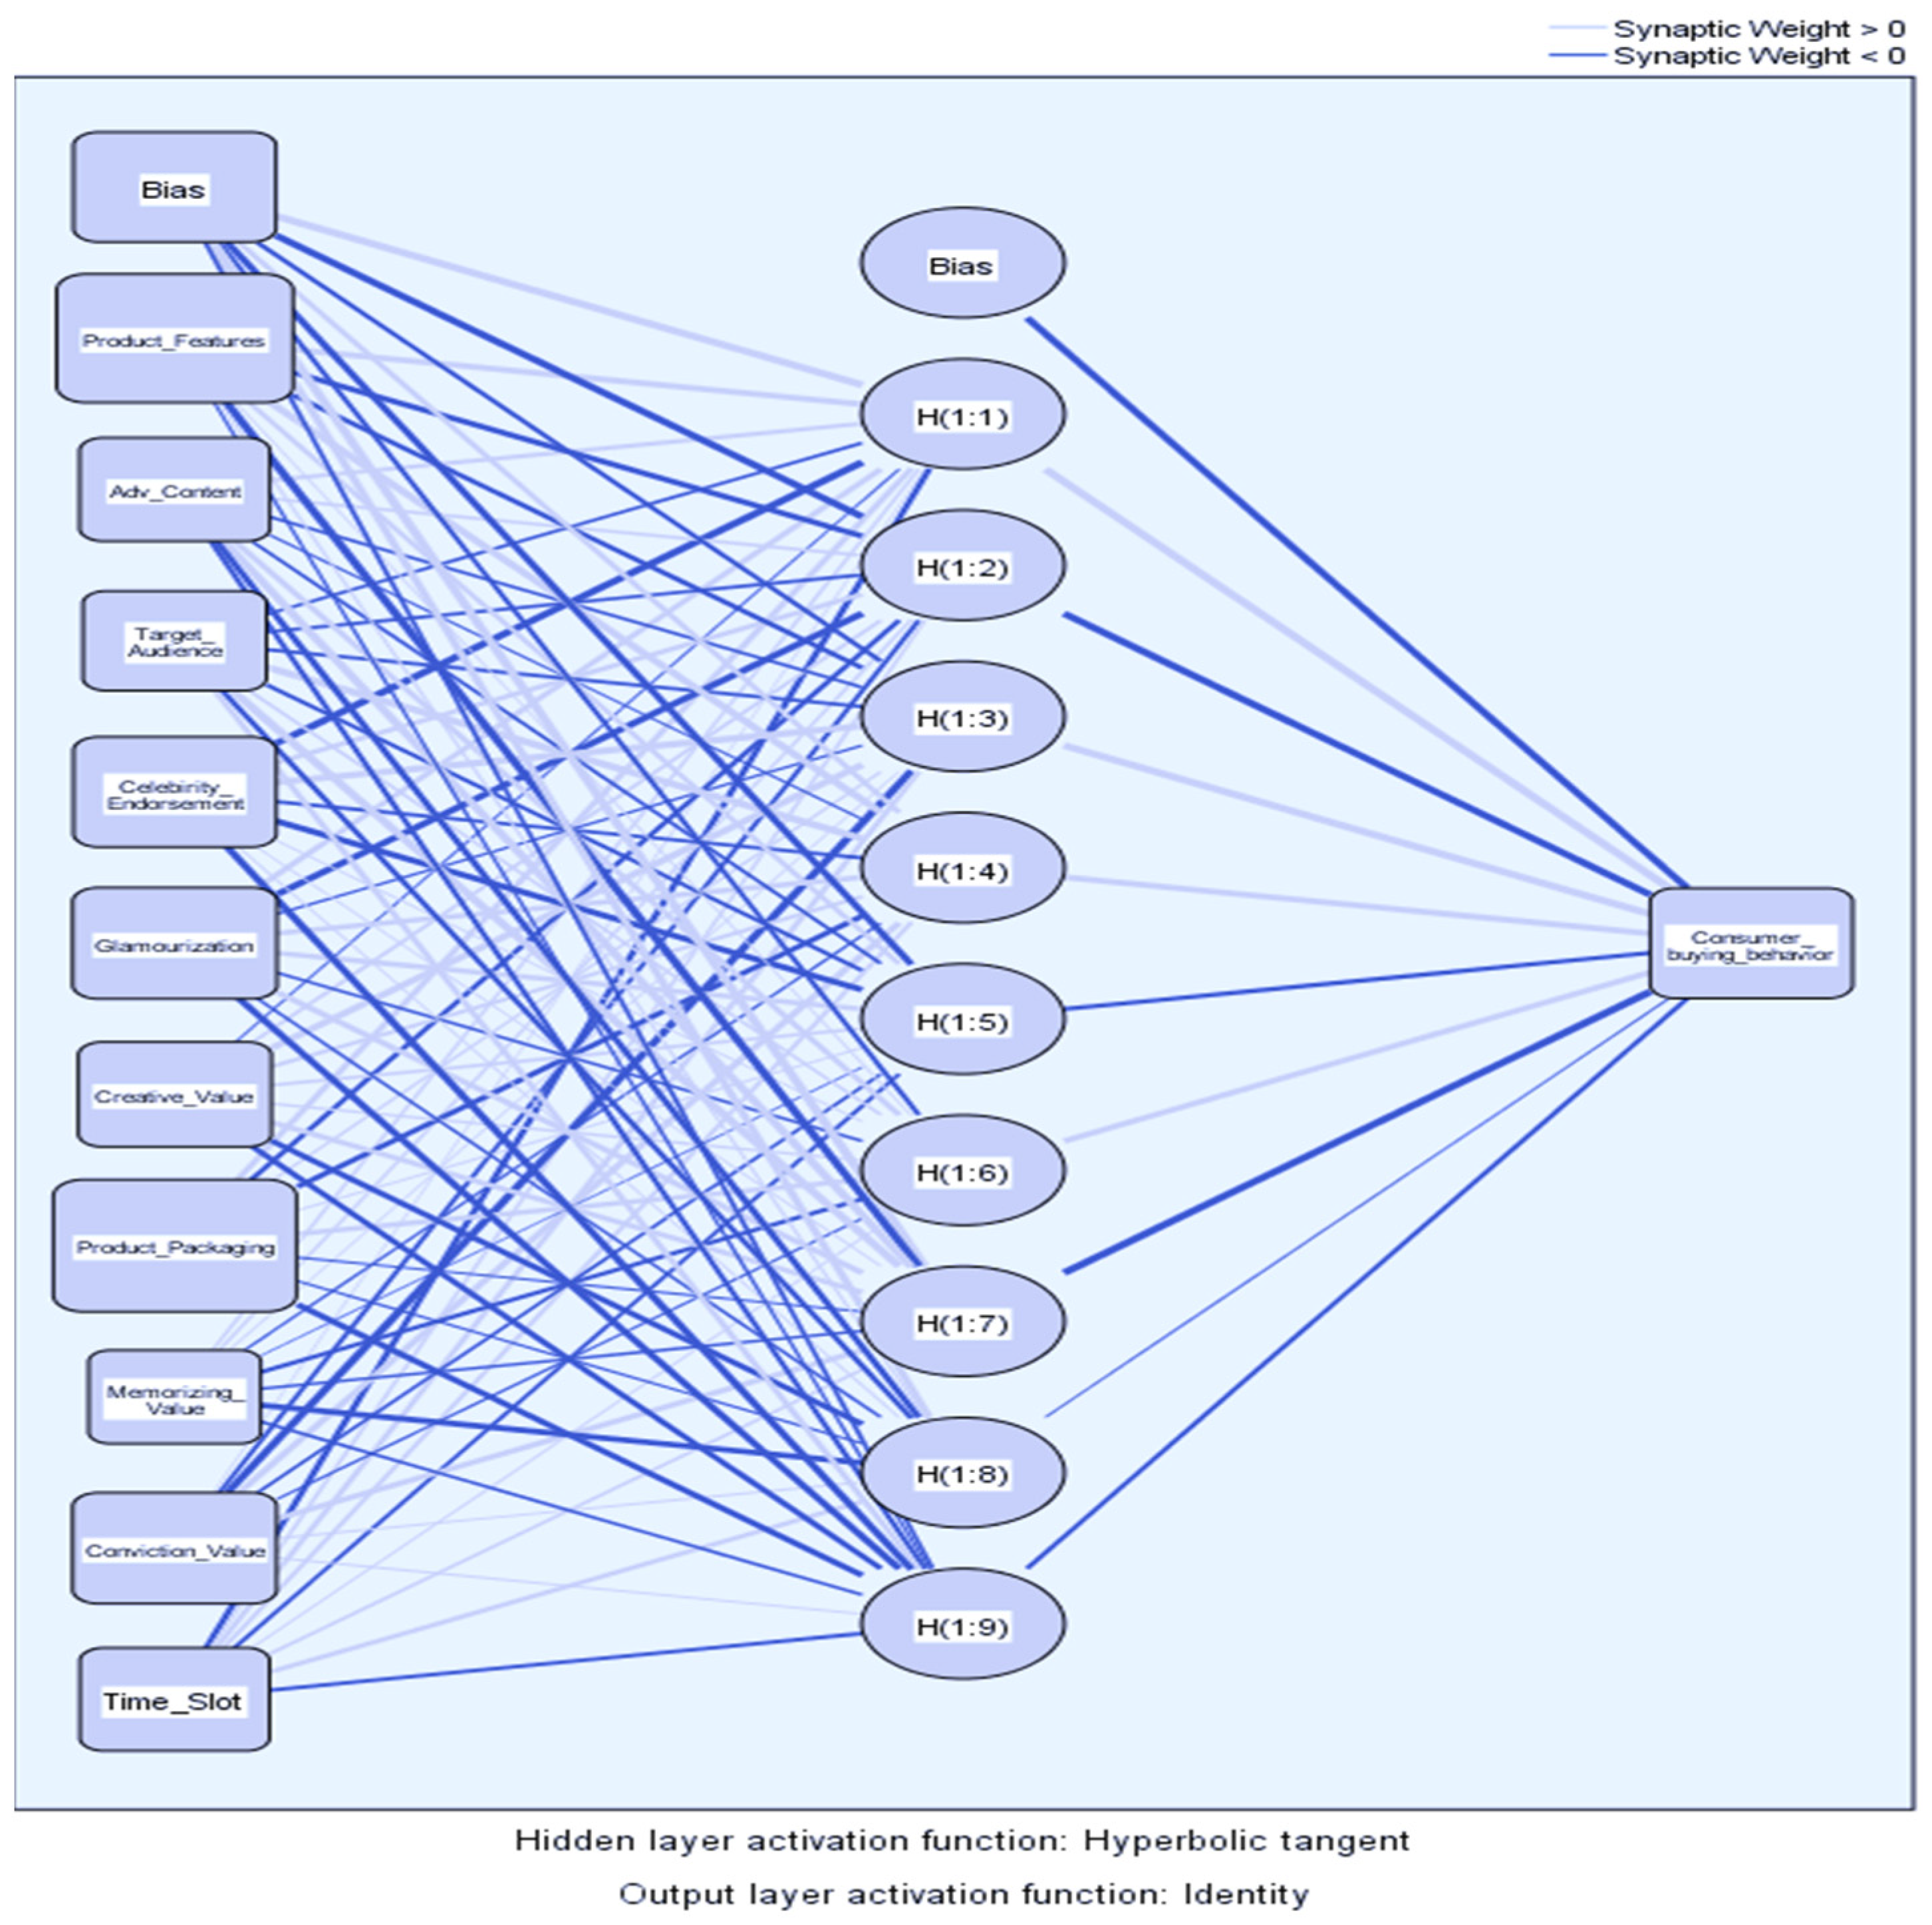
The network seen when the model is installed with the parameters mentioned in the previous section is exhibited in Figure 5 of the model of the first application. Figure 5 exhibits that there are three types of shared artificial networks. These shared types are known as layers of units [64,87]. The first layer of the unit is called the input, comprised of predictors [79,85]. The middle layer interconnected between the input and output layer units is signified as a hidden layer of the unit. The raw data or information is fed into the input layer units, and weights are assigned between the connections of input layers and hidden layer units [73,82]. The outcomes of the output layer unit depend solely on the estimation between input layer units, assigned weights, and hidden layer units [88]. Table 3 and Figure 5 demonstrate that the input layer of the product feature has the highest predictive power with the help of deep machine learning (hidden layer) on the consumer buying behavior at the output layer [63,81]. The hidden layers H(1:2), H(1:5), H(1:7), and H(1:9) have a significant impact between input layers and output layers.

4.5. Parameter Estimates

Table 3 displays that the middle-hidden layers of nodes between the input layer and predictive layer have synaptic weights and an output layer of multilayer perception predicted values of consumer buying behavior that was estimated to employ the training data sample only [66,67]. However, the parameter estimates show the predictors’ input layer between predicted hidden nodes units and output layer units of consumer buying behavior [70].

4.6. Predictors’ Importance

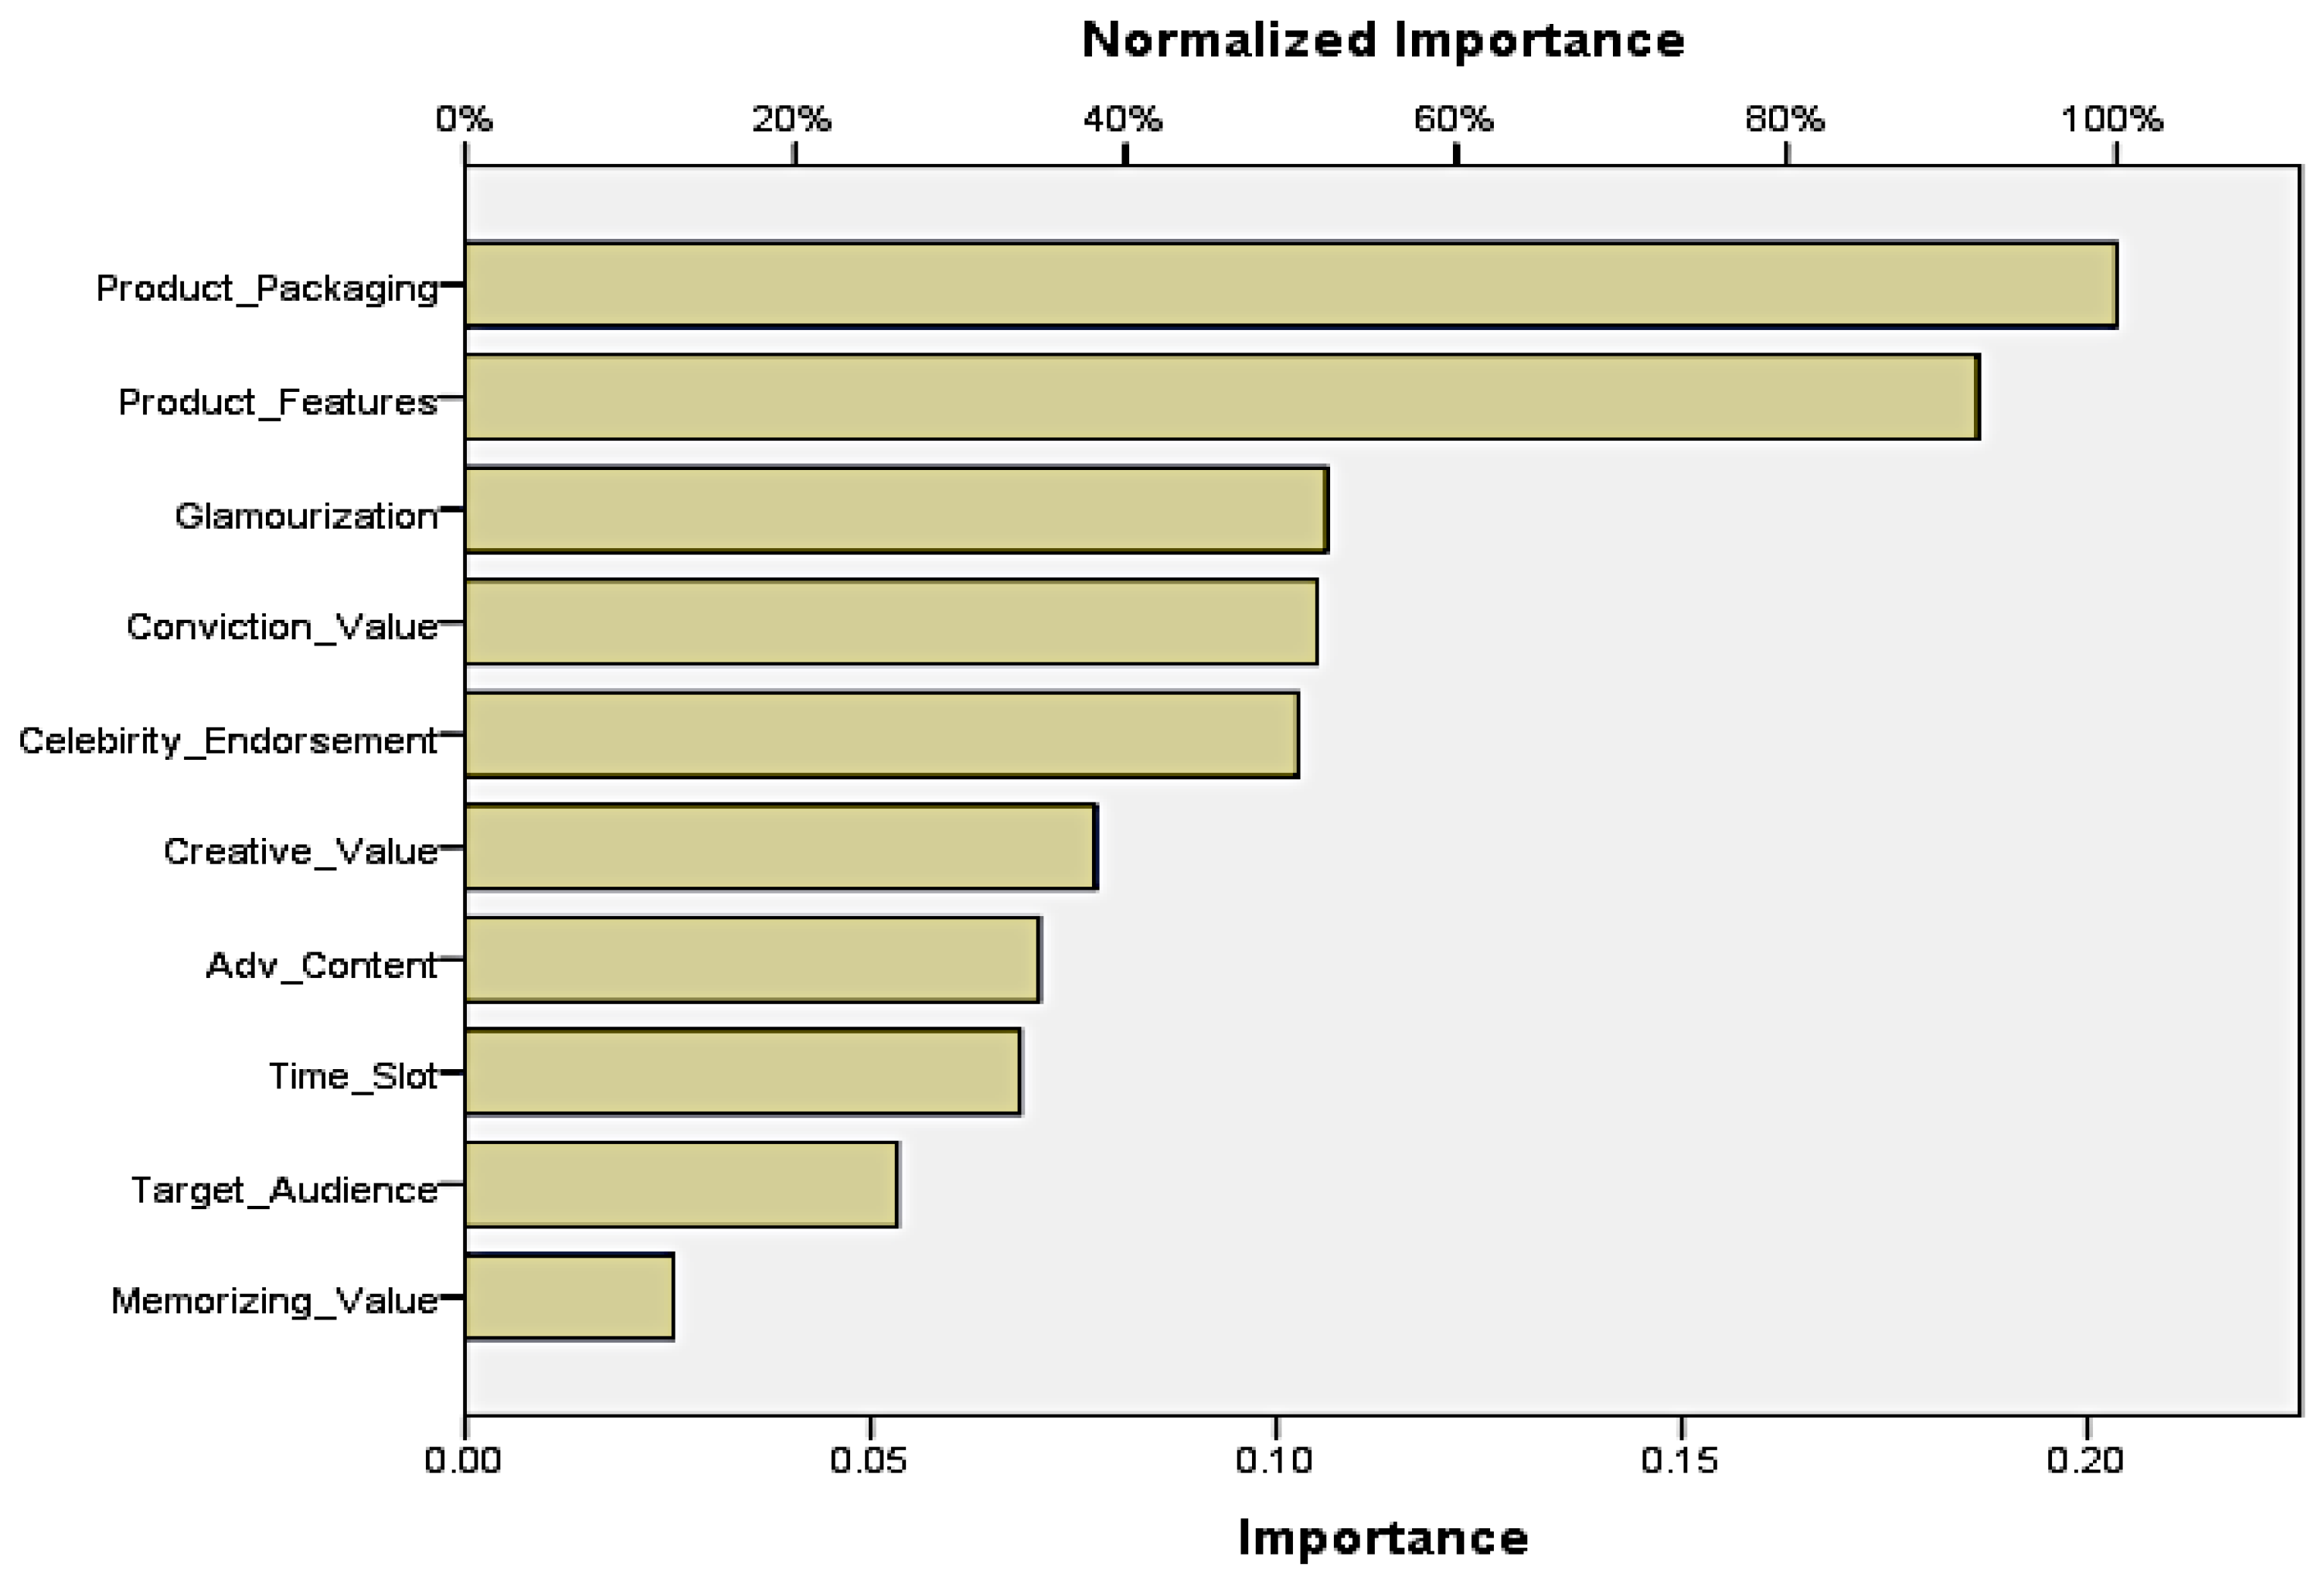
Table 4 shows the importance of independent variables over dependent variables. In agreement with Table 4 of independent variable importance, the independent elements most effective on consumer buying behavior are product packaging, product features, glamourization, conviction value, celebrity endorsement, and creative value. The normalized importance of product packaging is 100%. The second crucial independent element is the product feature, which has a normalized importance of 91.6%.

4.7. Normalized Importance

Similarly, Figure 6 showed that glamourization is the third important input with 52.2% normalized importance. However, conviction value (51.6%), celebrity endorsement (50.4%), creative value (38.2%), and advertisement content has 34.8% normalized importance. Thus, the first application of neural networks in artificial intelligence has revealed that the most important characteristics of an advertisement that change the behavior of consumers are the product packaging and product features [75,76]. Figure 6 exhibits the normalized importance of different characteristics of a good advertisement.

4.8. Second Application Using Model Taring and Testing—Model Summary

We have the following algorithmic function as Equation (8) of our first application using model training and testing for predicted values:
Output   ( CB :   Predicted ) = g ( k = 1 10 ( ins ) w 01 PF 1 + w 02 AC 2 + w 03 TA 3 + w 04 CE 4 + w 05 GL 5 + w 06 CV 6 + w 07 PP 7 + w 08 MV 8 + w 09 TS 9 + w 010 CNV 10 + ε + k = 1 10 ( Hid ) W k ν k )
where:
ν 1 = g [ k = 1 N ( Ins ) ( w 11 PF 1 ) ] ,   ν 2 = g [ k = 1 N ( Ins ) ( w 22 AC 2 ) ] ,   ν 3 = g [ k = 1 N ( Ins ) ( w 33 TA 3 ) ] ,   ν 4 = g [ k = 1 N ( Ins ) ( w 44 CE 4 ) ] ,   ν 5 = g [ k = 1 N ( Ins ) ( w 55 GL 5 ) ] ,   ν 6 = g [ k = 1 N ( Ins ) ( w 66 CV 6 ) ] , ν 7 = g [ k = 1 N ( Ins ) ( w 77 PP 7 ) ] ,   ν 8 = g [ k = 1 N ( Ins ) ( w 88 MV 8 ) ] ,   ν 9 = g [ k = 1 N ( Ins ) ( w 99 TS 9 ) ] , ν 10 = g [ k = 1 N ( Ins ) ( w 1010 CNV 10 ) ]
where:
K     N = 1 . 10
Similarly, we have Figure 7’s architectural diagram of our considered second application using model training and testing for predicted values:
In the second application, predicted consumer buying behavior is measured through an artificial neural network. Table 5 demonstrated that the sum of squares errors of training and testing data sets are 0.871 and 0.926. Additionally, training and testing data sets revealed a relative error of 0.004 and 0.010, showing a good number compared to the previous model summary of consumer buying behavior (see Table 5).

4.9. Model of the First Application

The network seen when the model is installed with the parameters mentioned in the previous section is exhibited in Figure 8 of the model of the second application. Table 6 and Figure 8 demonstrate that the input layer of the product feature has the highest predictive power with the help of deep machine learning (hidden layer) on the consumer buying behavior at the output layer. The hidden layers H(1:1), H(1:2), H(1:4), H(1:5), and H(1:8) have a significant impact between input layers and output layers [63,81].

4.10. Parameter Estimates

Table 6 displays that the hidden middle layers of nodes between the input and predictive layers have a synaptic weight. The output layer of multilayer perception predicted consumer buying behavior values estimated to employ the training data sample only. However, the parameter estimates show the predictors’ input layer between predicted hidden nodes units and output layer units of consumer buying behavior.

4.11. Predictors’ Importance

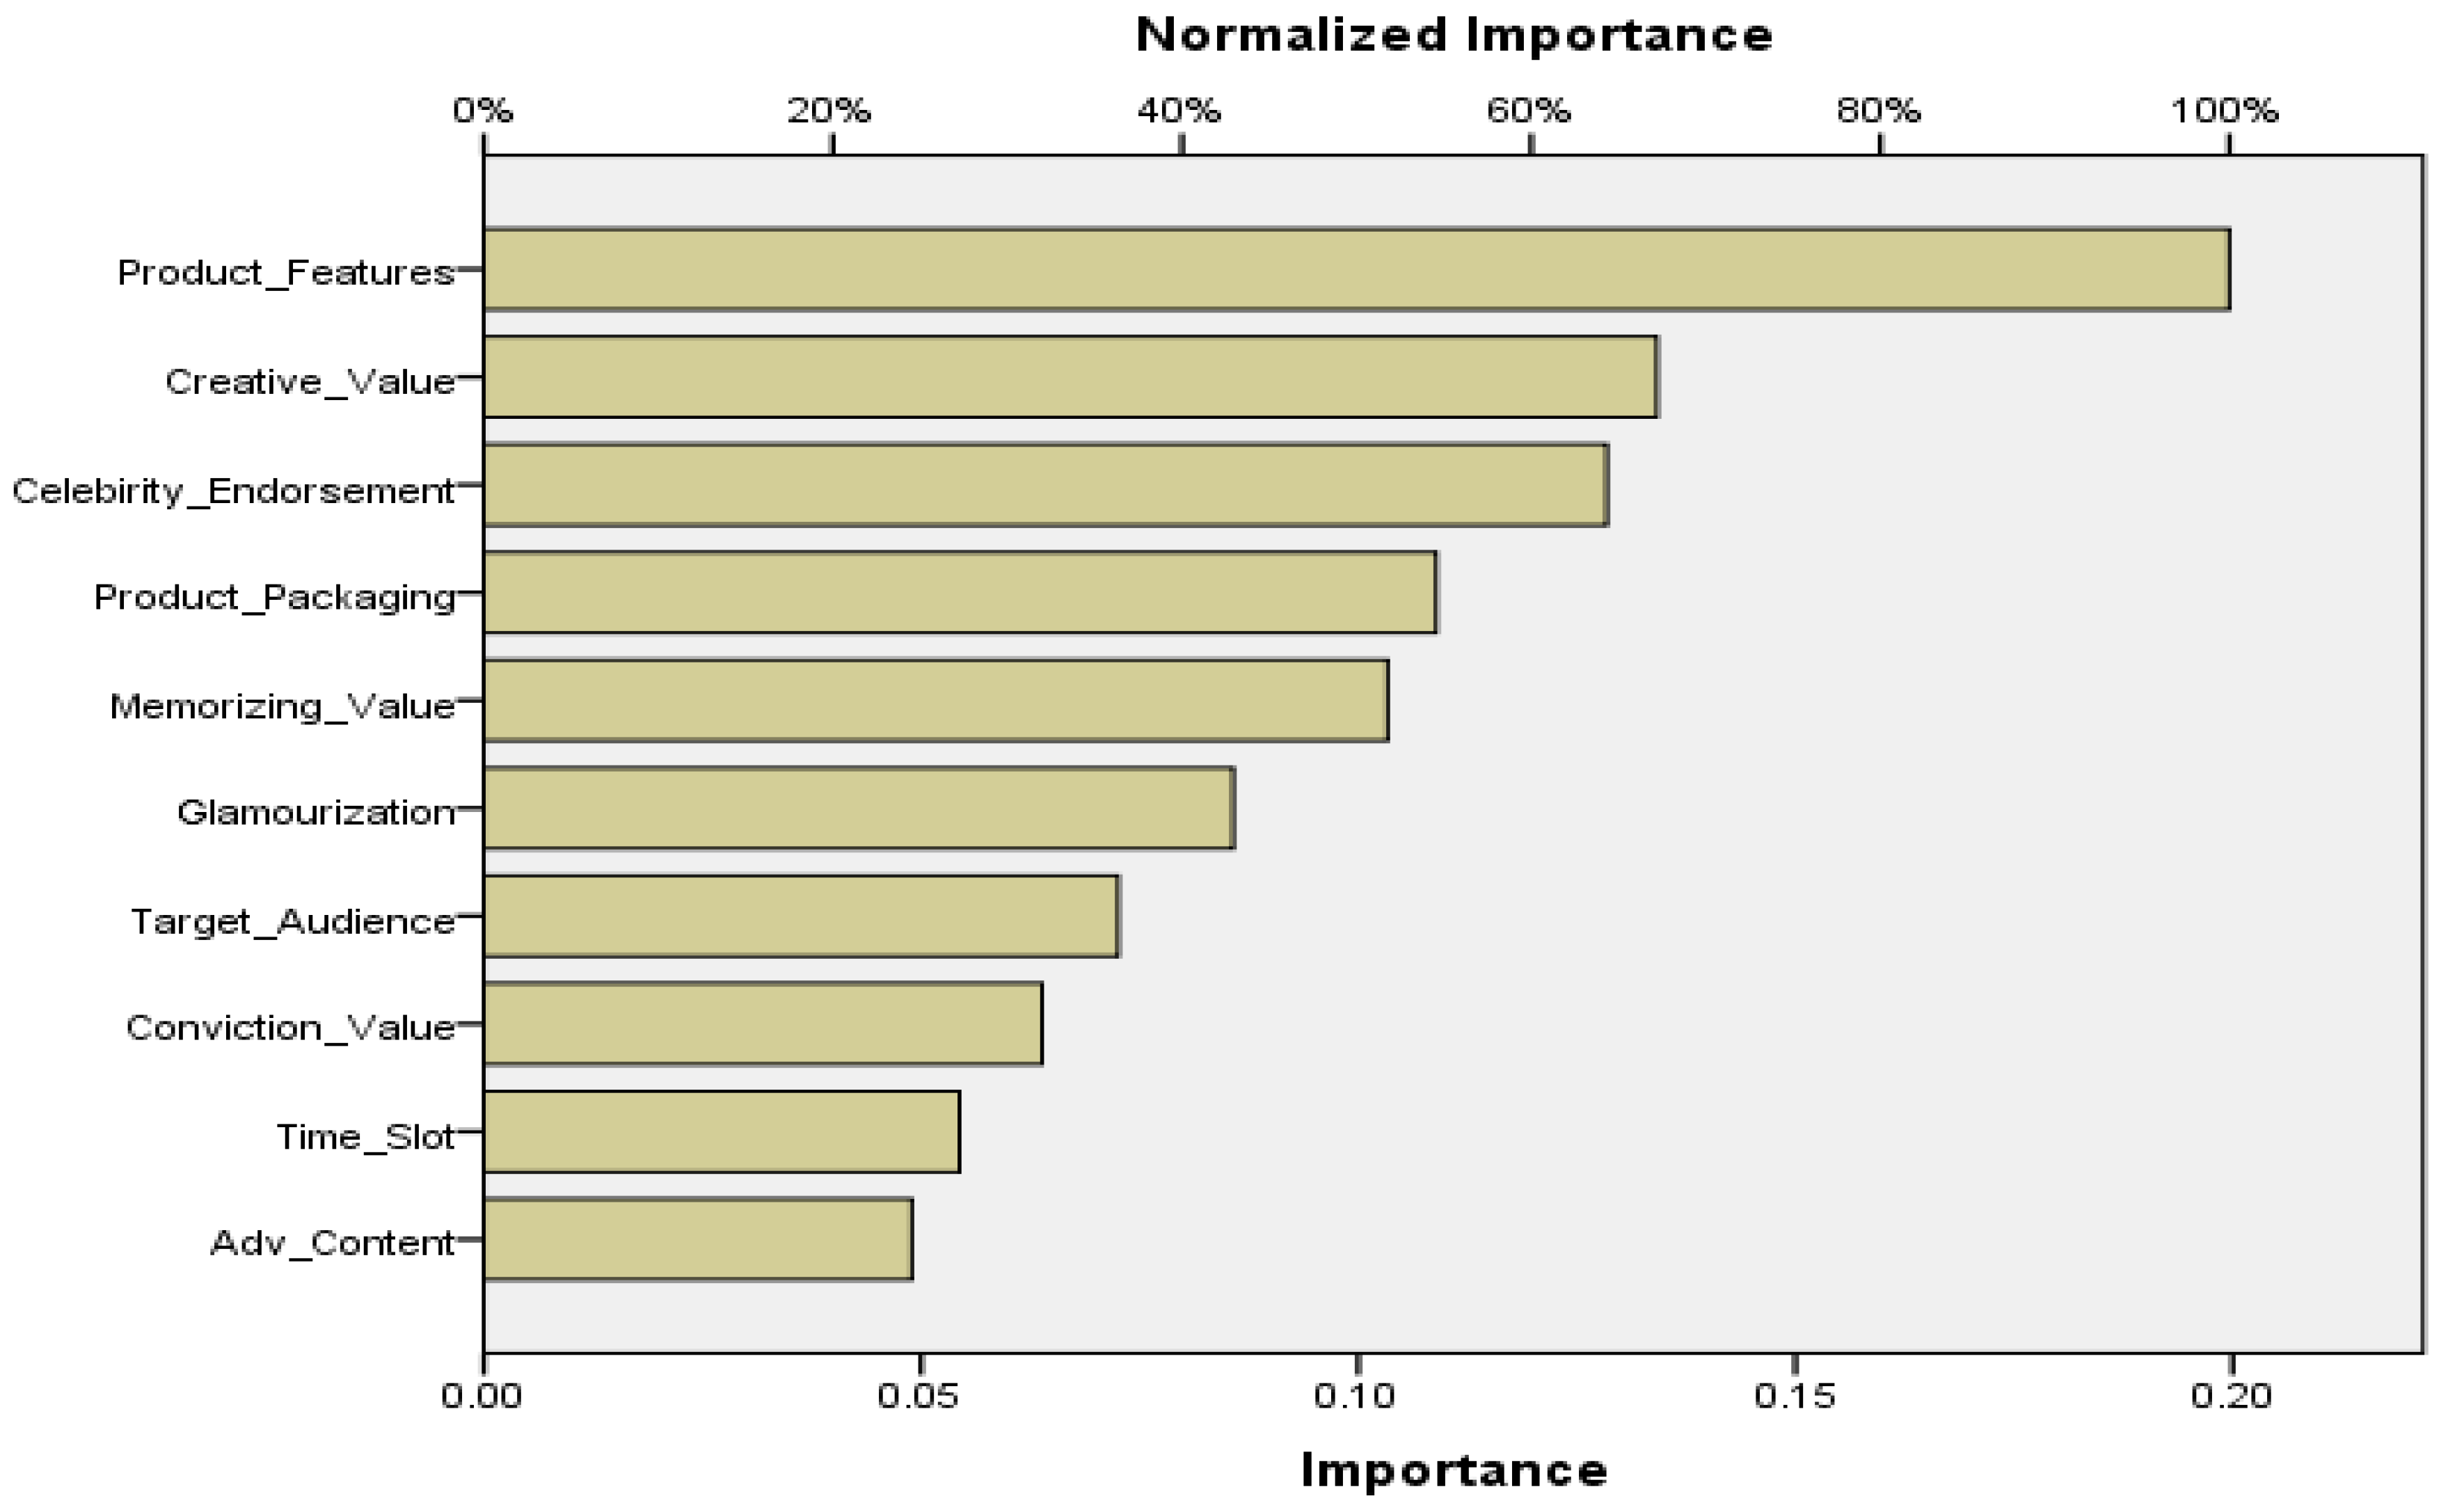
Table 7 shows the importance of independent variables over predicted consumer buying behavior, extracted using an artificial neural network. In agreement with Table 7, product features (100.0%) are the most effective predictors of consumer buying behavior. However, the second most important predictor is creative value, which has a normalized importance of 67.2%. The complete results are reported in Table 7.

4.12. Normalized Importance

Similarly, Figure 9 showed that celebrity endorsement is the third important input with 64.3% normalized importance. However, product packaging value (54.6%), memorizing value (51.8%), glamourization (42.9%), and target audience have 36.3% normalized importance. Thus, the second application of neural networks in artificial intelligence has revealed that the essential characteristics of an advertisement that change the predictive behavior of consumers are the product feature and creative value [67,68]. Figure 9 exhibits the normalized importance of different characteristics of a good advertisement.

4.13. Forecasting of Neuromarketing Outputs

The predicted consumer behavior is tested again in the second application. There is a difference between the first application and the second application. The first application exhibited that product packaging, product features, glamourization, conviction value, and celebrity endorsement are an advertisement’s first five critical characteristics, which can change a consumer’s behavior. However, in the second application, we employed predicted consumer buying behavior as an output variable, which demonstrates the predictive behavior of consumers regarding the crucial factors of an effective advertisement [62,66,67]. In the second application, we attained the product feature’s highest importance with 100.0%, and the creative value of the advertisement was the second essential characteristic, which had 67.2% normalized importance. However, celebrity endorsement is the third important input, with 64.3% normalized importance. Additionally, product packaging value (54.6%), memorizing value (51.8%), glamourization (42.9%), and target audience have 36.3% normalized importance. Thus, the second application provides the artificial intelligence of the human brain’s decision-making or change of behavior due to specific advertisements, which is the alternative method to measure the hidden factors of the human brain’s activity compared to the neuromarketing techniques.

5. Discussion

Human behavior is very complex; it constantly varies due to external stimuli [7,8]. For example, if we recoded the human behavior regarding the perception of consumer behavior regarding the advertisement effectiveness, factors which are convincing to human behavior to incline towards some specific ads of brands [4,8]. Suppose we repeat this process to gauge the behavior of the same respondents after a specific period. In that case, the new recorded response will differ from the previous one regarding the effectiveness of ads of that specific brand. It means human behavior constantly changes because of external factors and stimuli, making it very complex [12,90,91]. Neuromarketing is used to gauge neural activity to get inspiration while watching certain ads [13]. The neural change activity is recorded through fMRI [44,45], eye tracking, magnetoencephalography (MEG), transcranial magnetic stimulation (TMS), and several other gadgets. [9,15]. However, there is no guarantee that after a certain period, if we repeat the similar process and gauge neural change activity of the brain, the same results will be extracted from the paired devices, for instance, fMRI, eye tracking [33], magnetoencephalography (MEG), transcranial magnetic stimulation (TMS), etc. [4]. Thus, neuromarketing is also a complex phenomenon due to constant changes in human behavior. Therefore, it is imperative to comprehend that the neuromarketing phenomenon cannot be measured 100% correctly through fMRI, eye tracking, and other devices. The results of fMRI [29,46], eye tracking, magnetoencephalography (MEG) [30], transcranial magnetic stimulation (TMS) and other devices to measure the human brain activity show the limitations of that particular point of time when it was recorded. Thus, the recorded results cannot be generalizable for every moment of the life of the same human’s behavior and brain activity. Therefore, it is established that the neuromarketing studies cannot be limited to gauging the neural activity through the fMRI, eye tracking, magnetoencephalography (MEG) [23,41], transcranial magnetic stimulation (TMS) [4], and other devices [48]. Hence, this complex behavior of humans opens up the avenues of neural network artificial intelligence for tracking and predicting the neuromarketing phenomenon [53,57,92]. The neural network artificial intelligence gauge the neural activity of the human brain [52,54,93] regarding the effectiveness of any phenomenon, such as consumer buying behavior due to the underline causes, and produces predictive consumer buying behavior through artificial intelligence (neural network) [55,60]. However, we cannot 100% predict human behavior and brain activity through artificial intelligence (neural network), but we have identified another model to predict the neuromarketing phenomenon [58,89]. As we know, that neural network (artificial intelligence) is successfully used in Google search engines, YouTube social media, and other online media [89], and results have coincided with the human brain [83,88,90]. Therefore, we can say that artificial intelligence (neural network) is an effective tool for predicting the human brain in social sciences [57,80,91]. This research is essential and has a uniqueness in that we successfully employed neural networks (artificial intelligence) in social science topics such as to predict the consumer buying behavior regarding the critical characteristics of an advertisement [85,92,93,94], which can change the human behavior to establish the efficacy of advertisement of certain brands. Thus, the findings of this research might be generalized to the modeling and methodology for future neuromarketing studies.

6. Conclusions

The marketing world has recently begun to use neurological tests more frequently to understand consumers’ behavior better. With neuromarketing, it is possible to determine consumers’ reactions regarding a product or brand they watch in an advertisement or see where the brain is moving. The information from the previous literature shed light on the subjects such as product packaging, product features, creative value, conviction value, brand development, brand identification, pricing, promotion mix design, store atmosphere, and effective sales. The previous literature demonstrated that fMRI, EEG, eye-tracking, and other monitoring techniques are extensively used. Additionally, we discussed several techniques that are being used in neuromarketing. The current tools used in neuromarketing are costly, and not every researcher has access to these tools for neuromarketing studies. The prime objective of this research is to examine the artificial neural network as an alternative technique in neuromarketing research studies due to its cost-effectiveness and powerful tool in today’s marketing arena. The data was analyzed with two applications in this study; data was tested with ten different predictors (product packaging, product features, target audience, memorizing value, conviction value, ad content, time slot, creative value, glamourization, and celebrity endorsement) for meaningful results. In the first application, the effect of the independent variables on the consumer buying behavior (dependent variable) was observed, and forecasted simulated readings of consumer buying behavior were generated. However, the second application of artificial neural networks served as a neuromarketing tool to examine the predictive importance of independent variables on the predicted consumer buying behavior. The study concluded that artificial neural networks successfully generated the simulated values of predicted consumer buying behavior and estimated the effects of predictors on consumer buying behavior. Thus, this research provided a powerful and cost-effective tool for neuromarketing studies. Future researchers may replicate the methods of this research in their future studies to analyze the neuromarketing phenomenon. The brand and marketing managers may also use this method to gauge the effectiveness of their marketing campaigns. The study has been done only on the consumer buying behavior and ten imperative predictors or characteristics of an advertisement, which can change the human thinking pattern. However, more comprehensive research might be carried out to understand the entire phenomenon of neuromarketing using neural networks in artificial intelligence.

6.1. Theoretical and Practical Implications

The research has several theoretical implications, such as the coming researchers employing neural network (artificial intelligence) modeling to predict the neuromarketing phenomenon. The current devices such as fMRI, eye tracking, magnetoencephalography (MEG), transcranial magnetic stimulation (TMS), and others that gauge the neuromarketing phenomenon have a hefty cost and cannot be bearable to the researchers to carry out their neuromarketing studies. Additionally, there is no conclusive evidence that the results of fMRI, eye tracking, Magnetoencephalography (MEG), Transcranial magnetic stimulation (TMS), and other expensive devices are not 100% accurate at different periods with the same subjects. Therefore, the neural network is an alternative cost-saving modeling technique for neuromarketing subjects with the help of artificial intelligence. Future researchers may use the artificial neural network for tracking the neuromarketing phenomenon for human decision-making in different fields of the industries. Thus, they can replicate the study’s methodology in their future research studies. On the other hand, brand managers of the services and manufacturing sectors can use artificial intelligence (neural networks) to estimate the effectiveness of advertisements for their brands. Thus, they can incorporate the findings in their advertisement and marketing strategies at minimal cost, and ROMI can be enhanced by using a neural network (artificial intelligence).

6.2. Limitations and Potential Areas of Future Studies

This study has provided neuromarketing subjects’ fundamental framework and modeling technique (neural network in artificial intelligence). However, this research has certain limitations; for instance, we used a five-point Likert scale. For more robust outcomes, the scaling range might be increased to 100 (scale 1–100) to gauge the complex human behavior due to the brain’s changing thinking in neuromarketing studies. To make this modeling more concrete and authentic, there is a need to conduct further neuromarketing subjective studies with diverse topics using neural networks (artificial intelligence). Comparative neuromarketing studies might be conducted between fMRI, eye tracking, magnetoencephalography (MEG), transcranial magnetic stimulation (TMS), and neural network techniques to establish the importance and robustness of artificial intelligence (neural network) in social sciences and specifically in neuromarketing studies.

Supplementary Materials

The following supporting information can be downloaded at: https://www.mdpi.com/article/10.3390/su14148546/s1, Supplementary File S1—Data analysis Multilayer Perceptron (Neuromarketing).

Author Contributions

Conceptualization, R.R.A. and D.S.; methodology, R.R.A. and Z.A.C.; investigation, H.A.S. and J.S.; formal analysis, G.L.K. and D.S.; resources, G.L.K.; writing—original draft preparation, D.S. and R.R.A.; writing—review and editing, Z.A.C. and H.A.S.; visualization, J.S.; validation, G.L.K.; supervision, R.R.A. and D.S.; funding acquisition, G.L.K. and J.S. All authors have read and agreed to the published version of the manuscript.

Funding

This research received no external funding.

Institutional Review Board Statement

Not applicable.

Informed Consent Statement

Not applicable.

Data Availability Statement

Data is provided in Supplementary Materials File S1.

Conflicts of Interest

The authors declare no conflict of interest.

References

  1. Gurgu, R.; Gurgu, I.; Tonis, R. Neuromarketing for a better understanding of consumer needs and emotions. Indep. J. Manag. Prod. 2020, 11, 208–235. [Google Scholar] [CrossRef]
  2. Hafez, M. Neuromarketing: A new avatar in branding and advertisement. Pac. Bus. Rev. Int. 2019, 12, 58–64. [Google Scholar]
  3. Harris, J.; Ciorciari, J.; Gountas, J. Consumer neuroscience and digital/social media health/social cause advertisement effectiveness. Behav. Sci. 2019, 9, 42. [Google Scholar] [CrossRef] [PubMed] [Green Version]
  4. Vences, N.A.; Díaz-Campo, J.; Rosales, D.F.G. Neuromarketing as an Emotional Connection Tool Between Organizations and Audiences in Social Networks. A Theoretical Review. Front. Psychol. 2020, 11, 1787. [Google Scholar] [CrossRef] [PubMed]
  5. Lim, W.M. Demystifying neuromarketing. J. Bus. Res. 2018, 91, 205–220. [Google Scholar] [CrossRef]
  6. Fisher, C.E.; Chin, L.; Klitzman, R. Defining neuromarketing: Practices and professional challenges. Harv. Rev. Psychiatry 2010, 18, 230–237. [Google Scholar] [CrossRef]
  7. Wilson, M.R.; Gaines, J.; Hill, R.P. Neuromarketing and consumer free will. J. Consum. Aff. 2008, 42, 389–410. [Google Scholar] [CrossRef]
  8. Laybourne, P.; Lewi, D. Neuromarketing: The future of consumer research? Admap 2005, 461, 28–30. [Google Scholar]
  9. Sano, Y.; Takayasu, H.; Havlin, S.; Takayasu, M. Identifying long-term periodic cycles and memories of collective emotion in online social media. PLoS ONE 2019, 14, e0213843. [Google Scholar] [CrossRef]
  10. Lee, N.; Broderick, A.J.; Chamberlain, L. What is “neuromarketing”? A discussion and agenda for future research. Int. J. Psychophysiol. 2006, 63, 199–204. [Google Scholar] [CrossRef]
  11. Hsu, L.; Chen, Y.-J. Neuromarketing, subliminal advertising, and hotel selection: An EEG study. Australas. Mark. J. 2020, 28, 200–208. [Google Scholar] [CrossRef]
  12. Suomal, J.; Palokangas, L.; Leminen, S.; Westerlund, M.; Heinonen, J.; Numminen, J. Neuromarketing: Understand customers’ subconscious responses to marketing. Technol. Innov. Manag. Rev. 2012, 2, 12–21. [Google Scholar] [CrossRef]
  13. Ponnam, A. A case for customer based brand equity conceptualization within motivational perspective. Acad. Mark. Stud. J. 2011, 15, 61–70. [Google Scholar]
  14. Peterson, R.L. The neuroscience of investing: fMRI of the reward system. Brain Res Bull. 2005, 67, 391–397. [Google Scholar] [CrossRef] [PubMed]
  15. Ariely, D.; Berns, G.S. Neuromarketing: The hope and hype of neuroimaging in business. Nat. Rev. Neurosci. 2010, 11, 284–292. [Google Scholar] [CrossRef] [Green Version]
  16. Hammou, K.A.; Galib, M.H.; Melloul, J. The Contributions of Neuromarketing in Marketing Research. J. Manag. Res. 2013, 5, 20–33. [Google Scholar] [CrossRef] [Green Version]
  17. Murphy, E.R.; Illes, J.; Reiner, P.B. Neuroethics of neuromarketing. J Consum Behav. 2008, 7, 293–302. [Google Scholar] [CrossRef] [Green Version]
  18. Crespo-Pereira, V.; Legerén-Lago, B.; Arregui-McGullion, J. Implementing Neuromarketing in the Enterprise: Factors That Impact the Adoption of Neuromarketing in Major Spanish Corporations. Front. Commun. 2020, 5, 576789. [Google Scholar] [CrossRef]
  19. Renvoise, C.; Morin, P. Neuromarketing: Understanding the "Buy Button" in Your Customer’s Brain; Thomas Nelson Publishers: Nashville, TN, USA, 2007. [Google Scholar]
  20. Morin, C. Neuromarketing: The new science of consumer behavior. Society 2011, 48, 131–135. [Google Scholar] [CrossRef] [Green Version]
  21. Marcel, P.; Lacramioara, R.; Maniu, I.; Zaharie, M. Neuromarketing—Getting inside the customer’s mind. Ann. Univ. Oradea Econ. Sci. 2009, 4, 804–807. [Google Scholar]
  22. Al-Sharif, A.H.; Salleh, N.Z.M.; Baharun, R.; Yusoff, M.F. Consumer Behaviour Through Neuromarketing Approach. J. Contemp. Issues Bus. Gov. 2021, 27, 344–354. [Google Scholar] [CrossRef]
  23. Kurtoğlu, A.L.; Ferman, A.M. An exploratory research among fashion business leaders and neuromarketing company executives on the perception of applied neuromarketing. Pressacademia 2020, 11, 230–232. [Google Scholar] [CrossRef]
  24. Juarez, D.; Tur-Viñes, V.; Mengual, A. Neuromarketing Applied to Educational Toy Packaging. Front. Psychol. 2020, 11, 2077. [Google Scholar] [CrossRef] [PubMed]
  25. Vidal-Raméntol, S. Neuromarketing and Sustainability. Adv. Soc. Sci. Res. J. 2020, 7, 181–191. [Google Scholar] [CrossRef]
  26. Schreiner, M.; Fischer, T.; Riedl, R. Impact of content characteristics and emotion on behavioral engagement in social media: Literature review and research agenda. Electron. Comm. Res. 2019, 21, 329–345. [Google Scholar] [CrossRef] [Green Version]
  27. Sheline, Y.I. 3D MRI studies of neuroanatomic changes in unipolar major depression: The role of stress and medical comorbidity. Biol. Psychiatry 2000, 48, 791–800. [Google Scholar] [CrossRef]
  28. Nash, K.; Johansson, A.; Yogeeswaran, K. Social media approval reduces emotional arousal for people high in narcissism: Electrophysiological evidence. Front. Hum. Neurosci. 2019, 13, 292. [Google Scholar] [CrossRef]
  29. Hubert, M. Does neuroeconomics give new impetus to economic and consumer research? J. Econ. Psychol. 2010, 31, 812–817. [Google Scholar] [CrossRef]
  30. Libert, A.; Van Hulle, M.M. Predicting premature video skipping and viewer interest from EEG recordings. Entropy 2019, 21, 1014. [Google Scholar] [CrossRef] [Green Version]
  31. Madan, C.R. Neuromarketing: The next step in market research? Eureka 2010, 1, 34–42. [Google Scholar] [CrossRef]
  32. Muñoz-Leiva, F.; Hernández-Méndez, J.; Gómez-Carmona, D. Measuring advertising effectiveness in Travel 2.0 websites through eye-tracking technology. Physiol. Behav. 2019, 200, 83–95. [Google Scholar] [CrossRef] [PubMed]
  33. Mañas-Viniegra, L.; Veloso, A.I.; Cuesta, U. Fashion promotion on Instagram with eye tracking: Curvy girl influencers versus fashion brands in Spain and Portugal. Sustainability 2019, 11, 3977. [Google Scholar] [CrossRef] [Green Version]
  34. Tovino, S.A. The confidentiality and privacy implications of functional magnetic resonance imaging. J. Law Med. Ethics 2005, 33, 844–850. [Google Scholar] [CrossRef] [PubMed]
  35. Lewinski, P.; Fransen, M.L.; Tan, E.S.H. Predicting advertising effectiveness by facial expressions in response to amusing persuasive stimuli. J. Neurosci. Psychol. Econ. 2014, 7, 1–14. [Google Scholar] [CrossRef] [Green Version]
  36. Guixeres, J.; Bigne, E.; Azofra, J.M.A.; Raya, M.A.; Granero, A.C.; Hurtado, F.F.; Ornedo, V.N. Consumer neuroscience-based metrics predict recall, liking and viewing rates in online advertising. Front. Psychol. 2017, 8, 1808. [Google Scholar] [CrossRef]
  37. Gómez-Adorno, H.; Markov, I.; Sidorov, G.; Posadas-Durán, J.P.; Sánchez-Pérez, M.; Chanona-Hernández, L. Improving feature representation based on a neural network for author profiling in social media texts. Comput. Intell. Neurosci. 2016, 2016, 1638936. [Google Scholar] [CrossRef] [Green Version]
  38. Racine, E.; Bar-Ilan, O.; Illes, J. FMRI in the public eye. Nat. Rev. Neurosci. 2005, 6, 159–164. [Google Scholar] [CrossRef] [Green Version]
  39. Eser, Z.; Isin, F.B.; Tolon, M. Perceptions of marketing academics, neurologists, and marketing professionals about neuromarketing. J. Mark. Manag. 2011, 27, 854–868. [Google Scholar] [CrossRef]
  40. Bault, N.; Rusconi, E. The art of influencing consumer choices: A reflection on recent advances in decision neuroscience. Front. Psychol. 2020, 10, 3009. [Google Scholar] [CrossRef] [Green Version]
  41. Shukla, A.K.; Kumar, U. Positron emission tomography: An overview. J. Med. Phys. 2006, 31, 13–21. [Google Scholar] [CrossRef]
  42. Fugate, D.L. Marketing services more effectively with neuromarketing research: A look into the future. J. Serv. Mark. 2008, 22, 170–173. [Google Scholar] [CrossRef]
  43. Kulich, R.; Maciewicz, R.; Scrivani, S.J. Functional magnetic resonance imaging (fMRI) and expert testimony. Am. Acad. Pain Med. 2009, 10, 373–380. [Google Scholar] [CrossRef] [PubMed] [Green Version]
  44. Mencarelli, L.; Neri, F.; Momi, D.; Menardi, A.; Ross, S.; Rossi, A.; Santarnecchi, E. Stimuli, presentation modality, and load-specific brain activity patterns during n-back task. Hum. Brain Mapp. 2019, 40, 3810–3831. [Google Scholar] [CrossRef] [Green Version]
  45. Breiter, H.C.; Aharon, I.; Kahneman, D.; Dale, A.; Shizgal, P. Functional imaging of neural responses to expectancy and experience of monetary gains and losses. Neuron 2001, 30, 619–639. [Google Scholar] [CrossRef] [Green Version]
  46. Reimann, M.; Schilke, O.; Weber, B.; Neuhaus, C.; Zaichkowsky, J. Functional magnetic resonance imaging in consumer research: A review and application. Psychol. Mark. 2011, 28, 608–637. [Google Scholar] [CrossRef]
  47. Ohme, R.; Reykowska, D.; Wiener, D.; Choromanska, A. Analysis of neurophysiological reactions to advertising stimuli by means of EEG and galvanic skin response measures. J. Neurosci. Psychol. Econ. 2009, 2, 21–31. [Google Scholar] [CrossRef] [Green Version]
  48. Fugate, D.L. Neuromarketing: A layman’s look at neuroscience and its potential application to marketing practice. J. Consum. Mark. 2007, 24, 385–394. [Google Scholar] [CrossRef]
  49. Samuel, B.S.; Prasanth, V.T. Neuromarketing: Is Campbell in soup? IUP J. Mark. Manag. 2012, 11, 76–100. [Google Scholar]
  50. Ambler, T.; Ioannides, A.; Rose, S. Brand on the brain: Neuro-images of advertising. Bus. Strategy Rev. 2000, 11, 17–30. [Google Scholar] [CrossRef]
  51. McClure, S.-M.; Li, J.; Tomlin, D.; Cypert, K.; Montague, L.; Montague, P. Neural Correlates of Behavioral Preference for Culturally Familiar Drinks. Neuron 2004, 44, 379–387. [Google Scholar] [CrossRef] [Green Version]
  52. Al-Abaid, S.A. Artificial Neural Network Based Image Encryption Technique. J. Adv. Res. Dyn. Control. Syst. 2020, 12, 1184–1189. [Google Scholar] [CrossRef]
  53. Chen, H.; Lu, F.; He, B. Topographic property of backpropagation artificial neural network: From human functional connectivity network to artificial neural network. Neurocomputing 2020, 418, 200–210. [Google Scholar] [CrossRef]
  54. Lv, X.; Yang, Y.; Qin, D.; Cao, X.; Xu, H. Artificial intelligence service recovery: The role of empathic response in hospitality customers’ continuous usage intention. Comput. Hum. Behav. 2022, 126, 106993. [Google Scholar] [CrossRef]
  55. Vijayan, V.; Rubasundram, G.A. Artificial Neural Network (ANN): An Artificial Intelligent (AI) Tool to Predict Fraudulent Financial Reporting and Financial Distress. Int. J. Psychosoc. Rehabil. 2020, 24, 1215–1226. [Google Scholar] [CrossRef]
  56. Maillefer, V.A.; Udayar, S.; Fiori, M. Enhancing the Prediction of Emotionally Intelligent Behavior: The PAT Integrated Framework Involving Trait EI, Ability EI, and Emotion Information Processing. Front. Psychol. 2018, 9, 1078. [Google Scholar] [CrossRef] [Green Version]
  57. Banjade, D. Forecasting Bitcoin Price using Artificial Neural Network. SSRN Electron. J. 2020, 1–13. [Google Scholar] [CrossRef]
  58. Chan, V.K.H.; Chan, C.W. Towards explicit representation of an artificial neural network model: Comparison of two artificial neural network rule extraction approaches. Petroleum 2020, 6, 329–339. [Google Scholar] [CrossRef]
  59. Macukow, B. Neural Networks—State of Art, Brief History, Basic Models and Architecture. In Computer Information Systems and Industrial Management; CISIM 2016. Lecture Notes in Computer Science (LNCS), 9842; Saeed, K., Homenda, W., Eds.; Springer: Cham, Switzerland, 2016. [Google Scholar] [CrossRef] [Green Version]
  60. Alblushi, A. Face Recognition Based on Artificial Neural Network: A Review. Artif. Intell. Robot. Dev. J. 2021, 1, 116–131. [Google Scholar] [CrossRef]
  61. Li, L.; Zhang, Z.; Lu, J. Artificial fly visual joint perception neural network inspired by multiple-regional collision detection. Neural Netw. 2021, 135, 13–28. [Google Scholar] [CrossRef]
  62. Barai, D.P.; Bhanvase, B.A.; Pandharipande, S.L. Artificial neural network for prediction of thermal conductivity of rGO–metal oxide nanocomposite-based nanofluids. Neural Comput. Appl. 2021, 34, 271–282. [Google Scholar] [CrossRef]
  63. Shahiri, A.M.; Husain, W.; Rashid, A.N. A review on predicting student’s performance using data mining techniques. Procedia Comput. Sci. 2015, 72, 414–422. [Google Scholar] [CrossRef] [Green Version]
  64. Macfadyen, L.P.; Dawson, S. Mining LMS data to develop an “early warning system” for educators: A proof of concept. Comput. Educ. 2010, 54, 588–599. [Google Scholar] [CrossRef]
  65. Lykourentzou, I.; Giannoukos, I.; Mpardis, G.; Nikolopoulos, V.; Loumos, V. Early and dynamic student achievement prediction in e-learning courses using neural networks. J. Am. Soc. Inf. Sci. 2009, 60, 372–380. [Google Scholar] [CrossRef]
  66. Kanakana, G.M.; Olanrewaju, A.O. Predicting student performance in engineering education using an artificial neural network at Tshwane university of technology. In Proceedings of the International Conference on Industrial Engineering, Systems Engineering and Engineering Management for Sustainable Global Development, Stellenbosch, South Africa, 21–23 September 2011; pp. 1–7. [Google Scholar]
  67. Shaikh, R.; Shirazian, S.; Walker, G.M. Application of artificial neural network for prediction of particle size in pharmaceutical cocrystallization using mechanochemical synthesis. Neural. Comput. Appl. 2021, 33, 12621–12640. [Google Scholar] [CrossRef]
  68. Tonbul, T. Sales Forecast in FMCG Sector with Artificial Neural Networks. Project; Istanbul Technical University: Istanbul, Turkey, 2019. [Google Scholar] [CrossRef]
  69. Aka, H.; Aktuğ, Z.B.; Kılıç, F. Estimating the England Premier League Ranking with Artificial Neural Network. Appl. Artif. Intell. 2021, 35, 393–402. [Google Scholar] [CrossRef]
  70. Panda, S.; Panda, G. Performance Evaluation of a New BP Algorithm for a Modified Artificial Neural Network. Neural Process. Lett. 2020, 51, 1869–1889. [Google Scholar] [CrossRef]
  71. Duong, H.T.; Phan, H.C.; Tran, T.M.; Dhar, A.S. Assessment of critical buckling load of functionally graded plates using artificial neural network modeling. Neural Comput. Appl. 2021, 33, 16425–16437. [Google Scholar] [CrossRef]
  72. Jayne, C.; Lanitis, A.; Christodoulou, C. Neural network methods for one-to-many multi-valued mapping problems. Neural Comput. Appl. 2011, 20, 775–785. [Google Scholar] [CrossRef]
  73. Das, S. A Comparative Study of Legendre Neural Network and Chebyshev Functional Link Artificial Neural Network for Diabetes Data Classification. Int. J. Eng. Res. 2020, V9. [Google Scholar] [CrossRef]
  74. Pang, Z.; Niu, F.; O’Neill, Z. Solar radiation prediction using recurrent neural network and artificial neural network: A case study with comparisons. Renew. Energy 2020, 156, 279–289. [Google Scholar] [CrossRef]
  75. Mohammed, S.; Ramos, C.; Fang, W.C.; Kim, T.-H. Emerging higher-level artificial neural network-based intelligent systems. Neural Comput. Appl. 2021, 33, 4595–4597. [Google Scholar] [CrossRef]
  76. Song, J.; Zhang, Y.; Cheng, J.; Wang, S.; Liu, Z.; Sun, D. Non-invasive quantitative diagnosis of liver fibrosis with an artificial neural network. Neural Comput. Appl. 2021, 34, 6733–6744. [Google Scholar] [CrossRef]
  77. Awad, M.; Khanna, R. Deep Neural Networks. In Efficient Learning Machines; Apress: Berkeley, CA, USA, 2015. [Google Scholar] [CrossRef] [Green Version]
  78. Li, K.; Ramkumar, S.; Thimmiaraja, J.; Diwakaran, S. Optimized artificial neural network based performance analysis of wheelchair movement for ALS patients. Artif. Intell. Med. 2020, 102, 101754. [Google Scholar] [CrossRef] [PubMed]
  79. Wu, D.; Wang, G.G. Causal artificial neural network and its applications in engineering design. Eng. Appl. Artif. Intell. 2021, 97, 104089. [Google Scholar] [CrossRef]
  80. Fuengfusin, N.; Tamukoh, H. Network with Sub-networks: Layer-wise Detachable Neural Network. J. Robot. Netw. Artif. Life 2020, 7, 240. [Google Scholar] [CrossRef]
  81. Teles, G.; Rodrigues, J.J.P.C.; Rabê, R.A.L.; Kozlov, S.A. Artificial neural network and Bayesian network models for credit risk prediction. J. Artif. Intell. Syst. 2020, 2, 118–132. [Google Scholar] [CrossRef]
  82. Lawal, A.I.; Kwon, S.; Kim, G.Y. Prediction of an environmental impact of tunnel blasting using ordinary artificial neural network, particle swarm and Dragonfly optimized artificial neural networks. Appl. Acoust. 2021, 181, 108122. [Google Scholar] [CrossRef]
  83. Sharma, A.; Soni, S.; Rai, K. Link Prediction in Social Network using Artificial Neural Network. Int. J. Comput. Appl. 2021, 174, 26–30. [Google Scholar] [CrossRef]
  84. Allahyari, E. Application of artificial neural network in predicting EI. BioMedicine 2020, 10, 18–24. [Google Scholar] [CrossRef]
  85. Mitra, S.; Nigam, R. Artificial Neural Network Methods for Prediction of River Flow. Adalya J. 2020, 9. [Google Scholar] [CrossRef]
  86. Paliwal, M.; Kumar, U.A. A study of academic performance of business school graduates using neural network and statistical techniques. Expert Syst. Appl. 2009, 36, 7865–7872. [Google Scholar] [CrossRef]
  87. Feng, Y.; Hao, L. Testing Randomness Using Artificial Neural Network. IEEE Access. 2020, 8, 163685–163693. [Google Scholar] [CrossRef]
  88. Sidorov, O.Y.; Aristova, N.A. Simulation of Coke Quality Indicators Using Artificial Neural Network. KnE Eng. 2020, 2020, 21–28. [Google Scholar] [CrossRef] [Green Version]
  89. Mirza, M. Detecting Depression in Elderly People by Using Artificial Neural Network. Elder. Health J. 2020, 6, 103–108. [Google Scholar] [CrossRef]
  90. Saima, H.; Ahmed, R.R.; Shamsi, A.F. Technology Confirmation is associated to Improved Psychological Wellbeing: Evidences from an Experimental Design. Transform. Bus. Econ. 2021, 20, 177–196. [Google Scholar]
  91. Parmar, V.; Channar, Z.A.; Ahmed, R.R.; Štreimikienė, D.; Pahi, M.H.; Streimikis, J. Assessing the organizational commitment, subjective vitality and burnout effects on turnover intention in private universities. Oeconomia Copernic. 2022, 13, 251–286. [Google Scholar] [CrossRef]
  92. Kim, S.A.; Kim, S.H.; Hamann, S. Neural and self-reported responses to antisocial news stories: Entertaining versus traditional news introduction. Comput. Hum. Behav. 2022, 126, 106994. [Google Scholar] [CrossRef]
  93. Štreimikienė, D.; Mikalauskienė, A.; Sturienė, U.; Kyriakopoulos, G.L. The impact of social media on sales promotion in entertainment companies. E&M Ekon. Manag. 2021, 24, 189–206. [Google Scholar] [CrossRef]
  94. Ahmed, R.R.; Štreimikienė, D.; Berchtold, G.; Vveinhardt, J.; Channar, Z.A.; Soomro, R.H. Effectiveness of online digital media advertising as a strategic tool for building brand sustainability: Evidence from FMCGs and Services sectors of Pakistan. Sustainability 2019, 11, 3436. [Google Scholar] [CrossRef] [Green Version]
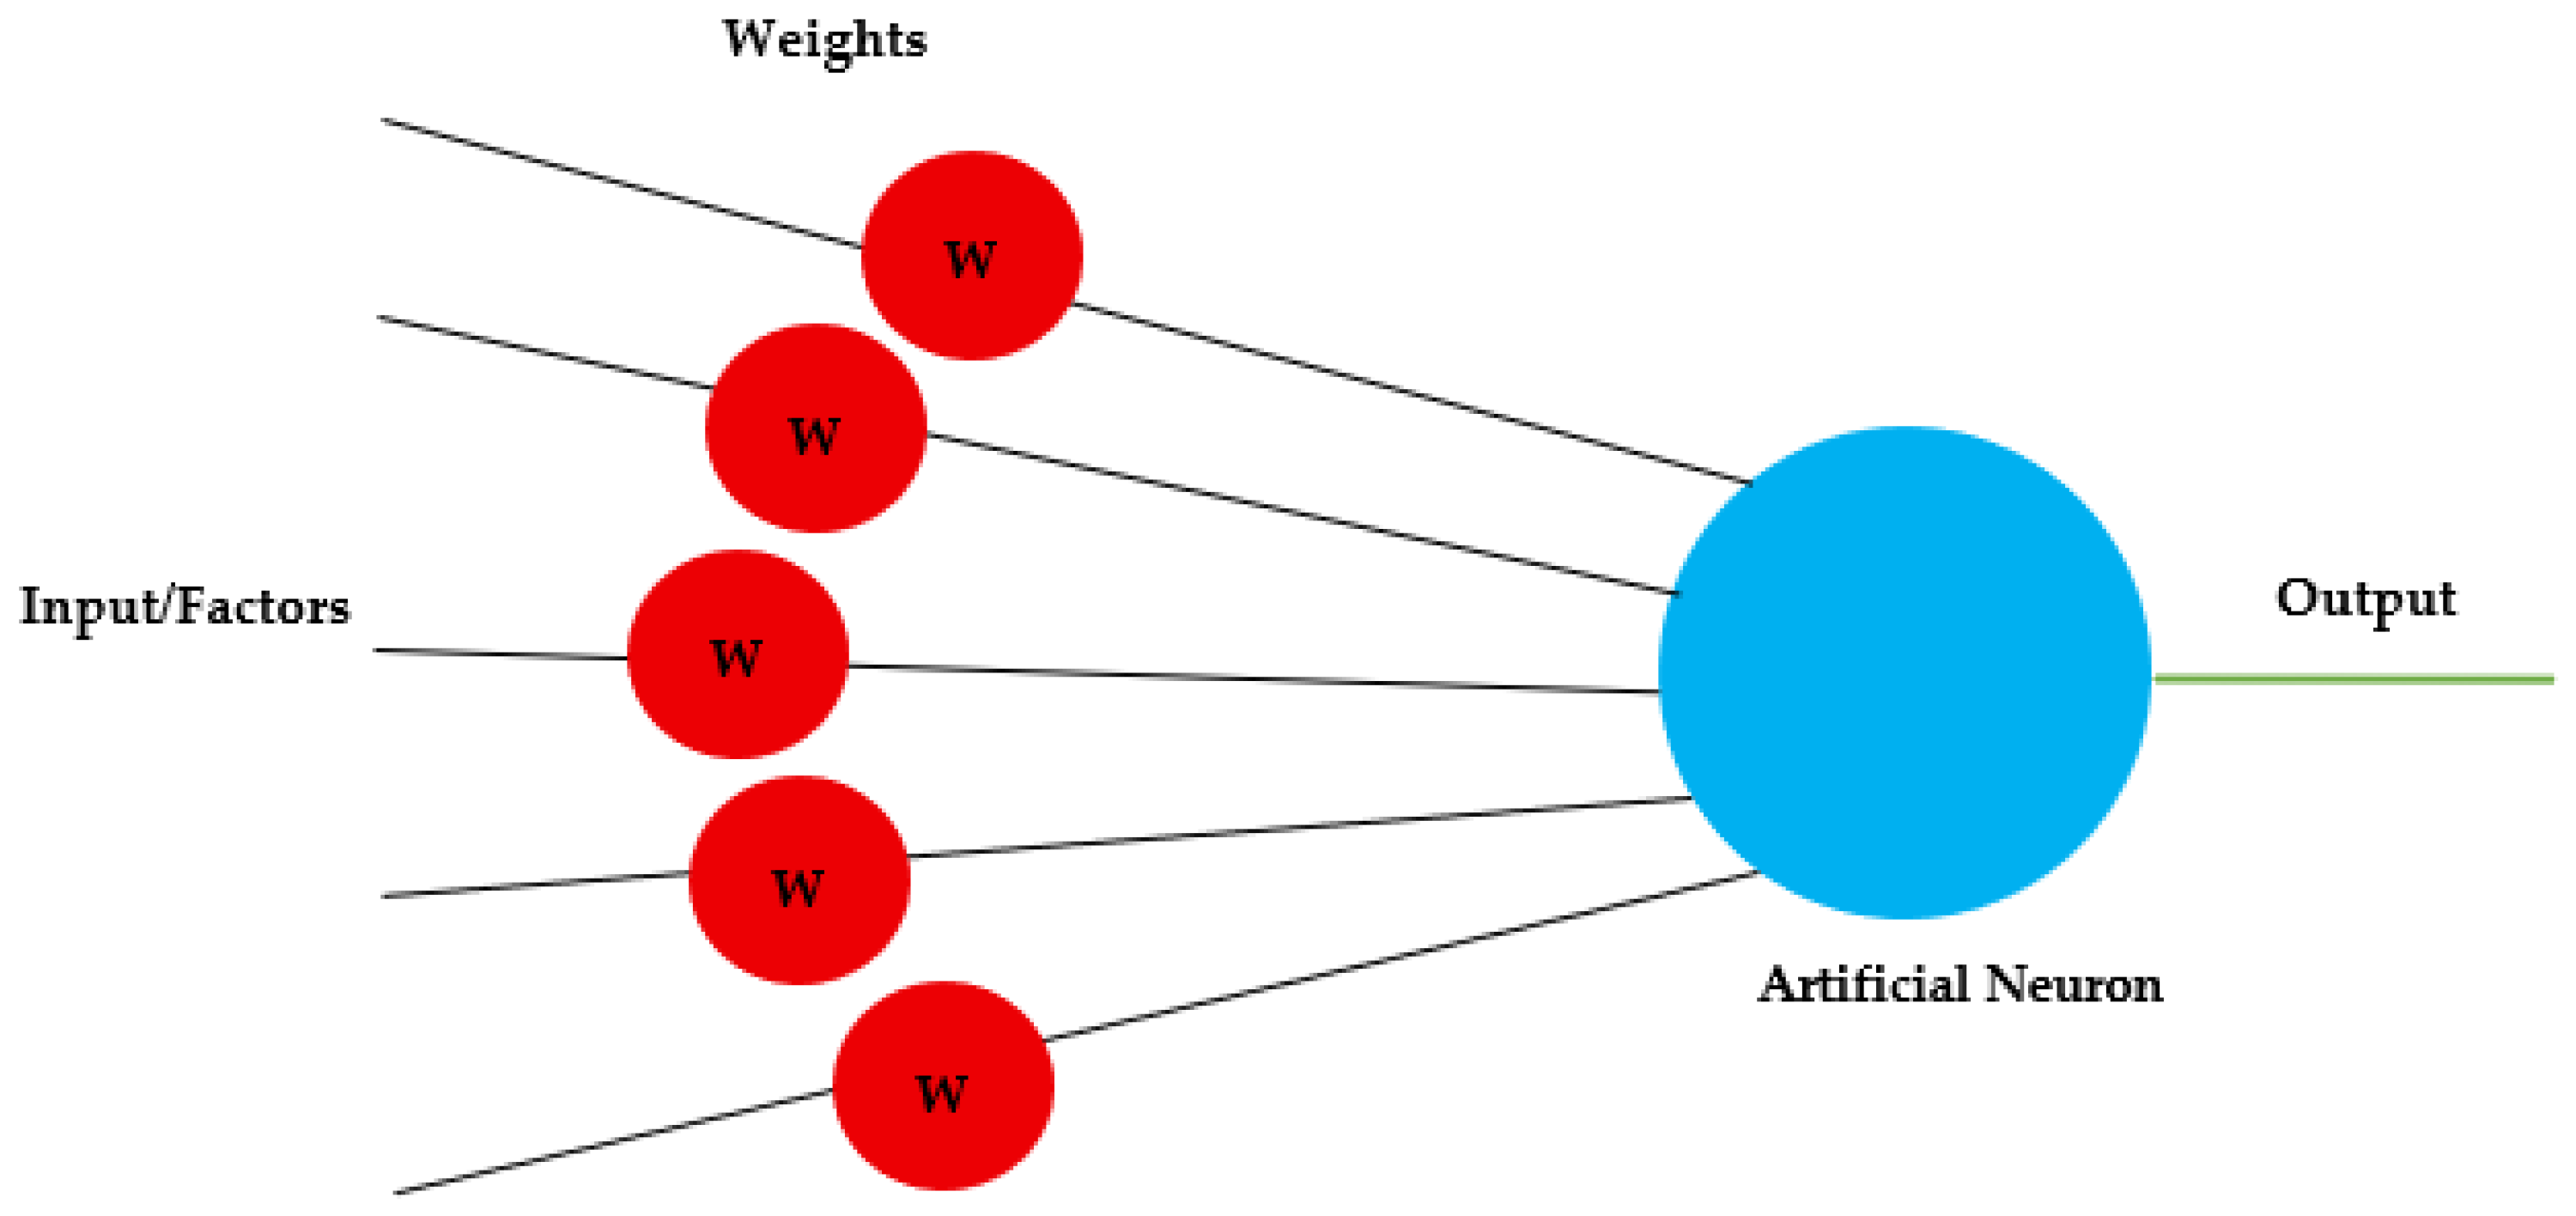
Figure 1. Simple representation of artificial neural networks.
Sustainability 14 08546 g001
Figure 2. Layers of artificial neural networks.
Sustainability 14 08546 g002
Figure 3. Representation of artificial nerve cells.
Sustainability 14 08546 g003
Figure 4. Architectural diagram of first application proposed model of the study. Where: CB = Consumer behavior; PF = Product features; AC = Advertisement content; TA = Target audience; CE = Celebrity endorsement; GL = Glamorization; CV = Creative values; PP = Product packaging; TS = Time slot; CNV = Conviction value; MV = Memorizing value; ε = Bias or Error.
Sustainability 14 08546 g004
Figure 5. Model of the first application.
Sustainability 14 08546 g005
Figure 6. Normalized importance.
Sustainability 14 08546 g006
Figure 7. Architectural representation of the second application of the proposed model. Where: CB = Consumer behavior; PF = Product features; AC = Advertisement content; TA = Target audience; CE = Celebrity endorsement; GL = Glamorization; CV = Creative values; PP = Product packaging; TS = Time slot; CNV = Conviction value; MV = Memorizing value; P = Predicted; ε = Bias or Error.
Sustainability 14 08546 g007
Figure 8. Model of the second application.
Sustainability 14 08546 g008
Figure 9. Normalized importance.
Sustainability 14 08546 g009
Table 1. Case processing summary.
NPercent
SampleTraining41470.8%
Testing17129.2%
Valid585100.0%
Excluded0
Total585
Table 2. Model Summary.
TrainingSum of Squares Error1.973
Relative Error0.010
Stopping Rule UsedOne consecutive step(s) with no decrease in error a
Training Time0:00:00.13
TestingSum of Squares Error1.539
Relative Error0.019
Dependent variable: consumer buying behavior. a. Error computations are based on the testing sample.
Table 3. Parameter estimates.
PredictorsPredicted
Hidden Layer 1Output
H(1:1)H(1:2)H(1:3)H(1:4)H(1:5)H(1:6)H(1:7)H(1:8)H(1:9)Consumer_Buying_Behavior
Input Layer(Bias)1.074−0.637−0.2790.321−0.456−0.2610.8080.492−0.226
Product_Features0.534−0.440−0.3370.5820.2880.019−0.6090.104−0.140
Adv_Content0.3150.207−0.192−0.094−0.1970.3580.705−0.409−0.287
Target_Audience−0.201−0.231−0.2430.820−0.2610.1700.744−0.3160.339
Celebirity_Endorsement−0.7310.3640.743−0.246−0.5280.0310.0280.034−0.494
Glamourization0.380−0.551−0.1400.4200.419−0.1710.437−0.164−0.458
Creative_Value−0.0540.2030.5760.2570.2290.1550.412−0.434−0.397
Product_Packaging0.369−0.2940.138−0.3830.0910.386−0.115−0.129−0.450
Memorizing_Value0.1520.1430.010−0.130−0.005−0.290−0.176−0.492−0.184
Conviction_Value0.000−0.236−0.6060.440−0.177−0.1280.4380.0860.077
Time_Slot−0.3480.1640.3110.234−0.2290.0560.1880.324−0.267
Hidden Layer 1(Bias) −0.551
H(1:1) 0.883
H(1:2) −0.688
H(1:3) 0.925
H(1:4) 0.544
H(1:5) −0.331
H(1:6) 0.467
H(1:7) −0.797
H(1:8) −0.035
H(1:9) −0.273
Table 4. Independent variable importance.
PredictorsImportanceNormalized Importance
Product Features0.18791.6%
Advertisement Content0.07134.8%
Target Audience0.05326.2%
Celebrity Endorsement0.10350.4%
Glamourization0.10652.2%
Creative Value0.07838.2%
Product Packaging0.204100.0%
Memorizing Value0.02612.6%
Conviction Value0.10551.6%
Time Slot0.06833.6%
Table 5. Model summary.
TrainingSum of Squares Error0.871
Relative Error0.004
Stopping Rule UsedOne consecutive step(s) with no decrease in error a
Training Time0:00:00.10
TestingSum of Squares Error0.926
Relative Error0.010
Dependent Variable: Predicted value for consumer buying behavior. a. Error computations are based on the testing sample.
Table 6. Parameter estimates.
PredictorsPredicted
Hidden Layer 1Output Layer
H(1:1)H(1:2)H(1:3)H(1:4)H(1:5)H(1:6)H(1:7)MLP Predicted Value
Input Layer(Bias)0.0190.4230.243−0.325−0.440−0.6070.371
Product_Features0.173−0.1360.2520.430−0.804−0.1220.529
Adv_Content−0.096−0.0560.060−0.0410.025−0.015−0.531
Target_Audience0.808−0.117−0.0690.189−0.428−0.0950.356
Celebirity_Endorsement−0.5660.2291.0280.0940.0510.162−0.776
Glamourization0.1470.0690.0090.130−0.332−0.2620.545
Creative_Value−0.463−0.443−0.326−0.737−0.2960.212−0.418
Product_Packaging−0.5260.521−0.3670.0670.3530.3560.689
Memorizing_Value0.0590.618−0.212−0.1230.431−0.0500.321
Conviction_Value−0.2600.3380.3560.1400.6670.232−0.339
Time_Slot0.3610.5480.276−0.075−0.8310.392−0.350
Hidden Layer 1(Bias) −0.227
H(1:1) −0.948
H(1:2) −0.614
H(1:3) 0.819
H(1:4) −0.364
H(1:5) −0.811
H(1:6) 0.638
H(1:7) 0.933
Table 7. Independent variable importance.
PredictorsImportanceNormalized Importance
Product Features0.200100.0%
Advertisement Content0.04924.5%
Target Audience0.07336.3%
Celebrity Endorsement0.12864.3%
Glamourization0.08642.9%
Creative Value0.13467.2%
Product Packaging0.10954.6%
Memorizing Value0.10351.8%
Conviction Value0.06432.0%
Time_Slot0.05427.2%
Publisher’s Note: MDPI stays neutral with regard to jurisdictional claims in published maps and institutional affiliations.