Abstract
CO2 emissions embodied in domestic trade between Japanese prefectures are gradually increasing and becoming an important growth point in the country’s CO2 emissions. The primary objective of this study is to evaluate the CO2 emissions embodied in Japan’s domestic imports and exports to visualize the carbon transfer paths between prefectures according to the attributes of production and consumption: also to identify the influencing factors of the carbon flow. This study estimated the CO2 emissions embodied in domestic imports and exports by prefectures using input–output analysis, followed by the log-mean Divisia index decomposition approach, which is used to quantify the influencing factor of net export CO2 emissions across prefectures. The results show substantial regional differences in the CO2 emissions embodied in domestic imports and exports across prefectures. Manufacturing prefectures satisfy most of Japan’s domestic demand for industrial products and are the main net exporters of CO2 emissions. Carbon flow is more obvious in economically advanced regions (such as the Kanto and Kansai regions) and covers more prefectures through carbon transfer. Consumer prefectures import the most CO2 emissions and export large amounts of CO2 emissions to other prefectures. Among the three factors influencing net export CO2 emissions, the technology effect has the most significant impact through the carbon intensity of domestic trade flows. These findings highlight the substantial differences in CO2 emissions embodied in domestic trade and the influencing factors across prefectures in Japan. The responsibility for emission reduction is attributable to both manufacturing and consumer prefectures.
1. Introduction
1.1. Background
Japan is the world’s third-largest economy and also the world’s fifth-largest emitter of greenhouse gas (GHG) and carbon dioxide (CO2) emissions [1]: therefore, Japan’s emission reduction policies are significant for dealing with climate change. After 2013, Japan’s CO2 emissions showed a downward trend as a whole, and its reduction rate of CO2 emissions in the G7 was second only to that of the United Kingdom (UK) [2], which itself heavily intervenes in Japan’s active emission-reduction policy. In the 2015 Paris Agreement, the Japanese government set a target of reducing GHGs by 26% in 2030 compared with 2013. This target was further expanded to 46% in 2021 following the Japanese government’s 2020 announcement of its goal to be carbon neutral by 2050.
Against the background of the decrease in overseas market demand, Japan has committed to expanding domestic consumption in recent years to stimulate economic growth, which has promoted an increasing amount of trade between prefectures [3]. To adapt to the expanding domestic market, the commodity structure of interregional trade is also changing, thus impacting industrial production in every prefecture. Fossil fuels account for a large proportion of Japan’s energy structure, resulting in approximately 80% of the country’s GHGs being produced by energy-related CO2 emissions [4]. However, another characteristic of Japan’s CO2 emissions is that total indirect CO2 emissions are high, which is an obstacle to further emissions reduction. Moreover, in the 21st century, CO2 emissions embodied in interregional trade have gradually increased and become an important growth point for overall CO2 emissions [5]. Therefore, it is necessary to further understand the CO2 emissions embodied in domestic trade across prefectures to expand the potential for Japan’s emissions reduction.
In recent years, the financial situation of the central and local governments in Japan has remained grim, and regional economic development can no longer rely on financial support [6]. To stabilize the economy, Japan has further expanded domestic trade by developing circular economies, which have also greatly enhanced the economic links between prefectures. According to prefectural economic calculations compiled by the Cabinet Office in 2011 [7], net domestic exports accounted for a relatively high proportion of the gross regional product (GRP) in most prefectures of Japan, especially in economically advanced prefectures such as Tokyo. Meanwhile, there are differences in the degree of dependence on domestic trade among industry sectors. The manufacturing industry plays a leading role in both domestic imports and exports. In Japan’s heavy industry base, located in places like Chiba and Kanagawa, the domestic exports accounted for more than 60% of the GRP contributed by the chemical industry in 2011. Meanwhile, the service industry is also an important part of Japan’s domestic exports. In Tokyo and Osaka, Japanese megacities with concentrated populations, the commercial sector accounted for 29% and 30% of domestic exports, respectively. The economic driving forces of each prefecture differ with economic development. Manufacturing prefectures use their manufacturing industry (See Table A4 in the Appendix A for detailed matching between the manufacturing industry and sectors) as an economic growth point, whereas consumer prefectures use consumption to support their economic foundations. Therefore, the difference in the structure of trade flows between prefectures leads to different CO2 emissions being embodied in domestic imports and exports. Moreover, with the decentralization of the Japanese government, whether Japan’s emissions reduction goal can be achieved depends largely on the effectiveness of the measures in every prefecture [8].
There is a considerable amount of research on CO2 emissions stemming from Japan’s trade. To the best of our knowledge, however, no previous researchers have systematically evaluated the CO2 emissions embodied in Japan’s domestic trade at the prefectural level and identified the influencing factors, so here, we conduct a brief review of Japan’s CO2 emissions from trade. For a more detailed literature review on traded CO2 emissions, please refer to Section 1.2. Wang et al. [9] quantified the CO2 emissions from the added value in global trade, and proposed that Japan has been favored by global trade from both the economic and environmental perspectives. This global trade is accompanied by the transfer of energy: Jiang et al. [10] analyzed the spatial transfer pattern of Japan’s energy flow in global trade from 1995 to 2011; Wang and Zhou [11] evaluated the inequality in US–Japanese trade in 2000–2011 from the perspectives of the economy and CO2 emissions; Dou et al. [12] examined the potential impact of the trade openness of China, Japan, and South Korea on CO2 emissions in 1970–2019; Yoon et al. [13] also focused on China, Japan, and South Korea, and further assessed the drivers of changes in manufacturing CO2 emissions from trade among the three countries. Based on the inter-prefectural trade in Japan, Battuvshin et al. [14] evaluated the impact of forest biomass resources on the energy supply, while Sadayuki and Arimura [15] evaluated the carbon leakage of firms from the perspective of the interregional carbon trading system in Japan. Although the above research systematically analyzed the CO2 emissions embodied in Japan’s trade, there are still certain limitations. On the one hand, most research related to Japan’s traded CO2 emissions has focused on international trade, ignoring the impact of domestic trade between prefectures. On the other hand, most research has focused on analyzing the process of carbon transfer in trade, but lacks attention to the driving factors of carbon transfer, which could provide a theoretical basis for adjusting the structure of trade flow.
1.2. Literature Review
1.2.1. CO2 emissions Embodied in Trade
Despite promoting the development of the world economy, global trade also produces CO2 emissions, and Wu et al. [16] showed that CO2 emissions embodied in international trade comprise approximately 40% of global direct CO2 emissions. The trade volume of developed countries accounts for most of the global trade; thus, some studies have focused on the CO2 emissions embodied in developed countries’ trade. Wang and Zhou [11] calculated the CO2 emissions embodied in trade between Japan and the United States (US) from 2000 to 2011, and found that economic losses in the US outweighed the positive effects of carbon transfer between the two countries (Wang and Zhou, 2019). Qiang et al. [17] studied CO2 emissions embodied in German–US trade from 2000 to 2015, and found that the significance of the US in Germany’s external trade was greater than that in the US’s external trade. Kim and Tromp [18] quantified the CO2 emissions embodied in South Korea’s trade from 2000 to 2014, showing a greater trade-off between the environmental costs and economic benefits of trade.
With the reduction in regional tariffs, the CO2 emissions embodied in the trade of developing countries will surge [19]. Wang and Yang [20] investigated CO2 emissions embodied in Chinese–Indian trade and proposed that China was a net exporter of CO2 and a net exporter of trade. Kim and Tromp [21] quantified the CO2 emissions and added value embodied in Chinese–Brazilian trade, and showed that China’s position as a net CO2 emissions and net value-added exporter deepened from 2000 to 2014.
Developed countries specialize in relatively cleaner products and services with high value-added parts, whereas developing countries are stuck in pollution-intensive links with low value-added parts [22]. Therefore, intensive studies have evaluated CO2 emissions embodied in trade between developing and developed countries. Wang et al. [23] calculated the CO2 emissions embodied in trade between China and Australia from 2000 to 2014 and found that the net carbon outflow from China to Australia is concentrated in the textile and heavy manufacturing sectors. Wang et al. [24] evaluated the CO2 emissions embodied in trade between the largest net exporter among developing countries (China) and the largest net exporter among developed countries (Germany), finding that CO2 emissions are mainly concentrated in carbon-intensive industrial sectors. Qiang et al. [25] studied the decoupling of CO2 emissions embodied in Sino–US trade and showed that it is relatively invariable and gradually improving.
1.2.2. Regional Carbon Transfers
Many studies have further analyzed the transfer paths of CO2 emissions embodied in trade based on trade flow. As trade structure is affected by economic level, developing countries are often net exporters of CO2 emissions, whereas developed countries are usually net importers [9]. Wu et al. [26] estimated the CO2 emission flows between China and Japan from 2000 to 2009 and found that China was a net exporter of CO2 emissions embodied in Chinese–Japanese trade. Zhao et al. [27] also focused on the CO2 emissions embodied in trade between Japan and China, further extending the research period from 1995 to 2009, and showed that CO2 emissions embodied in China’s exports increased by approximately 100%. Long et al. [28] compared CO2 emission flows through imports, exports, production, and consumption to analyze the differences between China and Japan. Xu et al. [29] decomposed the CO2 emission processes embodied in global trade and traced critical carbon transfer paths, finding that most transfer paths in the US end in services, whereas in China, they end in construction. Xu et al. [30] investigated carbon transfers between mainland China and its trade partners to quantify mitigation targets and allocate responsibilities: they showed that net carbon transfer paths from China driven by trading partners accounted for 87% of the total number of paths.
Moreover, some studies consider countries’ economies to be heterogeneous, multiregional, integrated wholes to analyze in-country carbon transfer [31]. Wei et al. [32] investigated the electricity-related CO2 emissions and added value embodied in China’s interprovincial trade from 2007 to 2012, showing that 20–80% of electricity-related CO2 emissions and 15–70% of the value added to a province’s final demand are outsourced to other provinces. Wang and Hu [33] evaluated carbon transfers caused by interprovincial demand and interprovincial exports for China in 2007, 2010, and 2012. Relatively few studies have been conducted on carbon transfer in Japan’s interregional trade: Yi et al. [34] combined prefecture-specific emission databases and technology matrices with the interregional trade flows presented by the nine-region multiregional input–output (MRIO) table to observe the effects of four environmental burdens in Japan; Hasegawa et al. [35] estimated carbon leakage in 47 prefectures and considered the structure of emissions at the regional level from the standpoint of consumer and producer responsibility in Japan in 2005.
1.3. Research Objective
Trade accelerates the transfer of CO2 emissions between producers and consumers; it also intensifies climate change, so a systematic assessment of CO2 emissions from domestic trade is significant for elucidating methods for the reduction of Japan’s emissions. Therefore, the objective of this study is to visualize carbon transfer paths by estimating the CO2 emissions embodied in domestic imports and exports across prefectures based on input–output analysis (IOA), and to identify the influencing factor of carbon flow through the log-mean Divisia index (LMDI) decomposition approach.
1.4. Research Significance
Through this study, the characteristics of CO2 emissions embodied in domestic trade can be specified for each sector in every prefecture. The carbon reduction responsibilities of each prefecture under different economic modes can be further distinguished through the visualization of carbon flows to formulate more targeted carbon reduction measures in Japan. Furthermore, the results of the study can provide insights with international applicability for reducing CO2 emissions, as evaluating the CO2 emissions from domestic trade is conducive to longer-term carbon reduction in each country and both domestic and international trade are important supports for each country’s economy. However, there is a certain degree of instability in international trade because of the changing international political situation. Meanwhile, expanding domestic demand to form new economic growth points is an important way of sustaining economic development in the 21st century. Therefore, it can be predicted that additional countries and regions will pay attention to domestic consumption, which will increase the CO2 emissions embodied in domestic trade. Finally, our research is helpful for balancing the supply–demand relationship between regions within each country and for avoiding carbon inequality in the process of carbon reduction.
2. Methodology and Data
Combining the single-regional input–output (SRIO) table of each prefecture and the National Cargo Net Flow Survey (NCNFS) from 2010, we first provide an assessment of the CO2 emissions embodied in Japan’s domestic trade. We subsequently applied the LMDI decomposition approach to quantitatively evaluate the factors influencing net export CO2 emissions.
2.1. CO2 Emissions Assessment Framework with Input–Output Model
IOA is one of the main methods used to evaluate CO2 emissions embodied in trade [36], and its basic principle comes from the technique of representing the complex interdependence between economic sectors [37]. Owing to the lack of domestic trade data in the IO tables (IOTs) of some prefectures, 30 prefectures (See Figure A1, Figure A2 in the Appendix A for the geographical coverage of the study) were studied in this research.
The basic equation for the assessment of CO2 emissions can be expressed as follows [38]:
where is the technical coefficient matrix, is the final demand vector, is the CO2 emission intensity vector, referring to sectoral CO2 emissions per monetary unit, is the total embodied CO2 emissions driven by final demand , and is the number of economic sectors.
Based on Equation (1), the CO2 emissions embodied in the domestic exports of each prefecture can be expressed as
where is the CO2 emissions embodied in domestic exports in sector and is a vector of the amount of domestic exports in sector j.
Considering the differences in the technical coefficients of the corresponding exporters, the CO2 emissions embodied in the domestic imports of each prefecture can be expressed as follows:
where is the CO2 emissions embodied in domestic imports in sector and is a vector of the volume of domestic imports from prefecture in sector .
Since the subnational MRIO table of Japan after 2010 is not currently available for use, we could not directly obtain the data for . Therefore, we use Japan’s NCNFS to estimate the trade flow of each prefecture from the other 29 prefectures. Domestic import matrices can be disaggregated as follows:
where is the total amount of domestic imports in the sector , and refers to the import amounts from prefecture in sector .
2.2. Evaluation of Influencing Factors Using the LMDI Decomposition Approach
Typically, IOA is combined with structural decomposition analysis to evaluate the factors influencing changes in CO2 emissions. However, the research object is the influencing factors of net export CO2 emissions generated by domestic imports and exports in each prefecture, and changes in panel data are not involved. Therefore, the LMDI decomposition approach was used in this study.
The CO2 emissions embodied in domestic imports and exports can be decomposed based on the Kaya identity as follows:
where and refer to the carbon intensity of the domestic imports and exports in sector and refer to the share of sector in total domestic imports and exports, and and refer to the total trade amount of domestic imports and exports.
The total effect on net export CO2 emissions can be expressed as follows:
where denotes the technology effect, denotes the structure effect, and denotes the scale effect.
2.3. Data
Each prefecture produces its own IOTs, so the IOTs of the 30 prefectures were retrieved via each prefecture’s official website (The official websites of each prefecture’s IOT are listed in Table A1, Table A2 in the Appendix A). This study focused on 2011 IOTs with the best data available [39]. Emission factors were obtained from the Agency for Natural Resources and Energy [40]. Regional trade data were collected from the 2010 (The NCNFS is held every five years, with the last three times being in 2015, 2010 and 2005. To cooperate with the 2011 SRIO table, the NCNFS in 2010 was used in this study) NCNFS between prefectures [41].
The CO2 emissions statistics table for each prefecture includes 28 sectors (see Table A3), and based on the sector classification of this table we combined the IOT’s sectors to form 28 sectors (Table A4). The names of the sectors in the IOT and CO2 emissions statistics table are different, and we adopt the IOT naming method. The sectoral correspondence between the NCNFS and IOTs is also shown in Table A4.
To check the effectiveness of domestic import data for every prefecture, we calculated the proportion of import volume from the other 29 prefectures in the total domestic imports of each prefecture (Table A1). Generally, 22 prefectures had more than 70% domestic imports, with a weighted average of 92.9%, which confirms that the study area could show the characteristics of CO2 emissions embodied in Japan’s domestic trade.
3. Results and Discussion
3.1. The CO2 Emissions Embodied in Japan’s Domestic Trade
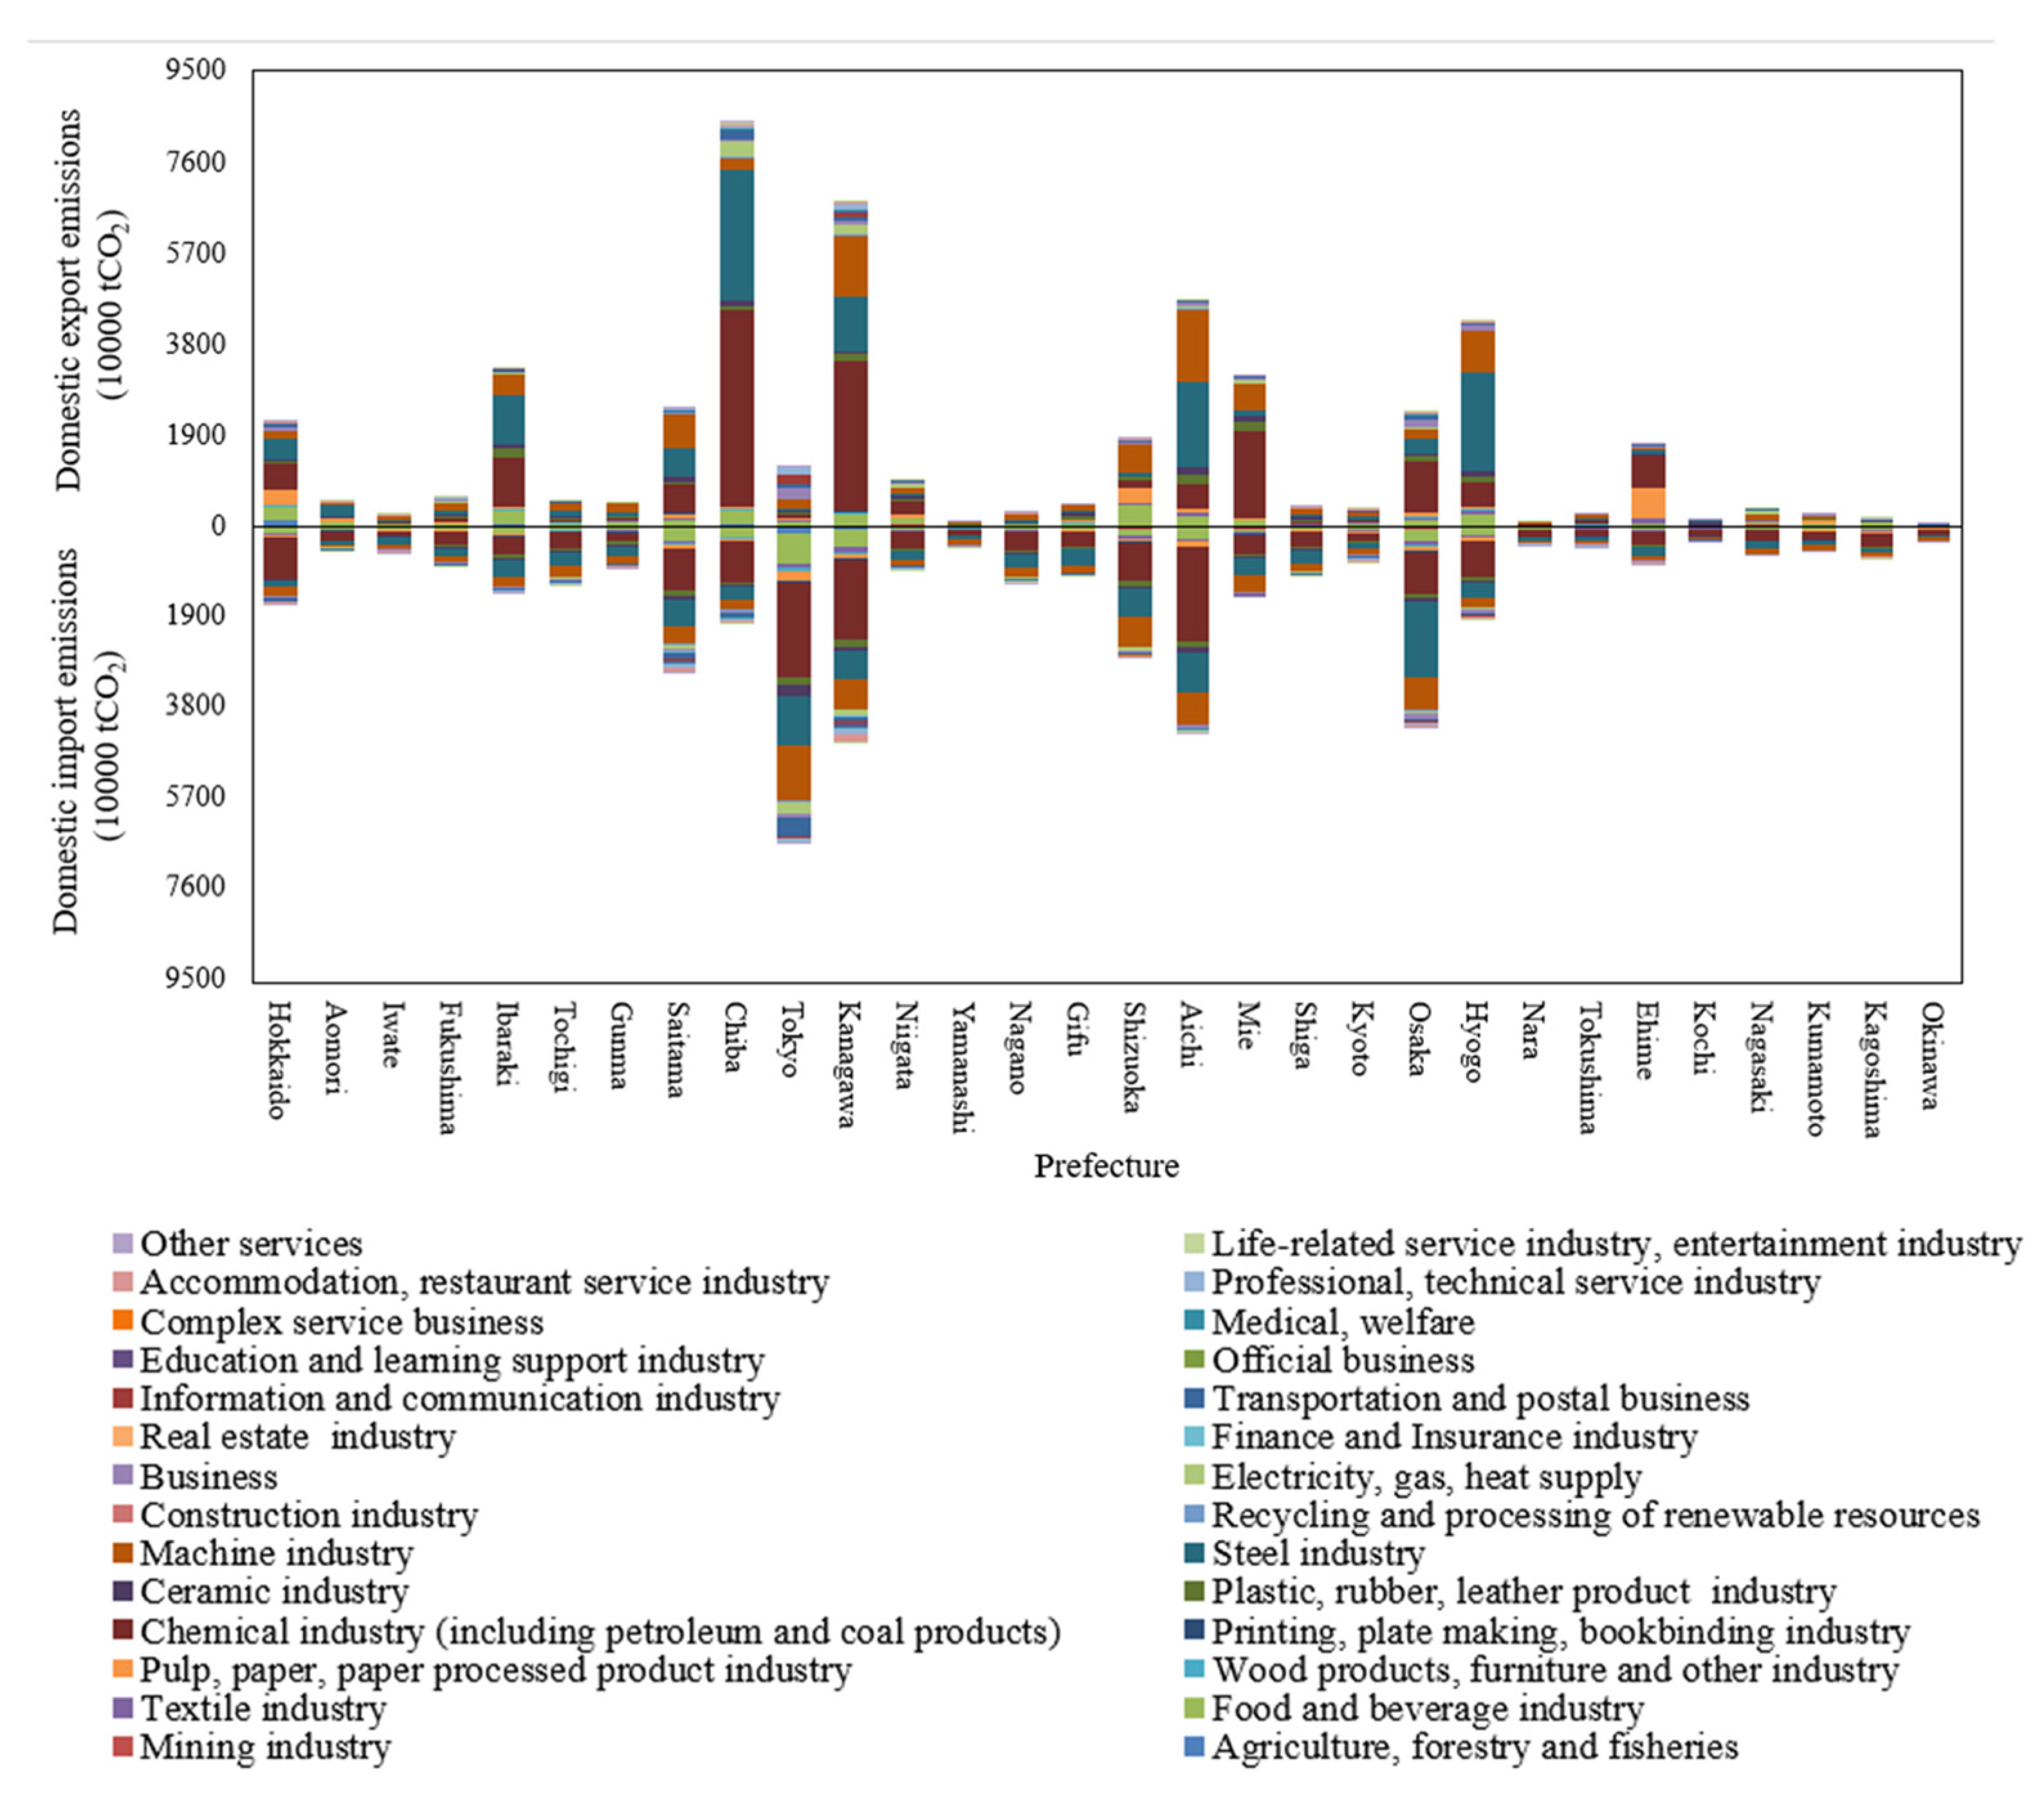
The total CO2 emissions embodied in the domestic trade of 30 prefectures were approximately 486 MtCO2, accounting for 41% of Japan’s total indirect CO2 emissions in 2011 [42]. Moreover, referring to the currently available data on consumption-based emissions in Japan in 2005 [35], the proportion of CO2 emissions embodied in domestic trade across prefectures was higher than 30%. Generally, CO2 emissions embodied in domestic imports and exports across prefectures show substantial regional differences (Figure 1). A few prefectures produce the most CO2 emissions through domestic trade, and these prefectures are mainly in the Kanto, Chubu, and Kansai regions, which include Tokyo, Aichi, and Osaka. In addition, these prefectures are economically similar in that they boast a high GRP and domestic trade. An active economy stimulates domestic trade between producers and consumers, which obviously promotes the transfer of CO2 emissions.
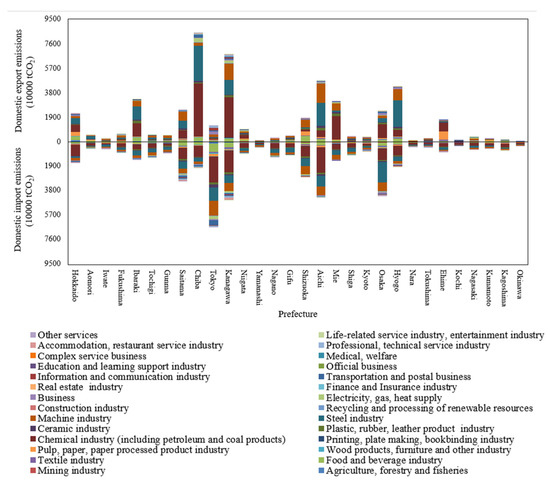
Figure 1.
The CO2 emissions embodied in Japan’s domestic imports and exports across prefectures in 2011.
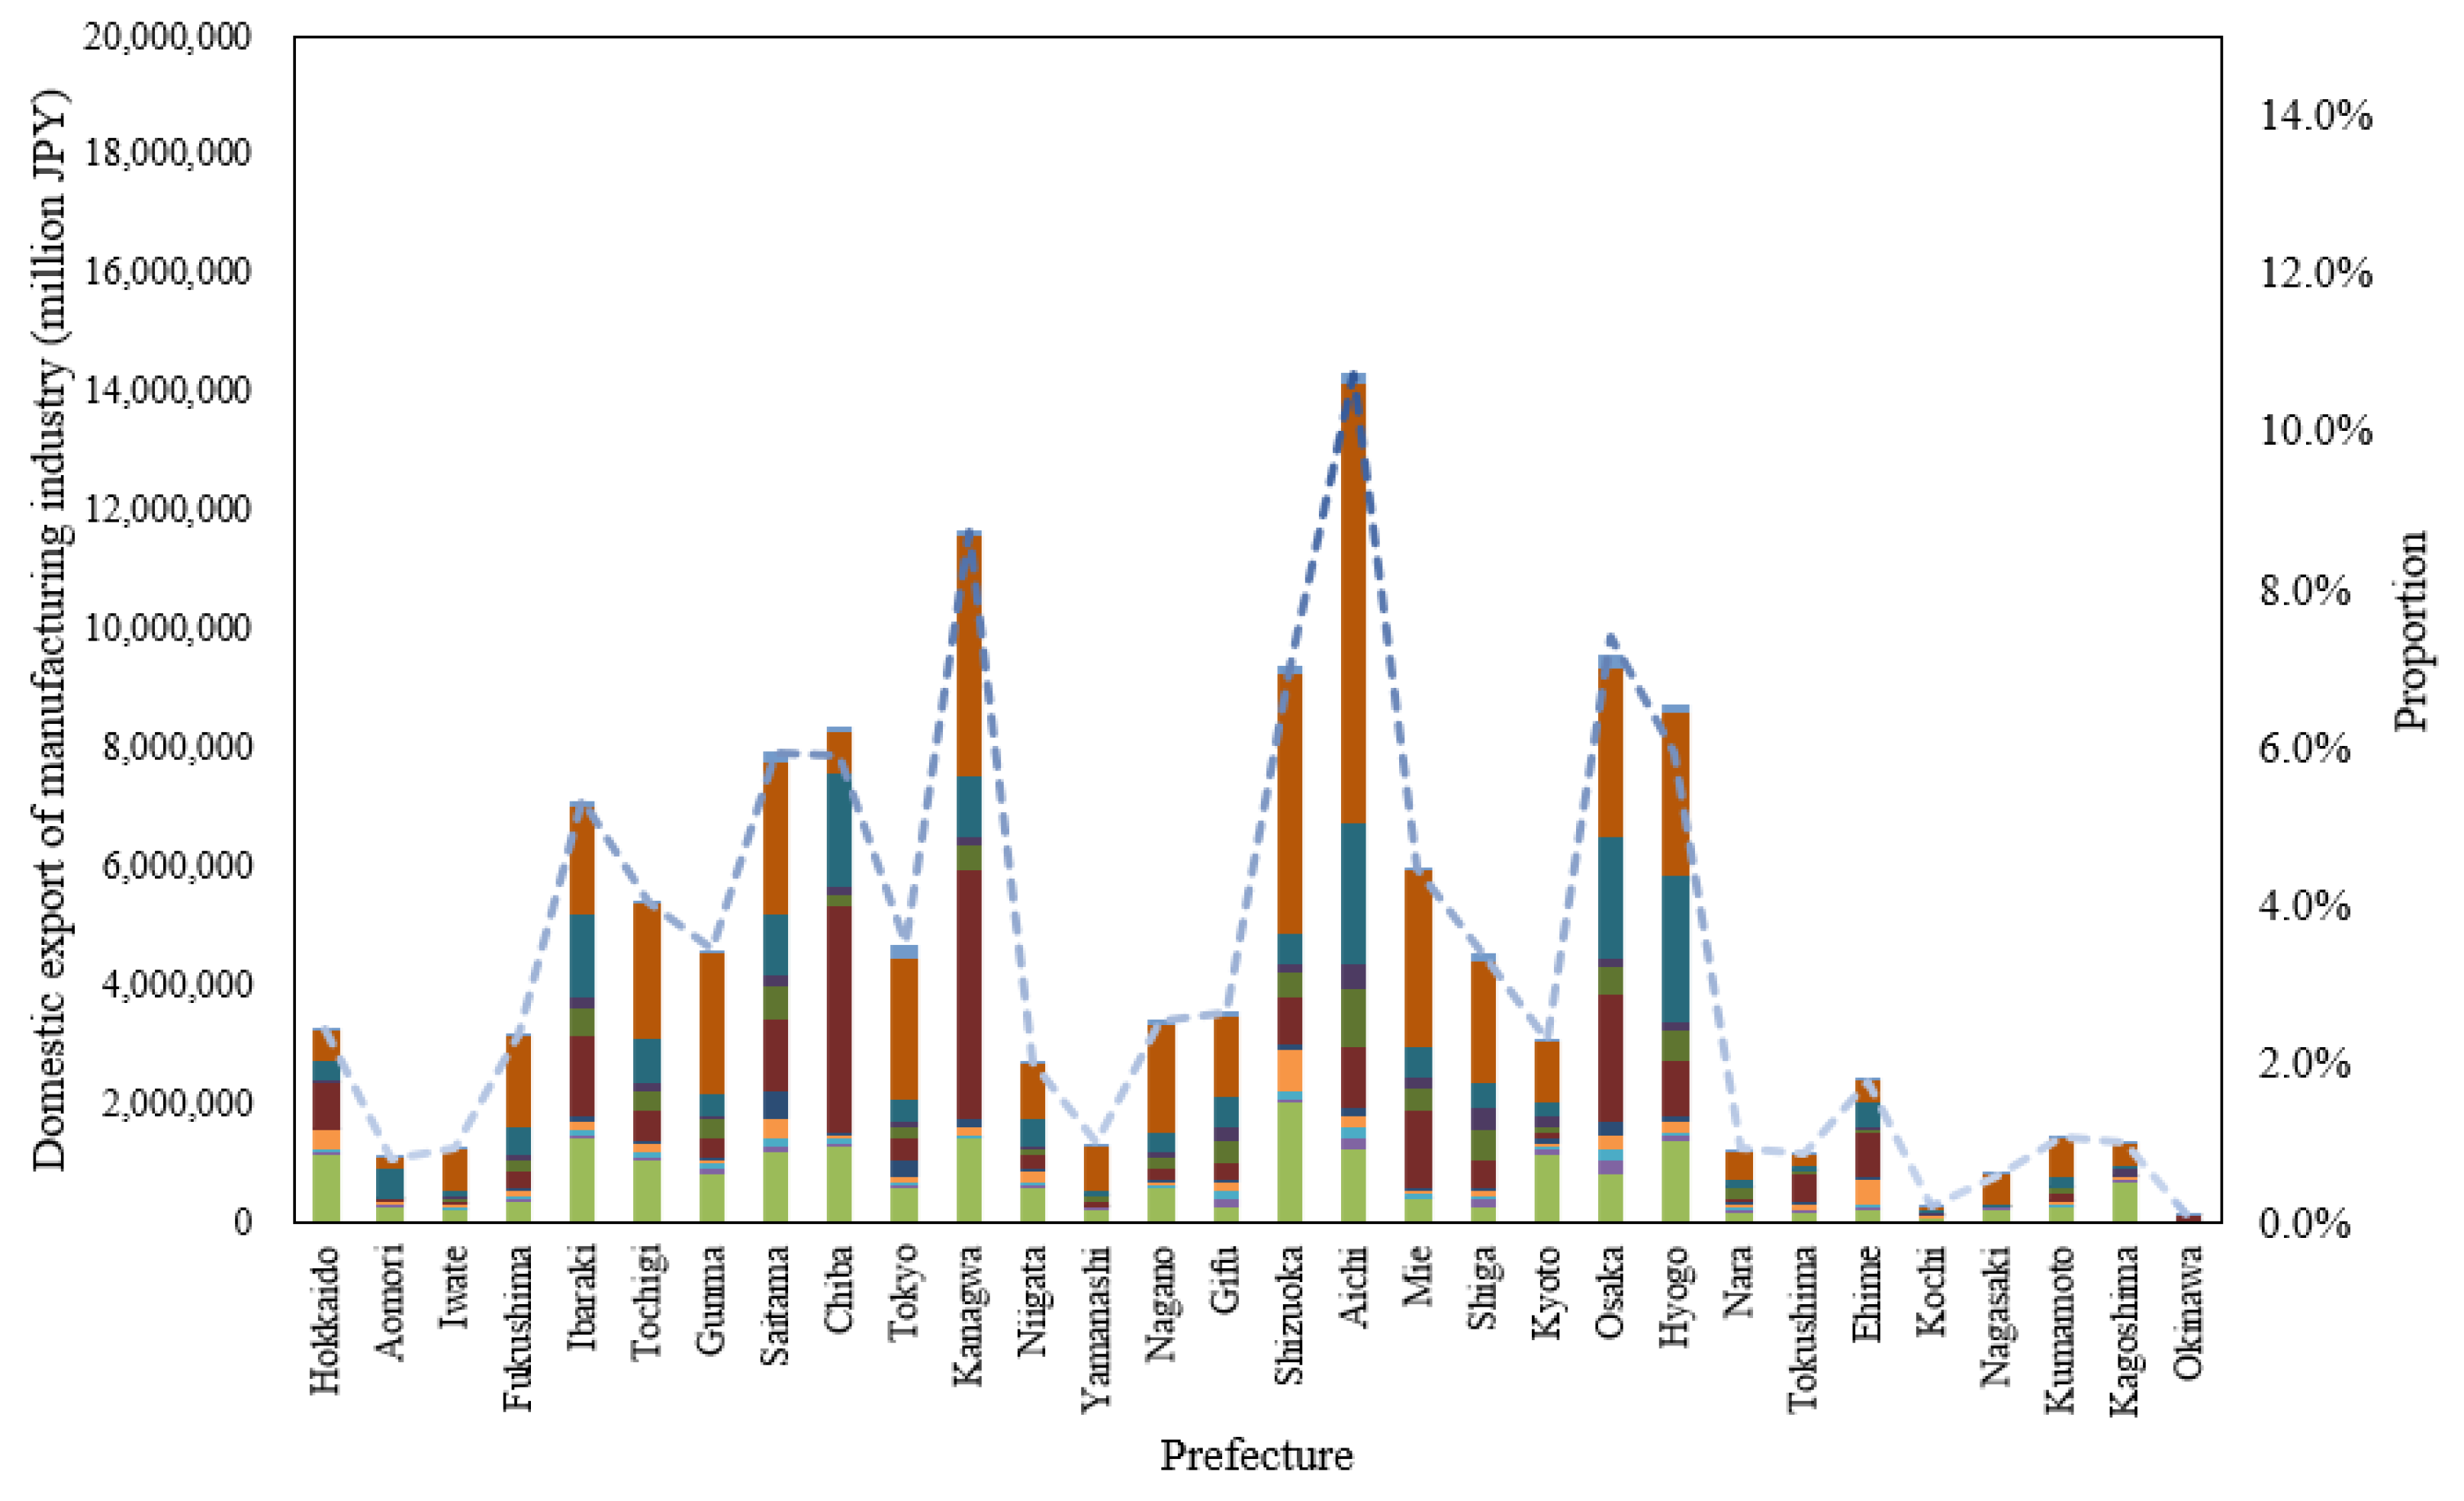
CO2 emissions embodied in domestic exports are concentrated in manufacturing prefectures: in contrast, the CO2 emissions embodied in domestic imports are concentrated in consumer prefectures. Chiba, Kanagawa, Aichi, and Hyogo, the four prefectures with a high proportion of the manufacturing industry in the GRP, account for 31% of the amount of total domestic exports in Japan (Figure 2). This reflects how a few manufacturing prefectures satisfy most of Japan’s domestic demand for industrial products, thus becoming the leading net exporters of CO2 emissions. The raw materials needed for production promote the expansion of domestic imports; thus, some manufacturing prefectures also have a significant amount of CO2 emissions embodied in domestic imports, such as Kanagawa and Aichi. Compared with domestic exports, the CO2 emissions embodied in the domestic imports of most prefectures, excluding manufacturing prefectures, are relatively high, especially in consumer prefectures such as Tokyo and Osaka.
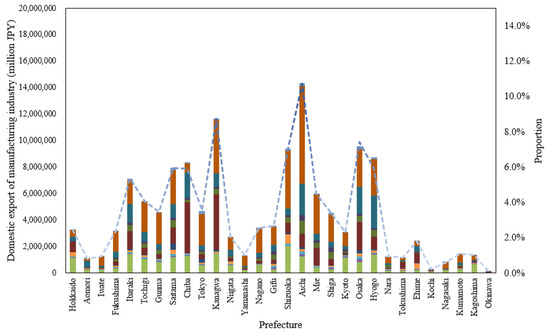
Figure 2.
Domestic exports of the manufacturing industry by prefecture, and their shares of Japan’s total manufacturing domestic exports (indicated by a light blue dotted line) in 2011. The color of the legend corresponds to the sectors in Figure 1.
In Japan’s domestic exports, the chemical, steel, and machine industries account for a high proportion of CO2 emissions in heavy-industry prefectures, mainly in the Kanto and Chubu regions. The economies of these prefectures are clearly export oriented; therefore, the manufacturing industry is more dependent on the external market. In addition, the CO2 emissions embodied in the domestic exports of other prefectures are relatively small and concentrated in light industries, such as the food and beverages. Chiba, Kanagawa, and Aichi are all important manufacturing prefectures in Japan with higher CO2 emissions from domestic exports. Therefore, we selected these three prefectures as case studies to further discuss the CO2 emissions embodied in domestic exports with industrial structures.
CO2 emissions from the chemical and steel industries account for a large proportion of the domestic exports from Chiba, which has the Keiyo Rinkai Complex, Japan’s largest basic materials industry cluster, and which provides the necessary raw materials and energy for all industries in Japan [43]. Chemical, petroleum, and steel products produced in the Keiyo Rinkai Complex account for approximately 60% of Chiba’s total manufacturing shipment value. In Kanagawa, the CO2 emissions embodied in domestic exports are concentrated in the machine and chemical industries, which are also the mainstays of the region’s economy. In 2010, the total output of Kanagawa’s manufacturing industry ranked second in Japan, with the machine industry accounting for 16.9% of the manufacturing industry. The CO2 emissions embodied in Aichi’s domestic exports came mainly from the machine and steel industries. The transport machinery industry is the traction force of the manufacturing industry, with more than half of the total shipments in Aichi’s manufacturing industry. In addition, most mechanical products exported by Aichi focus on precision instruments and high-tech products; thus, the CO2 emissions embodied in domestic exports are relatively low.
3.2. Carbon Transfer Path of Domestic Imports between Prefectures
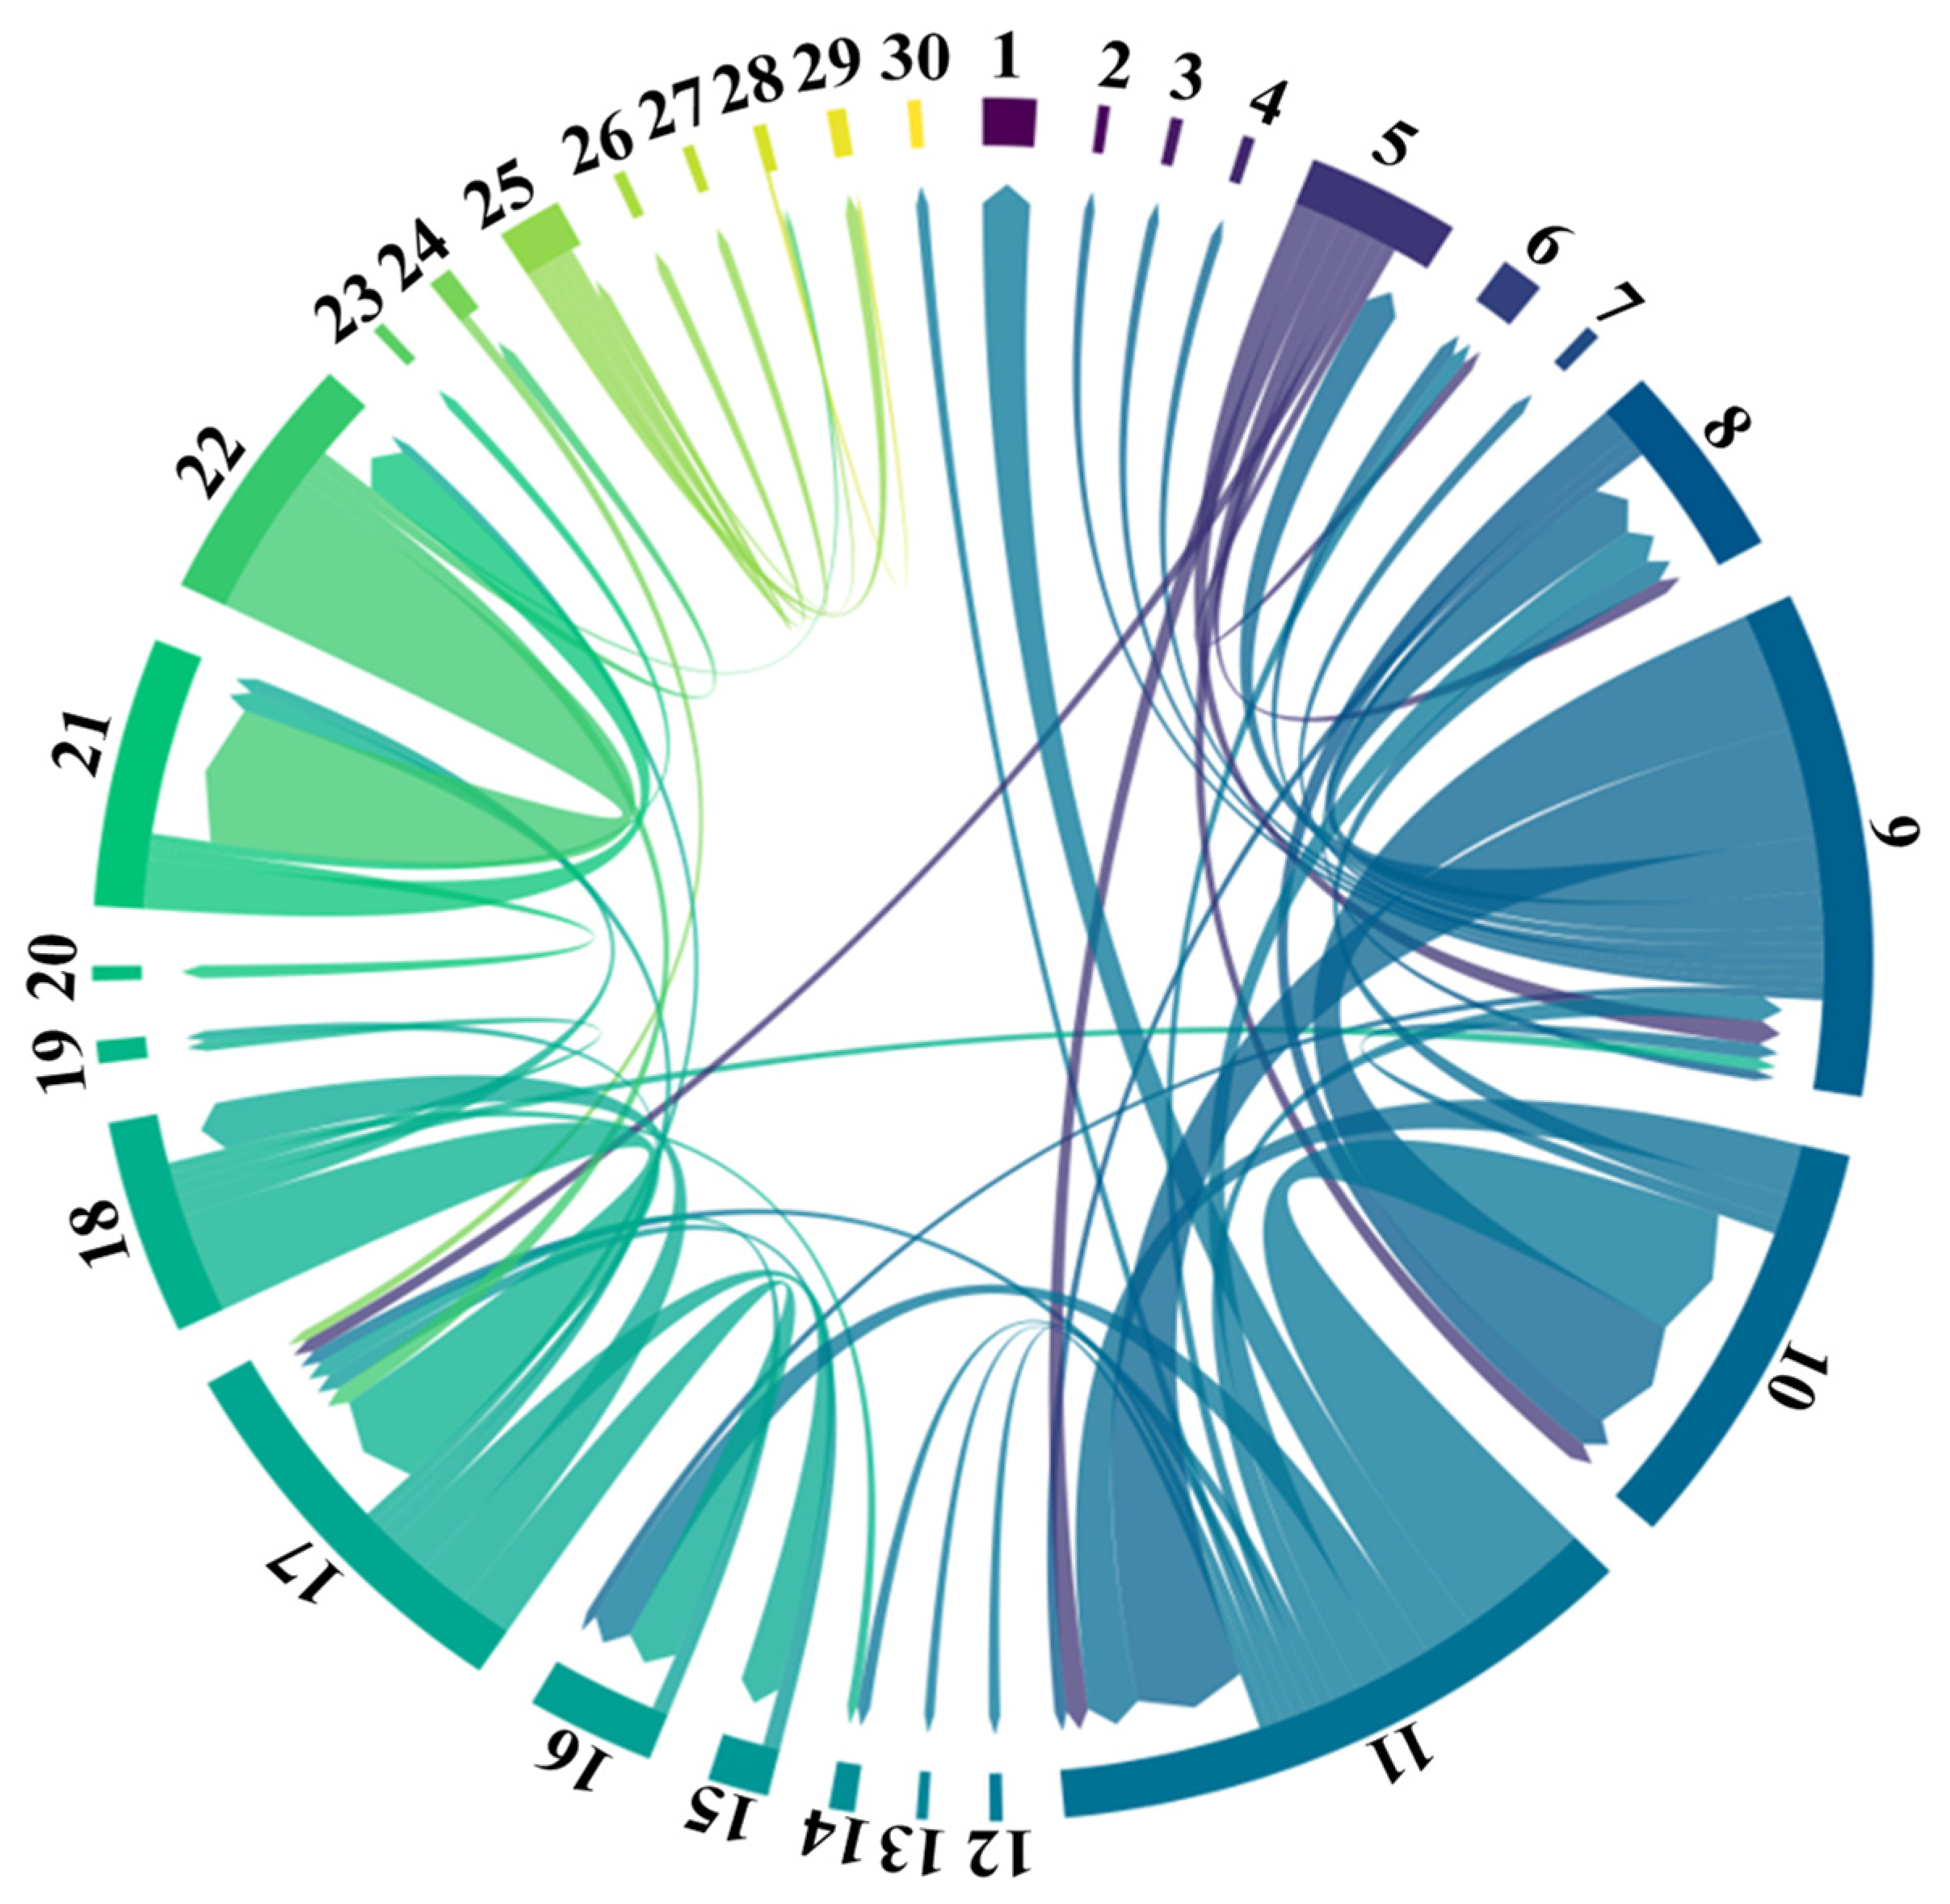
Overall, there were substantial differences in the carbon transfer paths of domestic imports in Japan’s 30 prefectures (Figure 3). Carbon flow is more obvious in economically advanced regions (e.g., the Kanto and Kansai regions) and covers more prefectures through carbon transfer. For example, Tokyo’s CO2 emissions account for 14% of Japan’s CO2 emissions embodied in domestic imports, and the emission sources extend from the Tohoku to Kanto regions (Ibaraki, Saitama, Chiba, etc.). However, the CO2 emissions of economically backward regions are lower and concentrated in neighboring manufacturing prefectures. For instance, Gifu accounts for only approximately 2% of the total CO2 emissions, mainly from neighboring Aichi. Furthermore, consumer prefectures import major CO2 emissions and export substantial amounts of CO2 emissions to other prefectures. For example, Tokyo has a large carbon output for Hokkaido, Ibaraki, Chiba, and Kanagawa, while Osaka is an important emission source for Aichi, Mie, Shiga, and Nara.
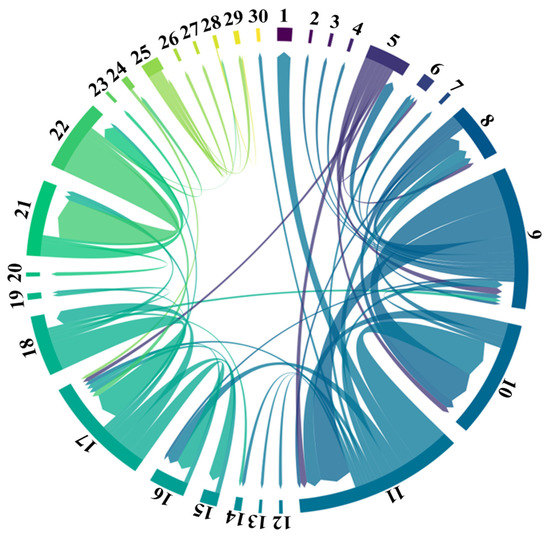
Figure 3.
Flow chart of the CO2 emissions embodied in domestic imports between prefectures of Japan in 2011 (unit in 10,000 tCO2). The numbers in the flowchart correspond to the prefectures, as detailed in Figure A1.
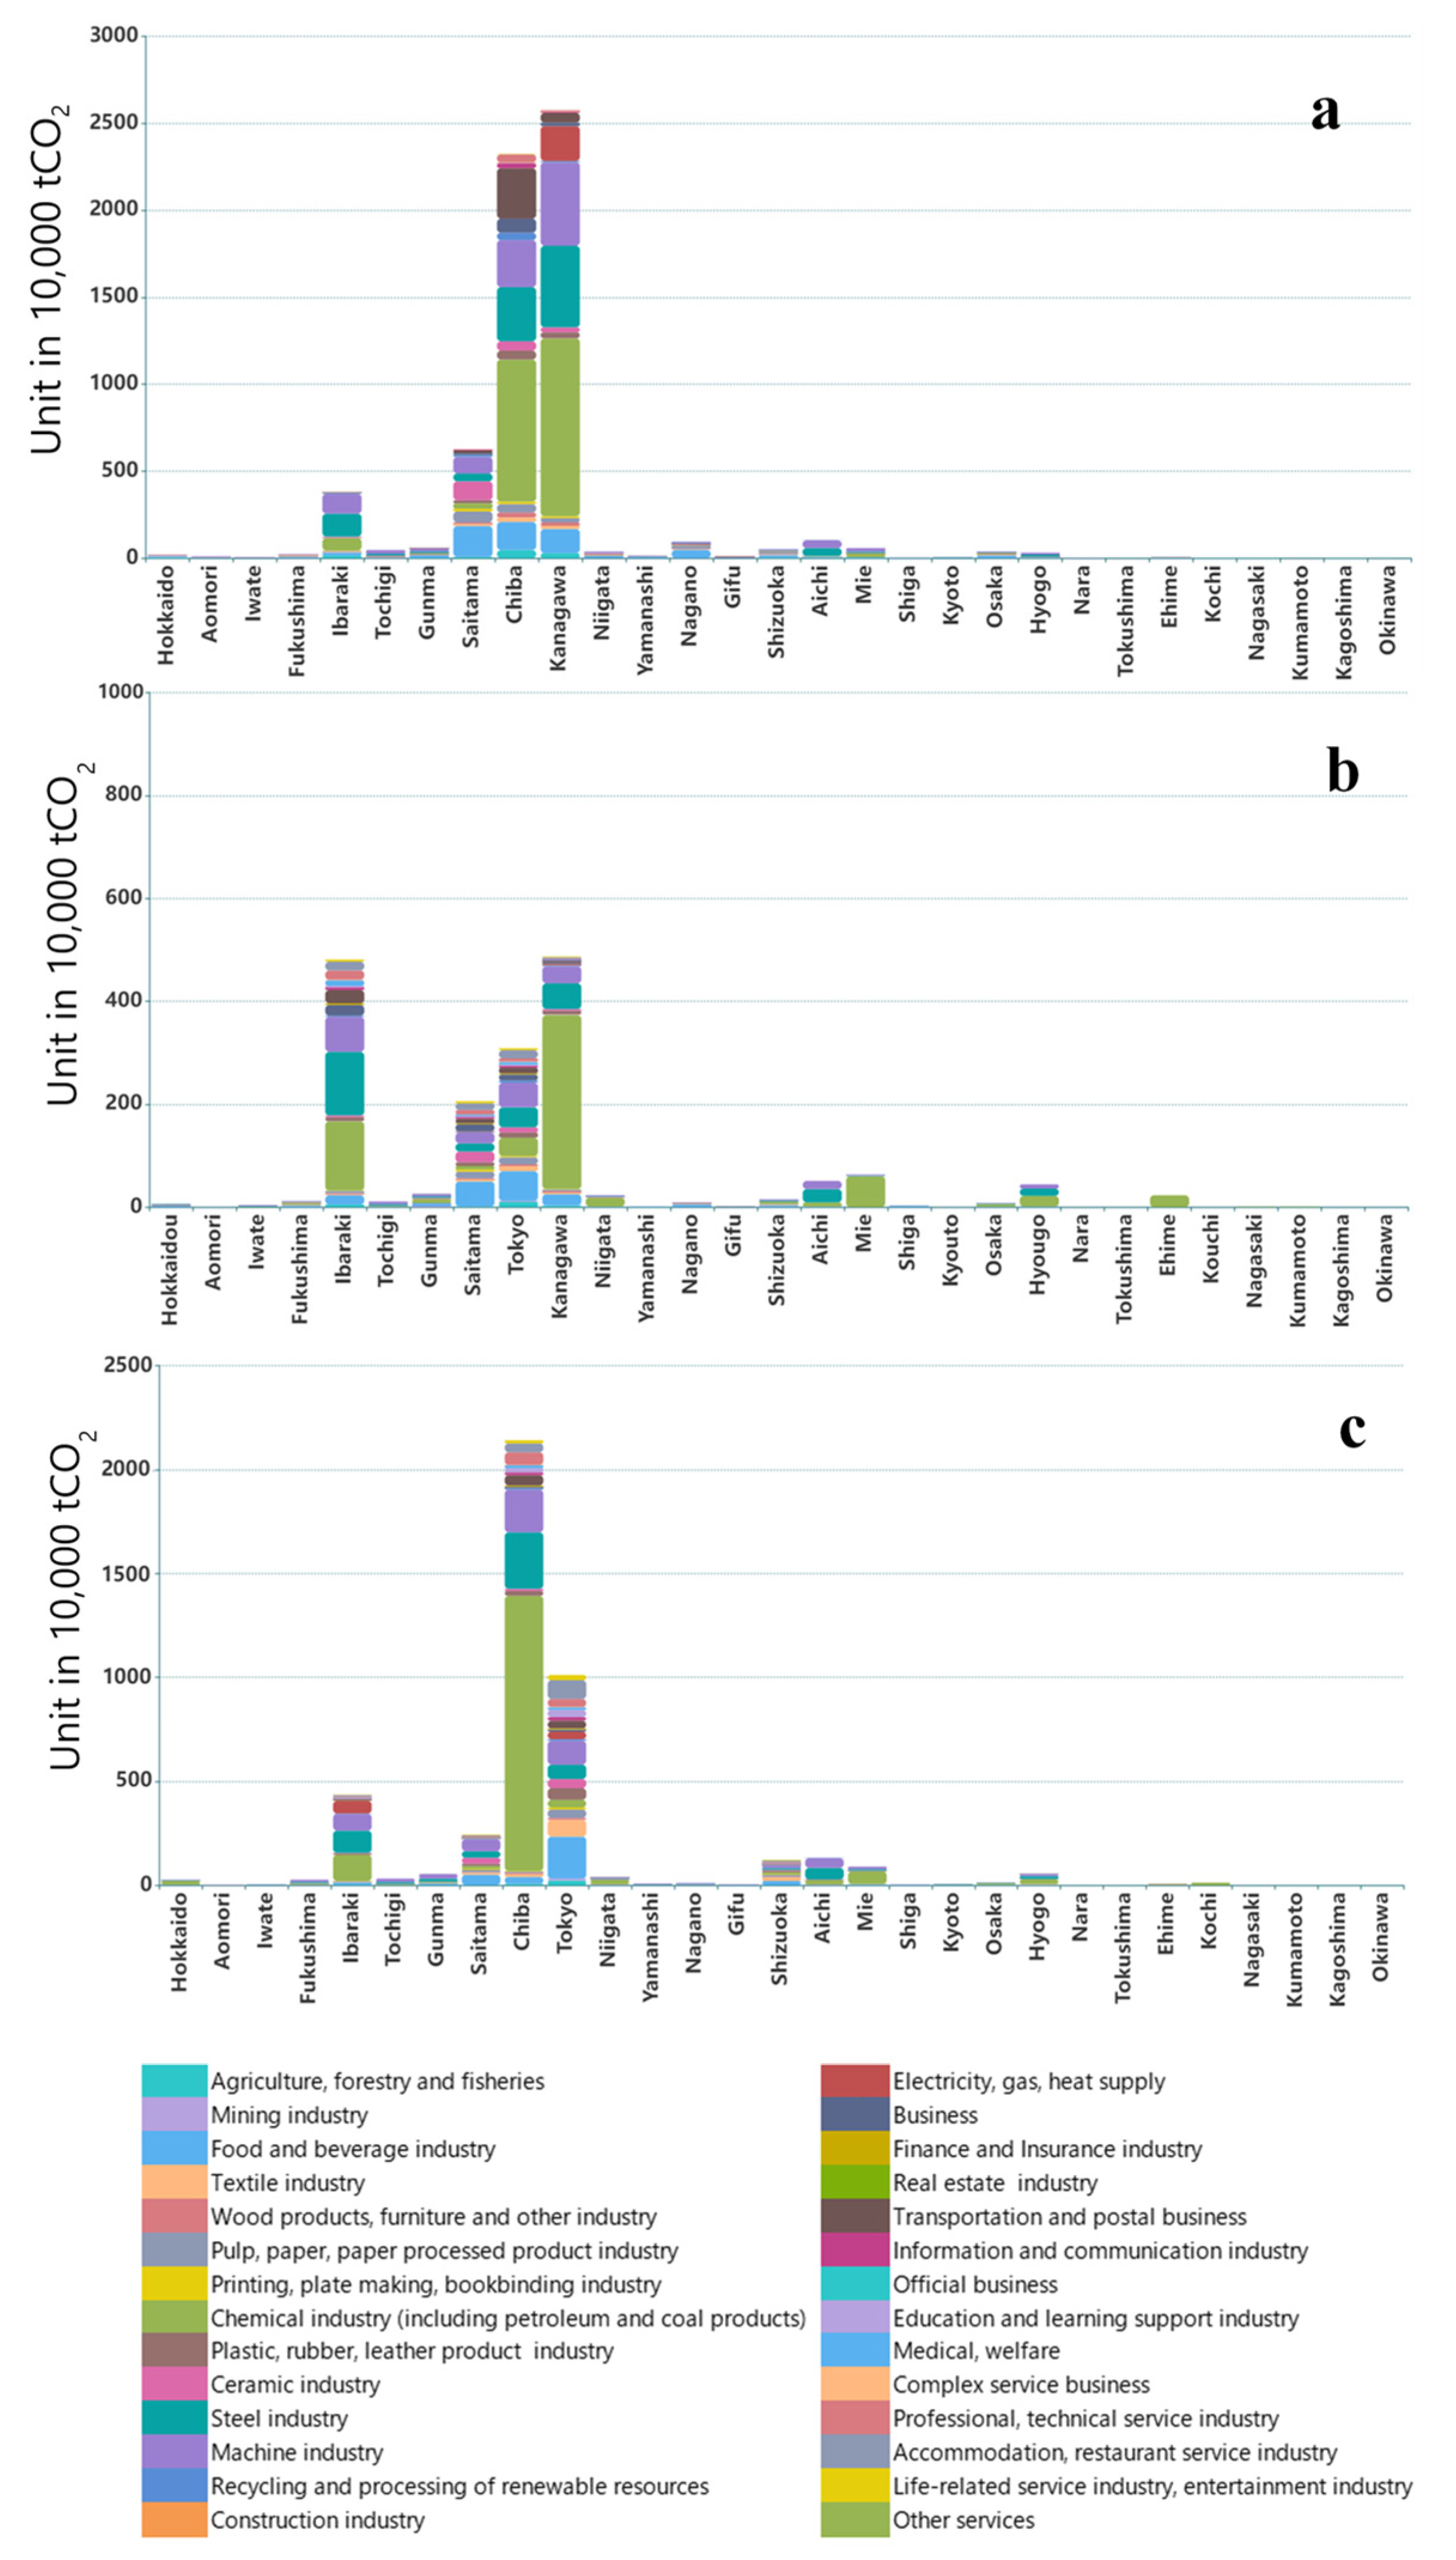
Tokyo is an important consumer prefecture with a high population concentration, whereas Chiba and Kanagawa are the main emission sources of the Hokkaido, Tohoku, Kanto, and Chubu regions in domestic imports. Therefore, we selected those three prefectures as case studies to further discuss regional differences in combination with the sectoral distribution of embodied CO2 emissions in Japan’s domestic imports (Figure 4).
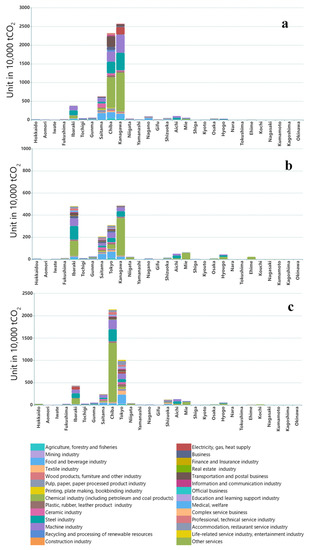
Figure 4.
The CO2 emissions embodied in the domestic imports of Tokyo (a), Chiba (b), and Kanagawa (c) by the exporter in 2011.
The main sources of CO2 emissions embodied in Tokyo’s domestic imports were Chiba and Kanagawa, and there were specific differences in sectoral distribution (Figure 4a). In contrast, CO2 emissions from other prefectures are lower, mainly in light industries. In domestic imports from Kanagawa and Chiba, the food and beverage, chemical, steel, and machine industries were the main sectors contributing to CO2 emissions. Tokyo is the capital of Japan, so production costs are higher than in other prefectures: thus, the development of heavy industry, which relies on resources and land areas, is limited. As important industrial bases in Japan, the neighboring prefectures Chiba and Kanagawa largely undertake the task of exporting heavy industrial products to Tokyo. Urban agriculture in neighboring prefectures (e.g., Saitama and Chiba) is promoted by the huge market demand of Tokyo and has become an important emission source.
Although Chiba and Kanagawa are manufacturing prefectures, there are differences in the sources of CO2 emissions embodied in domestic imports, where these emissions in Chiba were lower than those in Kanagawa. The basic materials industry accounts for a sizable proportion of Chiba’s manufacturing industry; thus, the huge demand for raw materials makes Chiba’s trade structure more dependent on international imports, which decreases CO2 emissions embodied in domestic imports. The emission sources of Chiba, such as Kanagawa, Ibaraki, and Tokyo, were relatively diverse (Figure 4b). In contrast, the emission source of Kanagawa was concentrated in Chiba (Figure 4c). As Chiba is Japan’s largest basic materials industry cluster, it can provide sufficient production support for the development of heavy industry in Kanagawa. Chiba and Kanagawa also have significant amounts of CO2 emissions from consumer prefectures in domestic imports, such as Tokyo.
3.3. The Influencing Factors of Net Export CO2 Emissions across Prefectures
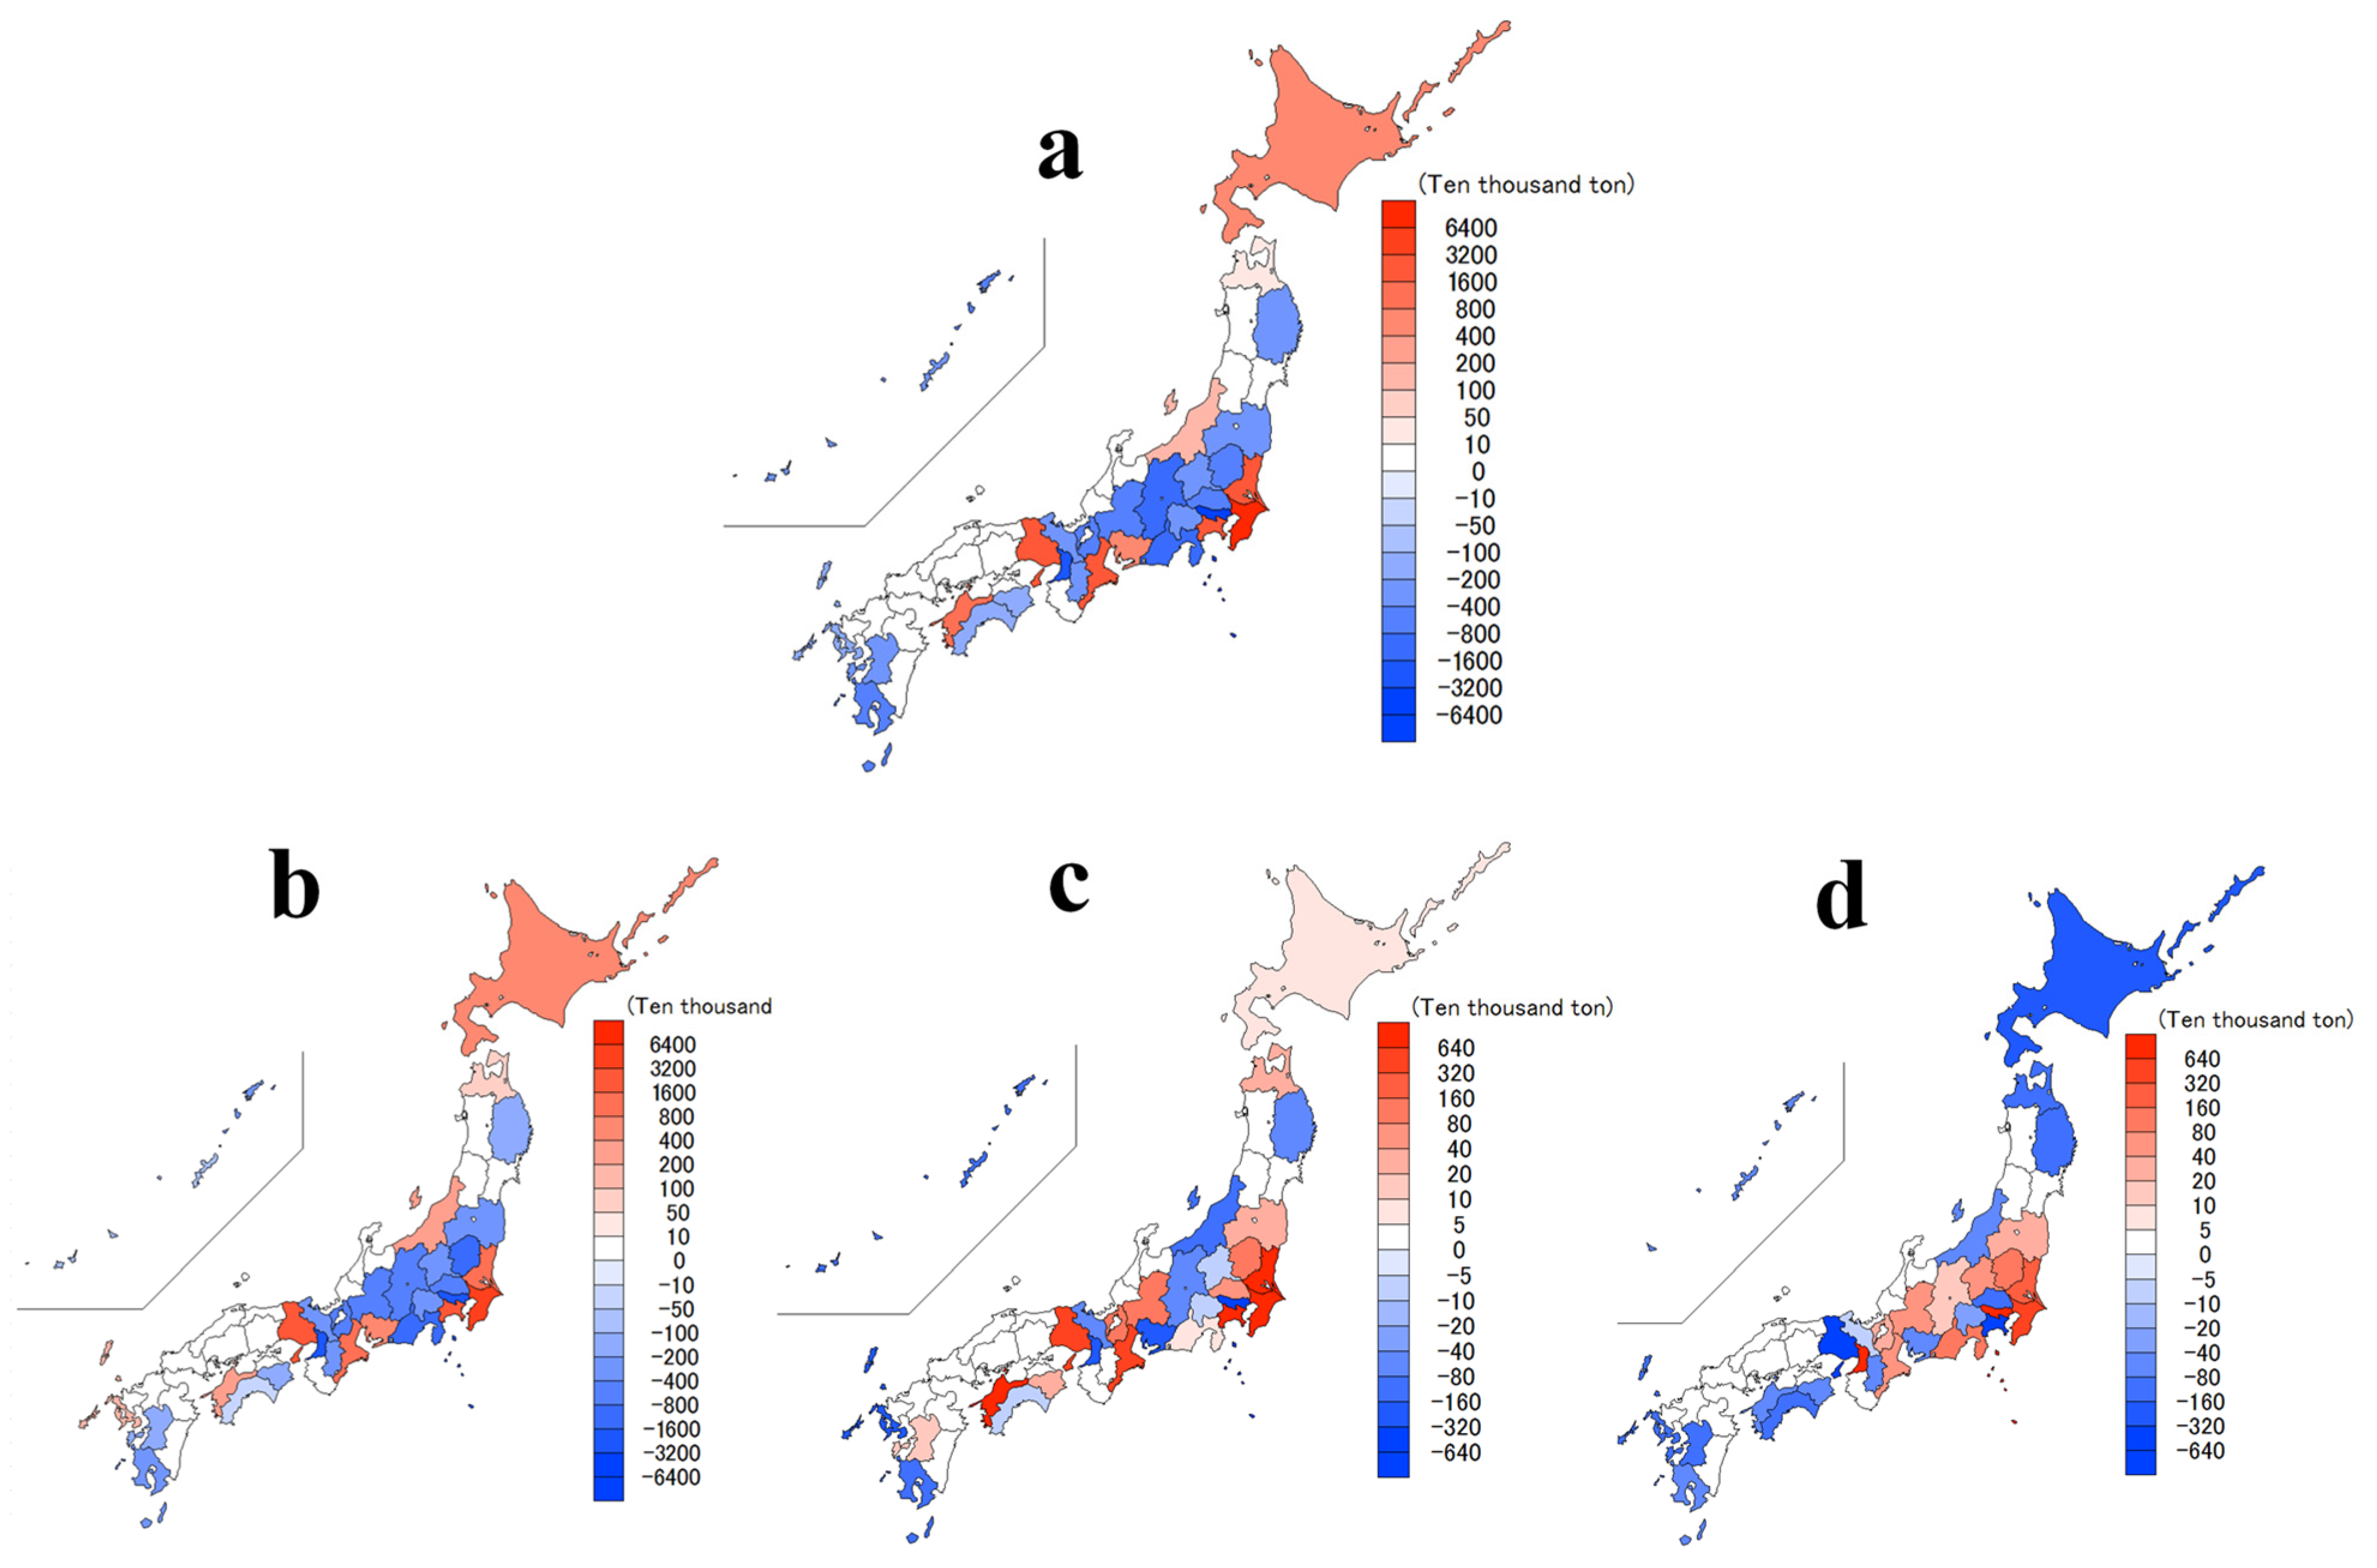
Among the 30 prefectures, 20 have negative net export CO2 emissions, especially consumer prefectures with advanced economies (e.g., Tokyo and Osaka). Prefectures with positive net export CO2 emissions are mostly manufacturing prefectures and are concentrated in the Kanto and Kansai regions (e.g., Kanagawa, Hyogo). From the impact degrees of the three influencing factors, the technology effect had the most significant impact on net export CO2 emissions (Figure 5b). The technology effect has an obvious positive impact on manufacturing prefectures while negatively affecting consumer prefectures. The impact of the structure effect on net export CO2 emissions was relatively weak and was mainly affected by the economic structure within each prefecture (Figure 5c). The scale effect has the least impact on net export CO2 emissions and has a positive impact, mainly in the Kanto region (Figure 5d).
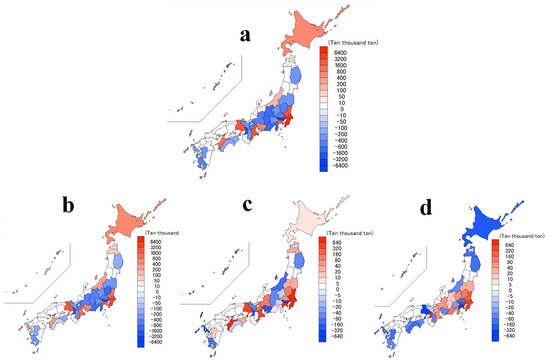
Figure 5.
Total net export CO2 emissions (a) and the impact of three factors on net export CO2 emissions across prefectures in 2011: technology effect (b), structure effect (c), and scale effect (d).
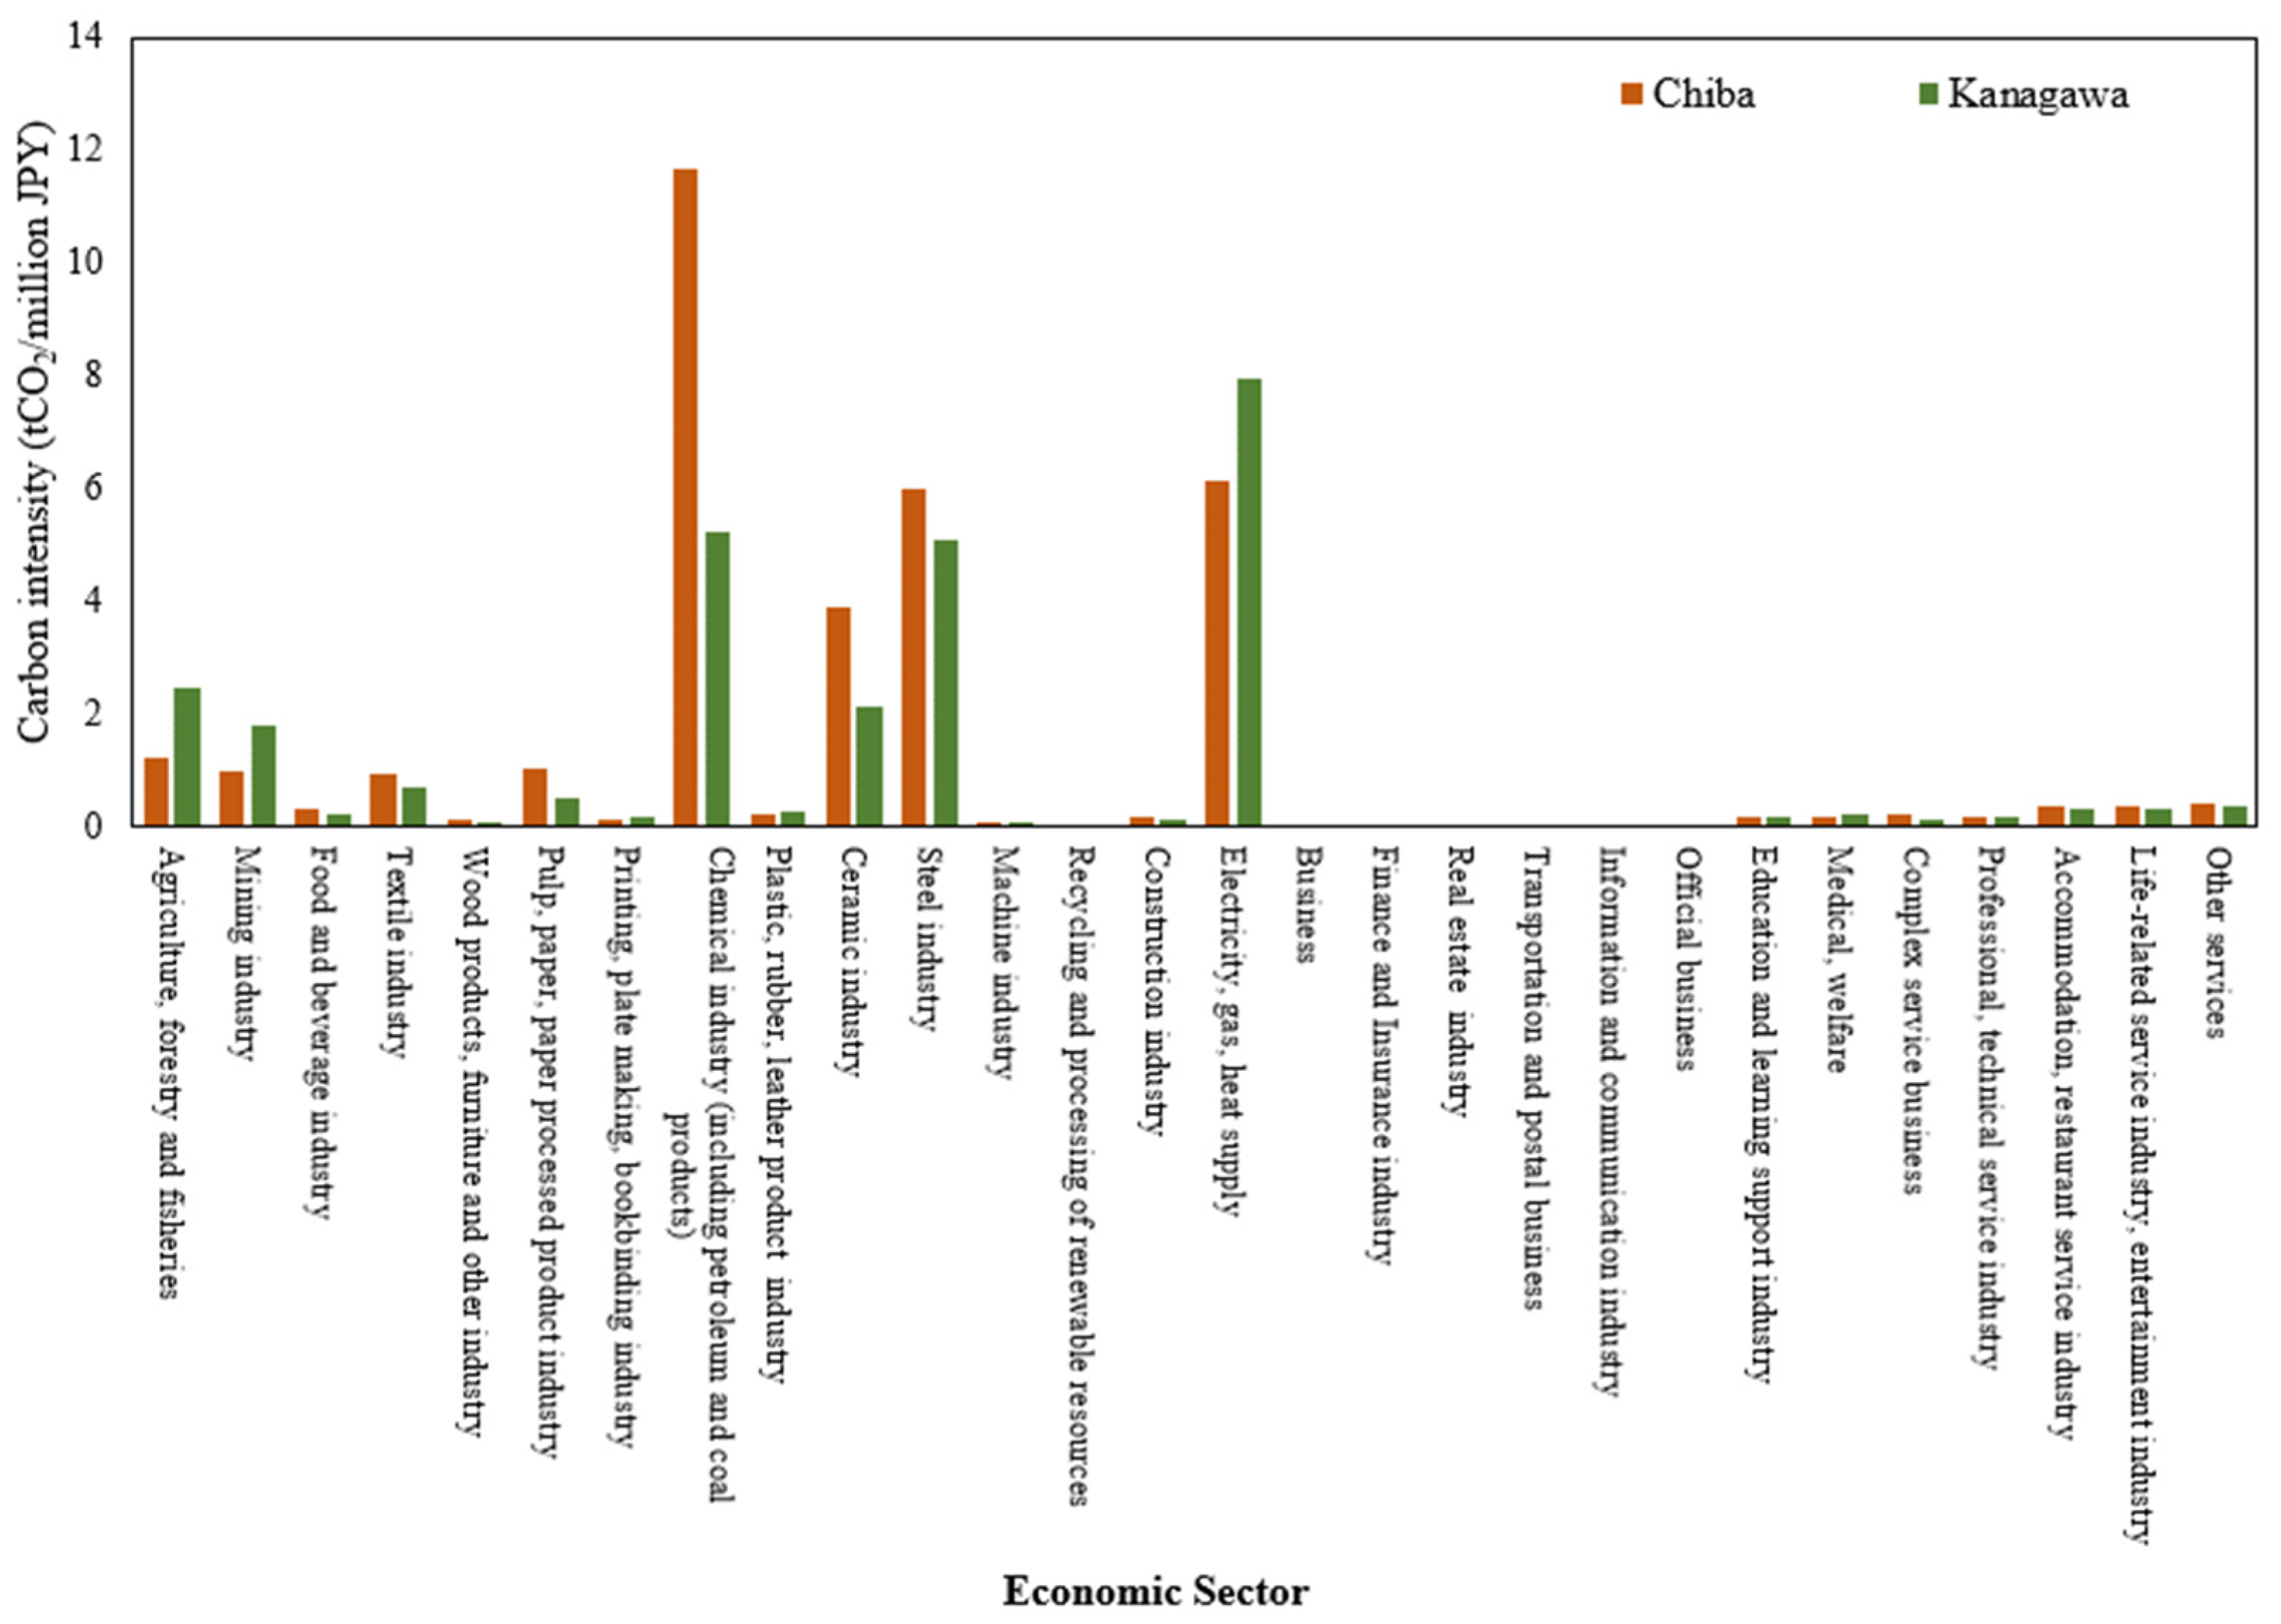
The impact of the technology effect on net export CO2 emissions is mainly reflected in carbon intensity (Equations (5) and (6)). Chiba and Kanagawa are the most important manufacturing prefectures in the Kanto region. However, the positive impact of the technology effect in Chiba is stronger than that in Kanagawa. The domestic exports of Chiba are dominated by the basic materials industry, including raw materials and energy. By contrast, Kanagawa has a high proportion of domestic exports in the machinery industry, and the added value of these exports in the manufacturing industry of Kanagawa (24%) is much higher than that of Chiba (12%). Through the commodity structure of domestic trade, the carbon intensity of Chiba was obviously higher than that of Kanagawa (Figure 6), and therefore, the technology effect had a stronger positive impact on Chiba. The negative impact of the technology effect gradually increases from economically backward prefectures to economically advanced prefectures: this is because economically advanced prefectures can provide a sufficient economic foundation for the development of technology-intensive and service industries and provide a huge consumer market.
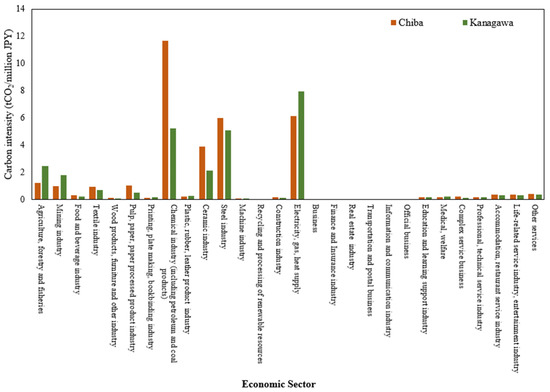
Figure 6.
Carbon intensity for 28 economic sectors between Chiba and Kanagawa in 2011.
The differences in economic structure cause the impact of the structural effect on net export CO2 emissions to differ between prefectures. In consumer prefectures housing a high proportion of the service industry, such as Tokyo, the structural effect has a significant negative impact. In prefectures where economic traction is shifting from manufacturing to services, such as Shizuoka and Kochi, the structural effect has a relatively weak positive or negative impact. In manufacturing prefectures with export-oriented economies that rely on external markets and resources, such as Chiba and Kanagawa, the structural effect has a strong positive effect.
The impact of the scale effect is determined largely by the volume of domestic imports and exports in each prefecture. When domestic exports are higher than domestic imports, the scale effect has a positive effect, as in Chiba. However, the scale effect also has a positive effect in some consumer prefectures with advanced economies, such as Tokyo and Osaka. The main reason is that, in addition to importing industrial products from manufacturing prefectures, consumer prefectures also export large amounts of CO2 emissions through service industries to other prefectures. This also confirms that, although manufacturing prefectures are the main net exporters of CO2 emissions, consumer prefectures are also important sources of CO2 emissions embodied in domestic trade.
3.4. Limitations of the Study
This study has five main limitations. Firstly, as the subnational MRIO table of Japan after 2010 is not currently available for use, we estimated the domestic trade flows between prefectures based on the SRIO table and NCNFS. Therefore, the domestic trade flow of each prefecture cannot accurately reflect the actual situation. Secondly, the SRIO tables for some prefectures do not provide domestic import and export data, as the study area was limited to 30 prefectures. Therefore, the conclusions of this study cannot be fully applicable to all prefectures in Japan. Thirdly, we recognize that the latest year analyzed in this study is more than 10 years in the past; however, it is currently impossible to prepare more recent data on SRIO tables for each prefecture in Japan. Because the research data are relatively outdated, the research results may not accurately reflect the current status of CO2 emissions embodied in Japan’s domestic trade. Fourthly, this study does not involve non-combustion CO2 emissions in the production process, which may reduce the CO2 emissions embodied in the domestic trade of each prefecture. Finally, to maintain the data integrity of the SRIO, NCNFS, and CO2 emissions statistics tables during data mapping, we used 28 sectors. Therefore, the aggregation of sectors may affect the understanding of the CO2 emissions accounting methods of some sectors, such as petroleum and coal products and chemicals. The limitations of the data could be addressed if the relevant data become available in the future.
4. Conclusions and Policy Implications
The CO2 emissions embodied in domestic imports and exports differ across prefectures. Generally, CO2 emissions embodied in Japan’s domestic trade are concentrated in economically advanced prefectures, mainly in the Kanto and Kansai regions. Manufacturing prefectures satisfy most of the domestic demand in Japan with industrial products and have become the main net exporters of CO2 emissions. Carbon flow is more obvious in consumer prefectures and covers more prefectures through carbon transfers. Furthermore, consumer prefectures also export amounts of CO2 emissions from the service industry to other prefectures.
In terms of the factors influencing net export of CO2 emissions across prefectures, the technology effect has the most significant impact on the carbon intensity of domestic trade flows. The economic traction of each prefecture is different, which is mainly reflected in the proportion of the manufacturing and service industries in the economic structure. Therefore, the impact of the structural effect on net export CO2 emissions differs by prefecture. The scale effect of manufacturing prefectures usually positively impacts net export CO2 emissions, but in consumer prefectures with advanced economies, the scale effect also has a positive impact.
There are substantial differences in CO2 emissions embodied in domestic trade and the influencing factors across prefectures; thus, emission reduction policies must be formulated flexibly according to local conditions to promote the sustainable development of each prefecture. The results of the analysis suggest policy implications, which are detailed below:
Firstly, it is necessary to adjust the industrial structures of manufacturing prefectures and reduce the carbon intensity of production. The government should promote the diversification of industrial structures in manufacturing prefectures and accelerate innovation in production technology to avoid the high carbon intensity of single production structures. For example, Chiba’s basic material industry has the advantage of an industrial cluster under enterprise agglomeration; thus, it can improve the proportion of high-end products in the raw material processing industry in the industrial chain, and promote the upgrading of the overall industrial structure while driving enterprises to adjust production. Meanwhile, in the processing industry of medium- and low-end products, the improvement of energy efficiency and the promotion of environmental protection technologies are key points.
Secondly, it is important to pay attention to CO2 emissions from consumer prefectures where the service industry is one of the main sources, although it is widely seen as a low-carbon emitter and therefore regulations to reduce emissions have been neglected. Consequently, for the service sector, emphasis should be placed on improving energy efficiency and promoting innovation in energy technologies to reduce energy consumption in the production process. Moreover, consumer prefectures have a stable and large market, and the government should actively promote the circulation of low-carbon products and guide consumers toward sustainable consumption.
Finally, the responsibility for emission reduction is attributable to both manufacturing and consumer prefectures, because the latter share responsibility for emissions, given that their demand induces emissions from production. The premise of emission reduction is to maintain the normal supply–demand relationship of Japan’s domestic trade. Manufacturing prefectures must strive to develop low-carbon economic growth. The government should reduce the utilization of coal for non-power generation, actively develop non-fossil energy and energy storage technologies, and build a new power system with new energy as the main body to reduce the CO2 emissions generated in the production process. Consumer prefectures can increase their market shares of low-carbon products through financial support, and by adjusting market demand to promote a low-carbon production structure, the Japanese government can enhance the synergy between producers and consumers.
Author Contributions
Conceptualization, Y.H. and K.M.; methodology, Y.H. and K.M.; software, Y.H.; validation, Y.H.; formal analysis, Y.H.; investigation, K.M.; resources, Y.H.; data curation, Y.H.; writing—original draft preparation, Y.H.; writing—review and editing, Y.H. and K.M.; visualization, Y.H. and K.M.; supervision, K.M.; project administration, K.M.; funding acquisition, K.M. All authors have read and agreed to the published version of the manuscript.
Funding
This research was funded by JSPS KAKENHI (grant numbers JP18K11800, JP19K12467, JP21H03673, and JP22H03817). The APC was funded by International Academic Paper Submission Grants of Toyo University.
Institutional Review Board Statement
Not applicable.
Informed Consent Statement
Not applicable.
Data Availability Statement
Not applicable.
Conflicts of Interest
The authors declare no conflict of interest.
Appendix A
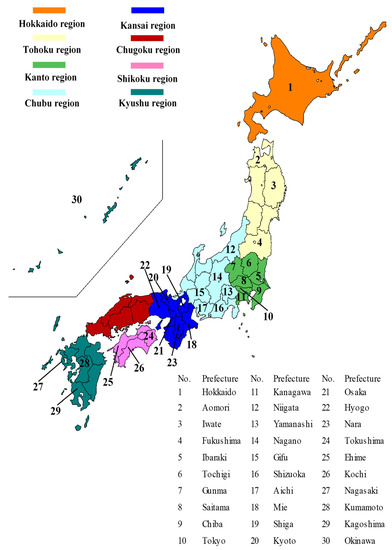
Figure A1.
Geographical locations of 30 prefectures and eight regions in Japan.
Figure A1.
Geographical locations of 30 prefectures and eight regions in Japan.
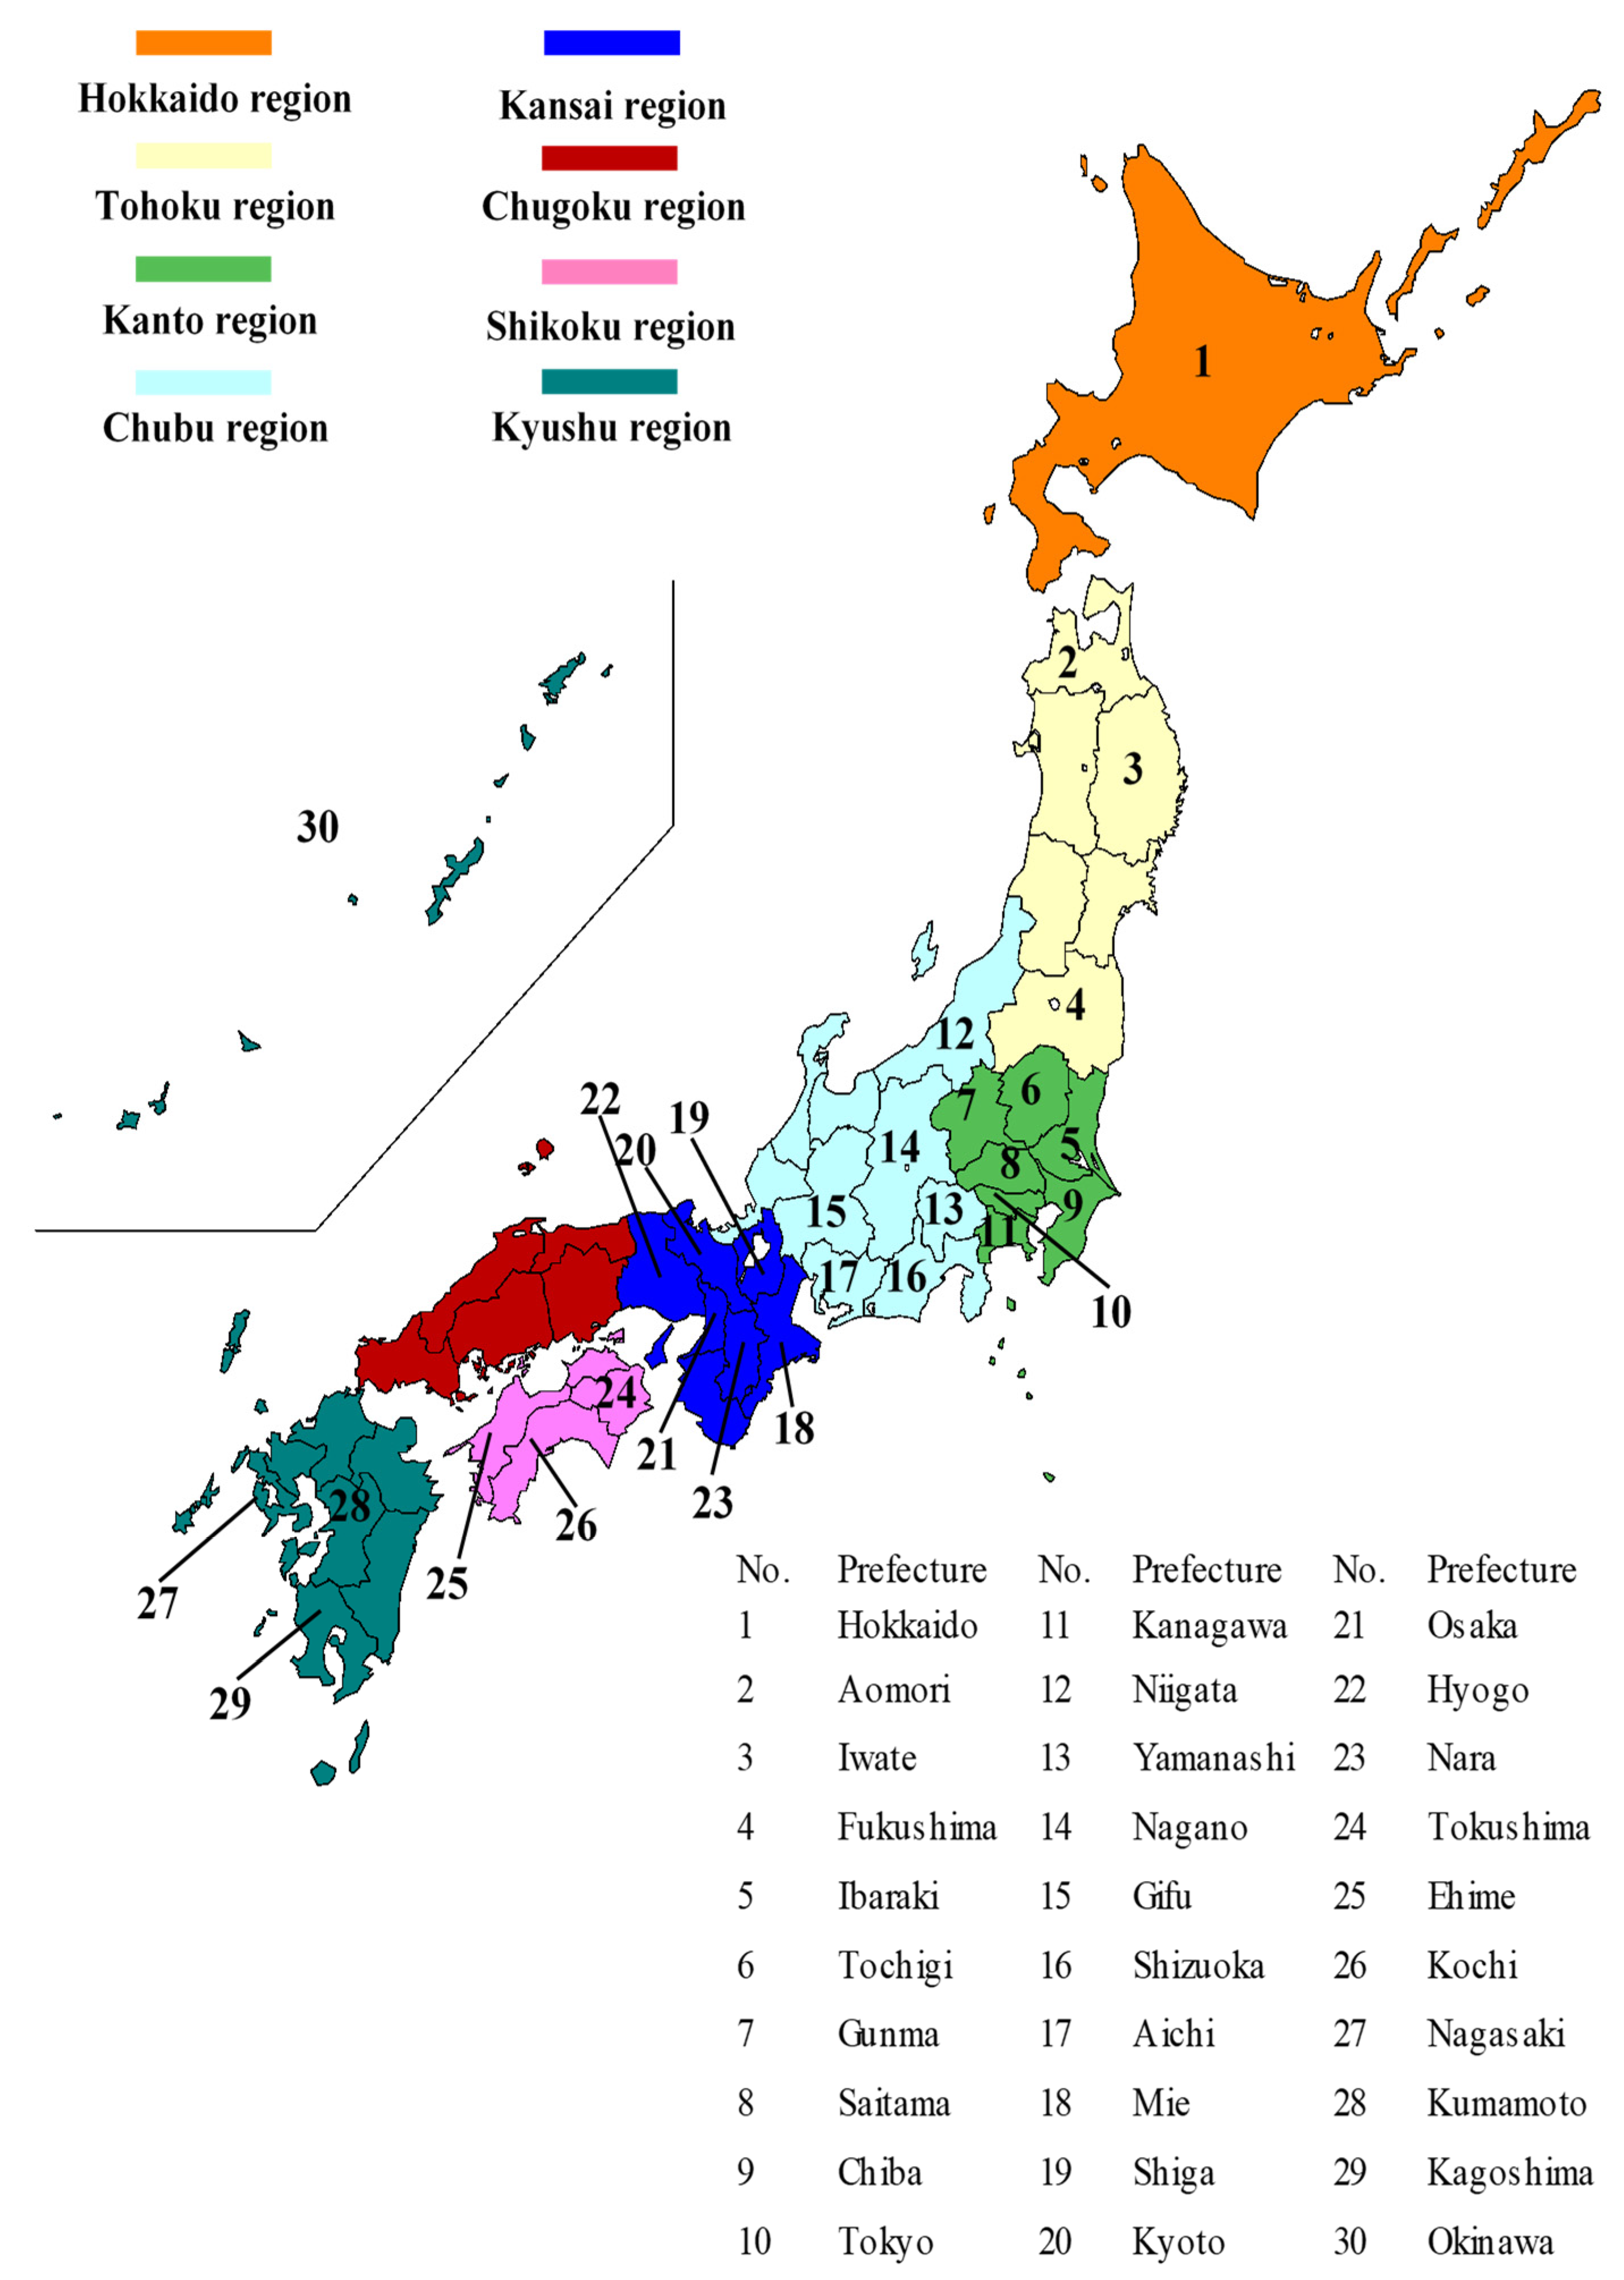
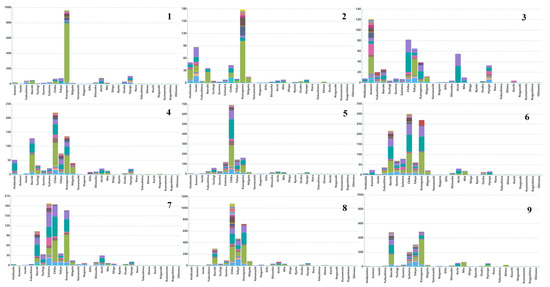
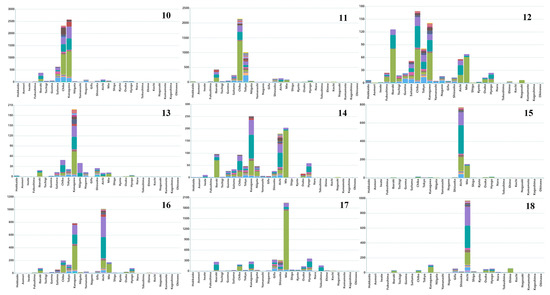
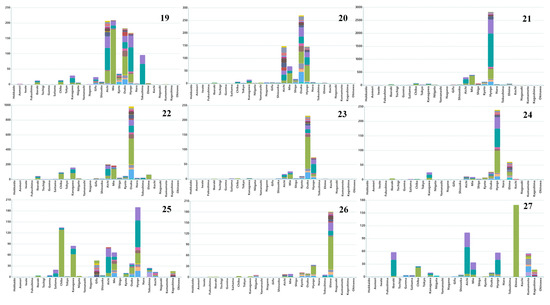
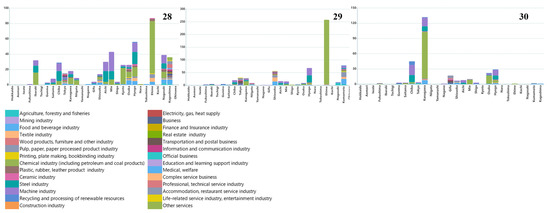
Figure A2.
The CO2 emissions embodied in the domestic imports of 30 prefectures in Japan by exporters in 2011 (units in 10,000 tCO2). The panel numbers correspond to the numbers in Figure A1.
Figure A2.
The CO2 emissions embodied in the domestic imports of 30 prefectures in Japan by exporters in 2011 (units in 10,000 tCO2). The panel numbers correspond to the numbers in Figure A1.
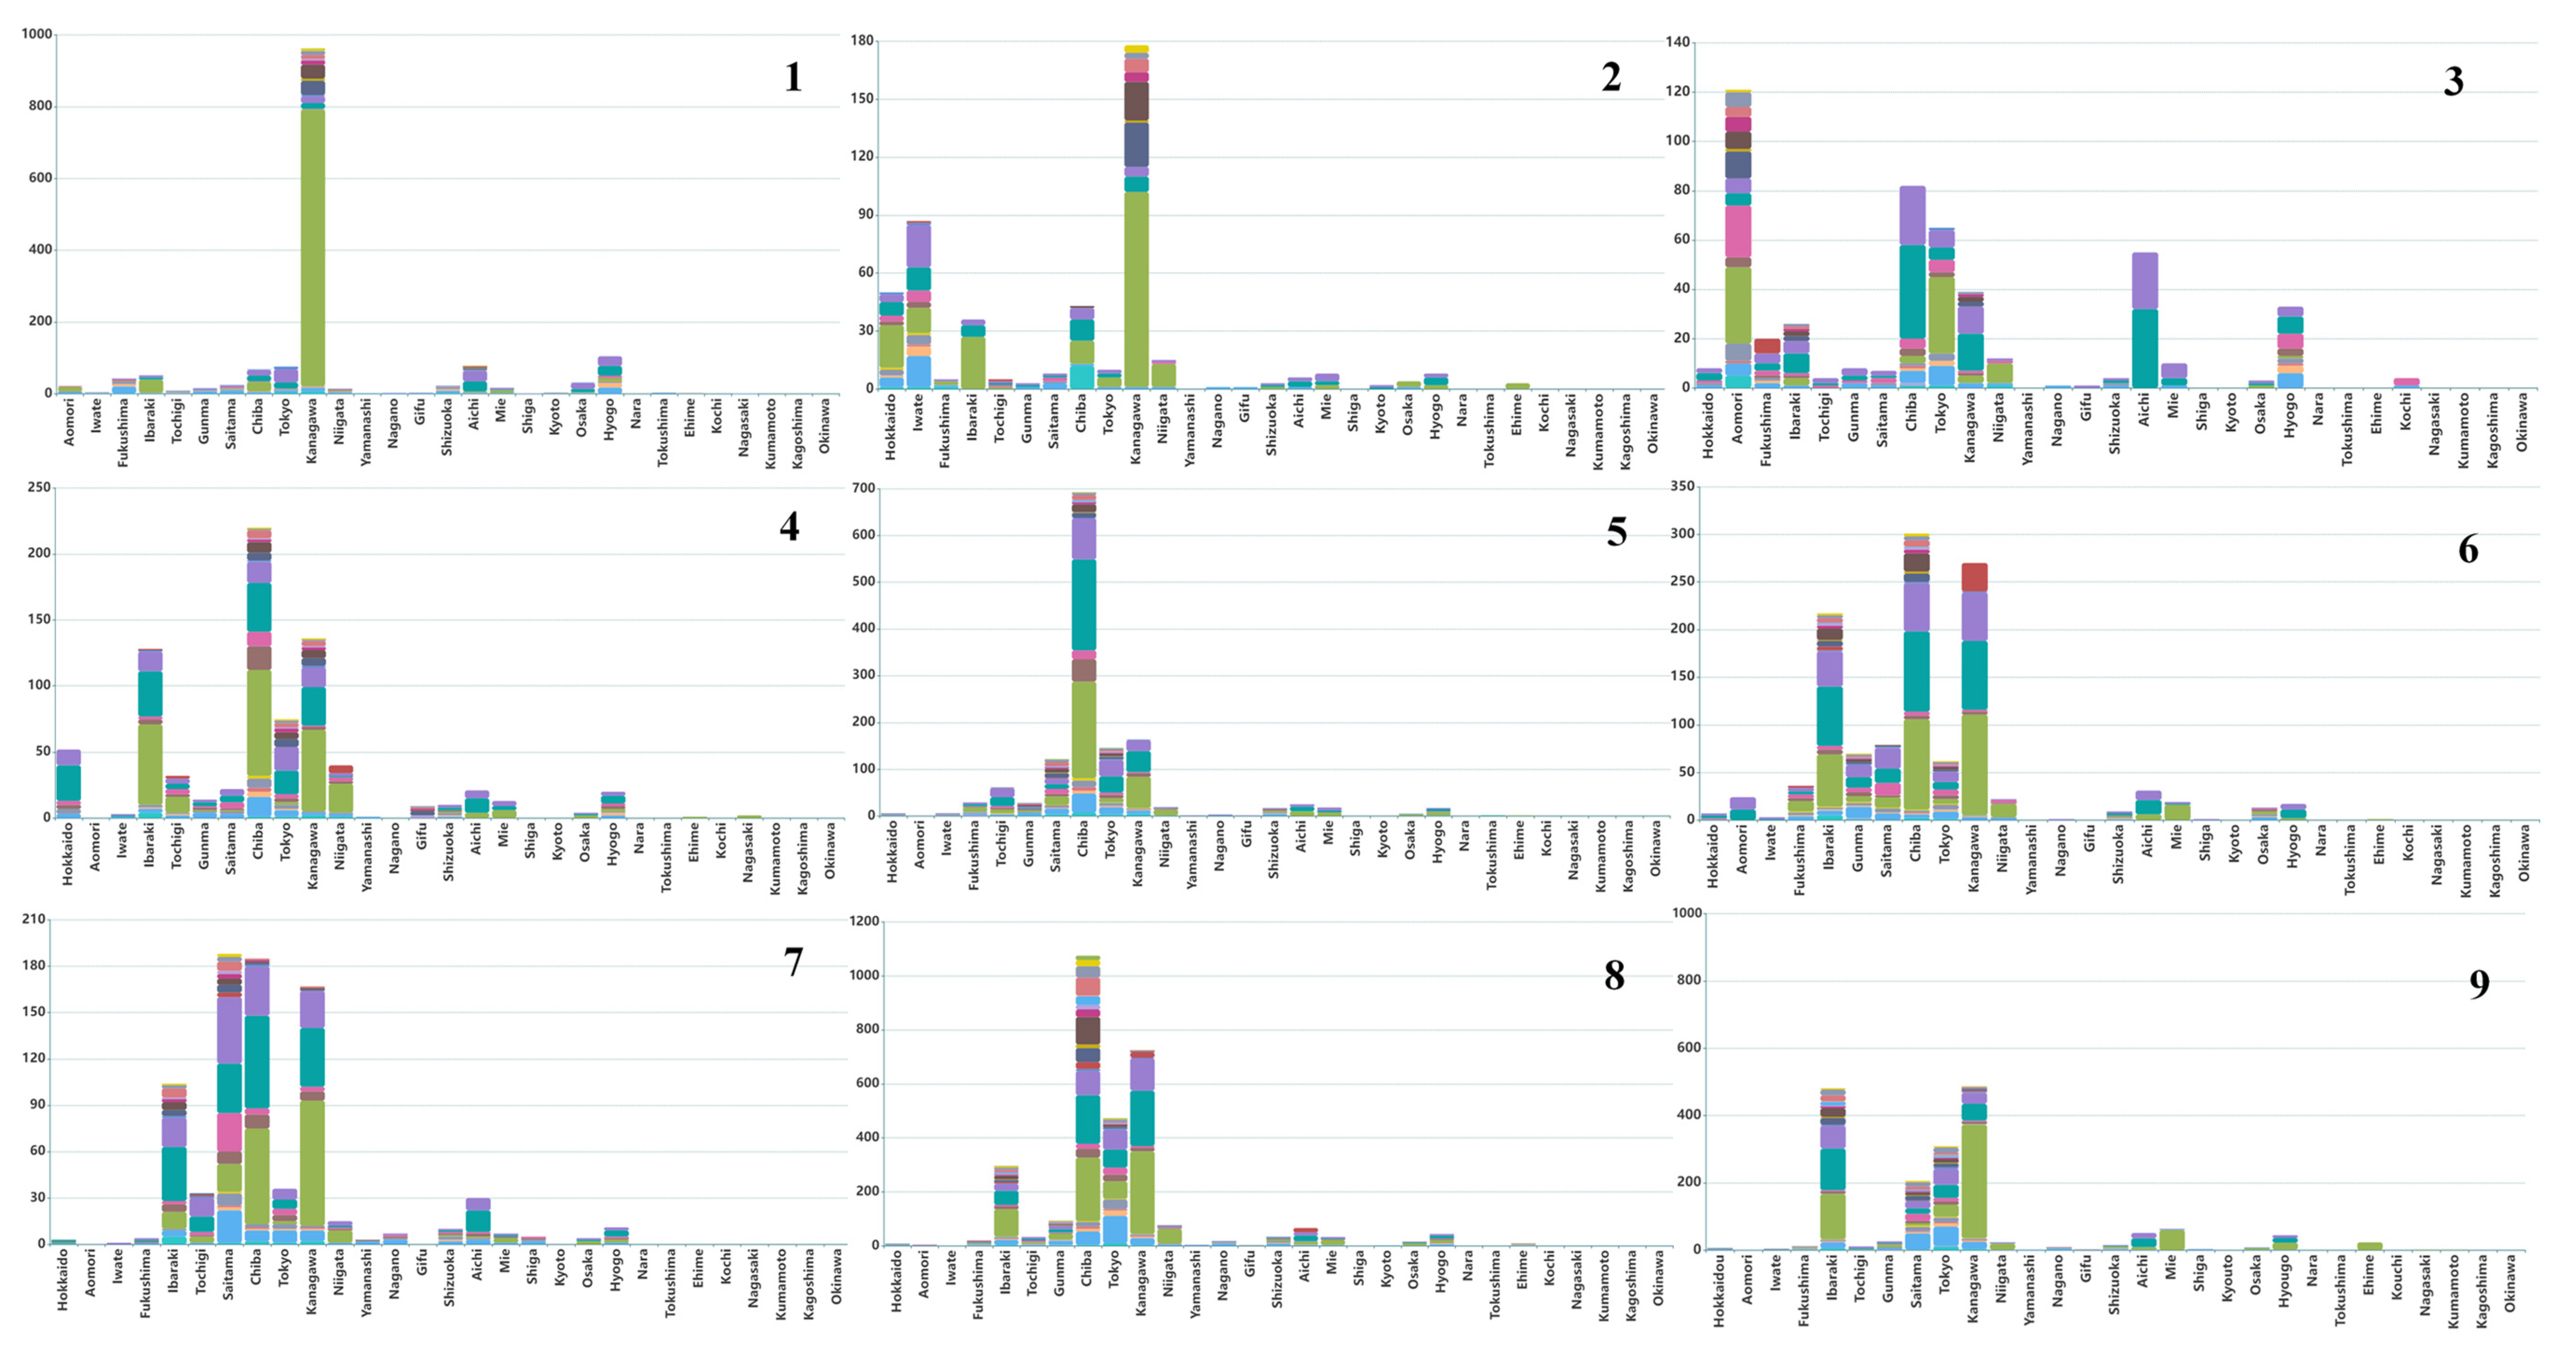
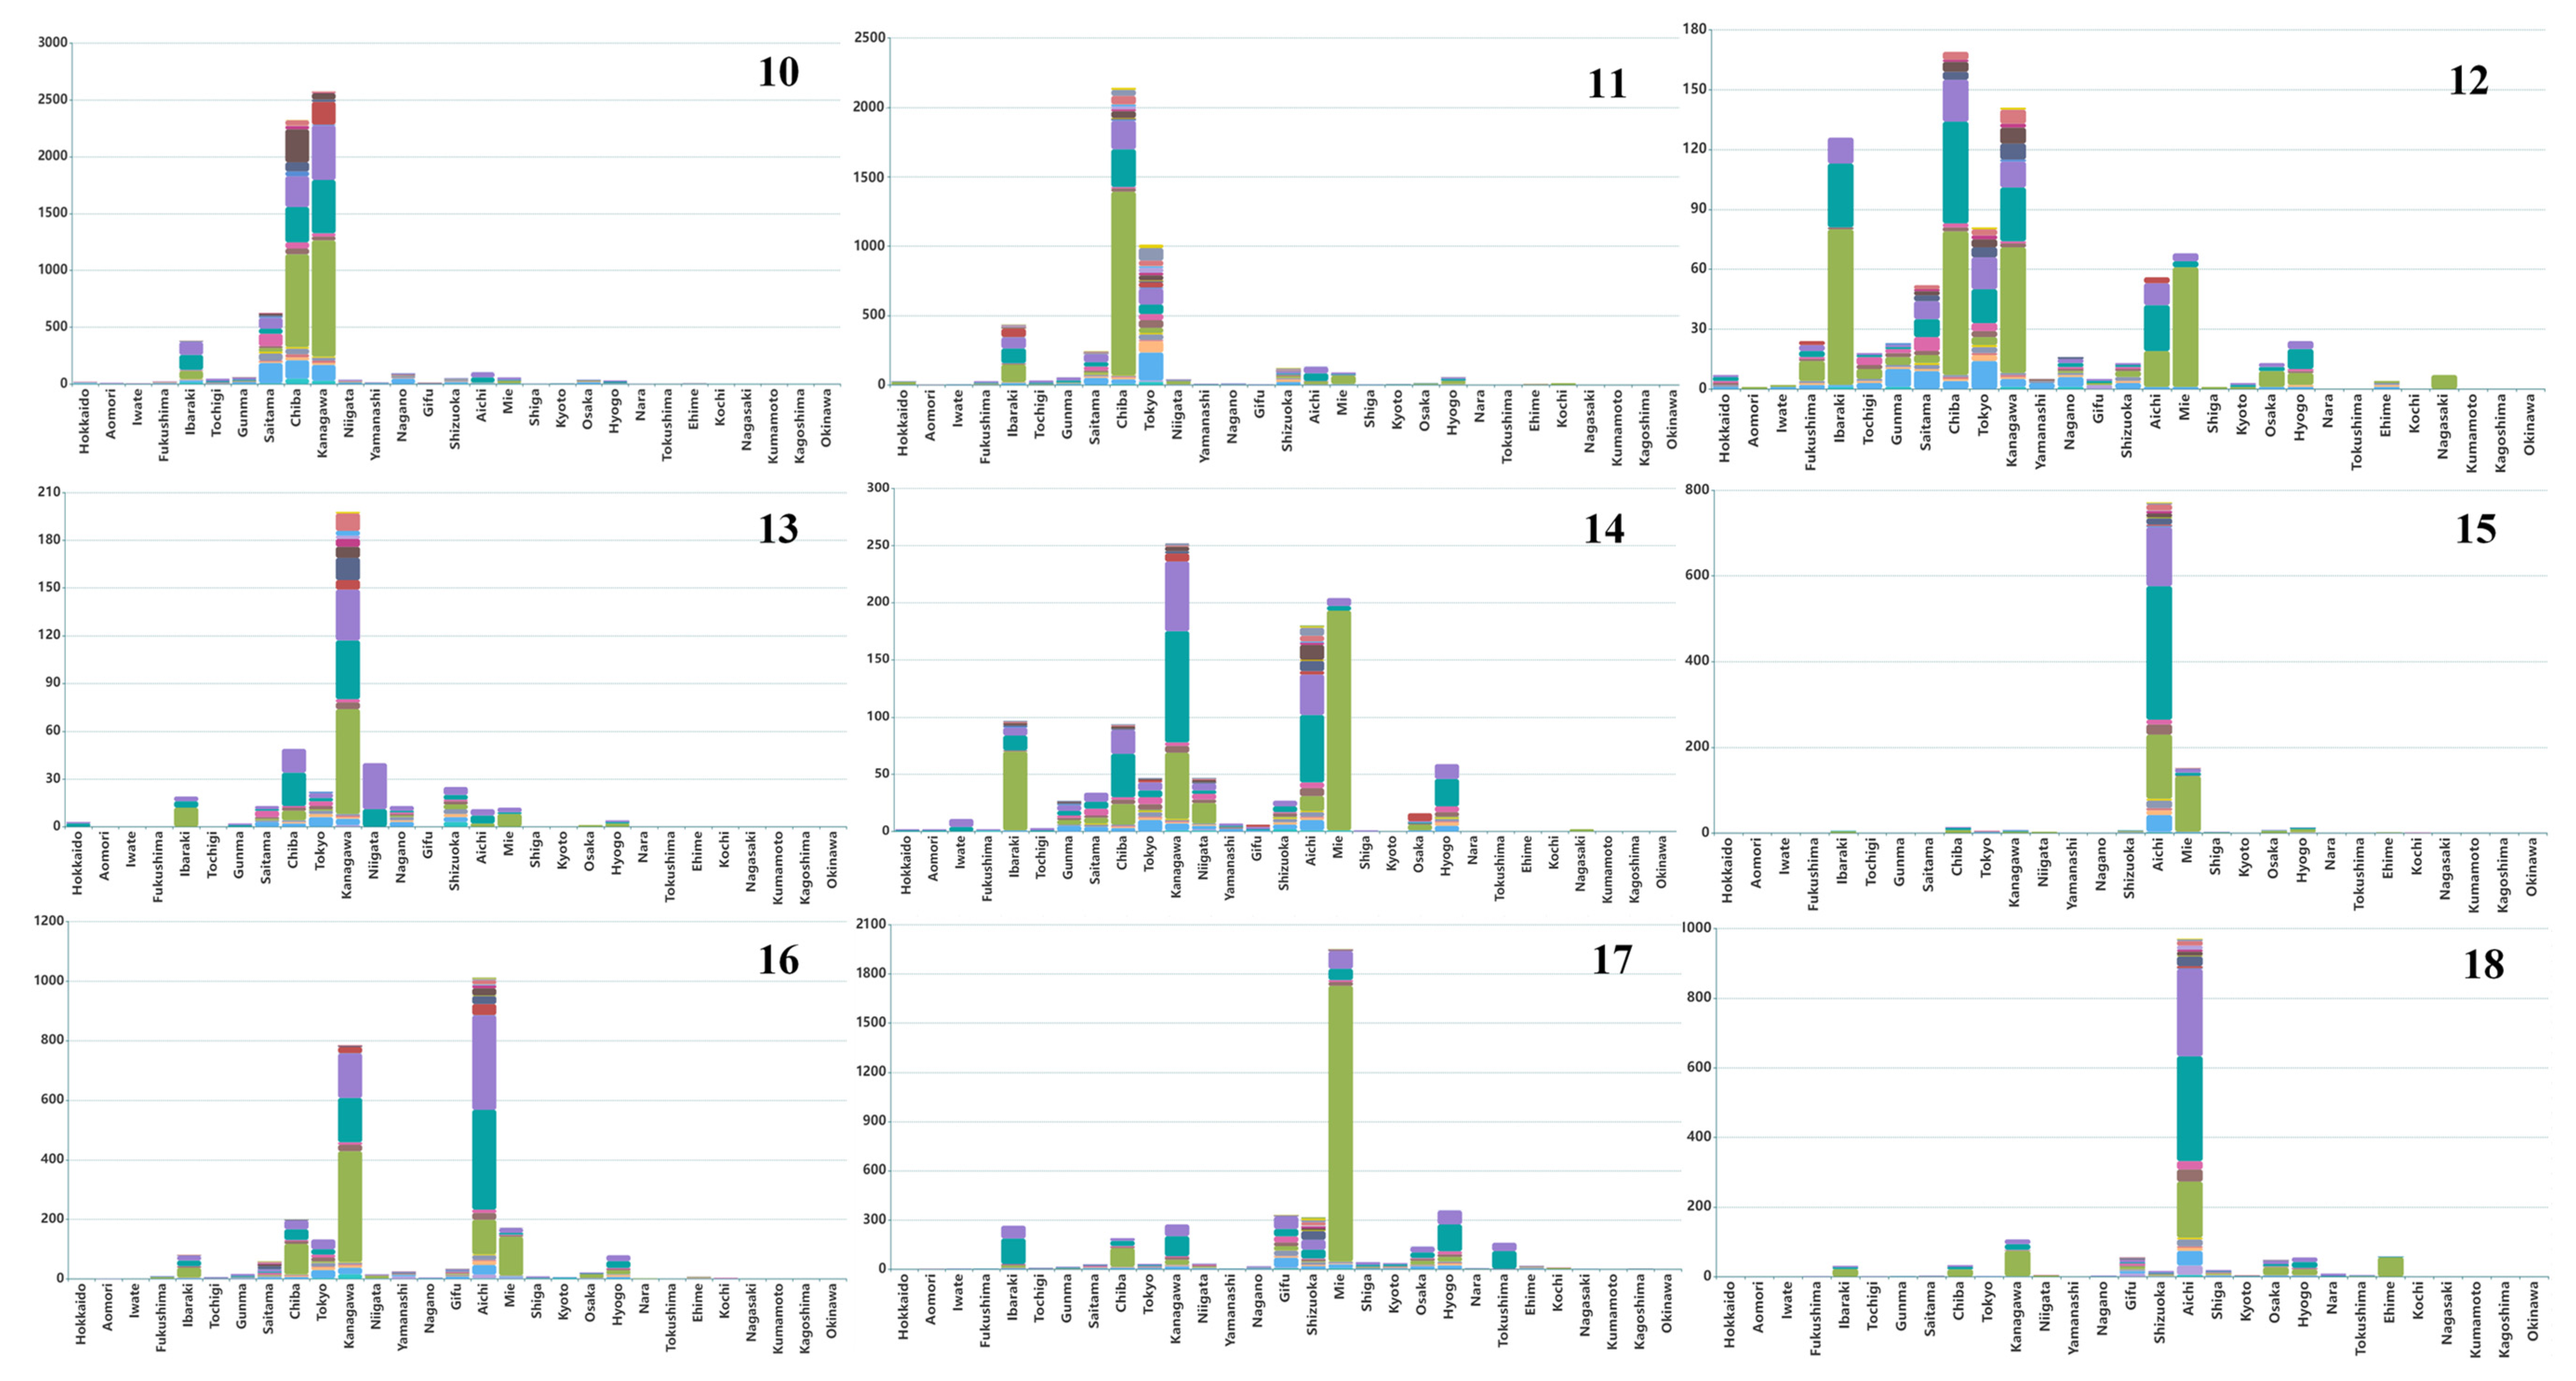
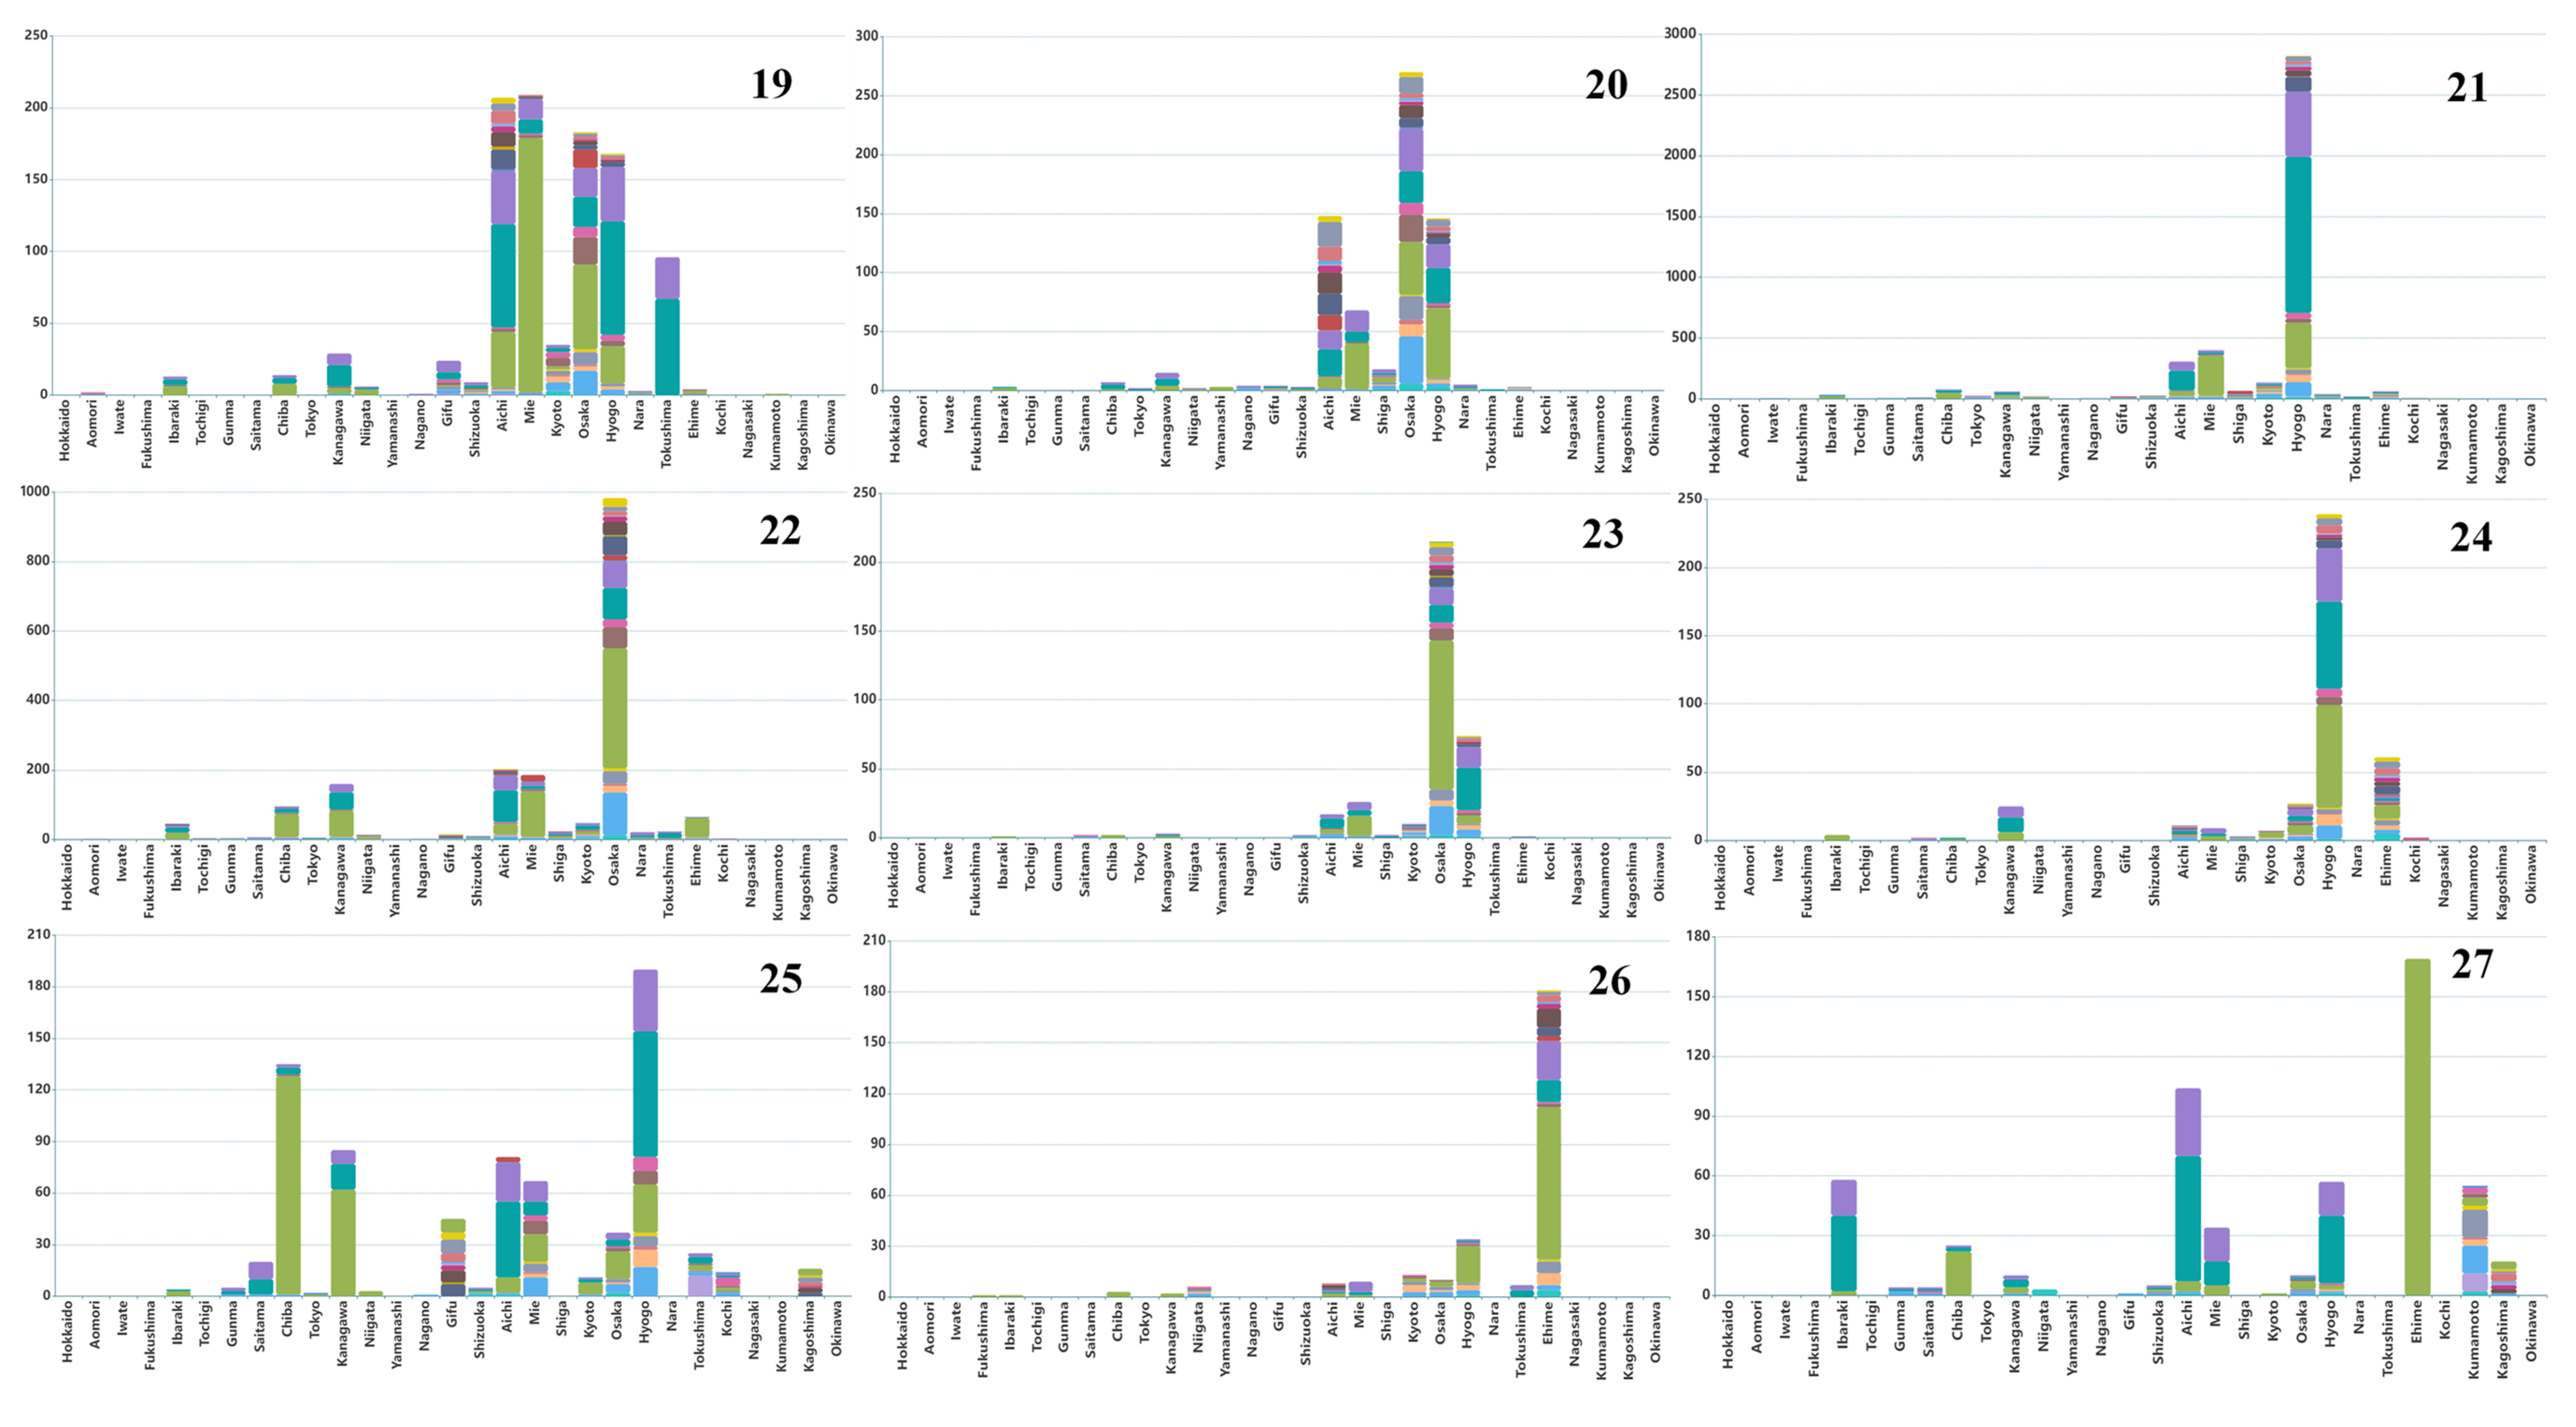
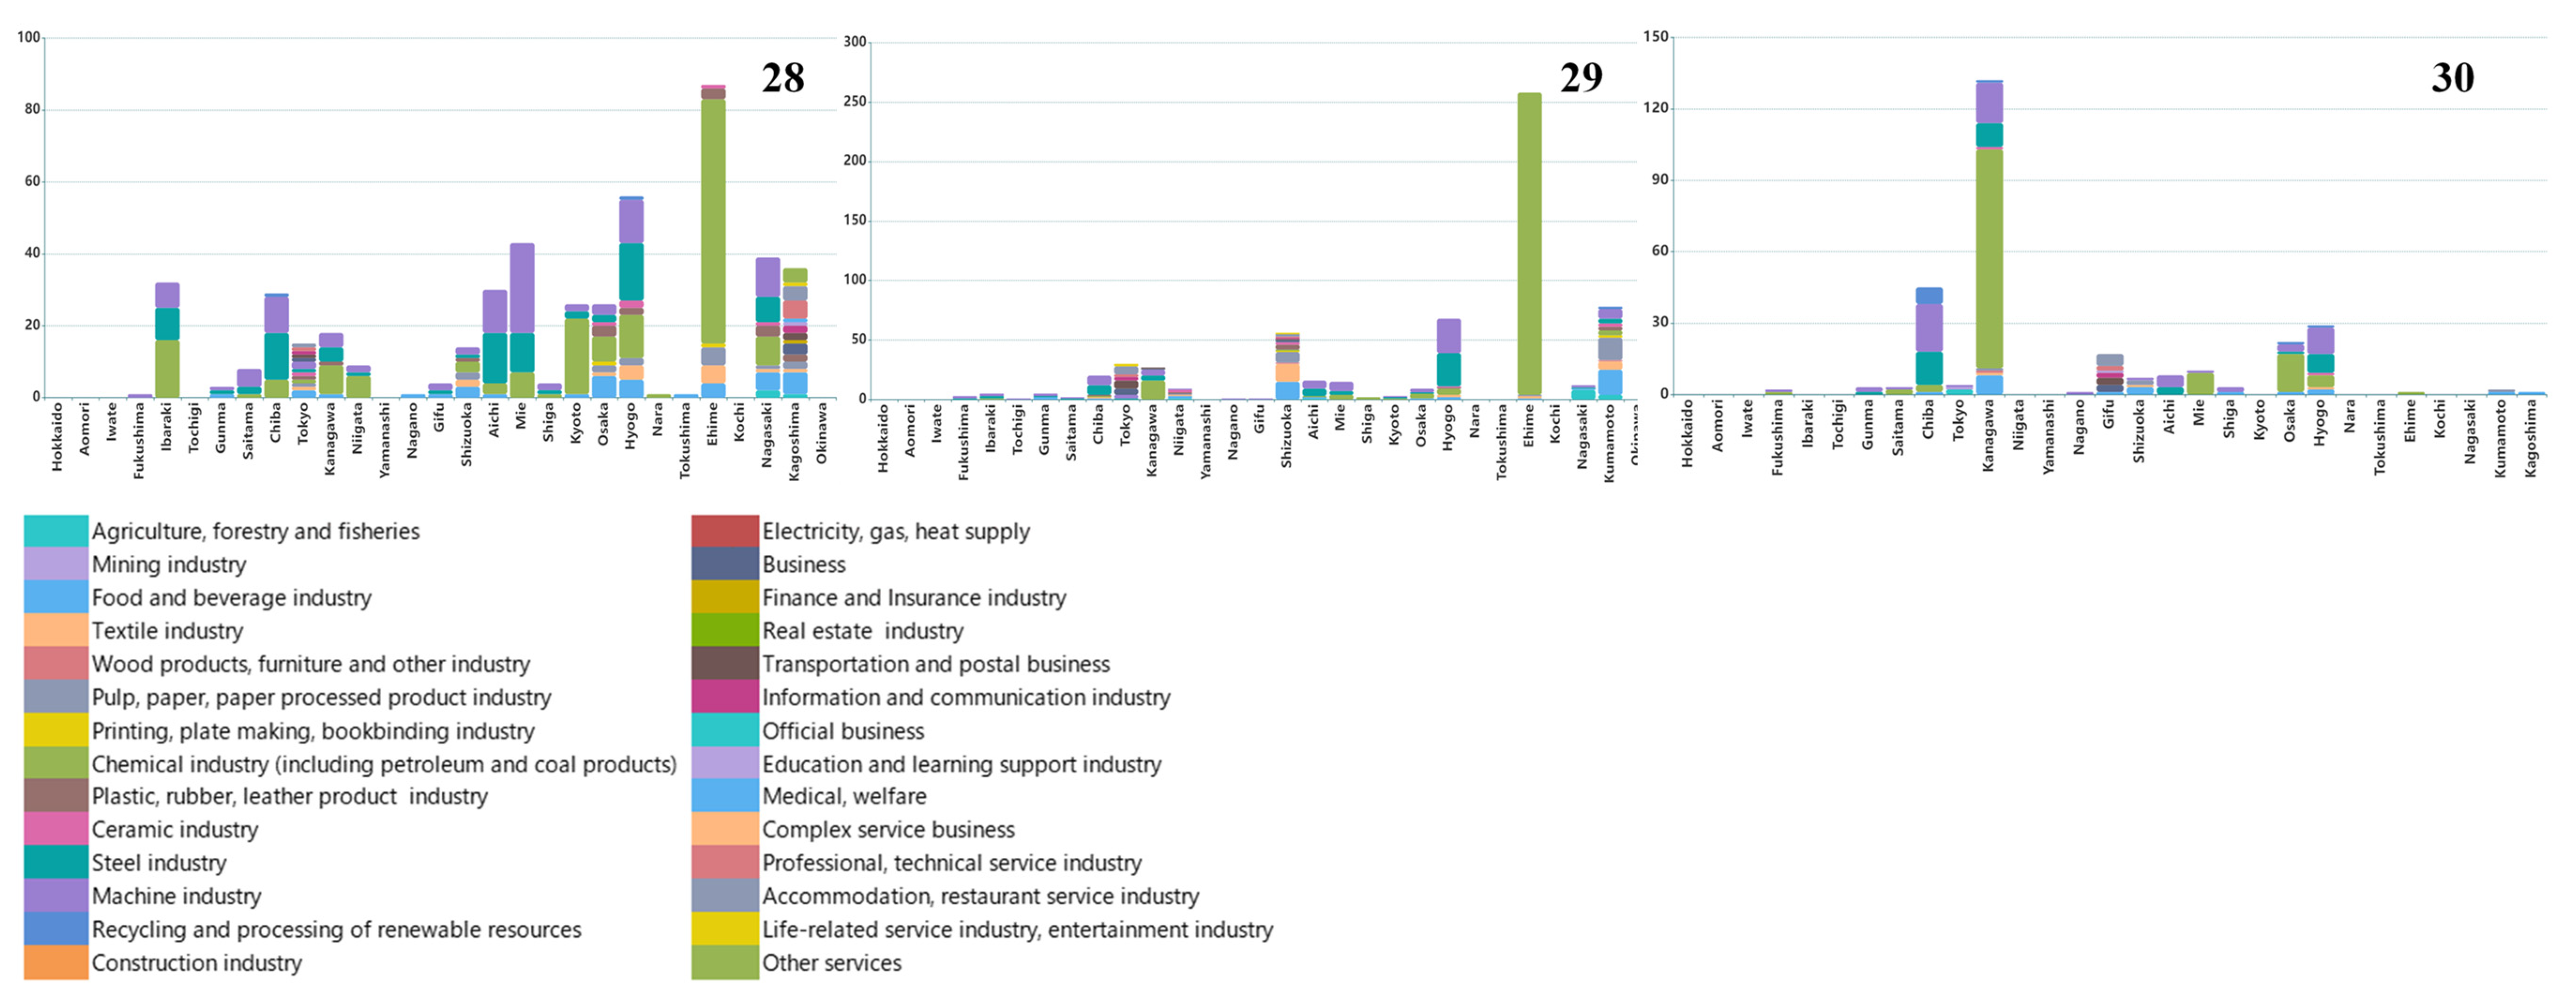

Table A1.
The proportions of import volume from the other 29 prefectures in the total domestic import of each prefecture in 2011.
Table A1.
The proportions of import volume from the other 29 prefectures in the total domestic import of each prefecture in 2011.
| Prefecture | Percentage | Prefecture | Percentage |
|---|---|---|---|
| Hokkaido | 89.57% | Shizuoka | 95.82% |
| Aomori | 82.14% | Aichi | 88.11% |
| Iwate | 37.67% | Mie | 95.51% |
| Fukushima | 61.05% | Shiga | 94.01% |
| Ibaraki | 97.58% | Kyoto | 93.30% |
| Tochigi | 96.79% | Osaka | 85.88% |
| Gunma | 98.13% | Hyogo | 74.60% |
| Saitama | 97.71% | Nara | 92.43% |
| Chiba | 98.54% | Tokushima | 48.46% |
| Tokyo | 98.29% | Ehime | 27.62% |
| Kanagawa | 97.71% | Kochi | 71.14% |
| Niigata | 86.54% | Nagasaki | 30.26% |
| Yamanashi | 96.84% | Kumamoto | 15.57% |
| Nagano | 94.33% | Kagoshima | 19.86% |
| Gifu | 95.52% | Okinawa | 45.97% |
| Weighted average | 92.98% | ||

Table A2.
Sources of IOTs across prefectures (as of 2 April 2022).
Table A2.
Sources of IOTs across prefectures (as of 2 April 2022).
Note: All data were taken from the official websites of prefectural governments.

Table A3.
Sectors of CO2 emissions statistics table.
Table A3.
Sectors of CO2 emissions statistics table.
| No. | Sector | No. | Sector |
|---|---|---|---|
| 1 | Agriculture, Forestry, and Fishery | 15 | Electricity, Gas, Heat Supply, and Water |
| 2 | Mining, Quarrying of Stone and Gravel | 16 | Wholesale and Retail Trade |
| 3 | Food, Beverages, Tobacco, and Feed | 17 | Finance and Insurance |
| 4 | Textile Mill Products | 18 | Real Estate and Goods Rental and Leasing |
| 5 | Lumber, Wood Products, Furniture, and Fixtures | 19 | Transport and Postal Activities |
| 6 | Pulp, Paper, and Paper Products | 20 | Information and Communications |
| 7 | Printing and Allied Industries | 21 | Government |
| 8 | Chemical and Allied Products, Oil and Coal Products | 22 | Education, Learning Support |
| 9 | Plastic Products, Rubber Products, and Leather Products | 23 | Medical, Health Care, and Welfare |
| 10 | Ceramic, Stone, and Clay Products | 24 | Compound Services |
| 11 | Iron and Steel | 25 | Scientific Research, Professional and Technical Services |
| 12 | Machinery | 26 | Accommodation, Eating and Drinking Services |
| 13 | Miscellaneous Manufacturing Industry | 27 | Living Related and Personal Services and Amusement Services |
| 14 | Construction Work Industry | 28 | Miscellaneous Services |

Table A4.
Matching table between sectors of NCNFS and IOTs.
Table A4.
Matching table between sectors of NCNFS and IOTs.
| No. | Sector | No. | Sector | ||
|---|---|---|---|---|---|
| Agricultural, marine, and forest products | 1 | Agriculture, forestry, and fisheries | Special product | Electricity, gas, heat, and water supply | |
| Mining products | 2 | Mining industry | 16 | Business | |
| Light industrial products | 3 | Food and beverage industry | 17 | Finance and Insurance industry | |
| 4 | Textile industry | 18 | Real estate industry | ||
| 5 | Wood products, furniture, and other industry | 19 | Transportation and postal business | ||
| 6 | Pulp, paper, paper processed product industry | 20 | Information and communication industry | ||
| 7 | Printing, plate making, bookbinding industry | 21 | Official business | ||
| 8 | Plastic, rubber, leather product industry | 22 | Education and learning support industry | ||
| 9 | Ceramic industry | 23 | Medical, welfare | ||
| Chemical products | 10 | Chemical industry (including petroleum and coal products) | 24 | Complex service business | |
| Metal machinery products | 11 | Steel industry | 25 | Professional, technical service industry | |
| 12 | Machine industry | 26 | Accommodation, restaurant service industry | ||
| Industrial waste | 13 | Recycling and processing of renewable resources | 27 | Life-related service industry, entertainment industry | |
| Miscellaneous manufactured products | 14 | Construction industry | 28 | Other services |
Note: The manufacturing industry includes the sector marked in orange, and the service industry includes the sector marked in green.
References
- Crippa, M.; Oreggioni, G.; Guizzardi, D.; Muntean, M.; Schaaf, E.; Lo Vullo, E.; Solazzo, E.; Monforti-Ferrario, F.; Olivier, J.; Vignati, E. Fossil CO2 & GHG Emissions of All World Countries; Publications Office of the European Union: Luxembourg, 2019; ISBN 9789276110255. [Google Scholar]
- Climate Change Convention. GHG Time Series Data from UNFCCC. 2019. Available online: https://di.unfccc.int/time_series (accessed on 26 March 2021).
- Ministry of Economy, Trade and Industry. White Paper on Manufacturing Infrastructure. 2015. Available online: https://www.meti.go.jp/report/whitepaper/mono/2015/honbun_pdf/index.html (accessed on 10 March 2021).
- National Institute for Environmental Studies. The GHG Emissions Data of Japan. 2020. Available online: https://www.nies.go.jp/gio/archive/ghgdata/index.html (accessed on 13 March 2021).
- Jiang, Y.; Cai, W.; Wan, L.; Wang, C. An index decomposition analysis of China’s interregional embodied carbon flows. J. Clean. Prod. 2015, 88, 289–296. [Google Scholar] [CrossRef]
- Cabinet Office of Japanese Government. The Regional Economy of 2011. 2011. Available online: https://www5.cao.go.jp/j-j/cr/cr11/chr11_index.html (accessed on 10 June 2022).
- Cabinet Office of Japanese Government. Prefectural Economic Calculation. 2015. Available online: https://www.esri.cao.go.jp/jp/sna/data/data_list/kenmin/files/contents/main_h26.html (accessed on 10 June 2022).
- Furukawa, S. Local Decentralization in Japan. Local Gov. Law J. 2010, 10, 35–63. [Google Scholar] [CrossRef]
- Wang, Y.; Xiong, S.; Ma, X. Carbon inequality in global trade: Evidence from the mismatch between embodied carbon emissions and value added. Ecol. Econ. 2022, 195, 107398. [Google Scholar] [CrossRef]
- Jiang, L.; He, S.; Tian, X.; Zhang, B.; Zhou, H. Energy use embodied in international trade of 39 countries: Spatial transfer patterns and driving factors. Energy 2020, 195, 116988. [Google Scholar] [CrossRef]
- Wang, Q.; Zhou, Y. Imbalance of carbon emissions embodied in the US-Japan trade: Temporal change and driving factors. J. Clean. Prod. 2019, 237, 117780. [Google Scholar] [CrossRef]
- Dou, Y.; Zhao, J.; Malik, M.N.; Dong, K. Assessing the impact of trade openness on CO2 emissions: Evidence from China-Japan-ROK FTA countries. J. Environ. Manag. 2021, 296, 113241. [Google Scholar] [CrossRef]
- Yoon, Y.; Kim, Y.K.; Kim, J. Embodied CO2 emission changes in manufacturing trade: Structural decomposition analysis of China, Japan, and Korea. Atmosphere 2020, 11, 597. [Google Scholar] [CrossRef]
- Battuvshin, B.; Matsuoka, Y.; Shirasawa, H.; Toyama, K.; Hayashi, U.; Aruga, K. Supply potential and annual availability of timber and forest biomass resources for energy considering inter-prefectural trade in Japan. Land Use Policy 2020, 97, 104780. [Google Scholar] [CrossRef]
- Sadayuki, T.; Arimura, T.H. Do regional emission trading schemes lead to carbon leakage within firms? Evidence from Japan. Energy Econ. 2021, 104, 105664. [Google Scholar] [CrossRef]
- Wu, X.D.; Guo, J.L.; Li, C.; Chen, G.Q.; Ji, X. Carbon emissions embodied in the global supply chain: Intermediate and final trade imbalances. Sci. Total Environ. 2020, 707, 134670. [Google Scholar] [CrossRef]
- Wang, Q.; Zhou, Y. Uncovering embodied CO2 flows via North-North trade–A case study of US-Germany trade. Sci. Total Environ. 2019, 691, 943–959. [Google Scholar] [CrossRef] [PubMed]
- Kim, T.J.; Tromp, N. Analysis of carbon emissions embodied in South Korea’s international trade: Production-based and consumption-based perspectives. J. Clean. Prod. 2021, 320, 128839. [Google Scholar] [CrossRef]
- Tian, K.; Zhang, Y.; Li, Y.; Ming, X.; Jiang, S.; Duan, H.; Yang, C.; Wang, S. Regional trade agreement burdens global carbon emissions mitigation. Nat. Commun. 2022, 13, 1–12. [Google Scholar] [CrossRef] [PubMed]
- Wang, Q.; Yang, X. Imbalance of carbon embodied in South-South trade: Evidence from China-India trade. Sci. Total Environ. 2020, 707, 134473. [Google Scholar] [CrossRef]
- Kim, T.J.; Tromp, N. Carbon emissions embodied in China-Brazil trade: Trends and driving factors. J. Clean. Prod. 2021, 293, 126206. [Google Scholar] [CrossRef]
- Liu, H.; Zong, Z.; Hynes, K.; De Bruyne, K. Can China reduce the carbon emissions of its manufacturing exports by moving up the global value chain? Res. Int. Bus. Financ. 2020, 51, 101101. [Google Scholar] [CrossRef]
- Wang, S.; Zhao, Y.; Wiedmann, T. Carbon emissions embodied in China–Australia trade: A scenario analysis based on input–output analysis and panel regression models. J. Clean. Prod. 2019, 220, 721–731. [Google Scholar] [CrossRef]
- Wang, Q.; Liu, Y.; Wang, H. Determinants of net carbon emissions embodied in Sino-German trade. J. Clean. Prod. 2019, 235, 1216–1231. [Google Scholar] [CrossRef]
- Wang, Q.; Han, X. Is decoupling embodied carbon emissions from economic output in Sino-US trade possible? Technol. Forecast. Soc. Chang. 2021, 169, 120805. [Google Scholar] [CrossRef]
- Wu, R.; Geng, Y.; Dong, H.; Fujita, T.; Tian, X. Changes of CO2 emissions embodied in China-Japan trade: Drivers and implications. J. Clean. Prod. 2016, 112, 4151–4158. [Google Scholar] [CrossRef]
- Zhao, Y.; Wang, S.; Yang, J.; Zhang, Z.; Liu, Y. Input-output analysis of carbon emissions embodied in China-Japan trade. Appl. Econ. 2016, 48, 1515–1529. [Google Scholar] [CrossRef]
- Long, R.; Li, J.; Chen, H.; Zhang, L.; Li, Q. Embodied carbon dioxide flow in international trade: A comparative analysis based on China and Japan. J. Environ. Manag. 2018, 209, 371–381. [Google Scholar] [CrossRef] [PubMed]
- Xu, D.; Zhang, Y.; Chen, B.; Bai, J.; Liu, G.; Zhang, B. Identifying the critical paths and sectors for carbon transfers driven by global consumption in 2015. Appl. Energy 2022, 306, 118137. [Google Scholar] [CrossRef]
- Xu, D.; Zhang, Y.; Li, Y.; Wang, X.; Yang, Z. Path analysis for carbon transfers embodied in China’s international trade and policy implications for mitigation targets. J. Clean. Prod. 2022, 334, 130207. [Google Scholar] [CrossRef]
- Zhou, D.; Zhou, X.; Xu, Q.; Wu, F.; Wang, Q.; Zha, D. Regional embodied carbon emissions and their transfer characteristics in China. Struct. Chang. Econ. Dyn. 2018, 46, 180–193. [Google Scholar] [CrossRef]
- Wei, W.; Hao, S.; Yao, M.; Chen, W.; Wang, S.; Wang, Z.; Wang, Y.; Zhang, P. Unbalanced economic benefits and the electricity-related carbon emissions embodied in China’s interprovincial trade. J. Environ. Manag. 2020, 263, 110390. [Google Scholar] [CrossRef]
- Wang, W.; Hu, Y. The measurement and influencing factors of carbon transfers embodied in inter-provincial trade in China. J. Clean. Prod. 2020, 270, 122460. [Google Scholar] [CrossRef]
- Yi, I.; Itsubo, N.; Inaba, A.; Matsumoto, K. Development of the interregional I/O based LCA method considering region-specifics of indirect effects in regional evaluation. Int. J. Life Cycle Assess. 2007, 12, 353–364. [Google Scholar] [CrossRef]
- Hasegawa, R.; Kagawa, S.; Tsukui, M. Carbon footprint analysis through constructing a multi-region input–output table: A case study of Japan. J. Econ. Struct. 2015, 4. [Google Scholar] [CrossRef] [Green Version]
- Lin, B.; Xie, X. CO2 emissions of China’s food industry: An input-output approach. J. Clean. Prod. 2016, 112, 1410–1421. [Google Scholar] [CrossRef]
- Leontief, W. Environmental Repercussions and the Economic Structure: An Input-Output Approach. Rev. Econ. Stat. 1970, 52, 262. [Google Scholar] [CrossRef]
- He, H.; Reynolds, C.J.; Li, L.; Boland, J. Assessing net energy consumption of Australian economy from 2004–05 to 2014–15: Environmentally-extended input-output analysis, structural decomposition analysis, and linkage analysis. Appl. Energy 2019, 240, 766–777. [Google Scholar] [CrossRef]
- Wakiyama, T.; Lenzen, M.; Geschke, A.; Bamba, R.; Nansai, K. A flexible multiregional input–output database for city-level sustainability footprint analysis in Japan. Resour. Conserv. Recycl. 2020, 154, 104588. [Google Scholar] [CrossRef]
- Agency for Natural Resources and Energy. Energy Consumption Statistics by Prefecture 2021. Available online: https://www.enecho.meti.go.jp/statistics/energy_consumption/ec002/results.html#headline2 (accessed on 27 October 2021).
- Ministry of Land Infrastructure Transport and Tourism. National Cargo Net Flow Survey. 2016. Available online: https://www.mlit.go.jp/sogoseisaku/transport/butsuryu06100.html (accessed on 10 March 2021).
- Japan Center for Climate Change Actions. Trends in Carbon Dioxide Emissions by Sector in Japan (1990–2019). 2021. Available online: https://www.jccca.org/download/13336?p_page=3#search (accessed on 27 January 2022).
- Matsumoto, K.; Shigetomi, Y.; Shiraki, H.; Ochi, Y.; Ogawa, Y.; Ehara, T. Addressing key drivers of regional CO2 emissions of the manufacturing industry in Japan. Energy J. 2019, 40, 3–8. [Google Scholar] [CrossRef]
Publisher’s Note: MDPI stays neutral with regard to jurisdictional claims in published maps and institutional affiliations. |
© 2022 by the authors. Licensee MDPI, Basel, Switzerland. This article is an open access article distributed under the terms and conditions of the Creative Commons Attribution (CC BY) license (https://creativecommons.org/licenses/by/4.0/).

