
Climate Change and Food Security Prioritizing Indices: Applying Analytical Hierarchy Process (AHP) and Social Network Analysis (SNA)

 ,
,
Abstract
:1. Introduction
Literature Review
2. Methods
2.1. Tools Assessment
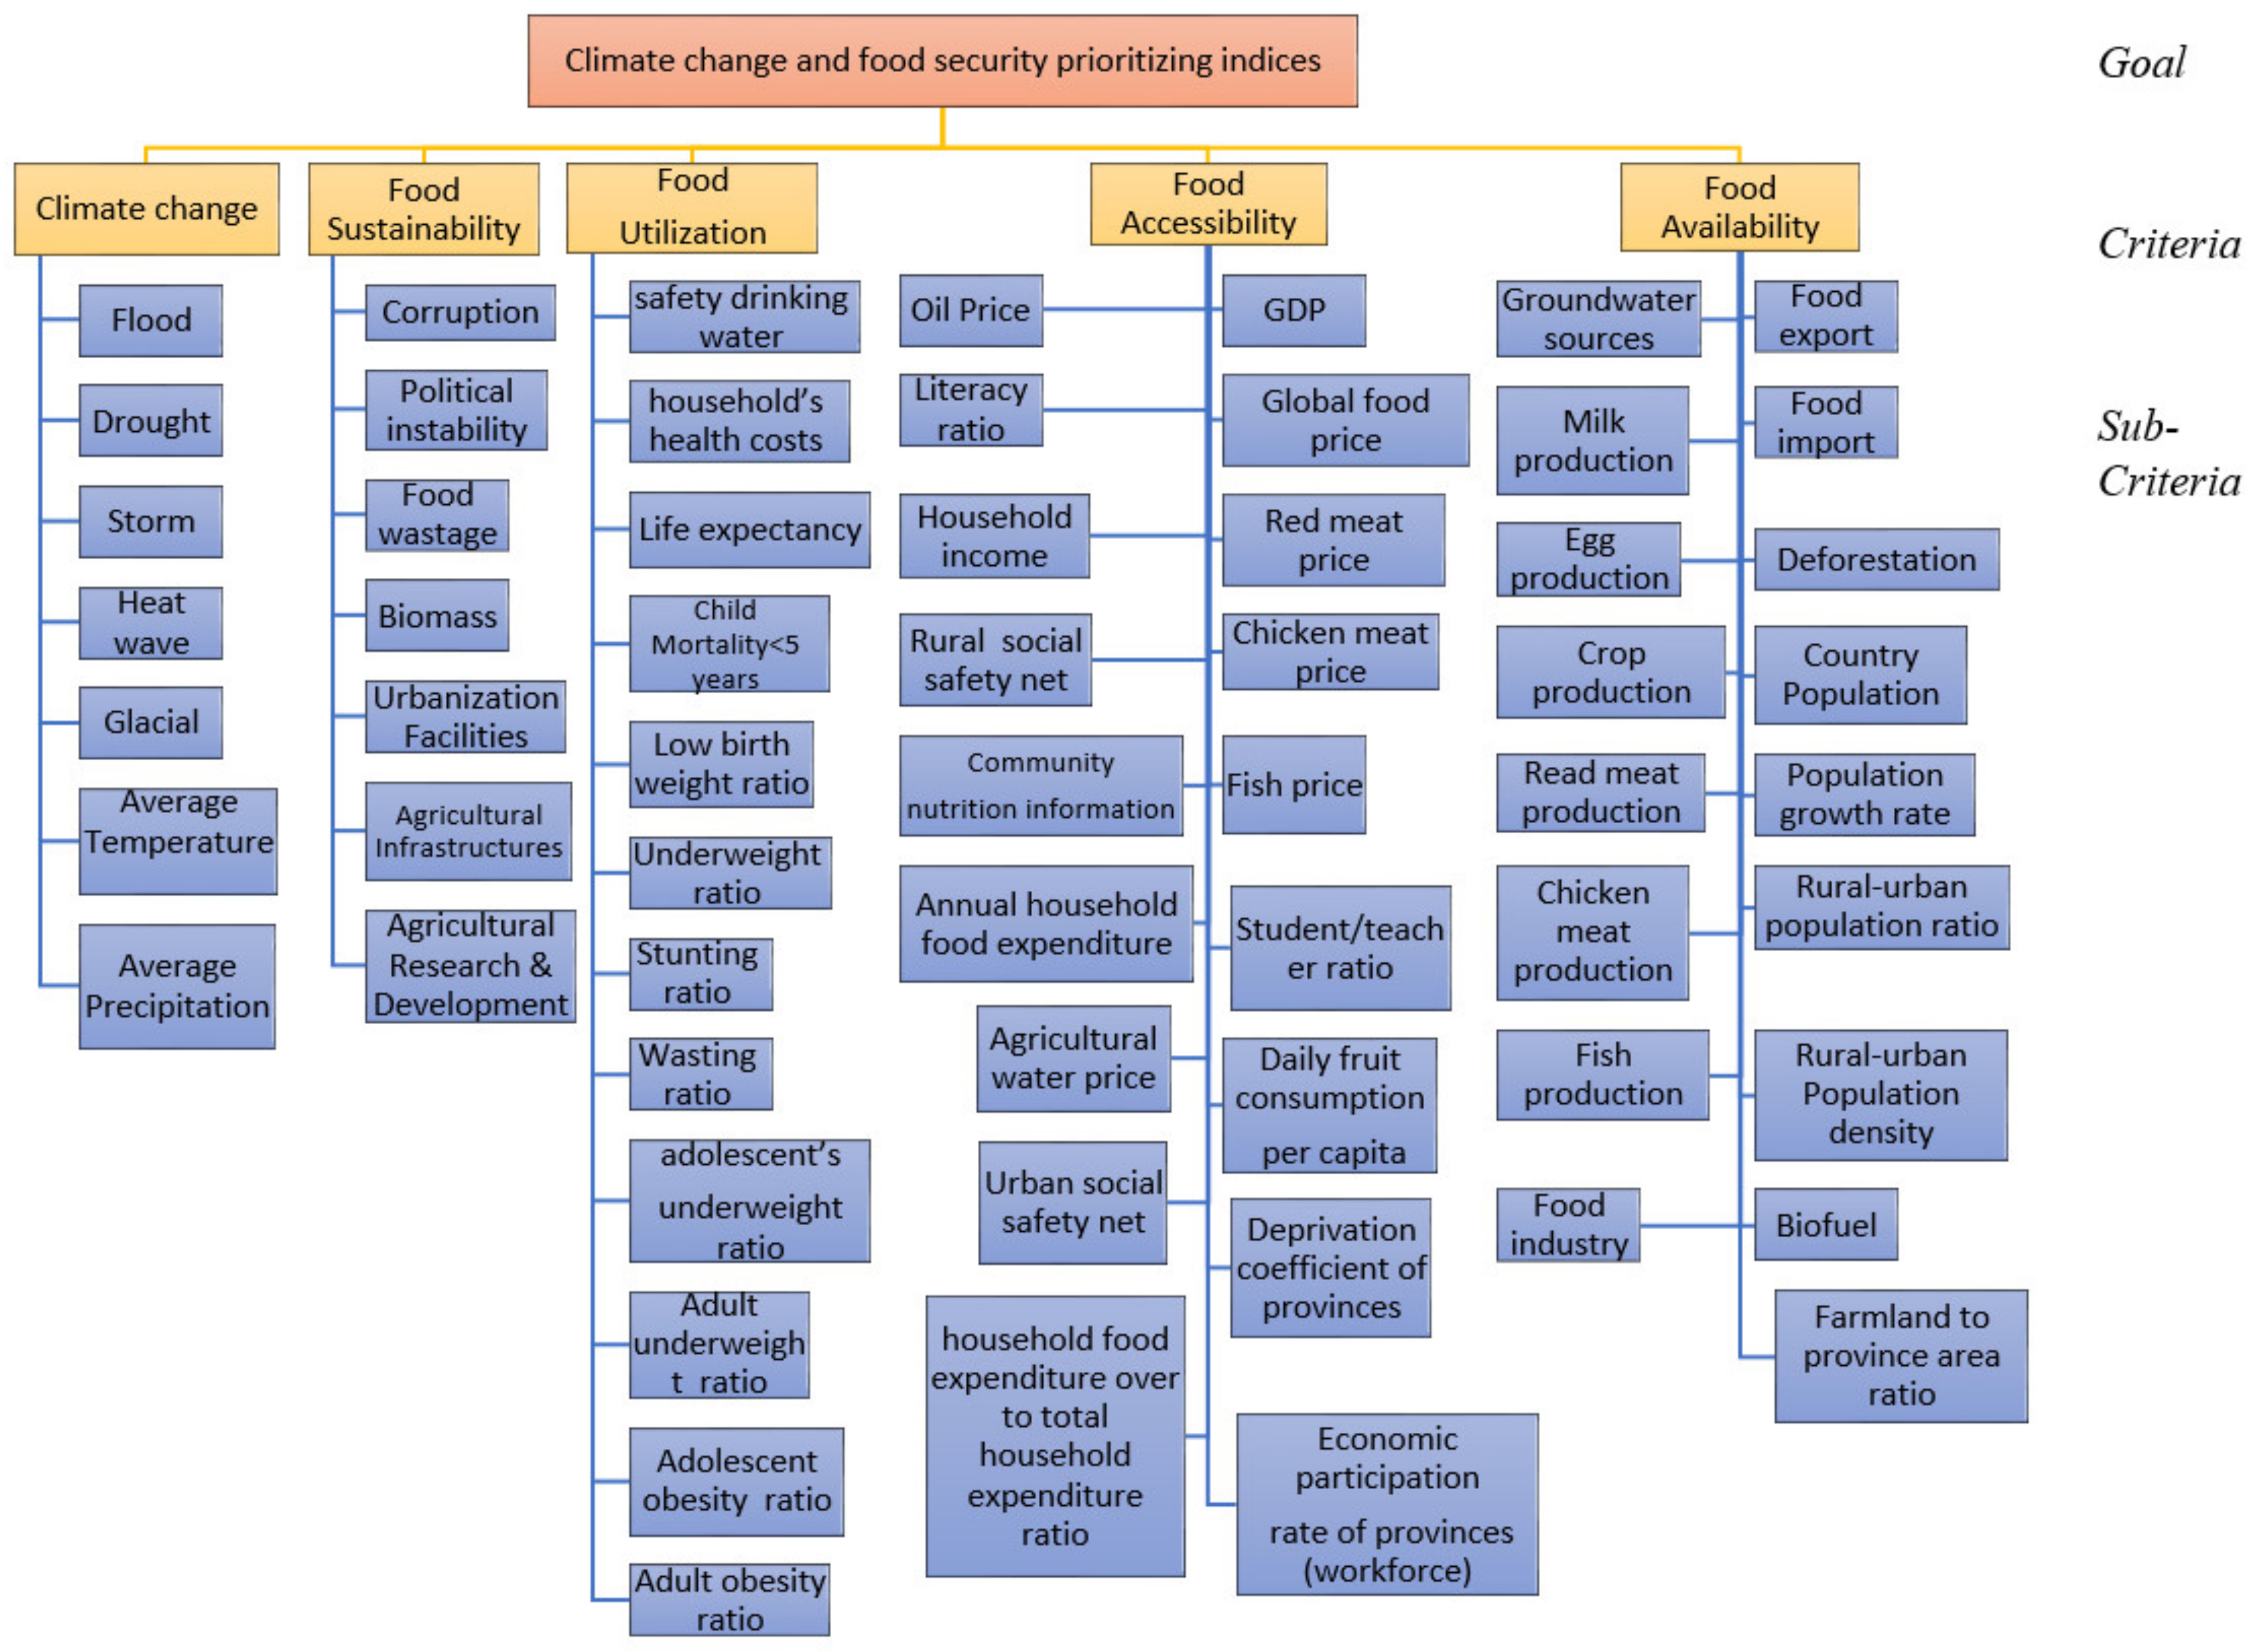
2.2. Building the AHP Model
2.3. AHP Scoring

| Intensity of Importance | Definition |
|---|---|
| 1 | Equal importance both elements |
| 3 | Weak importance of one indicator over another |
| 5 | Substantial importance of one indicator over another |
| 7 | Very strong or demonstrated importance of one indicator over another |
| 9 | The extreme importance of one indicator over another |
| 2, 4, 6, 8 | Intermediate values between two adjacent judgments |
2.4. Data Collection and Analysis
2.5. AHP Development and Data Analysis
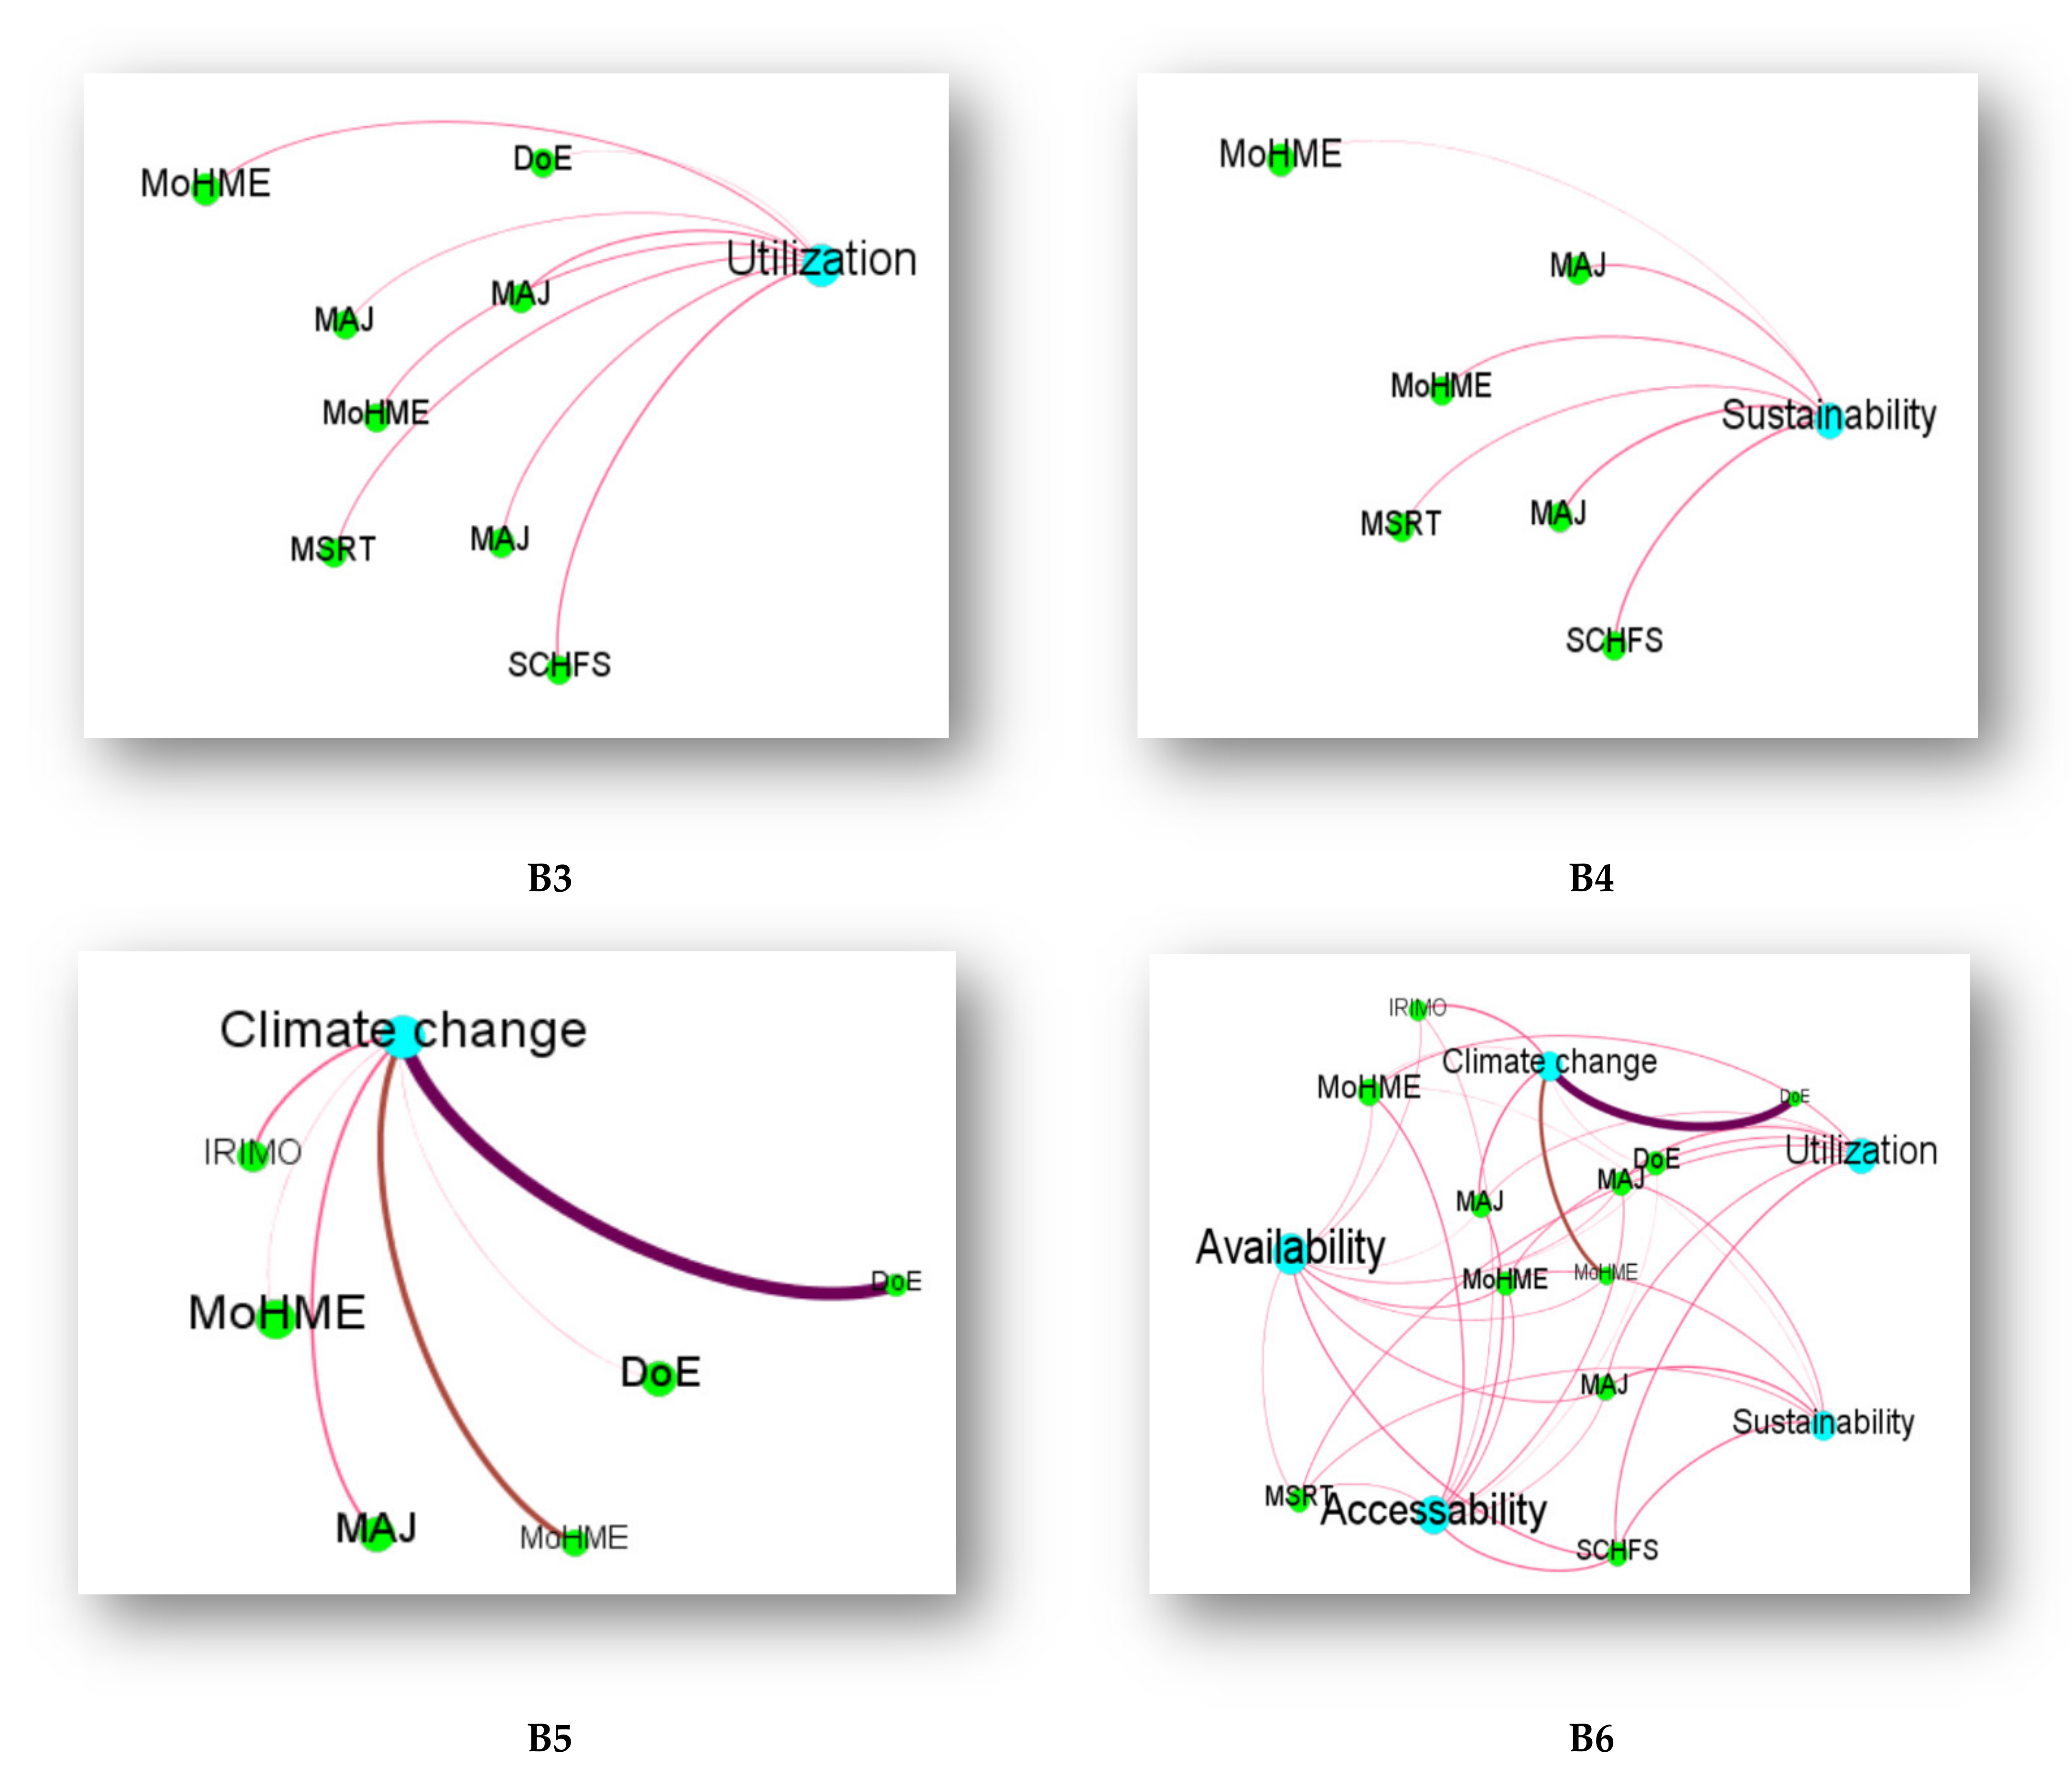
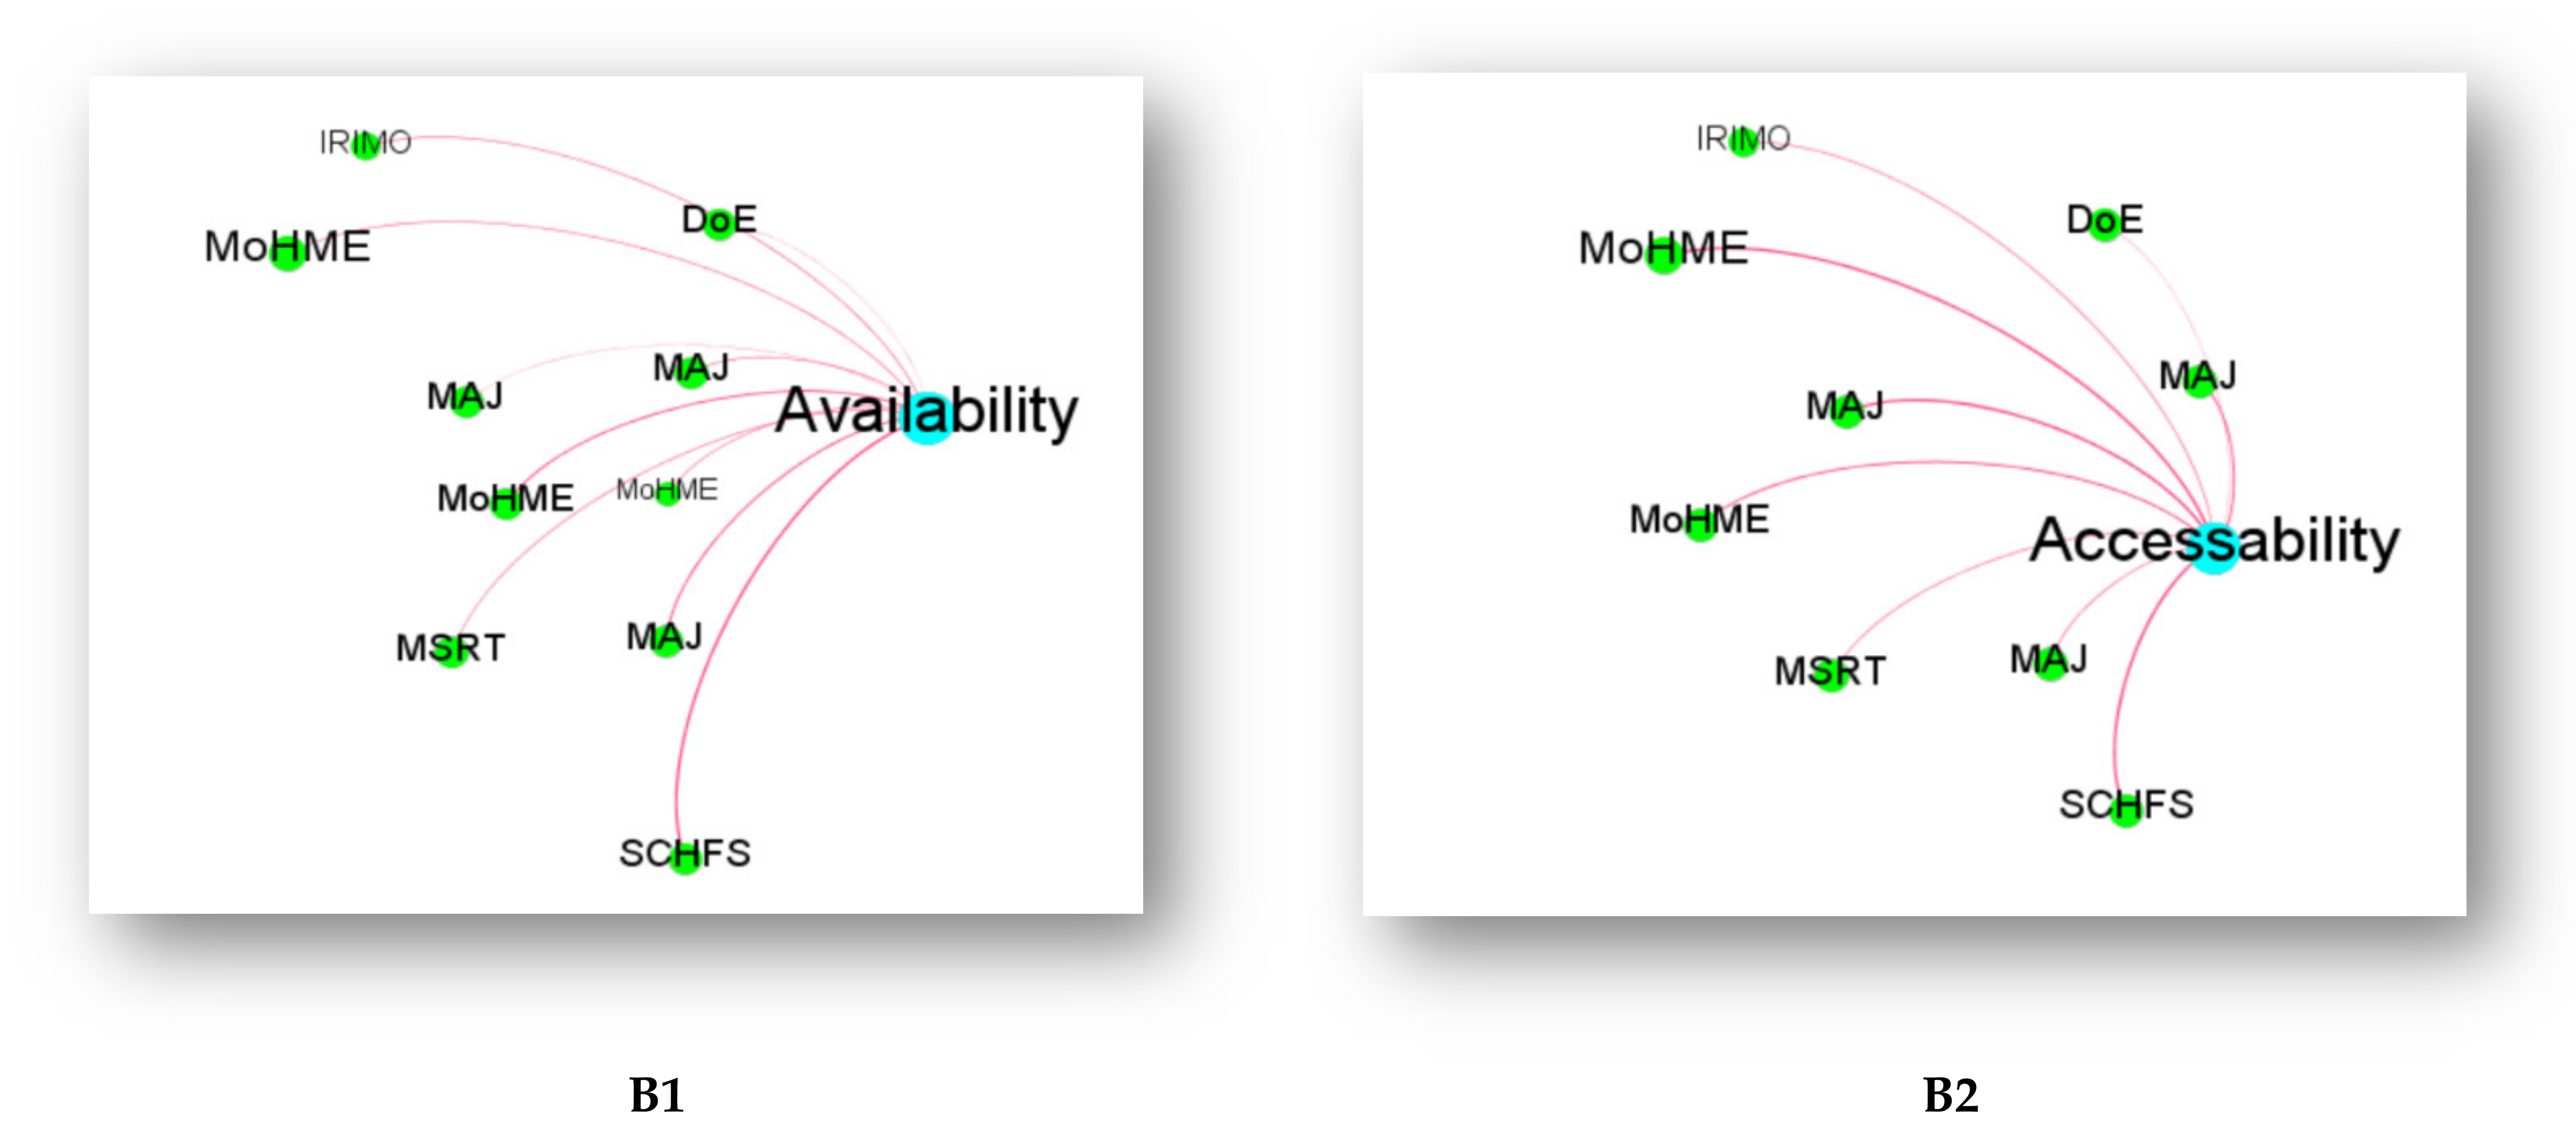
2.6. Social Network Analysis
| Institute (Actors) | Role of Institute (Actors) | ||
|---|---|---|---|
| Supportive | Cooperative | Responsible | |
| Ministry of Health and Medical Education (MoHME) | ✓ | ||
| Islamic Republic of Iran Meteorological Organization (IRIMO) | ✓ | ||
| Ministry of Science, Research and Technology (MSRT) | ✓ | ||
| Ministry of Agriculture Jihad (MAJ) | ✓ | ||
| Department of Environment (DoE) | ✓ | ||
| Supreme Council for Health and Food Security (SCHFS) | ✓ |
3. Results
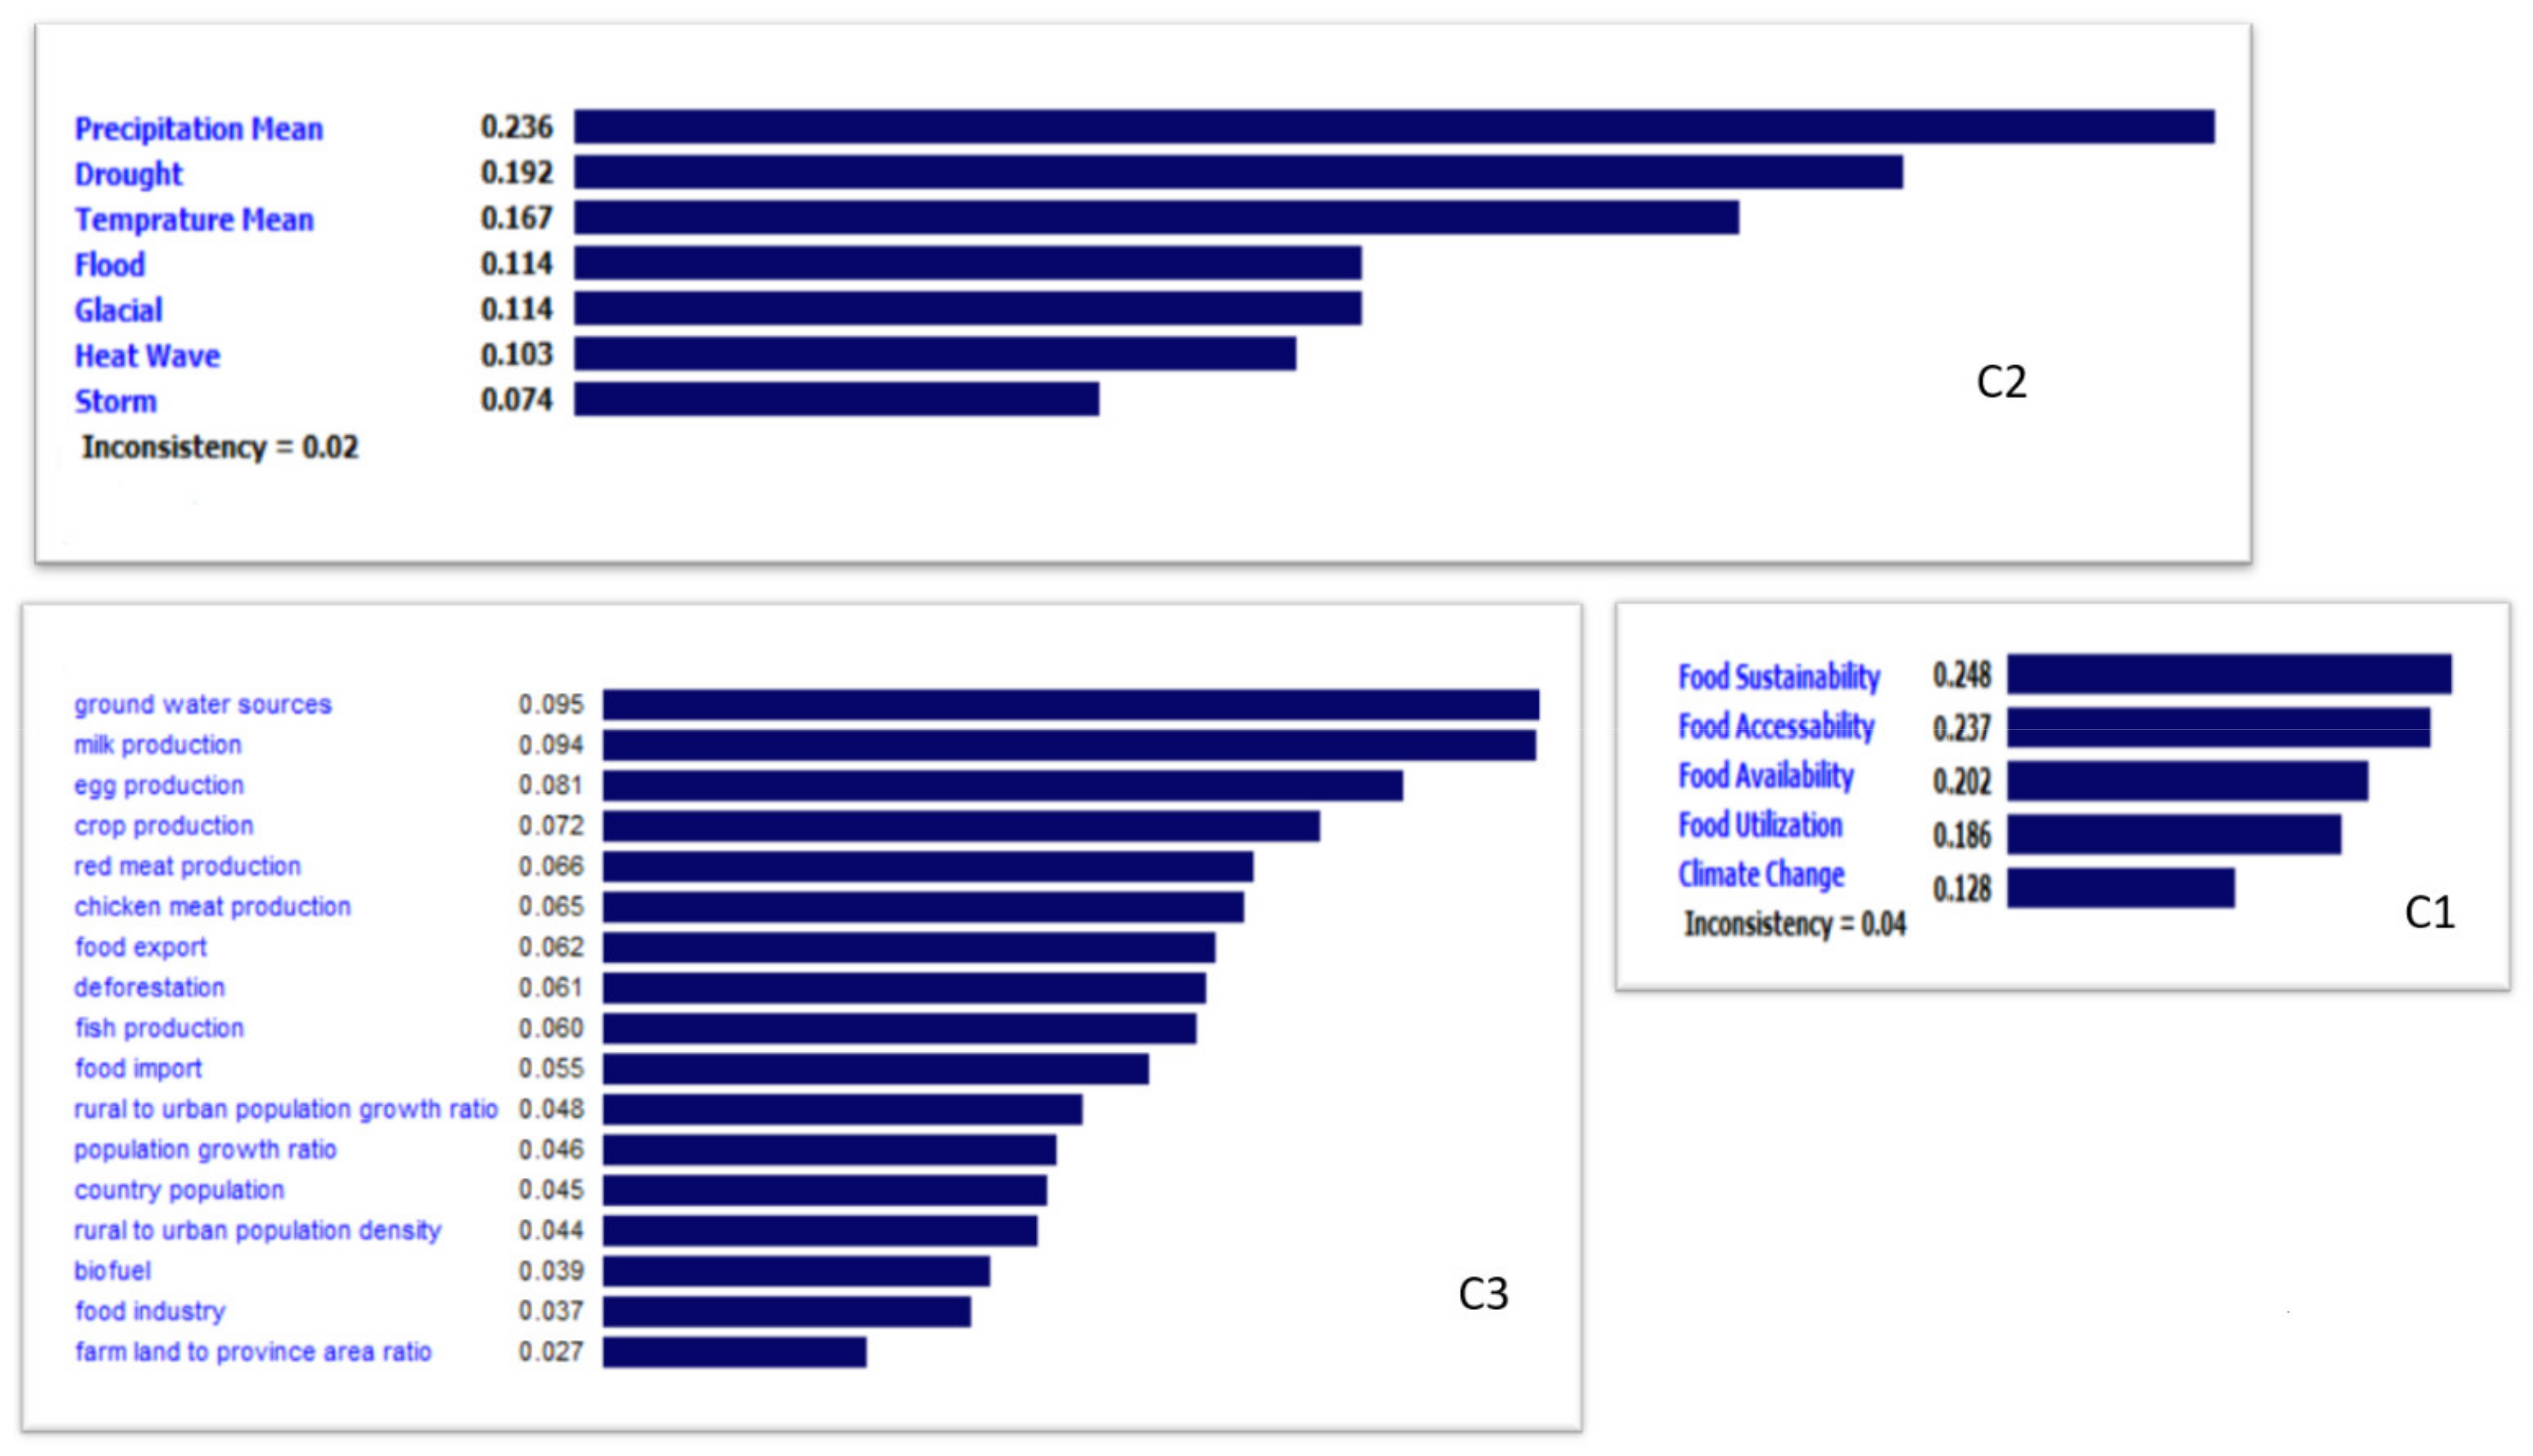
Relative Weights of Indicators
| Criteria | Definition/Source | Of Criteria and Sub-Criteria | Weight | Priority | Inconsistency |
| Food sustainability | [72] | 0.248 | 1 | ||
| Food accessibility | [72] | 0.237 | 2 | ||
| Food availability | [72] | 0.202 | 3 | 0.04 | |
| Food utilization | [72] | 0.186 | 4 | ||
| Climate change | [73] | 0.128 | 5 | ||
| Criteria | Sub-criteria | Definition/Source | Weight | Priority | Inconsistency |
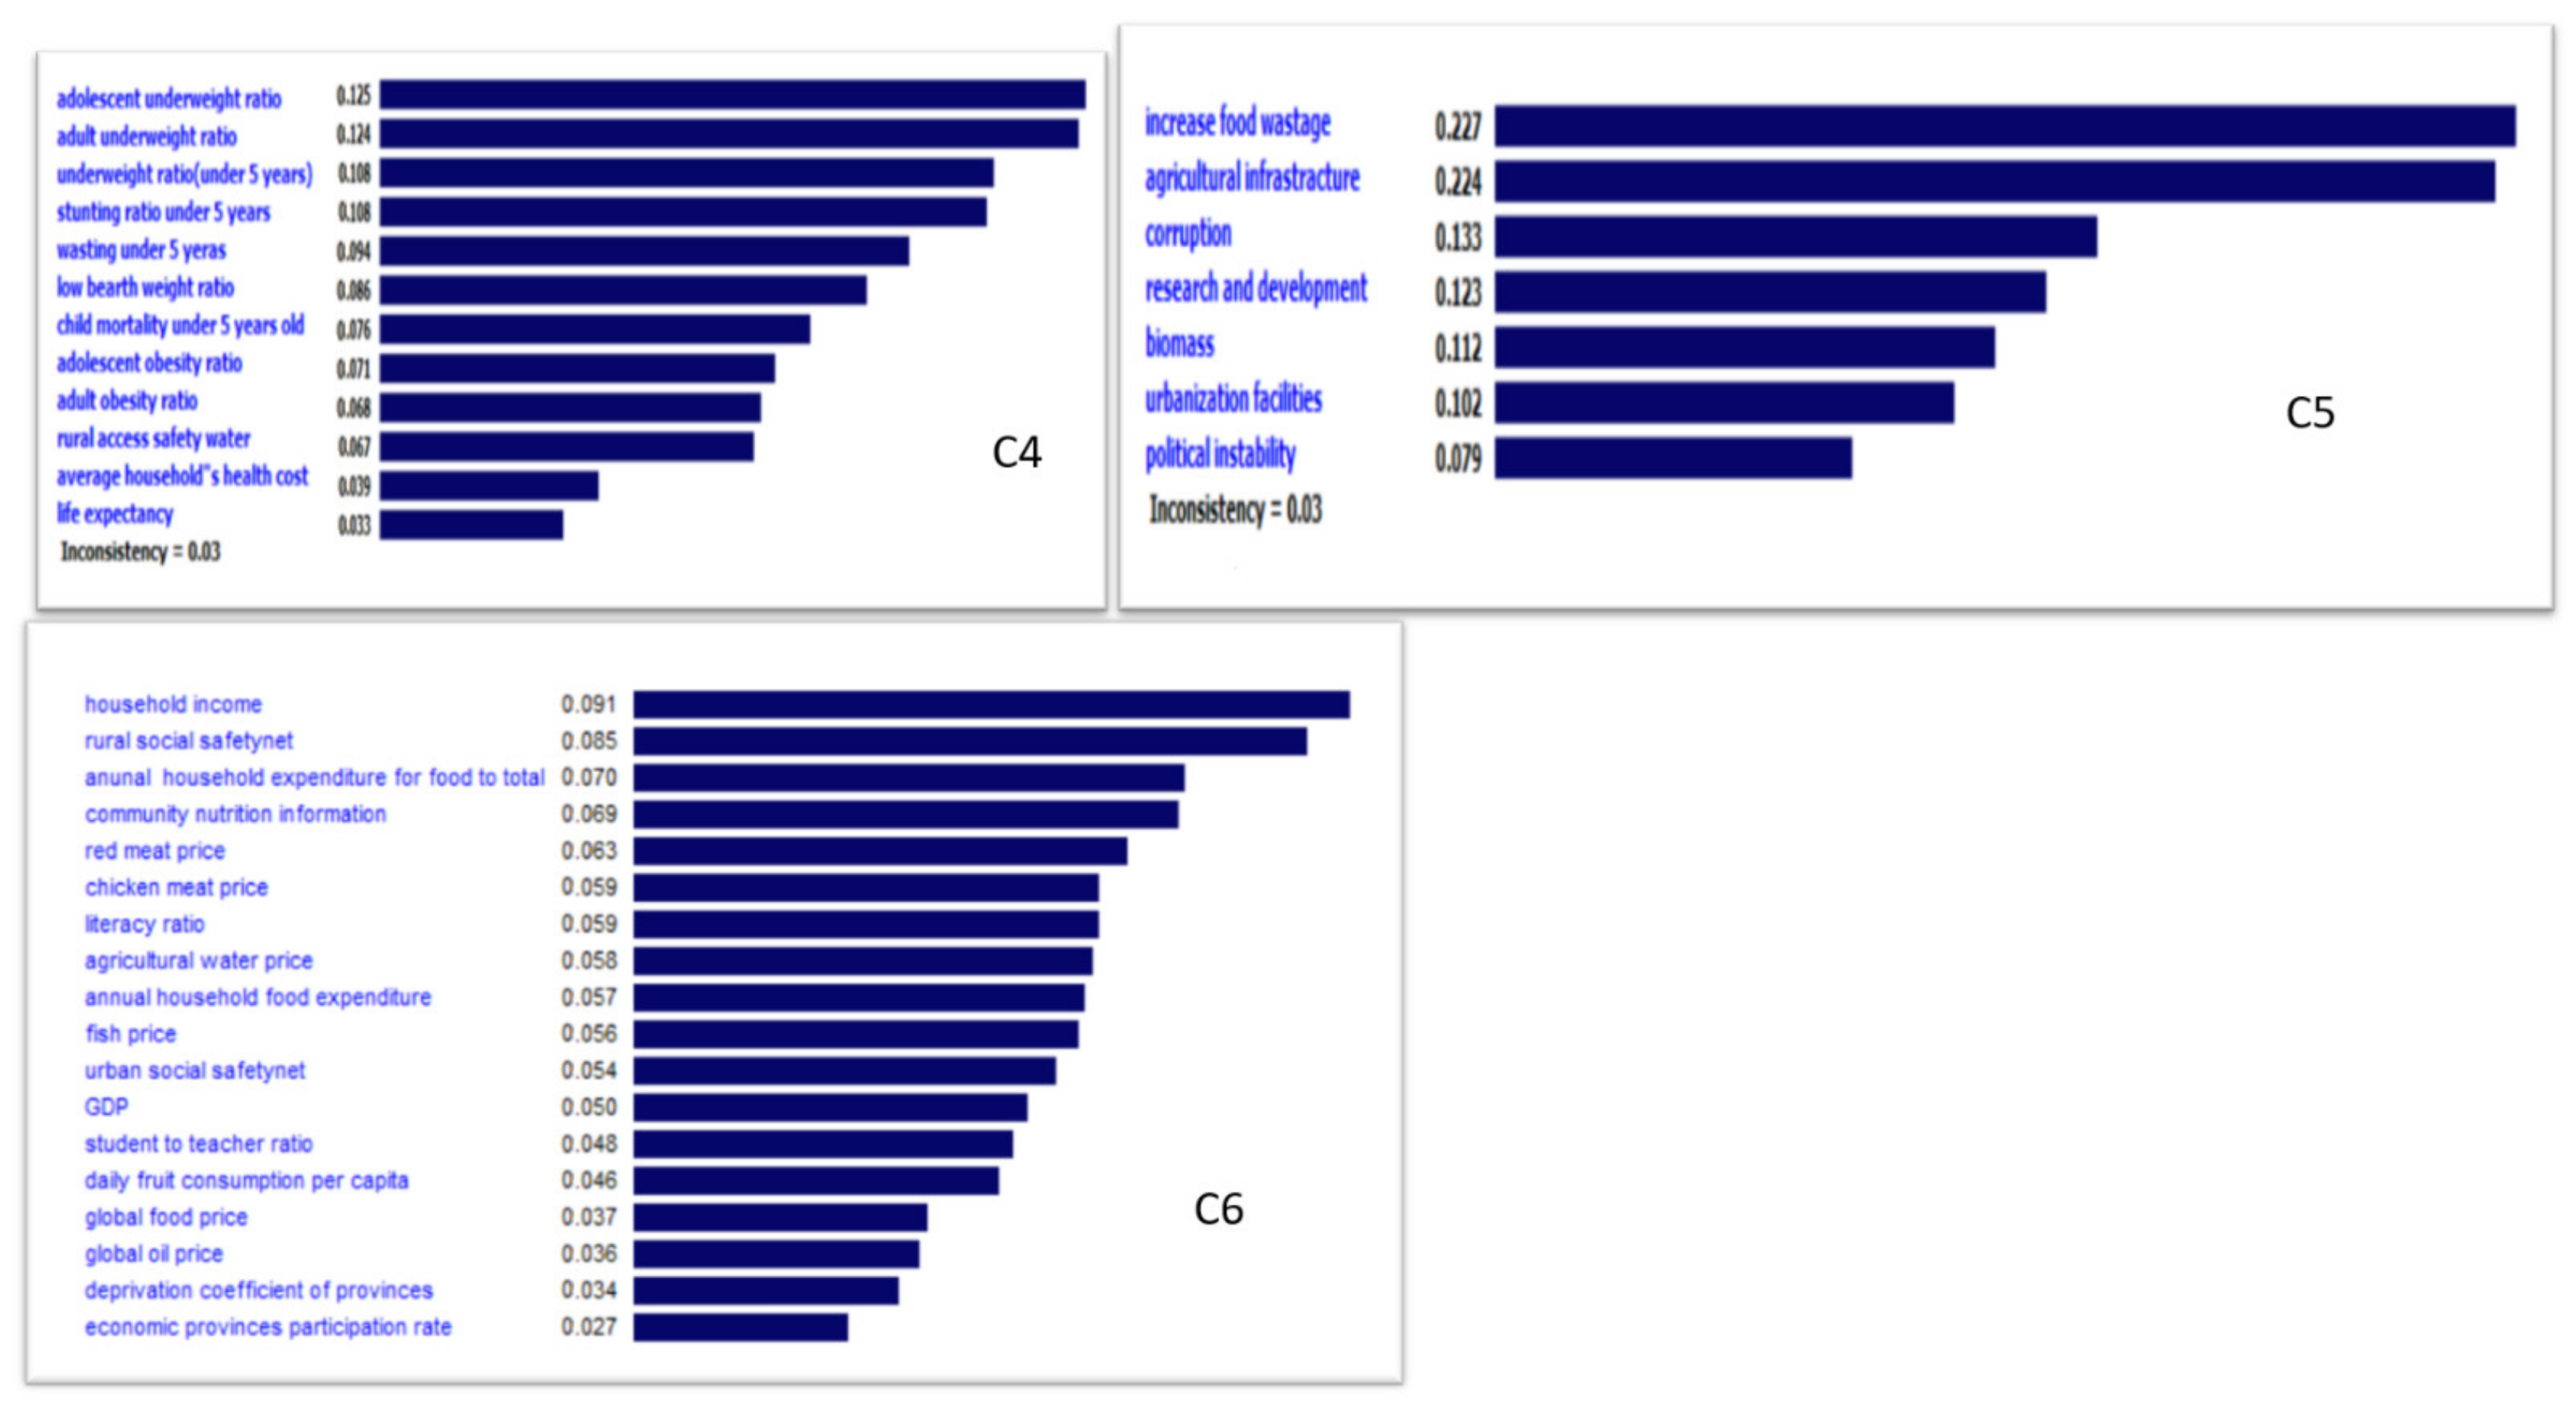
| Food wastage ratio | Percentage of national food waste in 12 months [73]. | 0.227 | 1 | ||
| Agricultural infrastructure | This is a composite indicator that measures the ability to store and transport crops to market [73]. | 0.224 | 2 | ||
| Corruption ratio | [74] | 0.133 | 3 | ||
| Food Sustainability | Agricultural research and development | [73] | 0.123 | 4 | 0.03 |
| Biomass | Percentage of plant-based material used as fuel to produce heat or electricity. | 0.112 | 5 | ||
| Urbanization facilities (urban absorption capacity) | This indicator measures the capacity of a country to absorb the stresses placed on it by urban growth and still ensure food security [73]. | 0.102 | 6 | ||
| Political instability | [74] | 0.079 | 7 | ||
| Household income | [72] | 0.091 | 1 | ||
| Rural social safety net | [72] | 0.085 | 2 | ||
| Annual household food expenditure over to total household expenditure ratio | [73] | 0.07 | 3 | ||
| Community nutrition information | Percentage of the knowledge of food and nutrition consumption that is monitored annually in Iran by the ministry of health. | 0.069 | 4 | ||
| Red meat price | Mean red meat price (national currency/Kg) a year. | 0.063 | 5 | ||
| Chicken meat price | Mean fish price (national currency/Kg) a year. | 0.059 | 6 | ||
| Literacy ratio | [73] | 0.059 | 7 | ||
| Agricultural water price | [73] | 0.058 | 8 | ||
| Food | Annual household food expenditure | [72] | 0.057 | 9 | Less than |
| Accessibility | Fish price | Mean fish price (national currency/Kg) in a year. | 0.056 | 10 | <0.1 |
| Urban social safety net | Presence of urban food safety-net programs [73]. | 0.054 | 11 | ||
| GDP | Gross domestic production. | 0.05 | 12 | ||
| Student/teacher ratio | The number of students over teachers number nationally. | 0.048 | 13 | ||
| Daily fruit consumption per capita | Percentage of daily fruit consumption per capita (national survey). | 0.046 | 14 | ||
| Global food price | [73] | 0.037 | 15 | ||
| Global oil price | USD for one barrel. Based on Organization of the Petroleum Exporting Countries (OPEC) | 0.036 | 16 | ||
| Deprivation coefficient of provinces | Estimated by the Gini coefficient [73]. | 0.034 | 17 | ||
| Economic participation rate of provinces (workforce) | The proportion of the older 10-years-old population over to total population of the country that works and makes money in each province according to the national statistic center of Iran [73]. | 0.027 | 18 | ||
| Criteria | Sub-criteria | Definition/Source | Weight | Priority | Inconsistency |
| Groundwater sources | [73] | 0.095 | 1 | ||
| Milk production | Average national milk production (tones/year). | 0.094 | 2 | ||
| Egg production | Average national egg production (tones/year). | 0.081 | 3 | ||
| Crop production | Average national crop production (tones/year). | 0.072 | 4 | ||
| Read meat production | Average national red meat production (tones/year). | 0.066 | 5 | ||
| Chicken meat production | Average national chicken meat production (tones/year). | 0.065 | 6 | ||
| Food export | [73] | 0.062 | 7 | ||
| Food | Deforestation | [73] | 0.061 | 8 | |
| Availability | Fish production | Average national fish production (tones/year). | 0.06 | 9 | Less than |
| Food import | [73] | 0.055 | 10 | <0.1 | |
| Rural–urban population ratio | Proportion of rural population over urban population in country. | 0.048 | 11 | ||
| Population growth rate | [73] | 0.046 | 12 | ||
| Country population | Total amount of population living in country + refugees and immigrants. | 0.045 | 13 | ||
| Rural–urban population density | [73] | 0.044 | 14 | ||
| Biofuel | Percentage of national biofuel production annually [72]. | 0.039 | 15 | ||
| Food industry | Total national industrial food production annually. Tones/year. | 0.037 | 16 | ||
| Farmland-to-province area ratio | Proportion of farmland over total land in country. | 0.027 | 17 | ||
| Adolescent’s underweight ratio | [72] | 0.125 | 1 | ||
| Adult underweight ratio | [72] | 0.124 | 2 | ||
| Underweight ratio (under 5 years old) | [72] | 0.108 | 3 | ||
| Stunting ratio (under 5 years old) | [72] | 0.108 | 4 | ||
| Wasting (under 5 years) | [72] | 0.094 | 5 | ||
| Low birth weight (under 2500 g) | [72] | 0.086 | 6 | 0.03 | |
| Food | Child mortality under 5 years | [72] | 0.076 | 7 | |
| Utilization | Adolescent obesity ratio | [72] | 0.071 | 8 | |
| Adult obesity ratio | [72] | 0.068 | 9 | ||
| Rural accessibility to safe drinking water | Access to potable water is the proportion of people using improved drinking water sources: household connection; public standpipe; borehole; protected dug well; protected spring; rainwater [73]. | 0.067 | 10 | ||
| Average household’s health costs | [73] | 0.039 | 11 | ||
| Life expectancy | [72] | 0.033 | 12 | ||
| Annual average precipitation | Mean precipitation during 12 months [73]. | 0.236 | 1 | ||
| Drought | [73] | 0.192 | 2 | ||
| climate | Annual average temperature | Mean temperature during 12 months [73]. | 0.167 | 3 | |
| change | Flood | [73] | 0.114 | 4 | 0.02 |
| Glacial | [73] | 0.114 | 5 | ||
| Heatwave | [73] | 0.103 | 6 | ||
| Storm | [73] | 0.074 | 7 |
4. Discussion
Social Network Analysis (SNA)
5. Limitation
6. Conclusions
7. Suggestions for Future Research
- Applying the same questionnaire in other countries with different political, social and economic contexts to understand the most essential national indices contributing to their food security under climate change.
- Reviewing and revising the food security indices, especially under extreme weather events, to develop an AHP questionnaire at the provincial level in Iran.
- Developing such studies in other countries to explore methods like the SNA with aims to improve the validity of indices’ weights.
- These indicator weights might be helpful in models that were conducted to predict the risk of food security under extreme weather event uncertainty in the national context.
Supplementary Materials
Author Contributions
Funding
Institutional Review Board Statement
Informed Consent Statement
Data Availability Statement
Acknowledgments
Conflicts of Interest
References
- FSIN. 2021 Global Report on Food Crises; WFP: Rome, Italy, 2021. [Google Scholar]
- WHO. The State of Food Security and Nutrition in the World 2018: Building Climate Resilience for Food Security and Nutrition; FAO: Rome, Italy, 2018. [Google Scholar]
- WHO. The State of Food Security and Nutrition in the World 2020: Transforming Food Systems for Affordable Healthy Diets; FAO: Rome, Italy, 2020. [Google Scholar]
- Molotoks, A.; Smith, P.; Dawson, T.P. Impacts of land use, population, and climate change on global food security. Food Energy Secur. 2021, 10, e261. [Google Scholar] [CrossRef]
- Meybeck, A.; Lankoski, J.; Redfern, S.; Azzu, N.; Gitz, V. (Eds.) Building resilience for adaptation to climate change in the agriculture sector. In Proceedings of the Joint FAO/OECD Workshop, Rome, Italy, 23–24 April 2012. [Google Scholar]
- Hasegawa, T.; Sakurai, G.; Fujimori, S.; Takahashi, K.; Hijioka, Y.; Masui, T. Extreme climate events increase risk of global food insecurity and adaptation needs. Nat. Food 2021, 2, 587–595. [Google Scholar] [CrossRef]
- Zhao, C.; Liu, B.; Piao, S.; Wang, X.; Lobell, D.B.; Huang, Y.; Huang, M.T.; Yao, Y.T.; Bassu, S.; Ciais, P.; et al. Temperature increase reduces global yields of major crops in four independent estimates. Proc. Natl. Acad. Sci. USA 2017, 114, 9326–9331. [Google Scholar] [CrossRef] [PubMed] [Green Version]
- Mosadeghi, R.; Warnken, J.; Tomlinson, R.; Mirfenderesk, H. Comparison of Fuzzy-AHP and AHP in a spatial multi-criteria decision making model for urban land-use planning. Comput. Environ. Urban Syst. 2015, 49, 54–65. [Google Scholar] [CrossRef] [Green Version]
- Ullah, S. Climate change impact on agriculture of Pakistan-A leading agent to food security. Int. J. Environ. Sci. Nat. Resour. 2017, 6, 76–79. [Google Scholar]
- Saxena, R.; Vanga, S.K.; Wang, J.; Orsat, V.; Raghavan, V. Millets for Food Security in the Context of Climate Change: A Review. Sustainability 2018, 10, 2228. [Google Scholar] [CrossRef] [Green Version]
- Haque, M.I.; Khan, M.R. Impact of climate change on food security in Saudi Arabia: A roadmap to agriculture-water sustainability. J. Agribus. Dev. Emerg. Econ. 2020, 12, 1–18. [Google Scholar] [CrossRef]
- Fujimori, S.; Hasegawa, T.; Krey, V.; Riahi, K.; Bertram, C.; Bodirsky, B.L.; Bosetti, V.; Callen, J.; Després, J.; Doelman, J.; et al. A multi-model assessment of food security implications of climate change mitigation. Nat. Sustain. 2019, 2, 386–396. [Google Scholar] [CrossRef] [Green Version]
- Schnitter, R.; Berry, P. The climate change, food security and human health nexus in Canada: A framework to protect population health. Int. J. Environ. Res. Public Health 2019, 16, 2531. [Google Scholar] [CrossRef] [Green Version]
- John, C.A.; Tan, L.S.; Tan, J.; Kiew, P.L.; Shariff, A.M.; Halim, H.N.A. Selection of Renewable Energy in Rural Area Via Life Cycle Assessment-Analytical Hierarchy Process (LCA-AHP): A Case Study of Tatau, Sarawak. Sustainability 2021, 13, 11880. [Google Scholar] [CrossRef]
- Nguyen, T.D.L.; Bleys, B. Applying Analytic Hierarchy Process to Adaptation to Saltwater Intrusion in Vietnam. Sustainability 2021, 13, 2311. [Google Scholar] [CrossRef]
- Yang, X.-L.; Ding, J.-H.; Hou, H. Application of a triangular fuzzy AHP approach for flood risk evaluation and response measures analysis. Nat. Hazards 2013, 68, 657–674. [Google Scholar] [CrossRef]
- Shin, J.Y.; Park, Y.J.; Kim, T.-W. Evaluation of Inland Inundation Risk in Urban Area using Fuzzy AHP. J. Korea Water Resour. Assoc. 2014, 47, 789–799. [Google Scholar] [CrossRef] [Green Version]
- Park, Y.; Lee, S.; Lee, J. Comparison of Fuzzy AHP and AHP in Multicriteria Inventory Classification While Planning Green Infrastructure for Resilient Stream Ecosystems. Sustainability 2020, 12, 9035. [Google Scholar] [CrossRef]
- Aldababseh, A.; Temimi, M.; Maghelal, P.; Branch, O.; Wulfmeyer, V. Multi-Criteria Evaluation of Irrigated Agriculture Suitability to Achieve Food Security in an Arid Environment. Sustainability 2018, 10, 803. [Google Scholar] [CrossRef] [Green Version]
- Bolaños, T.G.; Costa, M.M.; Nehren, U. Development of a Prioritization Tool for Climate Change Adaptation Measures in the Forestry Sector—A Nicaraguan Case Study. In Economic Tools and Methods for the Analysis of Global Change Impacts on Agriculture and Food Security; Springer: Cham, Switzerland, 2018; pp. 165–177. [Google Scholar] [CrossRef] [Green Version]
- Lim, H.; Kim, S.; Kim, Y.; Son, S. Relative Importance Analysis of Safety Climate Evaluation Factors Using Analytical Hierarchical Process (AHP). Sustainability 2021, 13, 4212. [Google Scholar] [CrossRef]
- Al-Zu’bi, Y.A. Application of Analytical Hierarchy Process for the Evaluation of Climate Change Impact on Ecohydrology: The Case of Azraq Basin in Jordan. J. Appl. Sci. 2008, 9, 135–141. [Google Scholar] [CrossRef] [Green Version]
- Sousa, A.R.; Parra-López, C.; Sayadi-Gmada, S.; Barandica, J.; Rescia, A. A multifunctional assessment of integrated and ecological farming in olive agroecosystems in southwestern Spain using the Analytic Hierarchy Process. Ecol. Econ. 2020, 173, 106658. [Google Scholar] [CrossRef]
- Pradhan, A.; Chan, C.; Roul, P.K.; Halbrendt, J.; Sipes, B. Potential of conservation agriculture (CA) for climate change adaptation and food security under rainfed uplands of India: A transdisciplinary approach. Agric. Syst. 2018, 163, 27–35. [Google Scholar] [CrossRef]
- Ocampo, L.A. Applying fuzzy AHP–TOPSIS technique in identifying the content strategy of sustainable manufacturing for food production. Environ. Dev. Sustain. 2019, 21, 2225–2251. [Google Scholar] [CrossRef]
- Di Gregorio, M.; Fatorelli, L.; Paavola, J.; Locatelli, B.; Pramova, E.; Nurrochmat, D.R.; May, P.H.; Brockhaus, M.; Sari, I.M.; Kusumadewi, S.D. Multi-level governance and power in climate change policy networks. Glob. Environ. Chang. 2019, 54, 64–77. [Google Scholar] [CrossRef]
- Faust, V.; Christens, B.; Sparks, S.M.; Hilgendorf, A.E. Exploring relationships among organizational capacity, collaboration, and network change. Psychosoc. Interv. 2015, 24, 125–131. [Google Scholar] [CrossRef] [Green Version]
- Feitelson, E.; Tubi, A. A main driver or an intermediate variable? Climate change, water and security in the Middle East. Glob. Environ. Chang. 2017, 44, 39–48. [Google Scholar] [CrossRef]
- Bucchignani, E.; Mercogliano, P.; Panitz, H.-J.; Montesarchio, M. Climate change projections for the Middle East–North Africa domain with COSMO-CLM at different spatial resolutions. Adv. Clim. Chang. Res. 2018, 9, 66–80. [Google Scholar] [CrossRef]
- The National Climate Change Office of Iran. Third National Communication to UNFCCC; National Climate Change Office of Iran: Tehran, Iran, 2014. [Google Scholar]
- Soltani, M.; Laux, P.; Kunstmann, H.; Stan, K.; Sohrabi, M.M.; Molanejad, M.; Sabziparvar, A.A.; SaadatAbadi, A.R.; Ranjbar, F.; Rousta, I.; et al. Assessment of climate variations in temperature and precipitation extreme events over Iran. Theor. Appl. Climatol. 2015, 126, 775–795. [Google Scholar] [CrossRef] [Green Version]
- Ashraf, S.; Nazemi, A.; AghaKouchak, A. Anthropogenic drought dominates groundwater depletion in Iran. Sci. Rep. 2021, 11, 9135. [Google Scholar] [CrossRef]
- Mirzaei, A.; Saghafian, B.; Mirchi, A.; Madani, K. The groundwater-energy-food nexus in Iran’s agricultural sector: Implications for water security. Water 2019, 11, 1835. [Google Scholar] [CrossRef] [Green Version]
- Jafary, F.; Bradley, C. Groundwater Irrigation Management and the Existing Challenges from the Farmers’ Perspective in Central Iran. Land 2018, 7, 15. [Google Scholar] [CrossRef] [Green Version]
- Vaghefi, S.A.; Keykhai, M.; Jahanbakhshi, F.; Sheikholeslami, J.; Ahmadi, A.; Yang, H.; Abbaspour, K.C. The future of extreme climate in Iran. Sci. Rep. 2019, 9, 1464. [Google Scholar] [CrossRef] [Green Version]
- Manesh, M.B.; Khosravi, H.; Alamdarloo, E.H.; Alekasir, M.S.; Gholami, A.; Singh, V.P. Linkage of agricultural drought with meteorological drought in different climates of Iran. Theor. Appl. Climatol. 2019, 138, 1025–1033. [Google Scholar] [CrossRef]
- Yadollahie, M. The flood in Iran: A consequence of the global warming? Int. J. Occup. Environ. Med. 2019, 10, 54. [Google Scholar] [CrossRef] [Green Version]
- Alizadeh-Choobari, O.; Najafi, M.S. Extreme weather events in Iran under a changing climate. Clim. Dyn. 2017, 50, 249–260. [Google Scholar] [CrossRef]
- Ardakani, Z.; Bartolini, F.; Brunori, G. Food and nutrition security in Iran: Application of TOPSIS technique. New Medit. 2017, 16, 11–17. [Google Scholar]
- Abolhassani, M.H.; Kolahdooz, F.; Majdzadeh, R.; Eshraghian, M.; Mirkazemi, R.; Djazayery, A. Prioritizing Food Security Indicators in Iran: Application of an Integrated Delphi/AHP Approach. Iran. Red Crescent Med. J. 2016, 20, e23585. [Google Scholar] [CrossRef]
- Bakhshi, M.; Mollaei, Z.; Farajisabokbar, H.; Badri, A.; Pakdel, F. Status of food security in CIRDAPs: An integrated approach of AHP and PROMETHEE. PERSIAN 2011, 19, 21–45. [Google Scholar]
- Zarei, S.; Bozorg-Haddad, O.; Singh, V.P.; Loáiciga, H.A. Developing water, energy, and food sustainability performance indicators for agricultural systems. Sci. Rep. 2021, 11, 22831. [Google Scholar] [CrossRef]
- Mousavi, A.; Ardalan, A.; Takian, A.; Ostadtaghizadeh, A.; Naddafi, K.; Bavani, A.M. Climate change and health in Iran: A narrative review. J. Environ. Health Sci. Eng. 2020, 18, 367–378. [Google Scholar] [CrossRef] [PubMed]
- Karandish, F.; Hoekstra, A.Y. Informing National Food and Water Security Policy through Water Footprint Assessment: The Case of Iran. Water 2017, 9, 831. [Google Scholar] [CrossRef] [Green Version]
- Daneshvar, M.R.M.; Ebrahimi, M.; Nejadsoleymani, H. An overview of climate change in Iran: Facts and statistics. Environ. Syst. Res. 2019, 8, 7. [Google Scholar] [CrossRef] [Green Version]
- Ministry of Energy. Sixth Five-Year Development Plan (2016–2021) Sets Out Socio-Economic Development Direction of Iran for 2016–2021; Tehran Rozname Rasmi Keshvar: Tehran, Iran, 2017.
- Gompf, K.; Traverso, M.; Hetterich, J. Using Analytical Hierarchy Process (AHP) to Introduce Weights to Social Life Cycle Assessment of Mobility Services. Sustainability 2021, 13, 1258. [Google Scholar] [CrossRef]
- Linh, V.T.; Dung, H.M.; Loi, N.K. Climate change vulnerability indicators for agriculture in Ho Chi Minh city. Vietnam J. Sci. Technol. Eng. 2020, 62, 90–96. [Google Scholar] [CrossRef] [Green Version]
- Armah, F.A.; Odoi, J.O.; Yengoh, G.T.; Obiri, S.; Yawson, D.O.; Afrifa, E.K. Food security and climate change in drought-sensitive savanna zones of Ghana. Mitig. Adapt. Strateg. Glob. Chang. 2011, 16, 291–306. [Google Scholar] [CrossRef]
- Kiker, G.A.; Bridges, T.S.; Varghese, A.; Seager, P.T.P.; Linkov, I. Application of Multicriteria Decision Analysis in Environmental Decision Making. Integr. Environ. Assess. Manag. 2005, 1, 95–108. [Google Scholar] [CrossRef] [PubMed]
- Wheeler, T.; Von Braun, J. Climate Change Impacts on Global Food Security. Science 2013, 341, 508–513. [Google Scholar] [CrossRef]
- Ericksen, P.J.; Ingram, J.S.I.; Liverman, D.M. Food security and global environmental change: Emerging challenges. Environ. Sci. Policy 2009, 12, 373–377. [Google Scholar] [CrossRef]
- Penadés-Plà, V.; García-Segura, T.; Martí, J.V.; Yepes, V. A review of multi-criteria decision-making methods applied to the sustainable bridge design. Sustainability 2016, 8, 1295. [Google Scholar] [CrossRef] [Green Version]
- Belton, V.; Stewart, T. Multiple Criteria Decision Analysis: An Integrated Approach; Springer Science & Business Media: Berlin, Germany, 2002. [Google Scholar]
- Velasquez, M.; Hester, P.T. An analysis of multi-criteria decision-making methods. Int. J. Oper. Res. 2013, 10, 56–66. [Google Scholar]
- Vinogradova, I. Multi-Attribute Decision-Making Methods as a Part of Mathematical Optimization. Mathematics 2019, 7, 915. [Google Scholar] [CrossRef] [Green Version]
- Darban, S.; Tehrani, H.G.; Karballaeezadeh, N.; Mosavi, A. Application of Analytical Hierarchy Process for Structural Health Monitoring and Prioritizing Concrete Bridges in Iran. Appl. Sci. 2021, 11, 8060. [Google Scholar] [CrossRef]
- Lin, T.-H.; Shih, S.-G. Prioritization of Factors Affecting Sustainability Property Improvement by Using Analytical Hierarchy Process and Important-Satisfaction Model: The Case of TAIPEI 101 Tower. Appl. Sci. 2020, 11, 257. [Google Scholar] [CrossRef]
- Saaty, T.L. Exploring the interface between hierarchies, multiple objectives and fuzzy sets. Fuzzy Sets Syst. 1978, 1, 57–68. [Google Scholar] [CrossRef]
- Saaty Thomas, L. The Analytic Hierarchy Process; McGraw-Hill: New York, NY, USA, 1980. [Google Scholar]
- Szabo, Z.K.; Szádoczki, Z.; Bozóki, S.; Stănciulescu, G.C.; Szabo, D. An Analytic Hierarchy Process Approach for Prioritisation of Strategic Objectives of Sustainable Development. Sustainability 2021, 13, 2254. [Google Scholar] [CrossRef]
- Saaty, T.L.; Vargas, L.G. Decision Making with the Analytic Network Process; Springer: Berlin, Germany, 2006. [Google Scholar]
- Sipahi, S.; Timor, M. The analytic hierarchy process and analytic network process: An overview of applications. Manag. Decis. 2010, 48, 775–808. [Google Scholar] [CrossRef]
- Saaty, T.L. Fundamentals of the analytic network process—Dependence and feedback in decision-making with a single network. J. Syst. Sci. Syst. Eng. 2004, 13, 129–157. [Google Scholar] [CrossRef]
- Chen, Y.; Jin, Q.; Fang, H.; Lei, H.; Hu, J.; Wu, Y.; Chen, J.; Wang, C.; Wan, Y. Analytic network process: Academic insights and perspectives analysis. J. Clean Prod. 2019, 235, 1276–1294. [Google Scholar] [CrossRef]
- Corlew, L.K.; Keener, V.; Finucane, M.; Brewington, L.; Nunn-Crichton, R. Using social network analysis to assess communications and develop networking tools among climate change professionals across the Pacific Islands region. Psychosoc. Interv. 2015, 24, 133–146. [Google Scholar] [CrossRef] [Green Version]
- Prota, L.; Cucco, I.; Cistulli, V. Social Network Analysis for Territorial Assessment and Mapping of Food Security and Nutrition Systems (FSNS). In A Methodological Approach; FAO: Rome, Italy, 2018. [Google Scholar]
- Karali, E.; Bojovic, D.; Michalek, G.; Giupponi, C.; Schwarze, R. Who is connected with whom? A social network analysis of in-stitutional interactions in the european CCA and DRR landscape. Sustainability 2020, 12, 1275. [Google Scholar]
- Hegland, S.J. FAO-IPCC Expert Meeting on Climate Change, Land Use and Food Security; Final Meeting Report; IPCC: Geneva, Switzerland, 25 January 2017. [Google Scholar]
- Skibniewski, M.J.; Chao, L. Evaluation of Advanced Construction Technology with AHP Method. J. Constr. Eng. Manag. 1992, 118, 577–593. [Google Scholar] [CrossRef]
- Fong, P.S.-W.; Choi, S.K.-Y. Final contractor selection using the analytical hierarchy process. Constr. Manag. Econ. 2000, 18, 547–557. [Google Scholar] [CrossRef]
- Pangaribowo, E.H.; Gerber, N.; Torero, M. Food and nutrition security indicators: A review. SSRN Electron. J. 2013. [Google Scholar] [CrossRef] [Green Version]
- EIU. Global Food Security Index 2019: Strengthening Food Systems and the Environment through Innovation and Investment; EIU: London, UK, 2019. [Google Scholar]
- EIU. Global Food Security Index 2016: An Annual Measure of the State of Global Food Security; EIU: London, UK, 2016. [Google Scholar]
- Kolahdouz, F.N.F.; Sadeghi, F. National System for Monitoring Food Security and Nutrition Situation in Iran and Development of the First Map of Food Security in the Country; Department of Community Nutrition, Ministry of Health and Medical Education: Tehran, Iran, 2012. [Google Scholar]
- FAO. The Impact of Disasters and Crises on Agriculture and Food Security; FAO: Rome, Italy, 2018. [Google Scholar]
- Raziei, T.; Daryabari, J.; Bordi, I.; Pereira, L.S. Spatial patterns and temporal trends of precipitation in Iran. Theor. Appl. Climatol. 2013, 115, 531–540. [Google Scholar] [CrossRef]
- Cheng, J.; Tao, J.-P. Fuzzy comprehensive evaluation of drought vulnerability based on the analytic hierarchy process: —An empirical study from Xiaogan City in Hubei Province. Agric. Agric. Sci. Procedia 2010, 1, 126–135. [Google Scholar]
- Li, X.; Liu, C.; Wang, G.; Bao, Z.; Diao, Y.; Liu, J. Evaluating the Collaborative Security of Water–Energy–Food in China on the Basis of Symbiotic System Theory. Water 2021, 13, 1112. [Google Scholar] [CrossRef]
- Berjan, S.; Capone, R.; Debs, P.; El Bilali, H. Food losses and waste: A global overview with a focus on Near East and North Africa region. Int. J. Agric. Manag. Dev. 2018, 8, 1–16. [Google Scholar]
- FAO. Global Initiative on Food Losses and Waste Reduction; FAO: Rome, Italy, 2013. [Google Scholar]
- Fami, H.S.; Aramyan, L.H.; Sijtsema, S.J.; Alambaigi, A. Determinants of household food waste behavior in Tehran city: A structural model. Resour. Conserv. Recycl. 2019, 143, 154–166. [Google Scholar] [CrossRef]
- Tesfaye, A.; Hansen, J.; Radeny, M.; Belay, S.; Solomon, D. Actor roles and networks in agricultural climate services in Ethiopia: A social network analysis. Clim. Dev. 2019, 12, 769–780. [Google Scholar] [CrossRef]

| Criteria A | 9 | 7 | 5 | 3 | 1 | 3 | 5 | 7 | 9 | Criteria B |
|---|---|---|---|---|---|---|---|---|---|---|
| Climate change | 9 | 7 | 5 | 3 | 1 | 3 | 5 | 7 | 9 | Food availability |
| Person | Workplace | Education Level | Work Experience (Year) | Sex | Role of Institute (Actors) |
|---|---|---|---|---|---|
| P1 | MoHME | PhD | 10 | M | Supportive |
| P2 | IRIMO | PhD | 29 | M | Responsible |
| P3 | MSRT | PhD | 7 | M | Cooperative |
| P4 | MoHME | MSc | 25 | M | Supportive |
| P5 | MAJ | MSc | 15 | M | Responsible |
| P6 | MoHME | PhD | 30 | M | Supportive |
| P7 | DoE | MSc | 12 | F | Cooperative |
| P8 | MAJ | PhD | 23 | M | Responsible |
| P9 | MAJ | PhD | 18 | M | Responsible |
| P10 | DoE | PhD | 29 | M | Cooperative |
| P11 | SCHFS | MSc | 28 | F | Supportive |
Publisher’s Note: MDPI stays neutral with regard to jurisdictional claims in published maps and institutional affiliations. |
© 2022 by the authors. Licensee MDPI, Basel, Switzerland. This article is an open access article distributed under the terms and conditions of the Creative Commons Attribution (CC BY) license (https://creativecommons.org/licenses/by/4.0/).
Share and Cite
Allipour Birgani, R.; Takian, A.; Djazayery, A.; Kianirad, A.; Pouraram, H. Climate Change and Food Security Prioritizing Indices: Applying Analytical Hierarchy Process (AHP) and Social Network Analysis (SNA). Sustainability 2022, 14, 8494. https://doi.org/10.3390/su14148494
Allipour Birgani R, Takian A, Djazayery A, Kianirad A, Pouraram H. Climate Change and Food Security Prioritizing Indices: Applying Analytical Hierarchy Process (AHP) and Social Network Analysis (SNA). Sustainability. 2022; 14(14):8494. https://doi.org/10.3390/su14148494
Chicago/Turabian StyleAllipour Birgani, Ramesh, Amirhossein Takian, Abolghasem Djazayery, Ali Kianirad, and Hamed Pouraram. 2022. "Climate Change and Food Security Prioritizing Indices: Applying Analytical Hierarchy Process (AHP) and Social Network Analysis (SNA)" Sustainability 14, no. 14: 8494. https://doi.org/10.3390/su14148494
APA StyleAllipour Birgani, R., Takian, A., Djazayery, A., Kianirad, A., & Pouraram, H. (2022). Climate Change and Food Security Prioritizing Indices: Applying Analytical Hierarchy Process (AHP) and Social Network Analysis (SNA). Sustainability, 14(14), 8494. https://doi.org/10.3390/su14148494