Article

Experimental Investigation of Wind Loads on Roof-Mounted Solar Arrays

1
Institute of Civil Engineering Disaster Prevention and Mitigation, College of Civil Engineering and Architecture, Zhejiang University of Water Resources and Electric Power, Hangzhou 310018, China
2
Department of New Energy Development and Construction, China Energy Engineering Group Zhejiang Electric Power Design Institute Co., Ltd., Hangzhou 310012, China
3
College of Civil Engineering and Architecture, Zhejiang University, Hangzhou 310058, China
*
Author to whom correspondence should be addressed.
Sustainability 2022, 14(14), 8477; https://doi.org/10.3390/su14148477
Submission received: 31 May 2022 / Revised: 6 July 2022 / Accepted: 7 July 2022 / Published: 11 July 2022
(This article belongs to the Section Sustainable Engineering and Science)

Abstract

:
An experimental study was conducted to investigate the aerodynamic loads on roof-mounted solar arrays. Four different parapet heights of 0 m, 0.9 m, 1.2 m, 1.5 m, and two tilt angles of 5° and 10°, are set to examine their effects on wind pressure coefficients. The statistics (means, standard deviations, skewness, kurtosis, maximum and minimum peaks) of wind pressure coefficients in different wind directions are exhibited and discussed in the current study. The results show that the oblique wind directions are critical for most measured locations, as the extreme of maximum and minimum peak pressure coefficients occur. The parapet can decrease wind loads on solar arrays, as expected. However, as the parapet is within a limited height in practice, it is not quite efficient to decrease wind loads despite the increasing of the parapet height. When the solar arrays are installed on the roof almost horizontally (tilt angle is less than 10°), the statistics of the aerodynamic load change a little with the decreasing of the tilt angle.

1. Introduction

Solar arrays are becoming increasingly popular on the roofs of industrial low-rise buildings due to the advantages of producing electric power close to energy consumers and no additional land being required [1]. As a typical wind-sensitive structure, determining aerodynamic loads acting on such arrays is one of the significant issues in the structure design practice [2,3].
Hence, there have been many proprietary studies concerned about the wind loads on roof-mounted arrays. Kopp et al. [4] investigated the aerodynamic mechanisms for wind loads on tilted, roof-mounted solar arrays, distinguishing the main mechanism as two parts: turbulence generated by the panel, which increases the wind loads for higher tilt angles, and pressure equalization, which dominates for lower tilt angles. To better understand the flow structure and aerodynamic mechanisms causing the peak wind loads, Pratt and Kopp [5] investigated the wind field around roof-mounted arrays utilizing synchronized time-resolved particle image velocimetry and pressure measurements. Then, some suggestions about obtaining design wind loads on roof-mounted solar arrays by wind tunnel test were made [3]. Warsido et al. [6] investigated the effect of the array perimeter gap from the building edge on the roof-mounted arrays, and they found that the wind load coefficients on the arrays decreased with the increasing perimeter gap. Wang et al. [7] performed large eddy simulations to examine the flow characteristics around solar arrays mounted on a flat roof building at wind directions of 0° and 180°. Dai et al. [8] examined the effects of panel location, tilt angle and building height on wind loads on isolated solar panels mounted on rooftops of tall buildings, finding that an increase in building height induced a decrease in the largest mean and the negative peak net panel force coefficients.
There also have been many studies to determine wind loads on ground-mounted panels. Scaletchi et al. [9] compared different models of wind action on solar tracking PV platforms stated in standards or reports from important companies, and they suggested obtaining the wind action model by experimental approach due to the large range of the wind loads, resulting from standards and reports. Pfahl et al. [10] examined the wind loads on heliostats and photovoltaic trackers of aspect ratios between 0.5 and 3.0 by a wind tunnel test, investigating the constellations (including wind direction and elevation angle of the panel) and resulting in highest wind loads, and they found that higher aspect ratios were advantageous for the dimensioning of the foundation, the pylon, and the elevation drive but disadvantageous for the azimuth drive. Abiola-Ogedengbe et al. [11] conducted an experimental investigation of wind effects on a standalone photovoltaic (PV) module comprised of 24 individual PV panels, finding that the inter-panel gap influences the module’s surface pressure field, and the wind exposure influences the mean pressure magnitudes on the PV module. The spacing parameters are important parameters for solar arrays, and their effect on wind loads on the ground-mounted arrays were investigated by Warsido et al. [6]. It is found that the magnitude of force and moment coefficients decreased across the panel rows as a result of the sheltering effect from the neighboring upwind panels. Increasing the lateral spacing between array columns had minimal effect on the force and moment coefficients. However, the wind load coefficients increased as the longitudinal spacing between panel rows was increased. In a numerical simulation of ground-mounted wind loads on five rows of solar panels, Jubayer and Hangan [12] found that all the trailing rows were in the complete wake of the leading row for the straight winds (0° and 180°), but not for the oblique winds (45° and 135°), and in terms of the maximum overturning moment, the 45° and 135° wind directions were critical with similar overturning moment coefficients for each row. Reina and De Stefano [13] promoted a reduced model with periodic boundary conditions in the spanwise homogeneous direction in the numerical simulation of sun-tracking ground-mounted arrays, and investigated the wind loads of the tilted panel from −60° to 60°. In the multi-row wind loading forecasting of the ground-mounted single-axis tracker, Taylor and Browne [14] utilized the pressure model at a relatively smaller scale and a sectional model at a larger scale to measure the buffeting forces acting on the array, and to extract the variation in aerodynamic stiffness and damping as a function of wind speed, respectively.
Although many proprietary studies concerned about the wind loads on roof-mounted arrays exist, little information about the effect of parapet height are reported. In the Chinese standard NB/T 10115-2018 [15], the wind load parameters, such as shape factor and shading factor, for panels with tilted angle less than 15° are regarded the same. However, little studies provide detailed and reasonable basis.
To make up for these deficiencies, the aerodynamic loads on roof-mounted solar arrays with four parapet heights (0 m, 0.9 m, 1.2 m, 1.5 m) and two tilt angles (5°, 10°) are investigated by the wind tunnel test. Firstly, the rigid models consist of a low-rise building, and the different parapet height and five solar arrays with different tilted angles are made. Then, the wind tunnel tests are conducted. Thirdly, the statistics (mean, standard deviation, skewness, kurtosis, peak) of wind pressure coefficients in the wind direction of 0° and 180° (perpendicular to the wide face of the building), 90° and 270° (perpendicular to the narrow face of the building), and 45° (oblique to the building) are discussed. Finally, the effects of the parapet height and tilted angle are examined and concluded.

2. Wind Tunnel Tests Experimental Setup and Measurements

2.1. Model and Instrumentations

The experimental model consists of two parts: the low-rise building and roof-mounted solar arrays. The low rise-building was 51.0 m in length, 19.0 m in width and 25.0 m in height. The diagram of the building with the parapet is shown in Figure 1a. The roof-mounted arrays consist of five rows, with each row made up of 22 units. Each unit consists of two modules. Each module is 2.094 m in length and 1.038 m in width. Thus, the length and width of each row of 22 units were 46.488 m and 2.096 m, respectively, since the rows were modeled with gaps of 0.02 m between modules. In total, the array had 220 modules with a total area of 478.186 m2. The five rows of arrays were symmetrically mounted on the roof, with a row space of 1.0 m and setbacks of 2.16 m from the edge of the roof. To investigate the influence of the tilt angle and parapet on the arrays’ wind loads, two module tilt angles (5° and 10°) and four parapet heights (0 m, 0.9 m, 1.2 m, 1.5 m) were set in the wind tunnel tests.
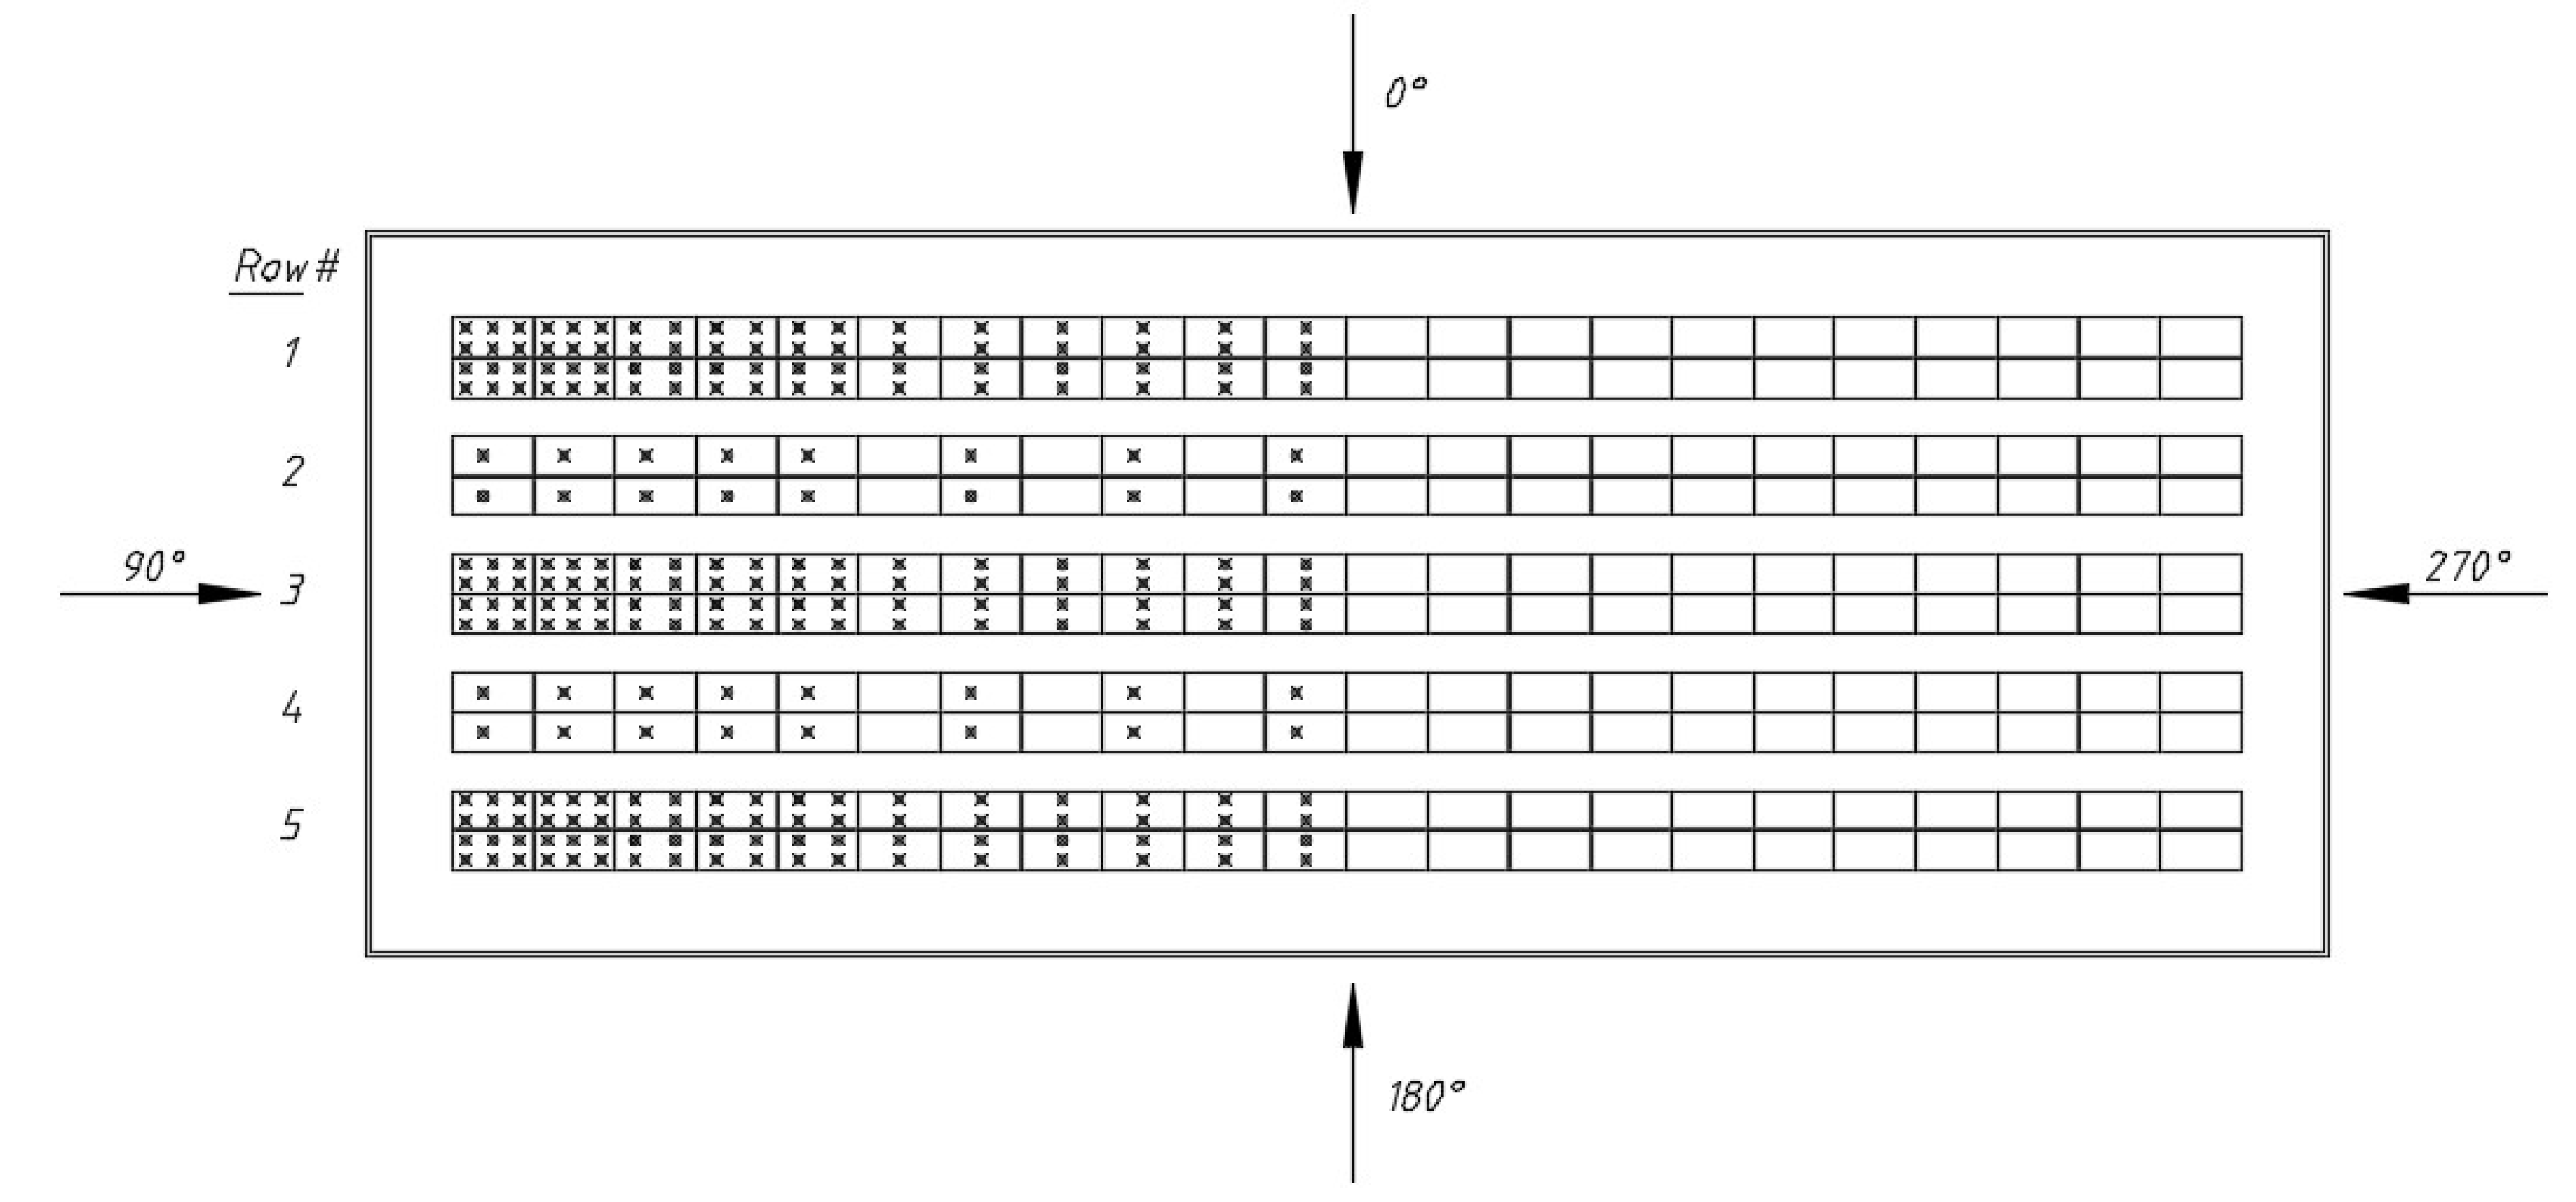
To simulate the aerodynamic flow field around the solar panel, both the solar array and surrounding structures must be geometrically similar [16,17]. For wind tunnel testing to yield accurate results, it is critical that the scale of the simulated atmospheric boundary layer and the building are the same, with the flow and geometric modeling both being sufficiently accurate [4]. In practice, the modules are relatively small compared to building size, requiring a larger scale flow simulation than one would use for low-rise buildings. However, the larger end of the range of model sizes is limited by blockage effects, noting that ASCE 67 (ASCE 1999) requires blockage to be less than 8%. To keep the balance of the above constraints, a length scale of 1:50 was used for the current study. Then the model size of the module is 41.88 mm × 20.76 mm. The model shown in Figure 1b was made by ABS plastic in a rigid manner. The layout of pressure taps (marked with ⊗) is shown in Figure 2. A total of 496 pressure taps were drilled on the upper and lower surfaces of panels. The positions of the taps were selected carefully to measure the pressure at all important locations. Since the low-rise building and panel arrays were symmetrical, the pressure taps were only drilled on the half zoon. The wind loads on the other half can be obtained by symmetry.
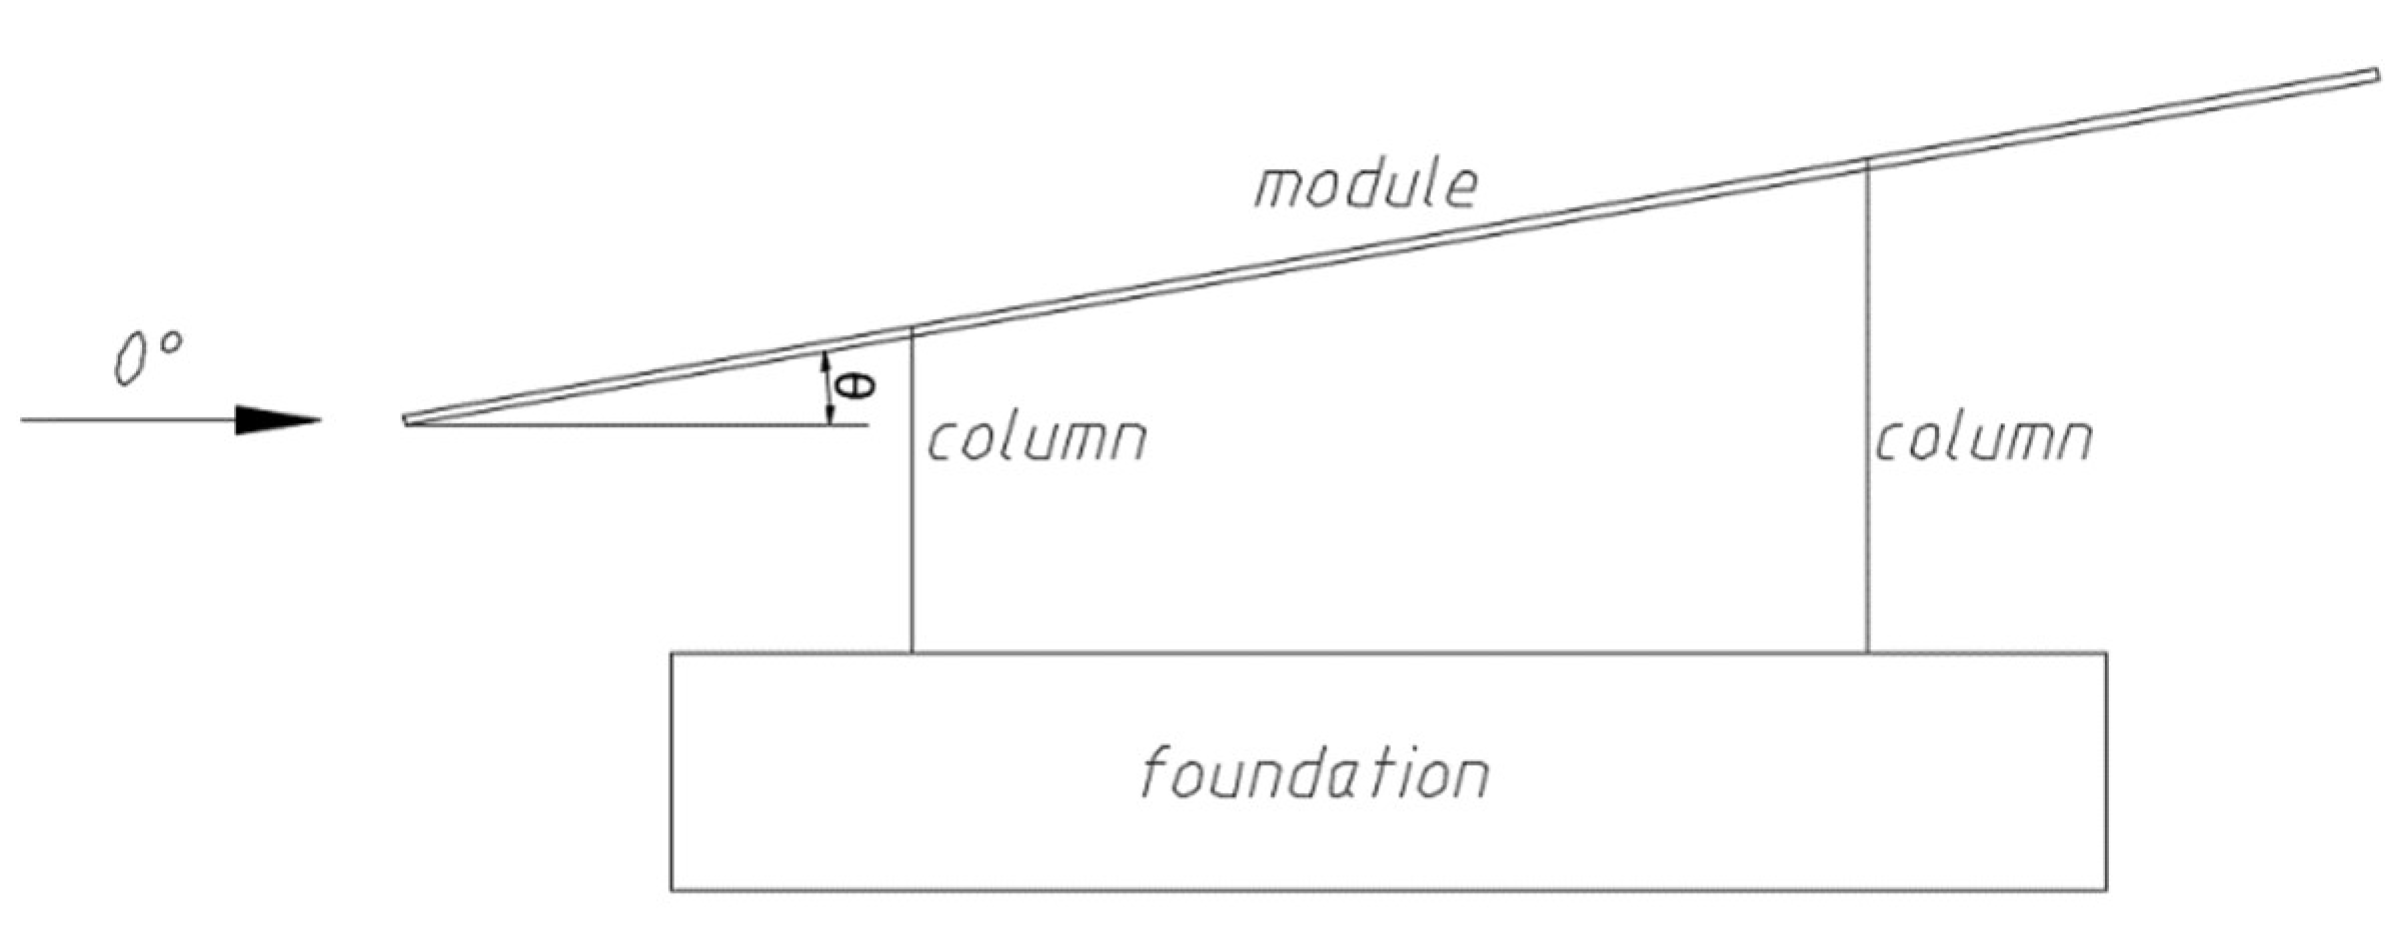
The wind tunnel tests were carried out at the ZD-1 Wind Tunnel Laboratory of Zhejiang University, a return-flow boundary layer wind tunnel of 4.0 m in width and 3.0 m in height. This wind tunnel enables the wind speed to range from 0 m/s to 55 m/s. The non-uniformity turbulence intensity of the wind velocity in the test region is less than 1%. The horizontal and vertical deflection angles of the flow are less than 1°. The aerodynamic wind loads acting on the panels were sampled by the Zoc33 digital modules (Scanivalve). Pressure signals were acquired at a sampling frequency of 312.5 Hz over a period of 60 s. Measurements were taken for 24 incident wind angles at 15° intervals for the full 360° azimuth, where 0° was perpendicular to the wide face acting in the short direction of the building and 90° was perpendicular to the narrow face acting in the long direction, as defined in Figure 2. Noting that in the wind tunnel test, the upper surface faces the approaching wind flow at the wind direction of 0°, as shown in Figure 3, in which θ is the tilted angle of module.

2.2. Terrain Simulation

The experiments were designed to match the open terrain exposure. According to the Chinse standards GB 5009-2012 [18], the upstream wind velocity and turbulence intensity profile are given as:
U z = U 0 ( z / z 0 ) α .
I u = I 10 ( z 10 ) α .
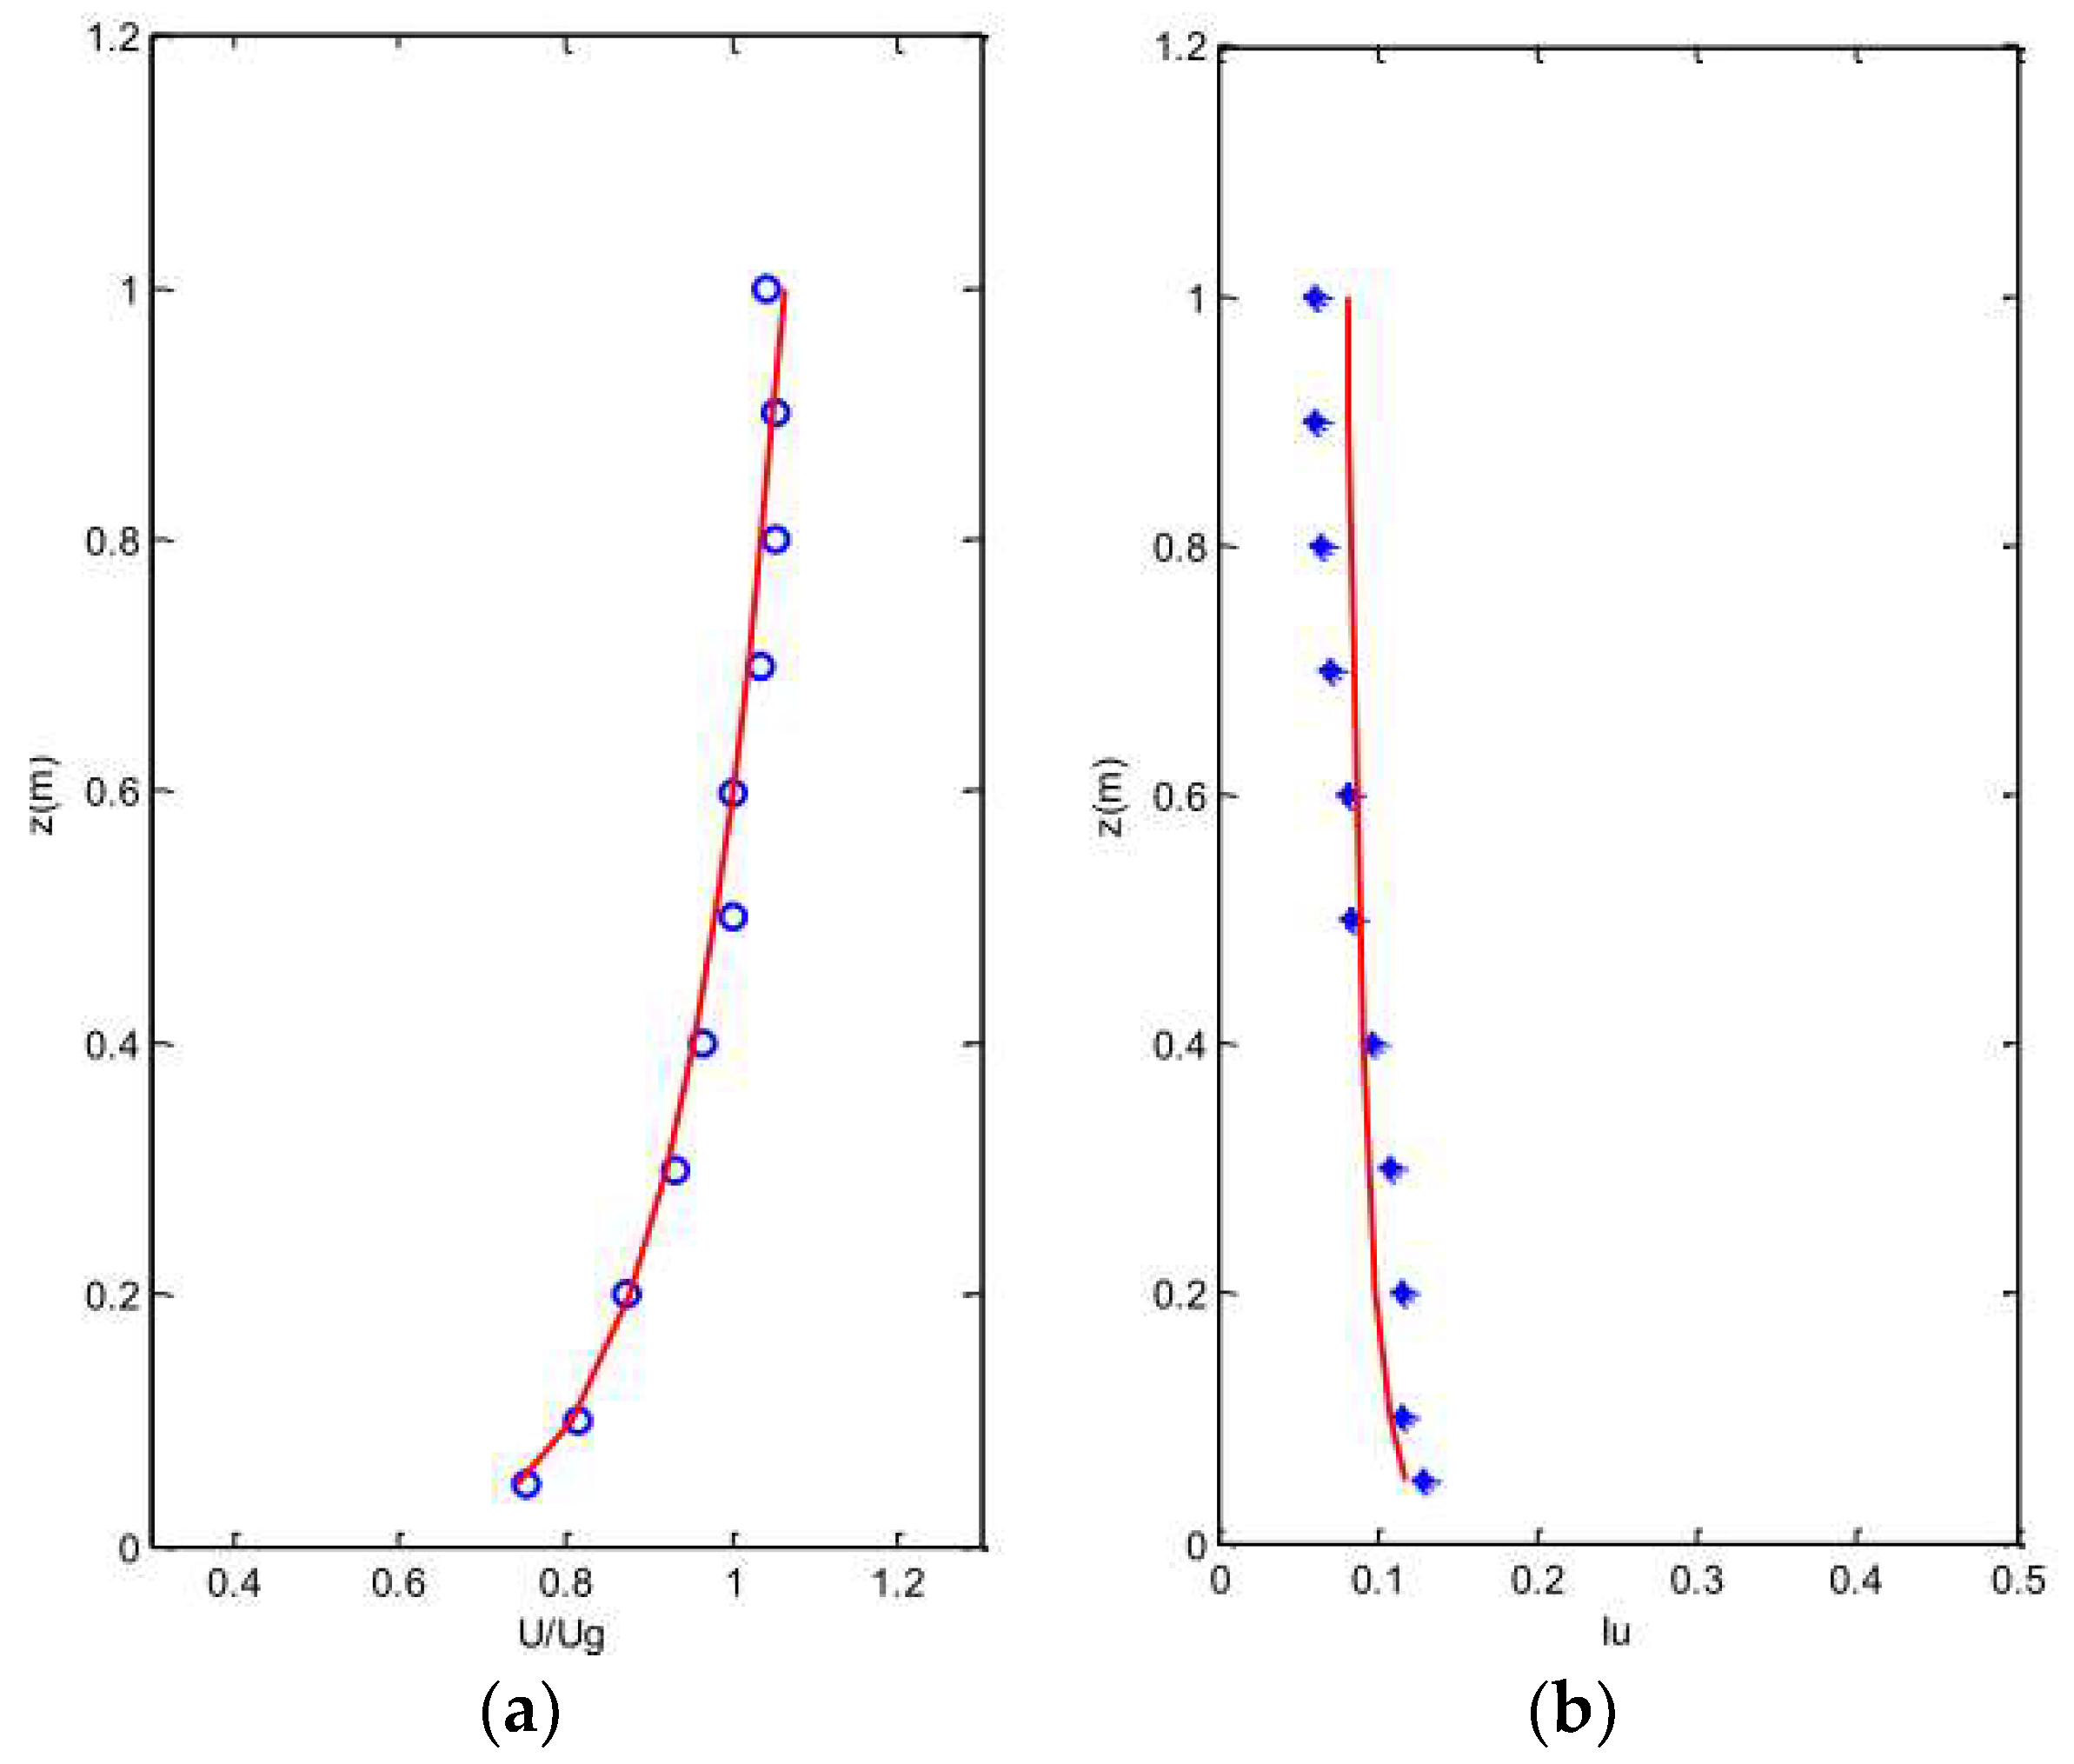
where, U z and I u are the mean wind velocity and turbulence intensity at height z from the ground, U 0 is the reference wind speed, z 0 is the reference height. When z 0 = 10 m, the corresponding reference wind speed is 36 m/s. I 10 is the reference turbulent intensity at the height of 10 m, α is the terrain-dependent exponent given as 0.12 of open terrain exposure in the GB 5009-2012 [18]. Figure 4 depicts the measured mean wind velocity and turbulence intensity profiles as well as the target open terrain profiles from GB 5009-2012 [18]. The figures show that both the experimental mean and intensity profiles are in excellent agreement with the target profiles. The reference height of the measured wind velocity was at the height of the roof, of 50 cm from the tunnel ground, and the reference wind speed was 10.65 m/s. Therefore, the velocity scale of this test was 1:4.1.

3. Data Processing

As described in Section 2.1, the pressure was measured simultaneously at 496 locations (248 on each surface) of the panel arrays. The non-dimensional pressure coefficients, C p i , can be obtained as,
C p i = P i P 0.5 ρ V 2
where, P i is the measured pressure at location i on the model surface, P and V are reference pressure and velocity, respectively, at a height of 50 cm (i.e., roof height) near the middle of the wind tunnel. The pressure coefficients compressing module surface are considered as positive ( C p + ), whereas the values deviating module surface are considered as negative ( C p ). Therefore, the net pressure ( Δ C p ) is the difference of the pressure coefficient values on adjacent upper and lower taps on the model, that is,
Δ C p = C p + C p
As shown in Figure 2, no taps were drilled on some modules. The net pressures on these modules were the linear interpolations of the left and right modules. The area-averaged pressure coefficient, C p , a r e a , is obtained by integrating the net pressures at all taps within an area simultaneously, given weighting to each pressure tap based on its tributary area relative to the total area being considered. In this study, the area-average pressure coefficients were obtained for various areas from modules within each unit to modules within each row.
The third (skewness) and fourth (kurtosis) statistical moments are the two main parameters used to measure non-Gaussian characteristics for a given process. The skewness, ( m 3 ) and kurtosis ( m 4 ), of a time history of a pressure coefficient with N data points sampled at discretized time instants t j , j = 1 , 2 , , N can be estimated statistically as follows [19],
m 3 = 1 N j = 1 N [ C p i ( t j ) C p i , m e a n C p i , R M S ] 3
m 4 = 1 N j = 1 N [ C p i ( t j ) C p i , m e a n C p i , R M S ] 4
where, C p i , m e a n and C p i , R M S are the mean and standard deviation, respectively, of the time history of the pressure coefficient.
In the structural design of the solar panel array, the maximum and minimum peak pressure coefficients are usually concernedby structural designers. According to the Chinese standard JGJ/T 481-2019 [20], the maximum ( C p i , max ) and minimum ( C p i , min ) peak pressure coefficients based on the four-moment Hermit model [21,22] for a given process can be calculated as,
{ C p i , max = C p i , m e a n + C p i , R M S · k ( 3.5 + 4 h 3 + 27 h 4 ) C p i , min = C p i , m e a n C p i , R M S · k ( 3.5 13 h 3 + 16 h 4 ) f o r m 3 0 , m 4 3
{ C p i , max = C p i , m e a n + C p i , R M S · k ( 3.5 + 13 h 3 + 16 h 4 ) C p i , min = C p i , m e a n C p i , R M S · k ( 3.5 4 h 3 + 27 h 4 ) f o r m 3 < 0 , m 4 3
{ C p i , max = C p i , m e a n + 3.5 C p i , R M S C p i , min = C p i , m e a n 3.5 C p i , R M S           f o r m 4 < 3
where, k , h 3 and h 4 are the parameters of the moment-based Hermite model [21], and can be obtained by skewness ( m 3 ) and kurtosis ( m 4 ), that is,
h 4 = [ 1 + 1.5 ( m 4 3 ) 1 ] / 18 h 3 = m 3 / ( 6 + 36 h 4 ) k = 1 / 1 + 2 h 3 2 + 6 h 4 2
Equation (7a–c) are suitable for softening and hardening processes, respectively. Based on the mean, standard deviation, and the maximum and minimum peaks of pressure coefficients, the positive and negative peak factor of the pressure coefficients can be calculated by,
g + = C p i , max C p i , m e a n C p i , R M S
g = C p i , min C p i , m e a n C p i , R M S

4. Results and Discussion

4.1. 0° and 180° Wind Directions

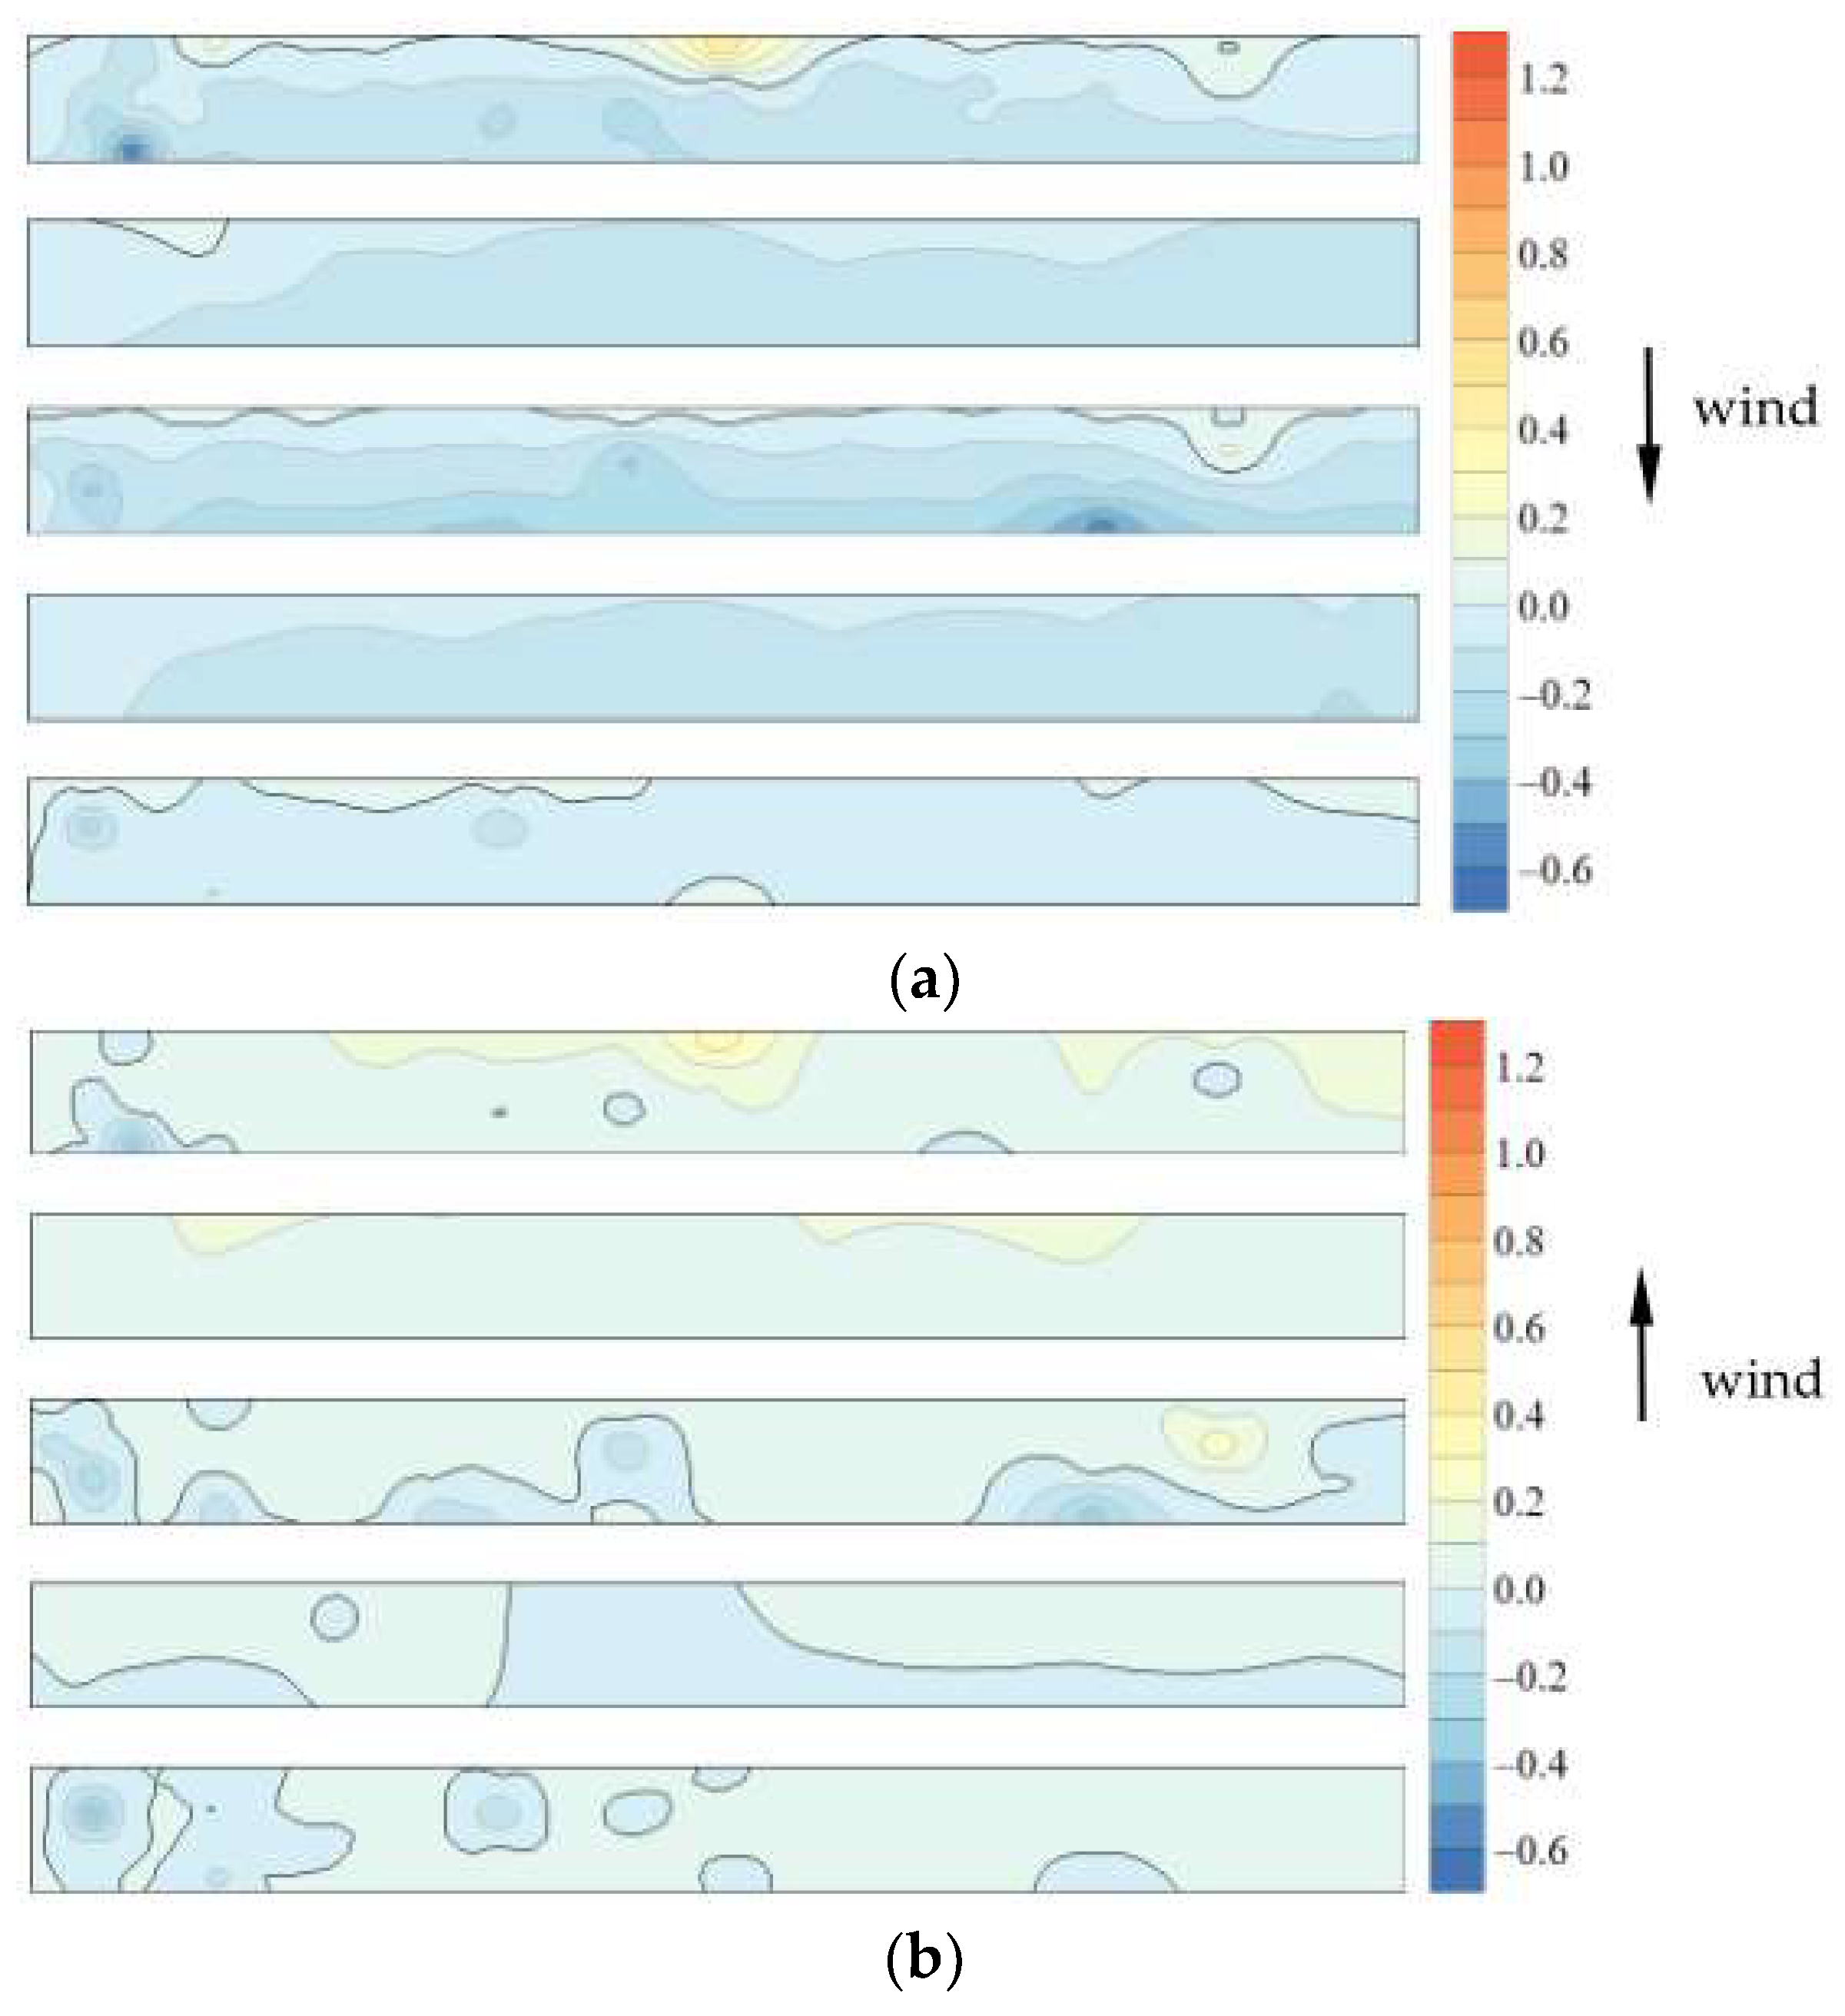
The contour plots of the net pressure coefficients ( Δ C p ) on the measured solar panel with a tilt angle of 10° and a parapet height of 0 m for wind directions 0° and 180° are shown in Figure 5. The results show that for the wind direction of 0°, the net pressure (see Figure 5a) on each row decreases monotonically from a highest positive value at the leading edge (lower end of the panel) to a lowest negative value at the trailing edge (upper end of the panel). However, from Row 1# to Row 5#, the area-averaged pressure coefficient within a row decreases first and then increases, so that when the wind flew over the panel arrays, the vortex produced by the panel slop shed and then reattached. The result is consistent with the study of Kopp et al. [4] on wind loads on tilted, roof-mounted solar arrays. When the flow approaches the panel arrays in the reverse direction, i.e., 180°, the net pressure coefficient (see Figure 5b) on each row has a relative constant at a value of 0, as the lower surface faces the approaching wind (opposite to that at 0°).
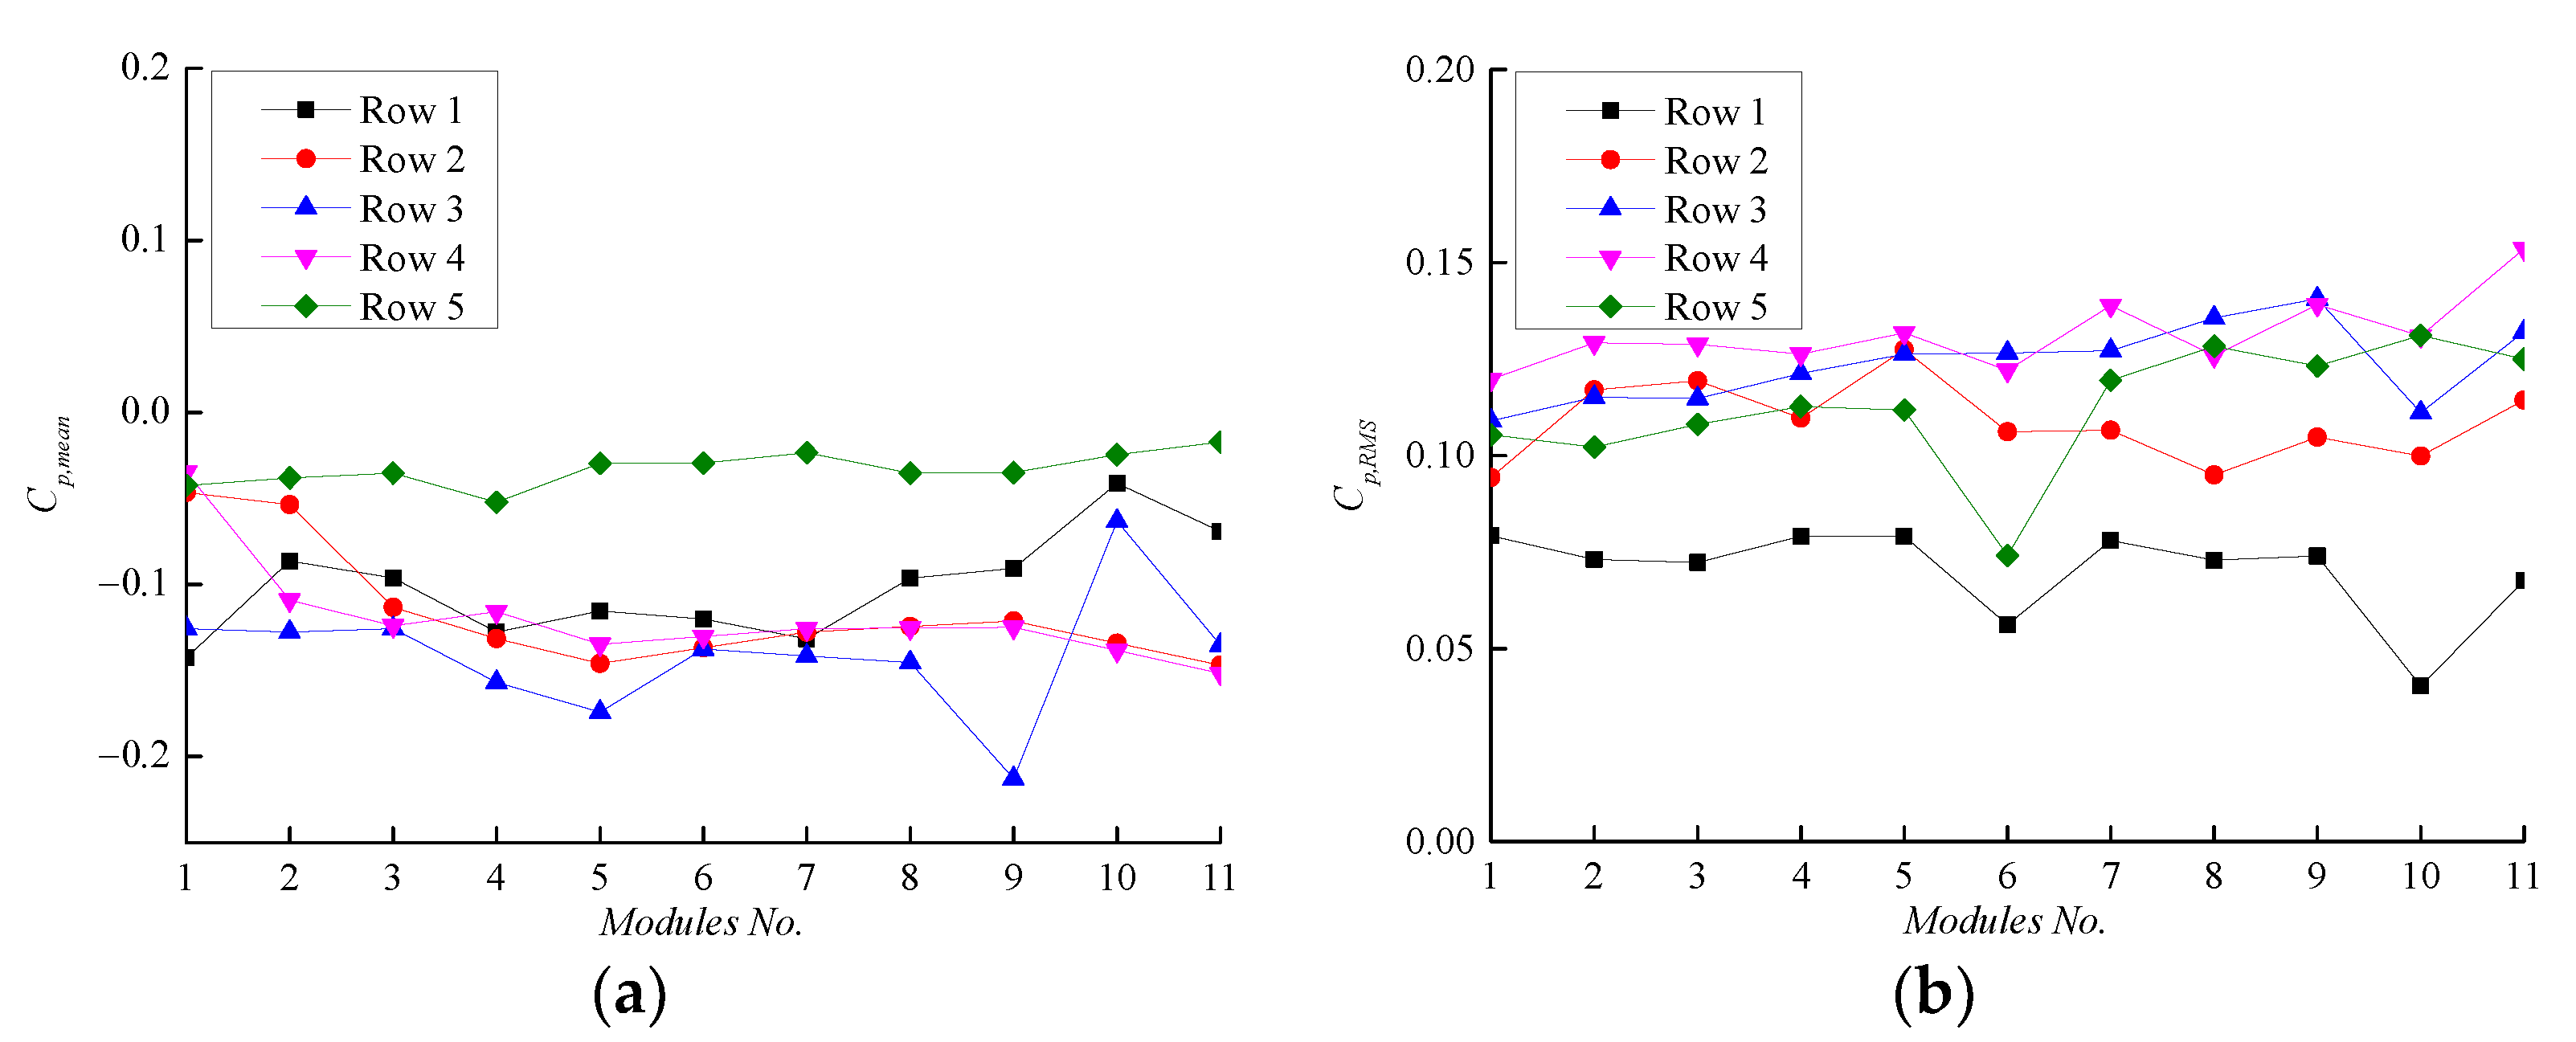
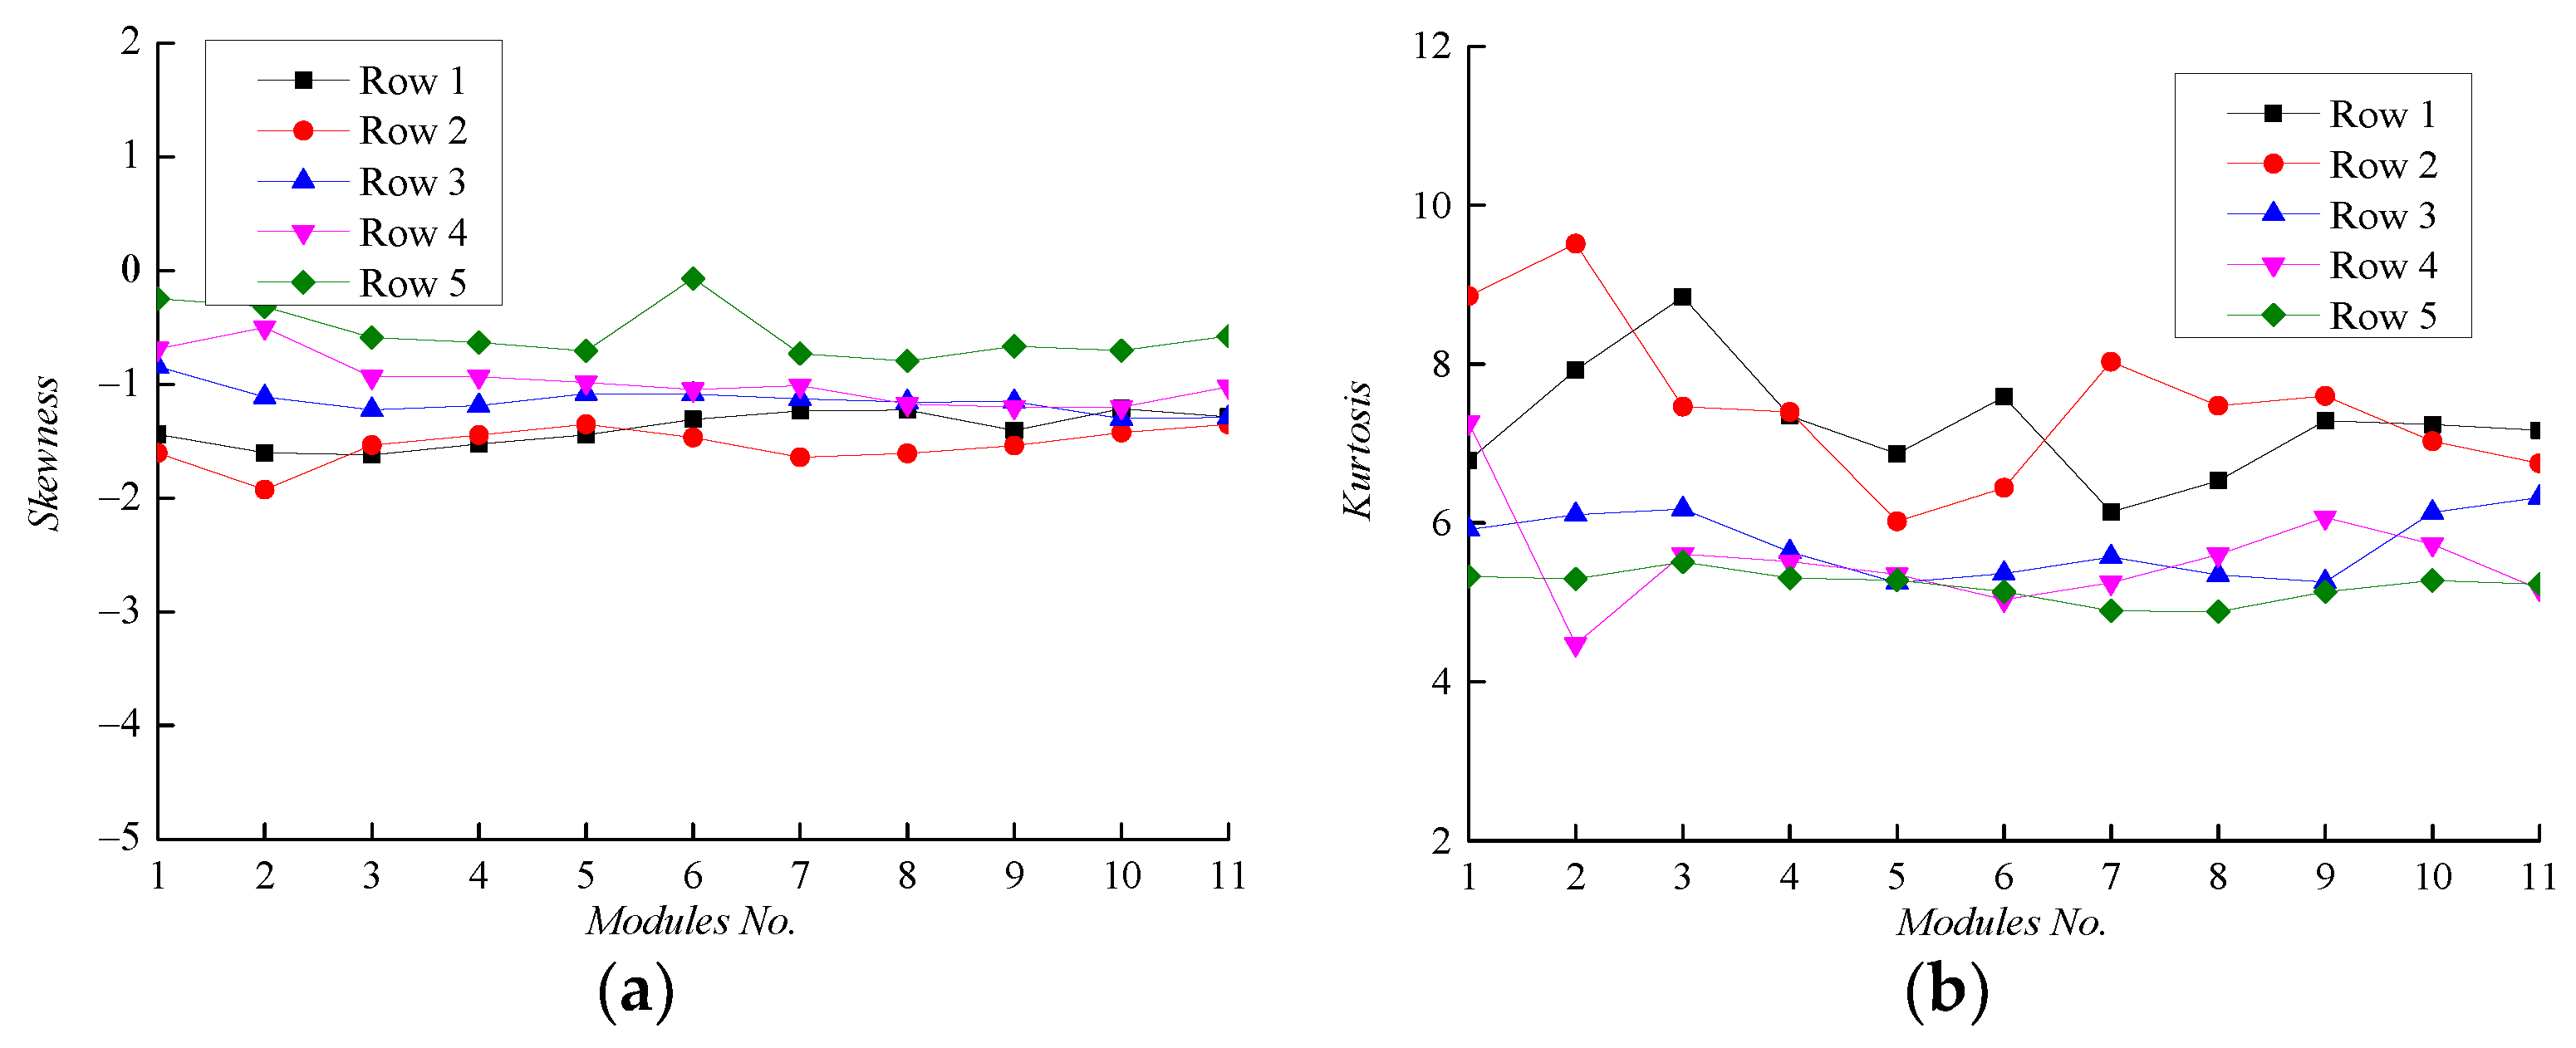
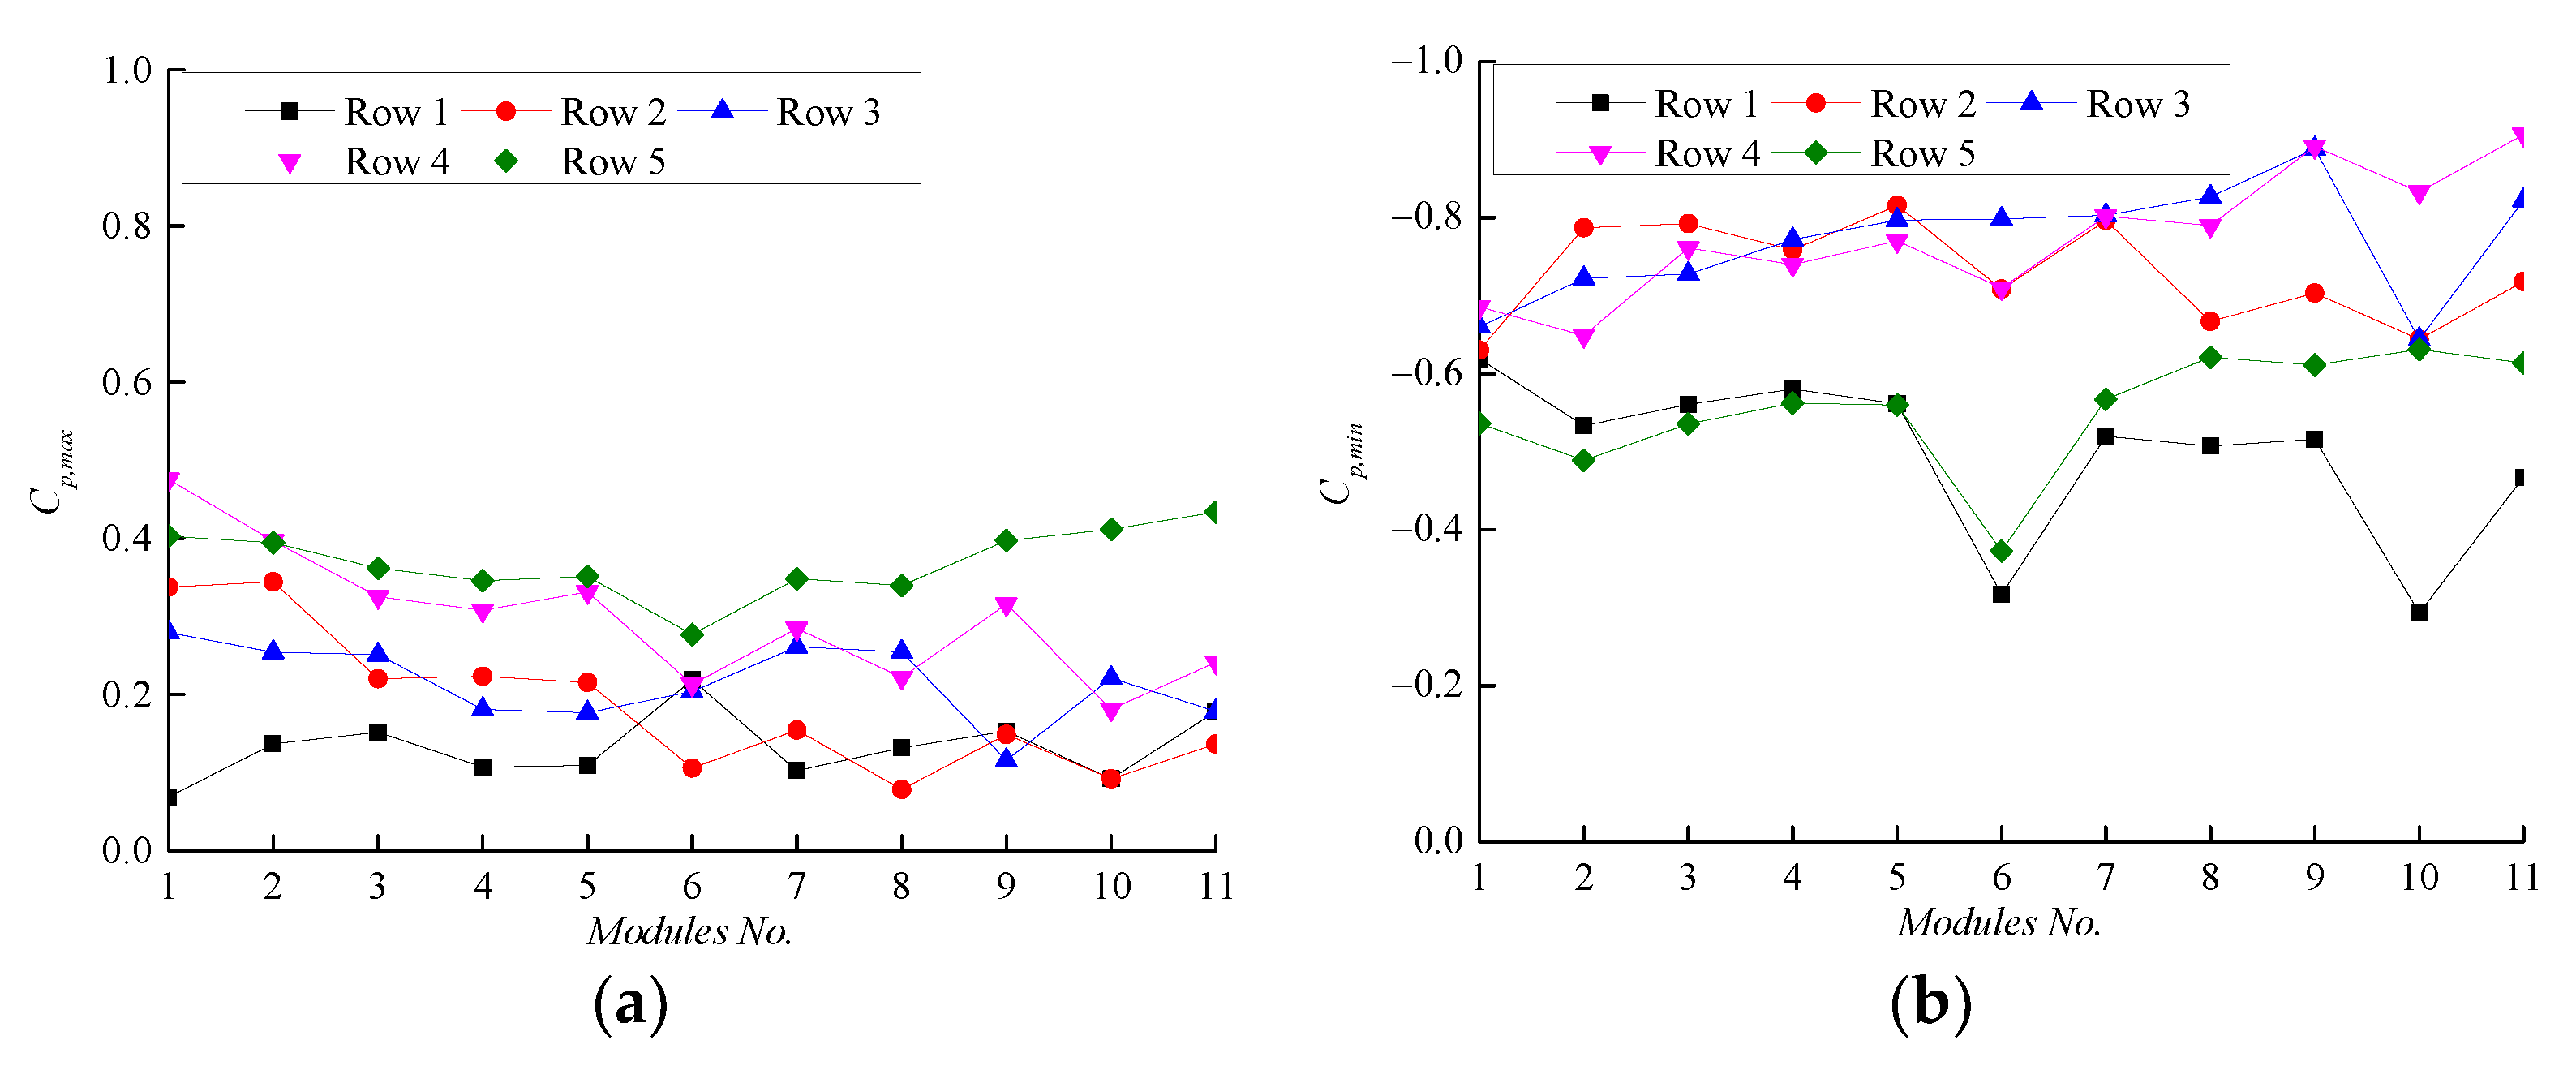
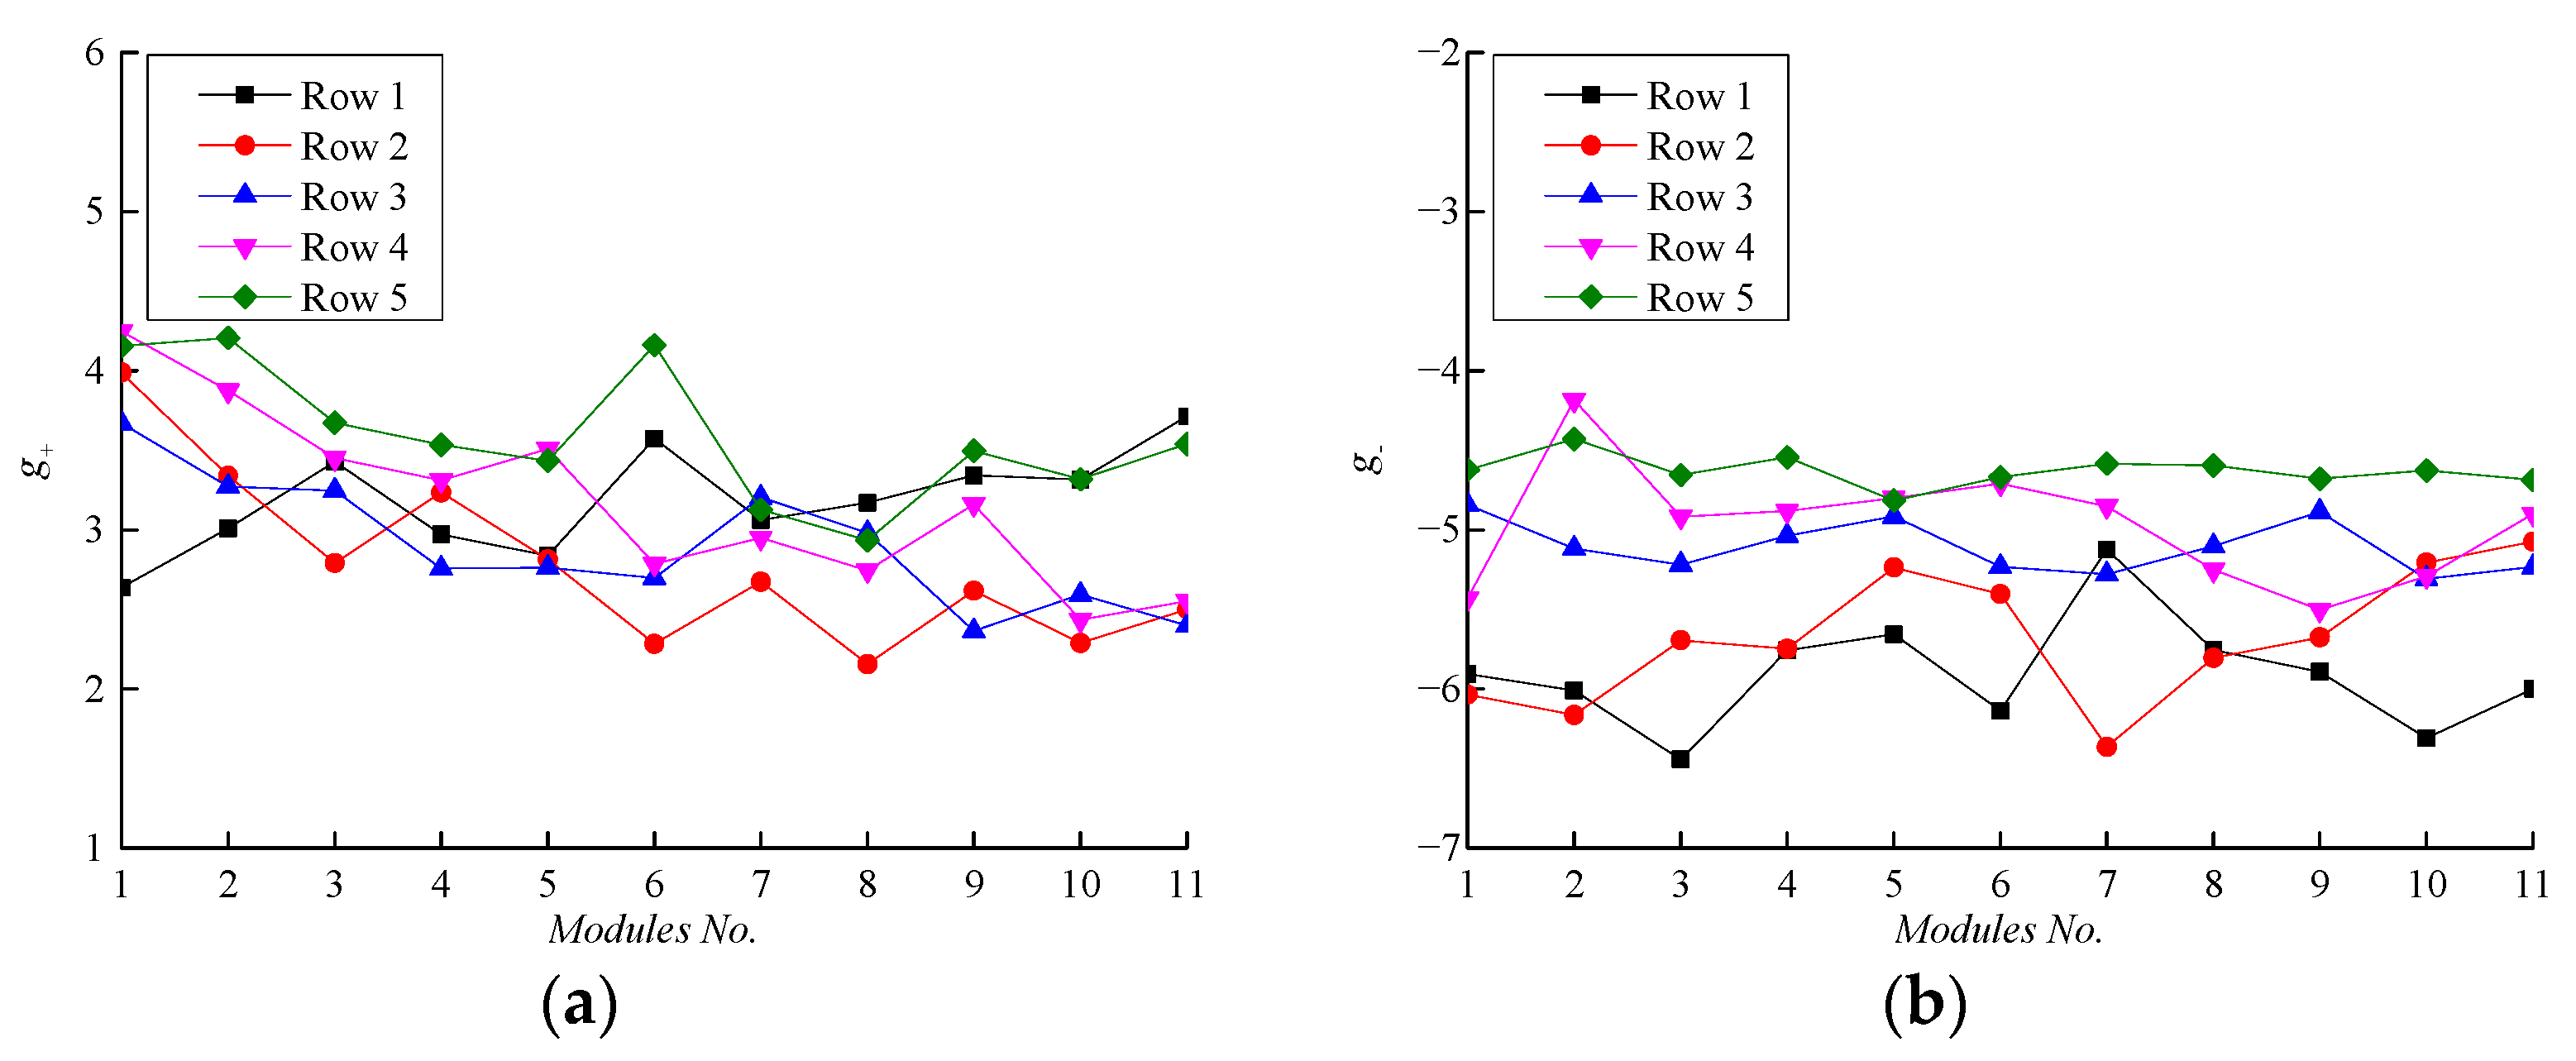
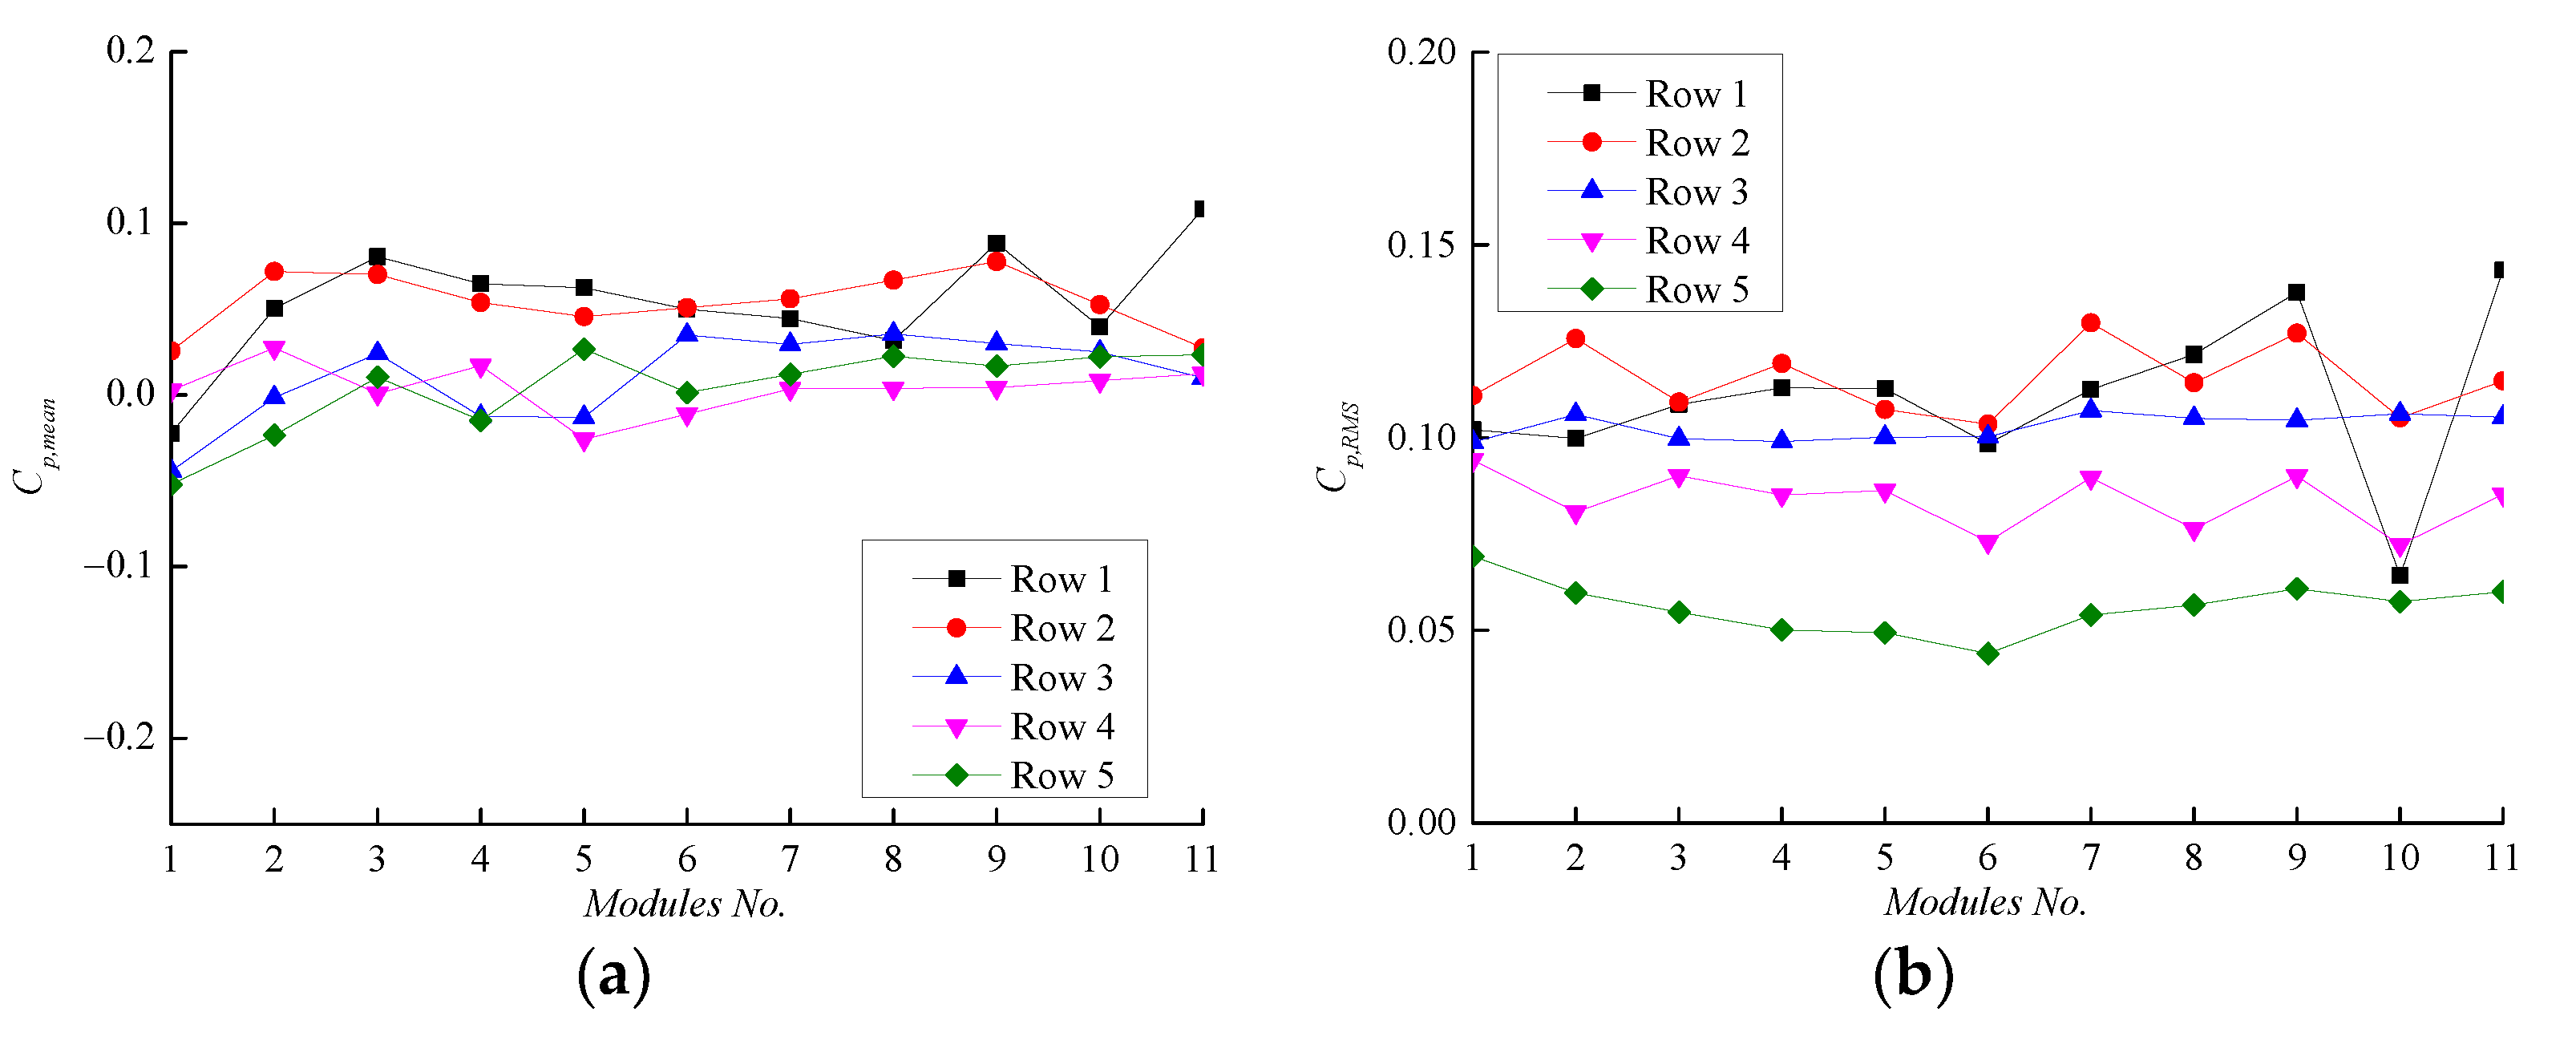
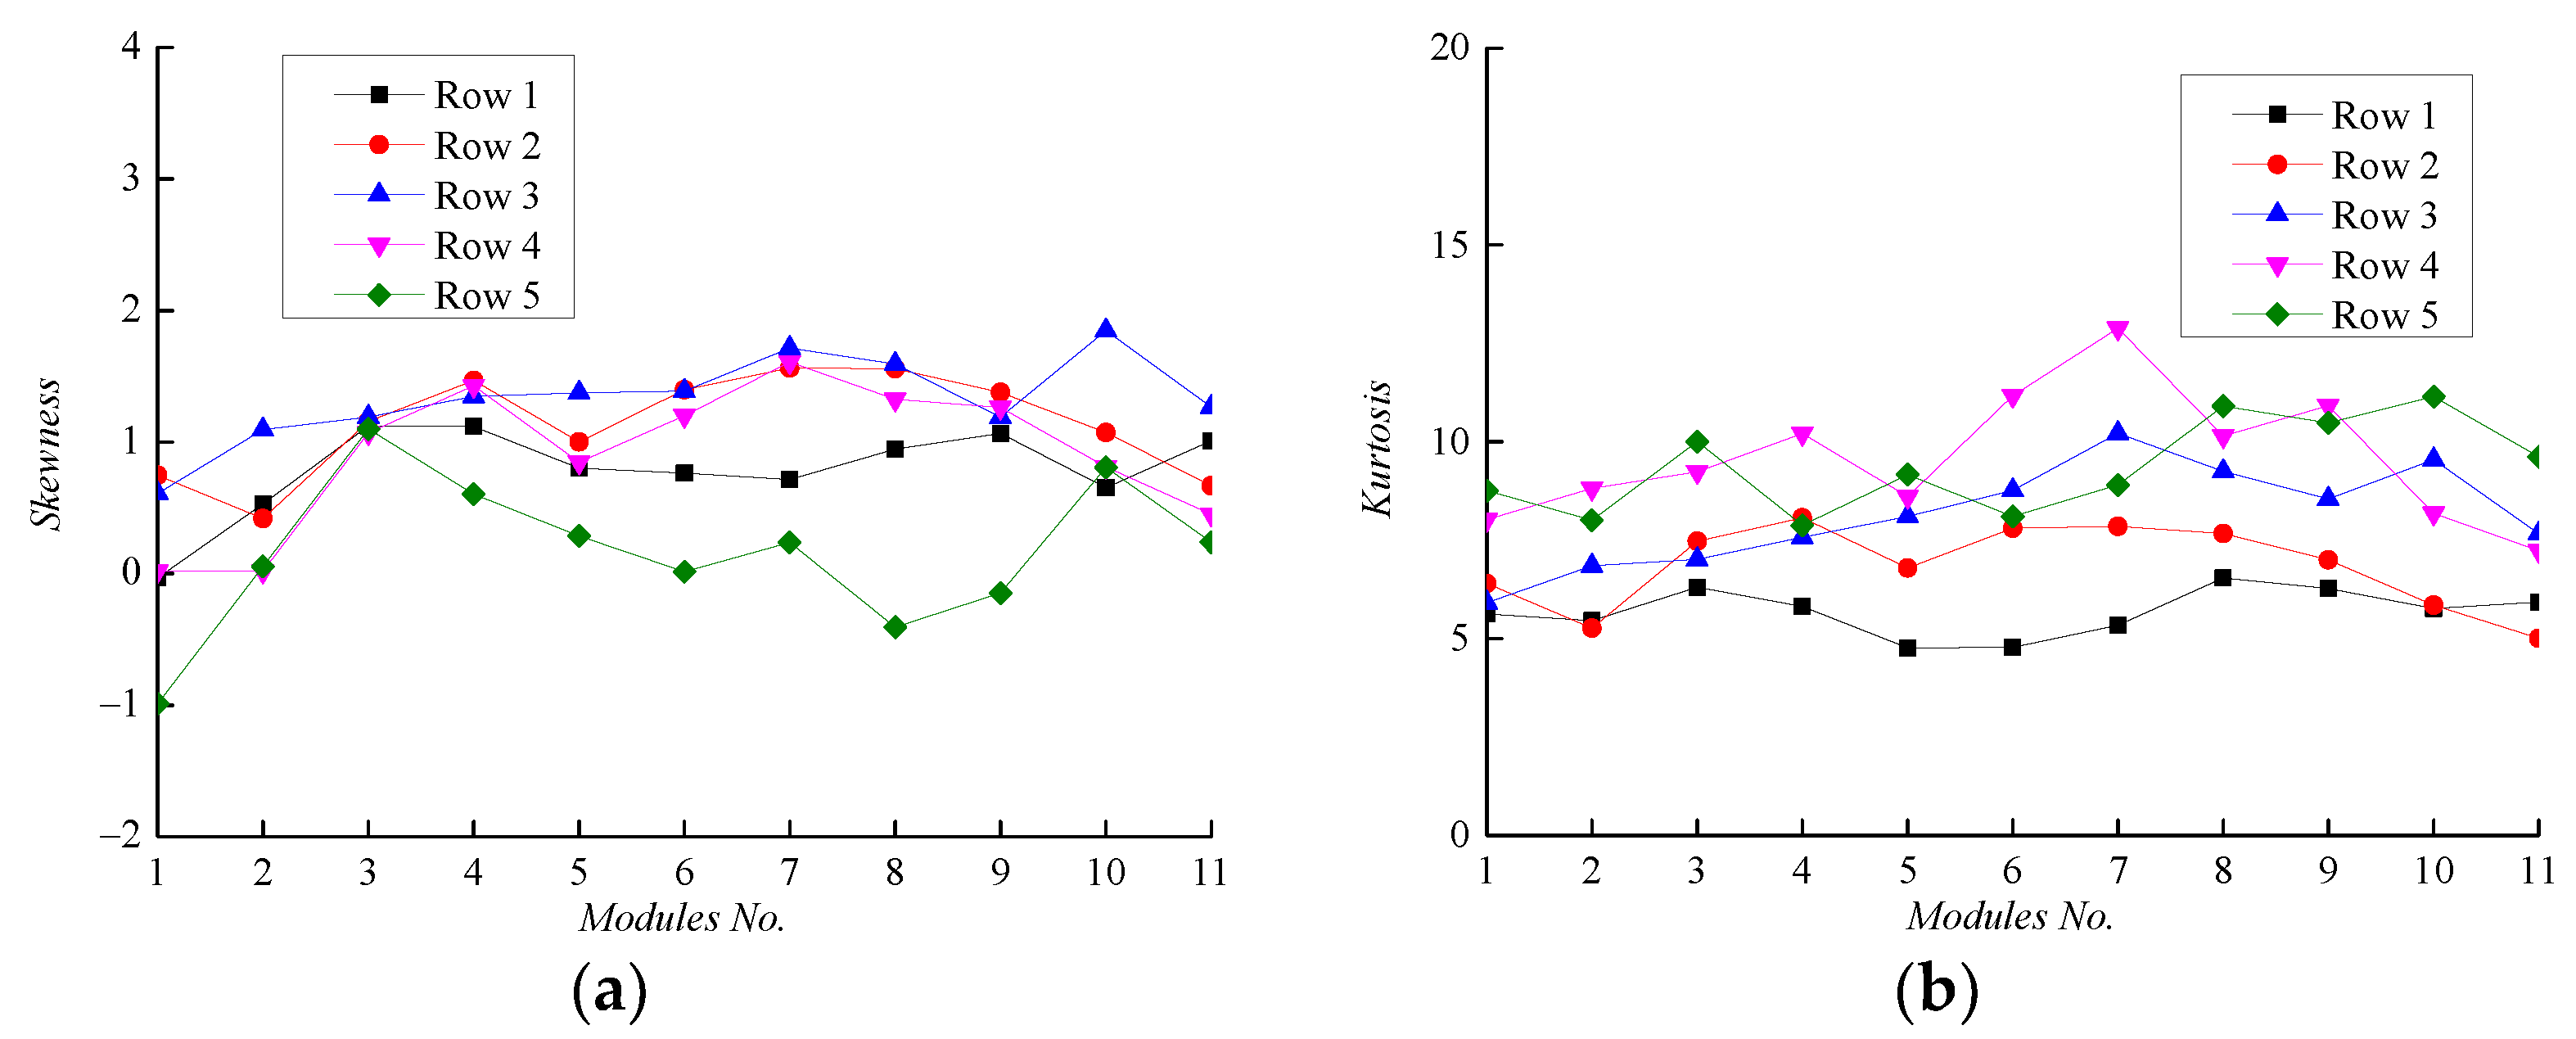
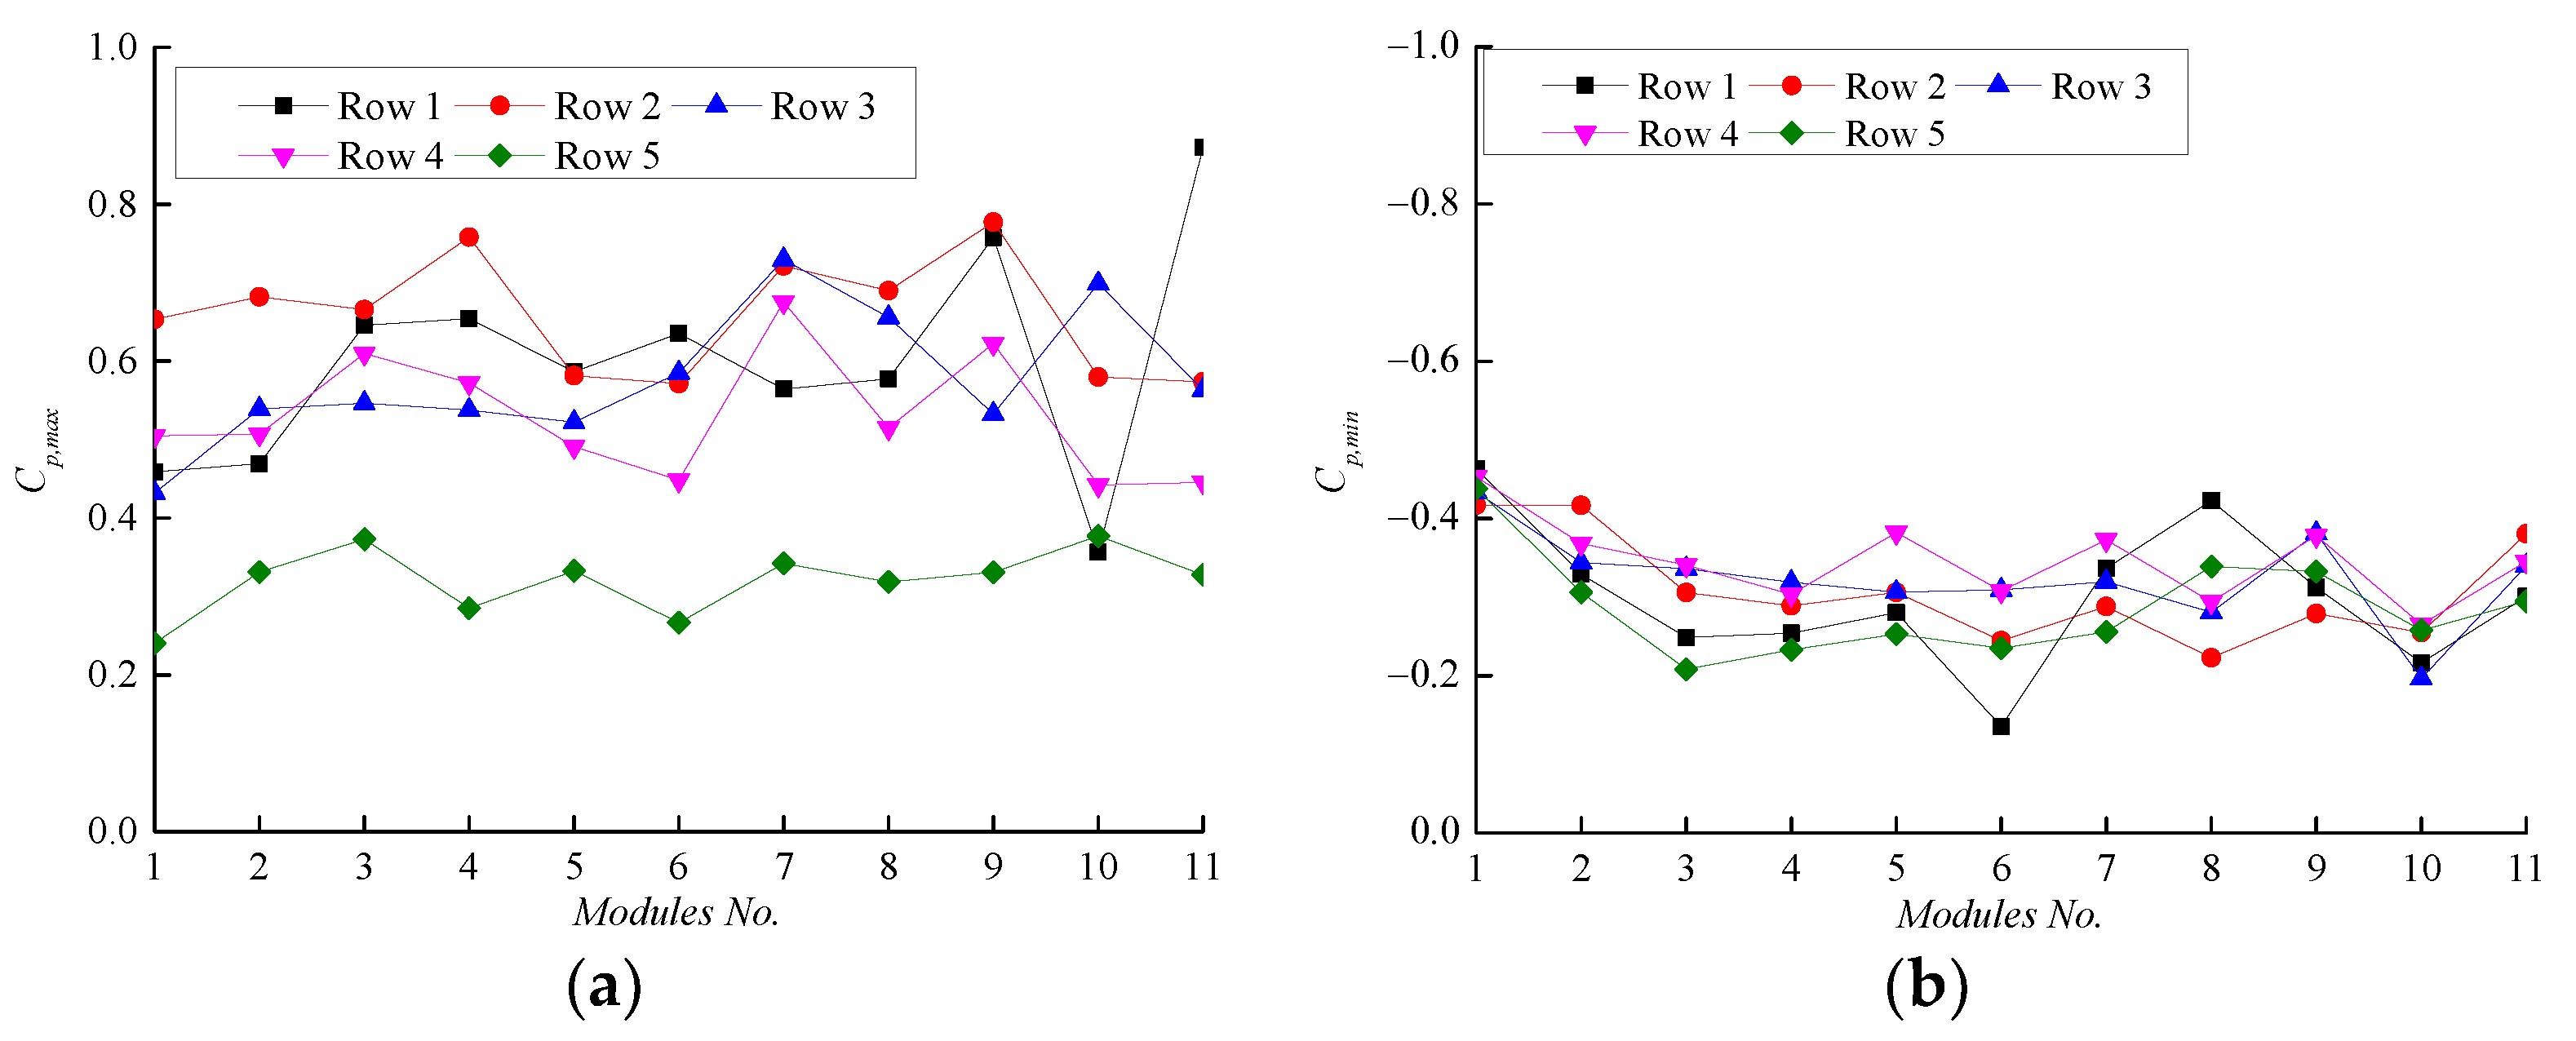
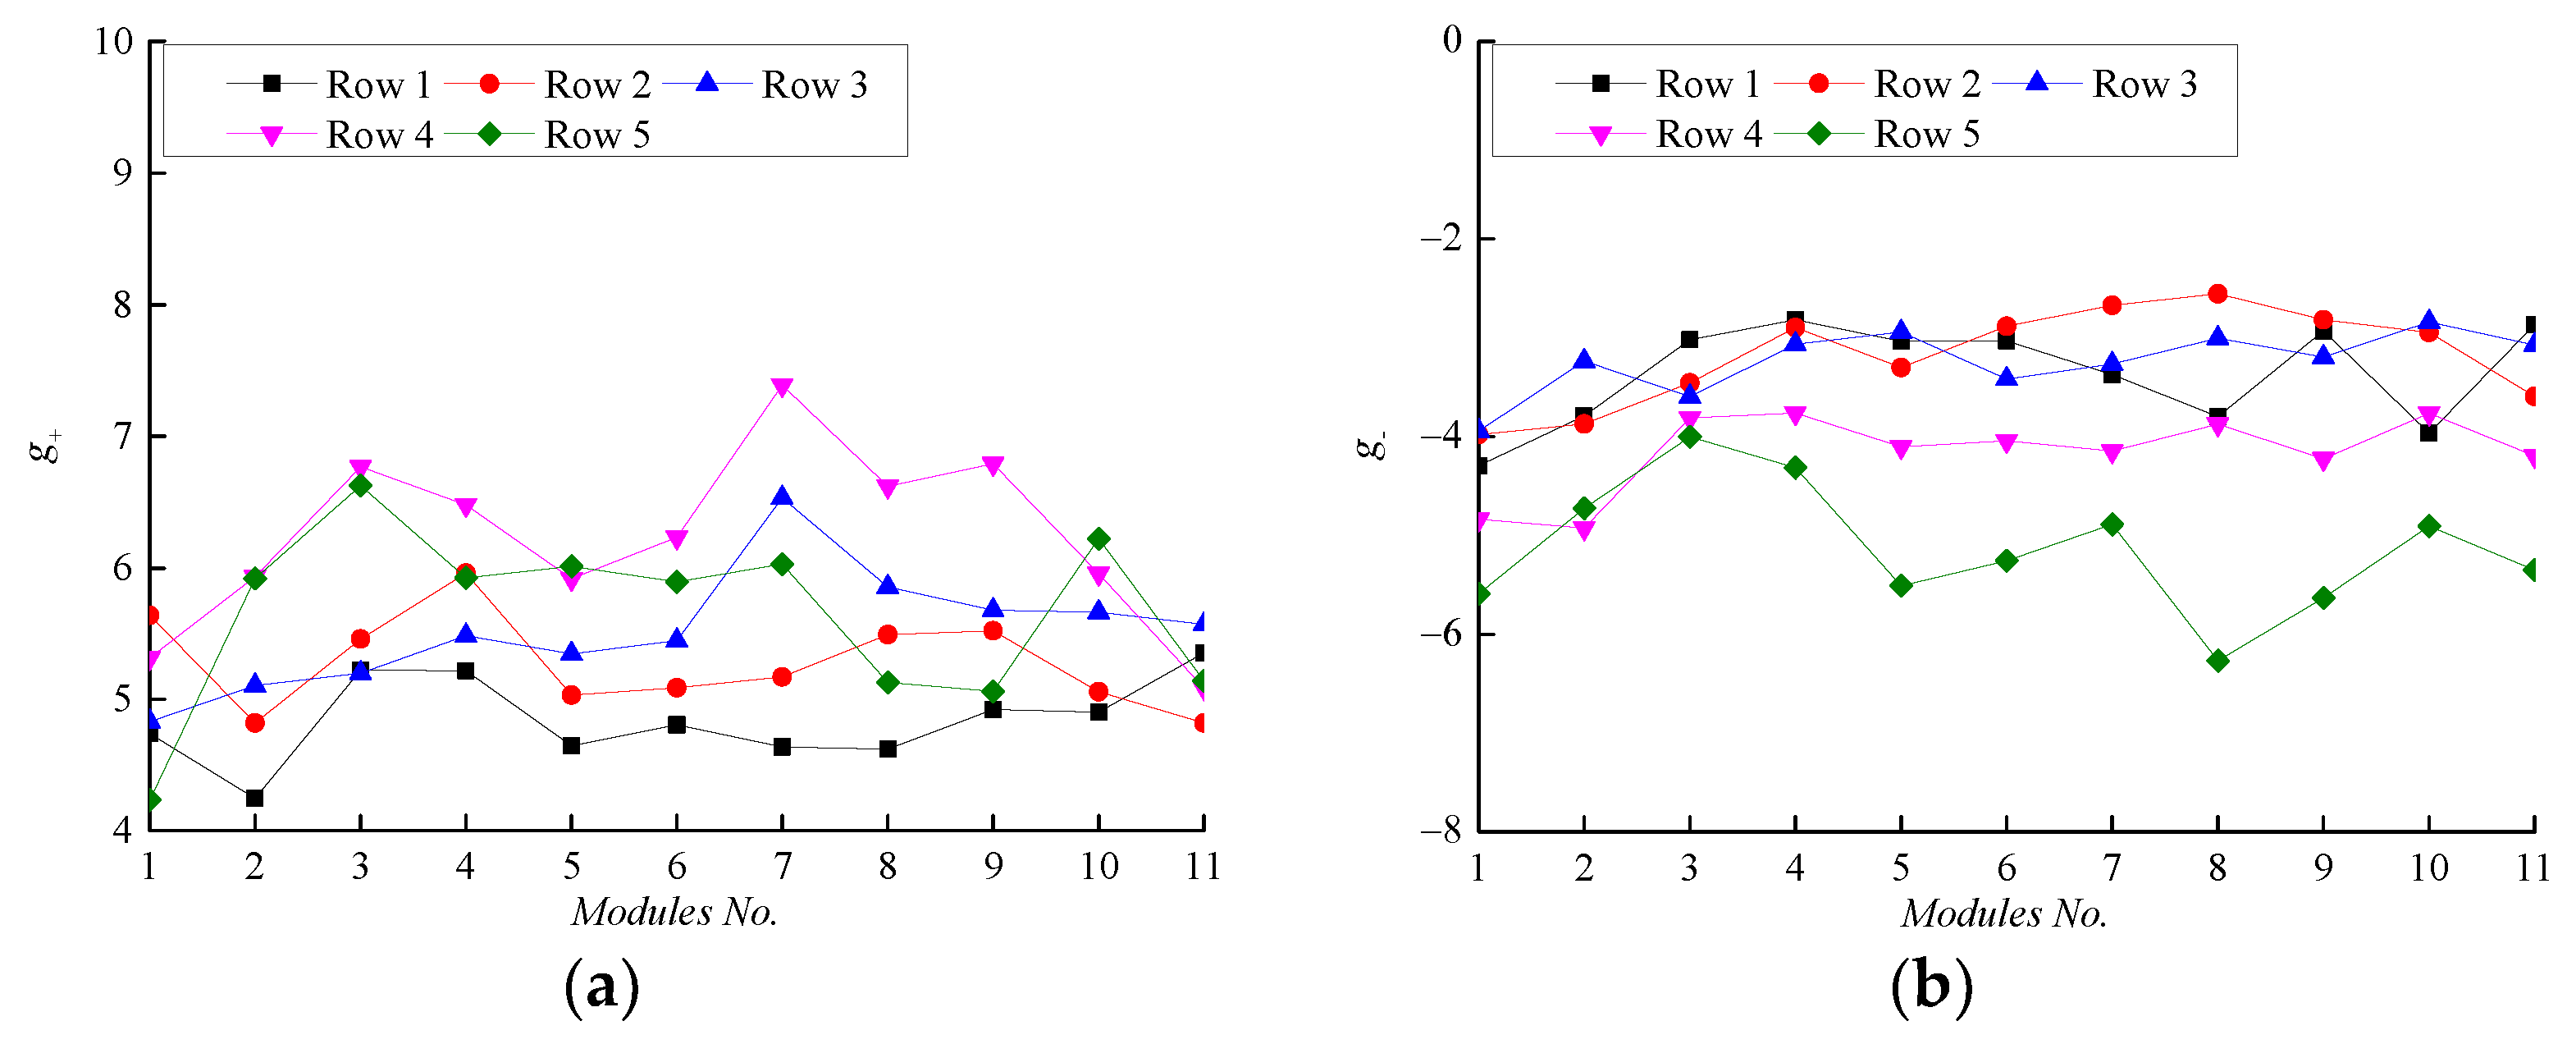
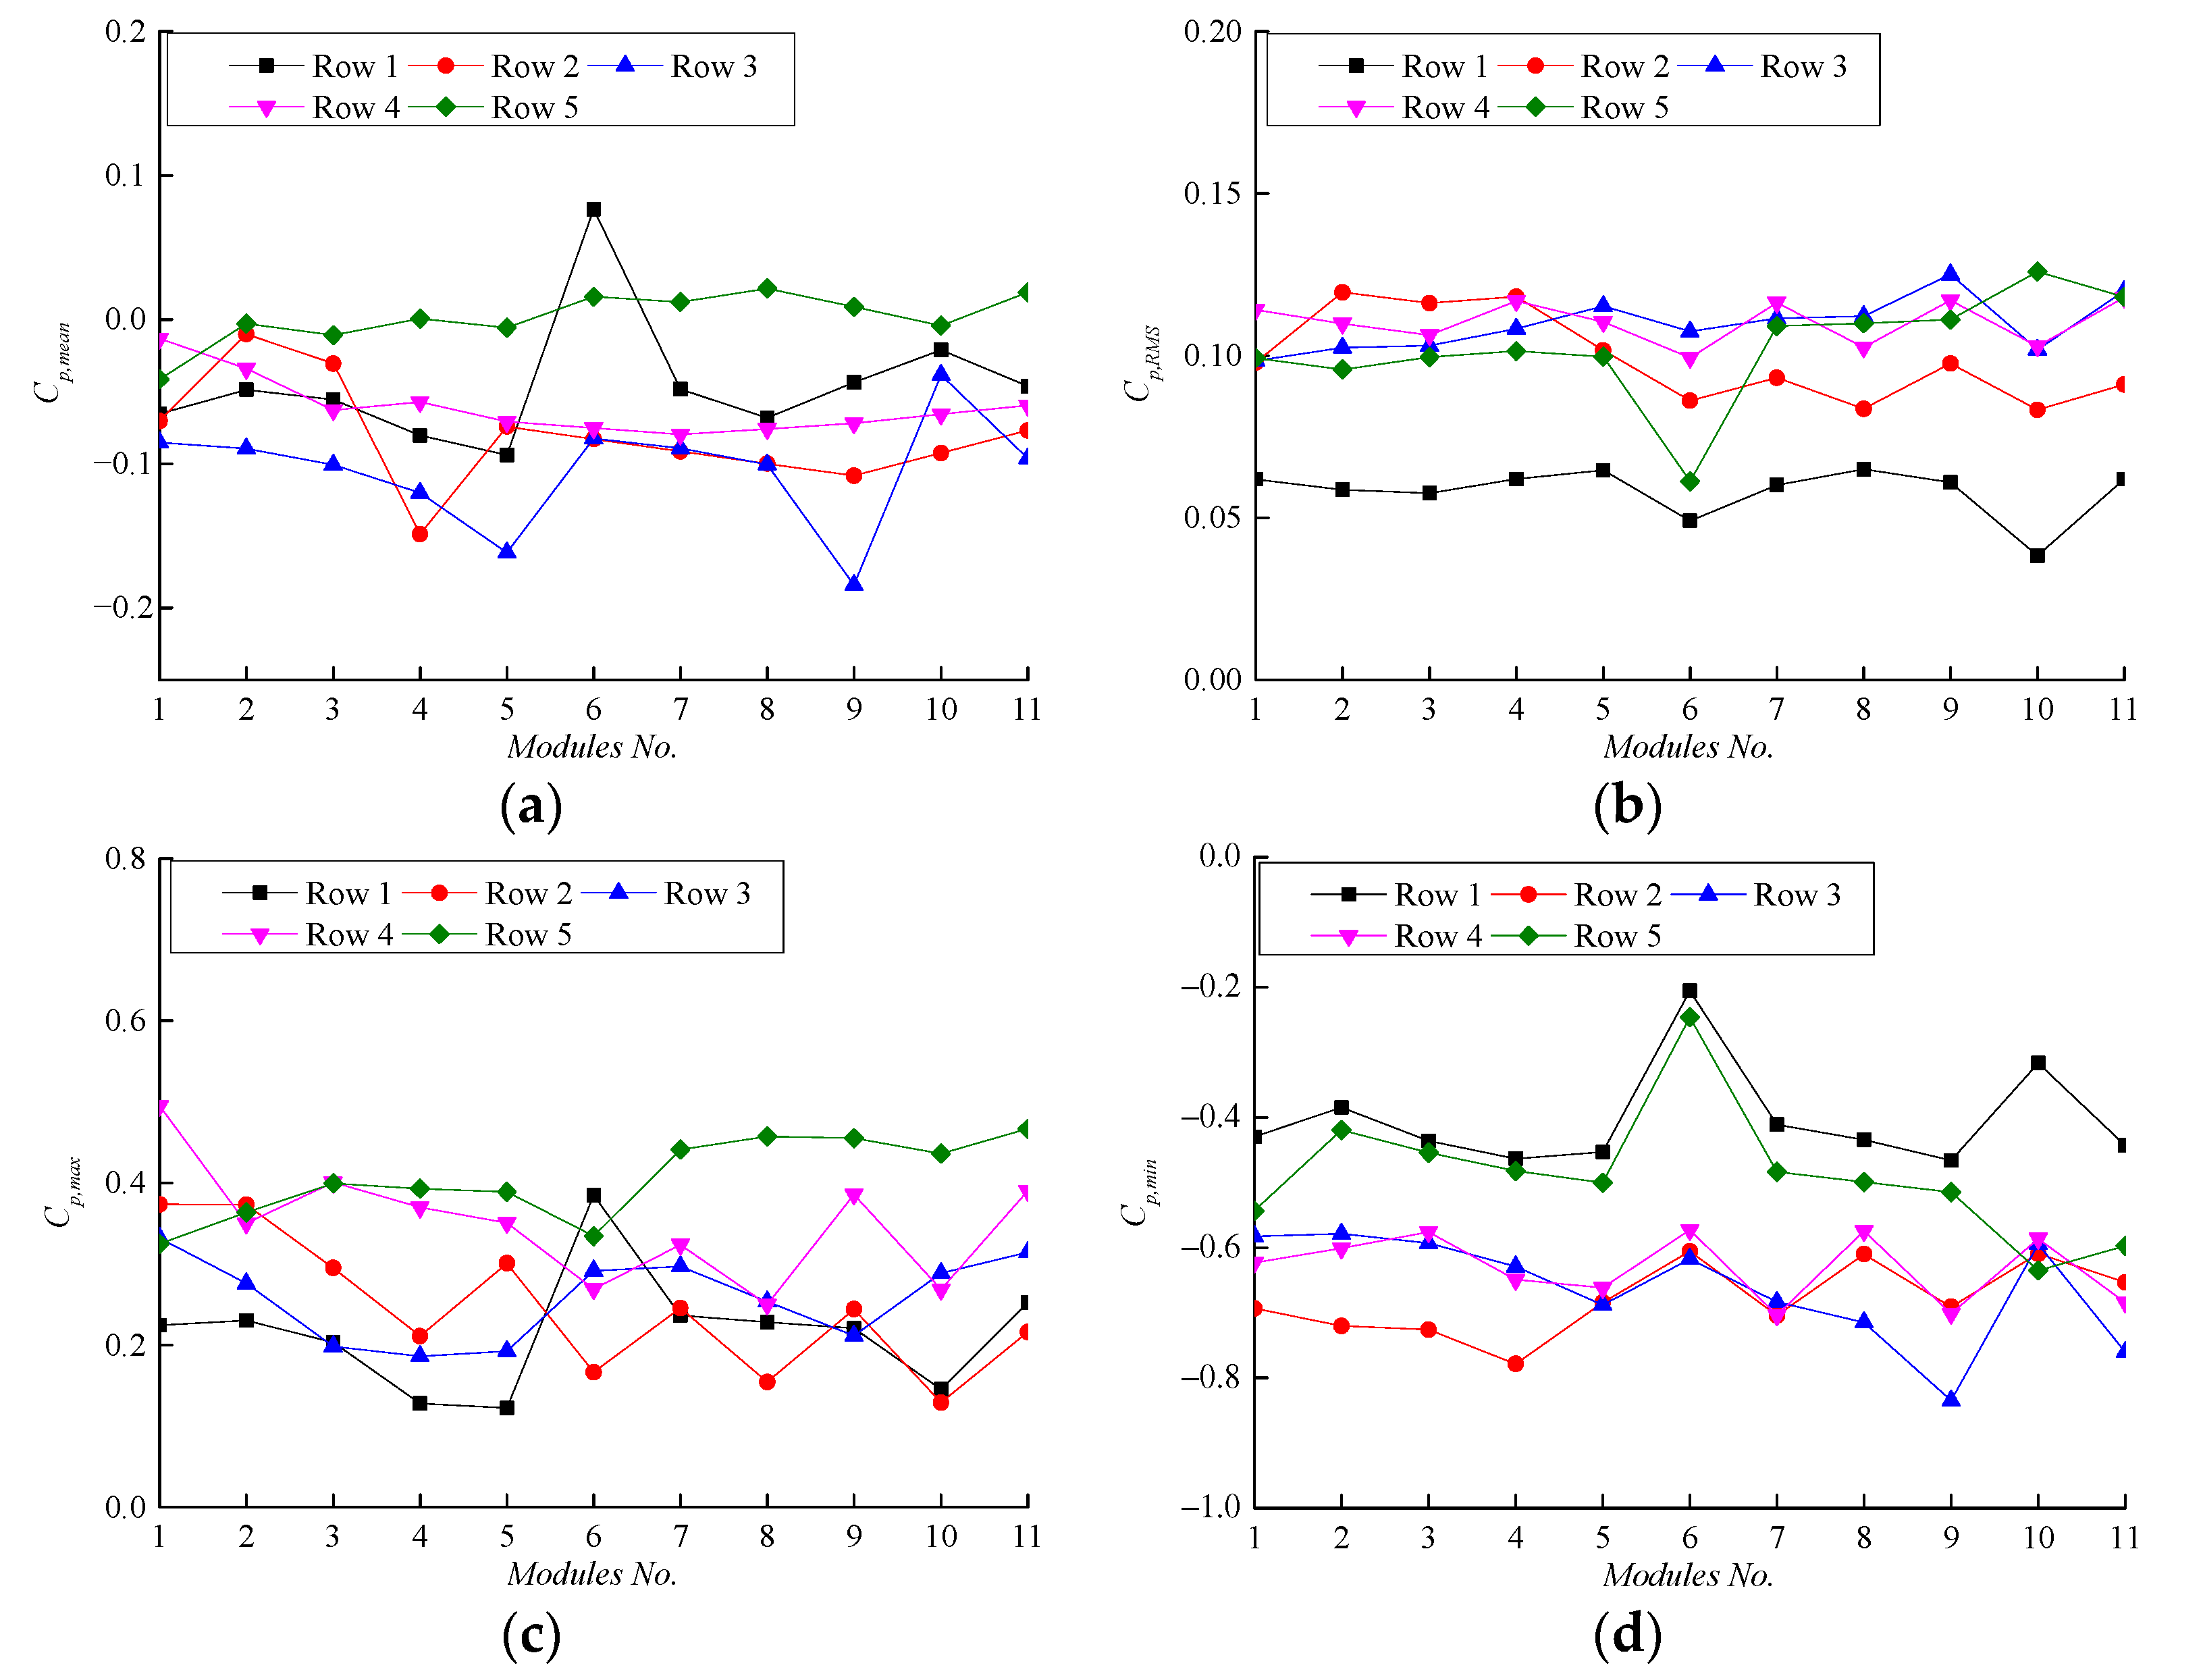
The mean ( C p , m e a n ) and standard deviation ( C p , R M S ) of the area-averaged pressure coefficients for units in the five rows for a wind direction of 0° with a tilt angle of 10° and a parapet height of 0 m are displayed in Figure 6. At this azimuth, the means for units in the full five rows of the roof-mounted array are negative, and have comparable magnitude in Rows 1#–4#, while they have the smallest magnitude in Row 5#. The standard deviations increase first but then decrease from Row 1# to Row 5#, and they have the maximum magnitude in Row 4#. The aerodynamics around roof-mounted solar arrays are similar to the flow over repeated hills, which depend on the hill slope and the spacing between hills. As the space between each row is relatively short, the turbulence continues to increase over the rows, leading to larger standard deviations. The skewness and kurtosis of area-averaged pressure coefficients on each unit are displayed in Figure 7. As kurtosises (see Figure 7b) for units in the full five rows is greater than 3, the pressure coefficients are softening processes. The non-Gaussian property of the pressure coefficients immediately suggests that the aerodynamics is subject to the comprehensive effect of the arrays itself, the corner and the edge. Thus, the maximum and minimum peak pressure coefficients should be calculated by Equation (7a,b). The corresponding peak factors are calculated by Equation (9a,b). The peak pressure coefficients and peak factors for units in the five rows at this azimuth are shown in Figure 8 and Figure 9. The minimum peak pressure coefficients have larger magnitudes than the maximum ones, as shown in Figure 8. Consequently, in the structure design of the solar panel array, the minimum peak pressure coefficients are more critical. As is typical in non-Gaussian processes, the negative peak factors are relatively constant at a value of about −6 for Rows 1–2 and about −5 for Rows 3–5 (see Figure 9b).
The mean ( C p , m e a n ) and standard deviation ( C p , R M S ) of the area-averaged pressure coefficients for the units for wind direction of 180° with a tilt angle of 10° and a parapet height of 0 m are displayed in Figure 10. Compared with those at 0° azimuth, the means at 0° azimuth are positive, with relatively smaller magnitudes. If reversing the row number, it can be found that the standard deviations between 0° and 180° azimuth are quite similar. The pressure coefficients for wind direction of 180° are also softening processes, as the kurtosises for units in the full five rows is greater than 3, which are shown in Figure 11. It is also worth noting that the lower surface of the solar panel faced the wind flow at 180° azimuth, which is opposite to that at 0° azimuth. The magnitudes of the maximum peak pressure coefficients (see Figure 12a) and positive peak factors (see Figure 13a) at 180° are quite close to those of the minimum peak pressure coefficients (see Figure 8b) and negative peak factors (see Figure 9b) at 0°. The magnitudes of minimum (see Figure 12b) and negative peak factors (see Figure 13b) have similar characteristics.

4.1.1. Effect of Parapet Height

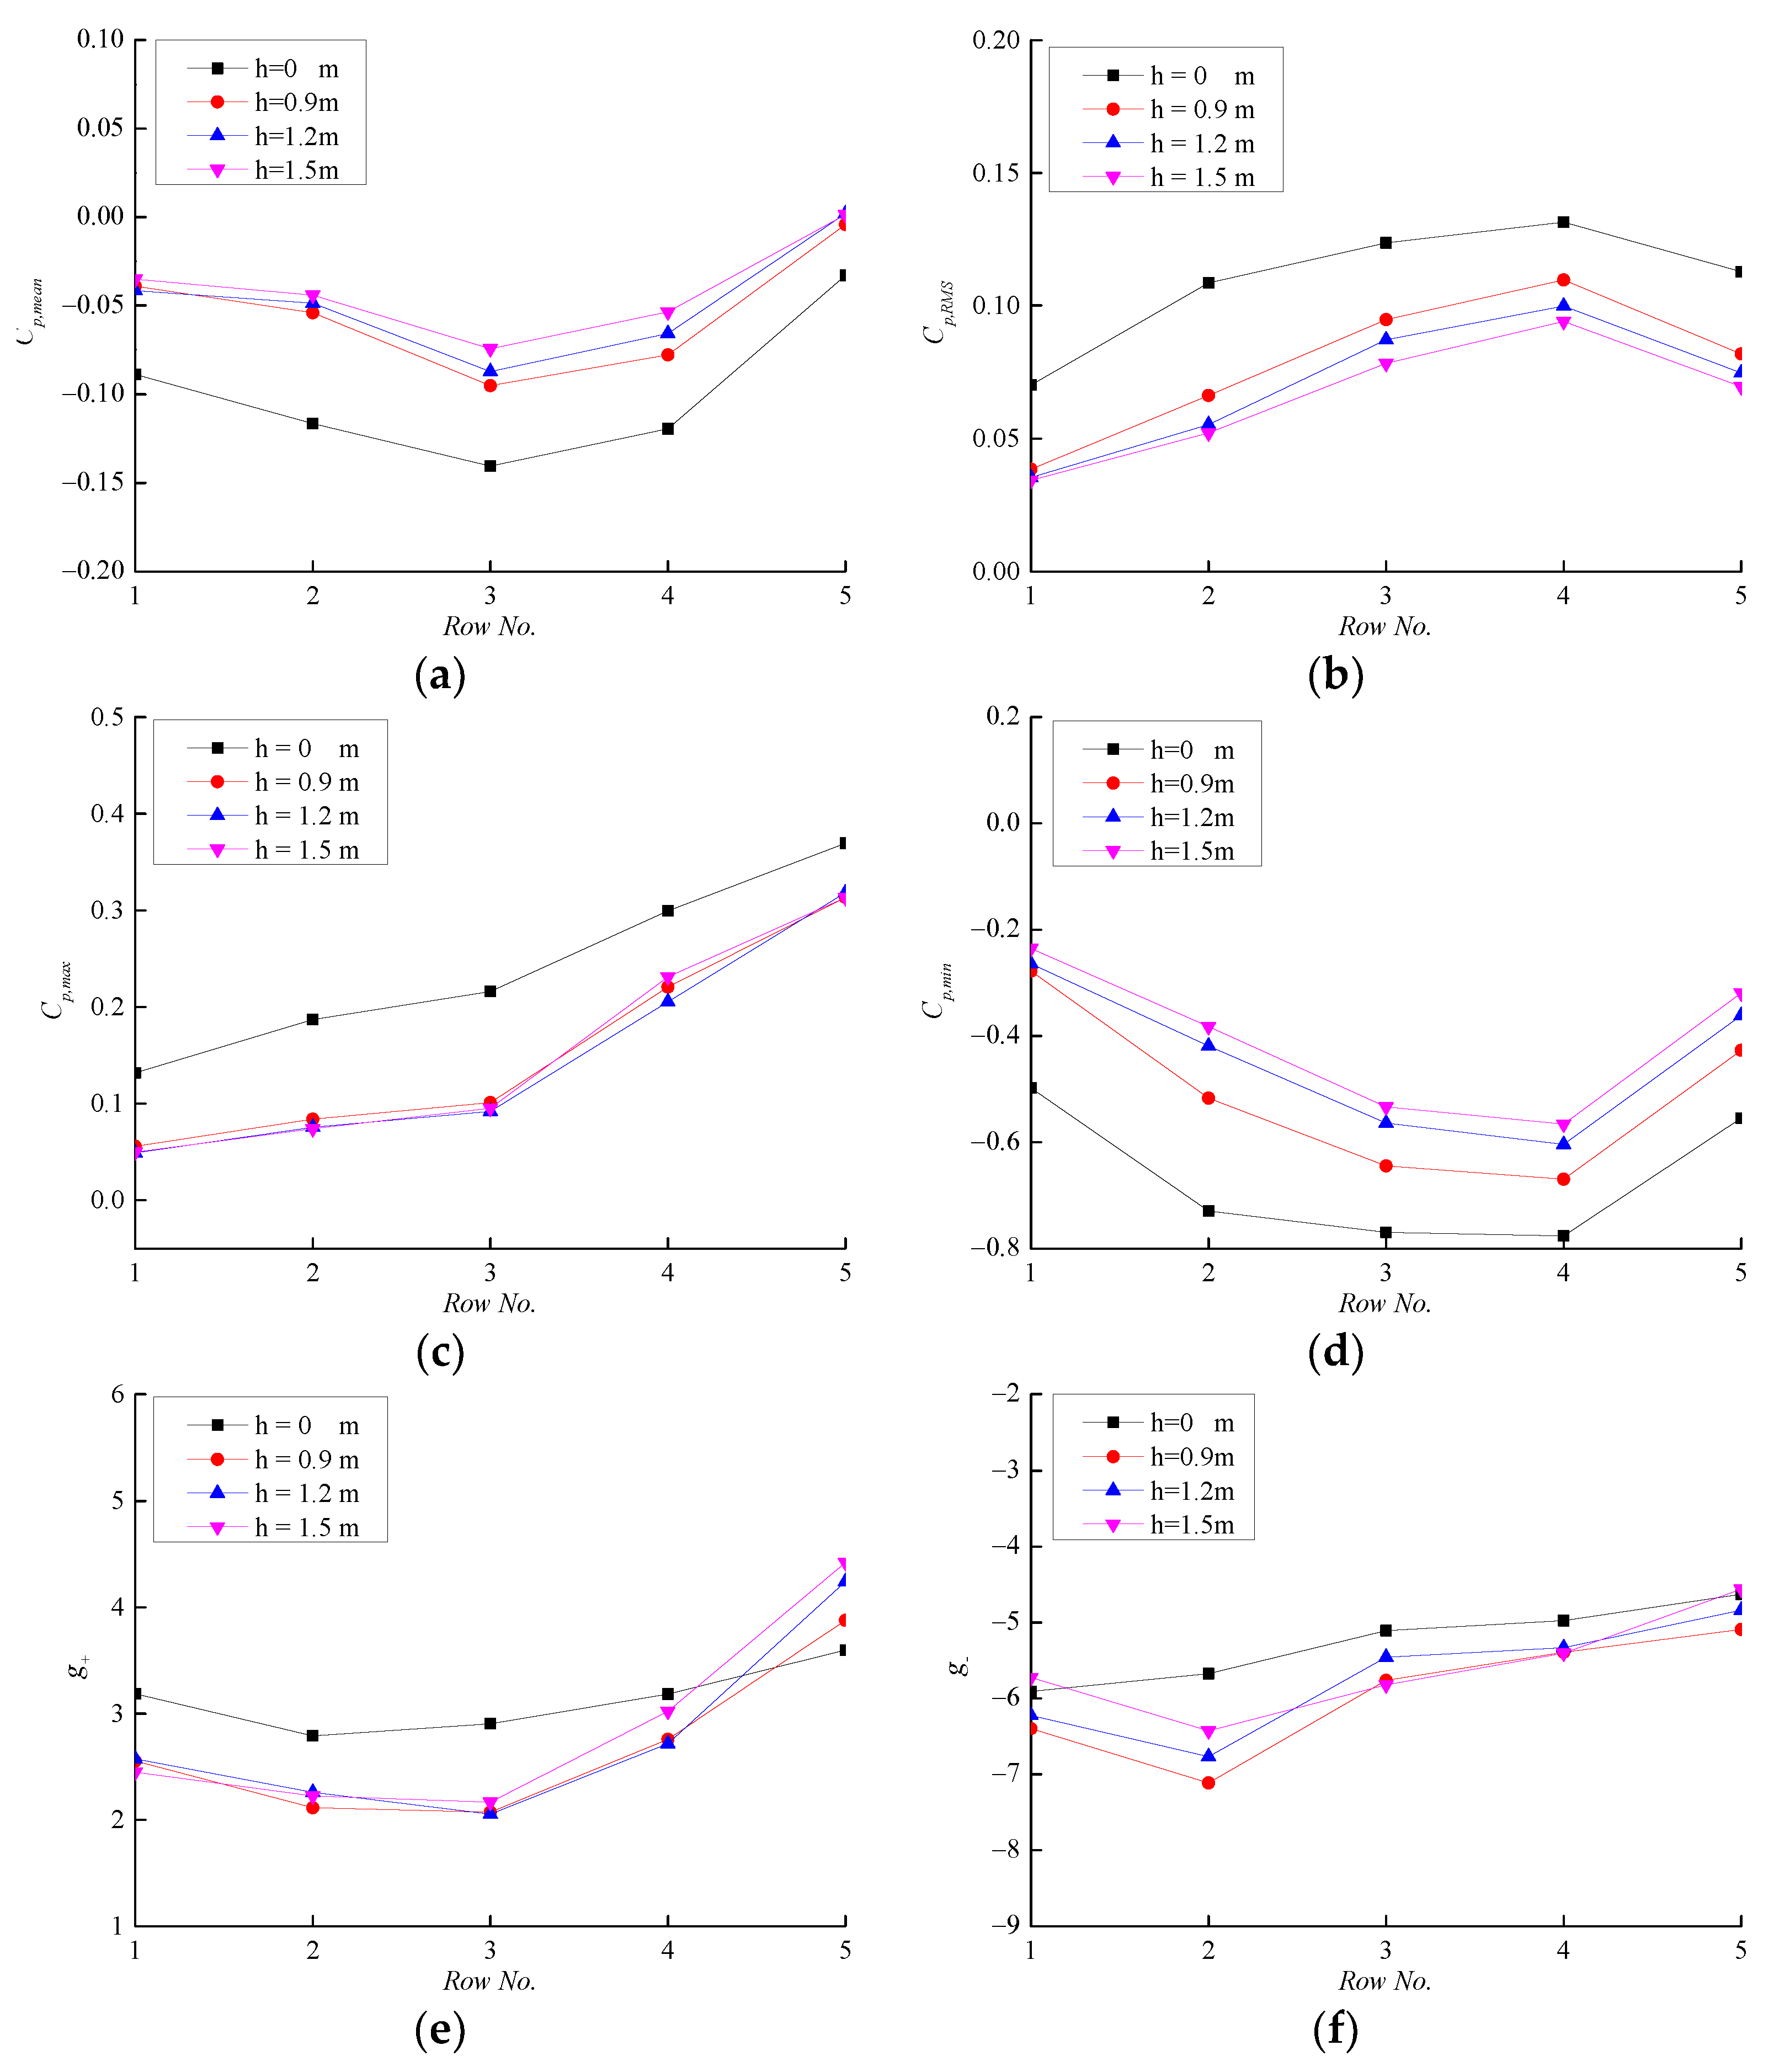
The mean, standard deviation, maximum and minimum peak pressure coefficient, positive and negative peak factor within a row for a wind direction of 0° with a tilt angle of 10° and parapet height h = 0 m, 0.9 m, 1.2 m and 1.5 m, are depicted in Figure 14. As Shown in Figure 14, the parapet height has a perceptible influence on the six statistics at this azimuth. Compared to a parapet height of 0 m, the magnitudes of the mean, standard deviation, maximum and minimum peak coefficient drop quickly with a parapet height of 0.9 m. The mean pressure coefficients drop by about 50% in Row 1#–2#, about 30% in Row 3#–4#, and by about 80% in Row 5#. The maximum peak pressure coefficients drop by about 50% in Row 1#–3#, and by about 20% in Row 4#–5#. The minimum peak pressure coefficients drop by about 40% in Row 1#, and by about 20% in Row 2#–5#. However, the characteristics of peak factors are quite different. Compared to the parapet height of 0 m, the magnitudes are smaller for positive values, but larger for negative values. It indicates that although the total wind loads acting on the panel arrays are weakened because of the shading effect of the parapet, the flow’s turbulence is strengthened, leading to a more complex wind field. The magnitudes of the six statistics in Figure 14 decrease a little with the increase of the parapet height (i.e., h = 1.2/1.5), therefore the arrays can be occluded by a 0.9 heighted parapet. When the arrays are occluded by the parapet, it is not quite efficient to decrease wind loads on the panel array despite increasing the parapet height.
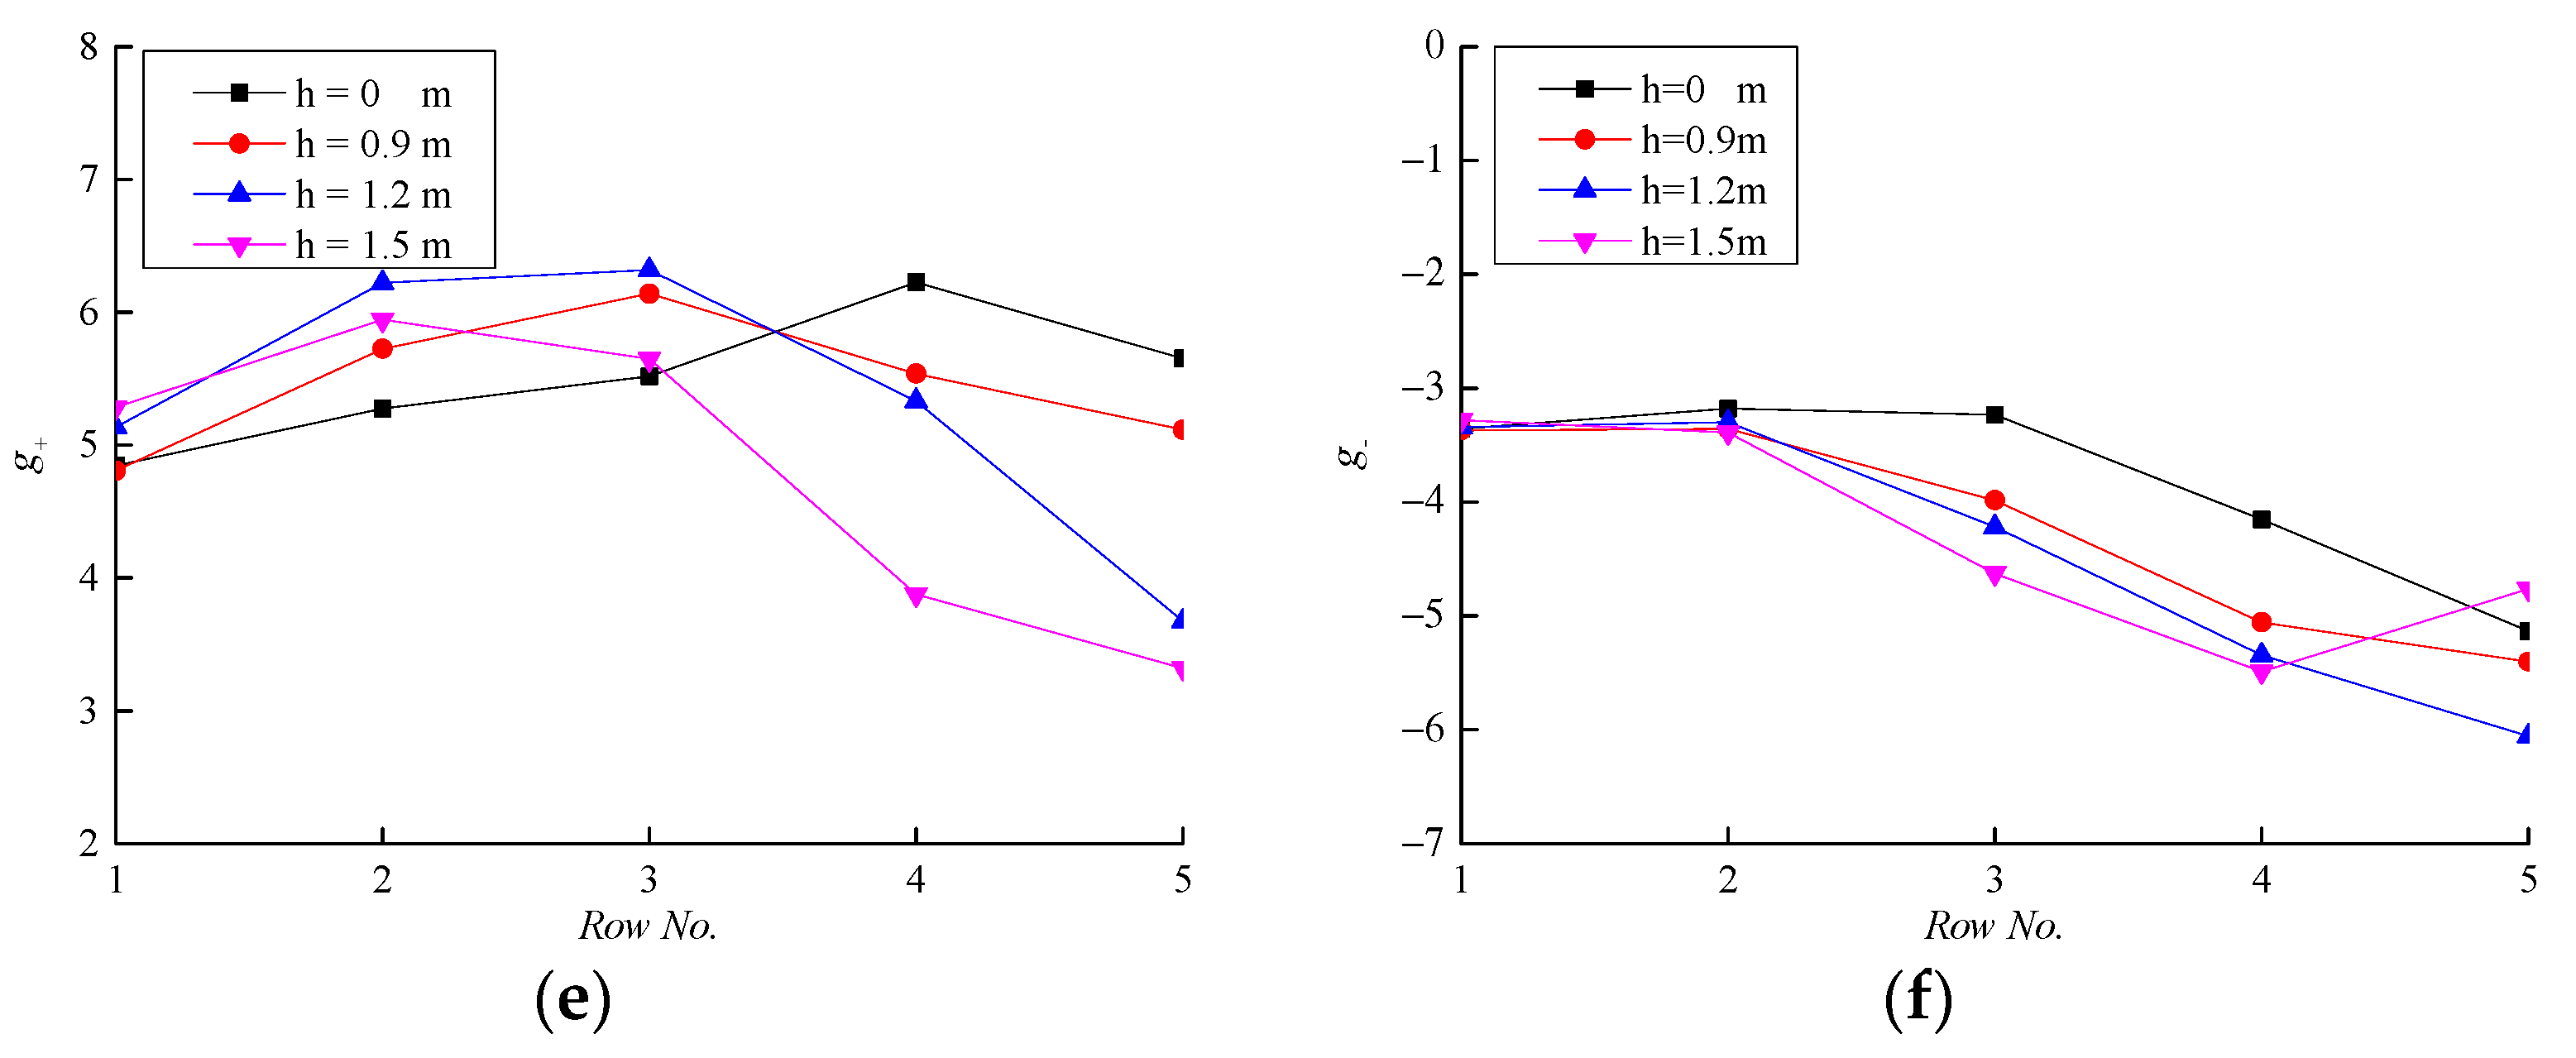
The effect of the parapet height at 180° is similar with that at 0°, as shown in Figure 15.

4.1.2. Effect of Tilt Angle

The mean, standard deviation, maximum and minimum peak pressure coefficient within units in the five rows with a tilt angle of 5° and a parapet height of 0 m at 0° and 180° azimuth are displayed in Figure 16 and Figure 17, respectively. The characteristics of these statistics are basically consistent with those values with a tilt angle of 10° (see Figure 5, Figure 7, Figure 9 and Figure 11). This indicates that when the solar panel is installed almost horizontally, the statistics of the aerodynamic load change very little with the tilt angle. So, it is reasonable that the shape factor, which is calculated from the mean pressure coefficient, remains the same when the tilt angle is less than 15° in the Chinese standard NB/T 10115-2018 [22].

4.2. 90° and 270° Wind Directions

When the wind approaches the panel arrays at other wind directions, they will experience a non-uniform wind exposure over their lateral width and hence the pressure distribution is non-symmetric. This effect will be studied at two perpendicular wind directions of 90° and 270°, and an oblique wind direction of 45°. The latter will be discussed in Section 4.3.
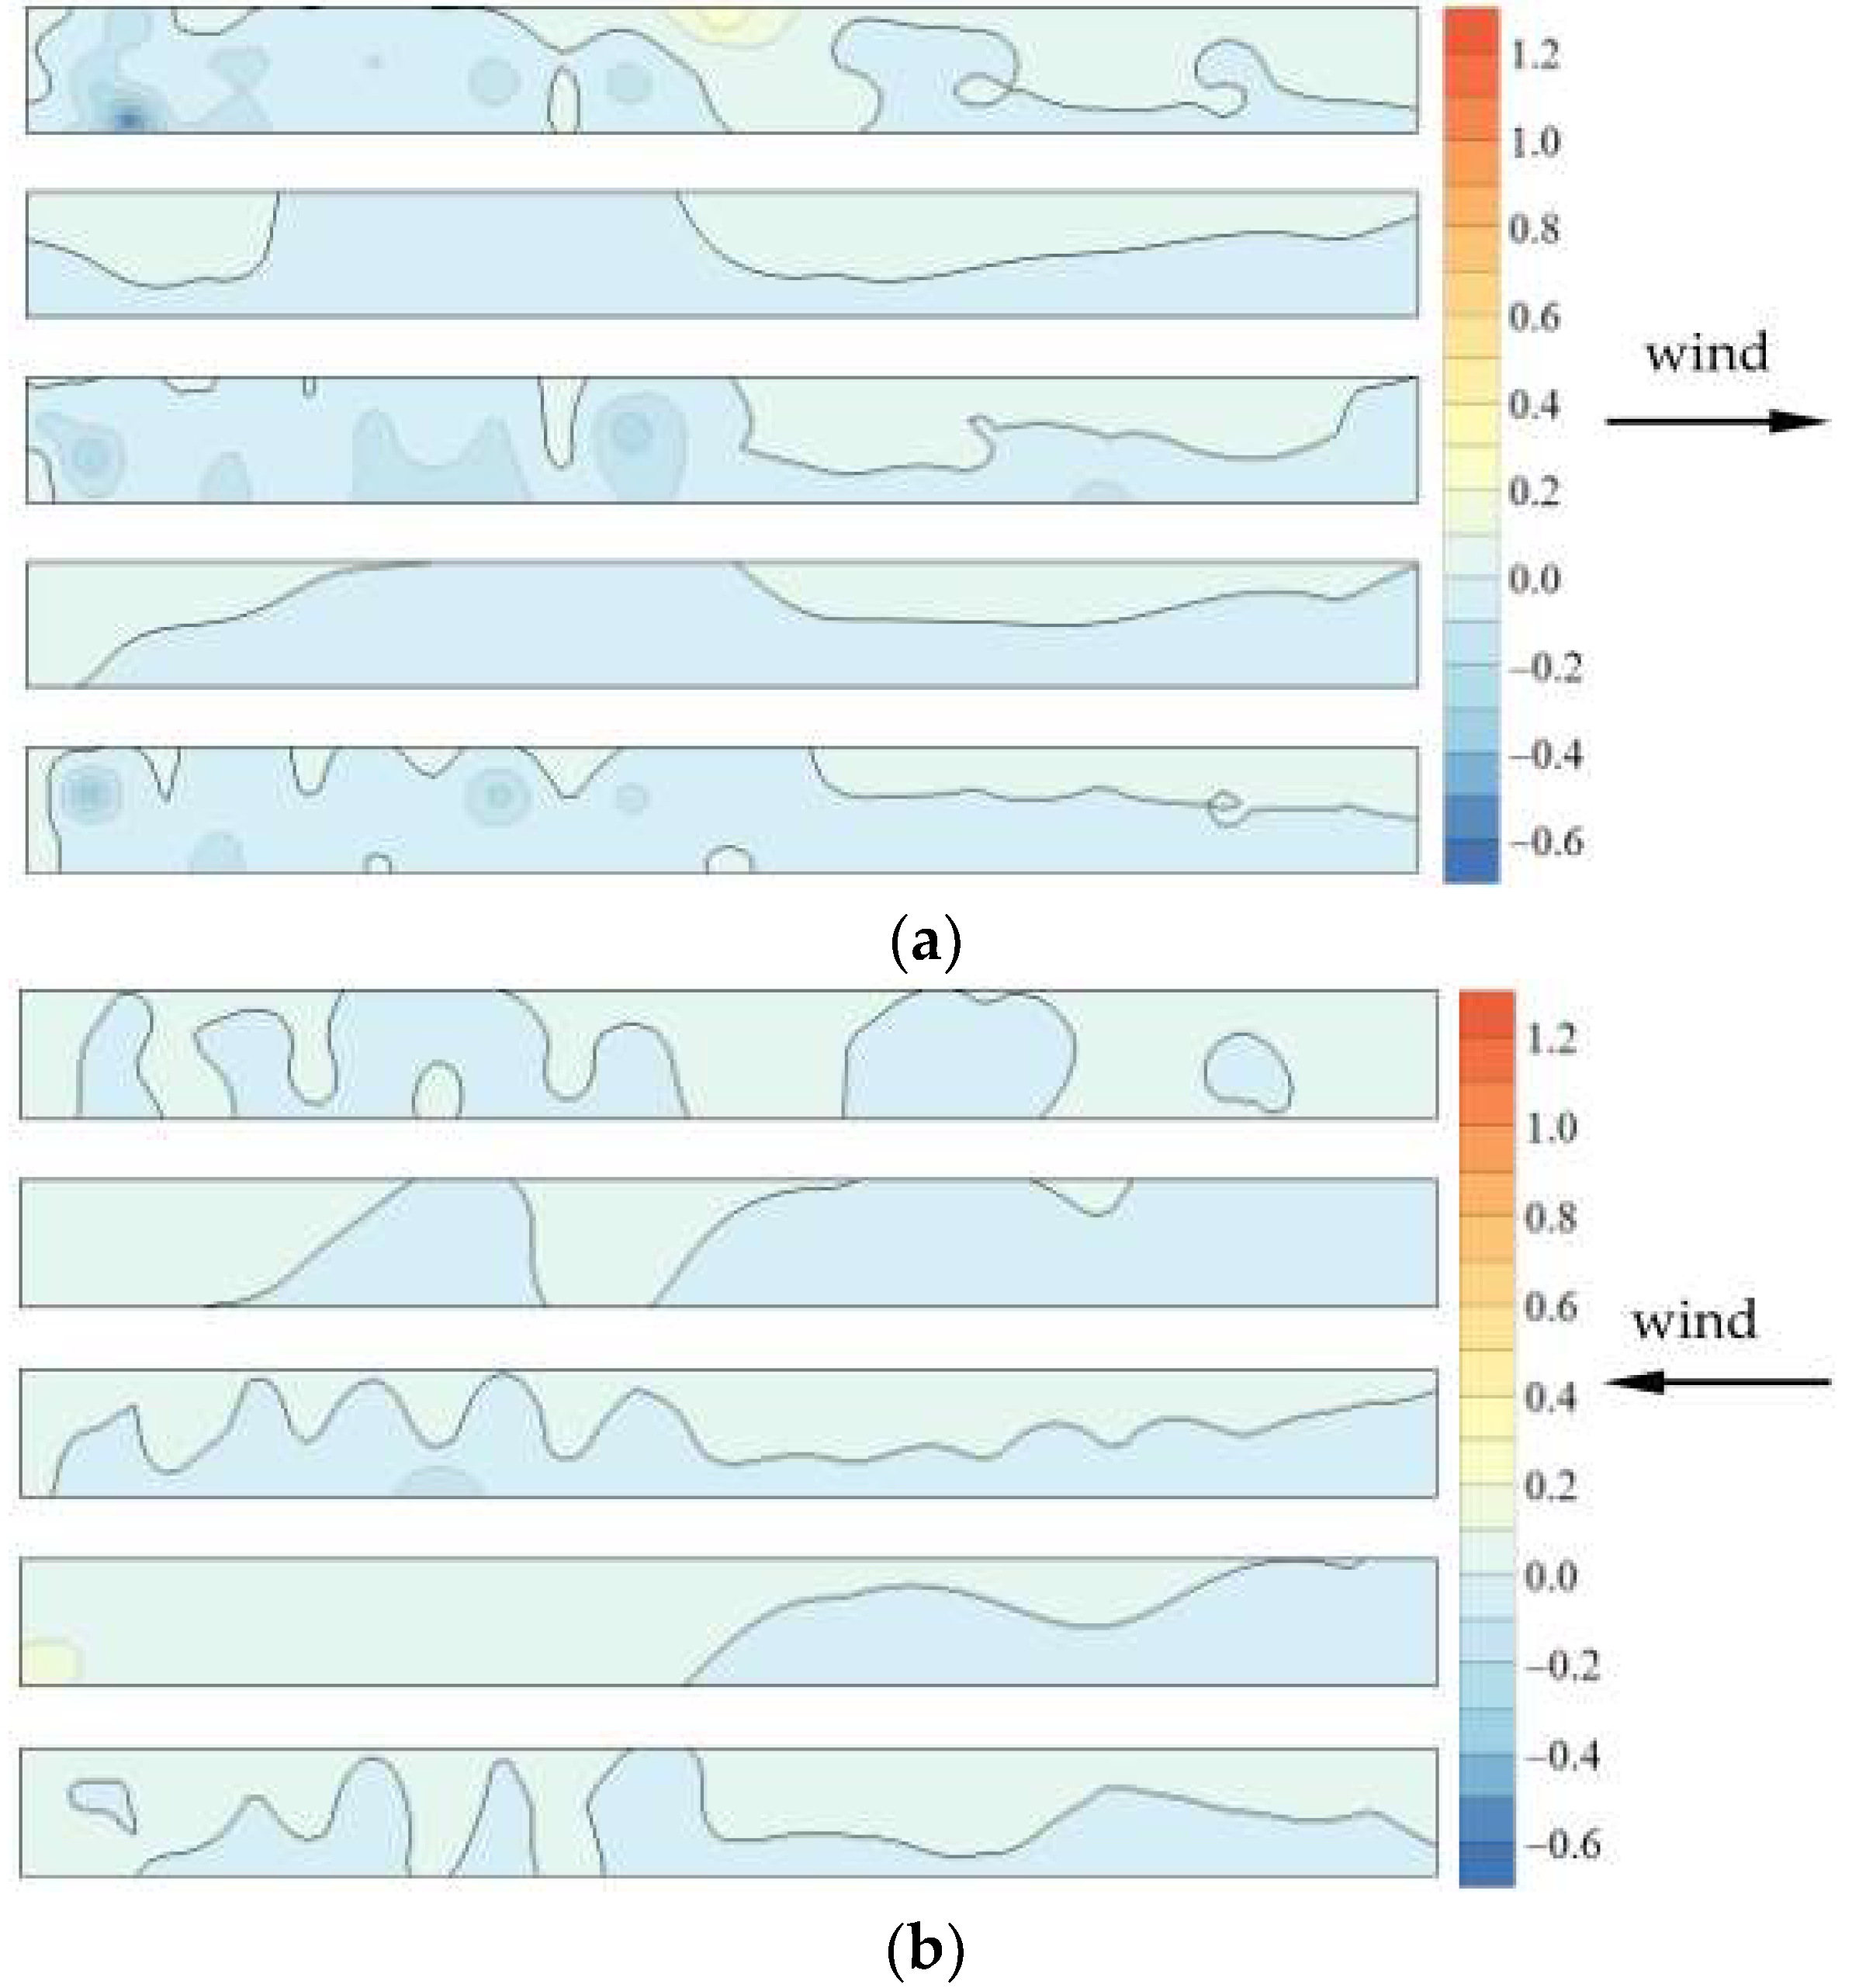
The contour plots of the net pressure Δ C p on the module surface for the wind direction of 90° and 270° with a tilt angle of 10° and a parapet height of 0 m are shown in Figure 18. The net pressures at five rows are similar and relatively uniform at these azimuthes, as the panel arrays installed along with the wind flow have the same geometric shape and similar surroundings.
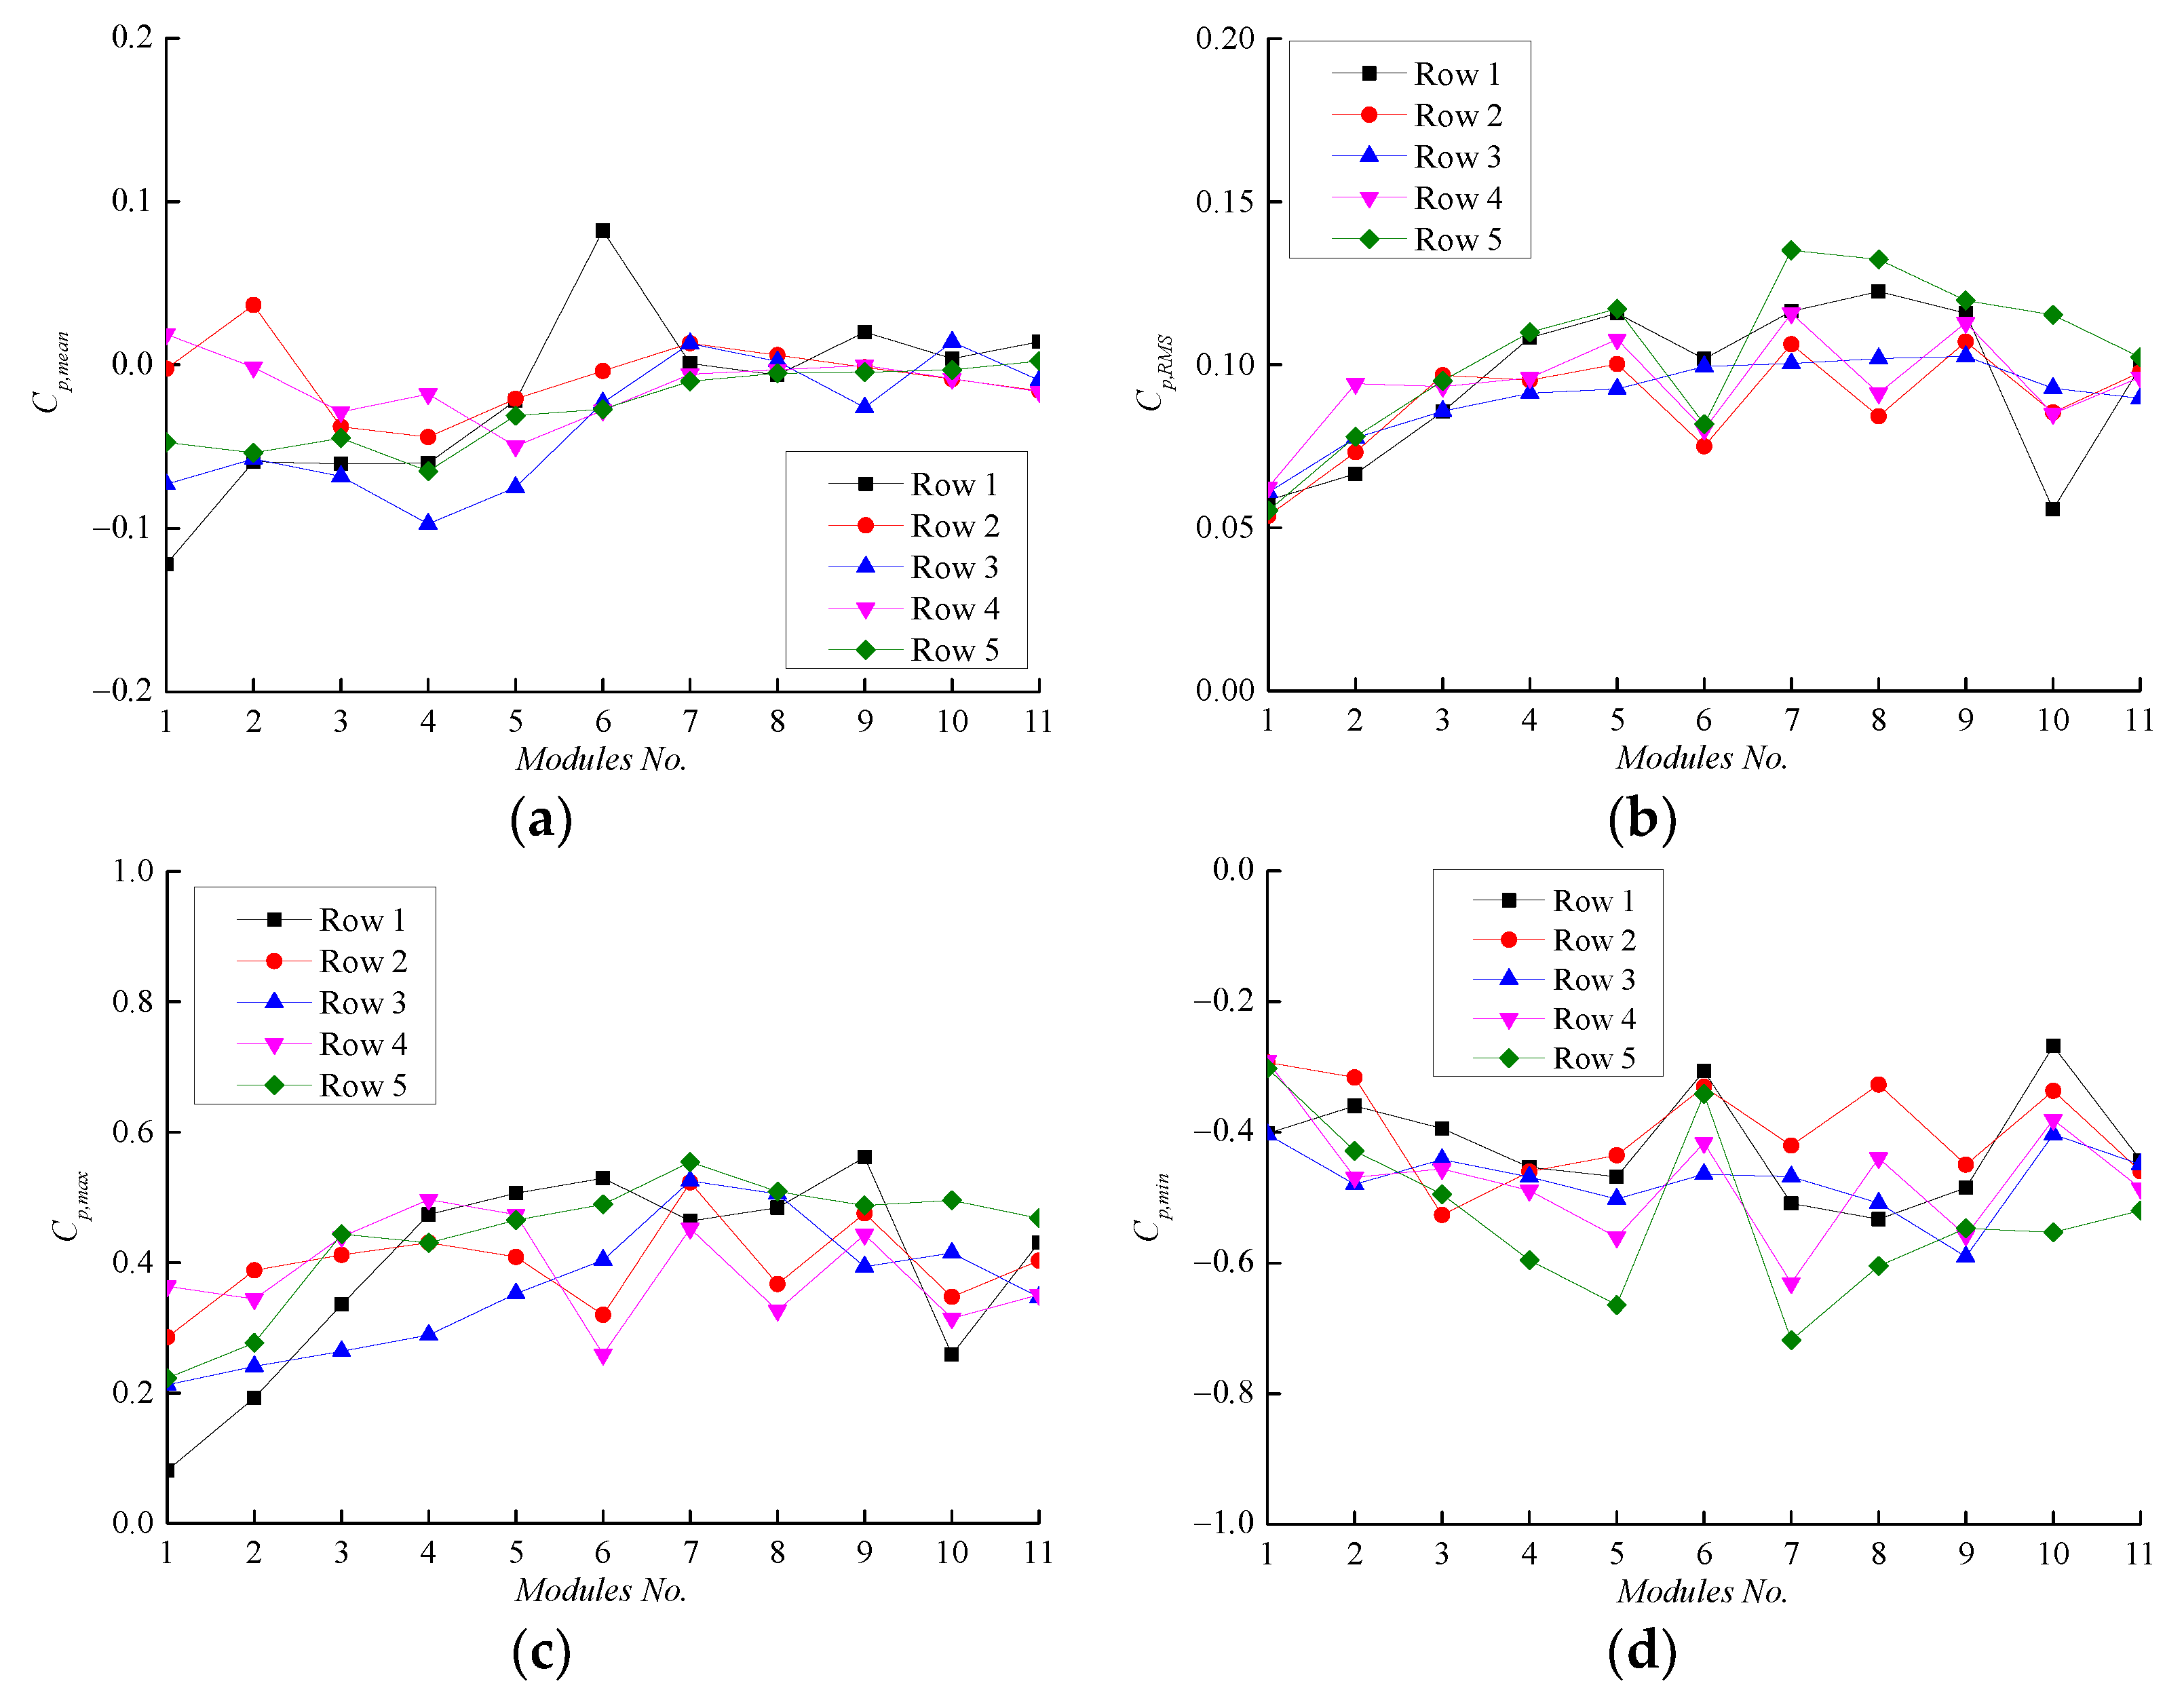
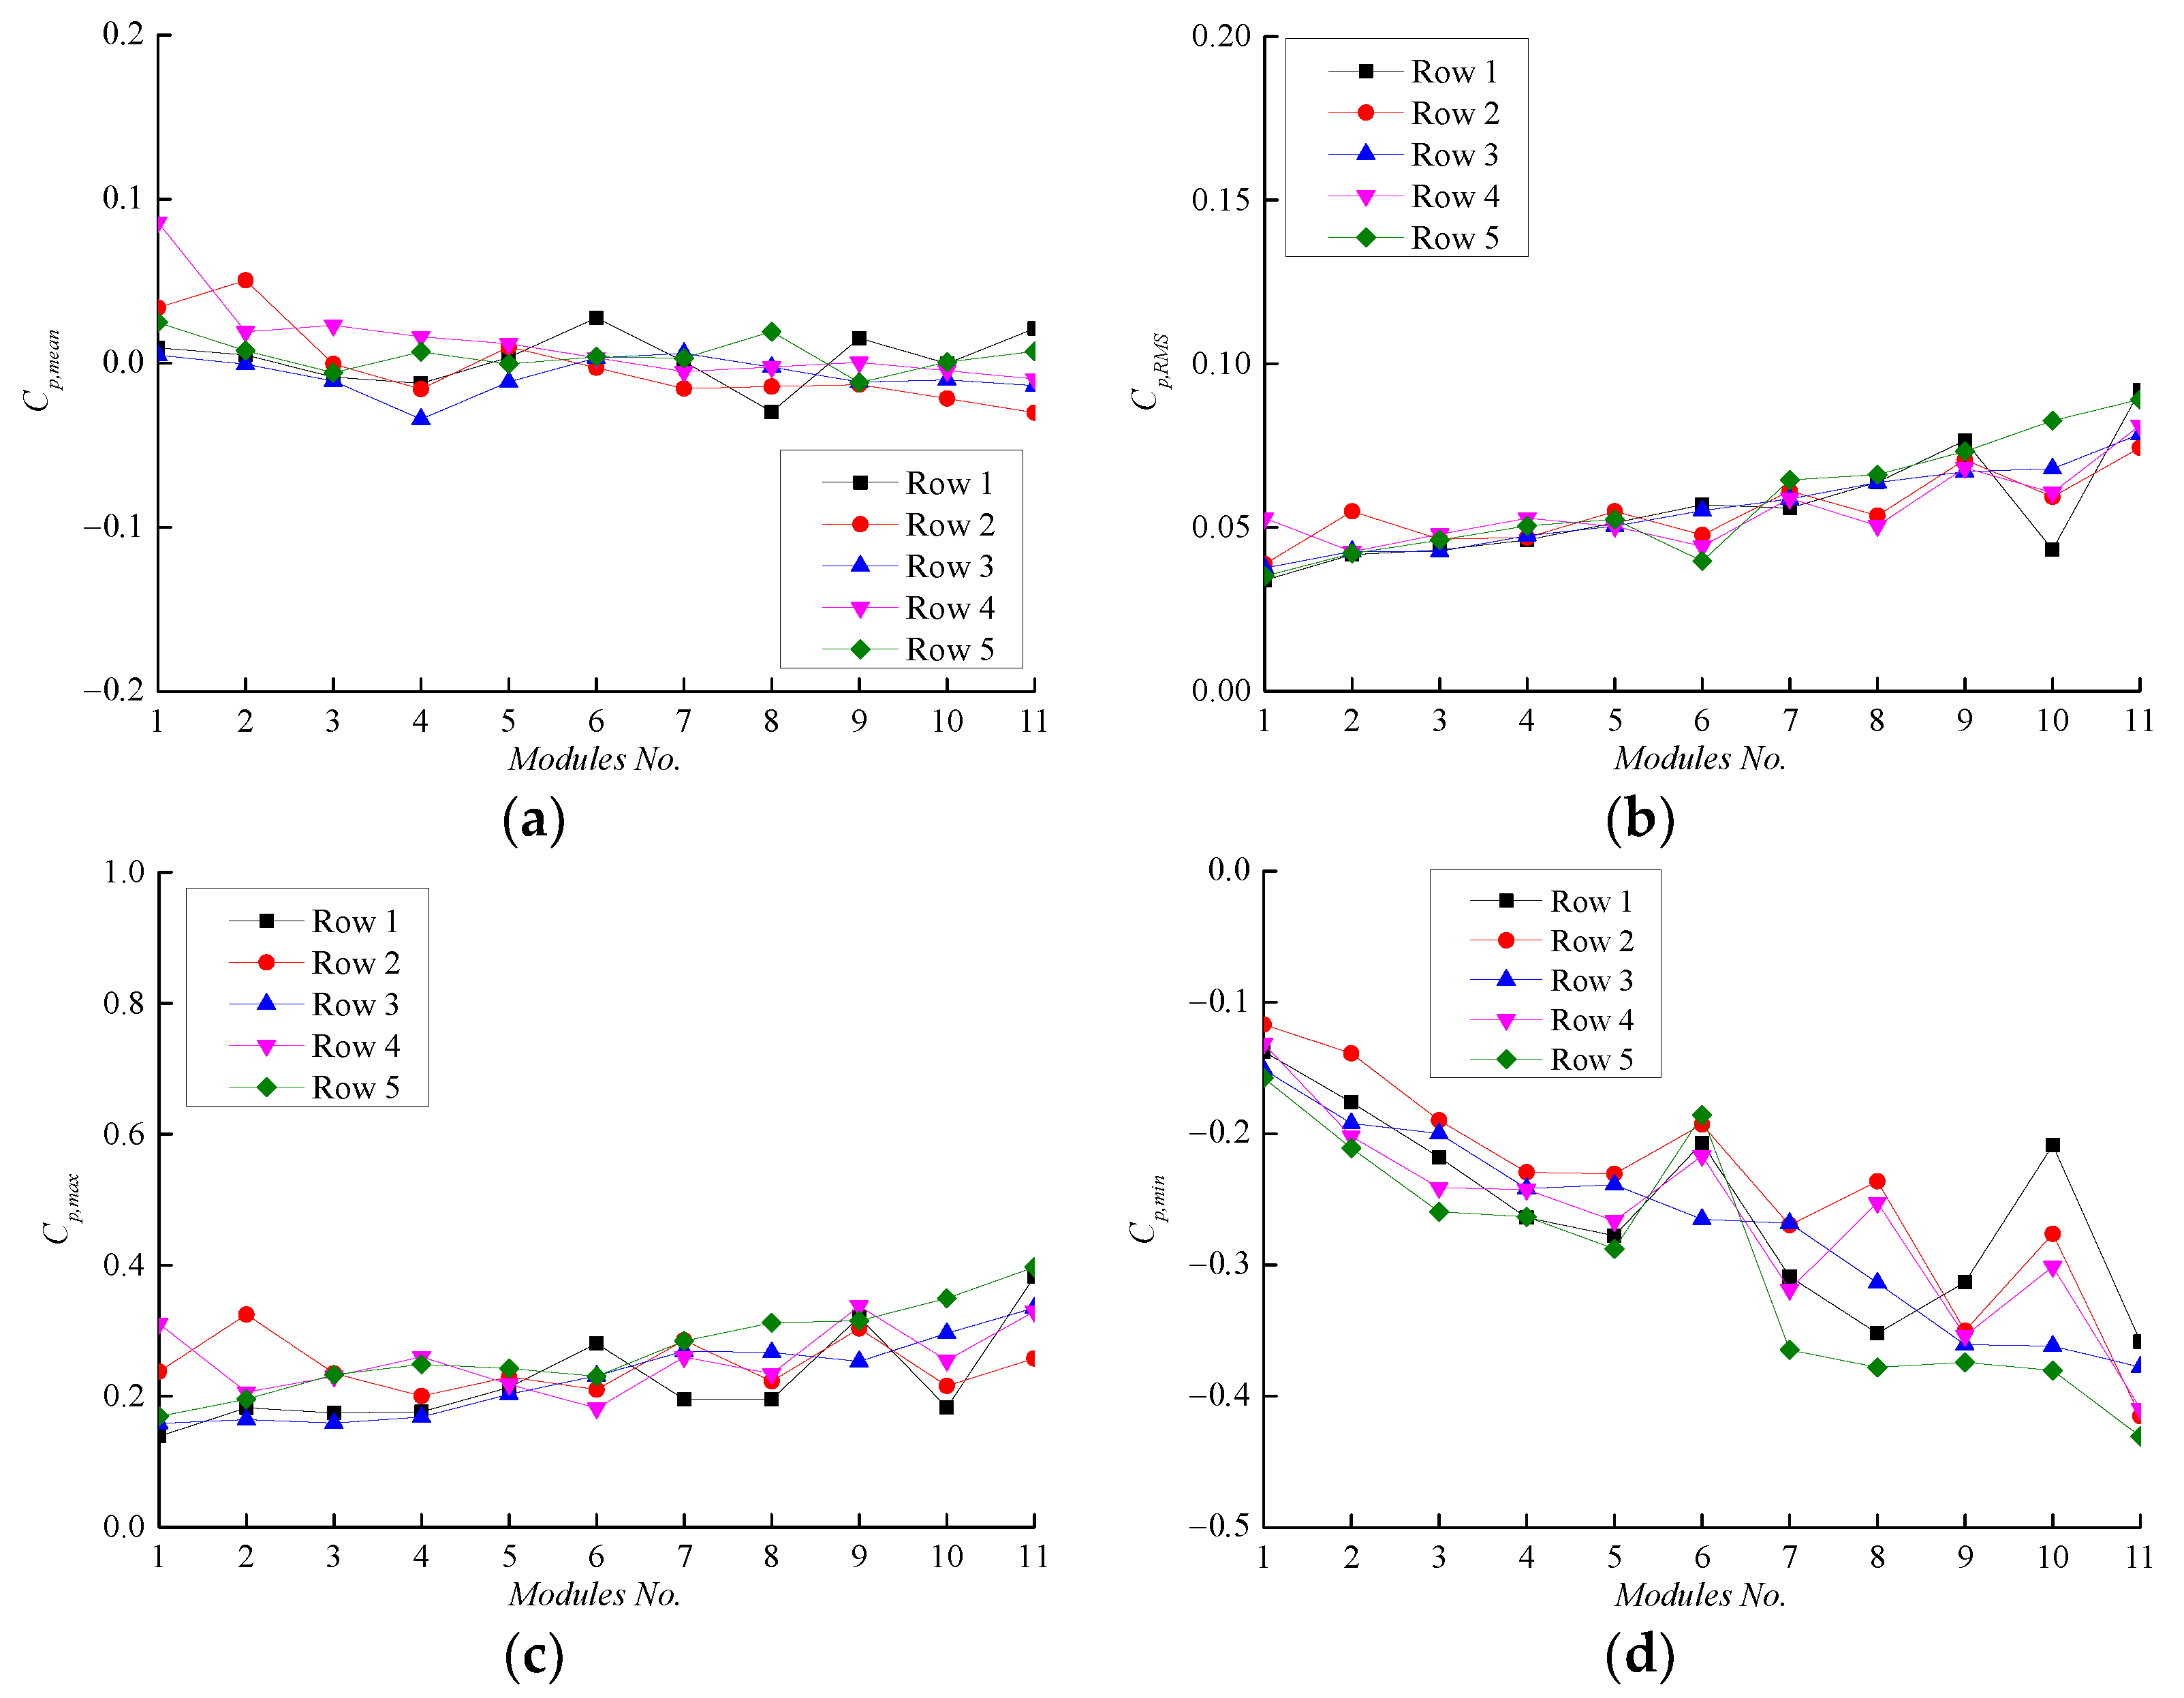
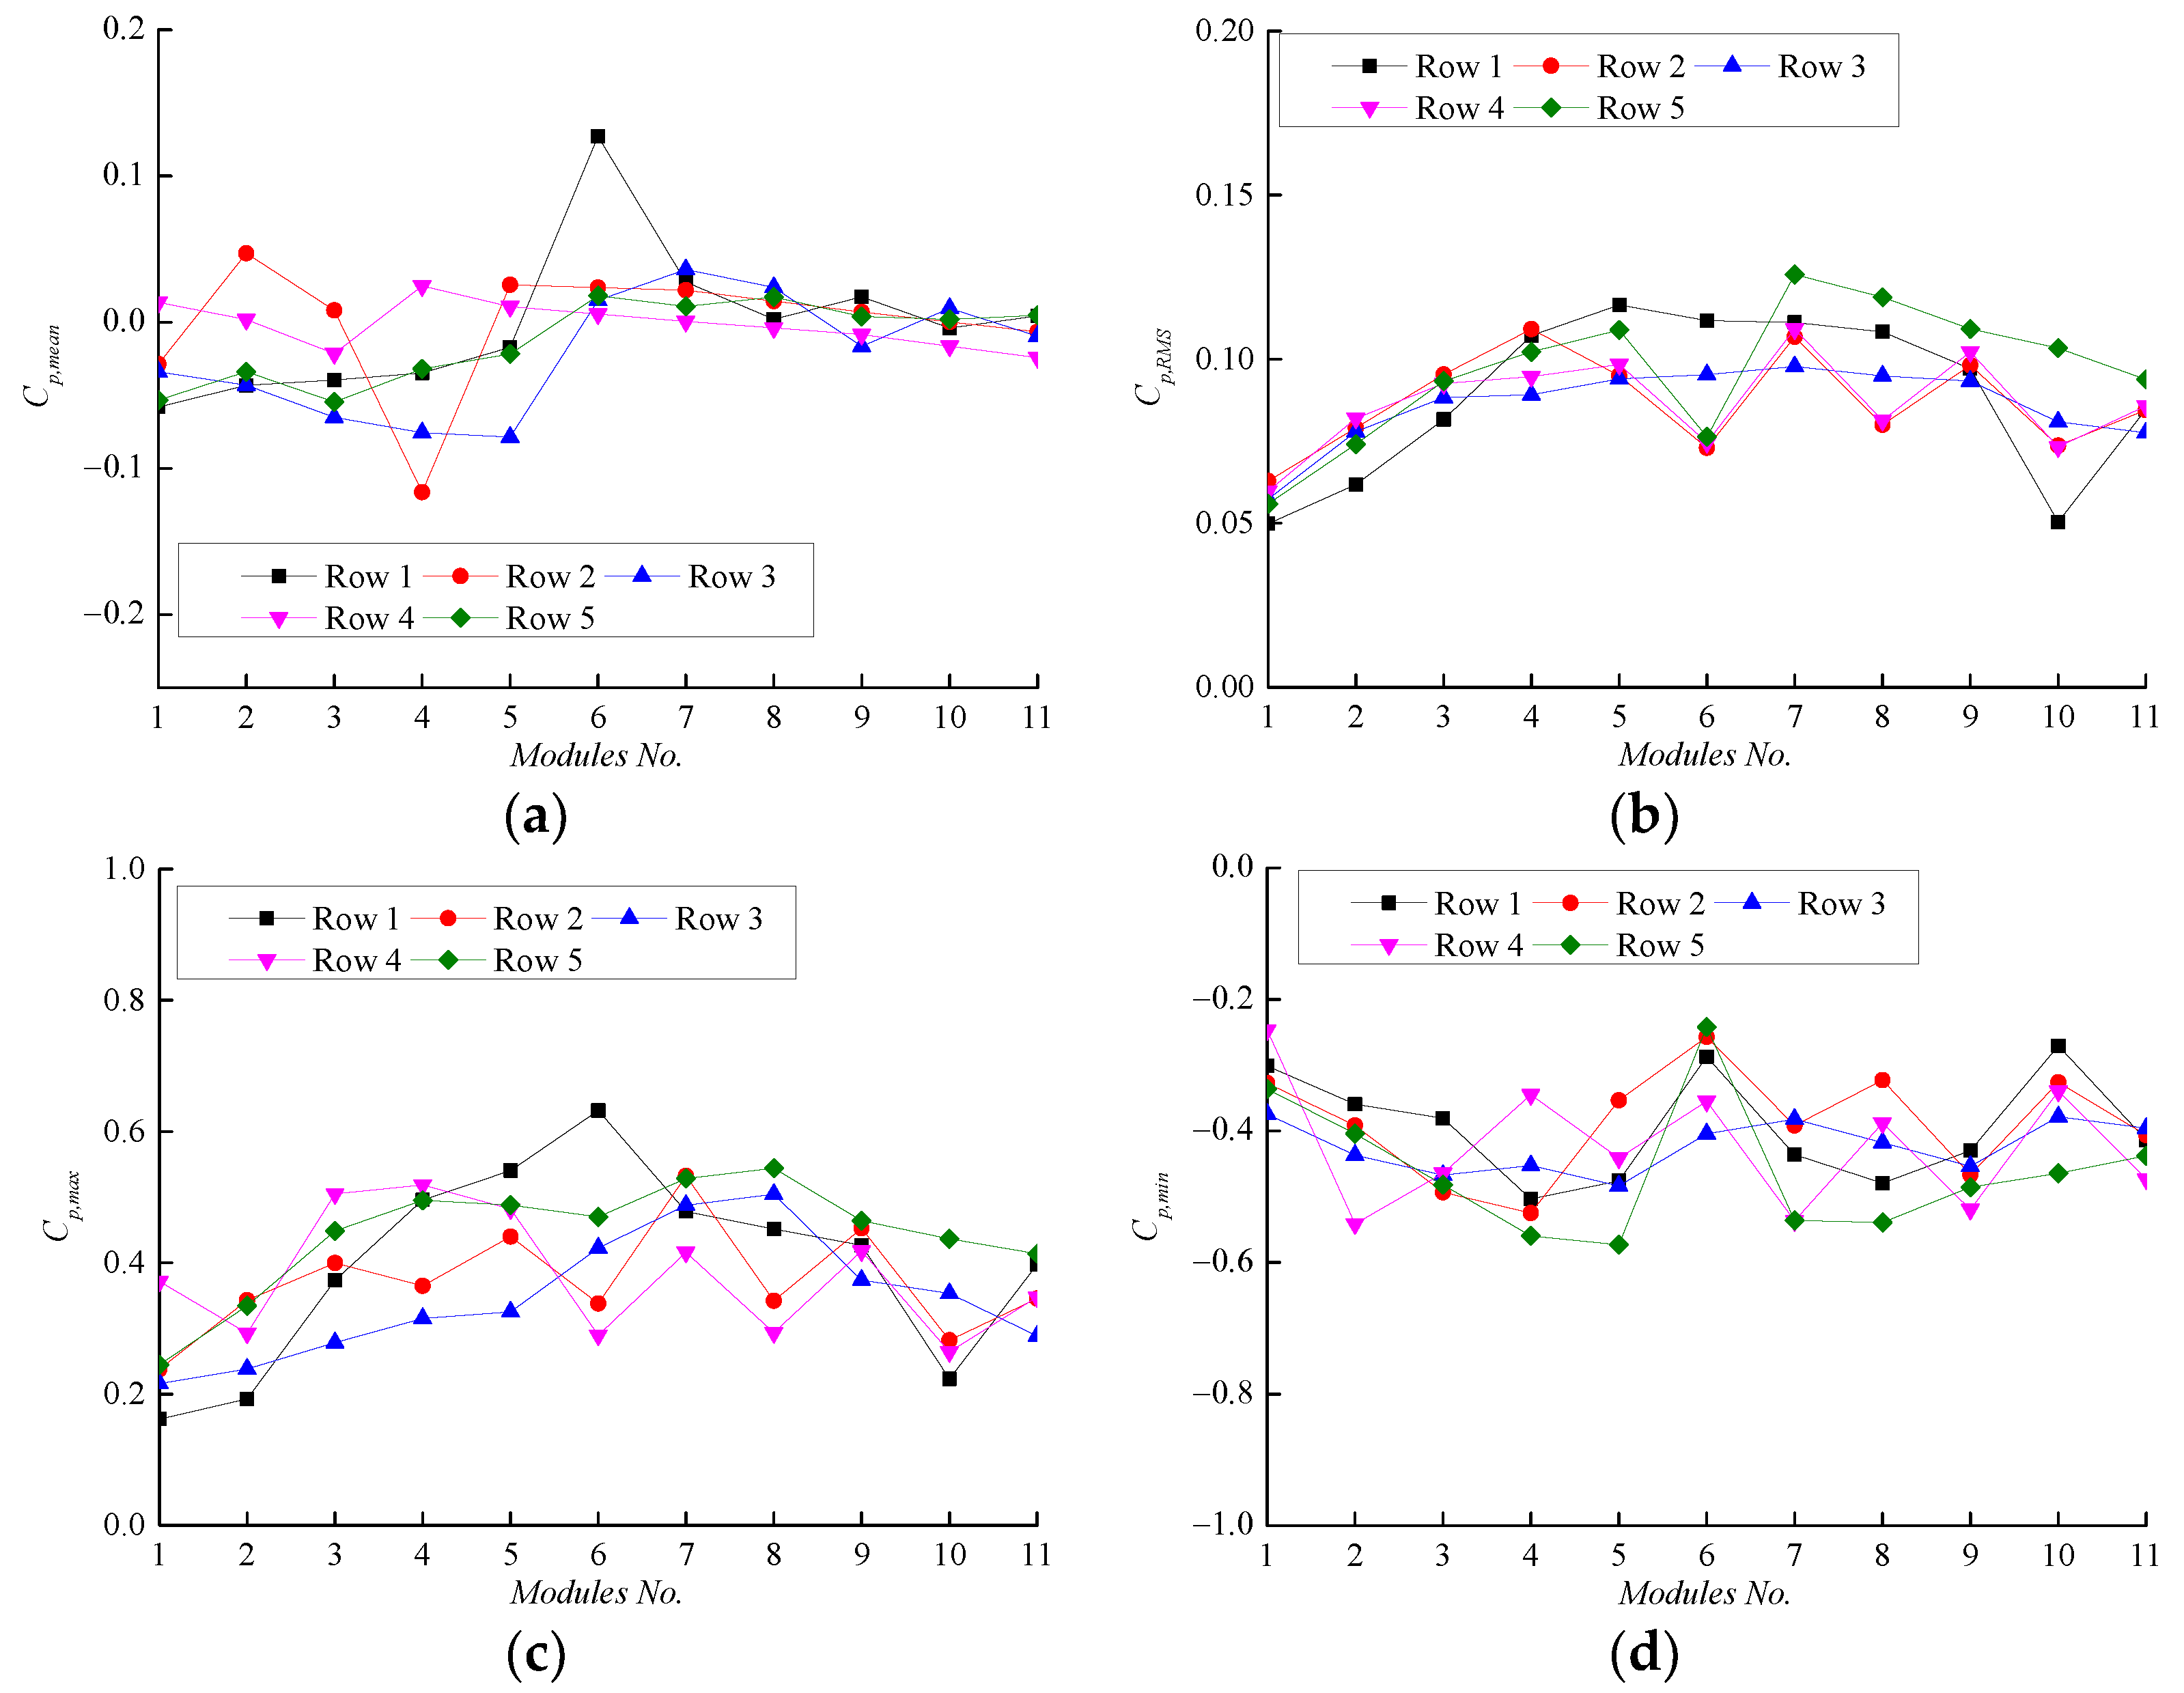
The mean, standard deviation, maximum and minimum peak pressure coefficient for units in five rows with a tilt angle of 10° and a parapet height of 0 m at 90° and 270° azimuth are displayed in Figure 19 and Figure 20, respectively. The mean pressure coefficients for units in five rows are relatively constant at a value of 0 (see Figure 19a and Figure 20a). This may be because the wind-induced pressures on the upper and lower surfaces of the thin solar panels reverse equally. The standard deviations are larger in the middle but smaller at both ends (see Figure 19b and Figure 20b), as the turbulence is stronger between the panel arrays but weaker at the edge of the roof. The maximum (see Figure 19c and Figure 20c) and minimum (see Figure 19d and Figure 20d) peak pressure coefficients at 90° and 270° have similar characteristics with standard deviations, for that in Equation (7a–c) the means are small enough to be considered negligible.

4.2.1. Effect of Parapet Height

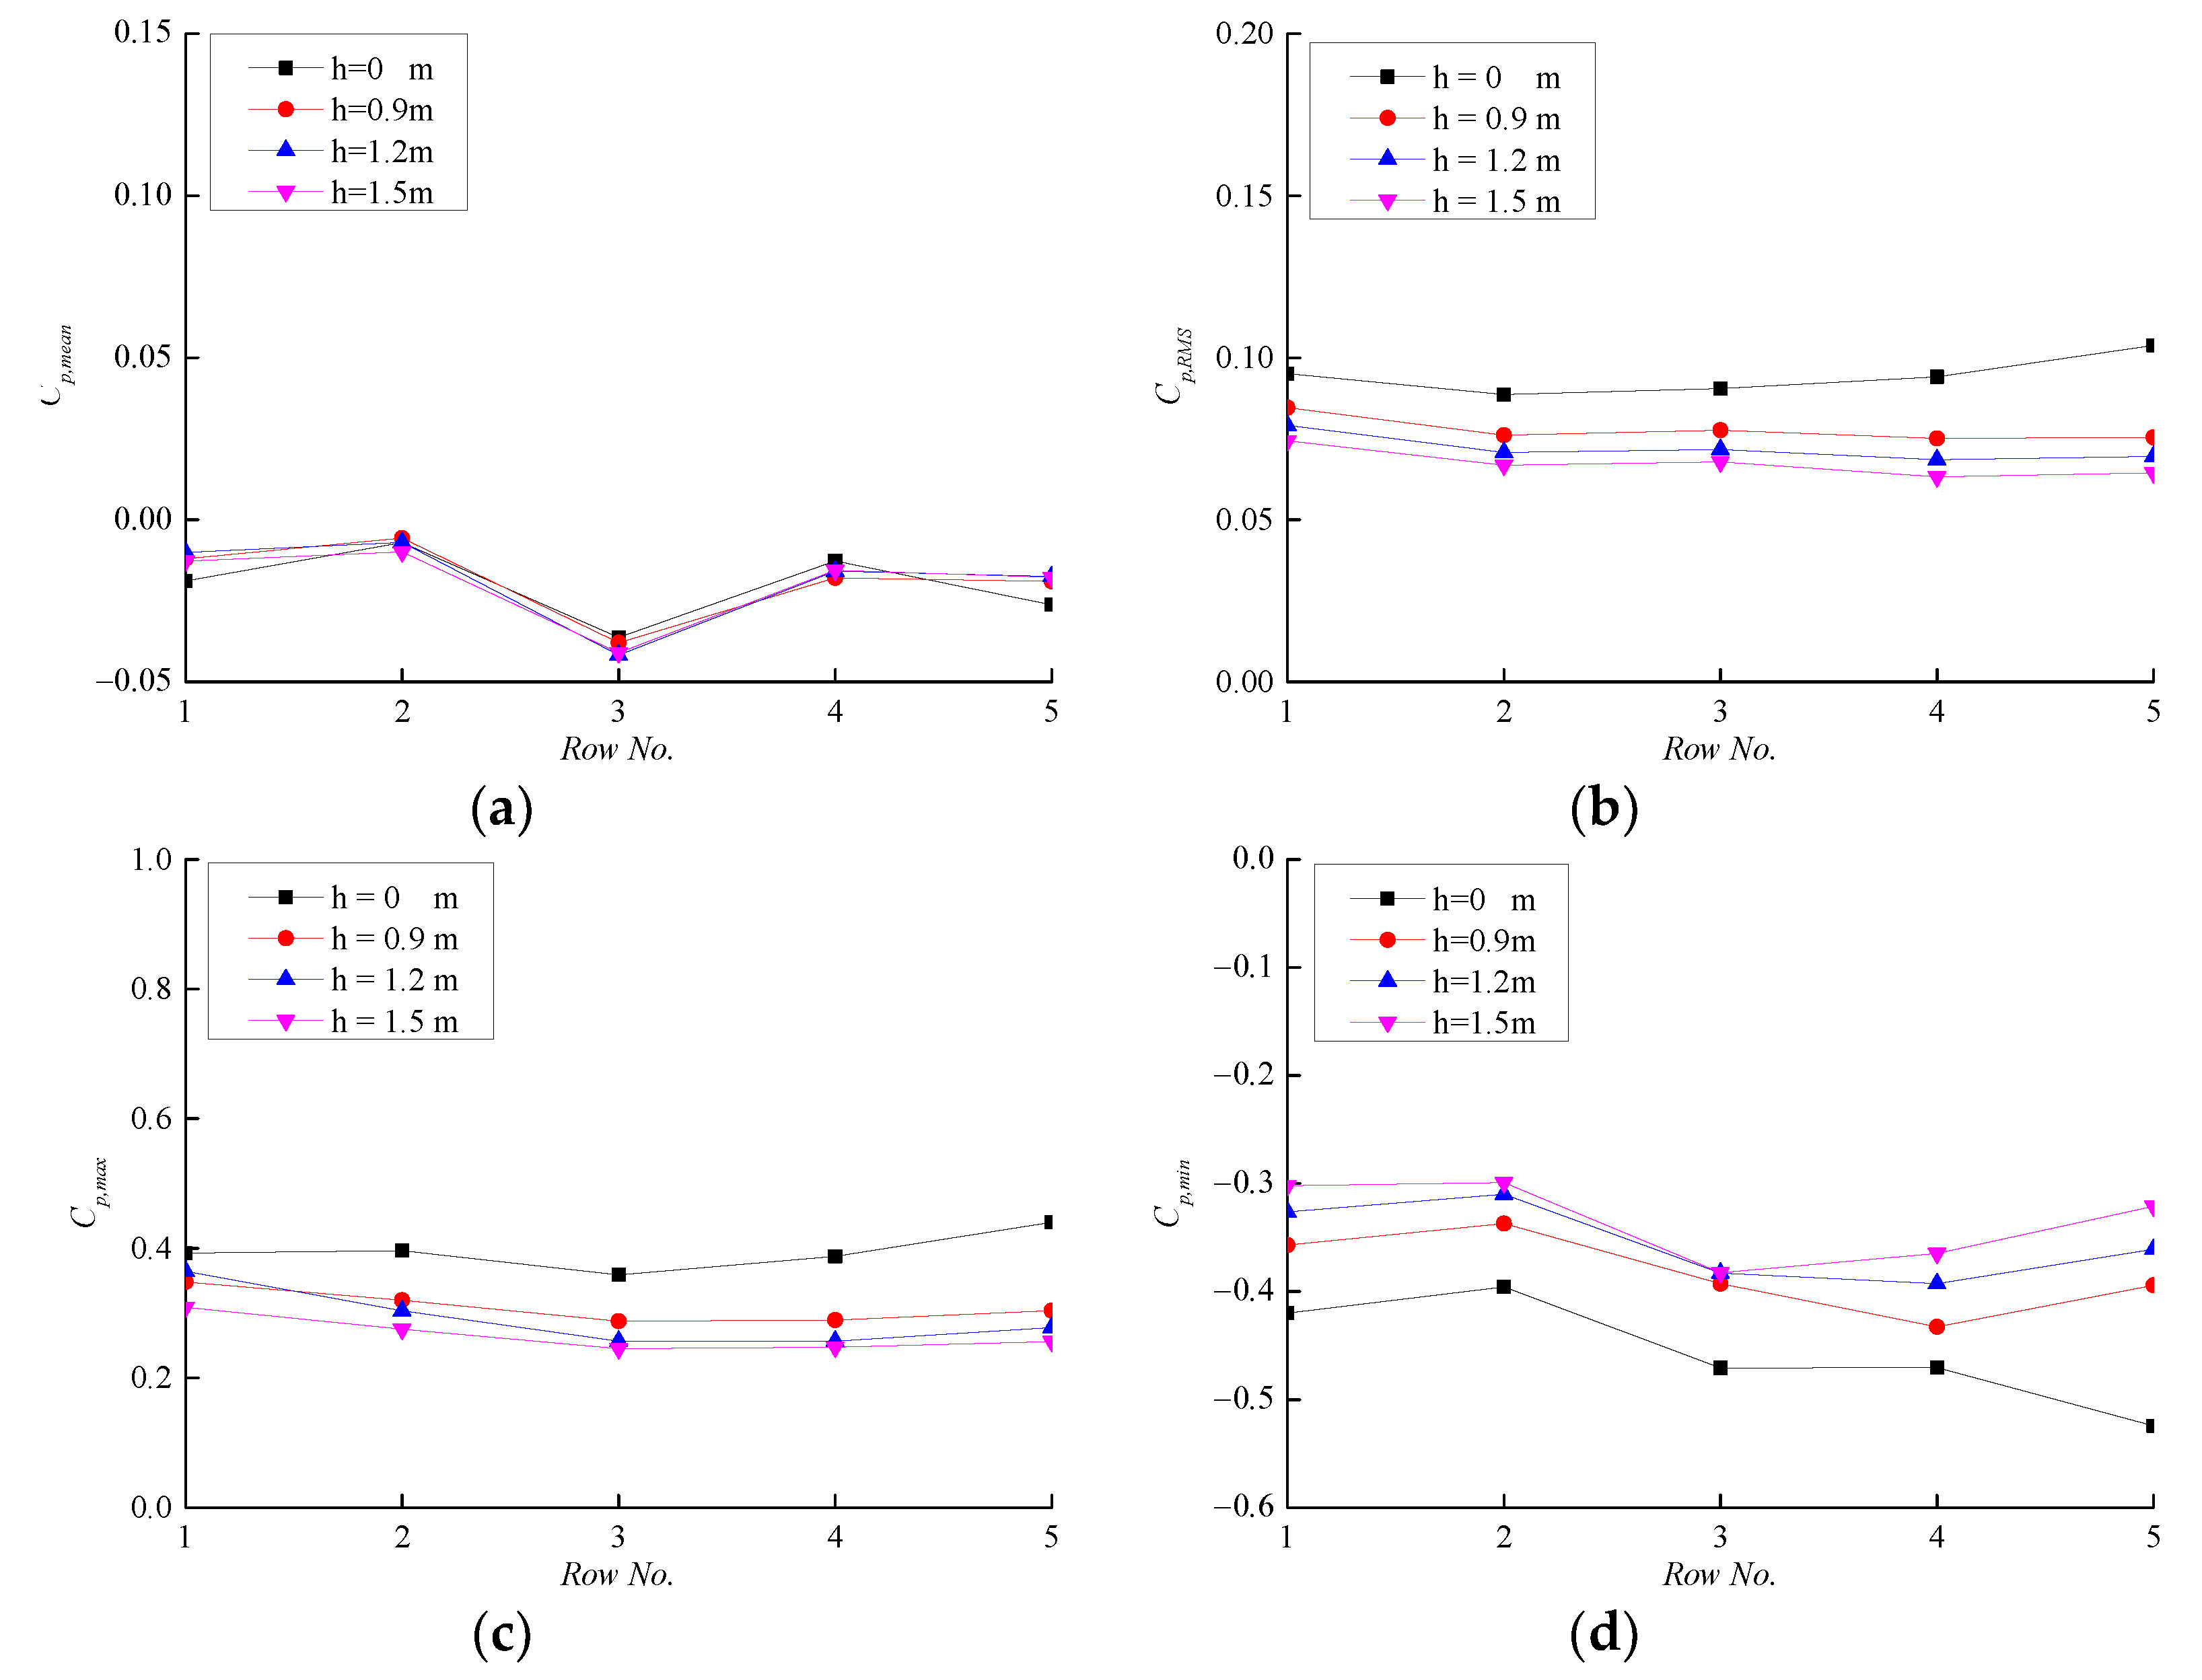
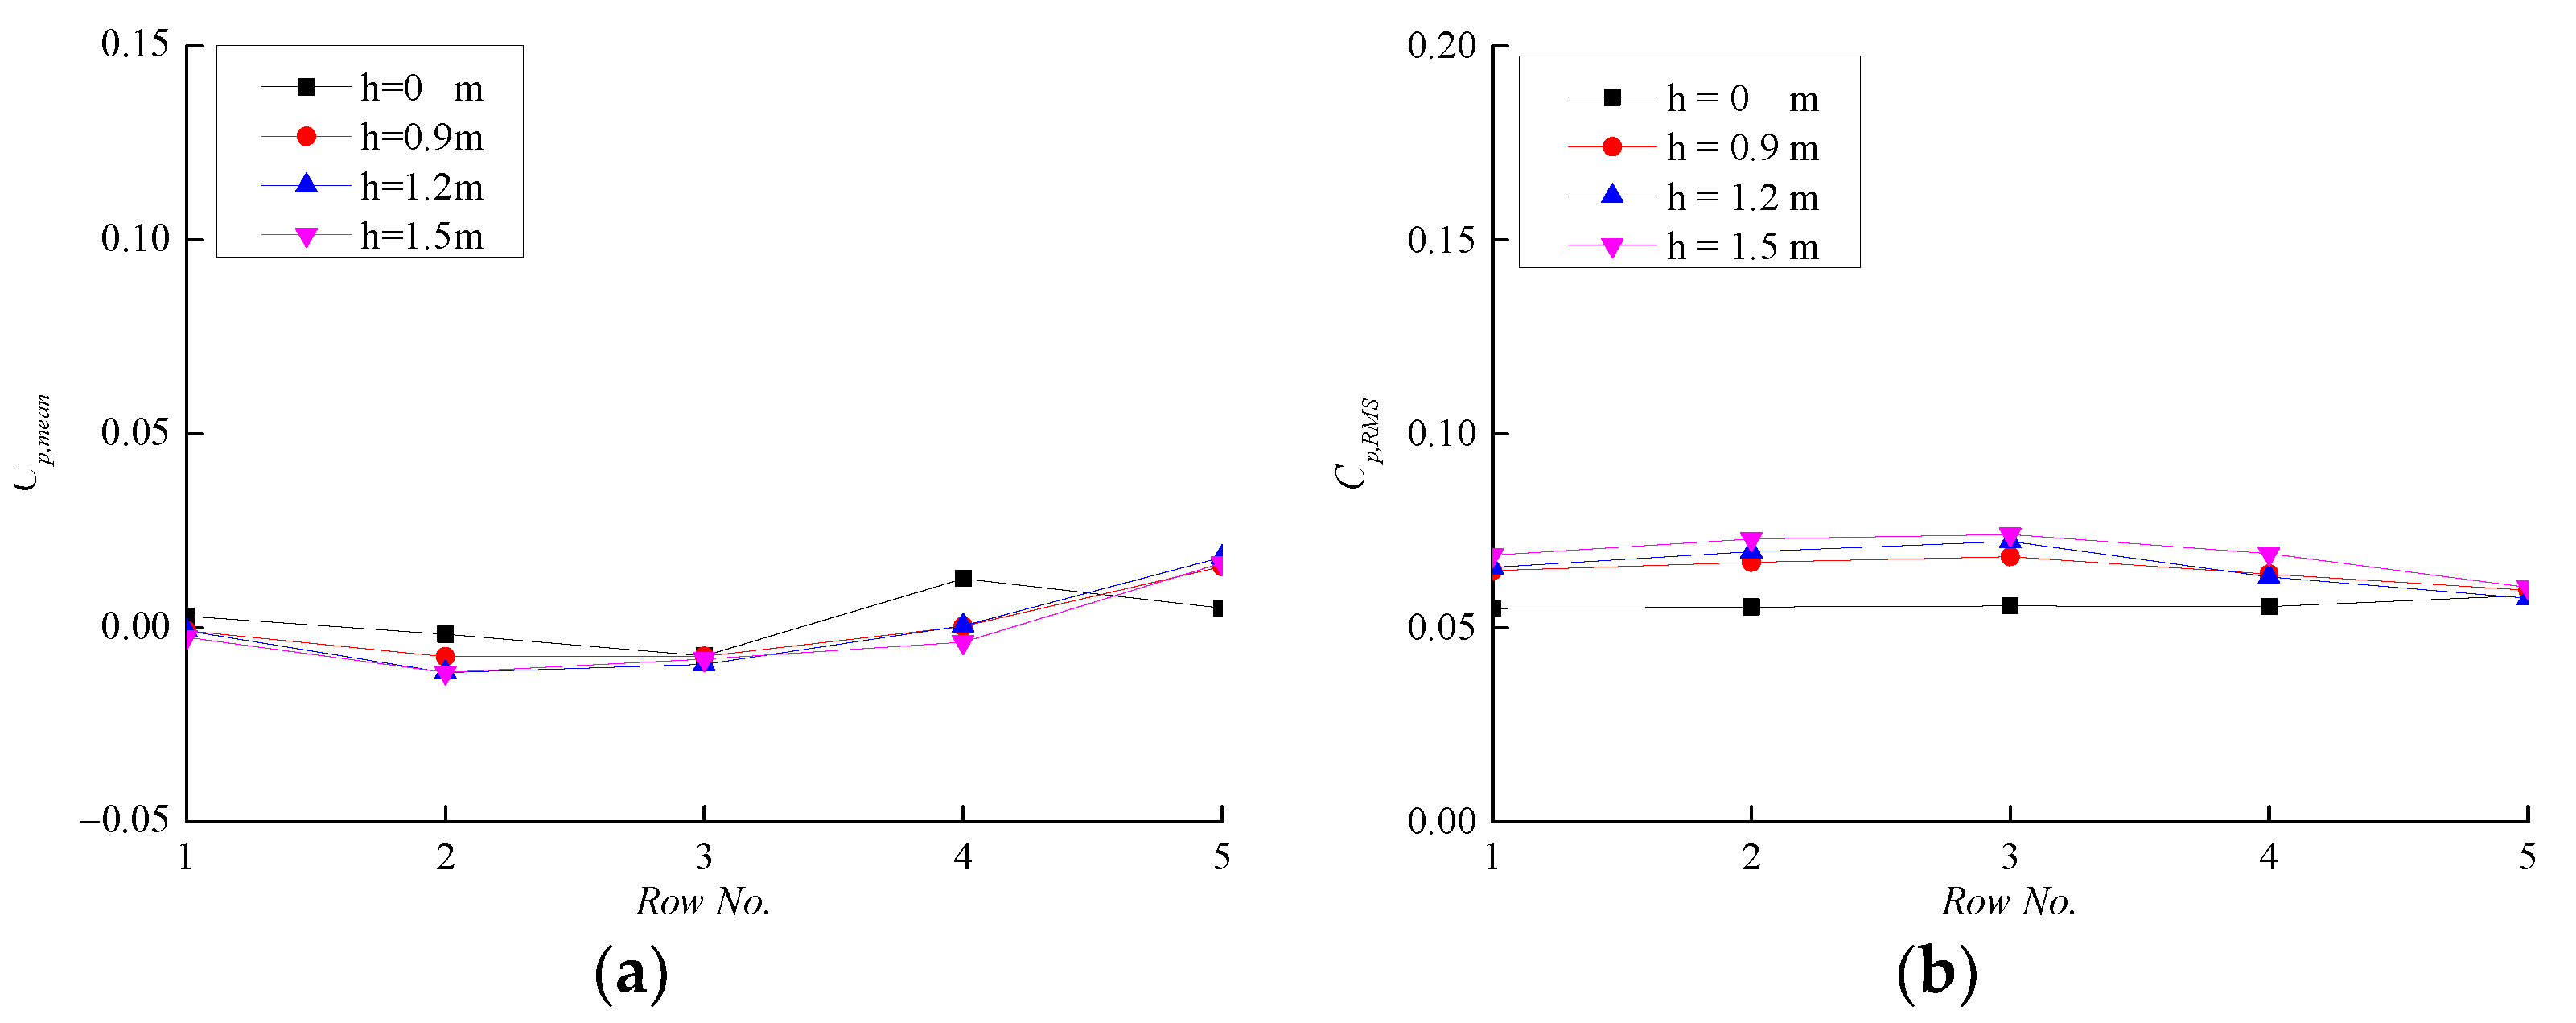
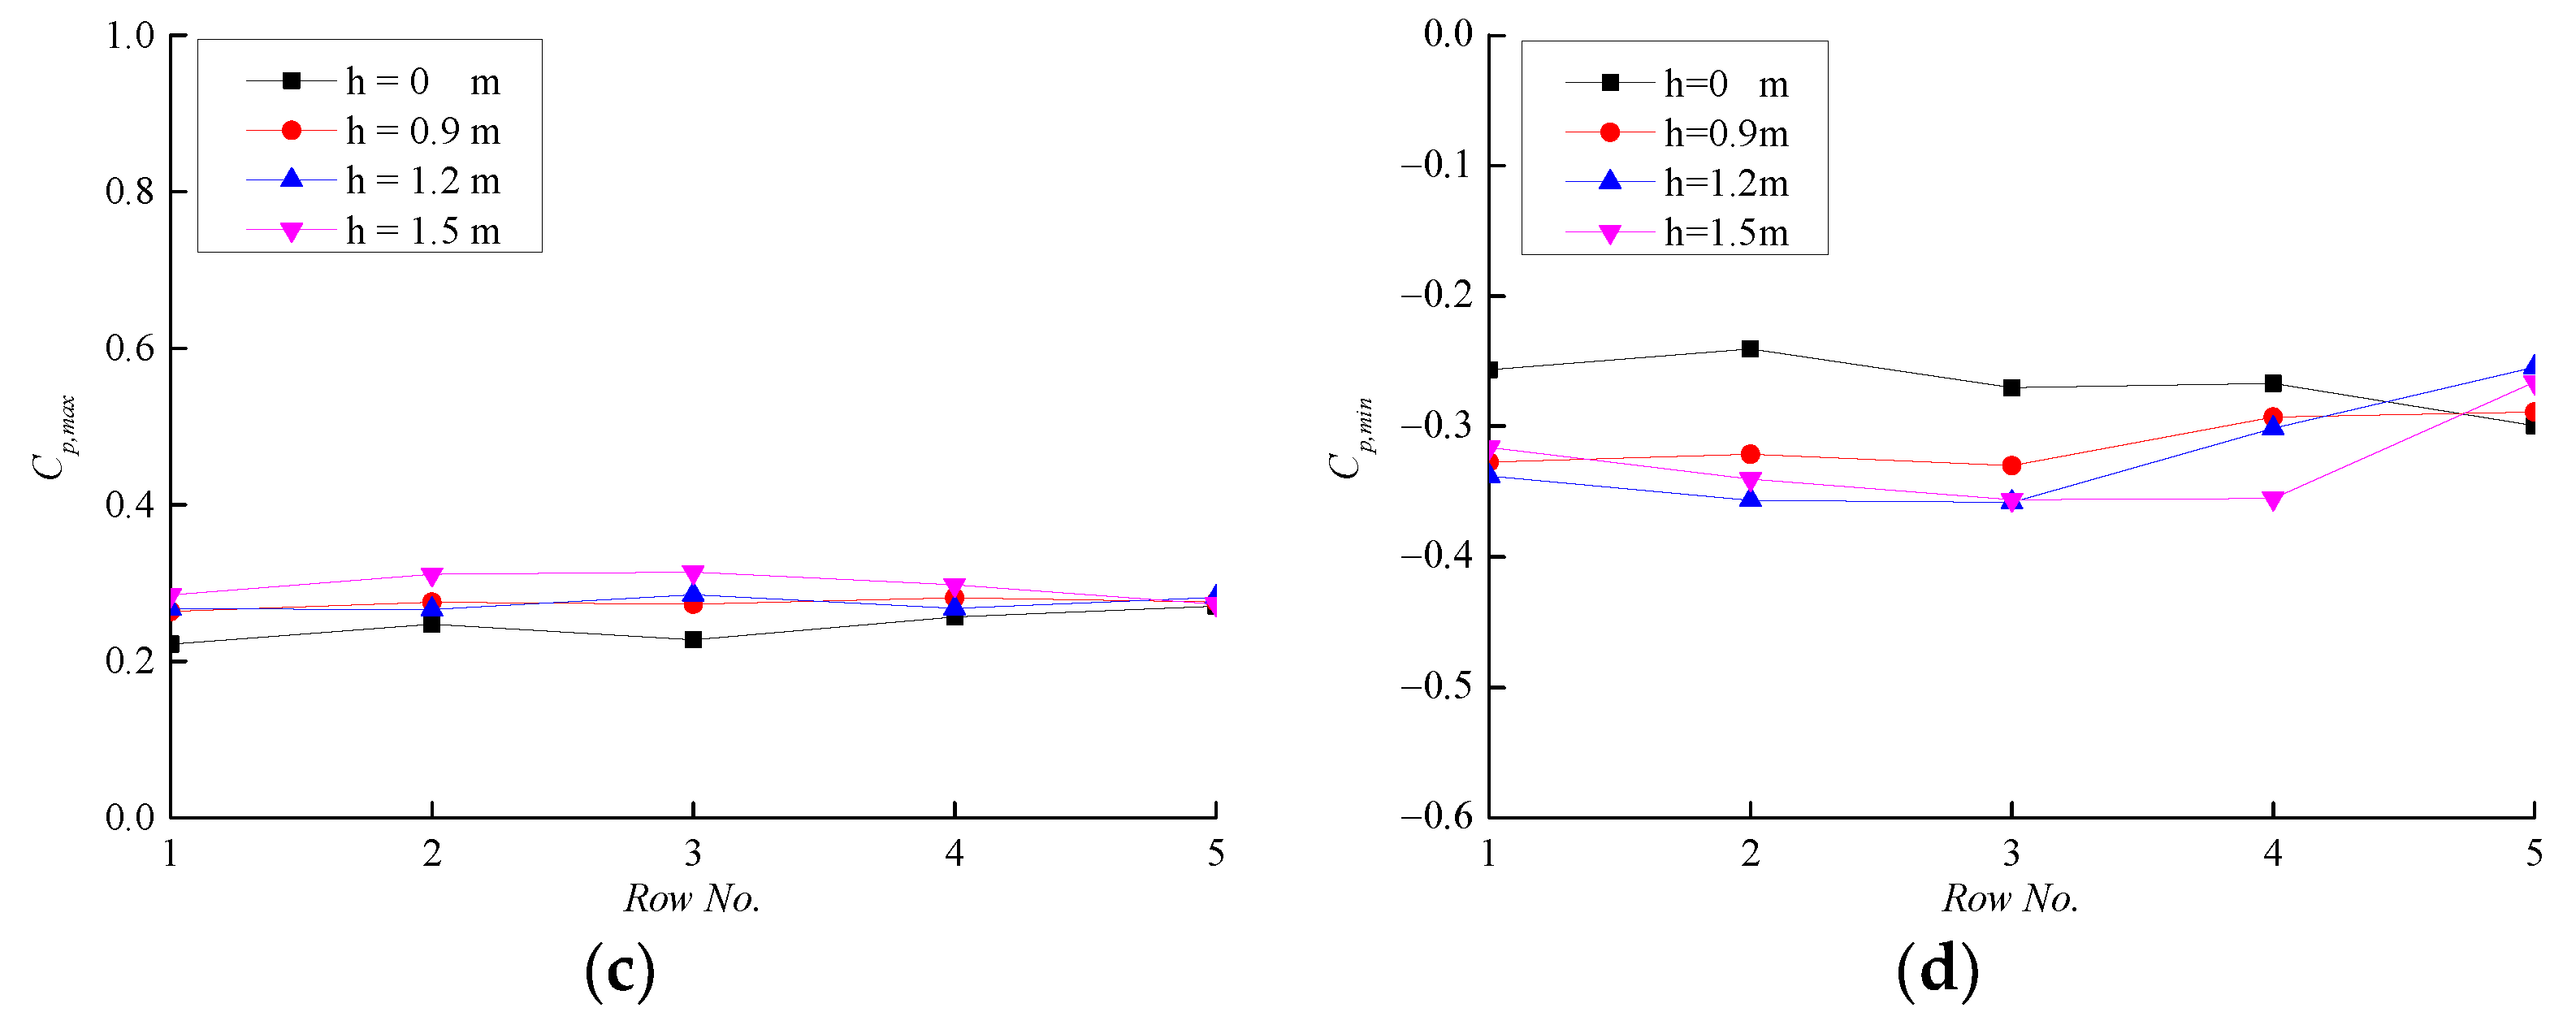
Figure 21 and Figure 22 show the mean, standard deviation, maximum and minimum peak pressure coefficients of each row with 11 panels with four different parapet heights (0 m, 0.9 m, 1.2 m, 1.5 m) for the wind directions of 90° and 270°. Similar to Figure 14 and Figure 15, the magnitudes of the above statistics also decrease as the parapet height increases, especially for the maximum and minimum peak pressure coefficients, which drop by about 10%. But the decreasing effect is not as good as the former, for the wind blew perpendicular to the narrow face of the building, leading to less shelter than that at 0° and 180°.

4.2.2. Effect of Tilt Angle

Figure 23 shows the mean, standard deviation, maximum and minimum peak pressure coefficients for units in five rows for the wind direction of 90° with a tilt angle of 5° and a parapet height of 0 m. The values of the above statistics are close to those with a tilt angle of 10° (see Figure 19). This is also because when the solar panel is installed almost horizontally, the statistics of the aerodynamic load change very little with the tilt angle.

4.3. Oblique Wind Direction

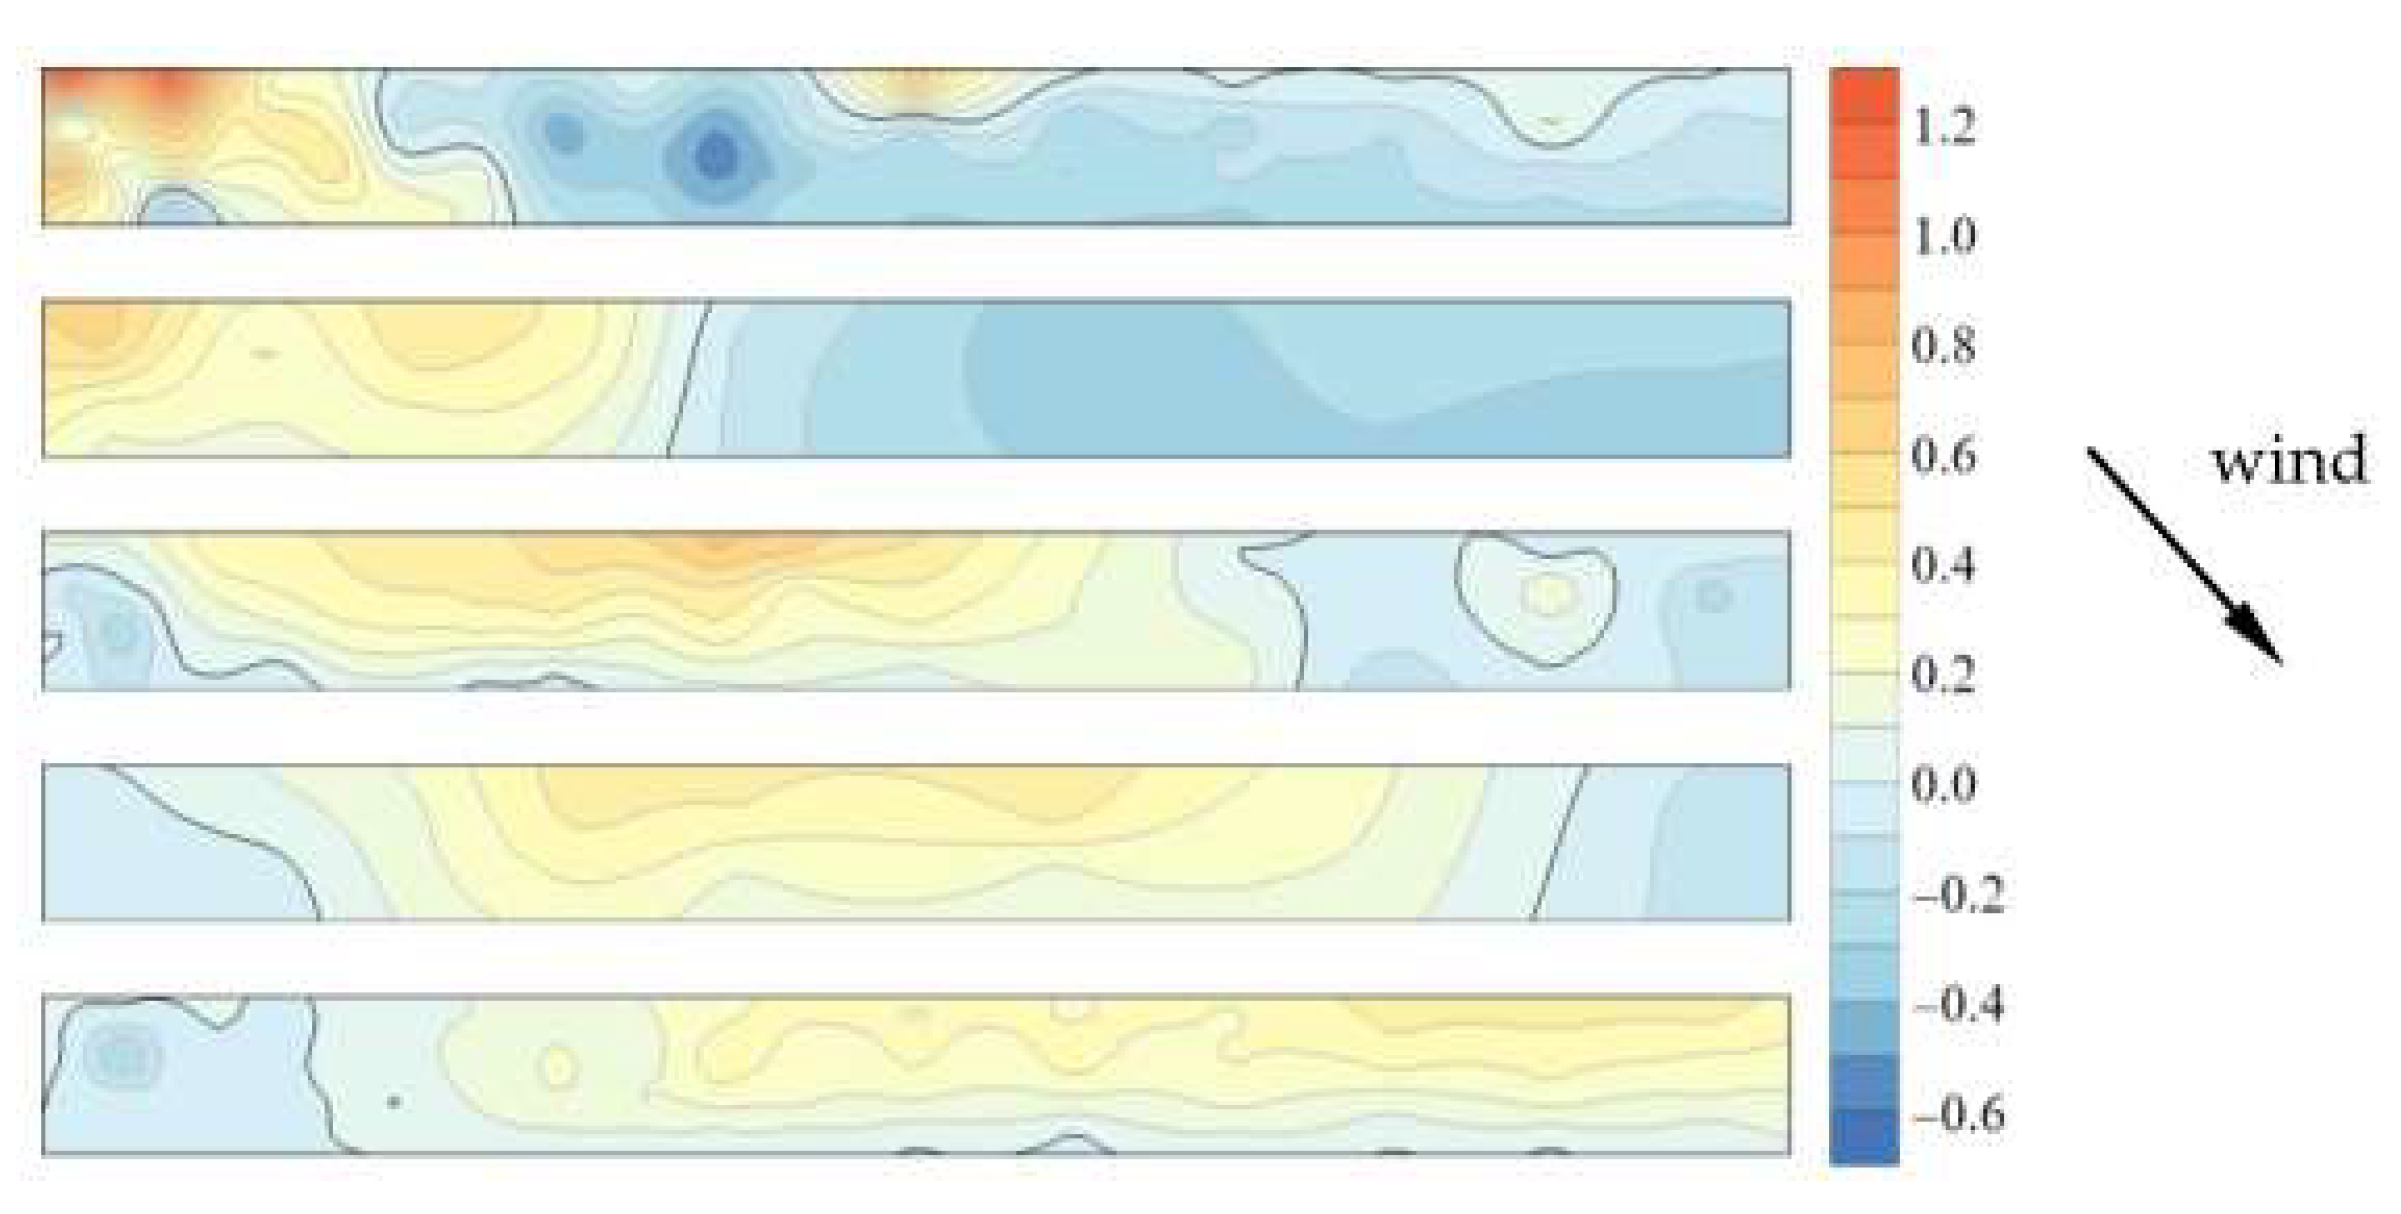
The contour plot of net pressure Δ C p on the module surface at a 45° wind direction with a tilt angle of 10° and a parapet height of 0 m is shown in Figure 24. The net pressure on the modules of the five rows facing the approaching wind are positive, with the largest value at the leading edge and lowest value at the trailing edge. However, the net pressure on the modules at the lower-left and upper-right corner are gradually decreasing to a negative value.
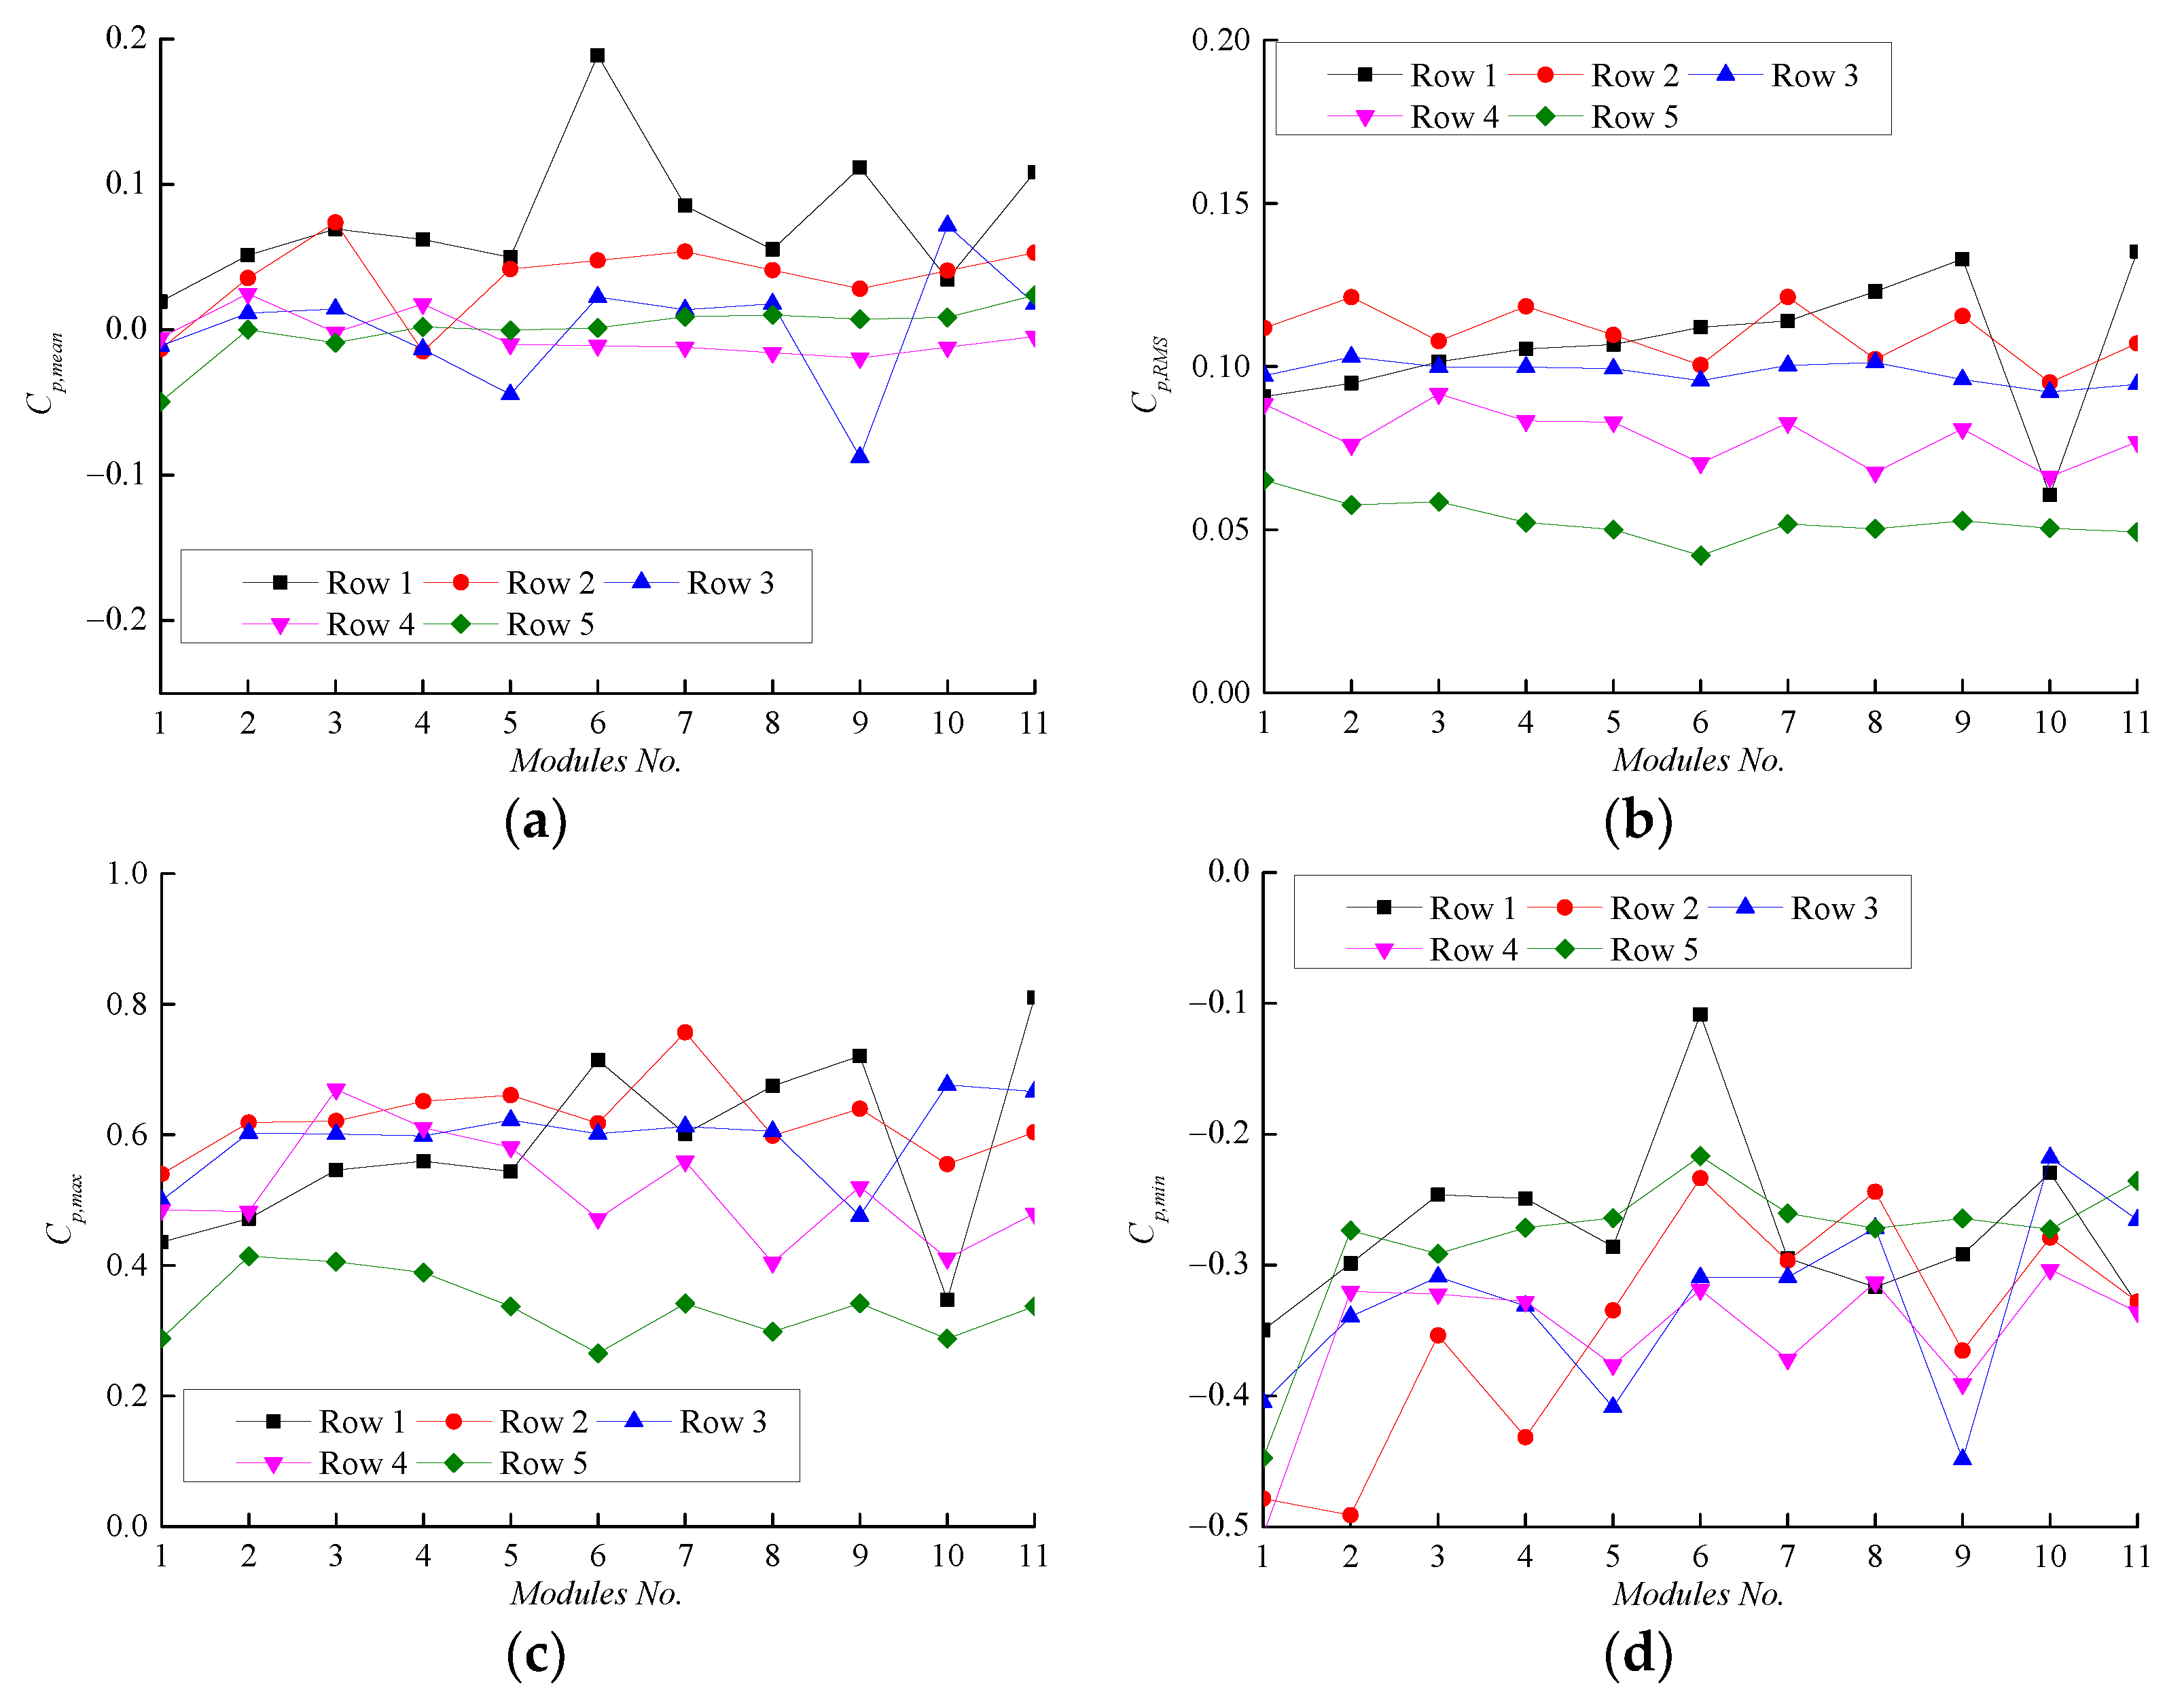
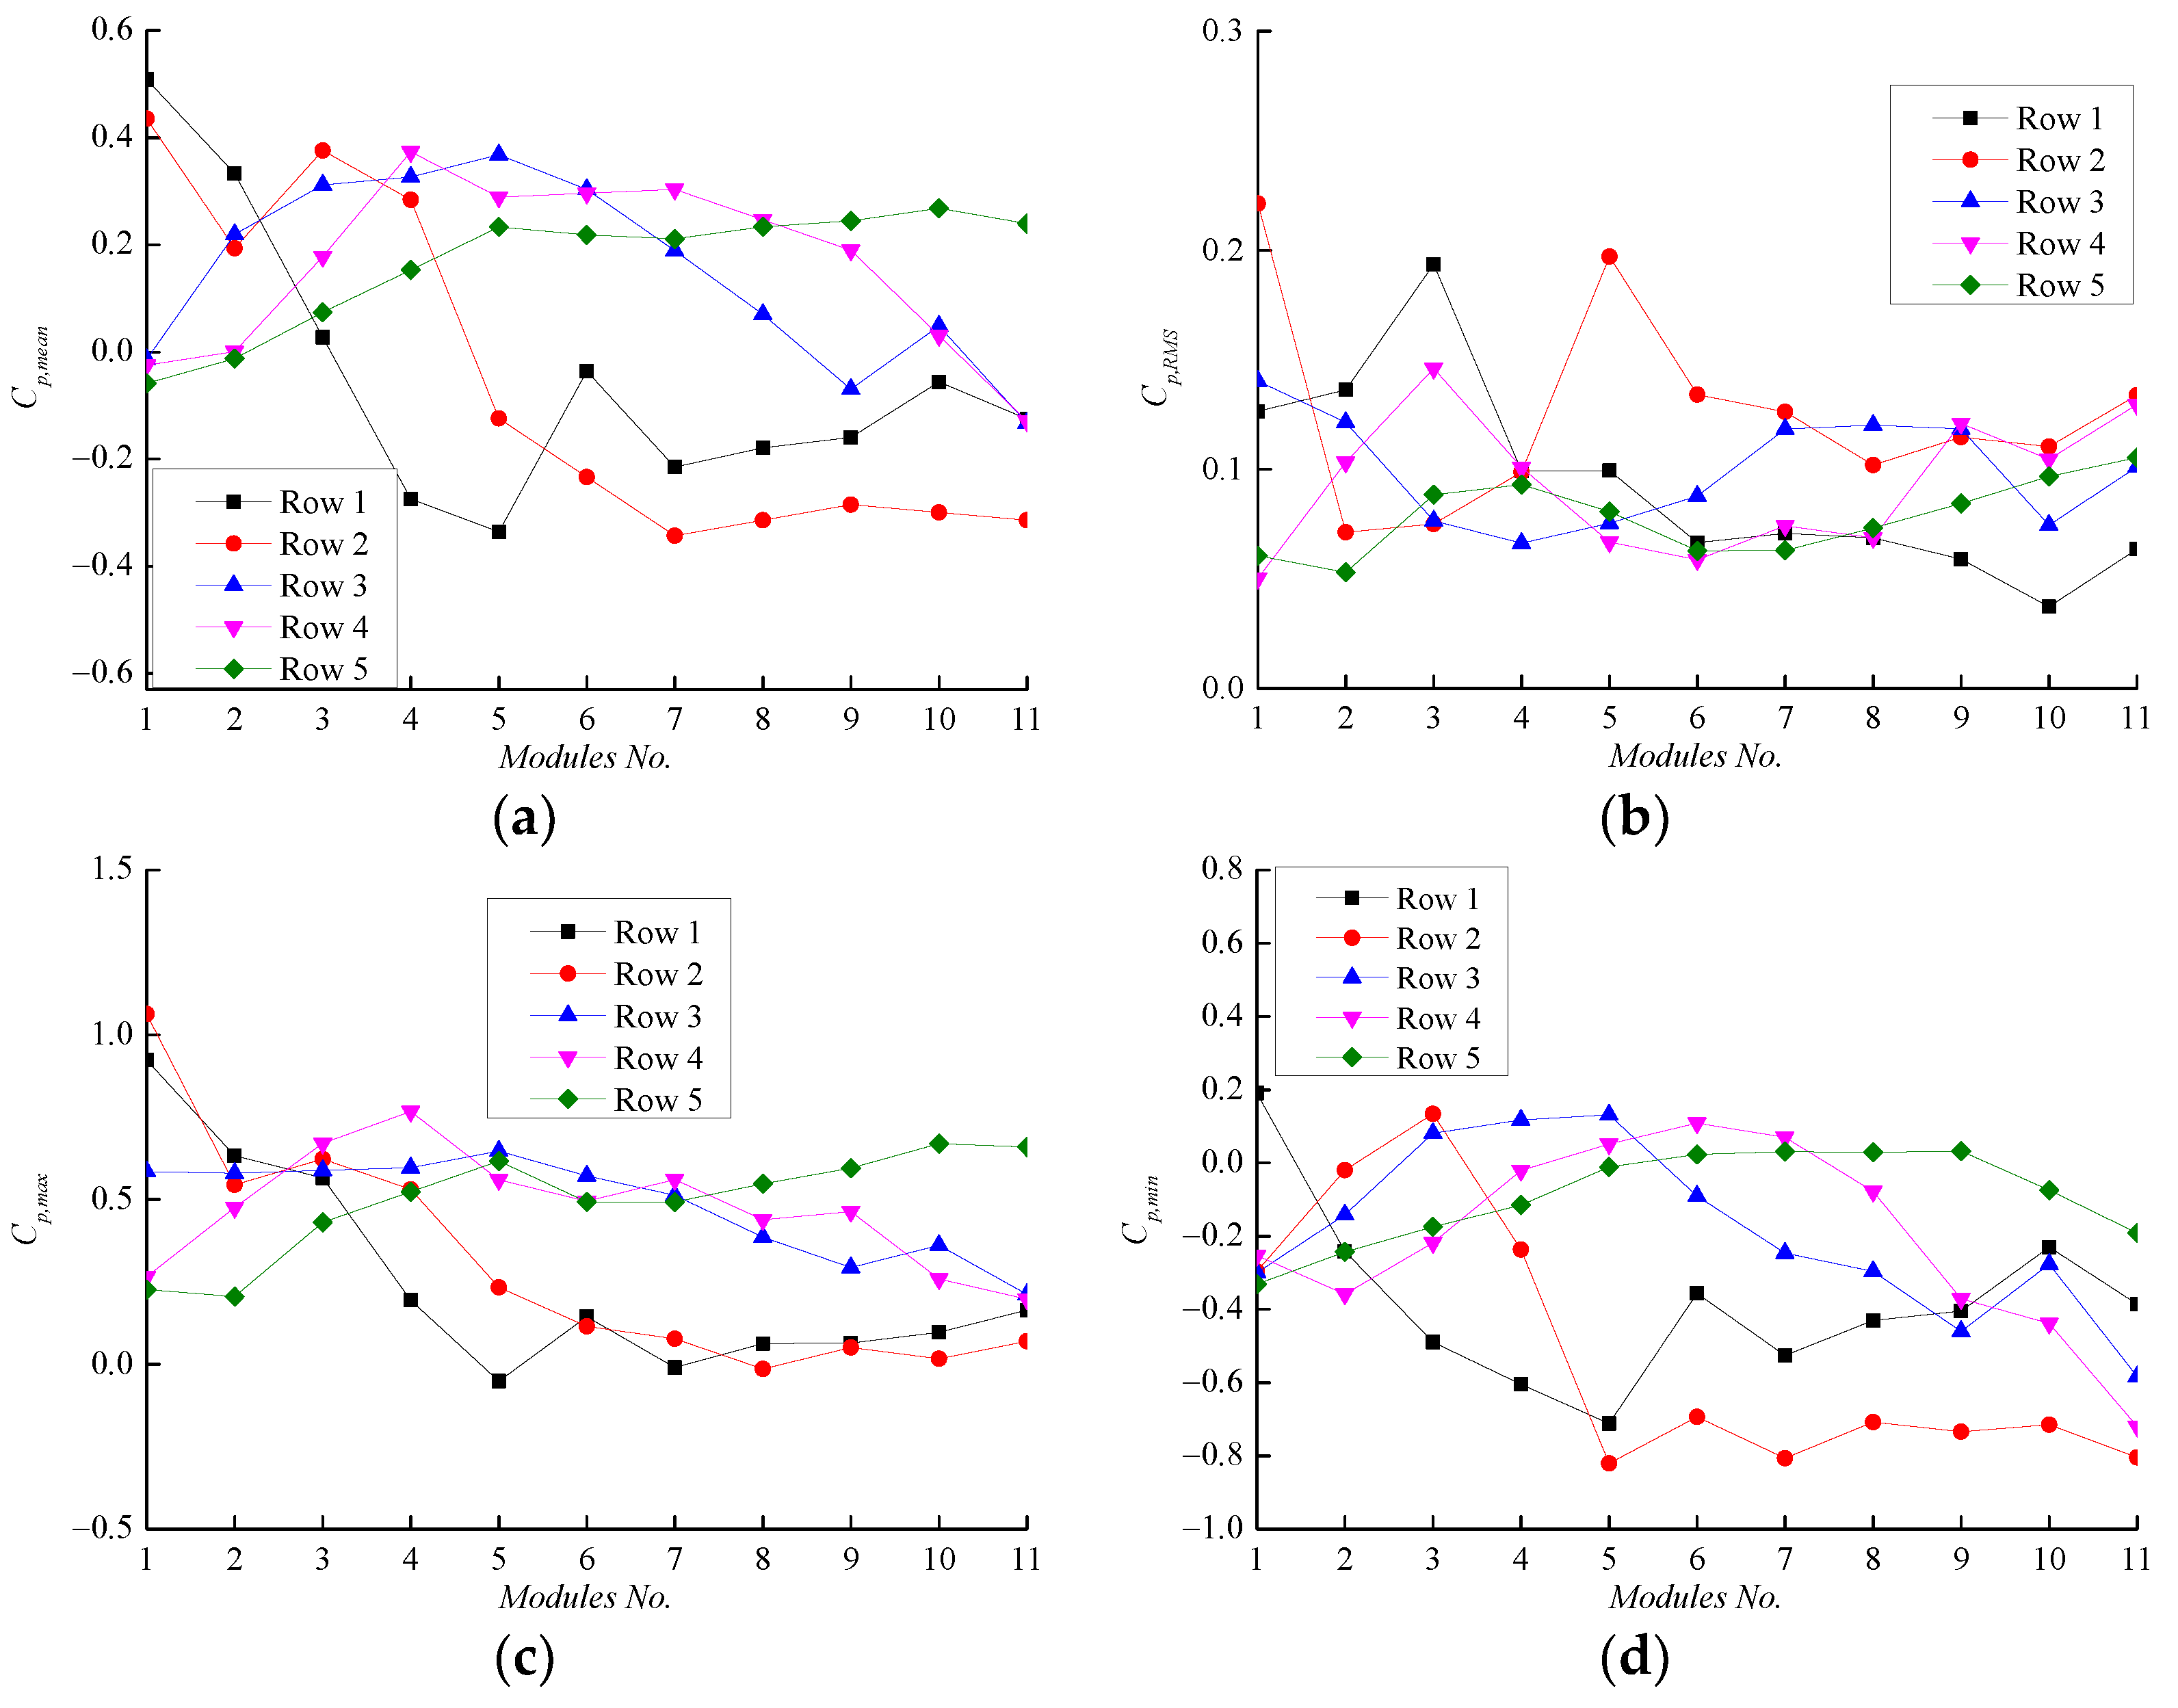
The mean, standard deviation, maximum and minimum peak pressure coefficients for the units in five rows at the oblique wind direction of 45° with a tilt angle of 10° and a parapet height of 0 m are shown in Figure 25. At this oblique wind direction, the module edges of rows 1–2 experience the largest mean pressure magnitude, as they are the closest to the wind direction. Different from the means at 0° azimuth (see Figure 6a), most means at 45° are positive and have larger magnitudes (see Figure 25a). The maximum (see Figure 25c) and minimum (see Figure 25d) peak pressure coefficients at this azimuth are more discrete than those at 0° azimuth (see Figure 8a,b). This result indicates that the turbulence between the arrays at the oblique wind direction are more complicated.
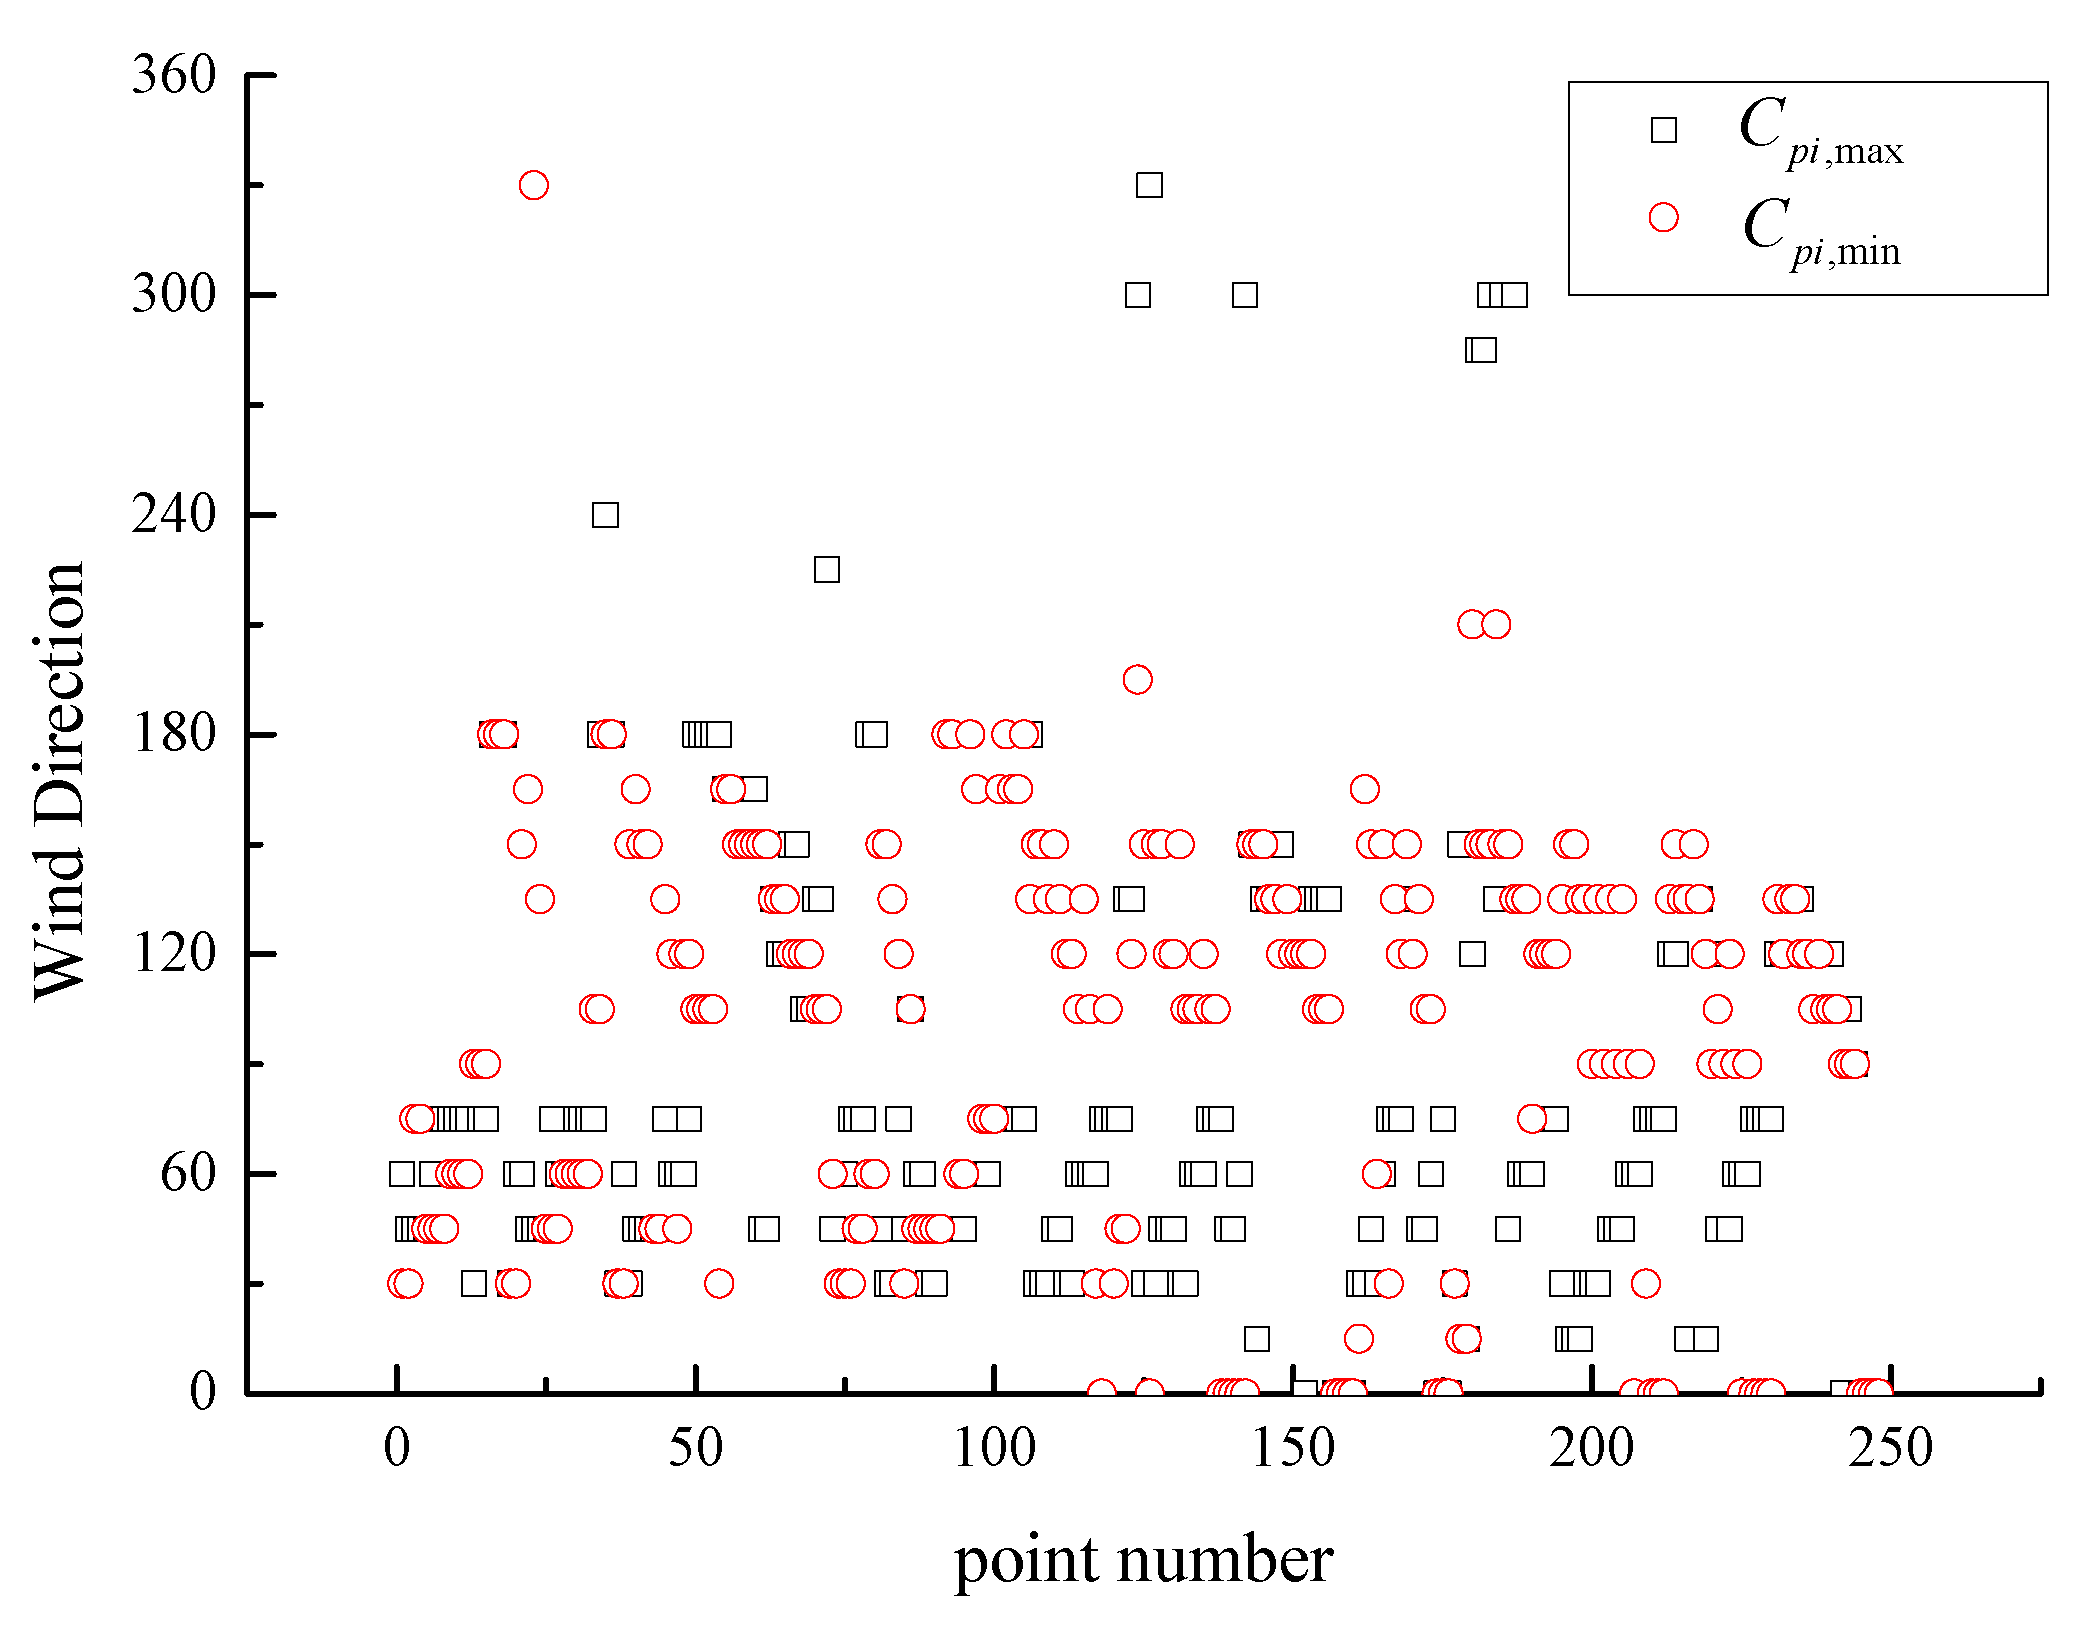
It should be noted that, according to Figure 8, Figure 12, Figure 19, Figure 20 and Figure 25, the extremes of the maximum and minimum peak pressure coefficients of each unit may be different at different wind directions. To further investigate the critical wind direction, the wind directions corresponding to the extremes of the maximum and minimum peak pressure coefficients at 248 measured locations for arrays with a tilt angle of 10° and a parapet height of 0 m were completed and displayed in Figure 26. It shows that the critical wind directions are oblique (45°–75°, 105°–150°) for most locations. This result is different from the standalone module, which is critically loaded when the wind impacts it head-on at 0° [11,23].

5. Conclusions

An experimental study was conducted to investigate the aerodynamic loads on roof-mounted solar arrays. Four parapet heights (0 m, 0.9 m, 1.2 m, 1.5 m) and two tilt angles (5°, 10°) were set in the wind tunnel test to examine their effects on aerodynamic loads. The statistics of the wind pressure coefficients in different wind directions were exhibited and discussed in the current study. The results show that the oblique wind directions are critical wind directions for most measured locations, as the extremes of the maximum and minimum peak pressure coefficients occur. Also, a parapet can decrease the wind loads on solar arrays. In the wind angles of 0° and 180° (wind blow is perpendicular to the wide face, acting in the short direction of the building), the maximum and minimum peak pressure coefficients drop by about 20–50%, 20–40%, respectively. In the wind angles of 90° and 270° (wind blow is perpendicular to the narrow face, acting in the long direction), as the shielding area of the parapet deceases compared to the wind direction of 0° and 180°, the maximum and minimum peak pressure coefficients drop by about 10%. But when the parapet is higher than 0.9 m, it is not quite efficient to decrease wind loads on the panel array despite increasing the parapet height, because that parapet with a height of 0.9 m has already provided good shelter. If the solar panels were installed on the roof almost horizontally (tilt angle as less than 10°), the statistics of the aerodynamic load changes little with the decreasing of the tilt angle. So, it is reasonable that the wind load parameter, such as shape factor, remains the same when the panels’ tilt angle is less than 15°.

Author Contributions

Conceptualization, J.Y. and Z.T.; methodology, J.Y., Z.T., D.W. and G.S.; investigation, J.Y. and Z.T.; writing—original draft preparation, J.Y. and Z.T.; writing—review and editing, W.L. All authors have read and agreed to the published version of the manuscript.

Funding

This research was funded by Zhejiang Provincial Natural Science Foundation of China (No. LGG22E080018).

Institutional Review Board Statement

Not applicable.

Data Availability Statement

Not applicable.

Acknowledgments

The authors greatly appreciate the support by the Zhejiang Provincial Natural Science Foundation of China under Grant No. LGG22E080018. The opinions and statements do not necessarily represent those of the sponsors.

Conflicts of Interest

The authors declare no conflict of interest.

References

  1. Zhao, X.; Xie, Y. The economic performance of industrial and commercial rooftop photovoltaic in China. Energy 2019, 187, 115961. [Google Scholar]
  2. Doddipatla, L.S.; Kopp, G.A. Wind loads on roof-mounted equipment on low-rise buildings with low-slope roofs. J. Wind. Eng. Ind. Aerodyn. 2021, 211, 104552. [Google Scholar] [CrossRef]
  3. Kopp, G.A.; Banks, D. Use of the Wind Tunnel Test Method for Obtaining Design Wind Loads on Roof-Mounted Solar Arrays. J. Struct. Eng. 2013, 139, 284–287. [Google Scholar] [CrossRef]
  4. Kopp, G.A.; Farquhar, S.; Morrison, M.J. Aerodynamic mechanisms for wind loads on tilted, roof-mounted, solar arrays. J. Wind Eng. Ind. Aerodyn. 2012, 111, 40–52. [Google Scholar] [CrossRef]
  5. Pratt, R.N.; Kopp, G.A. Velocity measurements around low-profile, tilted, solar arrays mounted on large flat-roofs, for wall normal wind directions. J. Wind Eng. Ind. Aerodyn. 2013, 123, 226–238. [Google Scholar] [CrossRef]
  6. Warsido, W.P.; Bitsuamlak, G.T.; Barata, J.; Chowdhury, A.G. Influence of spacing parameters on the wind loading of solar array. J. Fluids Struct. 2014, 48, 295–315. [Google Scholar] [CrossRef]
  7. Wang, J.; Van Phuc, P.; Yang, Q.; Tamura, Y. LES study of wind pressure and flow characteristics of flat-roof-mounted solar arrays. J. Wind Eng. Ind. Aerodyn. 2020, 198, 104096. [Google Scholar] [CrossRef]
  8. Dai, S.; Liu, H.; Yang, J.; Peng, H. Wind loads on roof-mounted isolated solar panels of tall buildings through wind tunnel testing. Sol. Energy 2022, 231, 607–622. [Google Scholar] [CrossRef]
  9. Scaletchi, I.; Visa, I.; Velicu, R. Modeling wind action on solar tracking PV platforms. Bull. Transilv. Univ. Bras. 2010, 3, 115–122. [Google Scholar]
  10. Pfahl, A.; Buselmeier, M.; Zaschke, M. Wind loads on heliostats and photovoltaic trackers of various aspect ratios. Sol. Energy 2011, 85, 2185–2201. [Google Scholar] [CrossRef] [Green Version]
  11. Abiola-Ogedengbe, A.; Hangan, H.; Siddiqui, K. Experimental investigation of wind effects on a standalone photovoltaic (PV) module. Renew. Energy 2015, 78, 657–665. [Google Scholar] [CrossRef]
  12. Jubayer, C.M.; Hangan, H. A numerical approach to the investigation of wind loading on an array of ground mounted solar photovoltaic (PV) panels. J. Wind Eng. Ind. Aerodyn. 2016, 153, 60–70. [Google Scholar] [CrossRef]
  13. Reina, G.P.; De Stefano, G. Computational evaluation of wind loads on sun-tracking ground-mounted photovoltaic panel arrays. J. Wind Eng. Ind. Aerodyn. 2017, 170, 283–293. [Google Scholar] [CrossRef]
  14. Taylor, Z.J.; Browne, M.T.L. Hybrid pressure integration and buffeting analysis for multi-row wind loading in an array of single-axis trackers—ScienceDirect. J. Wind Eng. Ind. Aerodyn. 2020, 197, 104056. [Google Scholar] [CrossRef]
  15. NB/T 10115-2018; Code for Design of Photovoltaic Modules Support Structures. China Jihua Press: Beijing, China, 2018.
  16. ASCE7–05; Minimum Design Loads for Buildings and Other Structures. ASCE: Reston, VA, USA, 2006.
  17. ASCE7-10; Minimum Design Loads for Buildings and Other Structures. ASCE: Reston, VA, USA, 2010.
  18. GB 50009-2012; Load Code for the Design of Building Structures. China Architecture and Building Press: Beijing, China, 2012.
  19. Huang, M.F.; Lou, W.; Pan, X.; Chan, C.M.; Li, Q.S. Hermite extreme value estimation of non-Gaussian wind load process on a long-span roof structure. J. Struct. Eng. 2014, 140, 04014061. [Google Scholar] [CrossRef]
  20. JGJ/T 481-2019; Standard for Wind Loads on Roof Structures. China Architecture and Building Press: Beijing, China, 2019.
  21. Wint´erstein, S.R. Nonlinear Vibration Models for Extremes and Fatigue. J. Eng. Mech. 1988, 114, 1772–1790. [Google Scholar] [CrossRef]
  22. Kwon, D.; Kareem, A. Peak factors for non-Gaussian load effects revisited. J. Struct. Eng. 2011, 10, 1611–1619. [Google Scholar] [CrossRef]
  23. Shademan, M.; Barron, R.; Balachandar, R.; Hangan, H. Numerical simulation of wind loading on ground-mounted solar panels at different flow configurations. Can. J. Civ. Eng. 2014, 41, 728–738. [Google Scholar] [CrossRef]
Figure 1. (a) The facade diagram of low-rise building with parapet, and (b) photographs of model arrays mounted on the roof, showing the upstream terrain.
Sustainability 14 08477 g001
Figure 2. Layout of roof-mounted arrays with row numbers, wind direction and pressure taps, # is the unit of Row.
Sustainability 14 08477 g002
Figure 3. Tilt angle of module at the wind direction of 0°.
Sustainability 14 08477 g003
Figure 4. (a) Mean velocity and (b) turbulence intensity profiles of measured terrain and open terrain given in GB 50009-2012. Data points are experimental measures, whereas the solid lines are GB profiles with α = 0.12.
Sustainability 14 08477 g004
Figure 5. Contour plot of net pressure Δ C p on module surface at (a) 0° and (b) 180° azimuth with tilt angle of 10° and parapet height of 0 m.
Sustainability 14 08477 g005
Figure 6. (a) Mean ( C p , m e a n ) and (b) standard deviation ( C p , R M S ) of area-averaged pressure coefficients for units in five rows for wind direction of 0° with tilt angle of 10° and parapet height of 0 m.
Sustainability 14 08477 g006
Figure 7. (a) Skewness and (b) kurtosis of area-averaged pressure coefficients for units in five rows for wind direction of 0° with tilt angle of 10° and parapet height of 0 m.
Sustainability 14 08477 g007
Figure 8. (a) Maximum ( C p i , max ) and (b) minimum ( C p i , min ) peak pressure coefficients for units in five rows for wind direction of 0° with tilt angle of 10° and parapet height of 0 m.
Sustainability 14 08477 g008
Figure 9. (a) Positive ( g + ) and (b) negative ( g ) peak factors for units in five rows for wind direction of 0° with tilt angle of 10° and parapet height of 0 m.
Sustainability 14 08477 g009
Figure 10. (a) Mean ( C p , m e a n ) and (b) standard deviation ( C p , R M S ) of area-averaged pressure coefficients for units in five rows for wind direction of 180° with tilt angle of 10° and parapet height of 0 m.
Sustainability 14 08477 g010
Figure 11. (a) Skewness and (b) kurtosis of area-averaged pressure coefficients for units in five rows for wind direction of 180° with tilt angle of 10° and parapet height of 0 m.
Sustainability 14 08477 g011
Figure 12. (a) Maximum ( C p i , max ) and (b) minimum ( C p i , min ) peak pressure coefficients for units in five rows for wind direction of 180° with tilt angle of 10° and parapet height of 0 m.
Sustainability 14 08477 g012
Figure 13. (a) Positive ( g + ) and (b) negative ( g ) peak factors for units in five rows for wind direction of 180° with tilt angle of 10° and parapet height of 0 m.
Sustainability 14 08477 g013
Figure 14. (a) Mean ( C p , m e a n ), (b) standard deviation ( C p , R M S ), (c) maximum peak pressure coefficient ( C p i , max ), (d) minimum peak pressure coefficient ( C p i , min ), (e) positive peak factor ( g + ), (f) negative peak factor ( g ) within a row of 11 panels for wind direction of 0° with tilt angle of 10° and parapet height ( h ) of 0 m, 0.9 m, 1.2 m and 1.5 m.
Sustainability 14 08477 g014
Figure 15. (a) Mean ( C p , m e a n ), (b) standard deviation ( C p , R M S ), (c) maximum peak pressure coefficient ( C p i , max ), (d) minimum peak pressure coefficient ( C p i , min ), (e) positive peak factor ( g + ), (f) negative peak factor ( g ) within a row of 11 panels for wind direction of 180° with tilt angle of 10° and parapet height ( h ) of 0 m, 0.9 m, 1.2 m and 1.5 m.
Sustainability 14 08477 g015aSustainability 14 08477 g015b
Figure 16. (a) Mean ( C p , m e a n ), (b) standard deviation ( C p , R M S ), (c) maximum ( C p i , max ) and (d) minimum ( C p i , min ) peak pressure coefficients for units in five rows for wind direction of 0° with tilt angle of 5° and parapet height of 0 m.
Sustainability 14 08477 g016
Figure 17. (a) Mean ( C p , m e a n ), (b) standard deviation ( C p , R M S ), (c) maximum ( C p i , max ) and (d) minimum ( C p i , min ) peak pressure coefficients for units in five rows for wind direction of 180° with tilt angle of 5° and parapet height of 0 m.
Sustainability 14 08477 g017
Figure 18. Contour plot of net pressure Δ C p on module surface at (a) 90° and (b) 270° wind direction with tilt angle of 10° and parapet height of 0 m.
Sustainability 14 08477 g018
Figure 19. (a) Mean ( C p , m e a n ), (b) standard deviation ( C p , R M S ), (c) maximum ( C p , R M S ) and (d) minimum ( C p i , min ) peak pressure coefficients for units in five rows for wind direction of 90° with tilt angle of 10° and parapet height of 0 m.
Sustainability 14 08477 g019
Figure 20. (a) Mean ( C p , m e a n ), (b) standard deviation ( C p , R M S ), (c) maximum ( C p i , max ) and (d) minimum ( C p i , min ) peak pressure coefficients for units in five rows for wind direction of 270° with tilt angle of 10° and parapet height of 0 m.
Sustainability 14 08477 g020
Figure 21. (a) Mean ( C p , m e a n ), (b) standard deviation ( C p , R M S ), (c) maximum peak pressure coefficient ( C p i , max ), (d) minimum peak pressure coefficient ( C p i , min ) of a row of 11 panels for wind direction of 90° with tilt angle of 10° and parapet height ( h ) of 0 m, 0.9 m, 1.2 m and 1.5 m.
Sustainability 14 08477 g021
Figure 22. (a) Mean ( C p , m e a n ), (b) standard deviation ( C p , R M S ), (c) maximum peak pressure coefficient ( C p i , max ), (d) minimum peak pressure coefficient ( C p i , min ) of a row of 11 panels for wind direction of 270° with tilt angle of 10° and parapet height ( h ) of 0 m, 0.9 m, 1.2 m and 1.5 m.
Sustainability 14 08477 g022aSustainability 14 08477 g022b
Figure 23. (a) Mean ( C p , m e a n ), (b) standard deviation ( C p , R M S ), (c) maximum ( C p i , max ) and (d) minimum ( C p i , min ) peak pressure coefficients for units in five rows for wind direction of 90° with tilt angle of 5° and parapet height of 0 m.
Sustainability 14 08477 g023
Figure 24. Contour plot of net pressure Δ C p on module surface at 45° wind direction with tilt angle of 10° and parapet height of 0 m.
Sustainability 14 08477 g024
Figure 25. (a) Mean ( C p , m e a n ), (b) standard deviation ( C p , R M S ), (c) maximum ( C p i , max ) and (d) minimum ( C p i , min ) peak pressure coefficients for units in five rows for wind direction of 45° with tilt angle of 10° and parapet height of 0 m.
Sustainability 14 08477 g025
Figure 26. Critical wind directions for the maximum and minimum peak pressure coefficients at measured locations for arrays with tilt angle of 10° and parapet height of 0 m.
Sustainability 14 08477 g026
Publisher’s Note: MDPI stays neutral with regard to jurisdictional claims in published maps and institutional affiliations.