Article

The Human Ecosystem Spatial Networks of Amman City Center: A New Methodological Approach towards Resiliency

by
Islam Alshafei
* and
Pinar Ulucay Righelato
Department of Architecture, Faculty of Architecture, Eastern Mediterranean University, North Cyprus via Mersin 10, Famagusta 99628, Turkey
*
Author to whom correspondence should be addressed.
Sustainability 2022, 14(14), 8451; https://doi.org/10.3390/su14148451
Submission received: 7 June 2022 / Revised: 3 July 2022 / Accepted: 5 July 2022 / Published: 11 July 2022
(This article belongs to the Section Sustainable Forestry)

Abstract

:
The human ecosystems embrace complex human-dominated systems, which often result in disparaging multifaceted social and ecological outcomes in various localities of the world. Green infrastructure (GI) with a well-planned and managed spatial organization and network of multifunctional landscapes does not only help improve the quality of life, but also promotes the multifunctional use of natural capital and enhances the resiliency of urban systems by enabling “disaster risk reduction”, or “DRR”, in real practice. To achieve more socially and ecologically resilient cities, the engagement of GI into the spatial network of the human ecosystem is inevitable. Moving on from this argument, the research utilizes several quantitative analysis tools, including space syntax methodology, graph theory, depth map analysis, linkage mapper analysis, and Arc-GIS to model the complex spatial patterns of the human ecosystem in the city center of Amman. To conclude, the study provides both theoretical evidence and practical assessment tools for the implementation of urban GI towards the sustenance of the social and ecological resiliency and NDRR within complex inner-city human ecosystems. The theoretical framework of this study embraces a novel contribution toward how resiliency and DRR theories can be merged into real practice through the utilization of a new methodological approach wherein the analysis, measurement, and visualization of human ecosystem spatial networks can be realized.

1. Introduction

Green Infrastructure, or “GI”, is generally known as a designed type of infrastructure that is implemented within the existing human ecosystem as natural or semi-natural multi-functioning networks [1,2,3,4]. Several identifications of GI highlight its significant contributions towards more resilient urban systems when properly integrated, planned, and managed [5,6,7]. GI is also widely acknowledged as having a crucial role in climate change mitigation, reduction, and the prevention of its related natural disasters, or “NDRR” [4,8]. Replacing non-resilient infrastructure by integrating GI within the ecosystem, referred to as grey-green or blue-green infrastructure, highly enhances their performance [5]. Urban GI networks contribute to ecosystem health and biodiversity conservation by increasing landscape connectivity. In addition, they enhance human health and well-being by decreasing human vulnerabilities towards disasters by delivering various ecosystem services [4,9,10]. As a result, the strong interconnection between GI, human health, and ecosystem health enhances the resiliency of the human ecosystem and promotes NDRR (Figure 1) [11,12].
Moving from the acknowledgement that there is a strong interconnection between the GI and urban resiliency, the research utilizes space syntax theory to analyze spatial layouts and human activity patterns in the city center of Amman to locate core areas of ecological networks and corridors as potential connections between the core areas. The outcomes of the analysis are achieved through building resilience capacities such as diversity, flexibility, adaptability, and transformability, amongst others, within urban communities and by decreasing vulnerabilities, which means that the urban communities are more likely to remain in a stable function when faced with stressors [13,14,15].
Drawing on the value of integrating GI towards a socially and ecologically resilient urban system, the literature emphasizes the enhanced performance of communities in situations where individuals are able to interact, work, move, and live closer to greenery. In such circumstances, individuals are expected to psychologically become more relaxed and physically more active while, at the same time, developing an increased sense of belonging and place attachment, which are crucial for a better quality of life [16]. Correspondingly, they become less exposed to toxins and outdoor air pollutants, benefitting from a more resilient natural ecosystem where core areas are well connected and there is an enhanced NDRR and a stronger possibility to mitigate climate change [17,18,19].
The degradation of the ecosystem and services such as GI and increasing inequity in this matter can result in multiple impacts on the health of urban dwellers [20]. The ecosystem services that the nature provides are divided into four main categories: the regulating services, such as wastewater management, storm water runoffs, and carbon storage/absorption, the provisioning services such as food and water supply, the cultural services such as providing spaces for recreation and increasing aesthetics, and the supporting services such as providing a habitat for wild species [21,22,23,24,25].
In urban areas, GI operates at different scales and typologies that varies from larger scale such as outer city landscapes, forests, urban parks, or urban agriculture to smaller inner city GI networks, which include neighborhood parks, residential gardens, green spaces, preambles pavements, green walls/roofs, or even individual street trees [7,26,27,28,29,30]. However, the literature acknowledges that planning for GI and implementing it in urban environments is a challenge and faces many barriers [5,31,32]. Similarly, as noted by Pauleit et al. in 2011 [33], current and past efforts in translating theory into practice towards the application of GI are in need for development to reach an effective implementation plan. Their research utilizes quantitative tools such as space syntax theory for the visualization of human spatial patterns while simultaneously making use of graph theory to map out landscape connectivity for analyzing spatial patterns of the human ecosystem. This method highlights the significance of the link between ecological and social factors and the implementation of a Green Infrastructure approach. The visualization of human–ecosystem spatial patterns through the space syntax graph theory method can help develop various GI implementation approaches. Previous studies have suggested that more research is required for the realization of this notion [33,34]. Moreover, while space syntax theory had been popular in urban studies to investigate the effect of spatial organization on human interactions, the integration of graph theory as a tool to assess the relationship in-between the human and ecological spatial patterns is yet to be addressed. This empirical research approach uses the space syntax technique to provide a framework for mapping spatial layouts and human activity patterns in urban systems, whereas graph theory is utilized to assess landscape connectivity where ecological core areas overlap with human activity areas. This method may serve as a tool to map out the most crucial areas within urban contexts that are in need of an ecological enhancement. Those ecological core areas are to be considered as potential zones to implement urban GI to maximize the potential benefit of nature for the urban communities’ health and well-being. Accordingly, the study adopts a case study, specifically Amman’s city center, as a testbed for its framework.
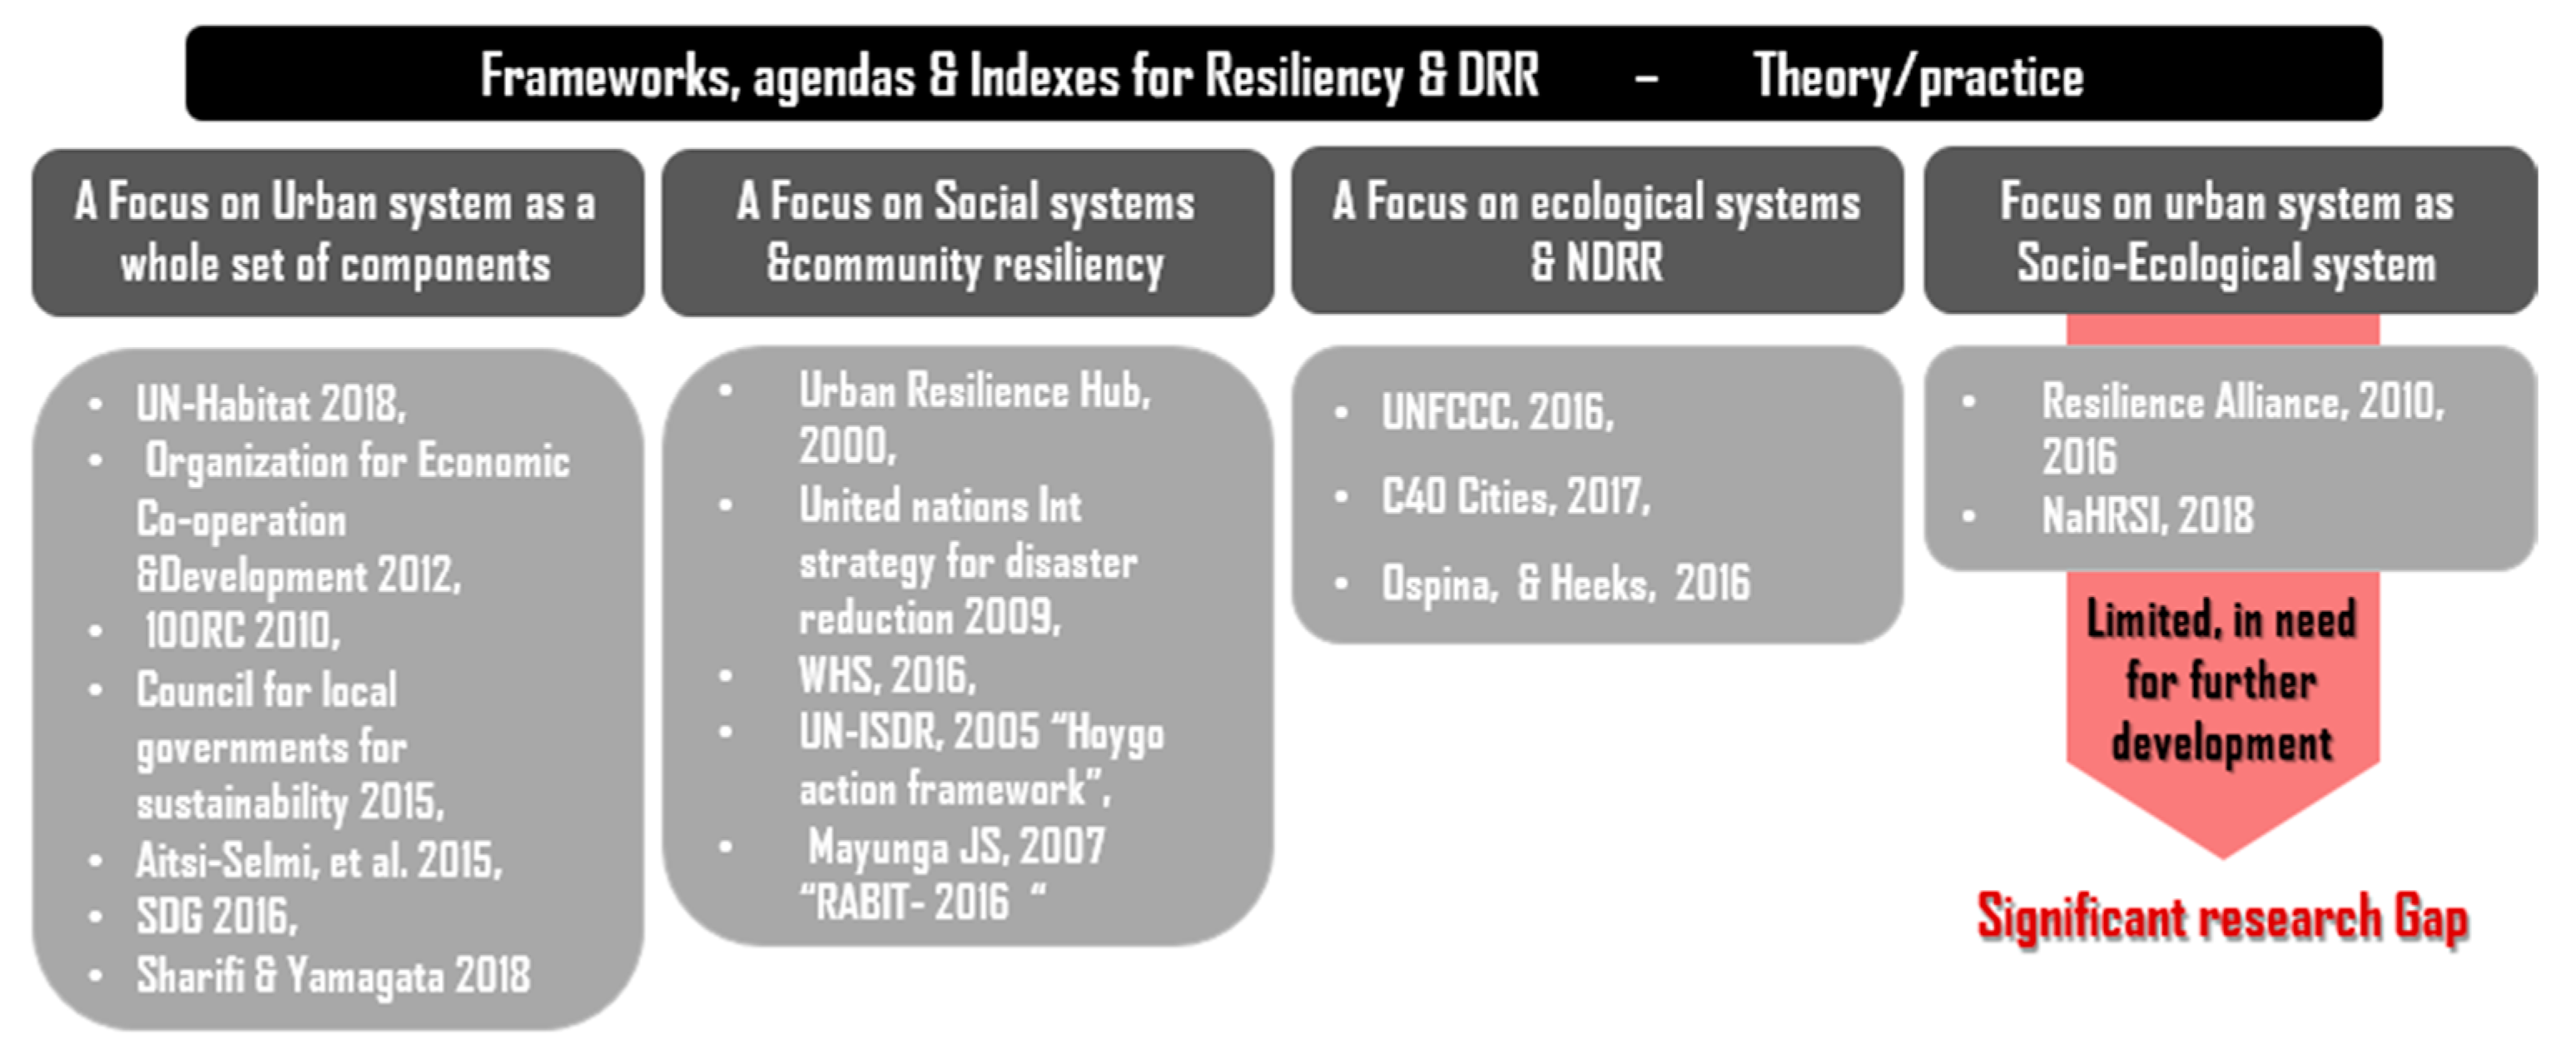
To further highlight the significance of approaching a framework for social ecological resiliency building, the study explores the available frameworks and agendas between theoretical studies and real practice. However, the research is limited to the contribution of the resiliency enhancement of disaster risk reduction “DRR”. A literature review was conducted to justify the research gap on the availability of frameworks that focus on human ecosystems where the resiliency of urban communities is investigated from a socio-ecological perspective [35,36,37,38,39,40,41,42,43,44,45,46,47,48,49,50,51].
The frameworks reviewed start from the early 21st century, and the review explores the availability of two main agendas. Firstly, a framework for resiliency and DRR in practice was published by the Resilience Alliance organization in 2016, where social ecological perspective was taken into account in urban systems. However, it is acknowledged by the organization itself that the issue is context-sensitive and is in need of further development. Since then, there has been no further publications. Secondly, within theoretical studies, a framework for resiliency and DRR on social ecological systems was published in 2018 by NaHRSI. This resource is considered as a theoretical approach and does not present any methods or tools for translating it into real practice. The literature review conducted provides evidence that there is a significant research gap on the aforementioned topic, as summarized in Figure 2.
Following the theoretical framework, the study focuses on the introduction of the methodology, where various tools such as axial connectivity, axial integration, axial mean depth, segment radius, and VGA connectivity are utilized to indicate areas with the highest nodes of human activities and intersections. This evaluation process is followed by a discussion of the results, conclusion, and further research opportunities.

2. Materials and Methods

2.1. Study Area

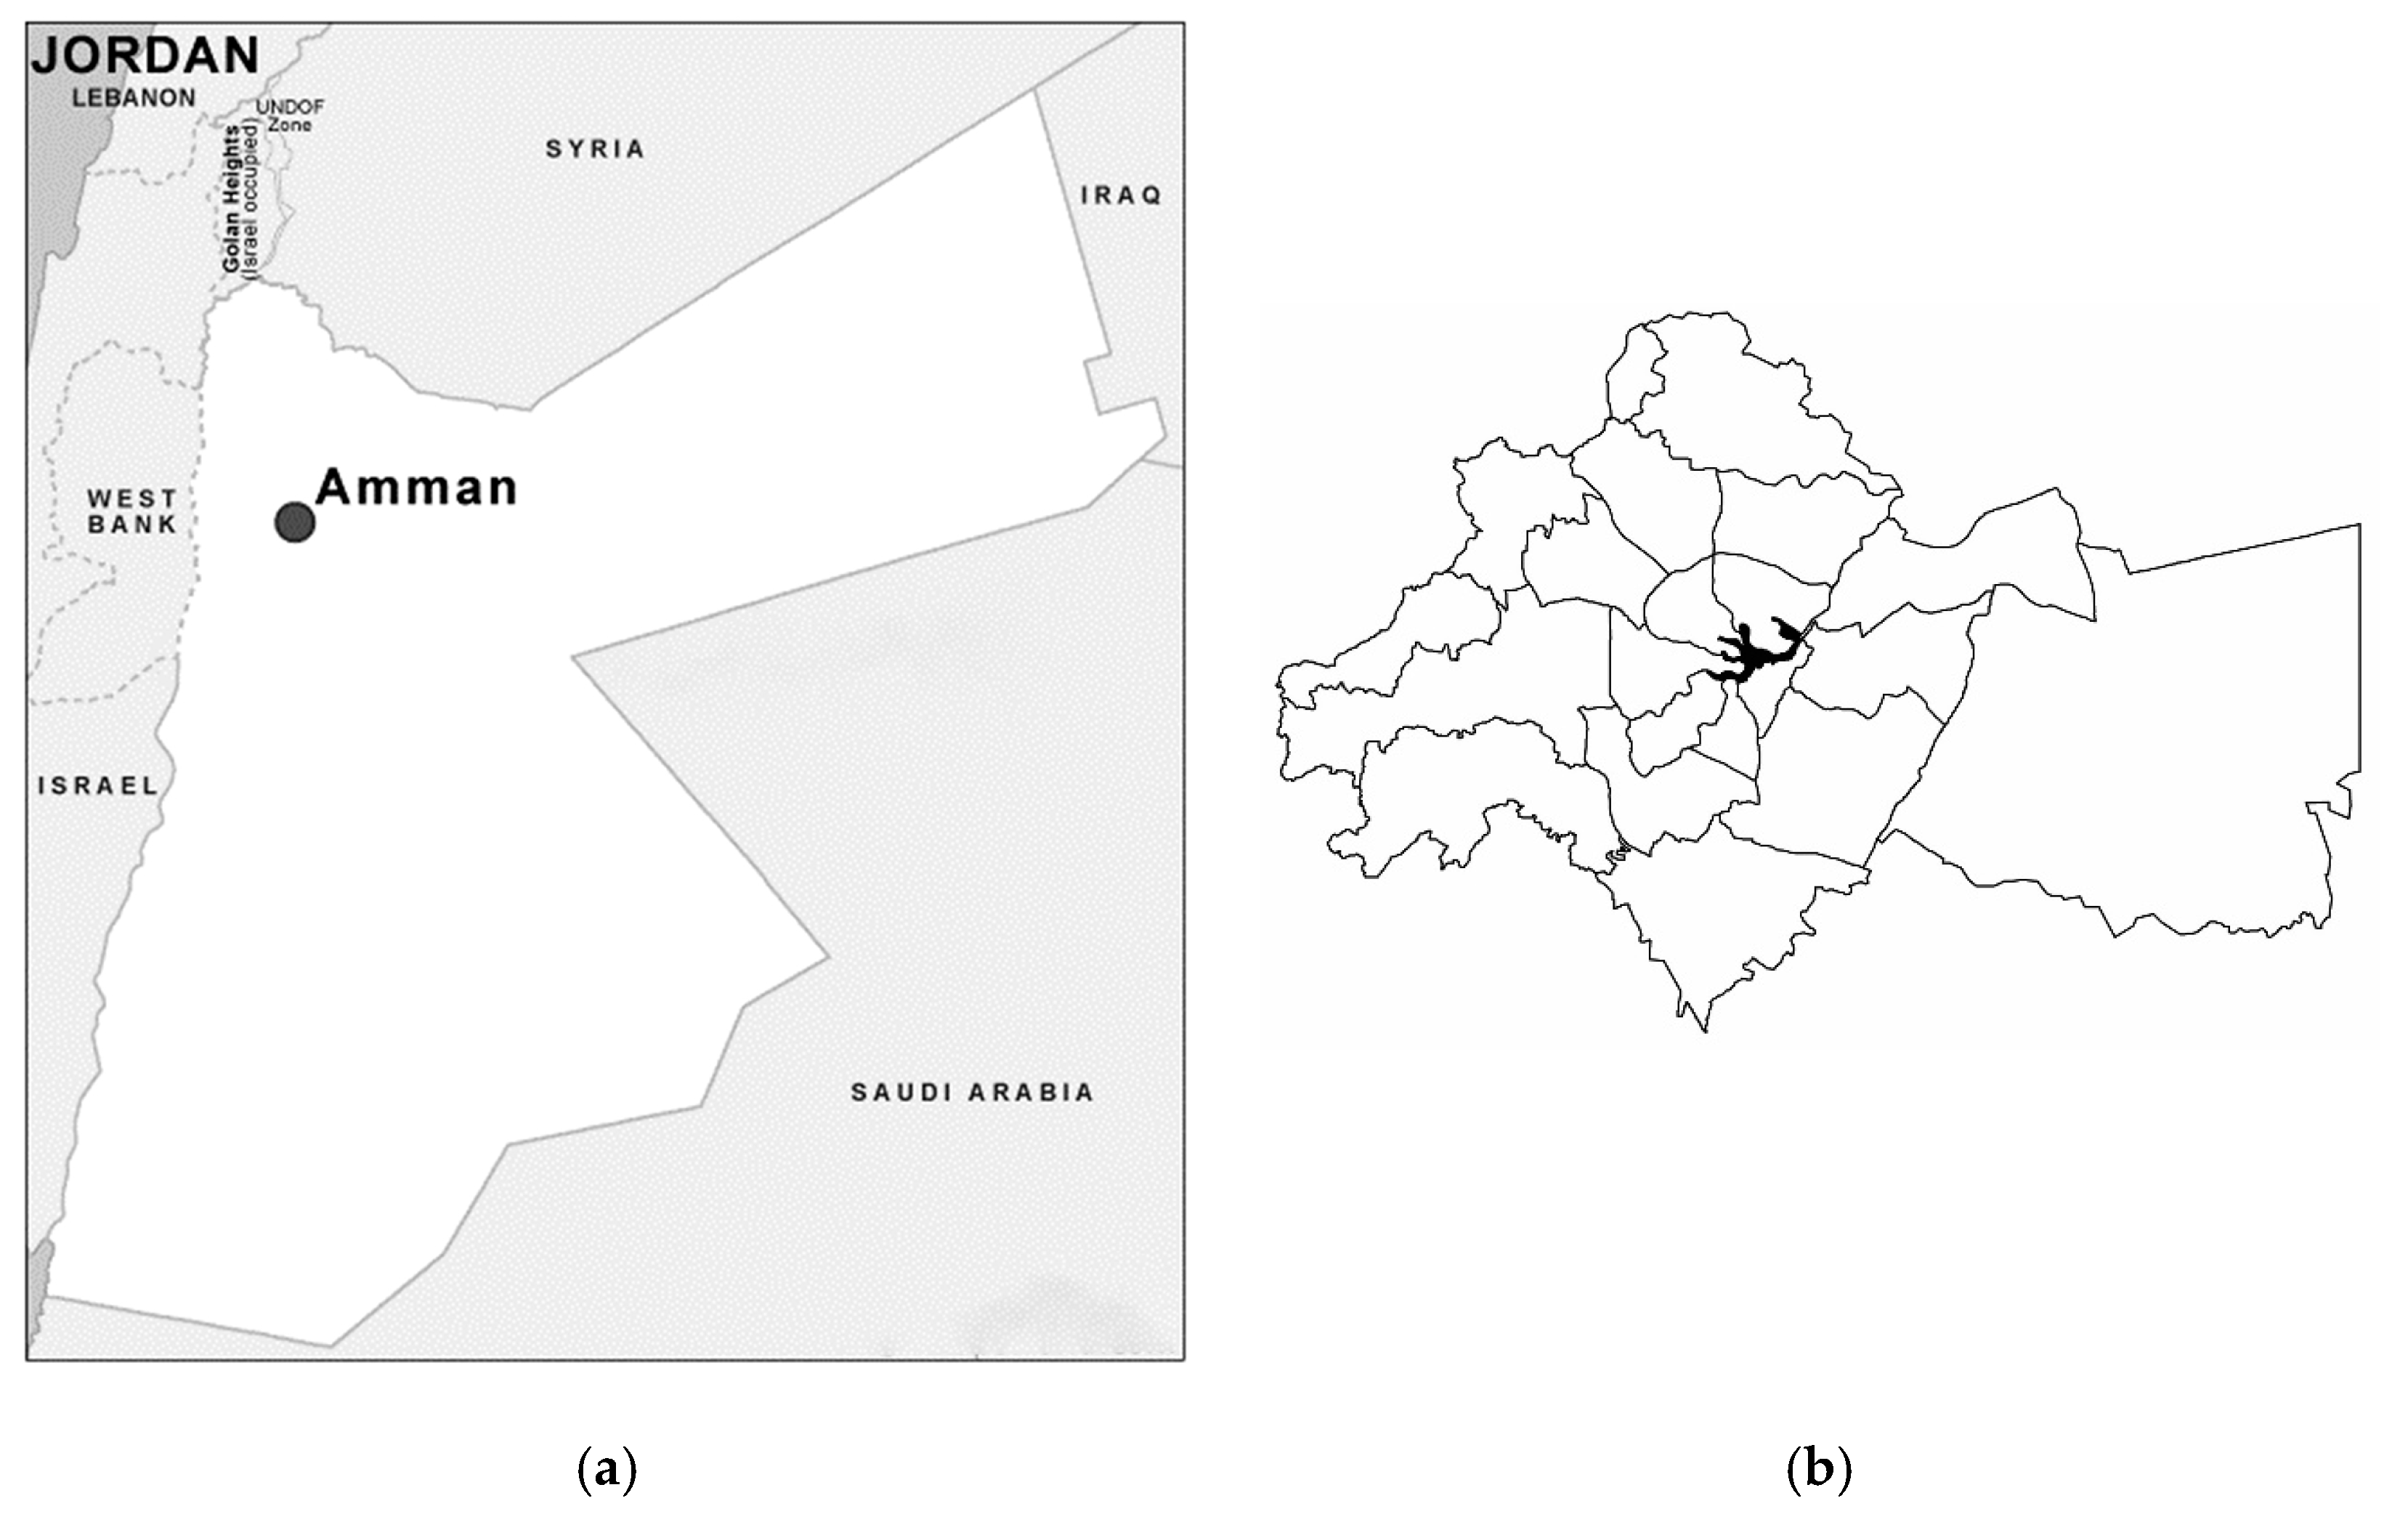
The city center of Amman, Jordan, shown in Figure 3, is selected as the case study of the research where the proposed methodology is tested.
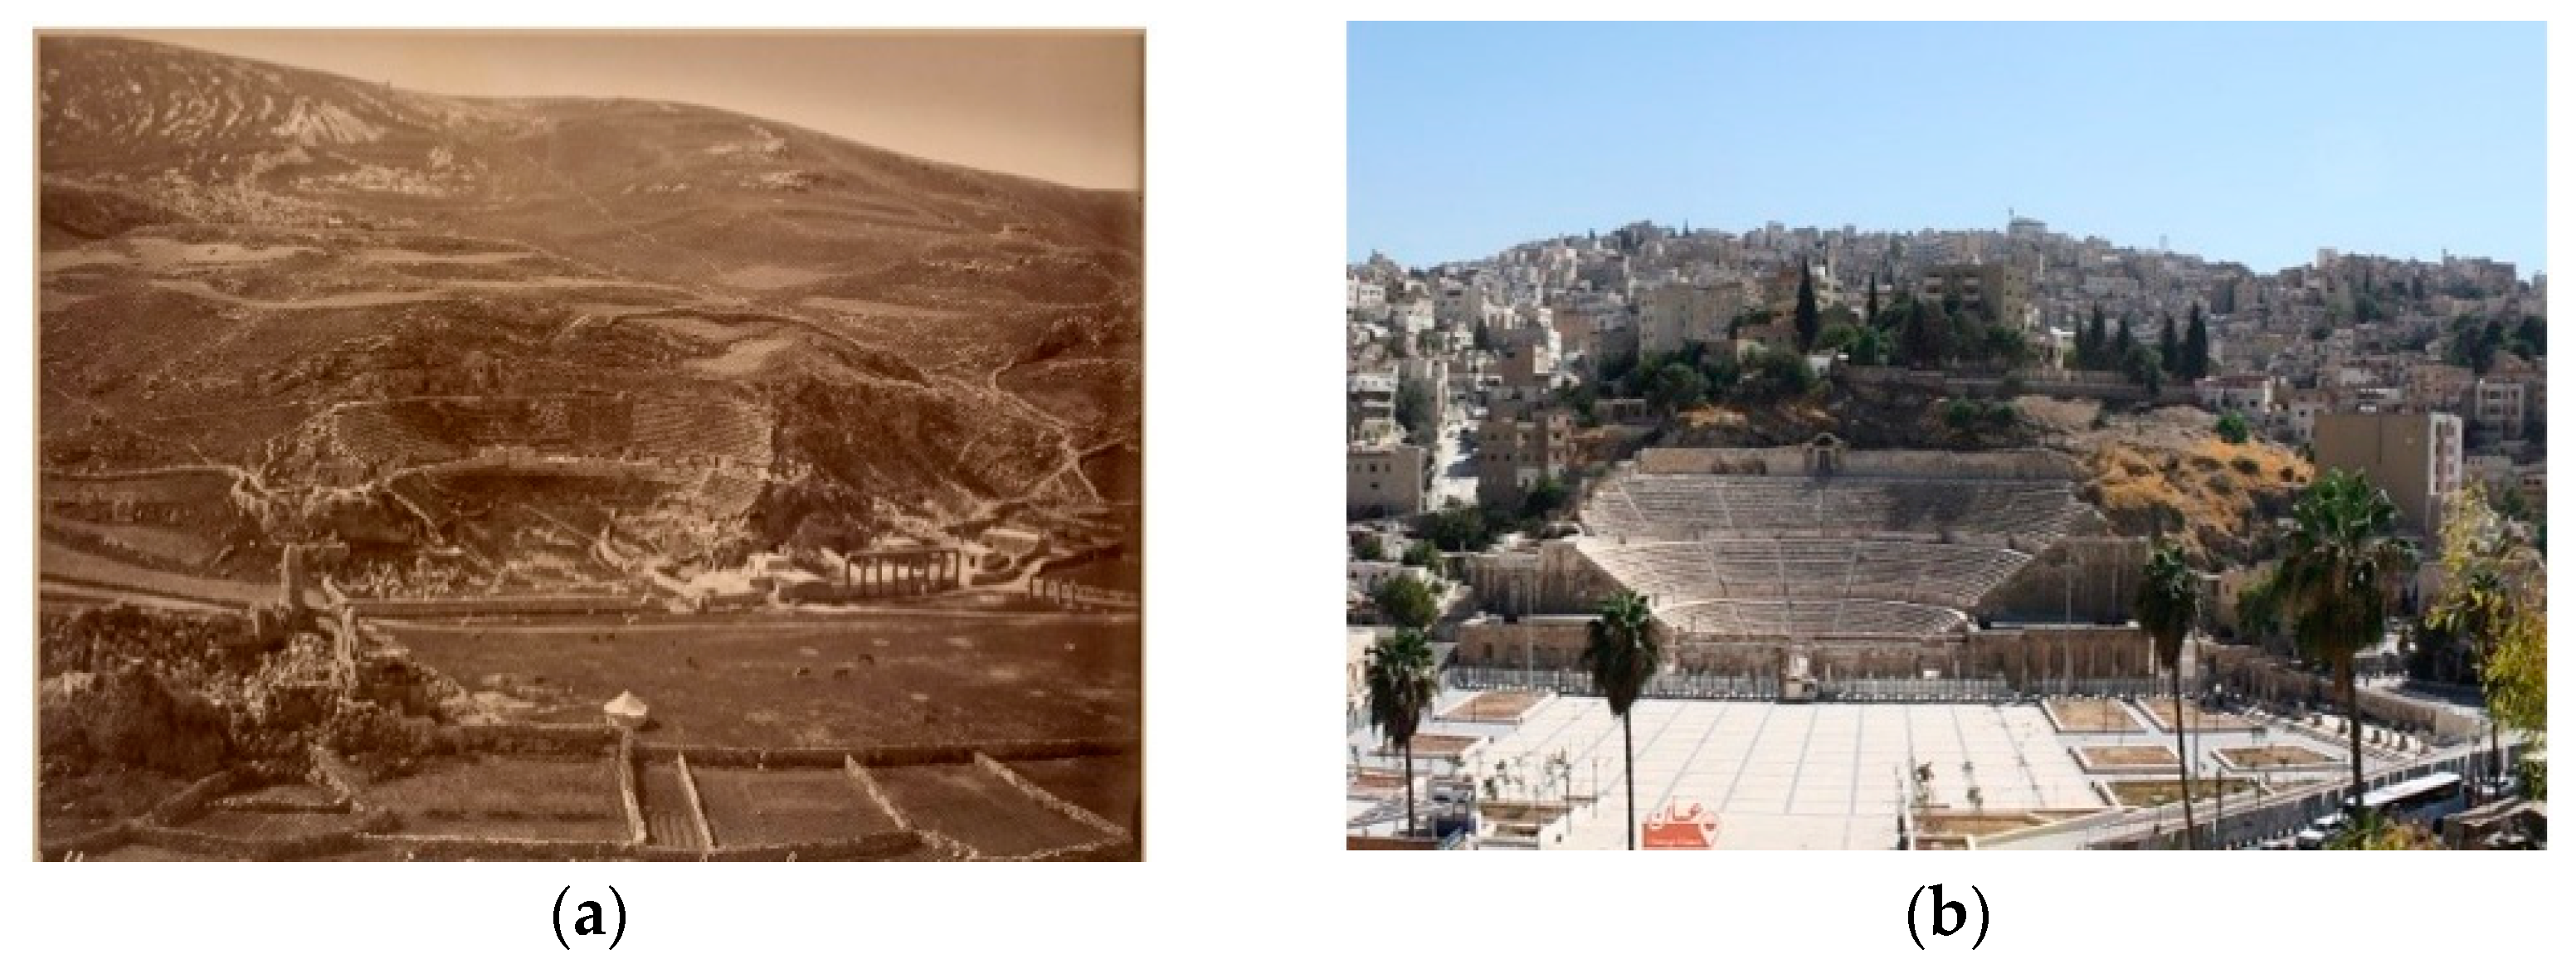
The capital city of Amman, Jordan, is considered to be one of the fastest growing and most populated urban settlements both in Jordan and out of all of the Middle Eastern countries. The pace of urbanization in the city of Amman is highlighted as phenomenal. Only inhabiting 3000 inhabitants in the late 19th century, the city grew to exceed 6 million in the early 21st century. This growth started from the nucleus of what is known as Al-Madinah; factors such as the remains of the presence of the Roman empire and a natural water stream have attracted immigrants from other countries and locals from surrounding mountains to settle in the city center [54,55]. This is evident in Figure 4, where the current view of the site around the roman theater is compared with the late 19th century view.
The huge amounts of unplanned, built-up areas emerging from and concentrating in the center of the city left it with insufficient areas of natural environment. This resulted in decreased landscape connectivity and increased fragmentation between the patches that still exist, especially after the natural water stream was covered to become a part of the busy street network. Indeed, doing so has resulted in increased disturbances for the urban communities within—both social and ecological—, such as limited green spaces and natural resources such as water supply. The rapid urban expansion did not only lead to increasing climate related disasters, air pollution, elevated temperatures, and surface floods, but also put pressure on the urban infrastructure. Consequently, the urban structure of the city became vulnerable and now requires to be enhanced in terms of the resiliency capacities of its components [57,58,59].
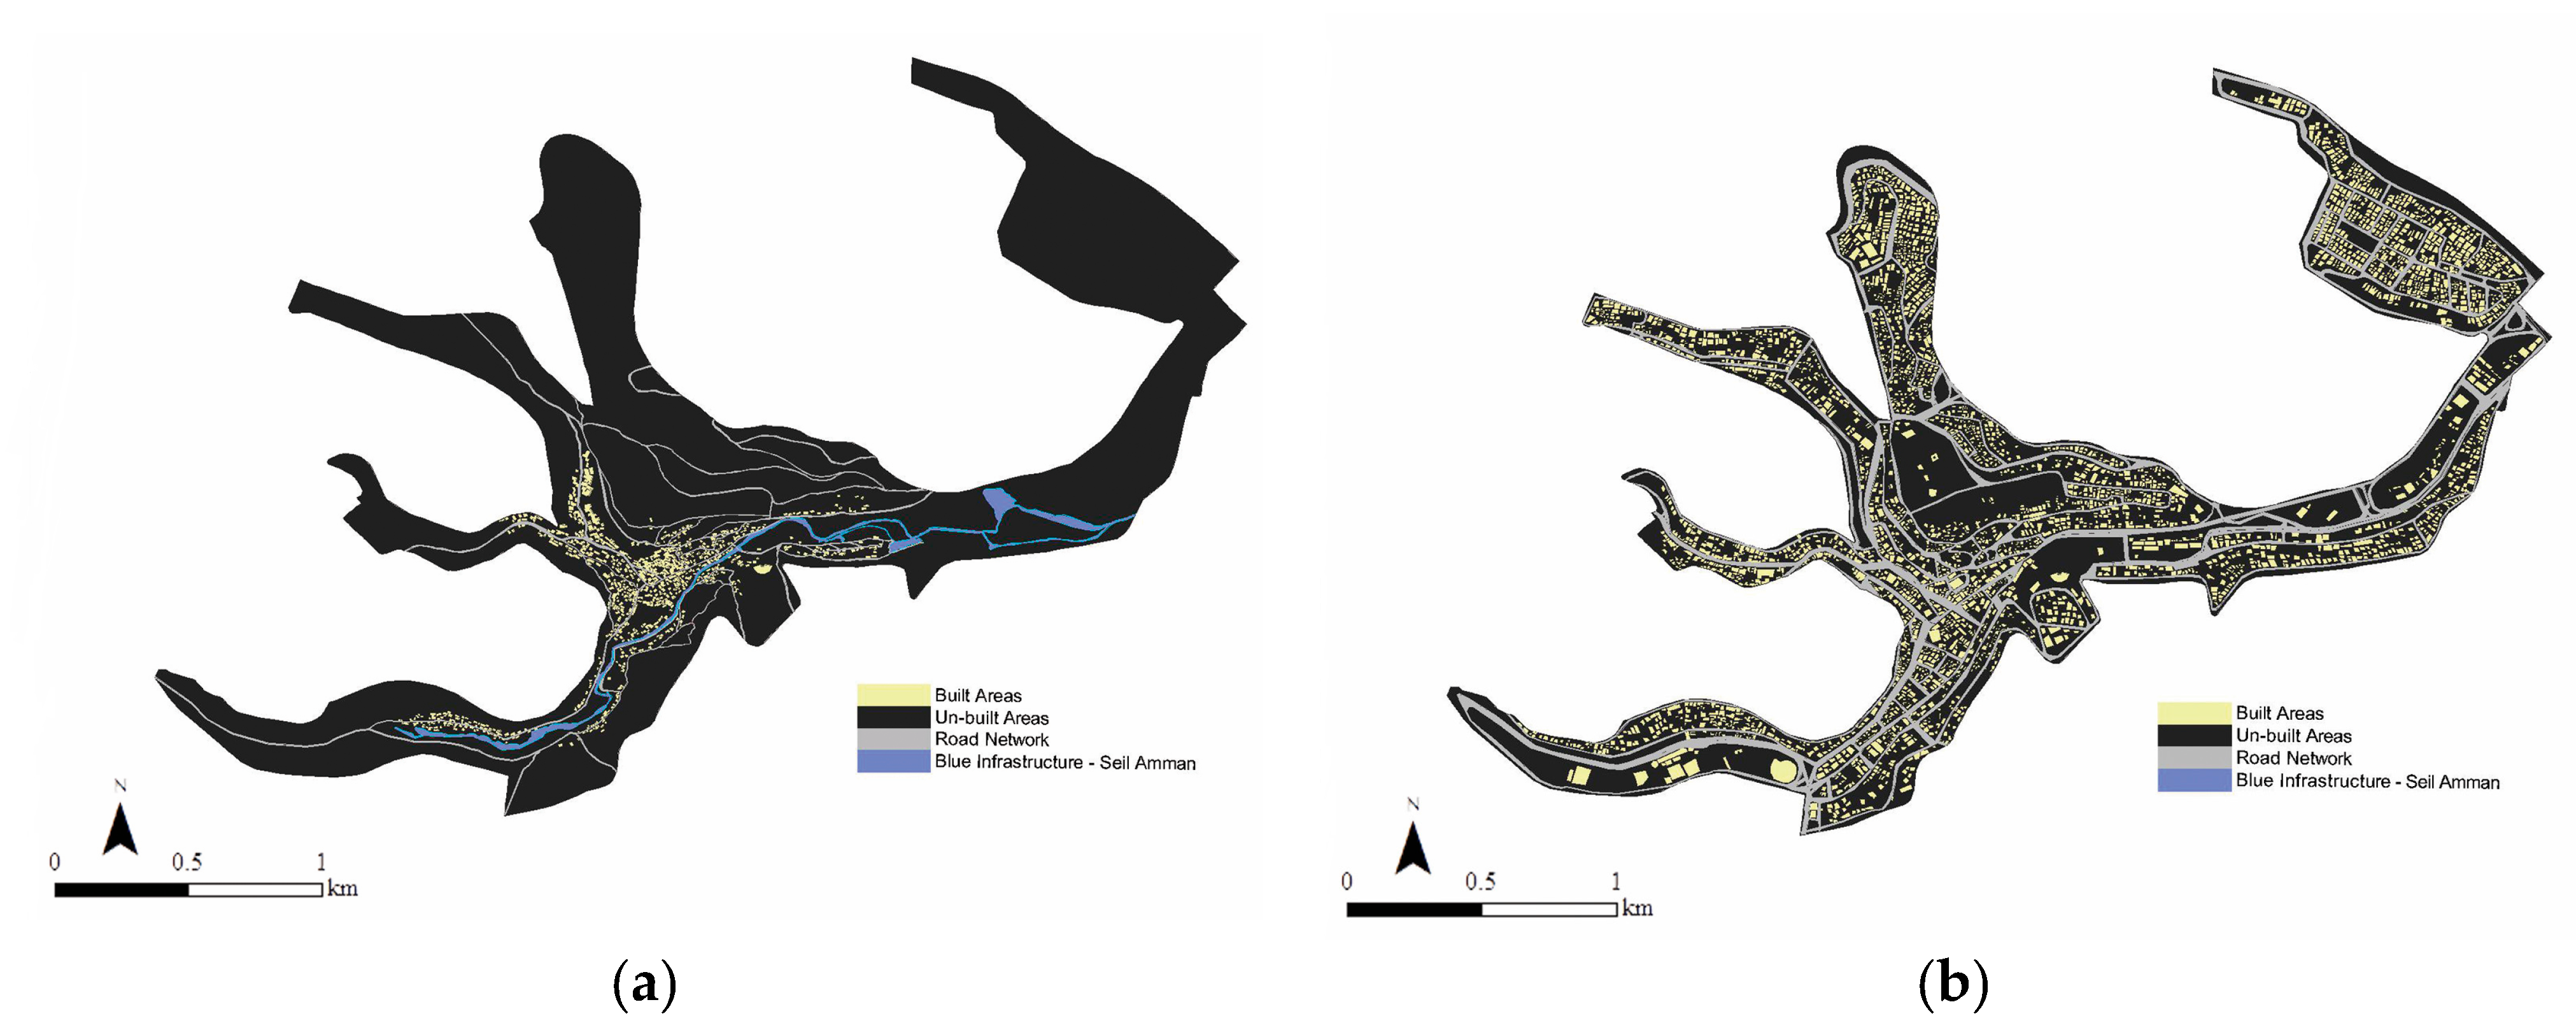
To this end, the city center of Amman is further assessed to test how GI can be implemented to increase social-ecological resiliency so that NDRR can be achieved. The maps in Figure 5 highlight the urban infrastructure (street networks and buildings) of the city center of Amman, showing the sprawling urban pattern and degraded natural environment from the early 20th to the early 21st century. While the acquisition of these maps belongs to the researchers, an up-to-date geo-referenced 2022 map was acquired from Greater Amman Municipality’s “GAM” official Geographic Information System “GIS” department and has been adapted for specific layers of this study and was also used in the mapping analysis of human ecosystem spatial networks.

2.2. Tools and Process

2.2.1. The Use of Space Syntax Theory for the Mapping of Human Spatial Networks

Theories of space syntax come from the notion that the structure of space is what defines the behavior of societies living and moving within. The theories strongly emphasize the relationship between urban layouts and human spatial patterns [61,62,63]. Within its space logic, the theories of space syntax have a set of techniques and methods that analyze spaces such as urban layouts from the perspective of how individuals understand, flow, centralize, move, and access spaces. Those techniques that grew significantly within urban fields are quantitative in nature, as they are based upon mathematics, whereby a graph can be defined as a pictorial representation to represent space using special spatial units such as axial lines which signifies movement, convex spaces that represents interaction, and isovist fields that symbolizes orientation through space. Accordingly, maps conducted through space syntax tools such as depth map analysis software are different, allowing visualization of human spatial patterns according to the spatial units and techniques applied. Space syntax methods are very analytical, providing a clear description, reading, and comparison of several human spatial patterns within space [64,65,66,67,68].
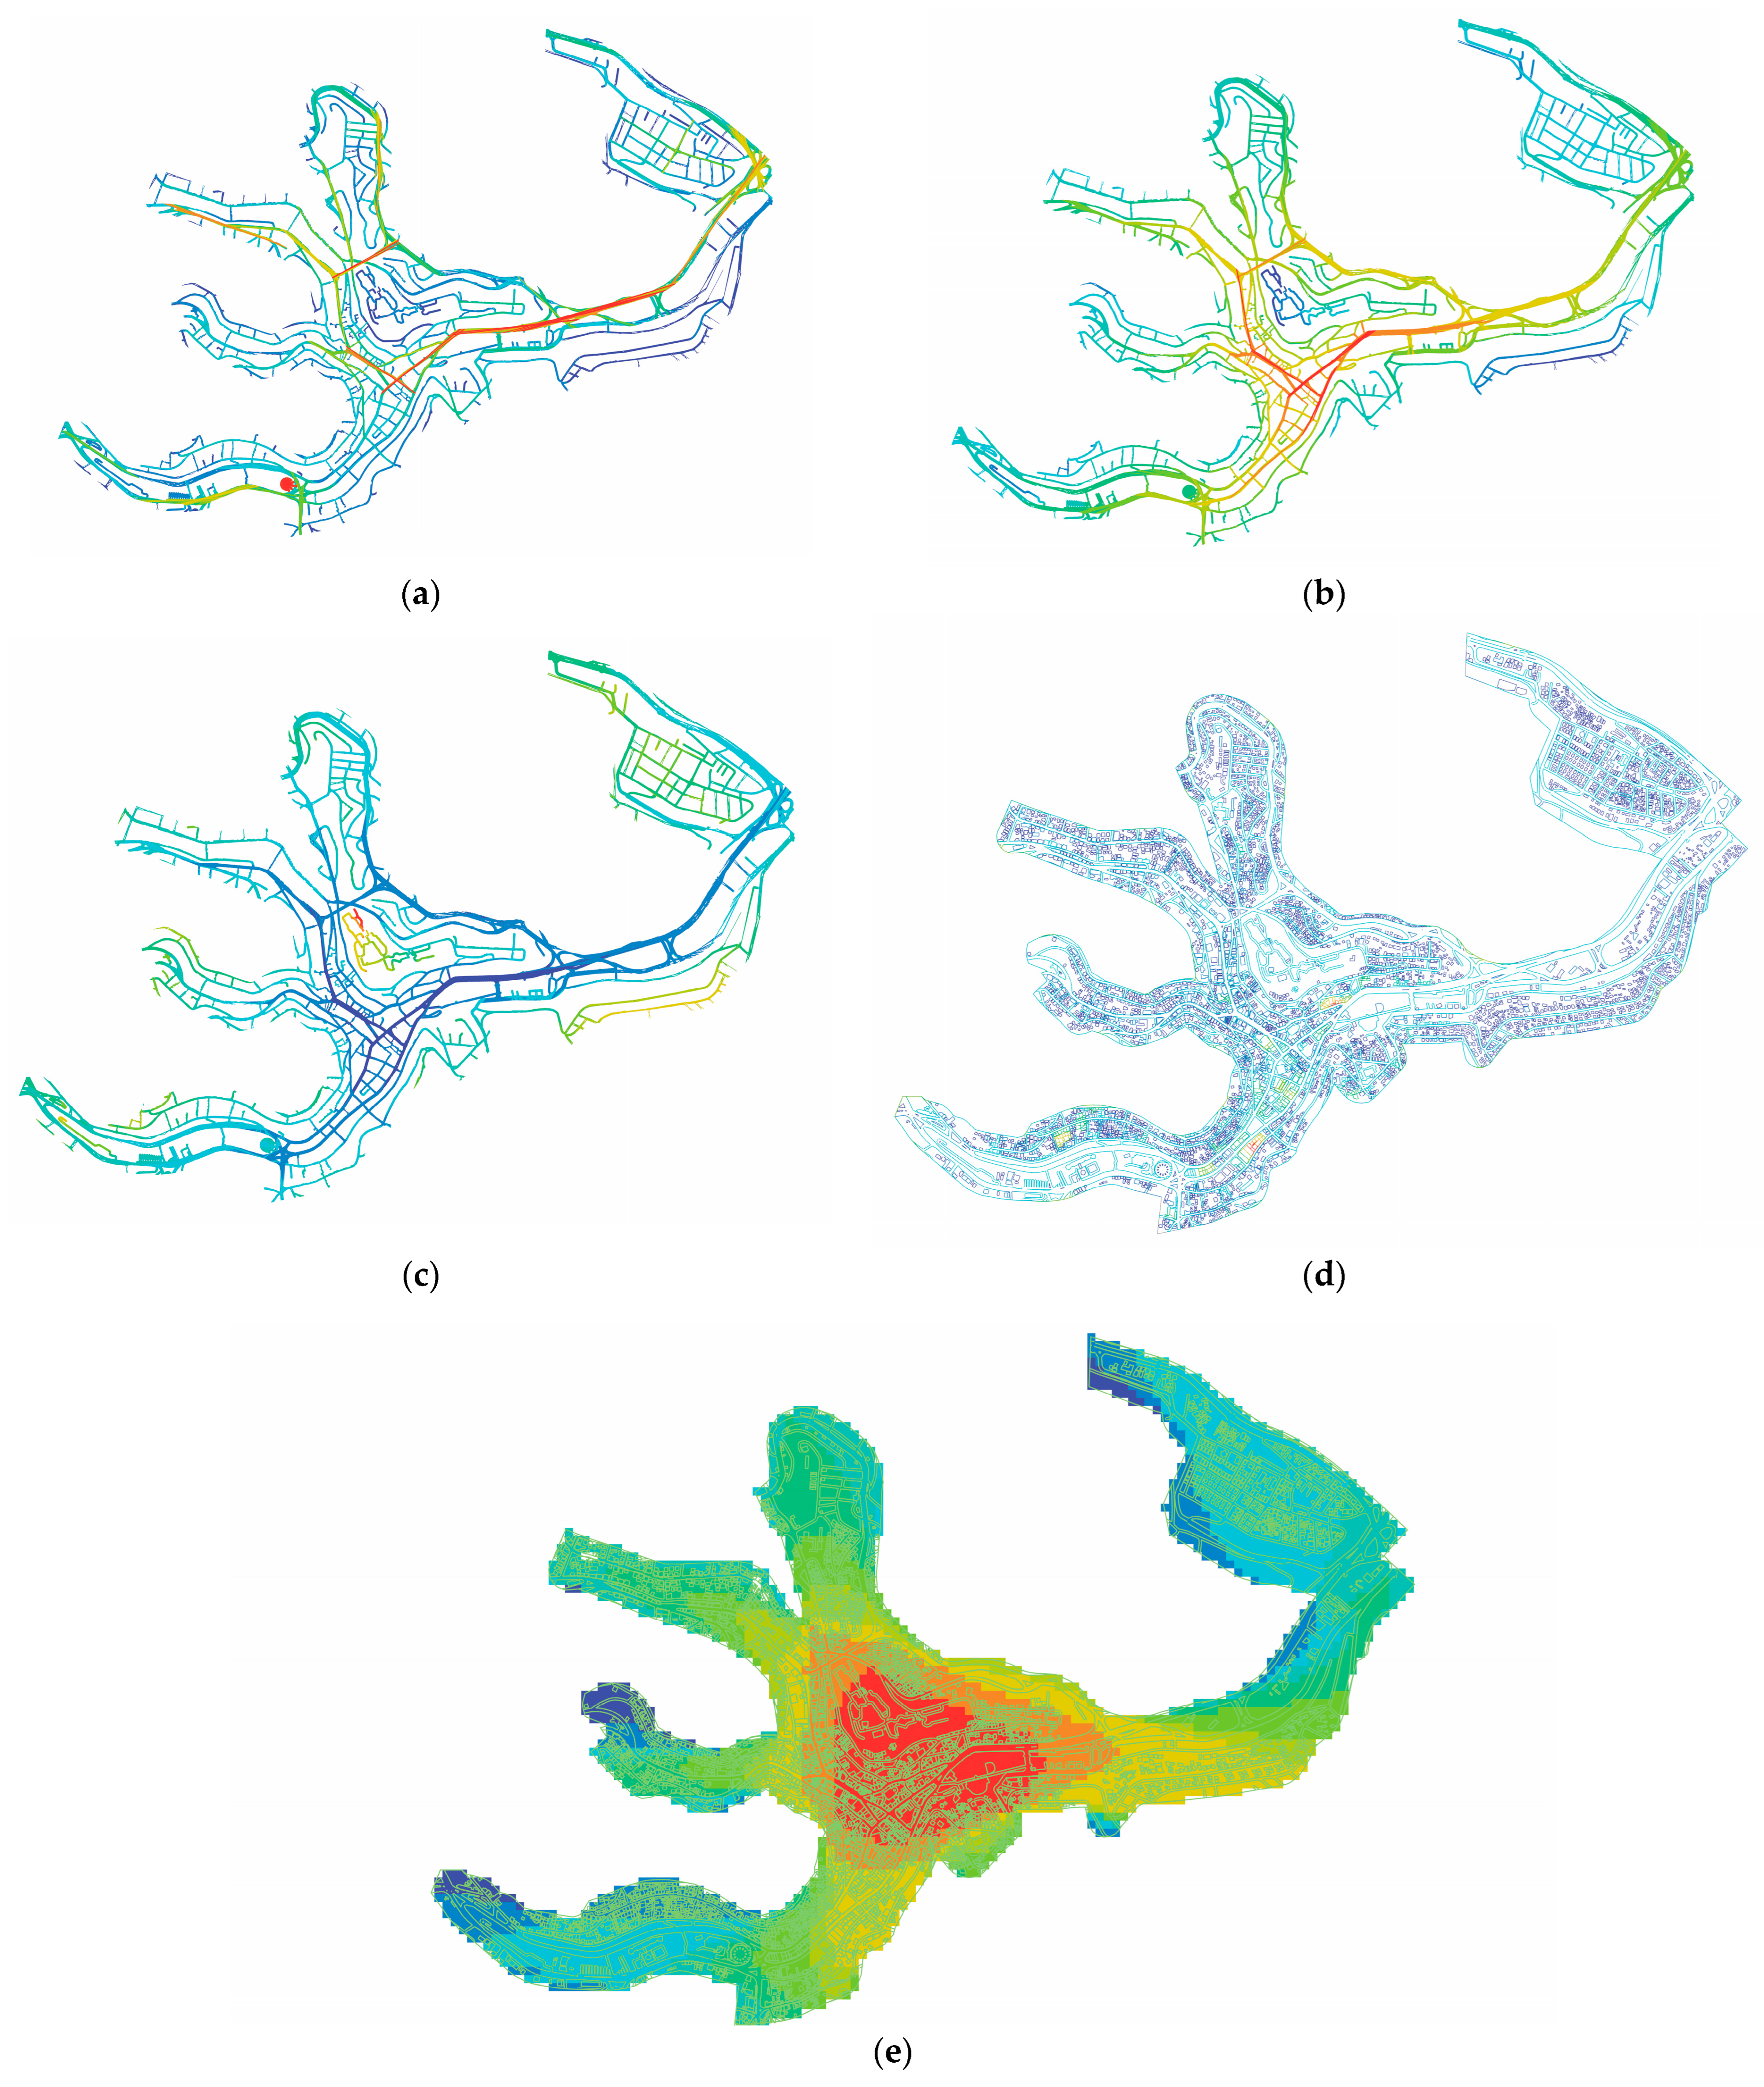
To this end, this research uses specific space syntax methods utilizing depth map analysis software to explore the space structure and human relationship so that human spatial patterns can be created. Most studies acknowledge this method as an effective, fast, and efficient way to evaluate urban contexts from a human perspective [69,70]. In summary, the specific methods used are as follows: axial connectivity that indicates flow by road value; axial integration that indicates ease of access; axial mean depth that indicates choice of movement; segment radius that indicates expected desirable human flow given metric radius; and VGA connectivity that indicates areas with most points/nodes of human activities and intersections.

2.2.2. The Use of Graph Theory for the Visualization of Ecosystem Spatial Networks

Studies on developing tools for measuring landscape connectivity and enhancing the functional species response within nature exist but are limited. Functional connections of landscapes are derived from a theoretical base known as graph theory. The methods and tools within graph theory are considered as quantitative mathematical techniques that integrate species and population data such as behavior within their habitat, quantifying space. Their significance within the field of measuring and modeling landscape connectivity lies in their effective approach towards representing ecosystem spatial patterns [71,72]. Landscape connectivity is one way of studying natural space structure, known as patchiness, and its effect on species within [73,74]. Ecosystem spatial patterns are usually modeled to measure how functional every patch “element of nature” is to one another, how they are connected, and to visually describe and analyze the movement of populations between patches [75,76,77,78].
Within the scope of an urban context, urbanization activities cause the fragmentation of the ecosystem, thus increasing its vulnerability and decreasing resilience capacities, as fragmented patches of nature indicate decreased benefit from the natural resources [79]. Within this perspective, increasing landscape connectivity is considered to be an effective method towards enhancing ecosystem resilience; therefore, there has been increasing attention towards planning and implementation strategies to manage and conserve ecosystems to mitigate climate change and associated natural disasters [80]. This research models the existing patches of the fragmented ecosystem in the city center of Amman by utilizing a graph theory-based tool, namely the linkage mapper that operates within Arc-GIS platform, as an approach towards locating areas that represent barriers in its ecosystem’s functional connections.

2.2.3. Methodological Framework

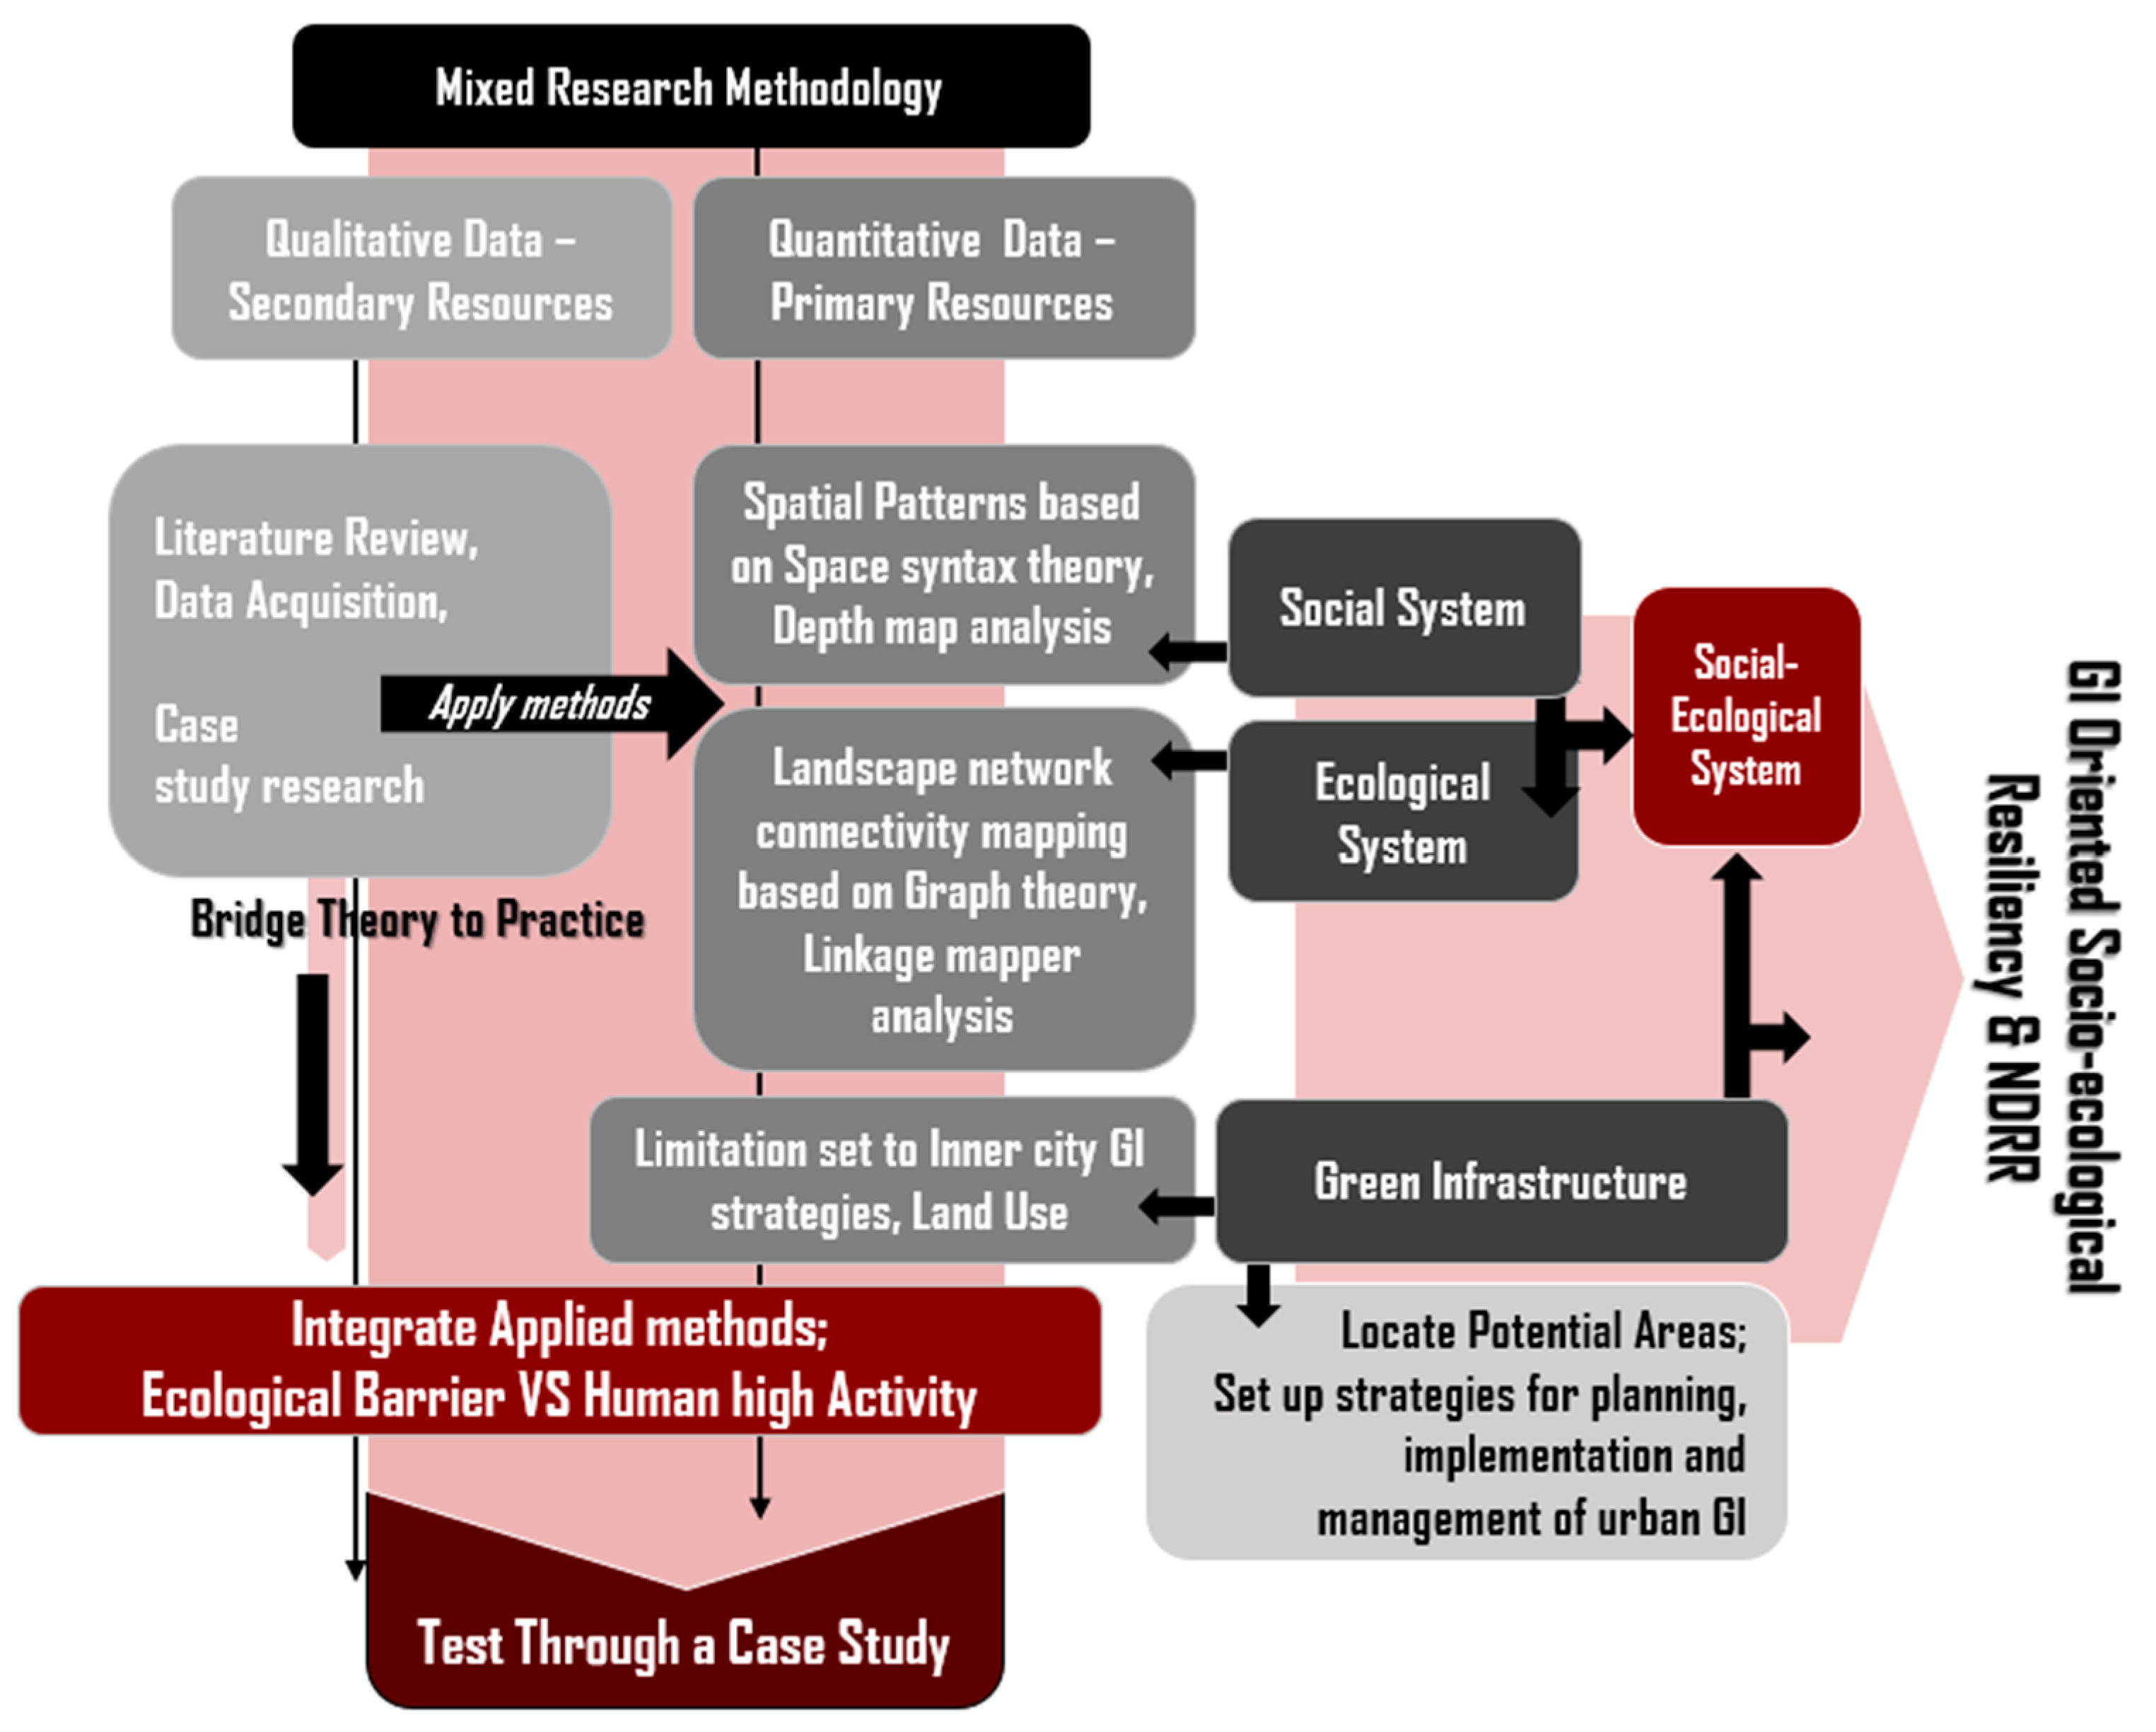
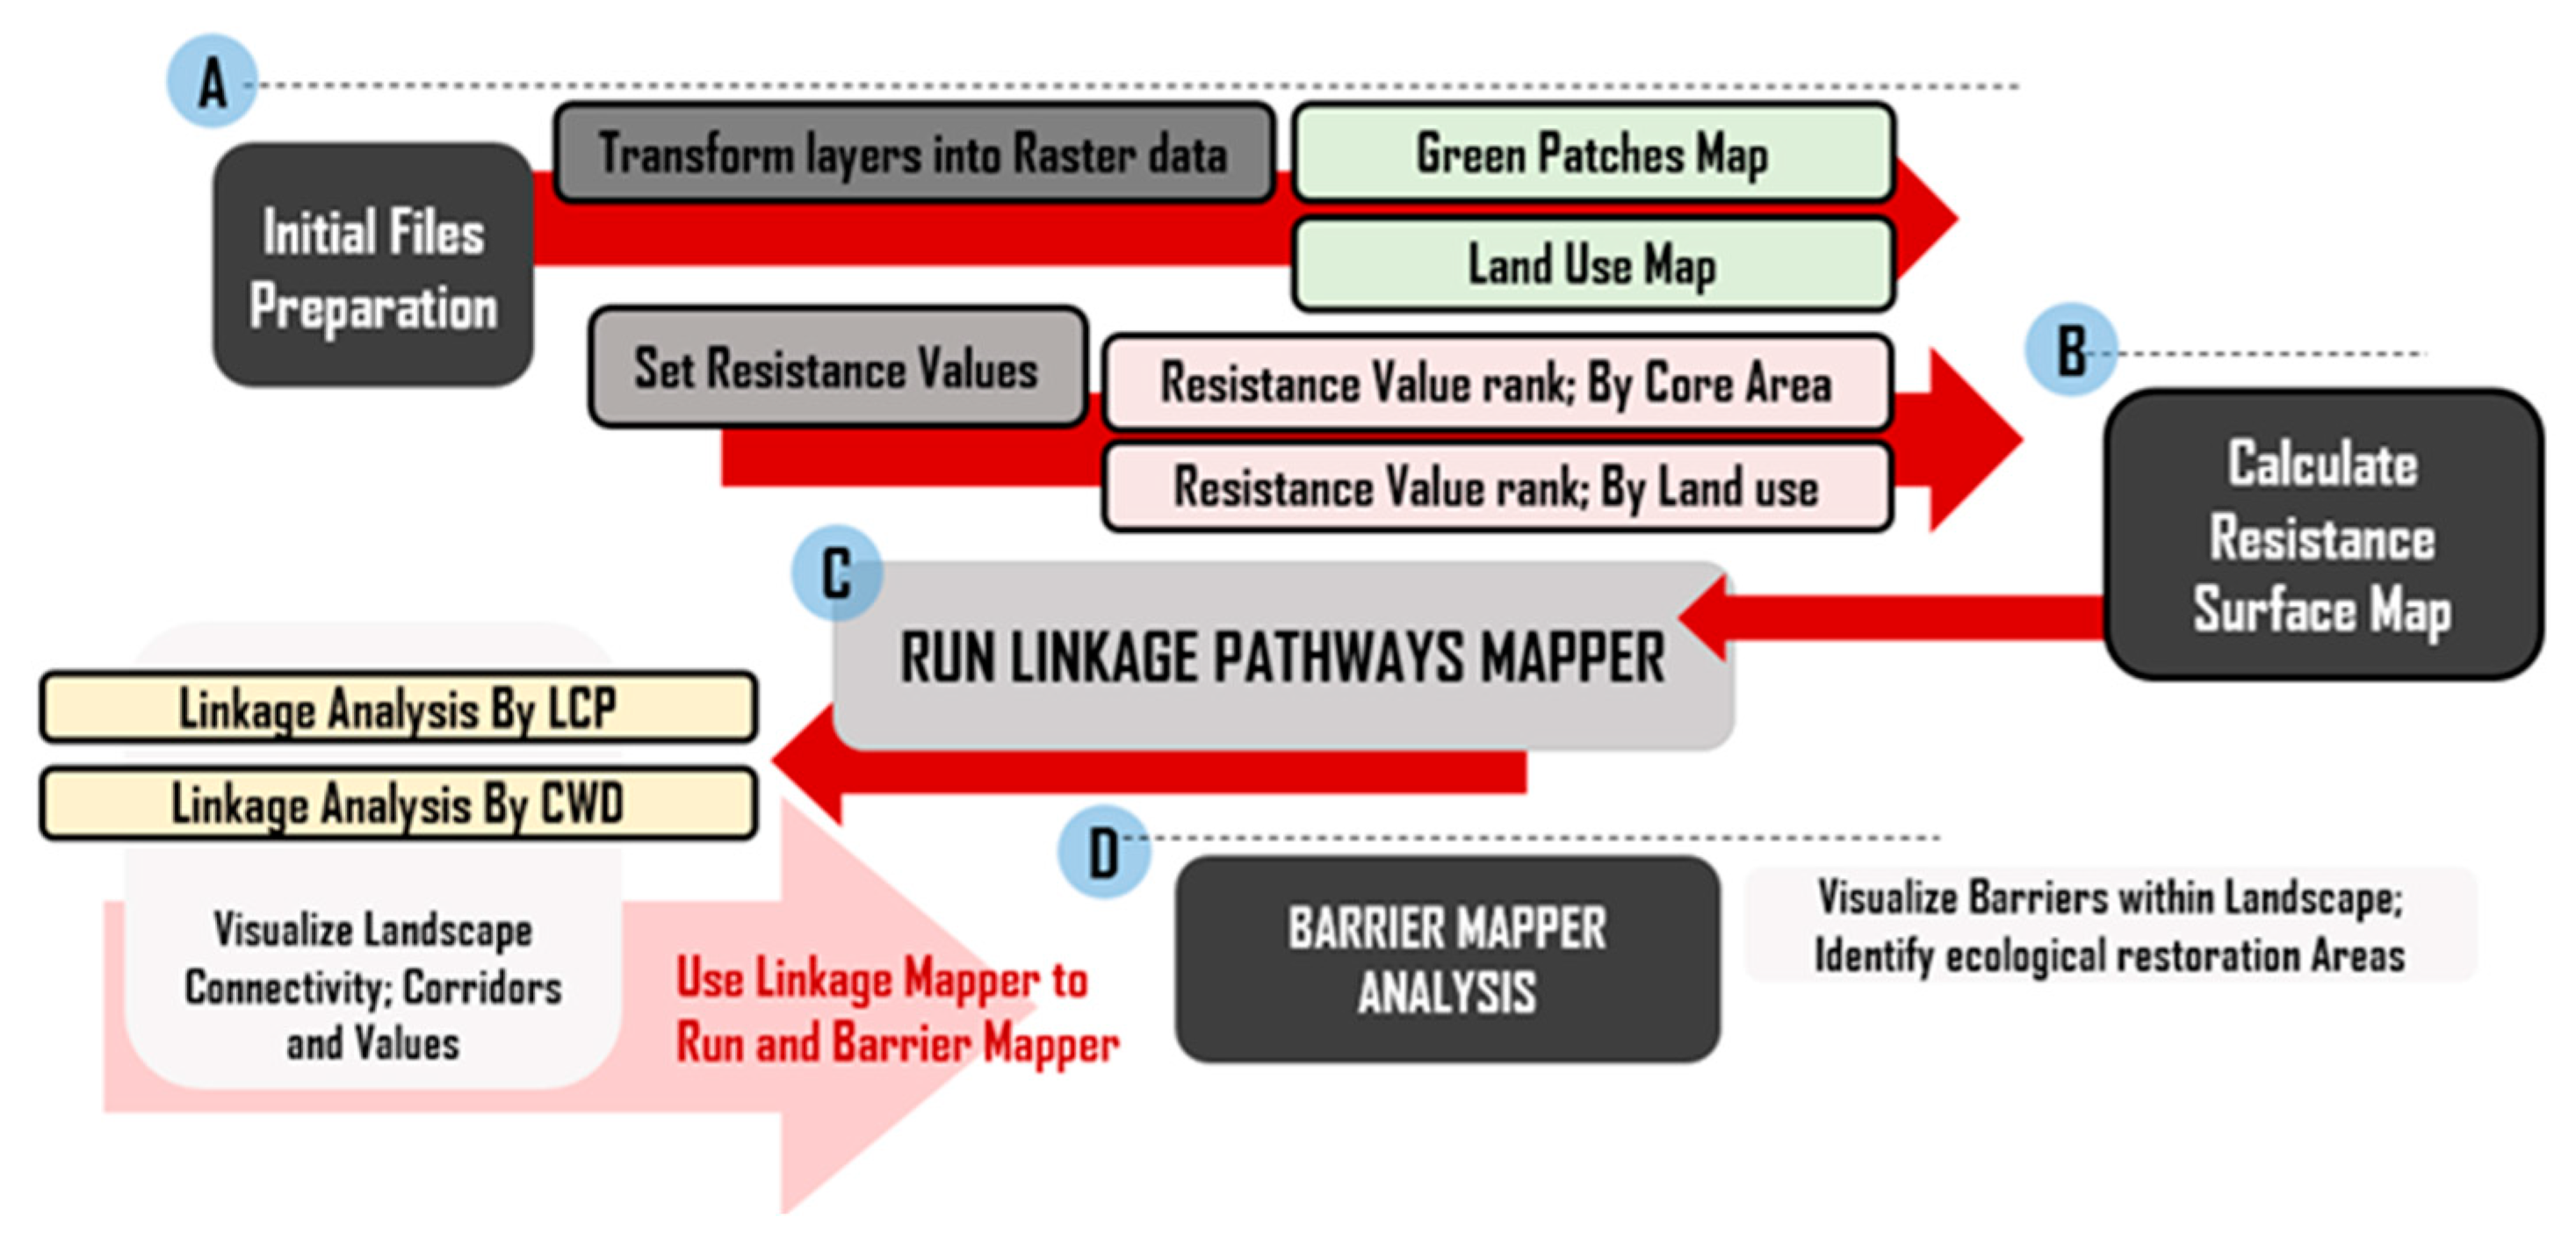
The study within its general methodology adopts a mixed research approach, whereby qualitative methods such as spatial analysis tools are used to assess the case study presented for the purpose of assessing and locating ecological functional barrier areas within human activity areas. This is achieved by the integration of both ecosystem and human spatial networks to propose potential urban GI strategies for enhancing both human and ecosystem health and well-being, thus improving the social ecological resiliency of the urban systems and capabilities for NDRR. The methods applied include a space syntax theory-based depth map tool for social spatial patterns, network mapping analysis, and a graph theory-based linkage mapper tool for the landscape connectivity mapping analysis of the ecological system. The study then utilizes the integration of both networks. The processes within the methodological framework of the study are briefly illustrated in Figure 6.

3. Results

3.1. Depth Map Analysis

A mapping analysis has been conducted to locate human spatial patterns within the study area using a limited specific set of techniques offered by space syntax based on a depth map analysis tool. The maps are used to investigate social–spatial relationships in the selected urban context (Figure 7). Selected techniques are as follows: from the axial map analysis, “Axial connectivity, Axial integration and Axial mean depth maps”; From the Segment map analysis, “Metric road network analysis/n = 100 map” and VGA map analysis.
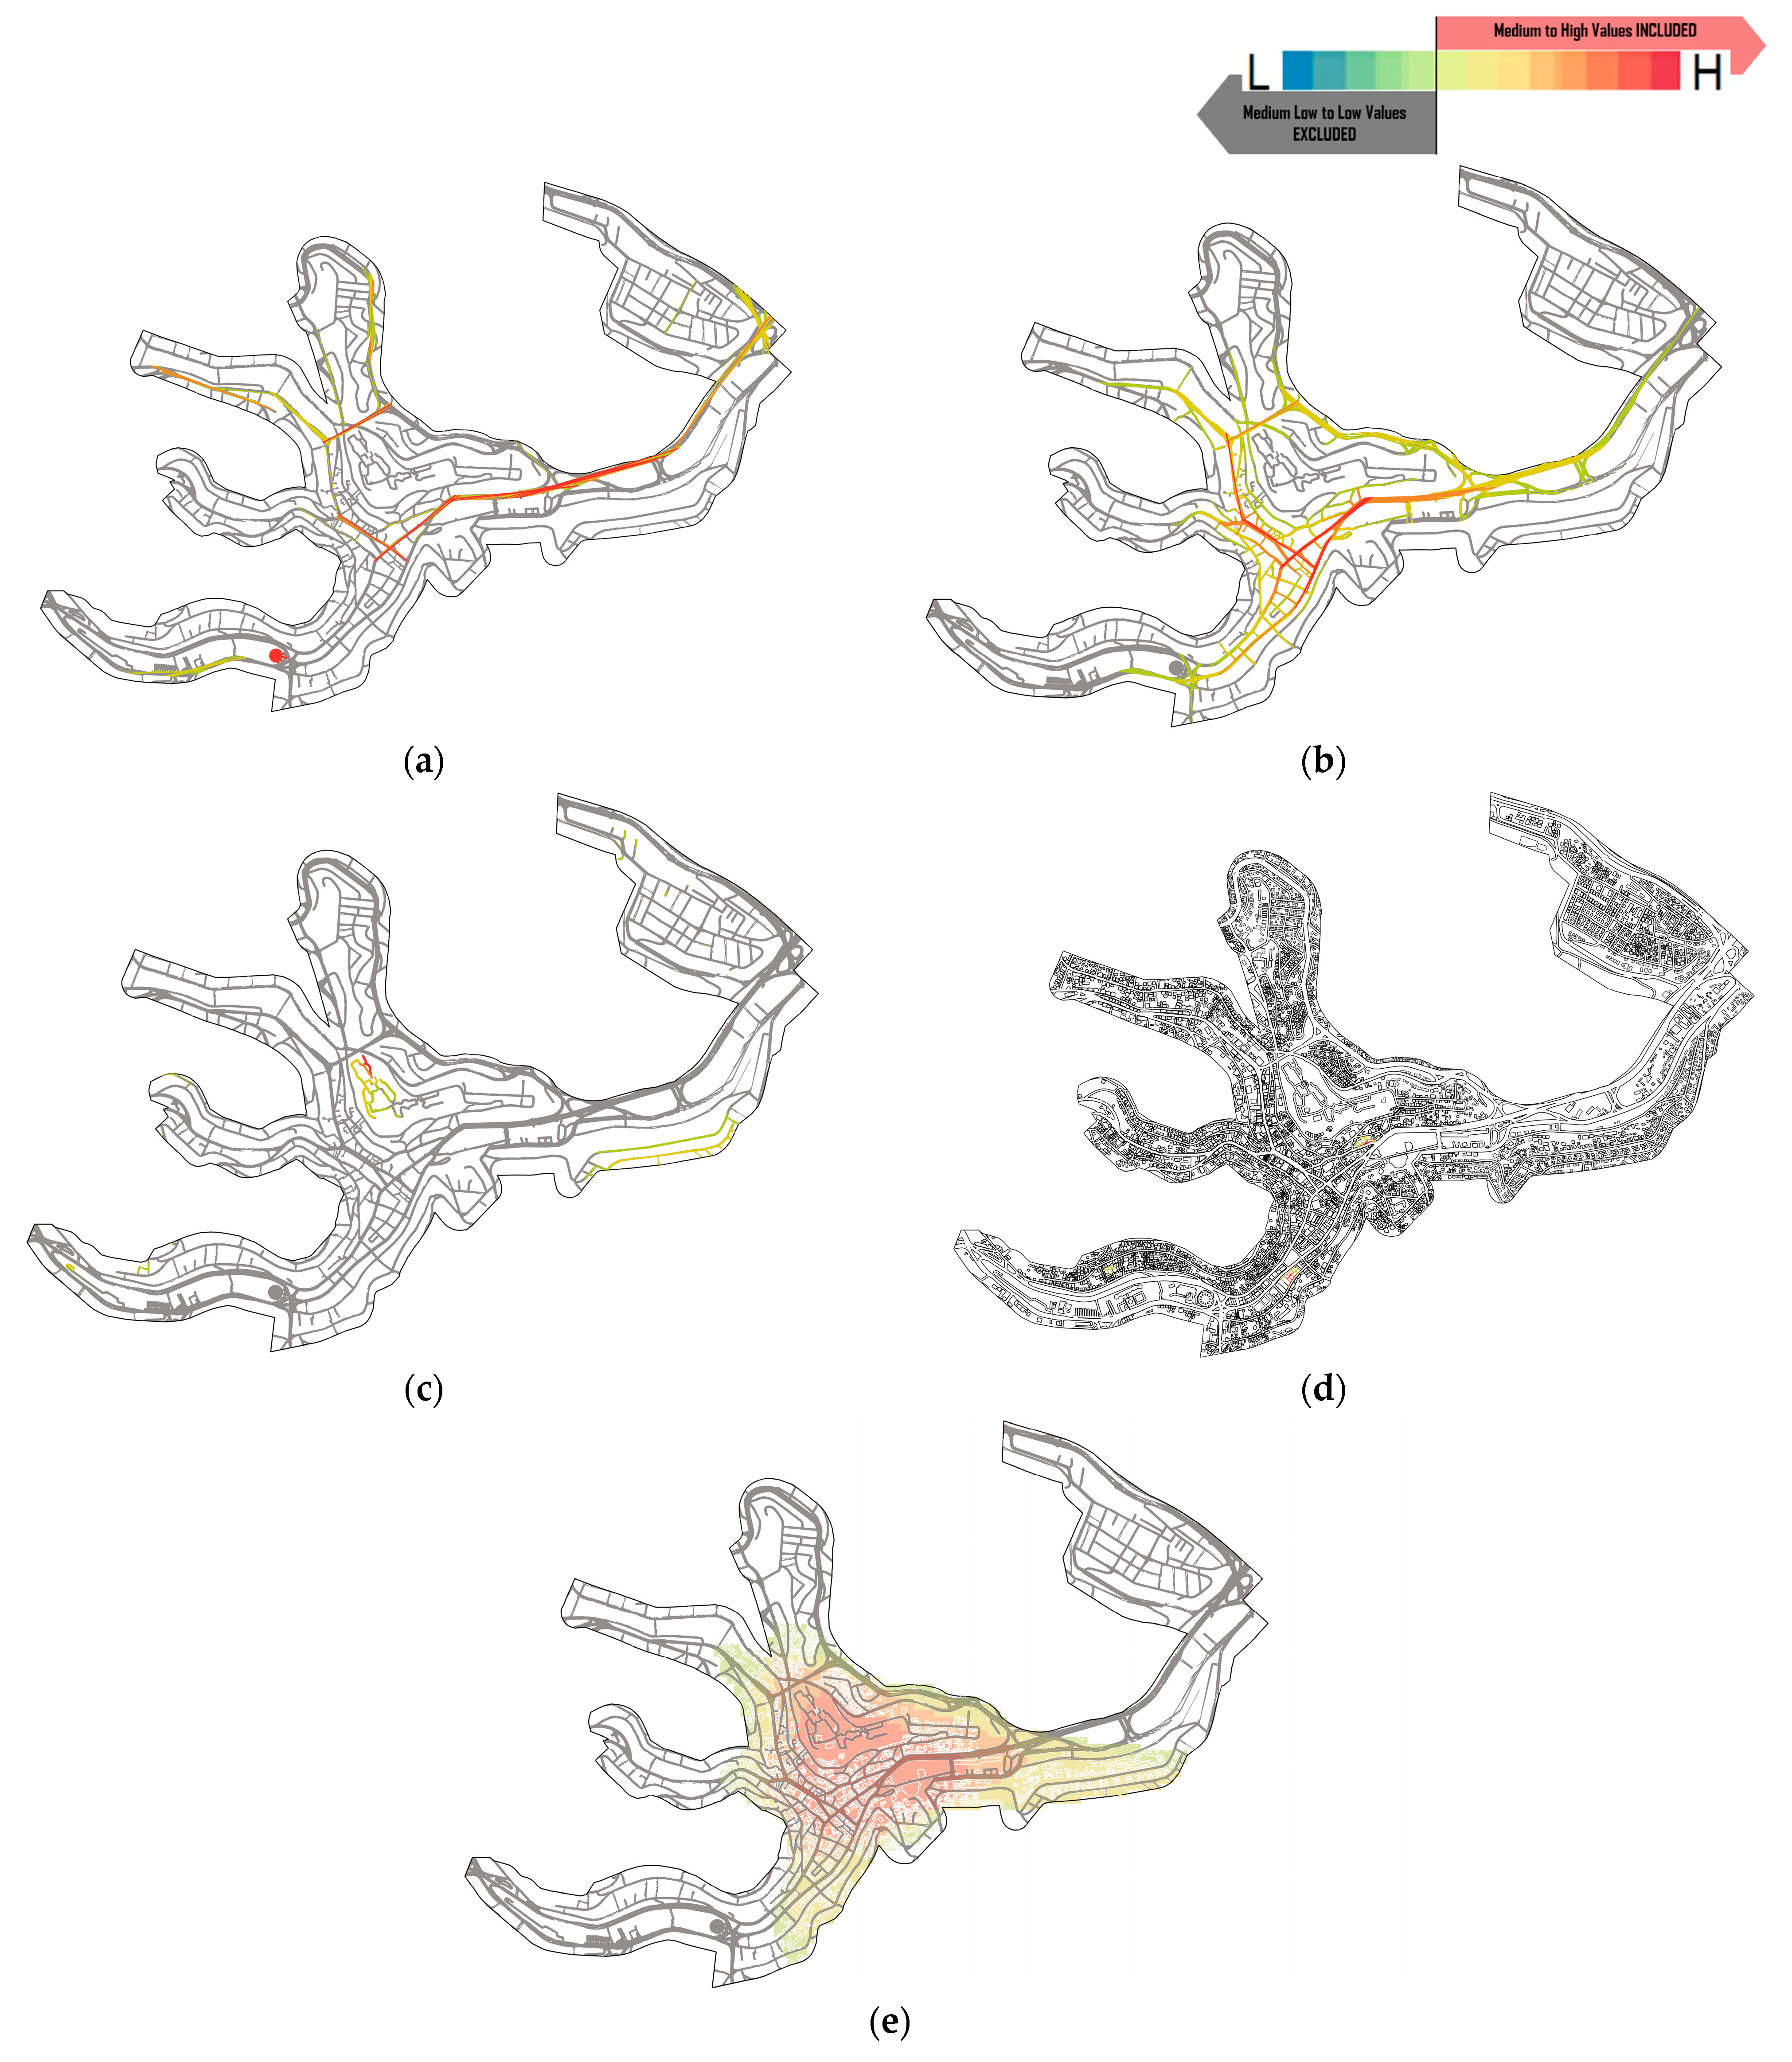
However, the research needed to achieve a comprehensive general human spatial pattern network map, namely the previous maps, were further limited to include medium to high values and then merged into one that excluded all low spatial values, as indicated in Figure 8.
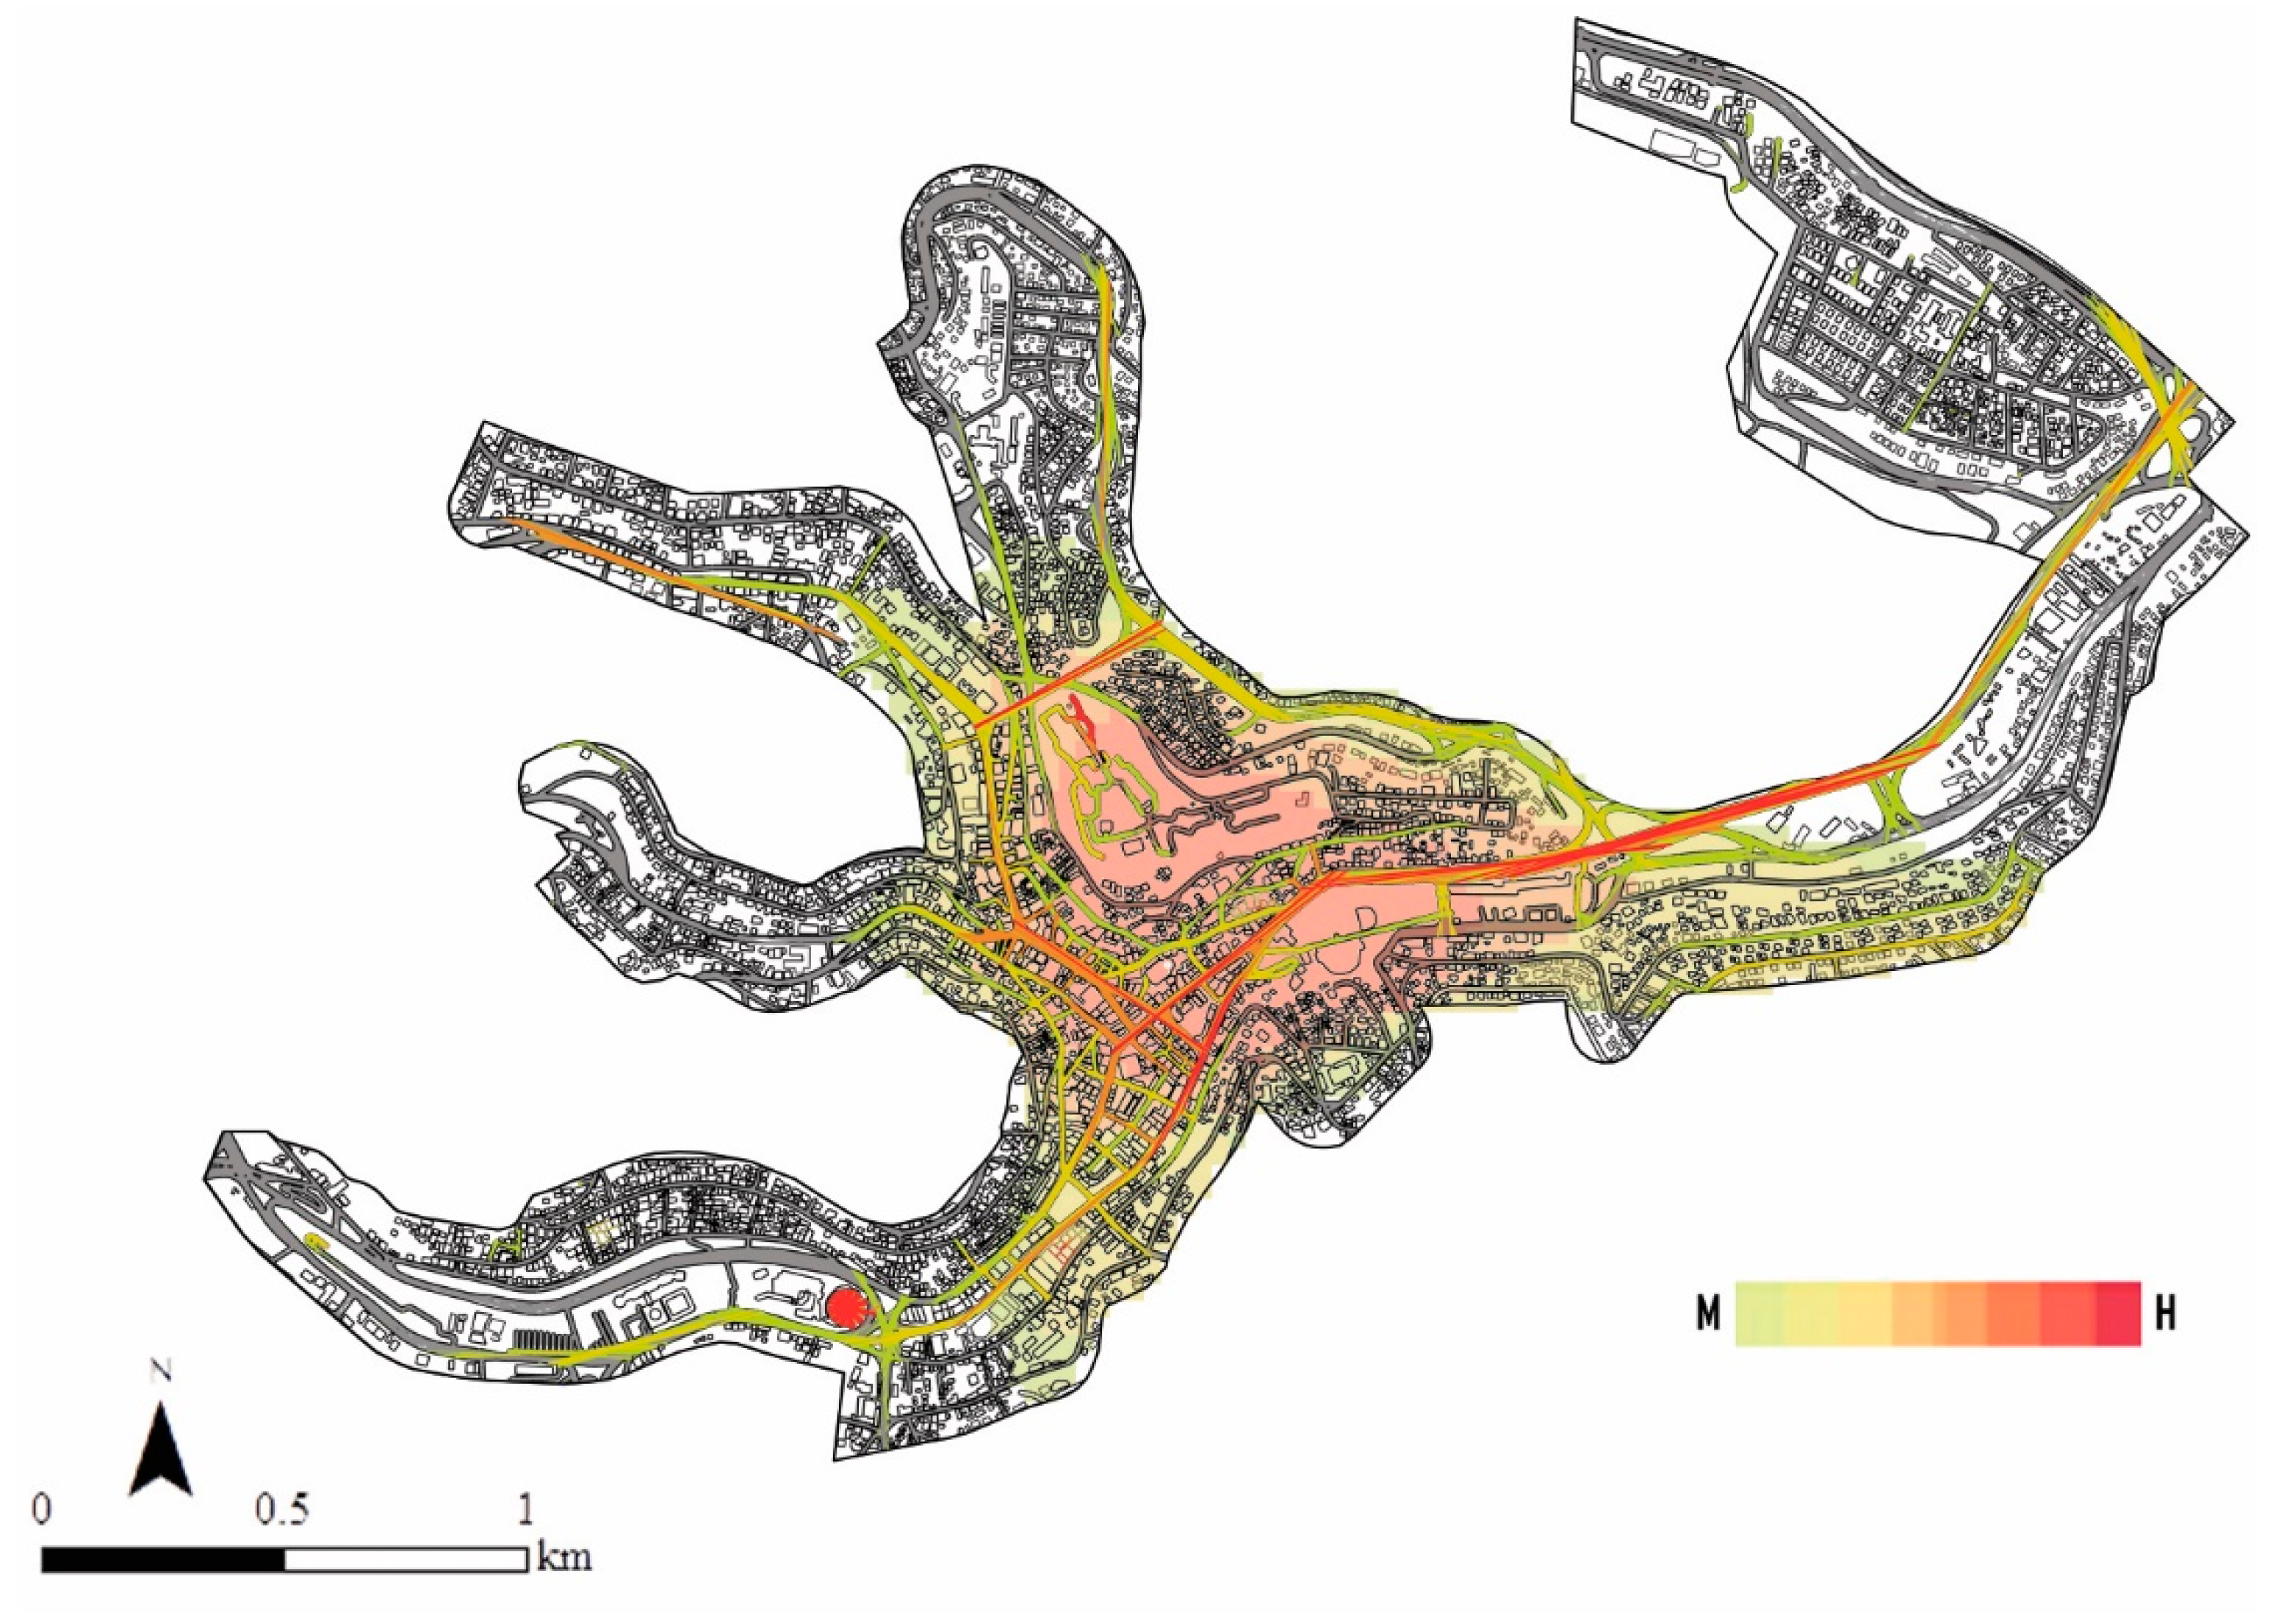
Finally, an overall understanding and visualization of the sum of all human activities, including the movement, flow, integration, and centralization within the study area, as well as the spaces within public accessibility and public preferences, is provided in Figure 9.

3.2. Linkage Mapper Analysis

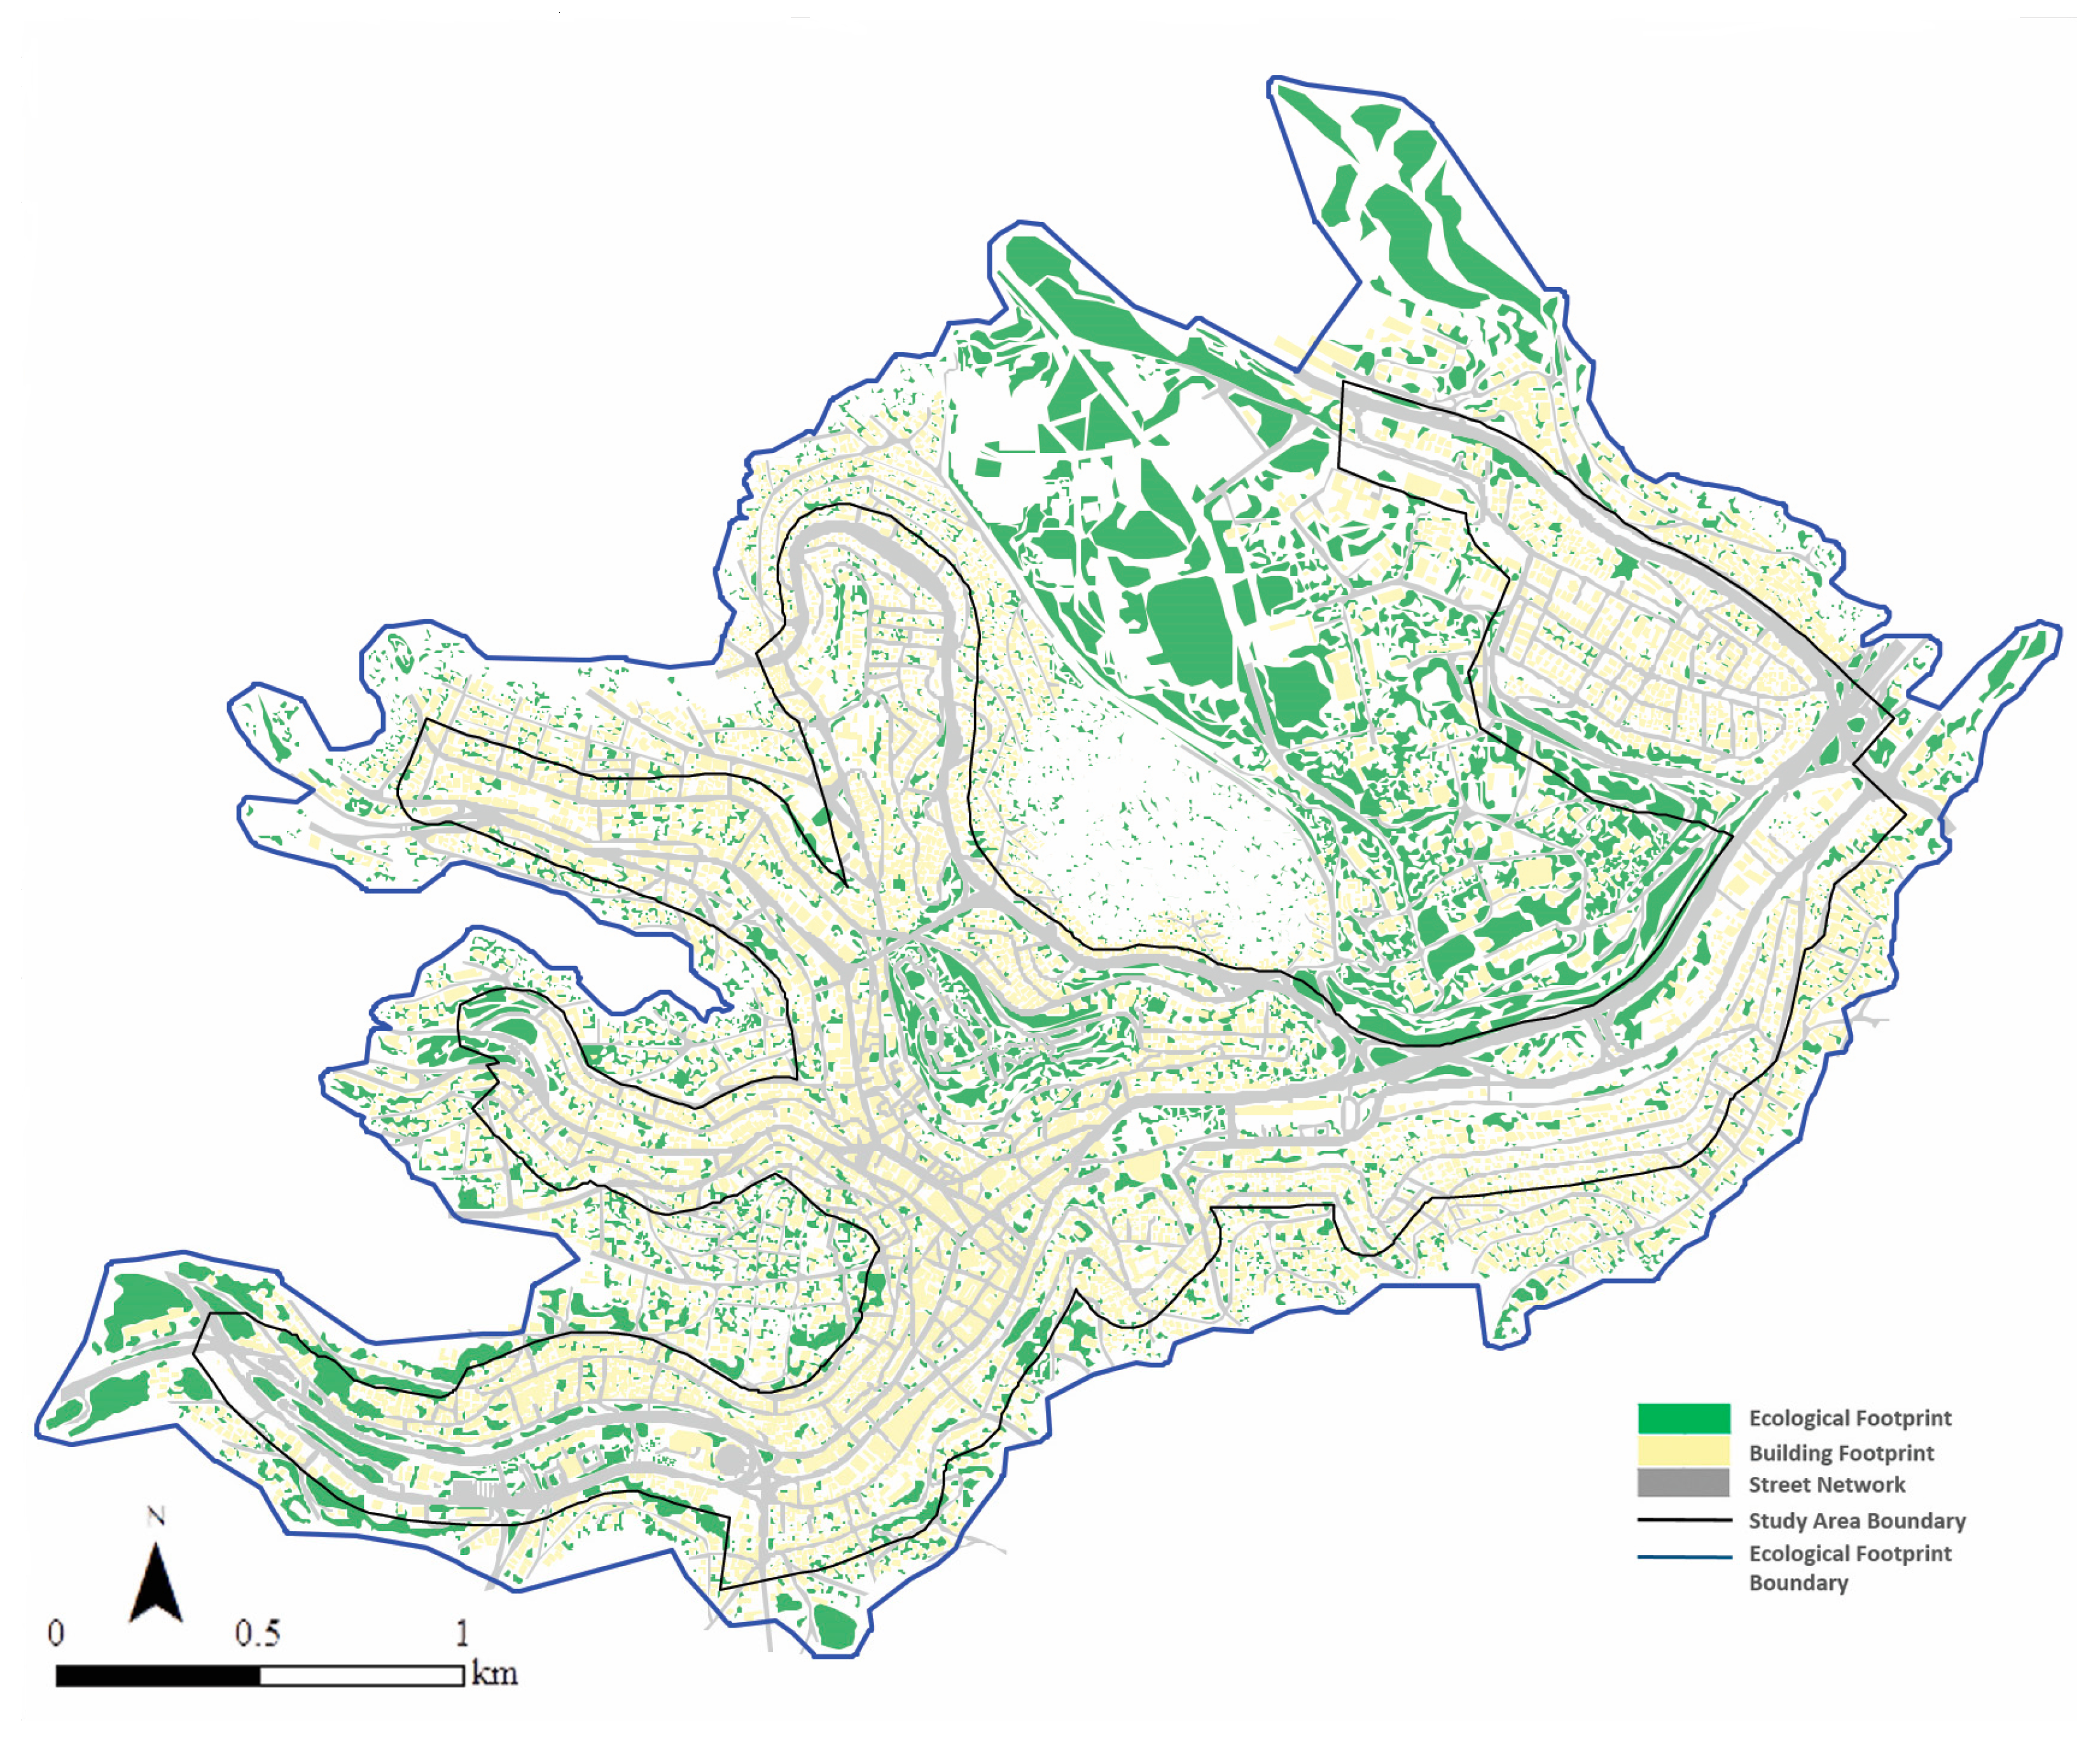
The landscape connectivity is analyzed in the study area utilizing a graph theory based-linkage mapper toolkit that operates within the Arc-GIS platform. The linkage mapper toolkit offers a set of mapping techniques that withholds different visual quantitative measurements towards landscape connectivity. However, for the purpose of this study, the research focuses on identifying ecological barrier areas, and that is why the barrier mapper technique was chosen. Firstly, the tool required a map with defined ecological patches. For that, an ecological trail map was provided to show the existing natural patches within the dense urban context of the city center and surrounding adjacent areas, as shown in Figure 10. The existing boundary of the city center was extended to include the noticeable habitat core areas that seem to be more integrated towards the edges to not obtain falsified results. Accordingly, surrounding ecological areas were included in the study parameter at this stage of the analysis.
The logic of how the linkage mapper toolkit operates requires a specific set of processes towards producing the barrier map analysis. The process is summarized in Figure 11.

3.2.1. Initial Files Preparation

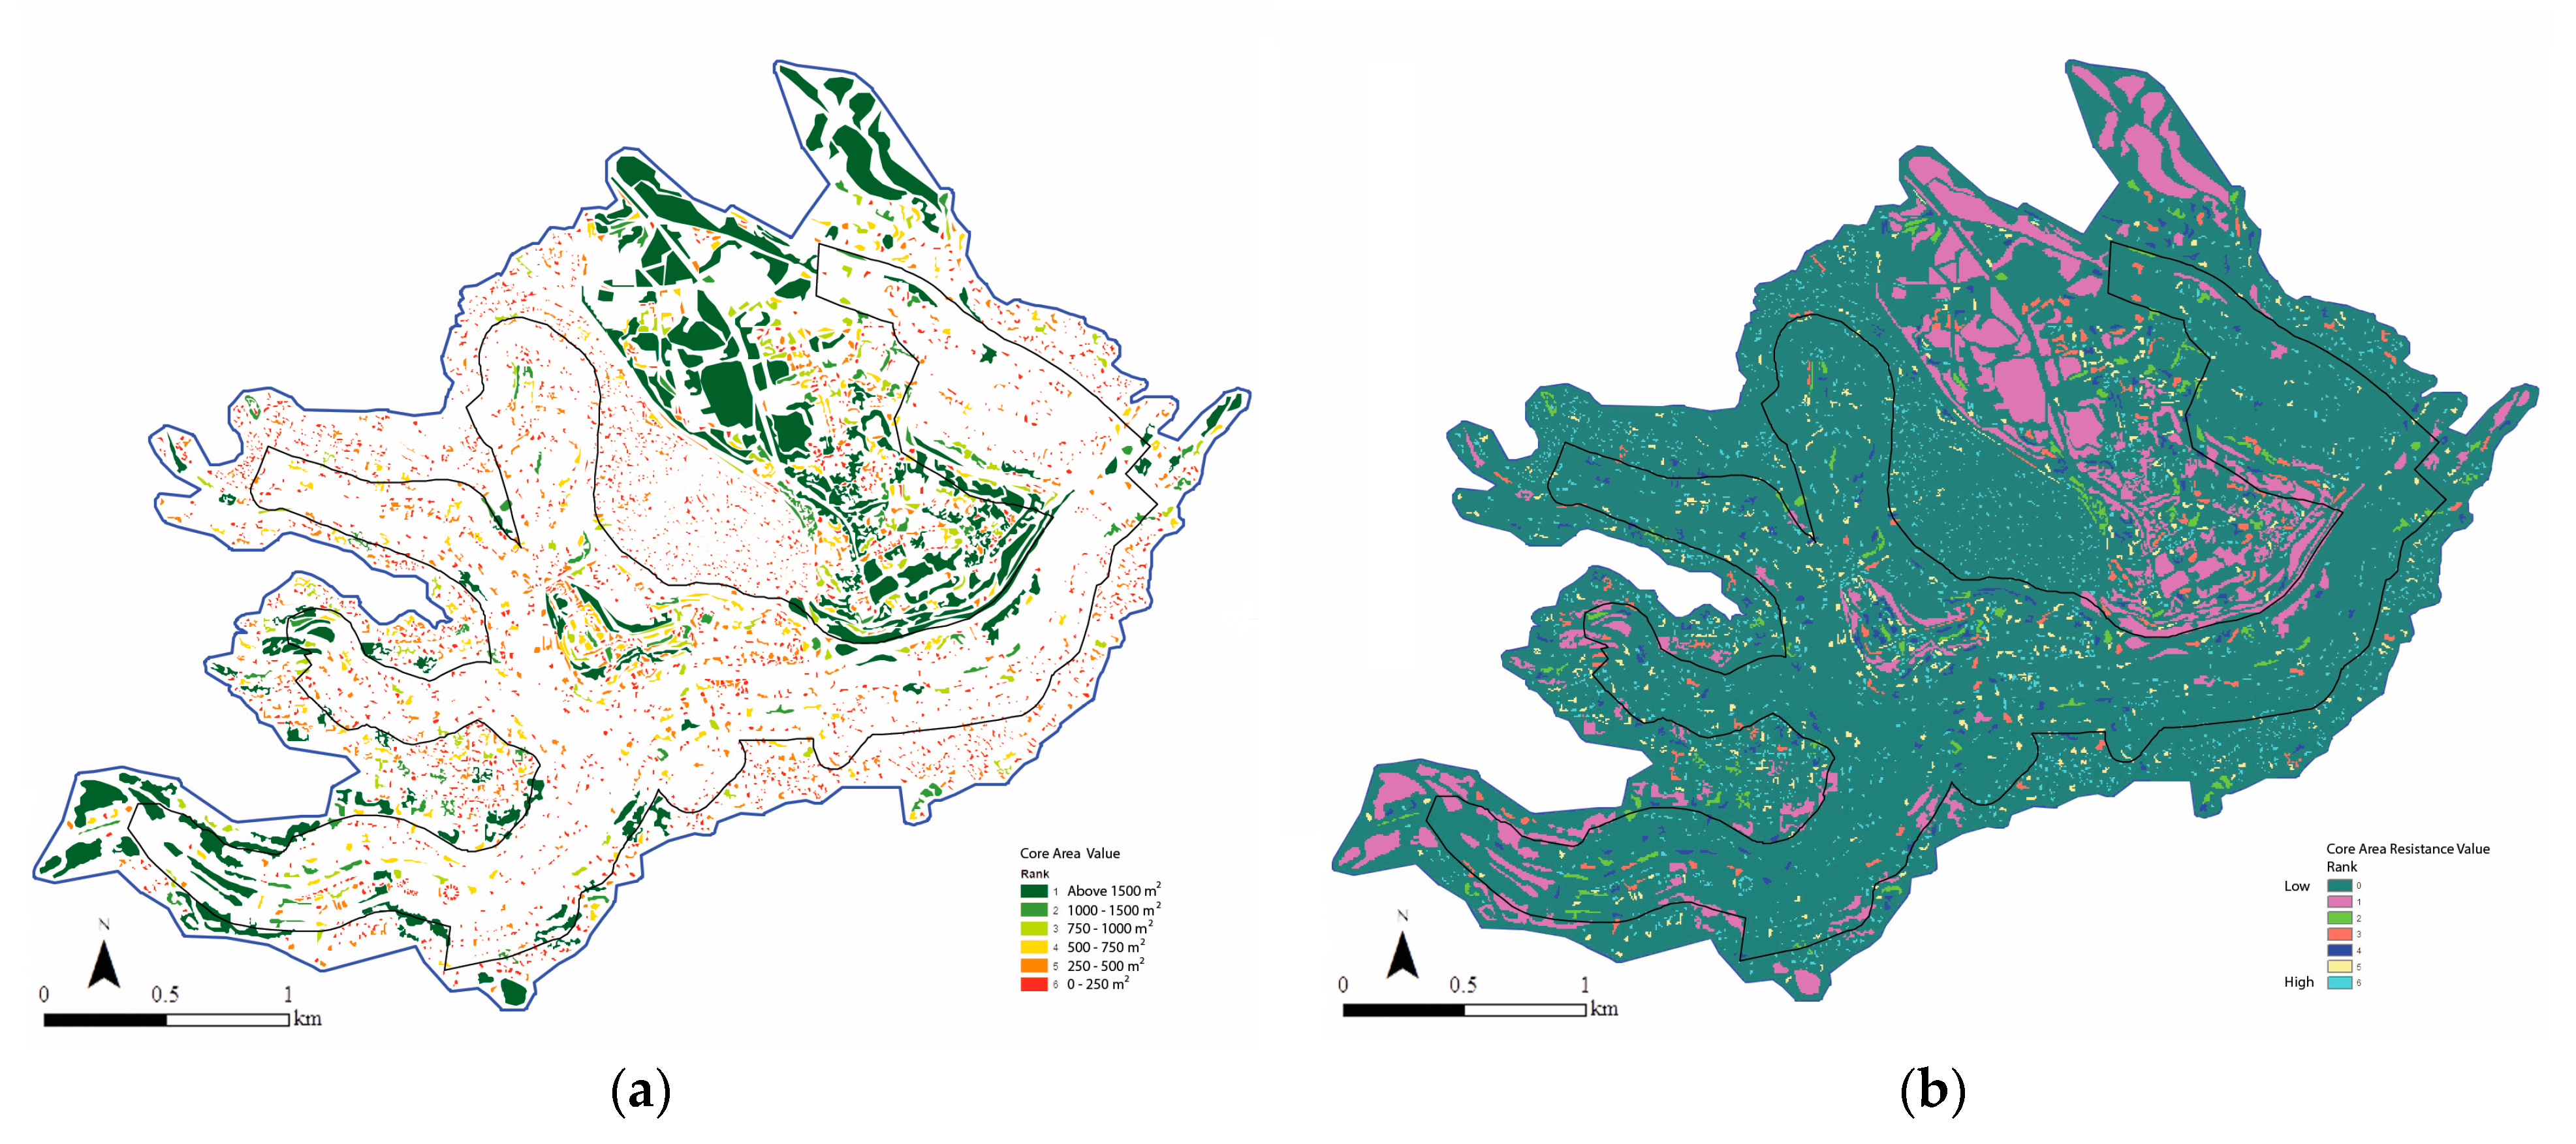
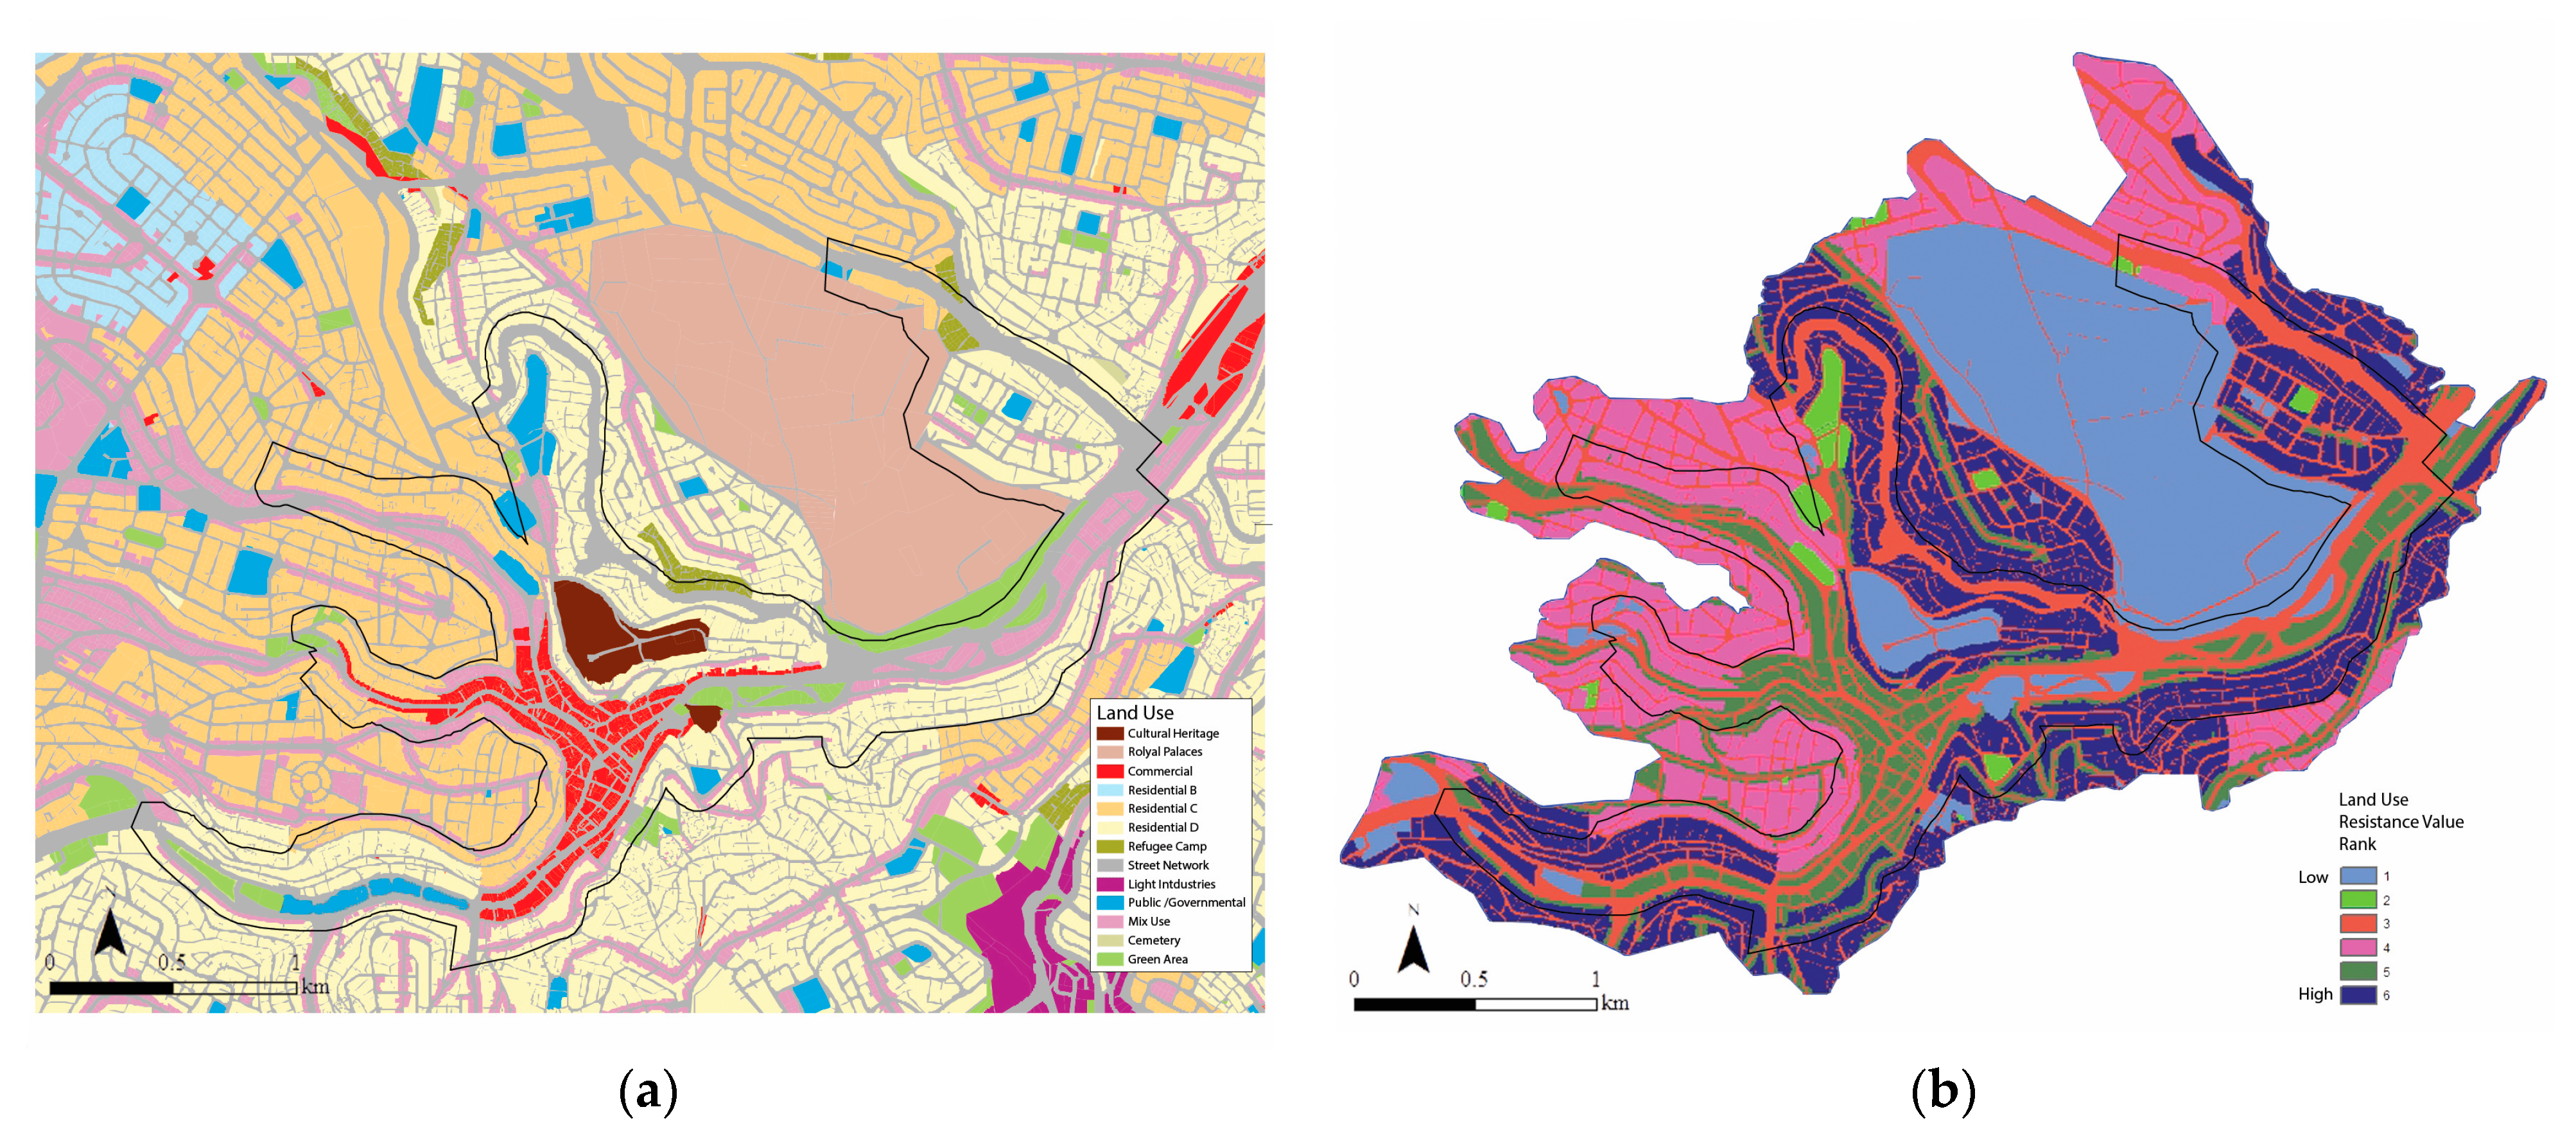
Firstly, the initial files were prepared by choosing the data layers needed to calculate the resistance surface. This step is essential, as the linkage mapper requires resistance data in the form of a raster surface map to run the landscape connectivity analysis. The layers of green patches and related land use functions were chosen, and then this map was divided into six main ranks. Criteria for choosing the resistance values for the green patches were based on their ecological availability, whilst the criteria for land use resistance values were based on built-up areas and relevant building regulations. All resistance values were chosen according to the general analysis of the study area, as well as upon expert opinions. Results for resistance values are shown in Table 1, and generated maps are shown in Figure 12 and Figure 13.

3.2.2. Calculating Resistance Surface Map

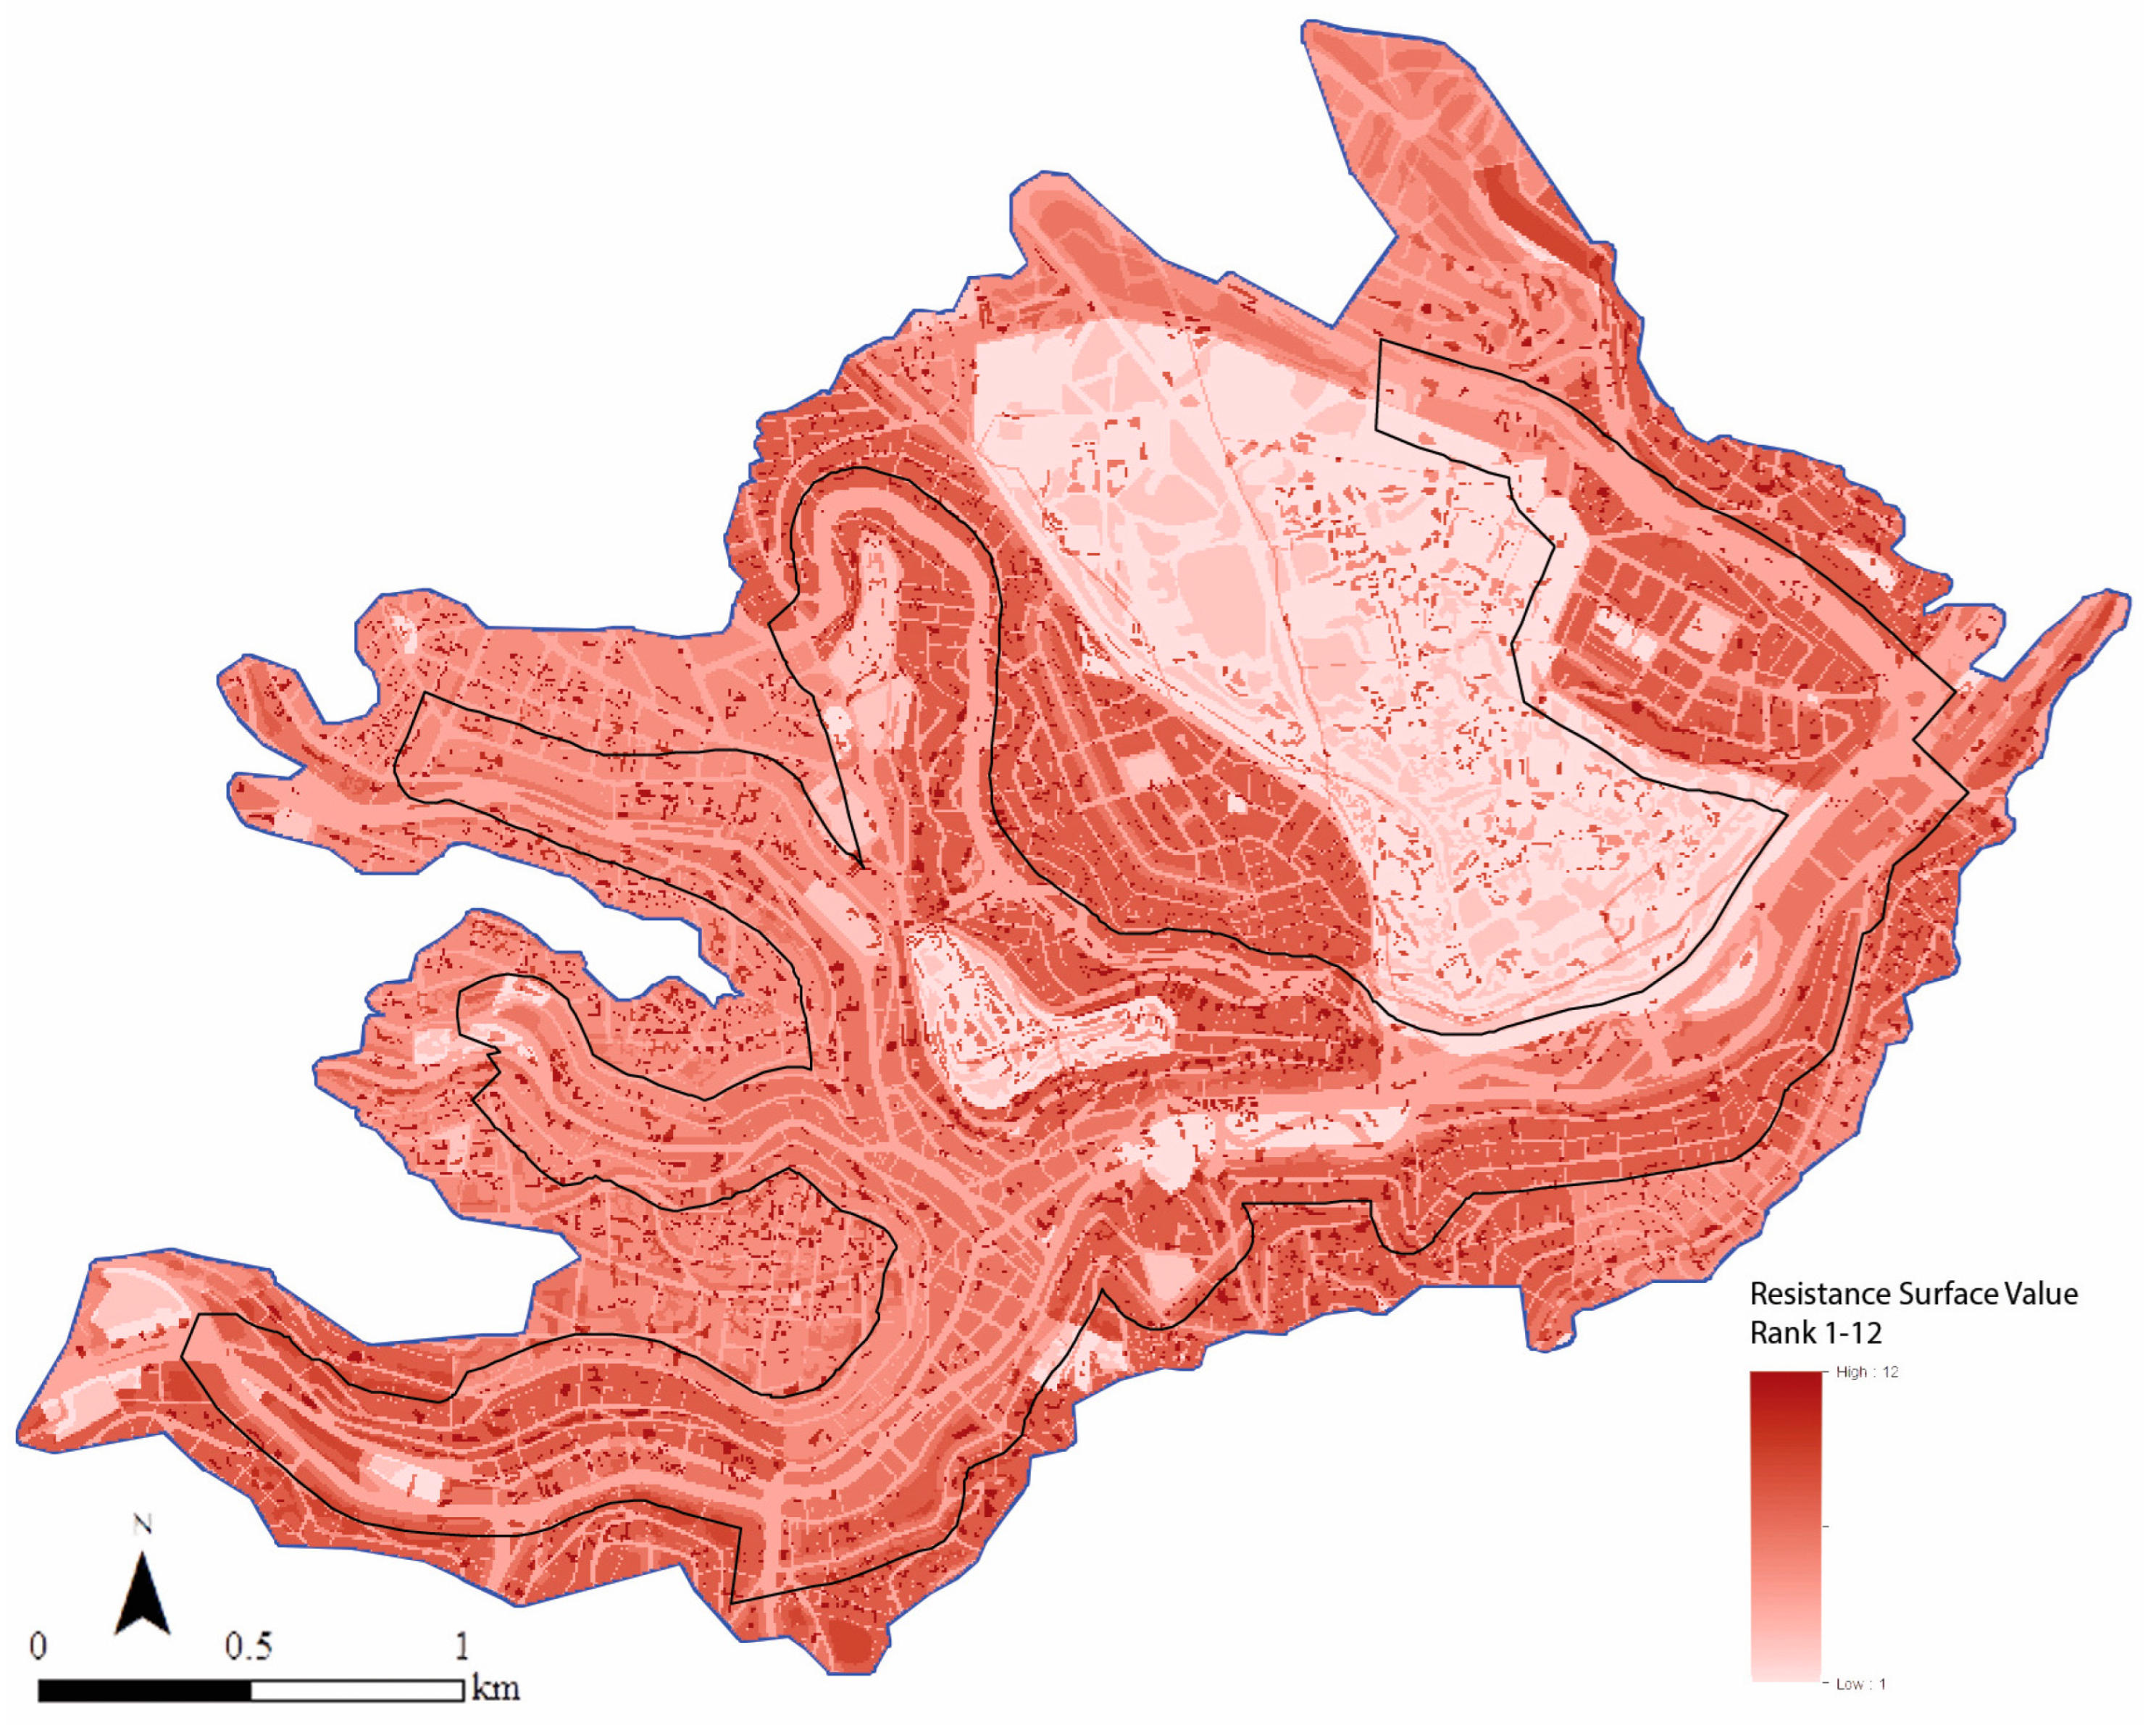
After obtaining both raster resistance maps for green patches and land use, habitat core areas, “HCAs”, were identified as having the lowest resistance rank of the green patch layers, i.e., the areas with 1500 m2 and above. Then, linkage mapper was run, and calculated the resistance surface map, merging both resistance values that resulted in values between 1 “indicating raster cells with low resistance” and 12 “indicating resistance cells with high resistance”, as shown in Figure 14.

3.2.3. Linkage Pathways Mapper Analysis

Linkage pathways mapper analysis provides three main visualizations on landscape connectivity: firstly, least cost paths, or “LCP”, referred to earlier habitat corridors which represent all possible linkages between HCA and LCP length value according to a resistance value to which those paths encounter when linking habitat core areas to each other. The second visualization depends on “CWD”, or cost weight distance, which visualizes the value of landscape connectivity by distance from habitat core areas. Lastly, an overall landscape connectivity by relative value presents areas with high to low pathway connections, which are represented by warm to cool color values. The overall landscape connectivity models produced are shown in Figure 15.
It is noticeable within the landscape connectivity models how values of lower connectivity are mainly presented when moving further in CWD distance from the main habitat core areas (HCAs). Similarly, where pathway linkage corridor LCP values are longer, indicated corridors facilitate low cover ecological spatial patterns. Although some values here provide an understanding on where lower connectivity exists, this does not provide a real measurement of ecological barriers, as they may already be embedded within HCAs. In the following process, a barrier mapper tool is used to visually model and analyze specific ecological barrier areas and values.

3.2.4. Barrier Mapper Analysis

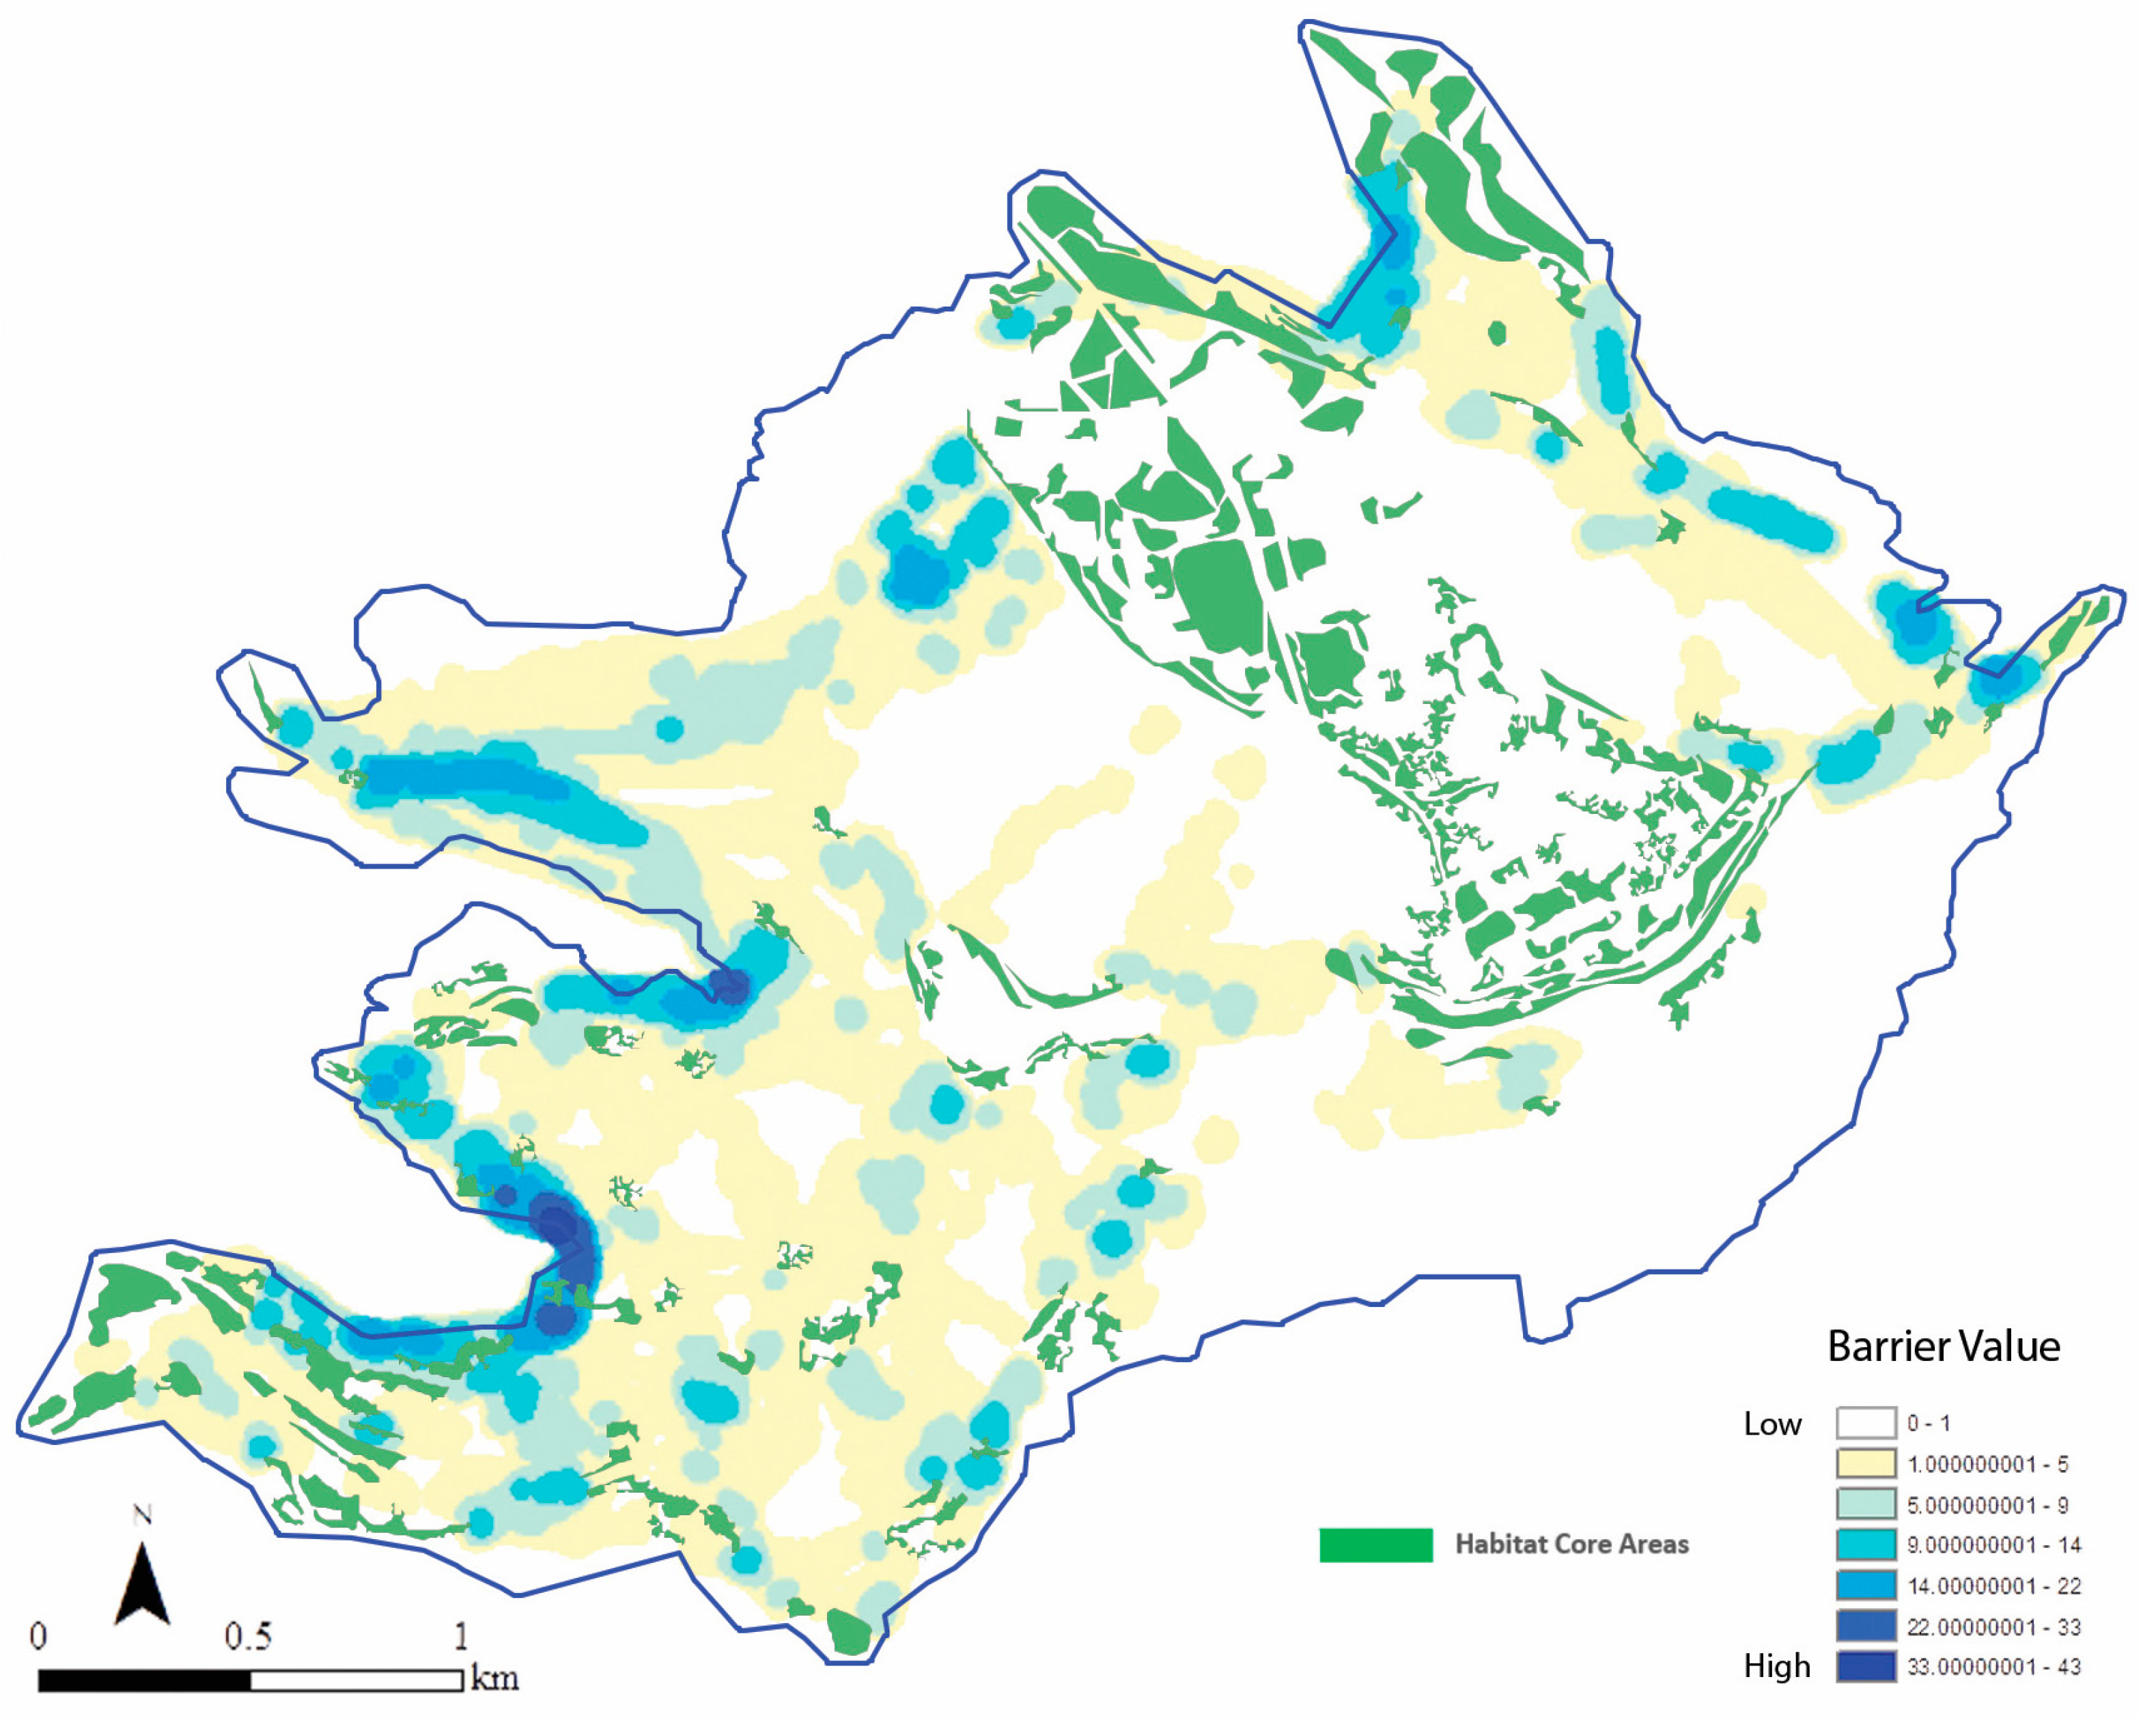
The barrier mapper tool has been utilized previously to obtain resistance surface map and linkage pathway maps as a basis for its calculations. The barrier map, shown in Figure 16, indicates low to high values where the areas with most barriers towards ecosystem connectivity exist. Low barrier values are indicated in yellow and light blue color values that become a darker blue when reaching the highest barrier points. Resembling areas is crucial need ecological restoration and to enhance both the overall ecosystem spatial patterns and landscape connectivity.

4. Discussion

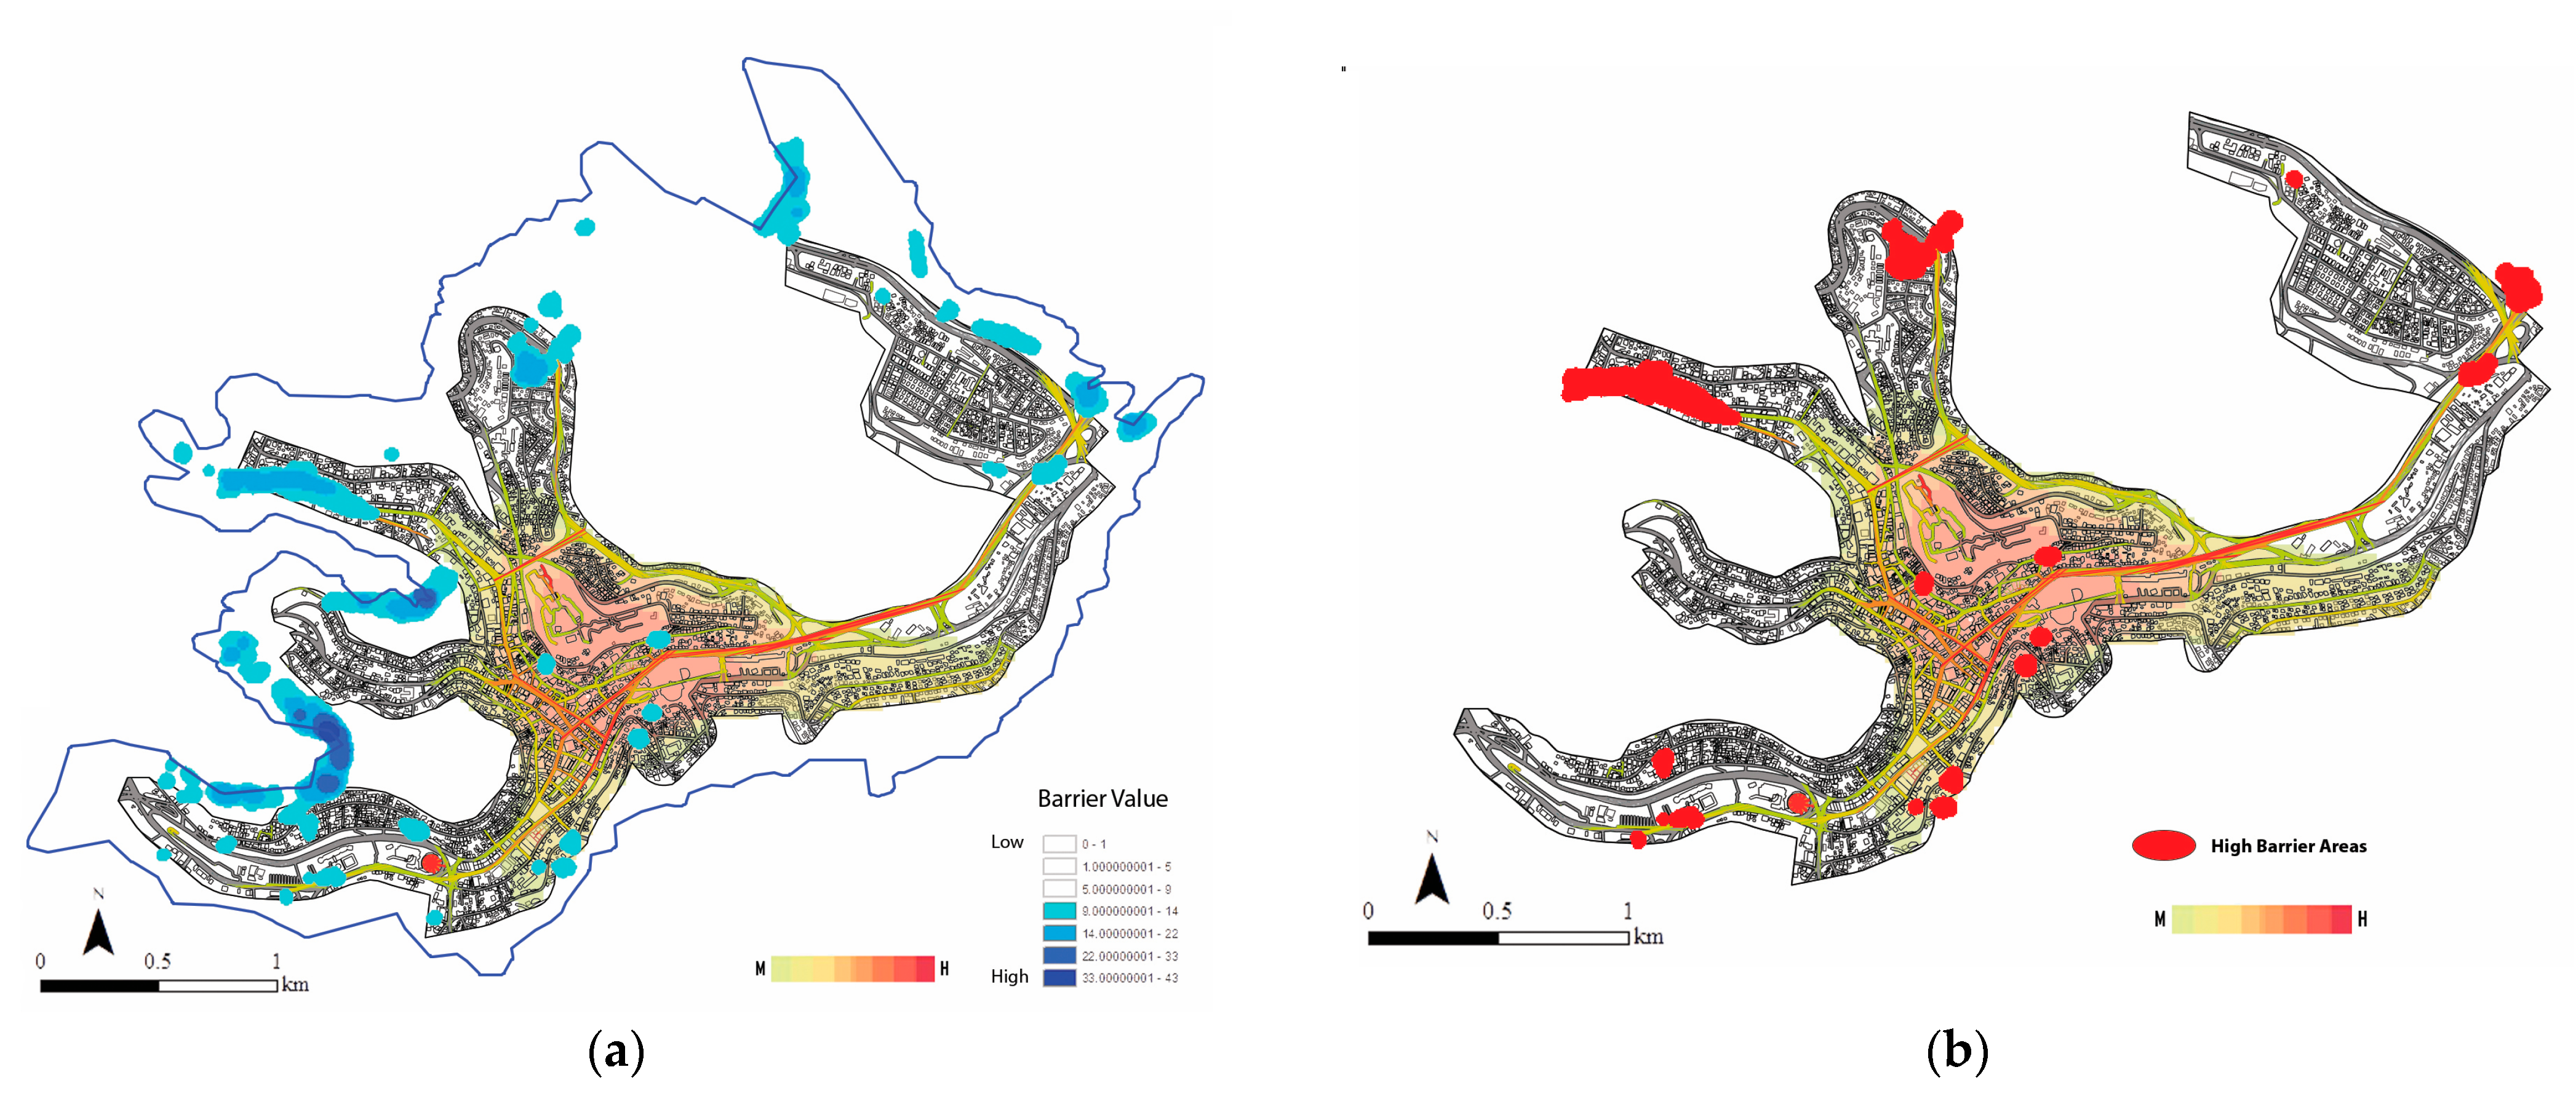
The space syntax theory prepared the basis for depth map analysis and the graph theory-based linkage mapper analysis to conduct an assessment on how human ecosystem spatial networks can be integrated. The ecological barrier map was remodeled, excluding low barrier values, to obtain a better focus on areas of high barrier values. The resulting barriers were further filtered to high-valued barriers within or on the edge of the initial study area boundary. To identify barriers that overlap with high human activity areas, the sum of all human spatial network maps was merged with the high barrier map.
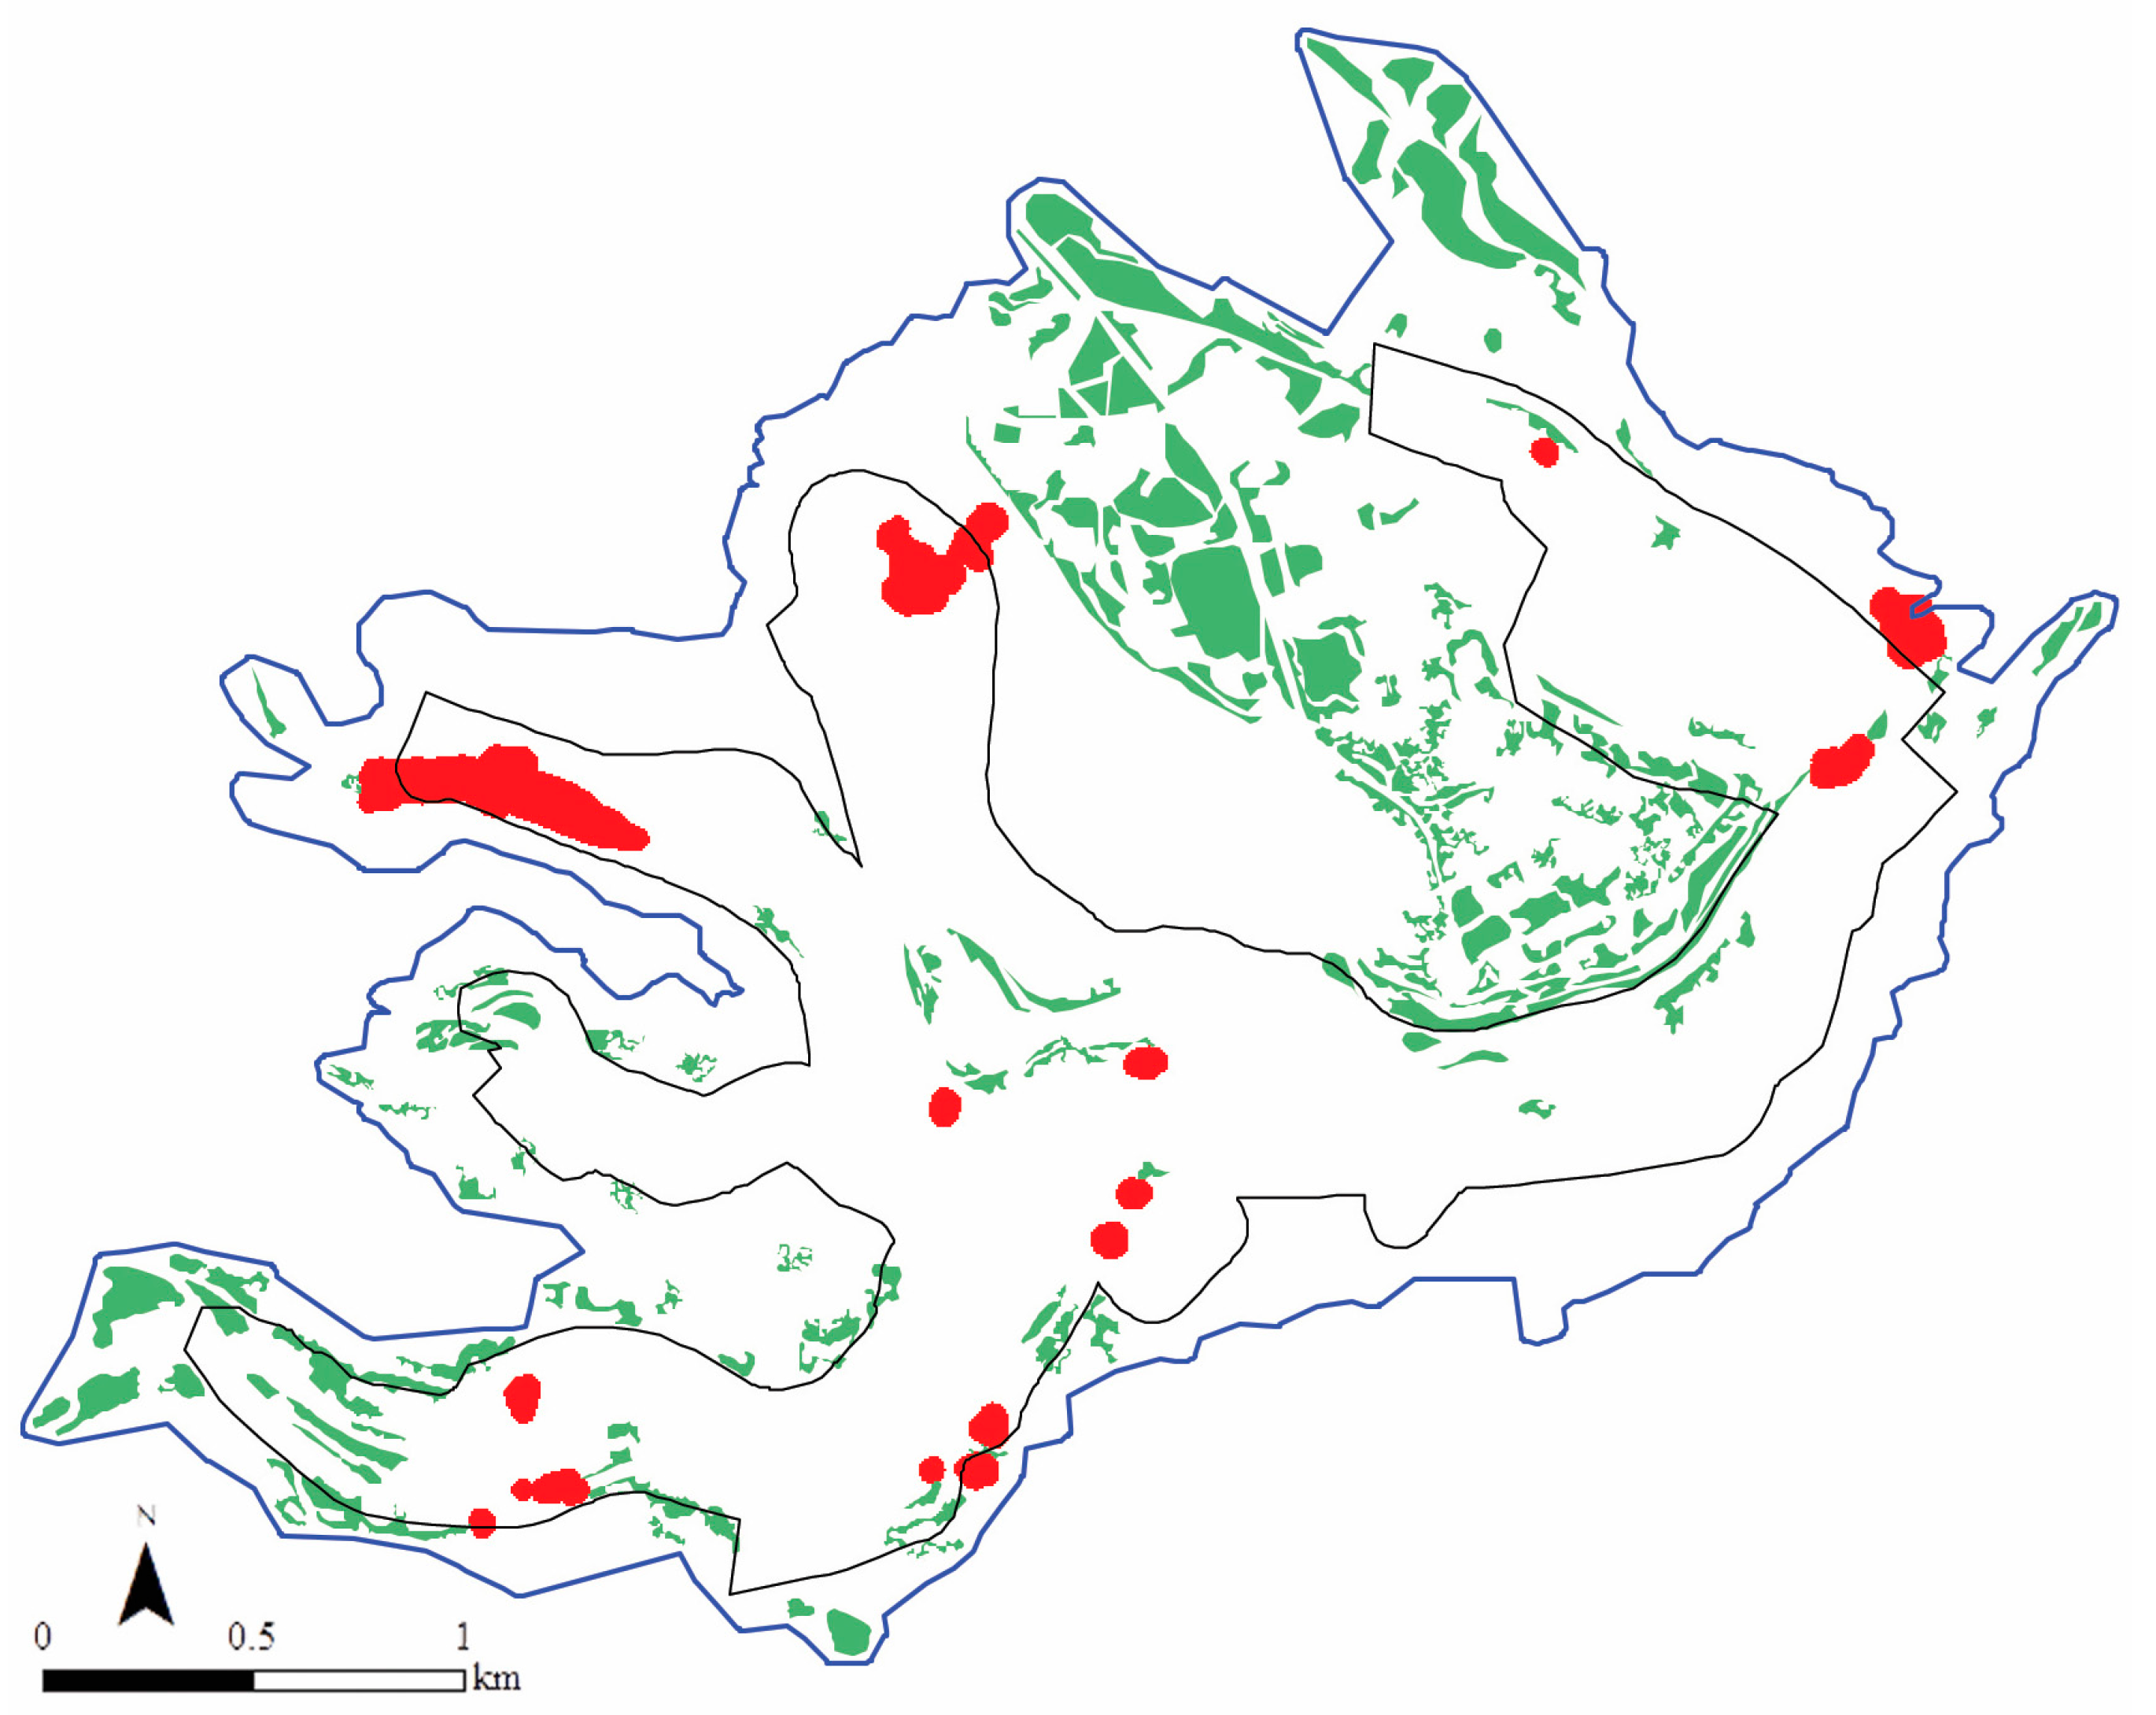
The results now display where ecological barriers exist within the identified borders of human activity areas. Indicating zones for ecological restoration in the selected case study area is now possible, and they are also highlighted as potential zones for integrating urban GI, which is acknowledged within literature to promote ecological health and well-being by enhancing overall landscape connectivity, to mitigate climate change, help prevent natural disasters, and enhance human health and wellbeing when interacting with GI as it delivers its various services and benefits to the human ecosystem. As a result, GI-oriented social ecological resilience and NDRR can be promoted within the complex urban context of the study area. The results are shown in Figure 17 and Figure 18.
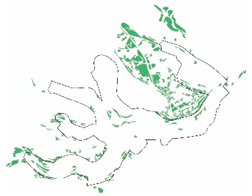
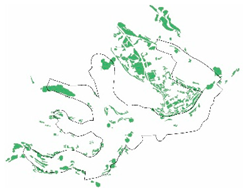
To provide evidence on how urban GI can be integrated within high barrier areas to enhance landscape connectivity, which will further enhance the well-being and health of communities within, the high barrier areas as new HCAs are identified, and their values are presented in a comparative analysis provided in Table 2.
The comparative analysis shows that HCAs (habitat core areas), due to the criteria chosen, i.e., “Only high barrier values where high human activity areas are taken into account”, did not significantly increase in number; however, they increased in surface area, as per patch and as a total sum area, which implies higher ecological impact, as the higher value of the patch area increases functional connectivity and ecological stability.

5. Conclusions

Whilst addressing the key argument of the research, this study has provided both theoretical evidence and practical assessment tools towards the implementation of urban GI for sustaining the social-ecological resilience and NDRR within complex human ecosystems. The theoretical framework of this study embraces a novel contribution towards the integration of resiliency and DRR theories into real practice through the utilization of a new methodological approach where the analysis, measurement, and visualization of human ecosystem spatial networks can be realized.
While space syntax tools have been popular within previous urban studies and practices, its incorporation with the recently developing linkage mapper tool for measuring ecosystem spatial patterns provided significant insight to the overall study as it contributed to the analysis of complex human ecosystems regarding the implementation of urban GI. This approach has proven to be very time effective and efficient in analyzing complex human ecosystems with specific information, which otherwise seemed difficult to obtain. Correspondingly, integrating urban GI within dense inner city areas has always been debatable and challenging for city administrations. However, with this new methodology, it has been proved that the integration of GI into dense inner city areas can be pursued.
However, for truly applying a context-sensitive urban GI implementation, real practices must investigate specific inner city GIs and their appropriateness for the land use in the targeted area. For instance, while community gardens and neighborhood parks are popular urban GI strategies for engaging the human ecosystem with greenery, they may not always be appropriate for use outside residential land use areas. Likewise, implementing GI strategies must be considered and prioritized in publicly accessible areas in the form of urban greening, as some areas with restricted land use regulations such as governmental or institutional land uses suggest otherwise.

6. Further Research

For further research, the integration of a pro-environmental behavior model within a questionnaire survey can help improve data reliability, specifically relating to social system analysis. Such data can help researchers understand the value urban communities assign nature and their level of awareness regarding the implementation and management of GI. Yet, this involves further research in positive environmental behavior [81]. In this sense, studies have argued that pro-environmental behavior which assesses human/environment psychological relationships are crucial towards climate change mitigation and the enhancement of NDRR [16,82,83]. Community-sensitive data can be beneficial for appropriate GI integration and implementation within social preferences and can make applying the framework for establishing GI-oriented resiliency more efficient, as it would be more context-sensitive, flexible, and adjustable.

Author Contributions

Supervision, P.U.R.; Writing—original draft, I.A. All authors have read and agreed to the published version of the manuscript.

Funding

This research received no external funding.

Institutional Review Board Statement

Not applicable.

Informed Consent Statement

Not applicable.

Conflicts of Interest

The authors declare no conflict of interest.

References

  1. The Conservation Fund. Green Infrastructure. 2004. Available online: http://www.greeninfrastructure.net (accessed on 7 April 2020).
  2. Natural England. Green infrastructure Guidance. Natural England 2009 Catalogue Code: NE176; 2009; p. 7. Available online: www.naturalengland.org.uk (accessed on 7 April 2020).
  3. Wang, J.; Banzhaf, E. Towards a better understanding of Green Infrastructure: A critical review. Ecol. Indic. 2018, 85, 758–772. [Google Scholar] [CrossRef]
  4. Pakzad, P. Green Urban Spaces, Green Infrastructure, and Urban Resilience; UCCRTF—Urban Climate Change Resilience Trust Fund: Sydney, Australia, 2019; pp. 1–12. [Google Scholar]
  5. Staddon, C.; Ward, S.; De Vito, L.; Zuniga-Teran, A.; Gerlak, A.K.; Schoeman, Y.; Hart, A.; Booth, G. Contributions of green infrastructure to enhancing urban resilience. Environ. Syst. Decis. 2018, 38, 330–338. [Google Scholar] [CrossRef] [Green Version]
  6. Resilience Shift Organization Official Publication. 2017. Available online: https://www.resilienceshift.org/ (accessed on 1 May 2022).
  7. Ranjha, S. Green Infrastructure: Planning for sustainable and resilient urban environment. In Policy Brief for Global Sustainable Development; Department of Economic and Social Affairs, United Nations: New York, NY, USA, 2016. [Google Scholar]
  8. Ramos-Gonzalez, O.M. The green areas of san juan, Puerto Rico. Ecol. Soc. 2014, 19, 21. [Google Scholar] [CrossRef] [Green Version]
  9. Pitt, M. The Pitt Review: Learning Lessons from the 2007 Floods [Online]. 2008. Available online: http://archive.cabinetoffice.gov.uk/pittreview/thepittreview/final_report.html (accessed on 7 April 2020).
  10. Barlow, S. Land and Food Resources; The University of Melbourne: Melbourne, Australia, 2011. [Google Scholar]
  11. Lu, F.; Li, Z. A model of ecosystem health and its application. Ecol. Model. 2003, 170, 55–59. [Google Scholar] [CrossRef]
  12. Tzoulas, K.; Korpela, K.; Venn, S.; Yli-Pelkonen, V.; Kaźmierczak, A.; Niemela, J.; James, P. Promoting ecosystem and human health in urban areas using Green Infrastructure: A literature review. Landsc. Urban Plan. 2007, 81, 167–178. [Google Scholar] [CrossRef] [Green Version]
  13. Godschalk, D.R. Urban hazard mitigation: Creating resilient cities. Nat. Hazards Rev. 2003, 4, 136–143. [Google Scholar] [CrossRef]
  14. Wilkinson, C. Social-ecological resilience: Insights and issues for planning theory. Plan. Theory 2011, 11, 148–169. [Google Scholar] [CrossRef]
  15. Rogers, Trust for Public Land National Urban Agenda. 2006. Available online: https://www.tpl.org/about/will-rogers (accessed on 1 May 2020).
  16. Steg, L.; Bolderdijk, J.W.; Keizer, K.; Perlaviciute, G. An integrated framework for encouraging pro-environmental behaviour: The role of values, situational factors and goals. J. Environ. Psychol. 2014, 38, 104–115. [Google Scholar] [CrossRef] [Green Version]
  17. Kim, J.; Kaplan, R. Physical and psychological factors in sense of community. New Urbanist Kentlands and Nearby Orchard Village. Environ. Behav. 2004, 36, 313–340. [Google Scholar] [CrossRef]
  18. Kuo, F.E.; Sullivan, W.C. Environment and crime in the inner city: Does vegetation reduce crime? Environ. Behav. 2001, 33, 343–367. [Google Scholar] [CrossRef] [Green Version]
  19. Lennon, M.; Scott, M. Delivering ecosystems services via spatial planning: Reviewing the possibilities and implications of a green infrastructure approach. Town Plan. Rev. 2014, 85, 563–587. [Google Scholar] [CrossRef] [Green Version]
  20. Abercrombie, L.C.; Sallis, J.F.; Conway, T.L.; Frank, L.D.; Saelens, B.E.; Chapman, J.E. Income and racial disparities in access to public parks and private recreation facilities. Am. J. Prev. Med. 2008, 34, 9–15. [Google Scholar] [CrossRef] [PubMed]
  21. Andersson, E.; Barthel, S.; Borgström, S.; Colding, J.; Elmqvist, T.; Folke, C.; Gren, A. Reconnecting cities to the biosphere: Stewardship of green infrastructure and urban ecosystem services. Ambio 2014, 43, 445–453. [Google Scholar] [CrossRef] [PubMed] [Green Version]
  22. Sandström, U.F. Green Infrastructure planning in urban Sweden. Plan. Pract. Res. 2002, 17, 373–385. [Google Scholar] [CrossRef]
  23. TEEB. The Economics of Ecosystems and Biodiversity: Ecological and Economic Foundation; Earthscan: Cambridge, MA, USA, 2010. [Google Scholar]
  24. Madureira, H.; Andresen, T. Planning for multifunctional urban green infrastructures: Promises and challenges. Urban Des. Int. 2013, 19, 38–49. [Google Scholar] [CrossRef]
  25. Kabisch, N.; Frantzeskaki, N.; Pauleit, S.; Naumann, S.; Davis, M.; Artmann, M.; Haase, D.; Knapp, S.; Korn, H.; Stadler, J.; et al. Nature-based solutions to climate change mitigation and adaptation in urban areas—Perspectives on indicators, knowledge gaps, barriers and opportunities for action. Ecol. Soc. 2016, 21, 39. [Google Scholar] [CrossRef] [Green Version]
  26. Lovell, S.T. Multifunctional urban agriculture for sustainable land use planning in the United States. Sustainability 2010, 2, 2499–2522. [Google Scholar] [CrossRef] [Green Version]
  27. Cole, L.B.; McPhearson, T.; Herzog, C.; Russ, A. Green infrastructure. Urban Environ. Educ. Rev. 2017, 261–270. [Google Scholar]
  28. Banzhaf, E.; de la Barrera, F.; Kindler, A.; Reyes-Paecke, S.; Schlink, U.; Welz, J.; Kabisch, S. A conceptual framework for integrated analysis of environmental quality and quality of life. Ecol. Indic. 2014, 45, 664–668. [Google Scholar] [CrossRef]
  29. European Environmental Agency (EEA). Glossary for Urban Green Infrastructure. 2017. Available online: https://www.eea.europa.eu/themes/sustainability-transitions/urbanenvironment/urban-green-infrastructure/glossary-for-urban-green-infrastructure (accessed on 7 April 2020).
  30. Cameron, R.W.F.; Blanusa, T.; Taylor, J.E.; Salisbury, A.; Halstead, A.J.; Henricot, B.; Thompson, K. The domestic garden—Its contribution to urban green infrastructure. Urban For. Urban Green. 2012, 11, 129–137. [Google Scholar] [CrossRef]
  31. Elmqvist, T.; Gomez-Baggethun, E.; Langemeyer, J. Ecosystem services provided by urban green infrastructure. In Routledge Handbook of Ecosystem Services; Routledge: New York, NY, USA, 2016. [Google Scholar]
  32. Baptiste, A.K.; Foley, C.; Smardon, R. Understanding urban neighborhood differences in willingness to implement green infrastructure measures: A case study of Syracuse, NY. Landsc. Urban Plan. 2015, 136, 1–12. [Google Scholar] [CrossRef]
  33. Pauleit, S.; Liu, L.; Ahern, J.; Kaźmierczak, A. Multifunctional Green Infrastructure Planning to Promote Ecological Services in the City; Oxford University Press: New York, NY, USA, 2011; pp. 272–285. [Google Scholar]
  34. Beauchamp, P.; Adamowski, J. An integrated framework for the development of green infrastructure: A literature review. Eur. J. Sustain. Dev. 2013, 2, 1–24. [Google Scholar] [CrossRef]
  35. Resilience Alliance. Assessing Resilience in Social-Ecological Systems: Workbook for Practitioners. Revised Version 2. 2010. Available online: http://www.resalliance.org/3871.php (accessed on 7 April 2020).
  36. Summers, J.K.; Harwell, L.C.; Smith, L.M.; Buck, K.D. Measuring community resilience to natural hazards: The natural hazard resilience screening index (NaHRSI)—development and application to the United States. GeoHealth 2018, 2, 372–394. [Google Scholar] [CrossRef] [PubMed]
  37. Paris Agreement. UNFCCC United Nations Treaty Collection. 8 July 2016. Archived from the Original on 21 August 2016. Available online: https://unfccc.int/process-and-meetings/the-paris-agreement/the-paris-agreement (accessed on 3 March 2020).
  38. C40 Cities. “C40 Cities Take Action to Increase Resiliency to Climate Risk.” C40 Cities. 2017. Available online: https://www.c40.org/news/c40-cities-take-action-to-increase-resiliency-to-climate-risk/?gclid=EAIaIQobChMInLWQ5Jnk-AIVEQkrCh1aAgwCEAMYASAAEgKq1fD_BwE (accessed on 2 March 2020).
  39. Ospina, A.V.; Heeks, R. Resilience Assessment Benchmarking and Impact Toolkit (Rabit)—Implementation Handbook, Version 1.0 a; University of Manchester: Manchester, UK, 2016. [Google Scholar]
  40. Urban Resilience Hub. “What is Urban Resilience?” UN Habitat. Available online: https://urbanresiliencehub.org/what-is-urban-resilience-old/ (accessed on 2 March 2020).
  41. UNISDR. Unisdr Terminology on Disaster Risk Reduction. 2009. Available online: http://www.drdm.gov.sc/wp-content/uploads/2017/05/UNISDR-terminology-2009-eng.pdf (accessed on 2 March 2020).
  42. UN-ISDR. Hoygo Declaration. In Proceedings of the World Conference on Disaster Reduction, Kobe, Japan, 18–22 January 2005. [Google Scholar]
  43. Agenda for Humanity. World Humanitarian Summit (Whs). 2016. Available online: https://www.agendaforhumanity.org/ (accessed on 2 March 2020).
  44. Mayunga, J.S. Understanding and applying the concept of community disaster resilience: A capital-based approach. Summer Acad. Soc. Vulnerability Resil. Build. 2007, 1, 1–16. [Google Scholar]
  45. UN-Habitat. City Resilience Profiling Tool. UN-Habitat. 2018. Available online: www.urbanresiliencehub.org (accessed on 2 March 2020).
  46. OECD. “Resilient Cities.” The Organization for Economic Co-Operation and Development. 2012. Available online: https://www.oecd.org/cfe/resilient-cities.htm (accessed on 20 April 2018).
  47. NYU Marron Institute. 100 RC Handbook: Planning for Resilient Urban Growth. NYU Marron Institute of Urban Management in Collaboration with 100 Resilient Cities. 2018. Available online: https://www.100resilientcities.org/wp-content/uploads/2018/09/NYUUrban-Growth Handbook_FINAL.pdf (accessed on 2 March 2020).
  48. ICLEI. “Resilient City.” International Council for Local Environmental Initiatives—Local Governments for Sustainability. Available online: https://resilientcities2019.iclei.org/ (accessed on 2 March 2020).
  49. Aitsi-Selmi, A.; Egawa, S.; Sasaki, H.; Wannous, C.; Murray, V. The Sendai framework for disaster risk reduction: Renewing the global commitment to people’s resilience, health, and well-being. Int. J. Disaster Risk Sci. 2015, 6, 164–176. [Google Scholar] [CrossRef] [Green Version]
  50. Sustainable Development Goals. 2016. Available online: https://www.undp.org/content/undp/en/home/sustainable-development-goals.html (accessed on 13 March 2020).
  51. Sharifi, A.; Yamagata, Y. Resilient Urban Form: A Conceptual Framework. In Resilience-Oriented Urban; Springer: Cham, Switzerland, 2018; pp. 167–179. [Google Scholar]
  52. Available online: https://emapsworld.com/jordan-capital-map-black-and-white.html (accessed on 1 December 2020).
  53. Greater Amman Municipality GAM. 2020. Available online: https://www.ammancity.gov.jo/ar/main/index.aspx (accessed on 1 December 2020).
  54. Potter, R.B.; Darmame, K.; Barham, N.; Nortcliff, S. “Ever-growing Amman”, Jordan: Urban expansion, social polarisation and contemporary urban planning issues. Habitat Int. 2009, 33, 81–92. [Google Scholar] [CrossRef]
  55. Khammash, A. Notes on Village Architecture in Jordan; University Art Museum; University of Southwestern Louisiana; 1986; Available online: https://www.khammash.com/sites/default/files/khammash_notesonvillagearchitecture.pdf (accessed on 1 December 2020).
  56. Courtesy of Amman Heritage Houses Foundation. 2020. Available online: https://www.facebook.com/HeritageHousesAmman/about/?ref=page_internal (accessed on 1 December 2020).
  57. 100RC. Amman Resilience Strategy. [online] 100 Resilient Cities. 2017. Available online: https://www.100resilientcities.org/ (accessed on 9 July 2020).
  58. Alshawabkeh, R.; Alhaddad, M. High density mixed use as an effective scheme in applying sustainable urban design principles in Amman, Jordan. Int. J. Humanit. Soc. Sci. 2018, 7, 57–78. [Google Scholar]
  59. Alamoush, S.J.; Jaafar, N.H.; Husini, E.M.; Ismail, W.N.W. Comfort Character of Landscape Features of Traditional Streets in Amman, Jordan. Plan. Malays. 2018, 16. [Google Scholar] [CrossRef]
  60. Archives of the Royal Jordanian geographic information system Center. 2020. Available online: http://rjgc.gov.jo/rjgc_site/en/main-en/ (accessed on 1 December 2020).
  61. Cutini, V. La Rivincita Dello Spazio Urbano. L’approccio Configurazionale Allo Studio e All’analisi Dei Centri Abitati; Plus—Pisa University Press: Pisa, Italy, 2010. [Google Scholar]
  62. Hillier, B.; Hanson, J. The Social Logic of Space; Cambridge University Press: Cambridge, UK, 1989. [Google Scholar]
  63. Dawes, M.; Ostwald, M.J. Precise locations in space: An alternative approach to space syntax analysis using intersection points. Archit. Res. 2013, 3, 1–11. [Google Scholar]
  64. Netto, V.M. ‘What is space syntax not?’ Reflections on space syntax as sociospatial theory. Urban Des. Int. 2016, 21, 25–40. [Google Scholar] [CrossRef]
  65. Penn, A. The University College London. Available online: spacesyntax.net (accessed on 1 December 2021).
  66. Batty, M. A New Theory of Space Syntax. 2004. Available online: discovery.ucl.ac.uk (accessed on 1 December 2021).
  67. Hillier, B. Space is the Machine: A Configurational Theory of Architecture; Space Syntax: London, UK, 2007. [Google Scholar]
  68. Osman, K.M.; Suliman, M. The space syntax methodology: Fits and misfits. Archit. Behav. 1994, 10, 189–204. [Google Scholar]
  69. Seamon, D. Review of Bill Hillier’s Space is the Machine. Environ. Archit. Phenomenol. 2003, 14, 6–9. [Google Scholar]
  70. Yamu, C.; van Nes, A.; Garau, C. Bill hillier’s legacy: Space syntax—A synopsis of basic concepts, measures, and empirical application. Sustainability 2021, 13, 3394. [Google Scholar] [CrossRef]
  71. Urban, D.L.; Minor, E.S.; Treml, E.A.; Schick, R.S. Graph models of habitat mosaics. Ecol. Lett. 2009, 12, 260–273. [Google Scholar] [CrossRef] [PubMed]
  72. Laliberté, J.; St-Laurent, M.H. Validation of functional connectivity modeling: The Achilles’ heel of landscape connectivity mapping. Landsc. Urban Plan. 2020, 202, 103878. [Google Scholar] [CrossRef]
  73. Levin, S.A. Population dynamic models in heterogeneous environments. Annu. Rev. Ecol. Syst. 1976, 7, 287–310. [Google Scholar] [CrossRef]
  74. Roff, D.A. The analysis of a population model demonstrating the importance of a dispersal in a heterogeneous environment. Oecologia 1974, 15, 259–275. [Google Scholar] [CrossRef]
  75. Henein, K.; Merriam, G. The elements of connectivity where corridor quality is variable. Landsc. Ecol. 1990, 4, 157–170. [Google Scholar] [CrossRef]
  76. Tischendorf, L.; Fahrig, L. On the usage and measurement of landscape connectivity. Oikos 2000, 90, 7–19. [Google Scholar] [CrossRef] [Green Version]
  77. Taylor, P.D.; Fahrig, L.; Henein, K.; Merriam, G. Connectivity is a vital element of landscape structure. Oikos 1993, 68, 571–573. [Google Scholar] [CrossRef] [Green Version]
  78. Wiens, J.A. Metapopulation dynamics and landscape ecology. In Metapopulation Biology; Hanski, I., Gilpin, M.E., Eds.; Academic Press: Cambridge, MA, USA, 1993; pp. 43–62. [Google Scholar]
  79. Galpern, P.; Manseau, M.; Fall, A. Patch-based graphs of landscape connectivity: A guide to construction, analysis and application for conservation. Biol. Conserv. 2011, 144, 44–55. [Google Scholar] [CrossRef]
  80. Urban, D.; Keitt, T. Landscape connectivity: A graph-theoretic perspective. Ecology 2001, 82, 1205–1218. [Google Scholar] [CrossRef]
  81. Kollmuss, A.; Agyeman, J. Mind the gap: Why do people act environmentally and what are the barriers to pro-environmental behavior? Environ. Educ. Res. 2002, 8, 239–260. [Google Scholar] [CrossRef] [Green Version]
  82. Balundė, A.; Perlaviciute, G.; Steg, L. The relationship between people’s environmental considerations and pro-environmental behavior in Lithuania. Front. Psychol. 2019, 10, 2319. [Google Scholar] [CrossRef] [PubMed] [Green Version]
  83. Stern, P.C.; Sovacool, B.K.; Dietz, T. Towards a science of climate and energy choices. Nat. Clim. Chang. 2016, 6, 547–555. [Google Scholar] [CrossRef]
Figure 1. GI for socio-ecological resiliency and DRR. Developed by authors.
Sustainability 14 08451 g001
Figure 2. Summary on frameworks between theory and practice on resiliency and DRR [35,36,37,38,39,40,41,42,43,44,45,46,47,48,49,50,51].
Sustainability 14 08451 g002
Figure 3. (a) Map of Jordan—locating the capital city of Amman [52]; (b) map showing the boundaries of the city of Amman in 2020, with all districts, highlighting the city center district resembling the study area of this research [53].
Sustainability 14 08451 g003
Figure 4. (a) To the left shows the site of a Roman theatre’s remains in the city center of Amman in the year 1878; (b) shows the same site in our modern-day [56].
Sustainability 14 08451 g004
Figure 5. (a) 1918 map—Downtown Amman. Retrieved from aerial photos retrieved from the archives of the royal Jordanian geographic information system center [60], developed by author. 2021; (b) 2020 map—Downtown Amman. Retrieved from satellite photos from google earth pro software, developed by authors, 2021.
Sustainability 14 08451 g005
Figure 6. The methodological framework of the study.
Sustainability 14 08451 g006
Figure 7. Result of space syntax analysis: (a) Axial connectivity analysis map indicating pedestrian flow by value of roads connectivity. (b) axial integration analysis map indicating ease of access by value of roads integration. (c) axial mean depth analysis map indicating likely human choice of movement path. (d) Segment metric radius roads network analysis: metric n = 100 map. Indicates the expected metric desirable human flow within the urban layout. (e) VGA connectivity analysis map indicates places with most points with nodes of activities and human intersections.
Sustainability 14 08451 g007
Figure 8. Results of space syntax analysis after exclusion of medium to low human activity values; (a) Axial connectivity analysis map indicating pedestrian flow by value of roads connectivity. (b) axial integration analysis map indicating ease of access by value of roads integration. (c) axial mean depth analysis map indicating likely human choice of movement path. (d) Segment metric radius roads network analysis: metric n = 100 map. Indicates the expected metric desirable human flow within the urban layout. (e) VGA connectivity analysis map indicates places with most points with nodes of activities and human intersections.
Sustainability 14 08451 g008
Figure 9. Sum of all human activities; human spatial network map; medium to high values only.
Sustainability 14 08451 g009
Figure 10. Map of the study area showing the ecological trails within the built urban environment.
Sustainability 14 08451 g010
Figure 11. Map of the study area showing the ecological trails within the built urban environment.
Sustainability 14 08451 g011
Figure 12. (a) Showing green patches’ values by rank; (b) showing raster resistance map of green patches. Maps generated using Arc-GIS platform.
Sustainability 14 08451 g012
Figure 13. (a) Land use (GAM); (b) raster resistance map of land use given resistance value. Maps generated using Arc-GIS platform.
Sustainability 14 08451 g013
Figure 14. Resistance surface map. Generated through linkage mapper tool and operated within ArcGIS platform.
Sustainability 14 08451 g014
Figure 15. (a) Connectivity relative value showing core habitat areas and corridors; (b) connectivity value CWD showing LCP of corridors as well as HCAs. Maps generated using linkage mapper toolkit operated within Arc-GIS platform.
Sustainability 14 08451 g015
Figure 16. Ecological barrier map-all values. Map generated using linkage mapper toolkit; barrier mapper tool operated within Arc-GIS platform.
Sustainability 14 08451 g016
Figure 17. (a) High barrier values overlapped with high human spatial pattern map; (b) high barrier values overlapped with high human spatial pattern map; study area boundary focus. Maps generated using linkage mapper—barrier mapper tool operated within Arc-GIS platform and depth map software.
Sustainability 14 08451 g017
Figure 18. HCA map showing potential areas for ecological restoration based on barrier mapper analysis. Note: The high barrier areas on some occasions overlap with the old core habitat areas, which was not identified in previous analysis. This further indicates how linkage pathway mapper results may not be sufficient on their own to identify ecological barrier areas. The significance of this tool towards measuring and visualizing real locations for the implementation of urban GI is highlighted.
Sustainability 14 08451 g018
Table 1. Resistance values by data type rank.
Data Type (Rank)Resistance Value (High = 1–Low = 6)
Land Use (Cultural Heritage)6
Land Use (Royal Palaces)6
Land Use (Commercial)4
Land Use (Residential Type B; low density)5
Land Use (Residential Type C; medium density)3
Land Use (Residential Type D; high density)1
Land Use (Refugee Camps; very high density)1
Land Use (Light Industries)1
Land Use (Public/Governmental)5
Land Use (Mix Use)2
Land Use (Green Spaces)6
Land Use (Cemetery)6
Land Use (Street network)0
Green Patch Area (Above 1500 m2)6
Green Patch Area (1000–1500 m2)5
Green Patch Area (750–1000 m2)4
Green Patch Area (500–750 m2)3
Green Patch Area (250–500 m2)2
Green Patch Area (1–250 m2)1
Table 2. The comparison between old and new HCA statistics.
HCA > 1500 m2Old HCANew HCAResults
Map Sustainability 14 08451 i001 Sustainability 14 08451 i002Visually; increased overall green patch within study area boundary
Core Area Count
Min Core Area m2
Max Core Area m2
SUM m2
185
1513
44,205
931,197
187
1513
87,803
1,177,936
+1.1%
-
+49.65%
+20.95%
Percentage of change
Publisher’s Note: MDPI stays neutral with regard to jurisdictional claims in published maps and institutional affiliations.